Standing Pine, MS Map & Demographics
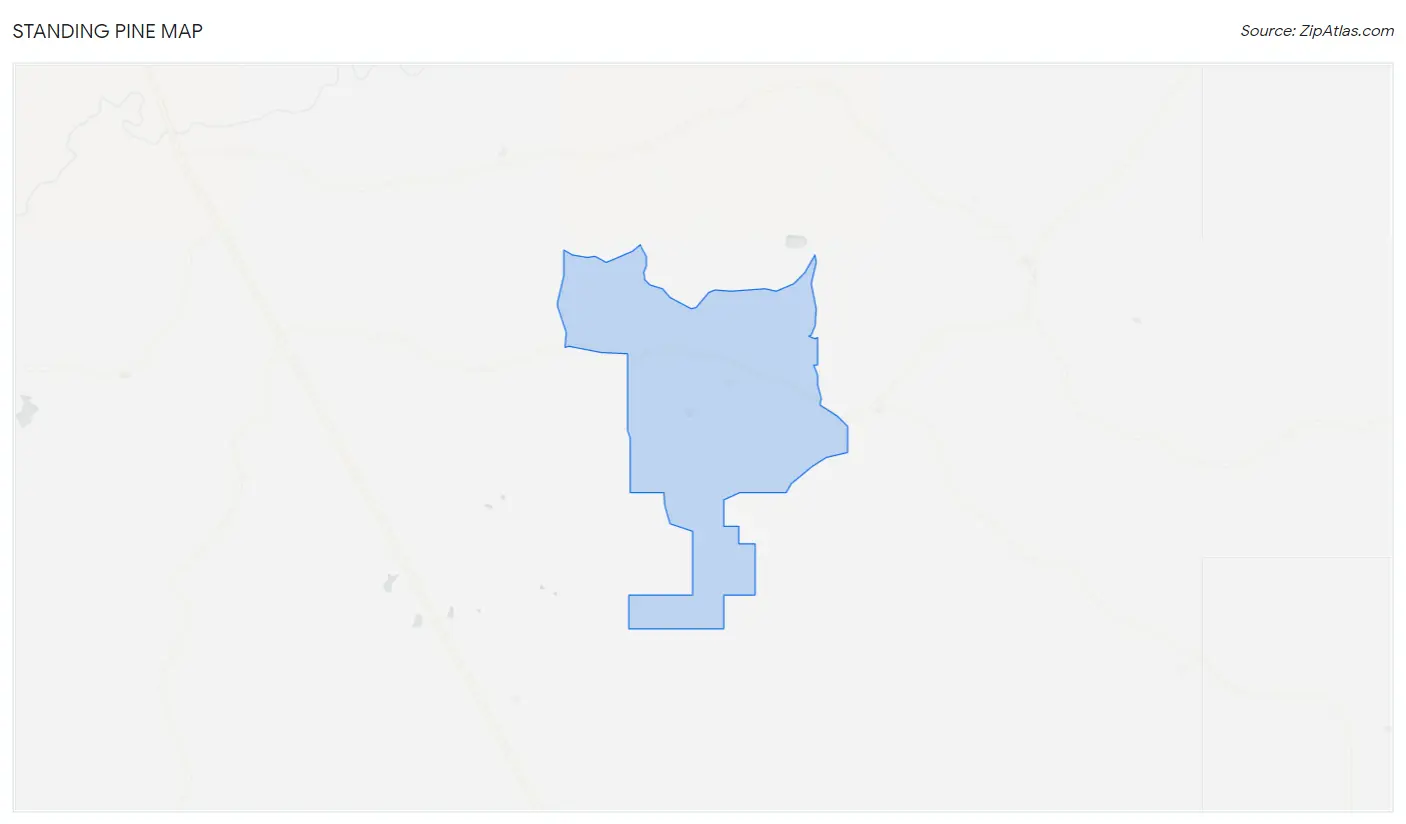
Standing Pine Map
Standing Pine Overview
$12,929
PER CAPITA INCOME
$44,500
AVG FAMILY INCOME
$55,893
AVG HOUSEHOLD INCOME
0.25
INEQUALITY / GINI INDEX
573
TOTAL POPULATION
253
MALE POPULATION
320
FEMALE POPULATION
79.06
MALES / 100 FEMALES
126.48
FEMALES / 100 MALES
28.6
MEDIAN AGE
4.2
AVG FAMILY SIZE
4.3
AVG HOUSEHOLD SIZE
210
LABOR FORCE [ PEOPLE ]
52.2%
PERCENT IN LABOR FORCE
5.7%
UNEMPLOYMENT RATE
Income in Standing Pine
Income Overview in Standing Pine
Per Capita Income in Standing Pine is $12,929, while median incomes of families and households are $44,500 and $55,893 respectively.
| Characteristic | Number | Measure |
| Per Capita Income | 573 | $12,929 |
| Median Family Income | 134 | $44,500 |
| Mean Family Income | 134 | $51,460 |
| Median Household Income | 134 | $55,893 |
| Mean Household Income | 134 | $54,599 |
| Income Deficit | 134 | $0 |
| Wage / Income Gap (%) | 573 | 0.00% |
| Wage / Income Gap ($) | 573 | 100.00¢ per $1 |
| Gini / Inequality Index | 573 | 0.25 |
Earnings by Sex in Standing Pine
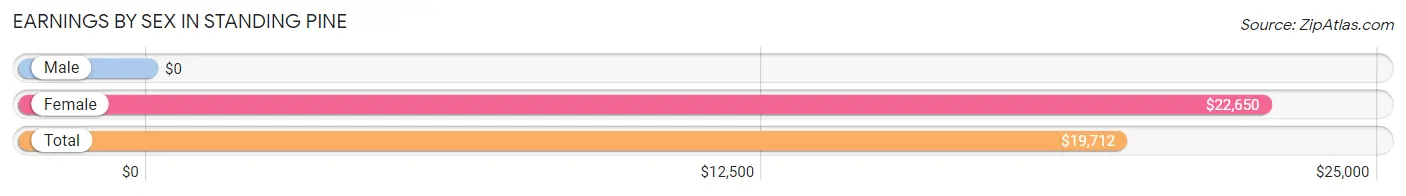
| Sex | Number | Average Earnings |
| Male | 103 (42.6%) | $0 |
| Female | 139 (57.4%) | $22,650 |
| Total | 242 (100.0%) | $19,712 |
Earnings by Sex by Income Bracket in Standing Pine
The most common earnings brackets in Standing Pine are $15,000 to $17,499 for men (50 | 48.5%) and $35,000 to $39,999 for women (28 | 20.1%).
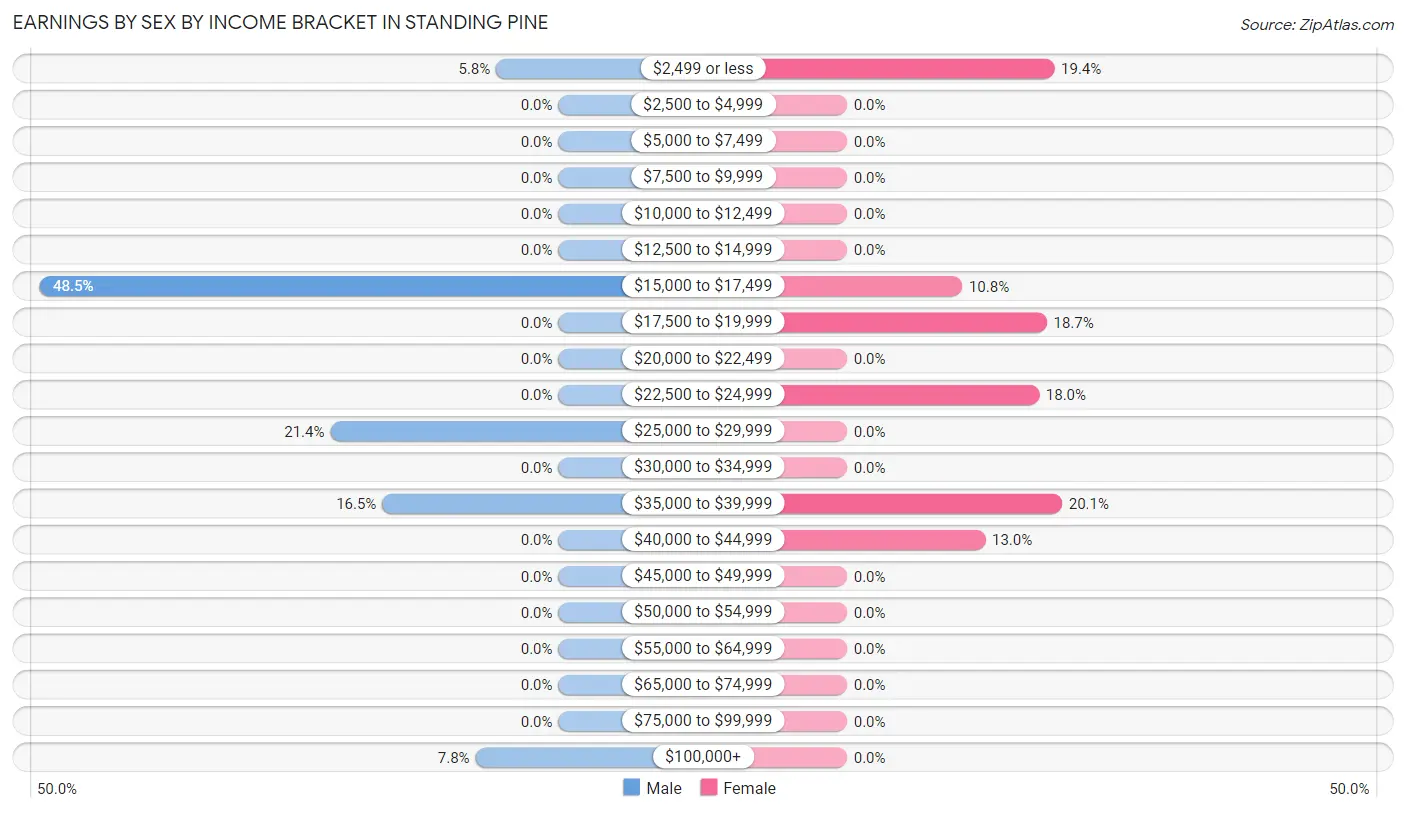
| Income | Male | Female |
| $2,499 or less | 6 (5.8%) | 27 (19.4%) |
| $2,500 to $4,999 | 0 (0.0%) | 0 (0.0%) |
| $5,000 to $7,499 | 0 (0.0%) | 0 (0.0%) |
| $7,500 to $9,999 | 0 (0.0%) | 0 (0.0%) |
| $10,000 to $12,499 | 0 (0.0%) | 0 (0.0%) |
| $12,500 to $14,999 | 0 (0.0%) | 0 (0.0%) |
| $15,000 to $17,499 | 50 (48.5%) | 15 (10.8%) |
| $17,500 to $19,999 | 0 (0.0%) | 26 (18.7%) |
| $20,000 to $22,499 | 0 (0.0%) | 0 (0.0%) |
| $22,500 to $24,999 | 0 (0.0%) | 25 (18.0%) |
| $25,000 to $29,999 | 22 (21.4%) | 0 (0.0%) |
| $30,000 to $34,999 | 0 (0.0%) | 0 (0.0%) |
| $35,000 to $39,999 | 17 (16.5%) | 28 (20.1%) |
| $40,000 to $44,999 | 0 (0.0%) | 18 (13.0%) |
| $45,000 to $49,999 | 0 (0.0%) | 0 (0.0%) |
| $50,000 to $54,999 | 0 (0.0%) | 0 (0.0%) |
| $55,000 to $64,999 | 0 (0.0%) | 0 (0.0%) |
| $65,000 to $74,999 | 0 (0.0%) | 0 (0.0%) |
| $75,000 to $99,999 | 0 (0.0%) | 0 (0.0%) |
| $100,000+ | 8 (7.8%) | 0 (0.0%) |
| Total | 103 (100.0%) | 139 (100.0%) |
Earnings by Sex by Educational Attainment in Standing Pine
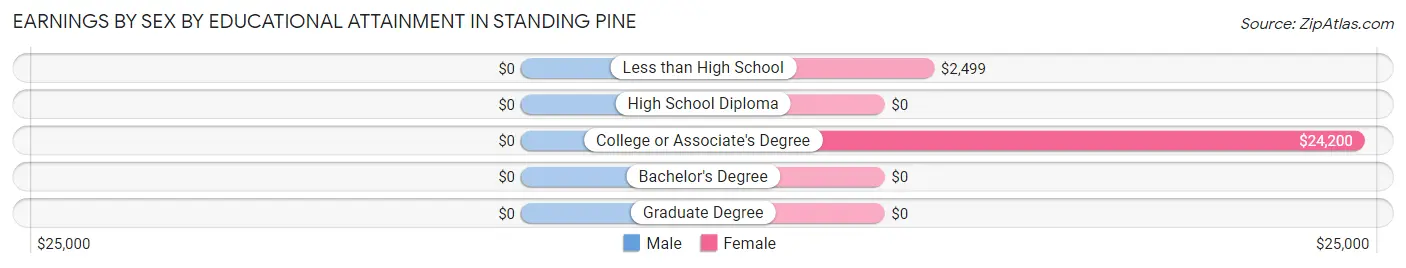
| Educational Attainment | Male Income | Female Income |
| Less than High School | - | - |
| High School Diploma | - | - |
| College or Associate's Degree | - | - |
| Bachelor's Degree | - | - |
| Graduate Degree | - | - |
| Total | - | - |
Family Income in Standing Pine
Family Income Brackets in Standing Pine
According to the Standing Pine family income data, there are 44 families falling into the $35,000 to $49,999 income range, which is the most common income bracket and makes up 32.8% of all families.
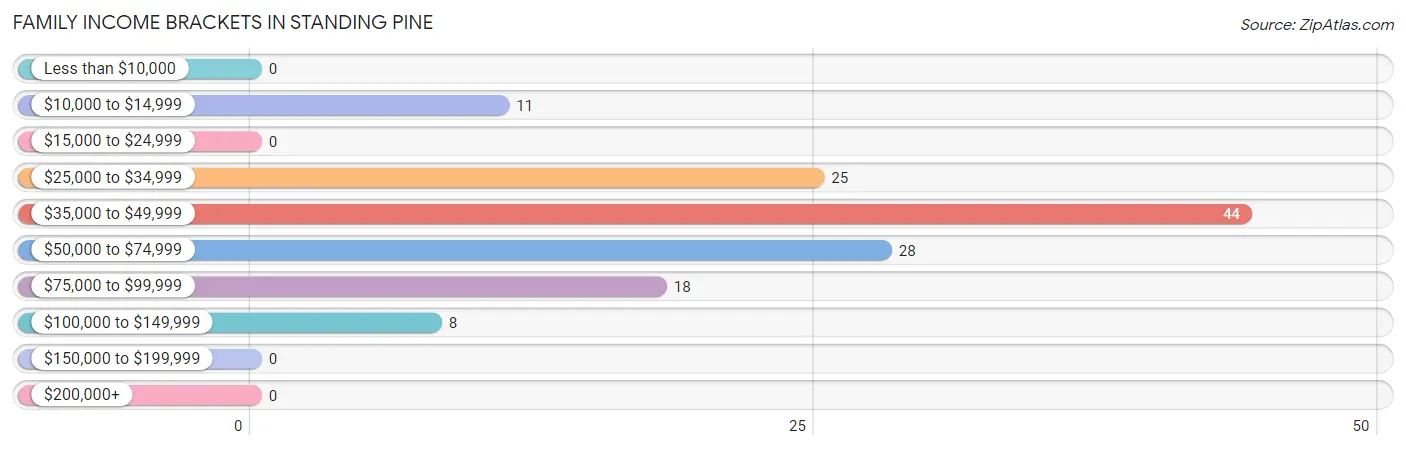
| Income Bracket | # Families | % Families |
| Less than $10,000 | 0 | 0.0% |
| $10,000 to $14,999 | 11 | 8.2% |
| $15,000 to $24,999 | 0 | 0.0% |
| $25,000 to $34,999 | 25 | 18.7% |
| $35,000 to $49,999 | 44 | 32.8% |
| $50,000 to $74,999 | 28 | 20.9% |
| $75,000 to $99,999 | 18 | 13.4% |
| $100,000 to $149,999 | 8 | 6.0% |
| $150,000 to $199,999 | 0 | 0.0% |
| $200,000+ | 0 | 0.0% |
Family Income by Famaliy Size in Standing Pine
4-person families (57 | 42.5%) account for the highest median family income in Standing Pine with $56,563 per family, while 4-person families (57 | 42.5%) have the highest median income of $14,141 per family member.
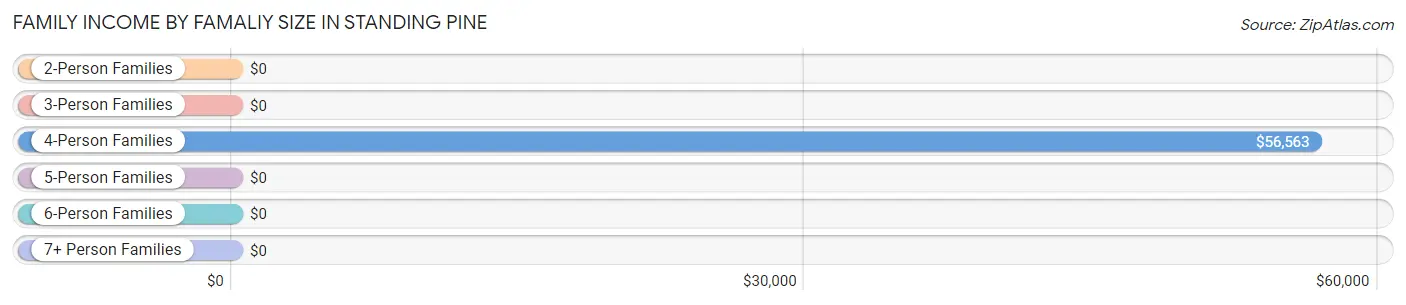
| Income Bracket | # Families | Median Income |
| 2-Person Families | 8 (6.0%) | $0 |
| 3-Person Families | 25 (18.7%) | $0 |
| 4-Person Families | 57 (42.5%) | $56,563 |
| 5-Person Families | 10 (7.5%) | $0 |
| 6-Person Families | 23 (17.2%) | $0 |
| 7+ Person Families | 11 (8.2%) | $0 |
| Total | 134 (100.0%) | $44,500 |
Family Income by Number of Earners in Standing Pine
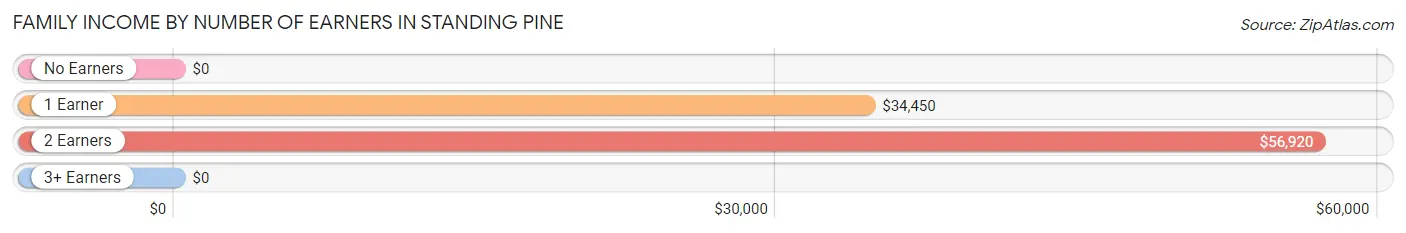
| Number of Earners | # Families | Median Income |
| No Earners | 2 (1.5%) | $0 |
| 1 Earner | 57 (42.5%) | $34,450 |
| 2 Earners | 65 (48.5%) | $56,920 |
| 3+ Earners | 10 (7.5%) | $0 |
| Total | 134 (100.0%) | $44,500 |
Household Income in Standing Pine
Household Income Brackets in Standing Pine
With 51 households falling in the category, the $50,000 to $74,999 income range is the most frequent in Standing Pine, accounting for 38.1% of all households.
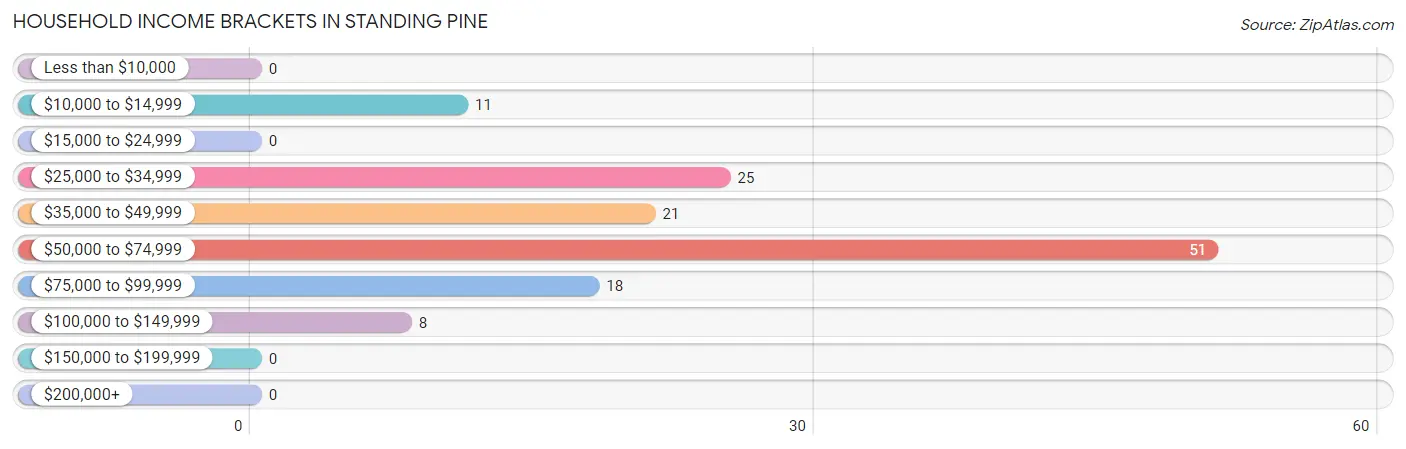
| Income Bracket | # Households | % Households |
| Less than $10,000 | 0 | 0.0% |
| $10,000 to $14,999 | 11 | 8.2% |
| $15,000 to $24,999 | 0 | 0.0% |
| $25,000 to $34,999 | 25 | 18.7% |
| $35,000 to $49,999 | 21 | 15.7% |
| $50,000 to $74,999 | 51 | 38.1% |
| $75,000 to $99,999 | 18 | 13.4% |
| $100,000 to $149,999 | 8 | 6.0% |
| $150,000 to $199,999 | 0 | 0.0% |
| $200,000+ | 0 | 0.0% |
Household Income by Householder Age in Standing Pine
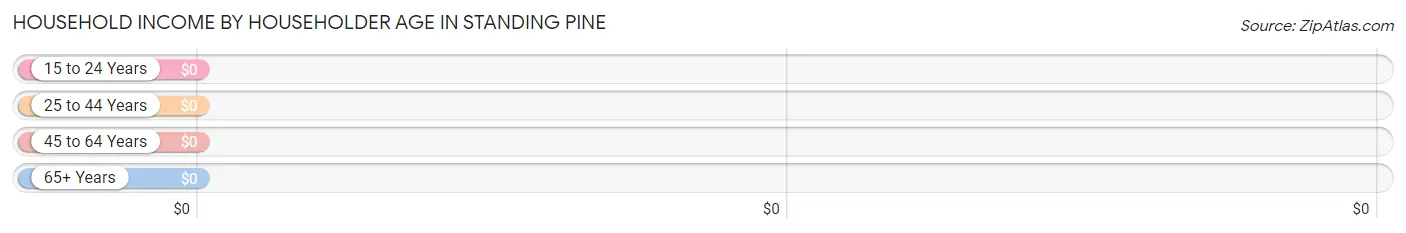
| Income Bracket | # Households | Median Income |
| 15 to 24 Years | 2 (1.5%) | $0 |
| 25 to 44 Years | 48 (35.8%) | $0 |
| 45 to 64 Years | 51 (38.1%) | $0 |
| 65+ Years | 33 (24.6%) | $0 |
| Total | 134 (100.0%) | $55,893 |
Poverty in Standing Pine
Income Below Poverty by Sex and Age in Standing Pine
With 20.5% poverty level for males and 10.6% for females among the residents of Standing Pine, 15 year old males and 6 to 11 year old females are the most vulnerable to poverty, with 3 males (100.0%) and 20 females (100.0%) in their respective age groups living below the poverty level.
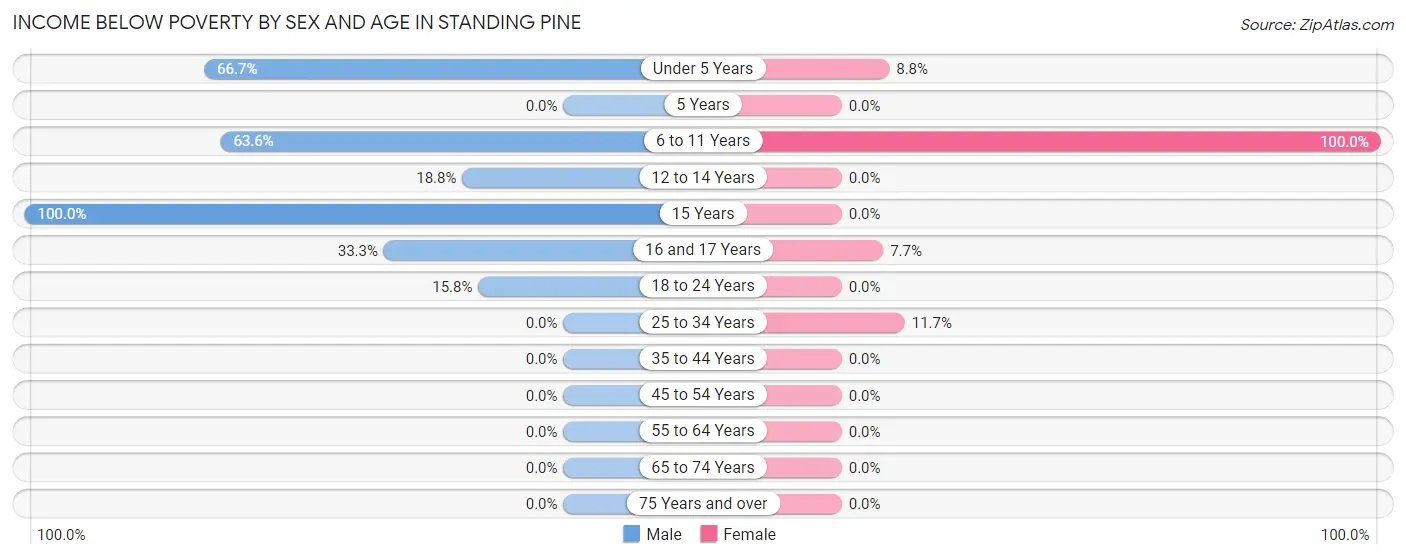
| Age Bracket | Male | Female |
| Under 5 Years | 12 (66.7%) | 3 (8.8%) |
| 5 Years | 0 (0.0%) | 0 (0.0%) |
| 6 to 11 Years | 28 (63.6%) | 20 (100.0%) |
| 12 to 14 Years | 3 (18.8%) | 0 (0.0%) |
| 15 Years | 3 (100.0%) | 0 (0.0%) |
| 16 and 17 Years | 3 (33.3%) | 2 (7.7%) |
| 18 to 24 Years | 3 (15.8%) | 0 (0.0%) |
| 25 to 34 Years | 0 (0.0%) | 9 (11.7%) |
| 35 to 44 Years | 0 (0.0%) | 0 (0.0%) |
| 45 to 54 Years | 0 (0.0%) | 0 (0.0%) |
| 55 to 64 Years | 0 (0.0%) | 0 (0.0%) |
| 65 to 74 Years | 0 (0.0%) | 0 (0.0%) |
| 75 Years and over | 0 (0.0%) | 0 (0.0%) |
| Total | 52 (20.5%) | 34 (10.6%) |
Income Above Poverty by Sex and Age in Standing Pine
According to the poverty statistics in Standing Pine, males aged 25 to 34 years and females aged 5 years are the age groups that are most secure financially, with 100.0% of males and 100.0% of females in these age groups living above the poverty line.
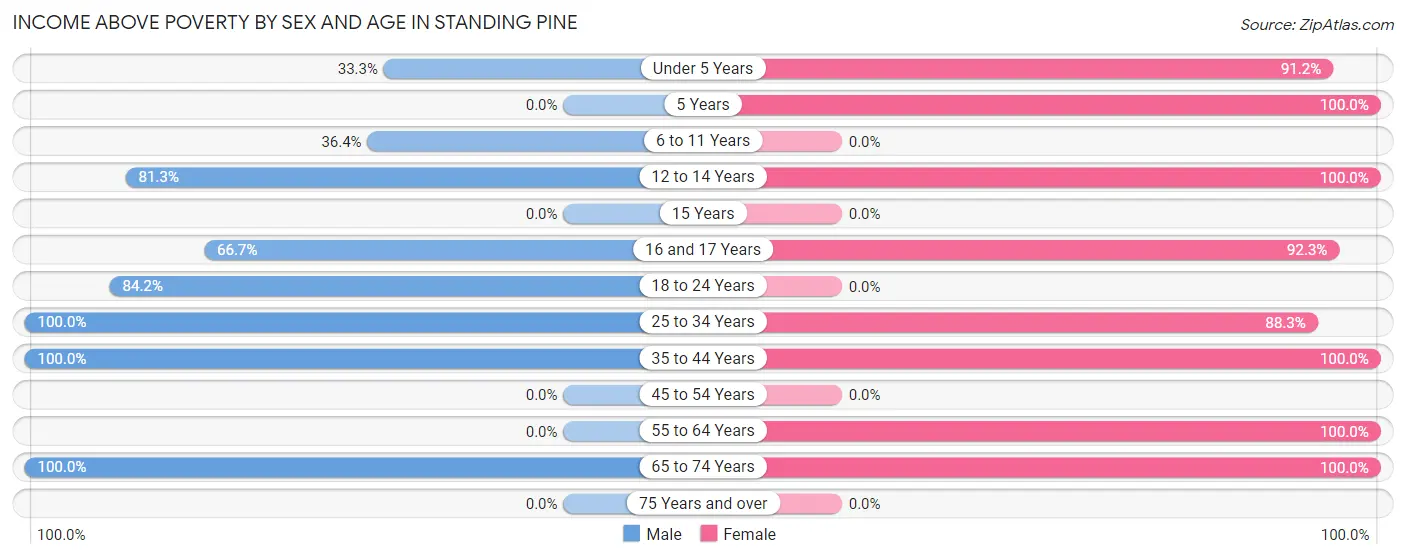
| Age Bracket | Male | Female |
| Under 5 Years | 6 (33.3%) | 31 (91.2%) |
| 5 Years | 0 (0.0%) | 14 (100.0%) |
| 6 to 11 Years | 16 (36.4%) | 0 (0.0%) |
| 12 to 14 Years | 13 (81.2%) | 22 (100.0%) |
| 15 Years | 0 (0.0%) | 0 (0.0%) |
| 16 and 17 Years | 6 (66.7%) | 24 (92.3%) |
| 18 to 24 Years | 16 (84.2%) | 0 (0.0%) |
| 25 to 34 Years | 12 (100.0%) | 68 (88.3%) |
| 35 to 44 Years | 124 (100.0%) | 44 (100.0%) |
| 45 to 54 Years | 0 (0.0%) | 0 (0.0%) |
| 55 to 64 Years | 0 (0.0%) | 51 (100.0%) |
| 65 to 74 Years | 8 (100.0%) | 32 (100.0%) |
| 75 Years and over | 0 (0.0%) | 0 (0.0%) |
| Total | 201 (79.4%) | 286 (89.4%) |
Income Below Poverty Among Married-Couple Families in Standing Pine
| Children | Above Poverty | Below Poverty |
| No Children | 8 (100.0%) | 0 (0.0%) |
| 1 or 2 Children | 29 (100.0%) | 0 (0.0%) |
| 3 or 4 Children | 10 (100.0%) | 0 (0.0%) |
| 5 or more Children | 0 (0.0%) | 0 (0.0%) |
| Total | 47 (100.0%) | 0 (0.0%) |
Income Below Poverty Among Single-Parent Households in Standing Pine
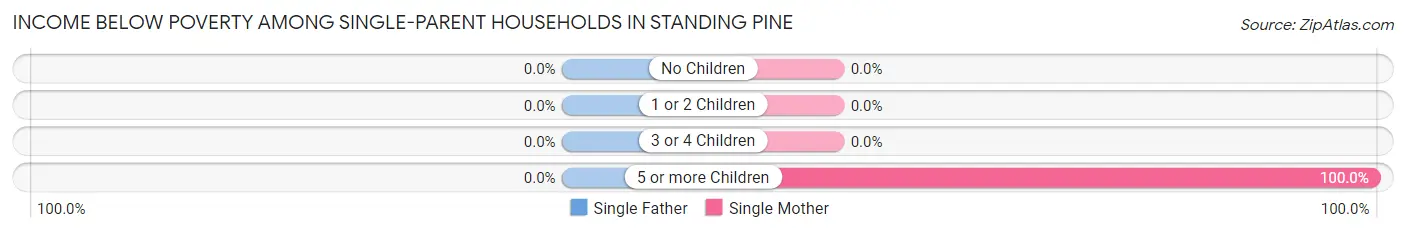
| Children | Single Father | Single Mother |
| No Children | 0 (0.0%) | 0 (0.0%) |
| 1 or 2 Children | 0 (0.0%) | 0 (0.0%) |
| 3 or 4 Children | 0 (0.0%) | 0 (0.0%) |
| 5 or more Children | 0 (0.0%) | 11 (100.0%) |
| Total | 0 (0.0%) | 11 (12.6%) |
Income Below Poverty Among Married-Couple vs Single-Parent Households in Standing Pine
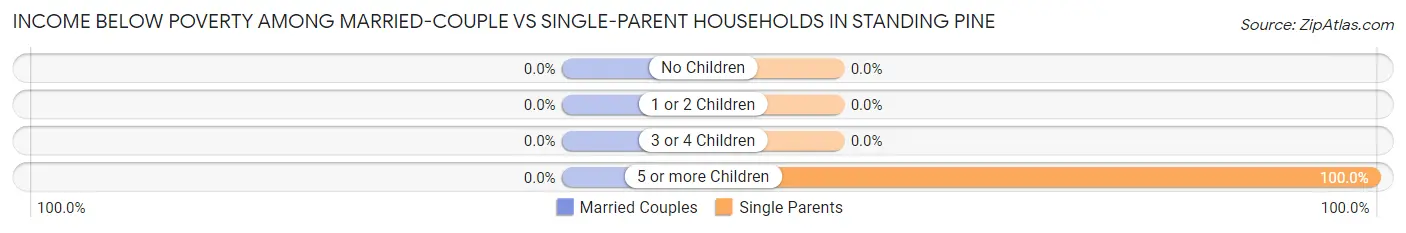
| Children | Married-Couple Families | Single-Parent Households |
| No Children | 0 (0.0%) | 0 (0.0%) |
| 1 or 2 Children | 0 (0.0%) | 0 (0.0%) |
| 3 or 4 Children | 0 (0.0%) | 0 (0.0%) |
| 5 or more Children | 0 (0.0%) | 11 (100.0%) |
| Total | 0 (0.0%) | 11 (12.6%) |
Race in Standing Pine
The most populous races in Standing Pine are Native / Alaskan (457 | 79.8%), White / Caucasian (87 | 15.2%), and Hispanic or Latino (29 | 5.1%).
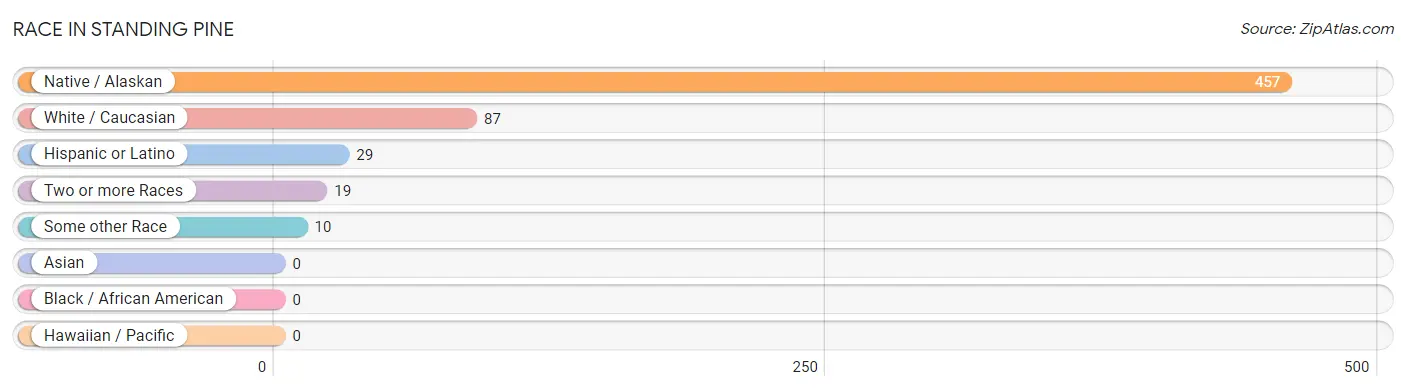
| Race | # Population | % Population |
| Asian | 0 | 0.0% |
| Black / African American | 0 | 0.0% |
| Hawaiian / Pacific | 0 | 0.0% |
| Hispanic or Latino | 29 | 5.1% |
| Native / Alaskan | 457 | 79.8% |
| White / Caucasian | 87 | 15.2% |
| Two or more Races | 19 | 3.3% |
| Some other Race | 10 | 1.8% |
| Total | 573 | 100.0% |
Ancestry in Standing Pine
The most populous ancestries reported in Standing Pine are Choctaw (457 | 79.8%), English (72 | 12.6%), and Mexican (29 | 5.1%), together accounting for 97.4% of all Standing Pine residents.
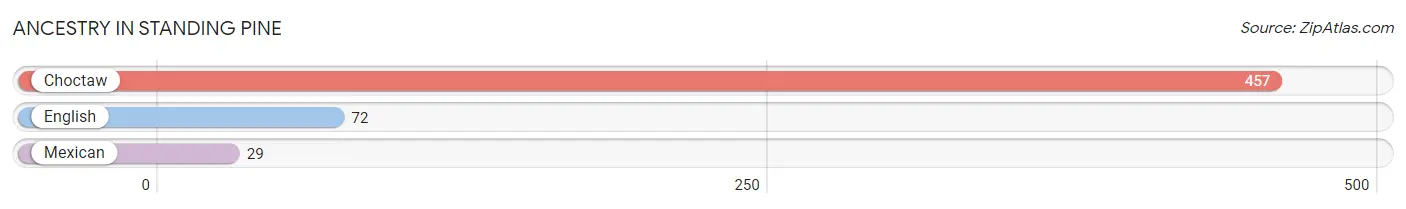
| Ancestry | # Population | % Population |
| Choctaw | 457 | 79.8% |
| English | 72 | 12.6% |
| Mexican | 29 | 5.1% | View All 3 Rows |
Immigrants in Standing Pine
The most numerous immigrant groups reported in Standing Pine came from Central America (10 | 1.8%), Latin America (10 | 1.8%), and Mexico (10 | 1.8%), together accounting for 5.3% of all Standing Pine residents.
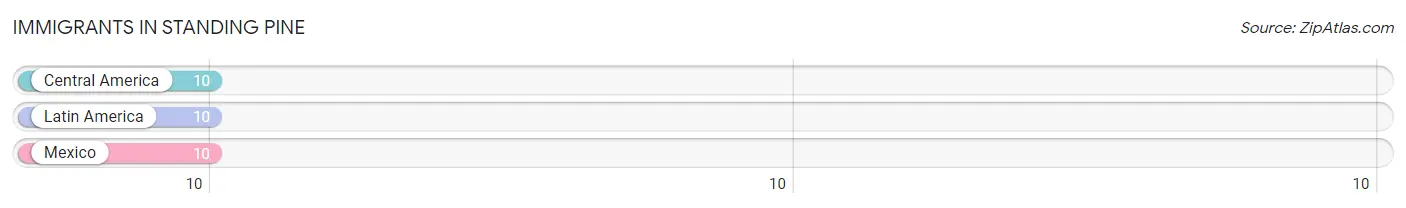
| Immigration Origin | # Population | % Population |
| Central America | 10 | 1.8% |
| Latin America | 10 | 1.8% |
| Mexico | 10 | 1.8% | View All 3 Rows |
Sex and Age in Standing Pine
Sex and Age in Standing Pine
The most populous age groups in Standing Pine are 35 to 39 Years (69 | 27.3%) for men and 25 to 29 Years (77 | 24.1%) for women.
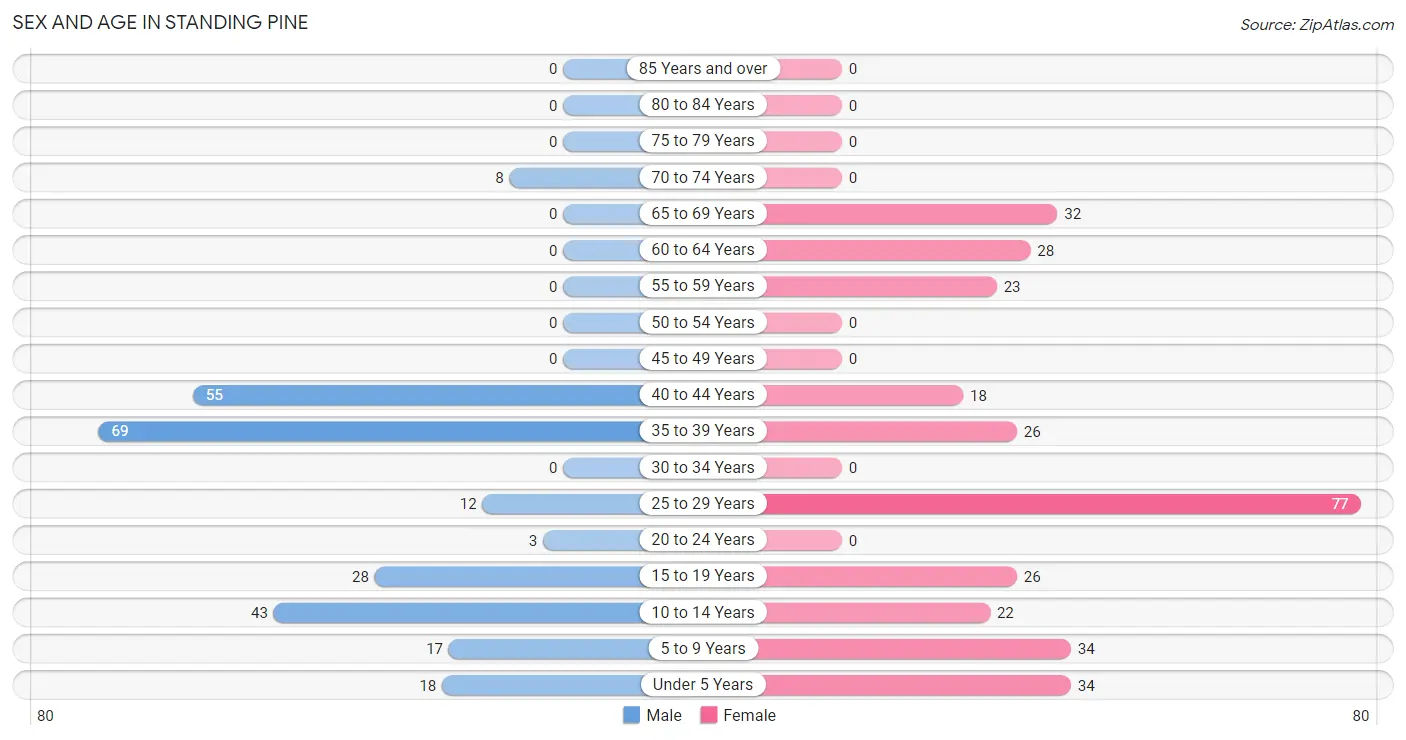
| Age Bracket | Male | Female |
| Under 5 Years | 18 (7.1%) | 34 (10.6%) |
| 5 to 9 Years | 17 (6.7%) | 34 (10.6%) |
| 10 to 14 Years | 43 (17.0%) | 22 (6.9%) |
| 15 to 19 Years | 28 (11.1%) | 26 (8.1%) |
| 20 to 24 Years | 3 (1.2%) | 0 (0.0%) |
| 25 to 29 Years | 12 (4.7%) | 77 (24.1%) |
| 30 to 34 Years | 0 (0.0%) | 0 (0.0%) |
| 35 to 39 Years | 69 (27.3%) | 26 (8.1%) |
| 40 to 44 Years | 55 (21.7%) | 18 (5.6%) |
| 45 to 49 Years | 0 (0.0%) | 0 (0.0%) |
| 50 to 54 Years | 0 (0.0%) | 0 (0.0%) |
| 55 to 59 Years | 0 (0.0%) | 23 (7.2%) |
| 60 to 64 Years | 0 (0.0%) | 28 (8.7%) |
| 65 to 69 Years | 0 (0.0%) | 32 (10.0%) |
| 70 to 74 Years | 8 (3.2%) | 0 (0.0%) |
| 75 to 79 Years | 0 (0.0%) | 0 (0.0%) |
| 80 to 84 Years | 0 (0.0%) | 0 (0.0%) |
| 85 Years and over | 0 (0.0%) | 0 (0.0%) |
| Total | 253 (100.0%) | 320 (100.0%) |
Families and Households in Standing Pine
Median Family Size in Standing Pine
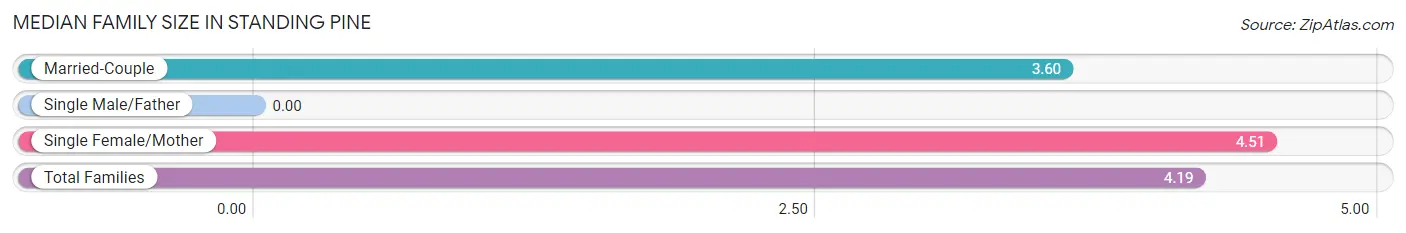
| Family Type | # Families | Family Size |
| Married-Couple | 47 (35.1%) | 3.60 |
| Single Male/Father | 0 (0.0%) | - |
| Single Female/Mother | 87 (64.9%) | 4.51 |
| Total Families | 134 (100.0%) | 4.19 |
Median Household Size in Standing Pine
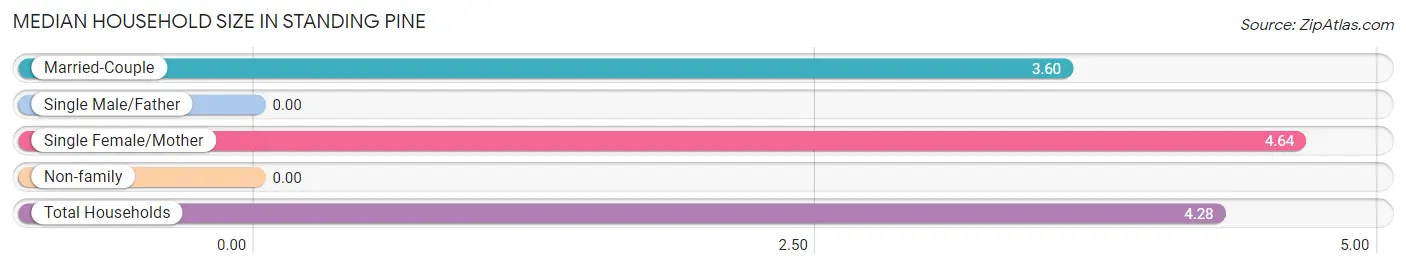
| Household Type | # Households | Household Size |
| Married-Couple | 47 (35.1%) | 3.60 |
| Single Male/Father | 0 (0.0%) | - |
| Single Female/Mother | 87 (64.9%) | 4.64 |
| Non-family | 0 (0.0%) | - |
| Total Households | 134 (100.0%) | 4.28 |
Household Size by Marriage Status in Standing Pine
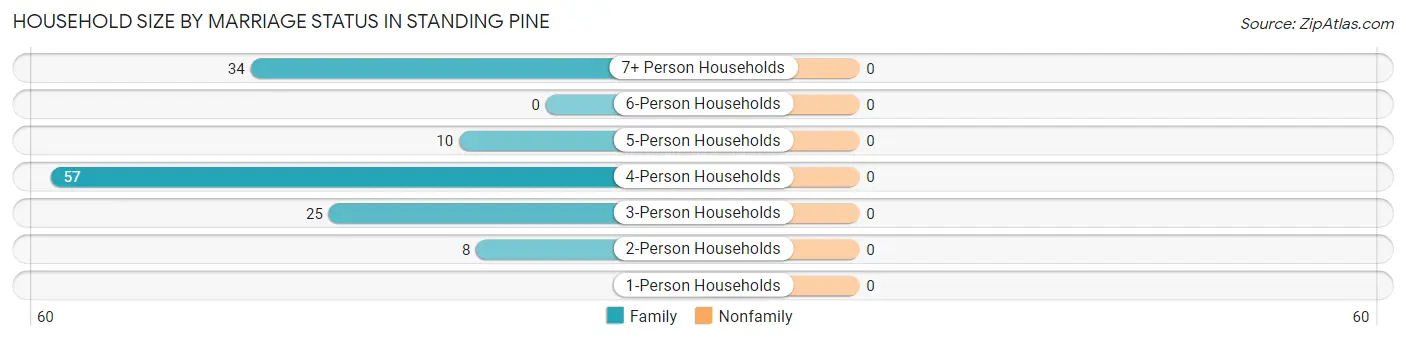
| Household Size | Family Households | Nonfamily Households |
| 1-Person Households | - | 0 (0.0%) |
| 2-Person Households | 8 (6.0%) | 0 (0.0%) |
| 3-Person Households | 25 (18.7%) | 0 (0.0%) |
| 4-Person Households | 57 (42.5%) | 0 (0.0%) |
| 5-Person Households | 10 (7.5%) | 0 (0.0%) |
| 6-Person Households | 0 (0.0%) | 0 (0.0%) |
| 7+ Person Households | 34 (25.4%) | 0 (0.0%) |
| Total | 134 (100.0%) | 0 (0.0%) |
Female Fertility in Standing Pine
Fertility by Age in Standing Pine
Average fertility rate in Standing Pine is 177.0 births per 1,000 women. Women in the age bracket of 20 to 34 years have the highest fertility rate with 338.0 births per 1,000 women. Women in the age bracket of 20 to 34 years acount for 100.0% of all women with births.
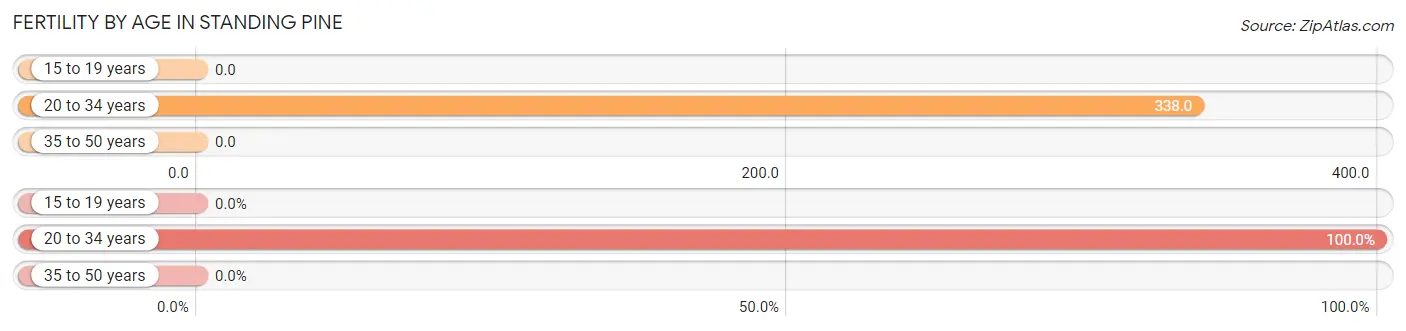
| Age Bracket | Women with Births | Births / 1,000 Women |
| 15 to 19 years | 0 (0.0%) | 0.0 |
| 20 to 34 years | 26 (100.0%) | 338.0 |
| 35 to 50 years | 0 (0.0%) | 0.0 |
| Total | 26 (100.0%) | 177.0 |
Fertility by Age by Marriage Status in Standing Pine
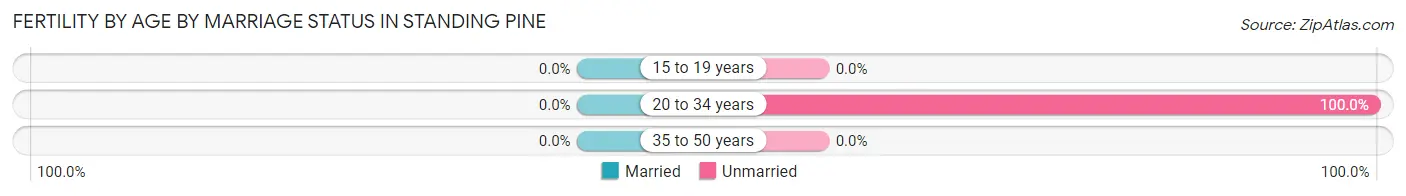
| Age Bracket | Married | Unmarried |
| 15 to 19 years | 0 (0.0%) | 0 (0.0%) |
| 20 to 34 years | 0 (0.0%) | 26 (100.0%) |
| 35 to 50 years | 0 (0.0%) | 0 (0.0%) |
| Total | 0 (0.0%) | 26 (100.0%) |
Fertility by Education in Standing Pine
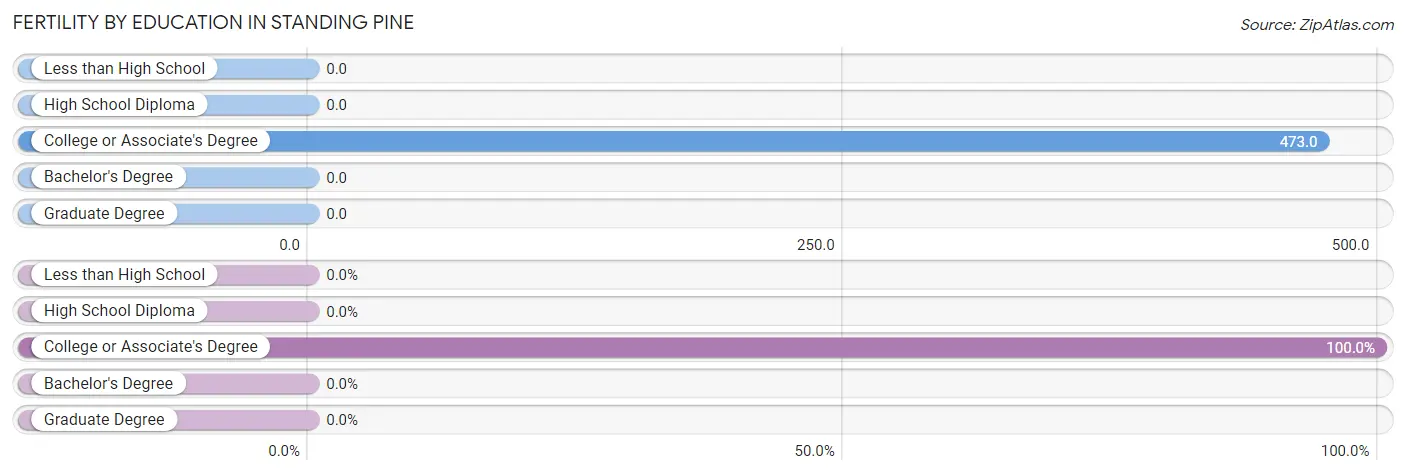
| Educational Attainment | Women with Births | Births / 1,000 Women |
| Less than High School | 0 (0.0%) | 0.0 |
| High School Diploma | 0 (0.0%) | 0.0 |
| College or Associate's Degree | 26 (100.0%) | 473.0 |
| Bachelor's Degree | 0 (0.0%) | 0.0 |
| Graduate Degree | 0 (0.0%) | 0.0 |
| Total | 26 (100.0%) | 177.0 |
Fertility by Education by Marriage Status in Standing Pine
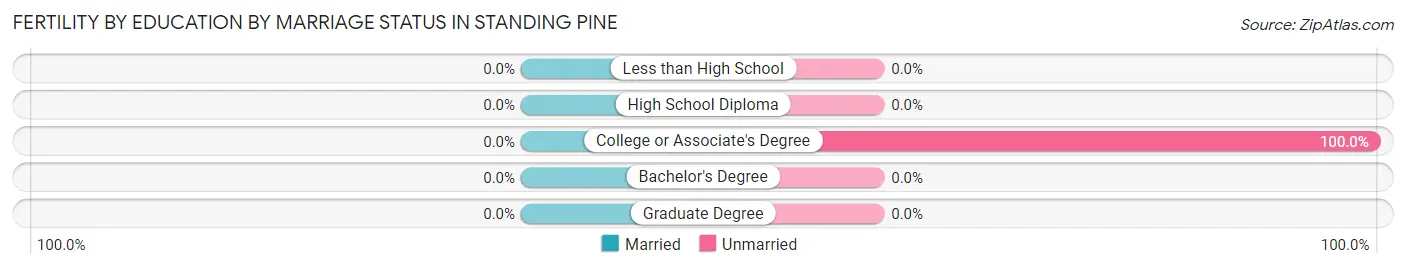
| Educational Attainment | Married | Unmarried |
| Less than High School | 0 (0.0%) | 0 (0.0%) |
| High School Diploma | 0 (0.0%) | 0 (0.0%) |
| College or Associate's Degree | 0 (0.0%) | 26 (100.0%) |
| Bachelor's Degree | 0 (0.0%) | 0 (0.0%) |
| Graduate Degree | 0 (0.0%) | 0 (0.0%) |
| Total | 0 (0.0%) | 26 (100.0%) |
Employment Characteristics in Standing Pine
Employment by Class of Employer in Standing Pine
Among the 198 employed individuals in Standing Pine, federal government employees (111 | 56.1%), private company employees (45 | 22.7%), and not-for-profit organizations (25 | 12.6%) make up the most common classes of employment.
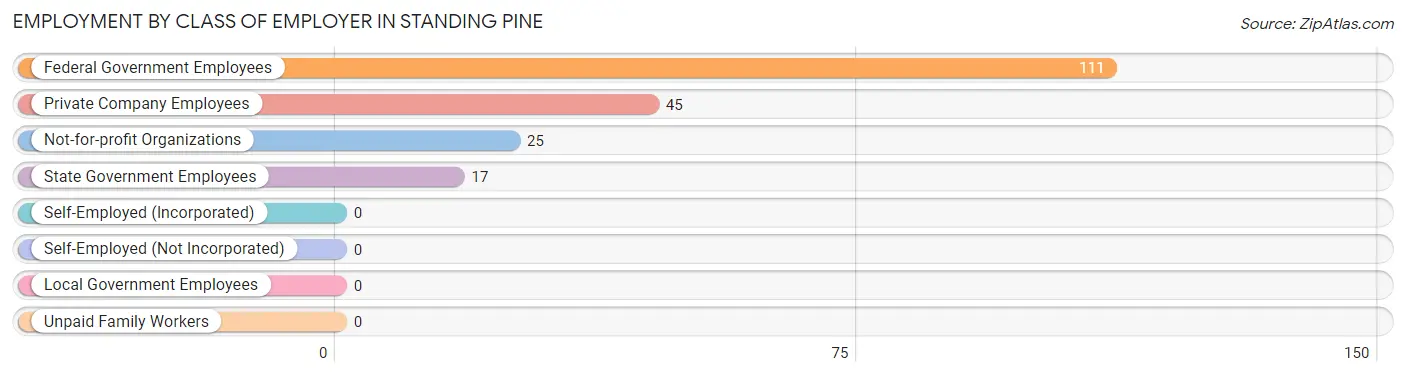
| Employer Class | # Employees | % Employees |
| Private Company Employees | 45 | 22.7% |
| Self-Employed (Incorporated) | 0 | 0.0% |
| Self-Employed (Not Incorporated) | 0 | 0.0% |
| Not-for-profit Organizations | 25 | 12.6% |
| Local Government Employees | 0 | 0.0% |
| State Government Employees | 17 | 8.6% |
| Federal Government Employees | 111 | 56.1% |
| Unpaid Family Workers | 0 | 0.0% |
| Total | 198 | 100.0% |
Employment Status by Age in Standing Pine
According to the labor force statistics for Standing Pine, out of the total population over 16 years of age (402), 52.2% or 210 individuals are in the labor force, with 5.7% or 12 of them unemployed. The age group with the highest labor force participation rate is 60 to 64 years, with 100.0% or 28 individuals in the labor force. Within the labor force, the 25 to 29 years age range has the highest percentage of unemployed individuals, with 57.1% or 12 of them being unemployed.
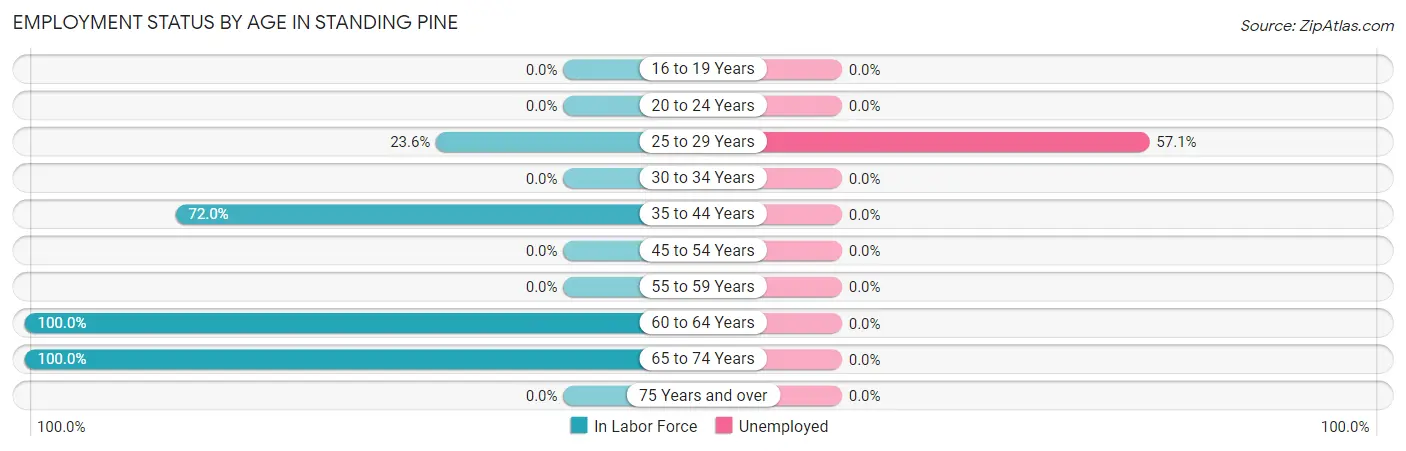
| Age Bracket | In Labor Force | Unemployed |
| 16 to 19 Years | 0 (0.0%) | 0 (0.0%) |
| 20 to 24 Years | 0 (0.0%) | 0 (0.0%) |
| 25 to 29 Years | 21 (23.6%) | 12 (57.1%) |
| 30 to 34 Years | 0 (0.0%) | 0 (0.0%) |
| 35 to 44 Years | 121 (72.0%) | 0 (0.0%) |
| 45 to 54 Years | 0 (0.0%) | 0 (0.0%) |
| 55 to 59 Years | 0 (0.0%) | 0 (0.0%) |
| 60 to 64 Years | 28 (100.0%) | 0 (0.0%) |
| 65 to 74 Years | 40 (100.0%) | 0 (0.0%) |
| 75 Years and over | 0 (0.0%) | 0 (0.0%) |
| Total | 210 (52.2%) | 12 (5.7%) |
Employment Status by Educational Attainment in Standing Pine
According to labor force statistics for Standing Pine, 55.2% of individuals (170) out of the total population between 25 and 64 years of age (308) are in the labor force, with 7.1% or 12 of them being unemployed. The group with the highest labor force participation rate are those with the educational attainment of less than high school, with 100.0% or 46 individuals in the labor force. Within the labor force, individuals with high school diploma education have the highest percentage of unemployment, with 100.0% or 12 of them being unemployed.
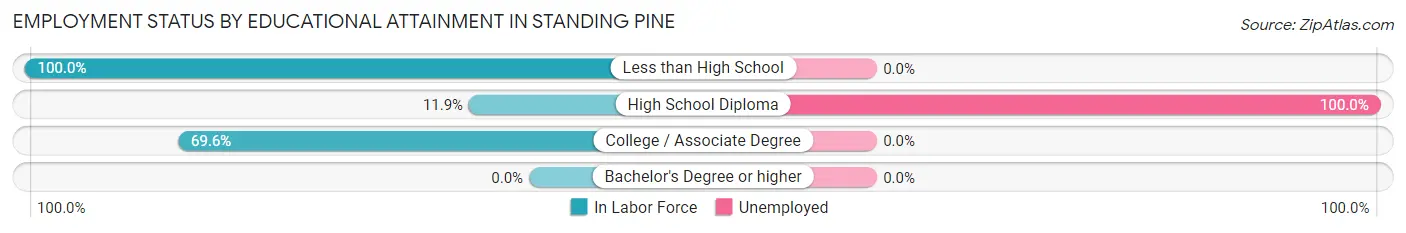
| Educational Attainment | In Labor Force | Unemployed |
| Less than High School | 46 (100.0%) | 0 (0.0%) |
| High School Diploma | 12 (11.9%) | 101 (100.0%) |
| College / Associate Degree | 112 (69.6%) | 0 (0.0%) |
| Bachelor's Degree or higher | 0 (0.0%) | 0 (0.0%) |
| Total | 170 (55.2%) | 22 (7.1%) |
Employment Occupations by Sex in Standing Pine
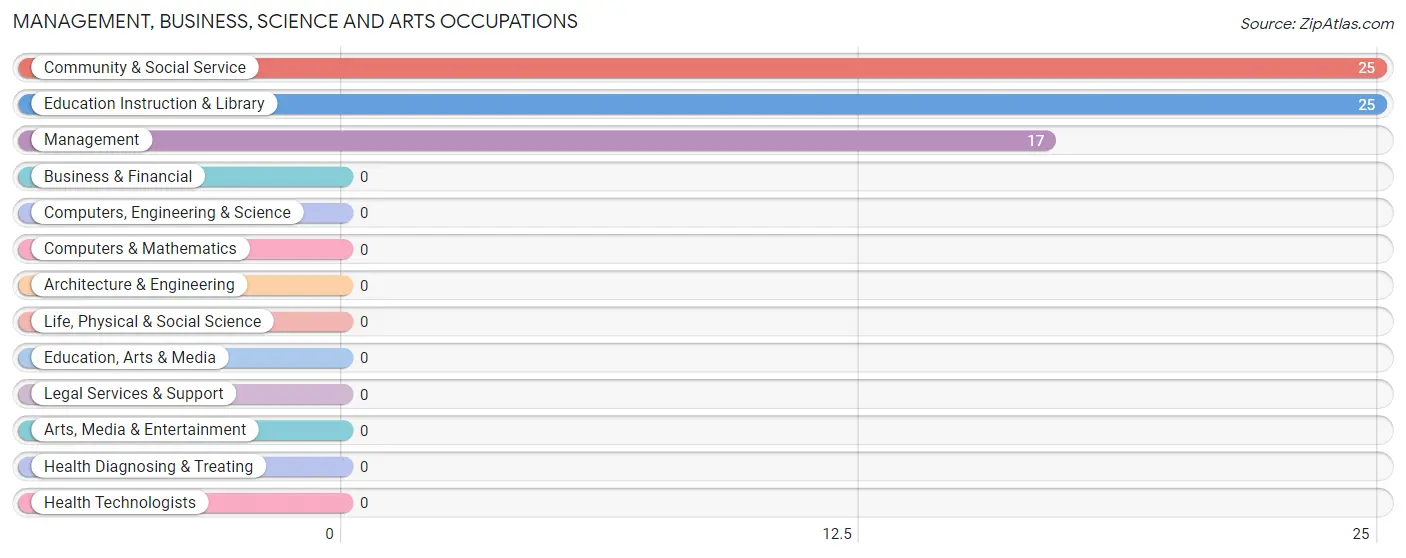
Management, Business, Science and Arts Occupations
The most common Management, Business, Science and Arts occupations in Standing Pine are Community & Social Service (25 | 12.6%), Education Instruction & Library (25 | 12.6%), and Management (17 | 8.6%).
Management, Business, Science and Arts Occupations by Sex
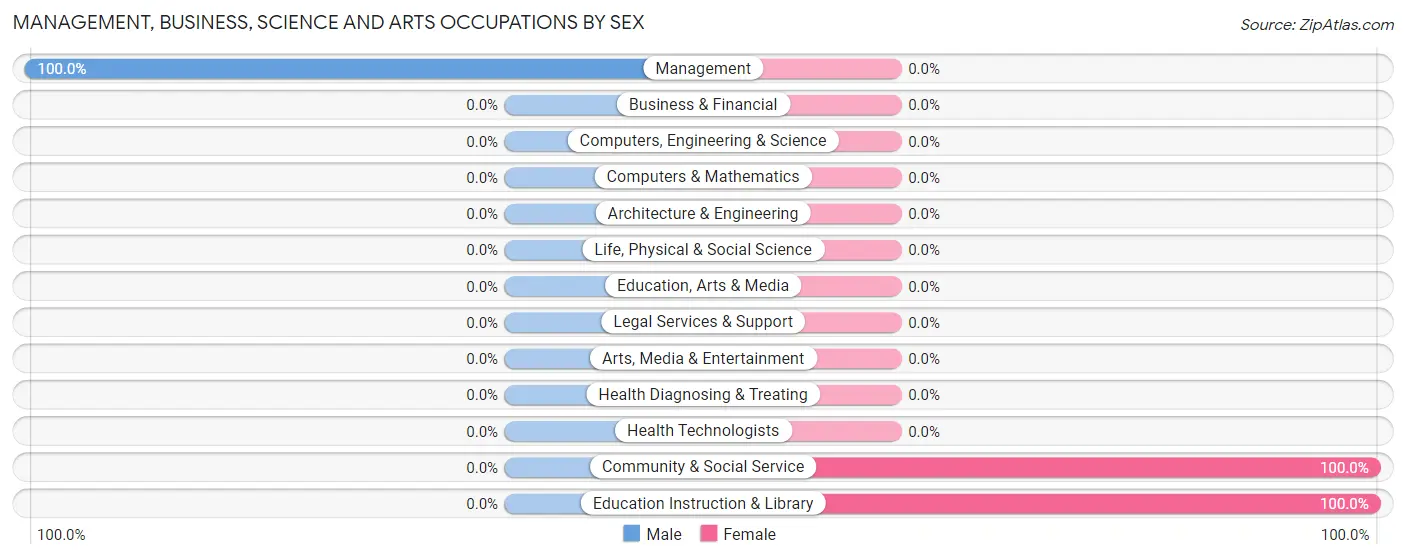
| Occupation | Male | Female |
| Management | 17 (100.0%) | 0 (0.0%) |
| Business & Financial | 0 (0.0%) | 0 (0.0%) |
| Computers, Engineering & Science | 0 (0.0%) | 0 (0.0%) |
| Computers & Mathematics | 0 (0.0%) | 0 (0.0%) |
| Architecture & Engineering | 0 (0.0%) | 0 (0.0%) |
| Life, Physical & Social Science | 0 (0.0%) | 0 (0.0%) |
| Community & Social Service | 0 (0.0%) | 25 (100.0%) |
| Education, Arts & Media | 0 (0.0%) | 0 (0.0%) |
| Legal Services & Support | 0 (0.0%) | 0 (0.0%) |
| Education Instruction & Library | 0 (0.0%) | 25 (100.0%) |
| Arts, Media & Entertainment | 0 (0.0%) | 0 (0.0%) |
| Health Diagnosing & Treating | 0 (0.0%) | 0 (0.0%) |
| Health Technologists | 0 (0.0%) | 0 (0.0%) |
| Total (Category) | 17 (40.5%) | 25 (59.5%) |
| Total (Overall) | 85 (42.9%) | 113 (57.1%) |
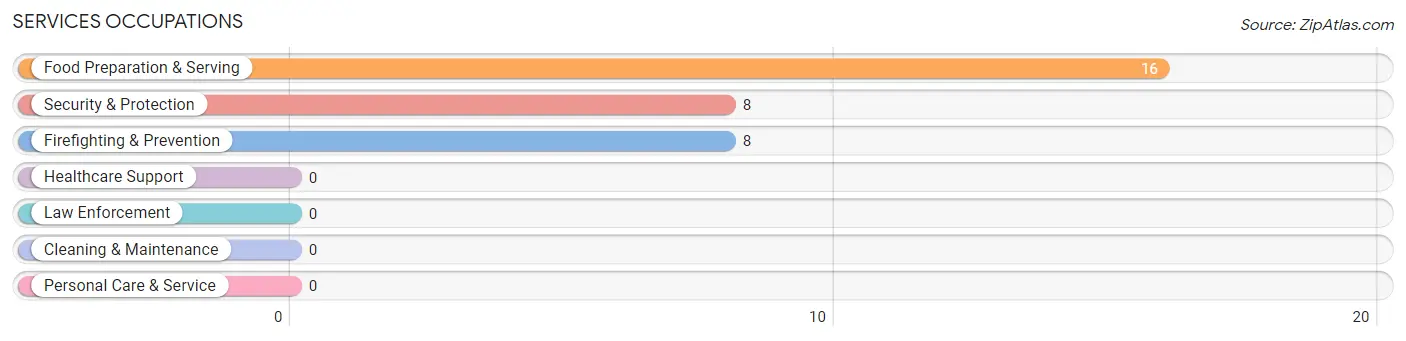
Services Occupations
The most common Services occupations in Standing Pine are Food Preparation & Serving (16 | 8.1%), Security & Protection (8 | 4.0%), and Firefighting & Prevention (8 | 4.0%).
Services Occupations by Sex
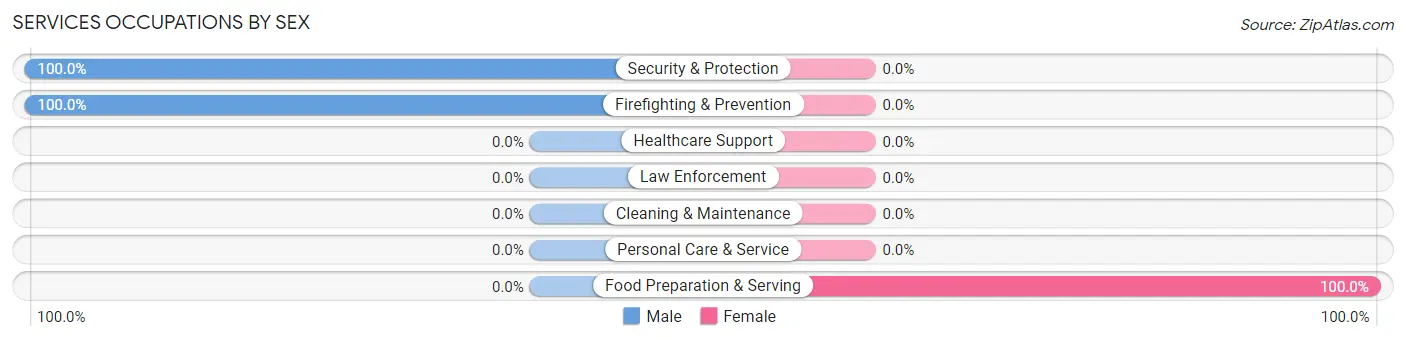
| Occupation | Male | Female |
| Healthcare Support | 0 (0.0%) | 0 (0.0%) |
| Security & Protection | 8 (100.0%) | 0 (0.0%) |
| Firefighting & Prevention | 8 (100.0%) | 0 (0.0%) |
| Law Enforcement | 0 (0.0%) | 0 (0.0%) |
| Food Preparation & Serving | 0 (0.0%) | 16 (100.0%) |
| Cleaning & Maintenance | 0 (0.0%) | 0 (0.0%) |
| Personal Care & Service | 0 (0.0%) | 0 (0.0%) |
| Total (Category) | 8 (33.3%) | 16 (66.7%) |
| Total (Overall) | 85 (42.9%) | 113 (57.1%) |
Sales and Office Occupations
The most common Sales and Office occupations in Standing Pine are , and Office & Administration (84 | 42.4%).
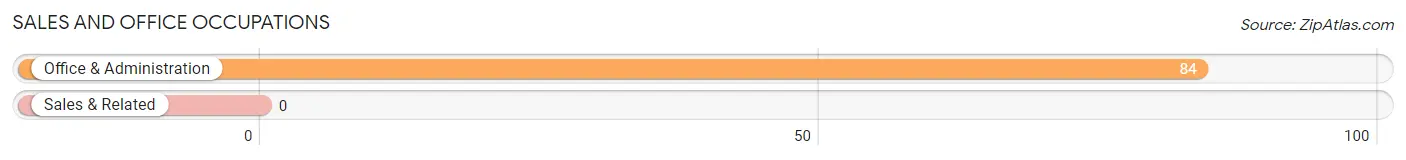
Sales and Office Occupations by Sex
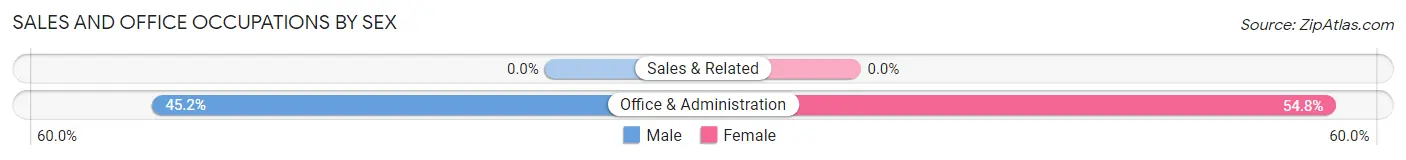
| Occupation | Male | Female |
| Sales & Related | 0 (0.0%) | 0 (0.0%) |
| Office & Administration | 38 (45.2%) | 46 (54.8%) |
| Total (Category) | 38 (45.2%) | 46 (54.8%) |
| Total (Overall) | 85 (42.9%) | 113 (57.1%) |
Natural Resources, Construction and Maintenance Occupations
The most common Natural Resources, Construction and Maintenance occupations in Standing Pine are Construction & Extraction (22 | 11.1%), and Farming, Fishing & Forestry (15 | 7.6%).
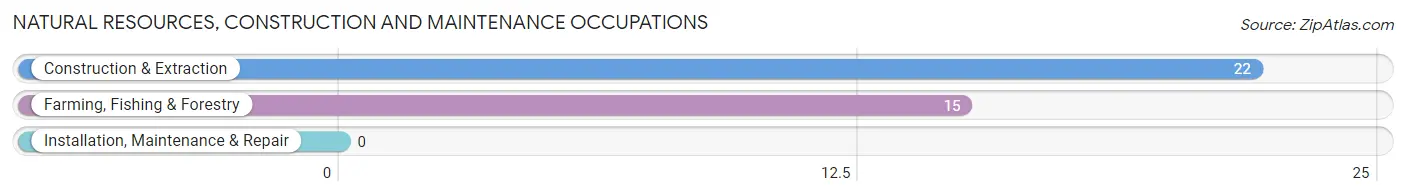
Natural Resources, Construction and Maintenance Occupations by Sex
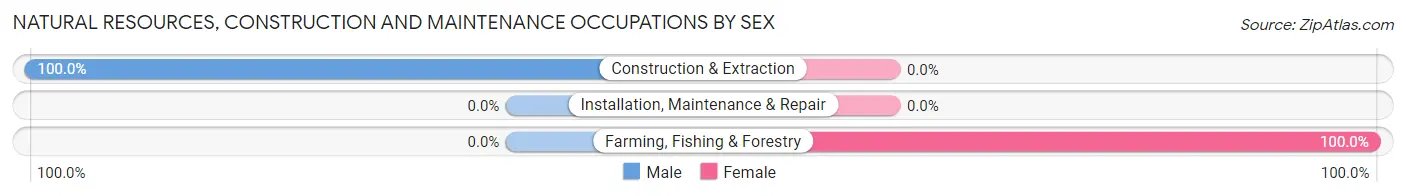
| Occupation | Male | Female |
| Farming, Fishing & Forestry | 0 (0.0%) | 15 (100.0%) |
| Construction & Extraction | 22 (100.0%) | 0 (0.0%) |
| Installation, Maintenance & Repair | 0 (0.0%) | 0 (0.0%) |
| Total (Category) | 22 (59.5%) | 15 (40.5%) |
| Total (Overall) | 85 (42.9%) | 113 (57.1%) |
Production, Transportation and Moving Occupations
The most common Production, Transportation and Moving occupations in Standing Pine are , and Material Moving (11 | 5.6%).
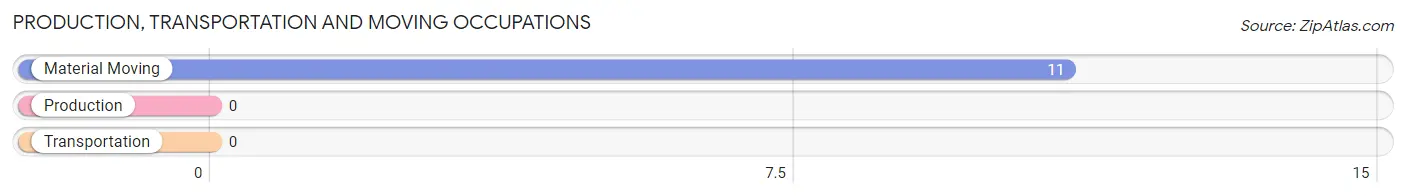
Production, Transportation and Moving Occupations by Sex
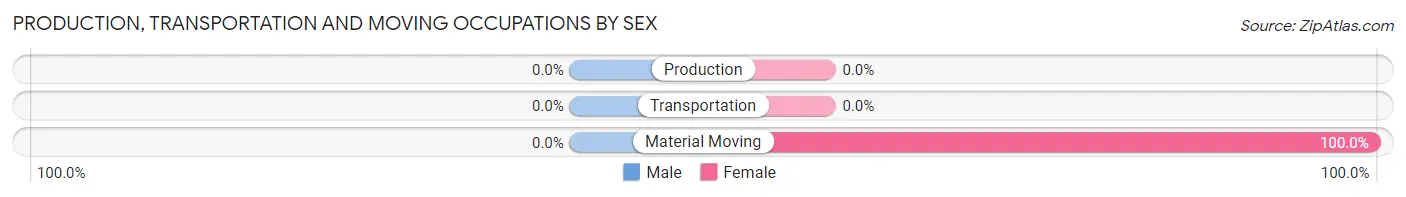
| Occupation | Male | Female |
| Production | 0 (0.0%) | 0 (0.0%) |
| Transportation | 0 (0.0%) | 0 (0.0%) |
| Material Moving | 0 (0.0%) | 11 (100.0%) |
| Total (Category) | 0 (0.0%) | 11 (100.0%) |
| Total (Overall) | 85 (42.9%) | 113 (57.1%) |
Employment Industries by Sex in Standing Pine
Employment Industries in Standing Pine
The major employment industries in Standing Pine include Educational Services (53 | 26.8%), Construction (39 | 19.7%), Public Administration (38 | 19.2%), Finance & Insurance (18 | 9.1%), and Accommodation & Food Services (16 | 8.1%).
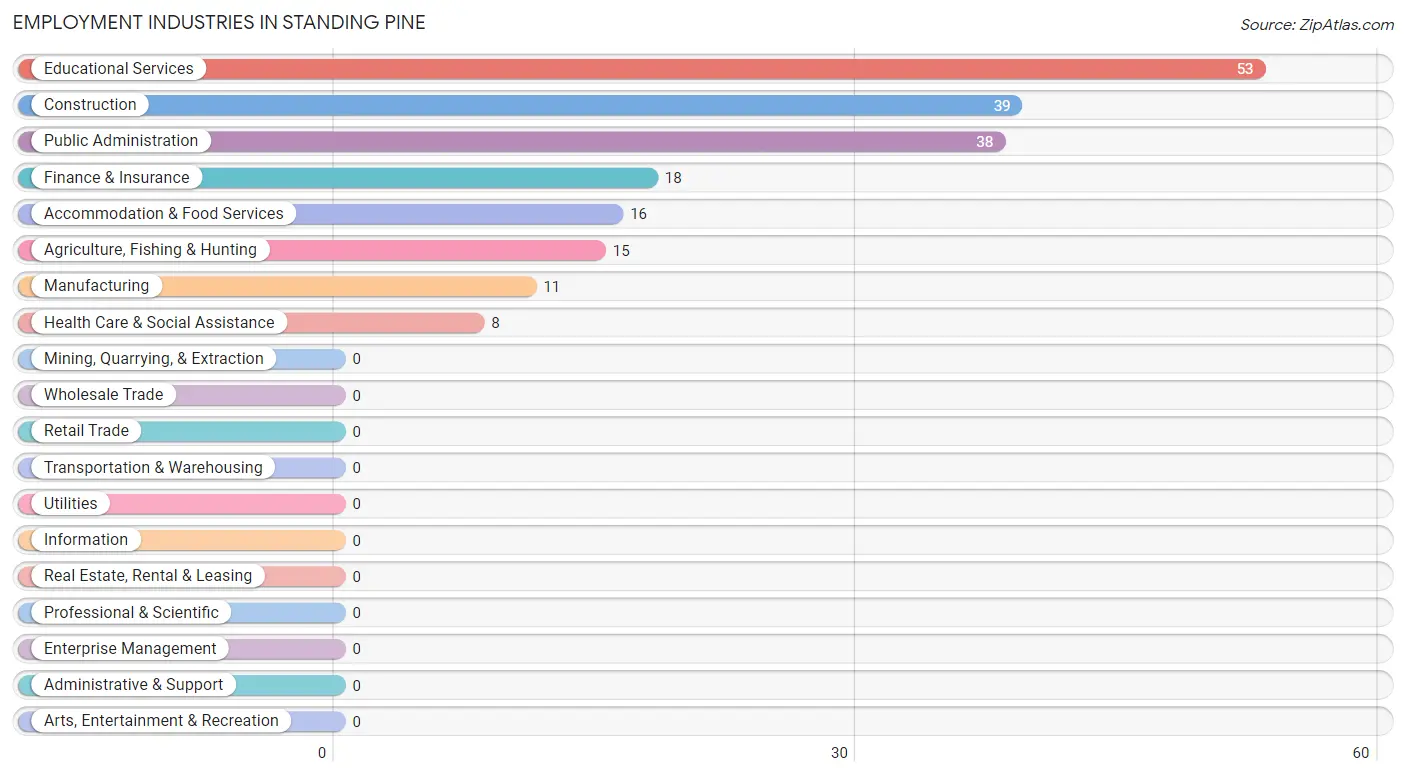
Employment Industries by Sex in Standing Pine
The Standing Pine industries that see more men than women are Construction (100.0%), Health Care & Social Assistance (100.0%), and Public Administration (100.0%), whereas the industries that tend to have a higher number of women are Agriculture, Fishing & Hunting (100.0%), Manufacturing (100.0%), and Finance & Insurance (100.0%).
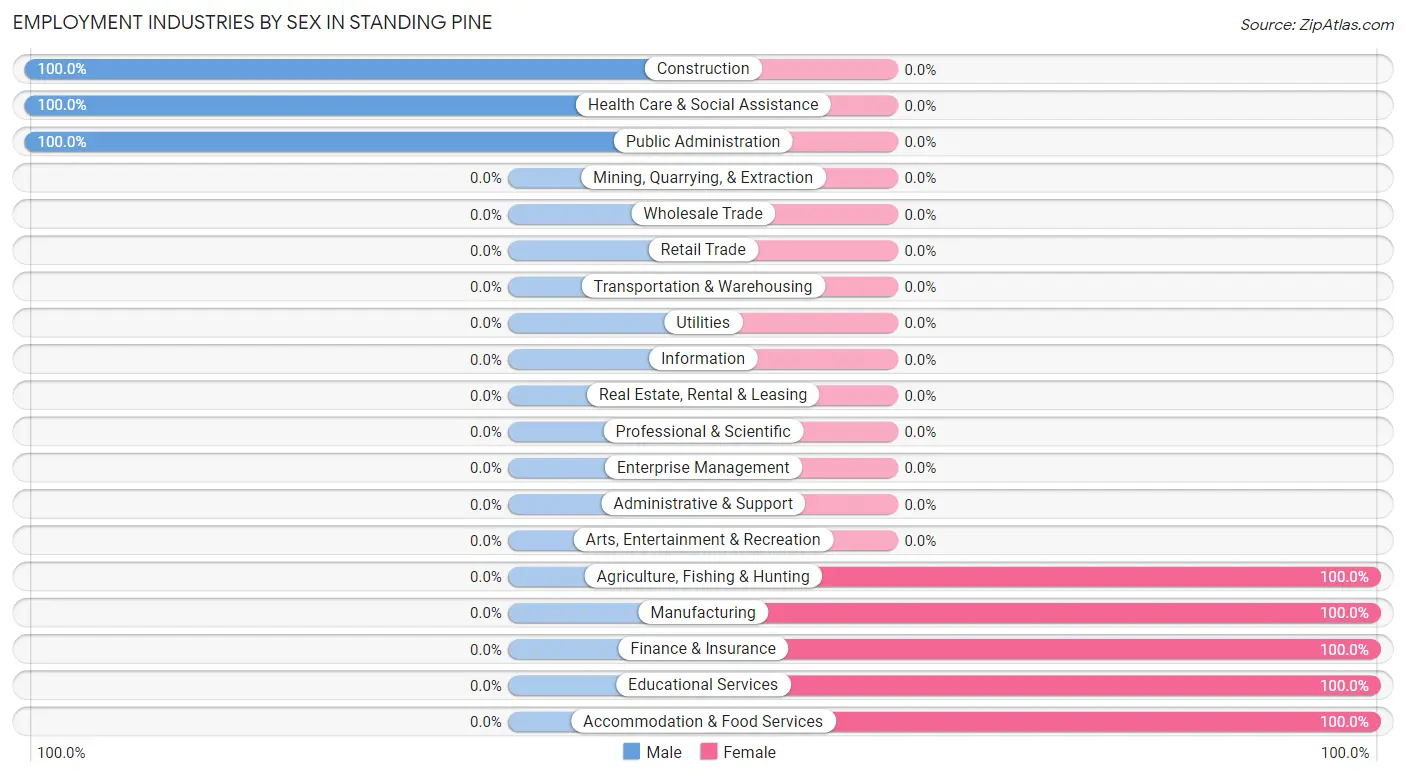
| Industry | Male | Female |
| Agriculture, Fishing & Hunting | 0 (0.0%) | 15 (100.0%) |
| Mining, Quarrying, & Extraction | 0 (0.0%) | 0 (0.0%) |
| Construction | 39 (100.0%) | 0 (0.0%) |
| Manufacturing | 0 (0.0%) | 11 (100.0%) |
| Wholesale Trade | 0 (0.0%) | 0 (0.0%) |
| Retail Trade | 0 (0.0%) | 0 (0.0%) |
| Transportation & Warehousing | 0 (0.0%) | 0 (0.0%) |
| Utilities | 0 (0.0%) | 0 (0.0%) |
| Information | 0 (0.0%) | 0 (0.0%) |
| Finance & Insurance | 0 (0.0%) | 18 (100.0%) |
| Real Estate, Rental & Leasing | 0 (0.0%) | 0 (0.0%) |
| Professional & Scientific | 0 (0.0%) | 0 (0.0%) |
| Enterprise Management | 0 (0.0%) | 0 (0.0%) |
| Administrative & Support | 0 (0.0%) | 0 (0.0%) |
| Educational Services | 0 (0.0%) | 53 (100.0%) |
| Health Care & Social Assistance | 8 (100.0%) | 0 (0.0%) |
| Arts, Entertainment & Recreation | 0 (0.0%) | 0 (0.0%) |
| Accommodation & Food Services | 0 (0.0%) | 16 (100.0%) |
| Public Administration | 38 (100.0%) | 0 (0.0%) |
| Total | 85 (42.9%) | 113 (57.1%) |
Education in Standing Pine
School Enrollment in Standing Pine
The most common levels of schooling among the 182 students in Standing Pine are high school (61 | 33.5%), middle school (51 | 28.0%), and elementary school (37 | 20.3%).
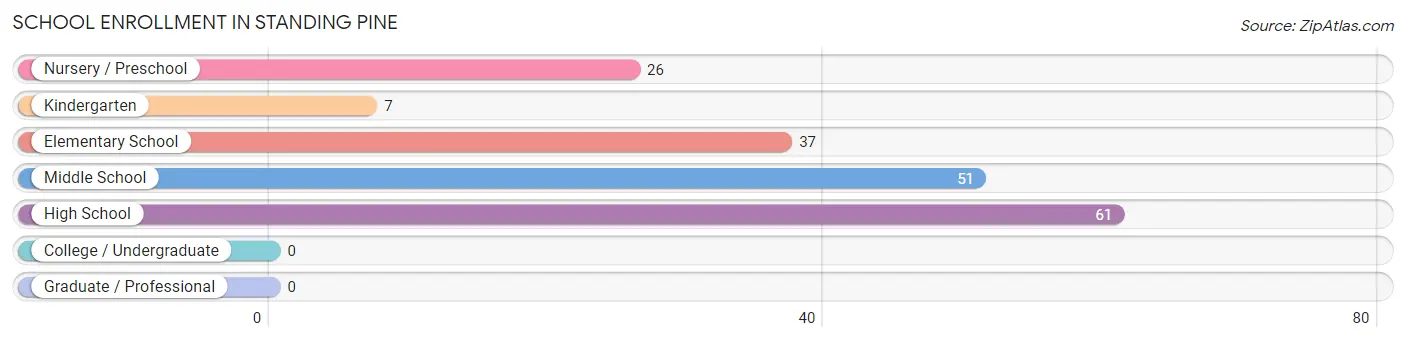
| School Level | # Students | % Students |
| Nursery / Preschool | 26 | 14.3% |
| Kindergarten | 7 | 3.8% |
| Elementary School | 37 | 20.3% |
| Middle School | 51 | 28.0% |
| High School | 61 | 33.5% |
| College / Undergraduate | 0 | 0.0% |
| Graduate / Professional | 0 | 0.0% |
| Total | 182 | 100.0% |
School Enrollment by Age by Funding Source in Standing Pine
Out of a total of 182 students who are enrolled in schools in Standing Pine, 88 (48.4%) attend a private institution, while the remaining 94 (51.6%) are enrolled in public schools. The age group of 18 to 19 year olds has the highest likelihood of being enrolled in private schools, with 16 (100.0% in the age bracket) enrolled. Conversely, the age group of 3 to 4 year olds has the lowest likelihood of being enrolled in a private school, with 12 (100.0% in the age bracket) attending a public institution.
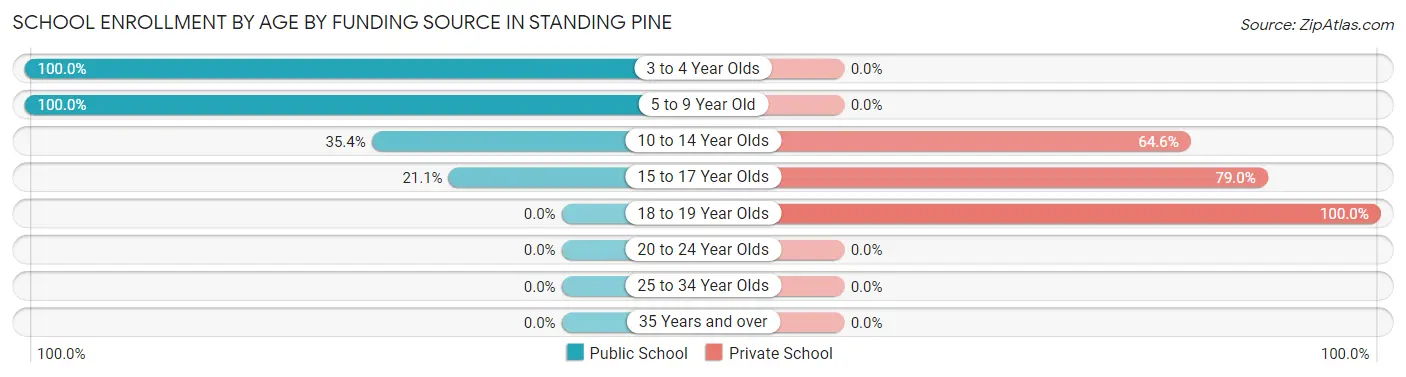
| Age Bracket | Public School | Private School |
| 3 to 4 Year Olds | 12 (100.0%) | 0 (0.0%) |
| 5 to 9 Year Old | 51 (100.0%) | 0 (0.0%) |
| 10 to 14 Year Olds | 23 (35.4%) | 42 (64.6%) |
| 15 to 17 Year Olds | 8 (21.0%) | 30 (78.9%) |
| 18 to 19 Year Olds | 0 (0.0%) | 16 (100.0%) |
| 20 to 24 Year Olds | 0 (0.0%) | 0 (0.0%) |
| 25 to 34 Year Olds | 0 (0.0%) | 0 (0.0%) |
| 35 Years and over | 0 (0.0%) | 0 (0.0%) |
| Total | 94 (51.6%) | 88 (48.4%) |
Educational Attainment by Field of Study in Standing Pine
| Field of Study | # Graduates | % Graduates |
| Computers & Mathematics | 0 | 0.0% |
| Bio, Nature & Agricultural | 0 | 0.0% |
| Physical & Health Sciences | 0 | 0.0% |
| Psychology | 0 | 0.0% |
| Social Sciences | 0 | 0.0% |
| Engineering | 0 | 0.0% |
| Multidisciplinary Studies | 0 | 0.0% |
| Science & Technology | 0 | 0.0% |
| Business | 0 | 0.0% |
| Education | 0 | 0.0% |
| Literature & Languages | 0 | 0.0% |
| Liberal Arts & History | 0 | 0.0% |
| Visual & Performing Arts | 0 | 0.0% |
| Communications | 0 | 0.0% |
| Arts & Humanities | 0 | 0.0% |
| Total | 0 | 0.0% |
Transportation & Commute in Standing Pine
Vehicle Availability by Sex in Standing Pine
The most prevalent vehicle ownership categories in Standing Pine are males with 1 vehicle (50, accounting for 58.8%) and females with 1 vehicle (39, making up 44.3%).
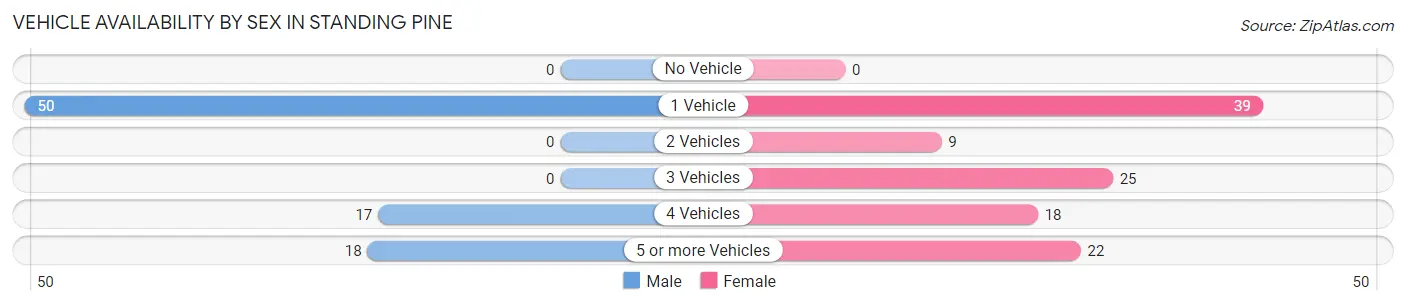
| Vehicles Available | Male | Female |
| No Vehicle | 0 (0.0%) | 0 (0.0%) |
| 1 Vehicle | 50 (58.8%) | 39 (34.5%) |
| 2 Vehicles | 0 (0.0%) | 9 (8.0%) |
| 3 Vehicles | 0 (0.0%) | 25 (22.1%) |
| 4 Vehicles | 17 (20.0%) | 18 (15.9%) |
| 5 or more Vehicles | 18 (21.2%) | 22 (19.5%) |
| Total | 85 (100.0%) | 113 (100.0%) |
Commute Time in Standing Pine
The most frequently occuring commute durations in Standing Pine are 30 to 34 minutes (75 commuters, 37.9%), 5 to 9 minutes (58 commuters, 29.3%), and 10 to 14 minutes (35 commuters, 17.7%).
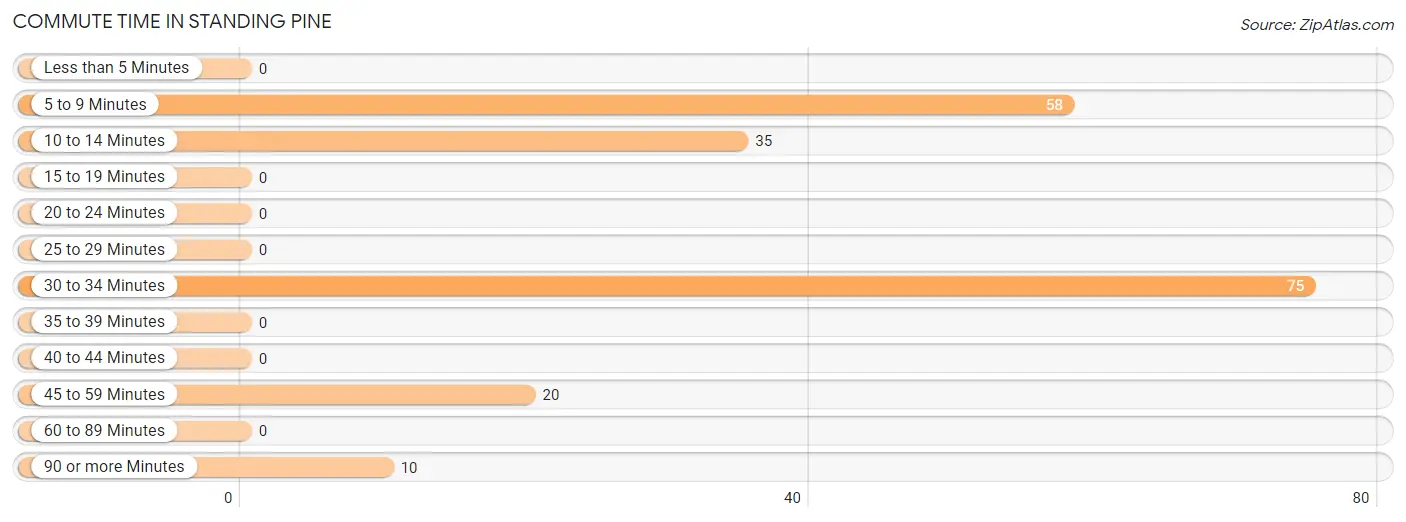
| Commute Time | # Commuters | % Commuters |
| Less than 5 Minutes | 0 | 0.0% |
| 5 to 9 Minutes | 58 | 29.3% |
| 10 to 14 Minutes | 35 | 17.7% |
| 15 to 19 Minutes | 0 | 0.0% |
| 20 to 24 Minutes | 0 | 0.0% |
| 25 to 29 Minutes | 0 | 0.0% |
| 30 to 34 Minutes | 75 | 37.9% |
| 35 to 39 Minutes | 0 | 0.0% |
| 40 to 44 Minutes | 0 | 0.0% |
| 45 to 59 Minutes | 20 | 10.1% |
| 60 to 89 Minutes | 0 | 0.0% |
| 90 or more Minutes | 10 | 5.1% |
Commute Time by Sex in Standing Pine
The most common commute times in Standing Pine are 30 to 34 minutes (50 commuters, 58.8%) for males and 5 to 9 minutes (50 commuters, 44.3%) for females.
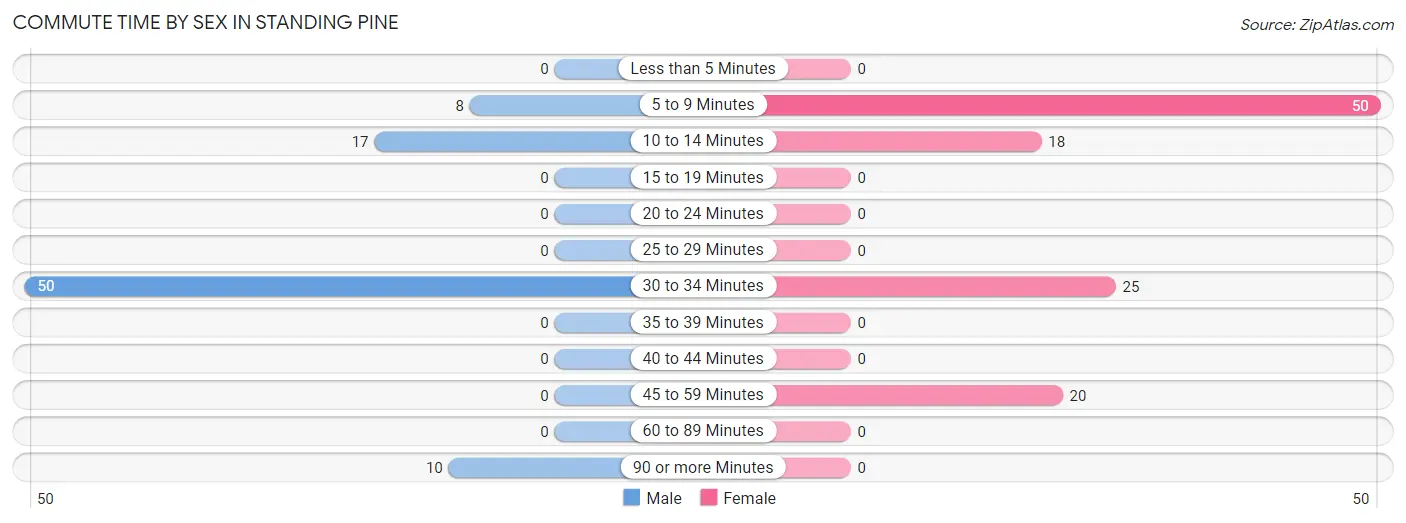
| Commute Time | Male | Female |
| Less than 5 Minutes | 0 (0.0%) | 0 (0.0%) |
| 5 to 9 Minutes | 8 (9.4%) | 50 (44.3%) |
| 10 to 14 Minutes | 17 (20.0%) | 18 (15.9%) |
| 15 to 19 Minutes | 0 (0.0%) | 0 (0.0%) |
| 20 to 24 Minutes | 0 (0.0%) | 0 (0.0%) |
| 25 to 29 Minutes | 0 (0.0%) | 0 (0.0%) |
| 30 to 34 Minutes | 50 (58.8%) | 25 (22.1%) |
| 35 to 39 Minutes | 0 (0.0%) | 0 (0.0%) |
| 40 to 44 Minutes | 0 (0.0%) | 0 (0.0%) |
| 45 to 59 Minutes | 0 (0.0%) | 20 (17.7%) |
| 60 to 89 Minutes | 0 (0.0%) | 0 (0.0%) |
| 90 or more Minutes | 10 (11.8%) | 0 (0.0%) |
Time of Departure to Work by Sex in Standing Pine
The most frequent times of departure to work in Standing Pine are 6:00 AM to 6:29 AM (38, 44.7%) for males and 7:00 AM to 7:29 AM (53, 46.9%) for females.
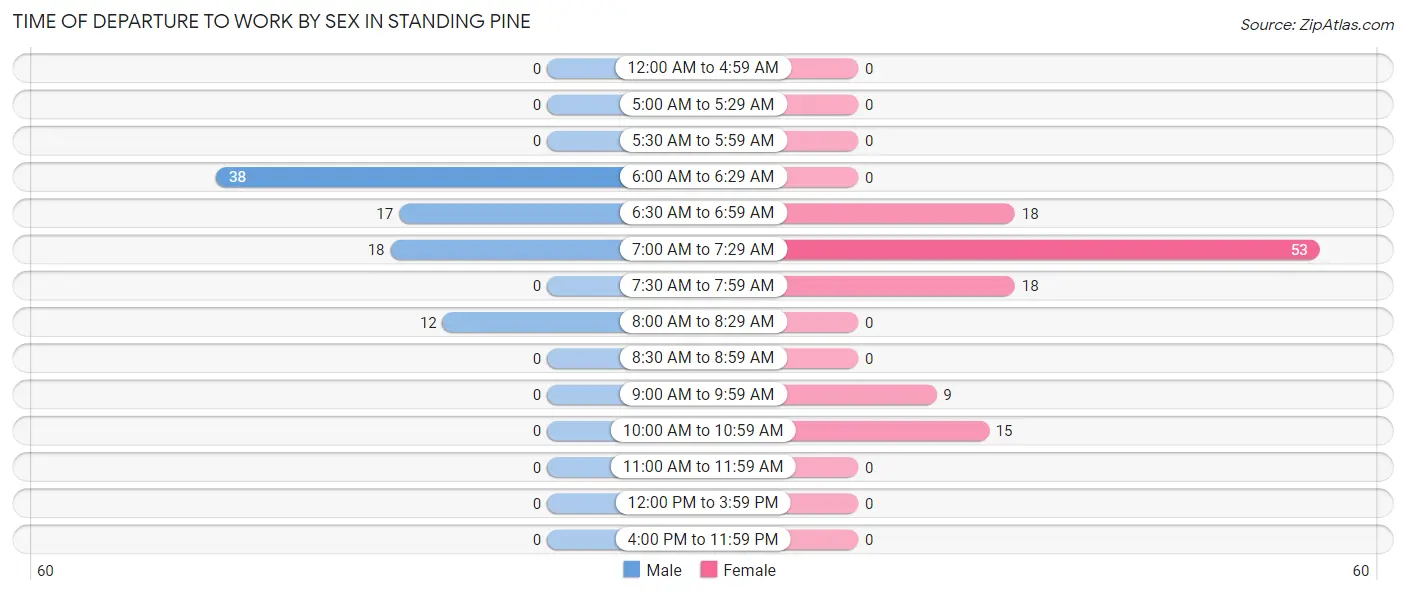
| Time of Departure | Male | Female |
| 12:00 AM to 4:59 AM | 0 (0.0%) | 0 (0.0%) |
| 5:00 AM to 5:29 AM | 0 (0.0%) | 0 (0.0%) |
| 5:30 AM to 5:59 AM | 0 (0.0%) | 0 (0.0%) |
| 6:00 AM to 6:29 AM | 38 (44.7%) | 0 (0.0%) |
| 6:30 AM to 6:59 AM | 17 (20.0%) | 18 (15.9%) |
| 7:00 AM to 7:29 AM | 18 (21.2%) | 53 (46.9%) |
| 7:30 AM to 7:59 AM | 0 (0.0%) | 18 (15.9%) |
| 8:00 AM to 8:29 AM | 12 (14.1%) | 0 (0.0%) |
| 8:30 AM to 8:59 AM | 0 (0.0%) | 0 (0.0%) |
| 9:00 AM to 9:59 AM | 0 (0.0%) | 9 (8.0%) |
| 10:00 AM to 10:59 AM | 0 (0.0%) | 15 (13.3%) |
| 11:00 AM to 11:59 AM | 0 (0.0%) | 0 (0.0%) |
| 12:00 PM to 3:59 PM | 0 (0.0%) | 0 (0.0%) |
| 4:00 PM to 11:59 PM | 0 (0.0%) | 0 (0.0%) |
| Total | 85 (100.0%) | 113 (100.0%) |
Housing Occupancy in Standing Pine
Occupancy by Ownership in Standing Pine
Of the total 134 dwellings in Standing Pine, owner-occupied units account for 104 (77.6%), while renter-occupied units make up 30 (22.4%).
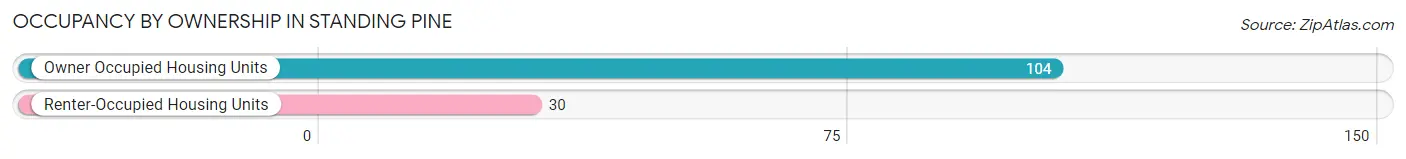
| Occupancy | # Housing Units | % Housing Units |
| Owner Occupied Housing Units | 104 | 77.6% |
| Renter-Occupied Housing Units | 30 | 22.4% |
| Total Occupied Housing Units | 134 | 100.0% |
Occupancy by Household Size in Standing Pine
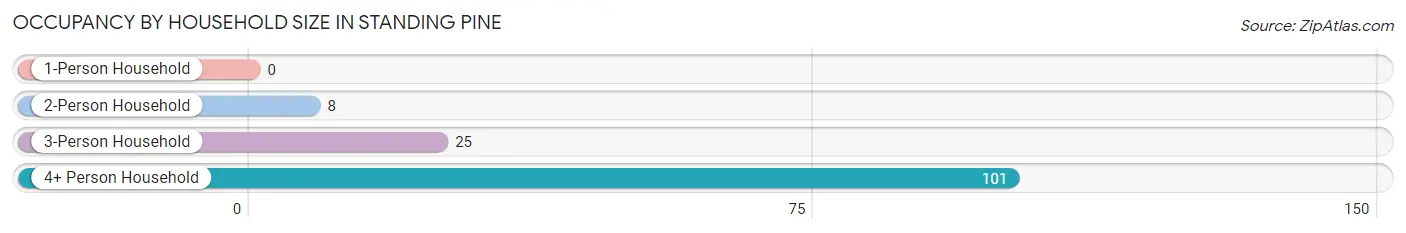
| Household Size | # Housing Units | % Housing Units |
| 1-Person Household | 0 | 0.0% |
| 2-Person Household | 8 | 6.0% |
| 3-Person Household | 25 | 18.7% |
| 4+ Person Household | 101 | 75.4% |
| Total Housing Units | 134 | 100.0% |
Occupancy by Ownership by Household Size in Standing Pine
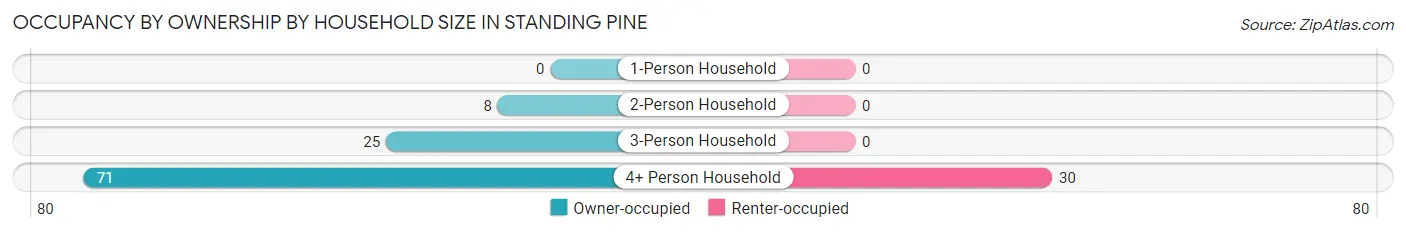
| Household Size | Owner-occupied | Renter-occupied |
| 1-Person Household | 0 (0.0%) | 0 (0.0%) |
| 2-Person Household | 8 (100.0%) | 0 (0.0%) |
| 3-Person Household | 25 (100.0%) | 0 (0.0%) |
| 4+ Person Household | 71 (70.3%) | 30 (29.7%) |
| Total Housing Units | 104 (77.6%) | 30 (22.4%) |
Occupancy by Educational Attainment in Standing Pine
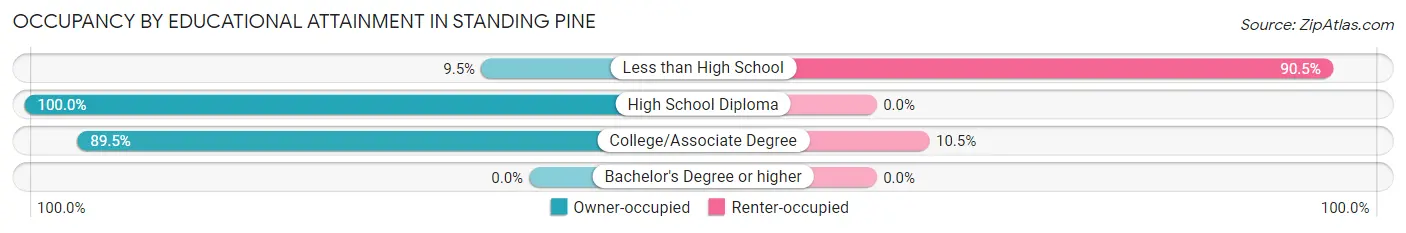
| Household Size | Owner-occupied | Renter-occupied |
| Less than High School | 2 (9.5%) | 19 (90.5%) |
| High School Diploma | 8 (100.0%) | 0 (0.0%) |
| College/Associate Degree | 94 (89.5%) | 11 (10.5%) |
| Bachelor's Degree or higher | 0 (0.0%) | 0 (0.0%) |
Occupancy by Age of Householder in Standing Pine
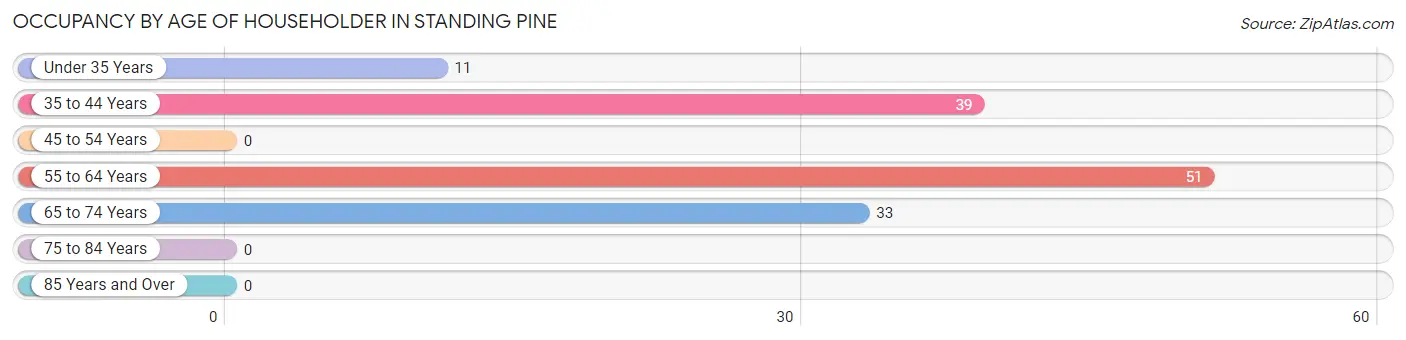
| Age Bracket | # Households | % Households |
| Under 35 Years | 11 | 8.2% |
| 35 to 44 Years | 39 | 29.1% |
| 45 to 54 Years | 0 | 0.0% |
| 55 to 64 Years | 51 | 38.1% |
| 65 to 74 Years | 33 | 24.6% |
| 75 to 84 Years | 0 | 0.0% |
| 85 Years and Over | 0 | 0.0% |
| Total | 134 | 100.0% |
Housing Finances in Standing Pine
Median Income by Occupancy in Standing Pine
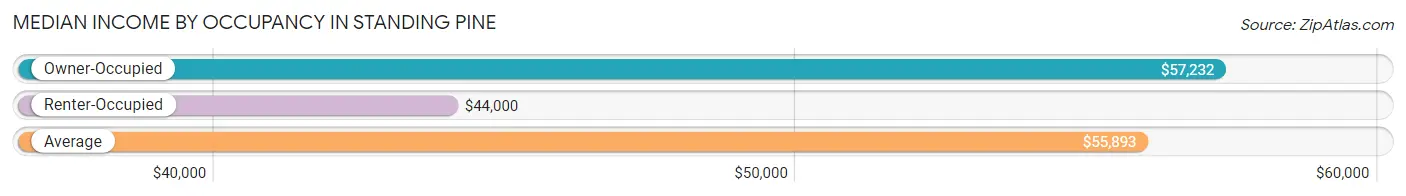
| Occupancy Type | # Households | Median Income |
| Owner-Occupied | 104 (77.6%) | $57,232 |
| Renter-Occupied | 30 (22.4%) | $44,000 |
| Average | 134 (100.0%) | $55,893 |
Occupancy by Householder Income Bracket in Standing Pine
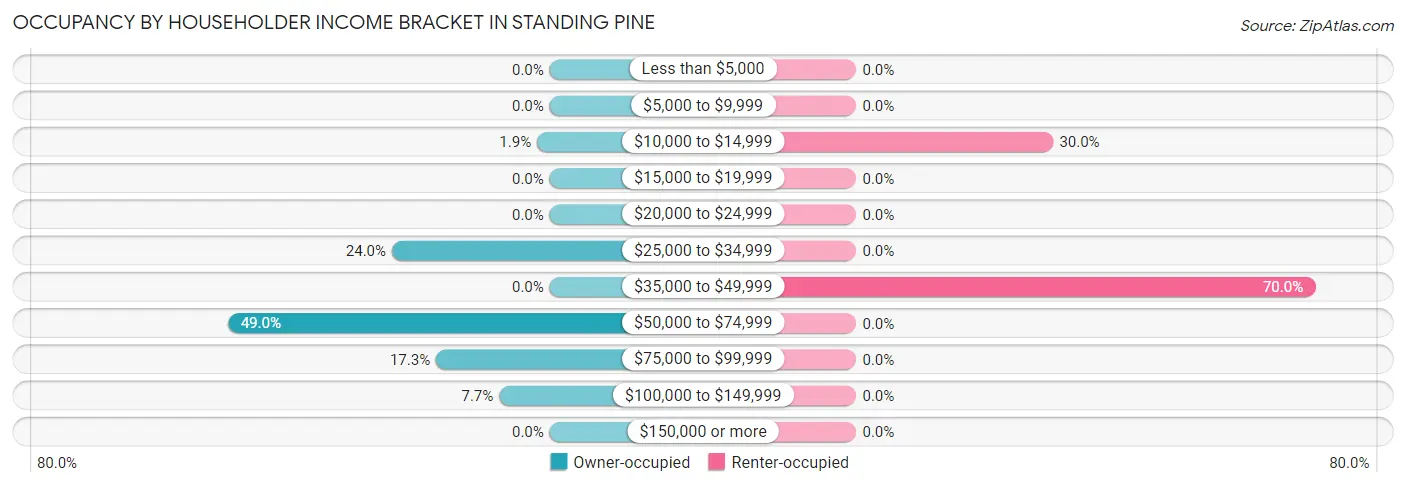
| Income Bracket | Owner-occupied | Renter-occupied |
| Less than $5,000 | 0 (0.0%) | 0 (0.0%) |
| $5,000 to $9,999 | 0 (0.0%) | 0 (0.0%) |
| $10,000 to $14,999 | 2 (1.9%) | 9 (30.0%) |
| $15,000 to $19,999 | 0 (0.0%) | 0 (0.0%) |
| $20,000 to $24,999 | 0 (0.0%) | 0 (0.0%) |
| $25,000 to $34,999 | 25 (24.0%) | 0 (0.0%) |
| $35,000 to $49,999 | 0 (0.0%) | 21 (70.0%) |
| $50,000 to $74,999 | 51 (49.0%) | 0 (0.0%) |
| $75,000 to $99,999 | 18 (17.3%) | 0 (0.0%) |
| $100,000 to $149,999 | 8 (7.7%) | 0 (0.0%) |
| $150,000 or more | 0 (0.0%) | 0 (0.0%) |
| Total | 104 (100.0%) | 30 (100.0%) |
Monthly Housing Cost Tiers in Standing Pine
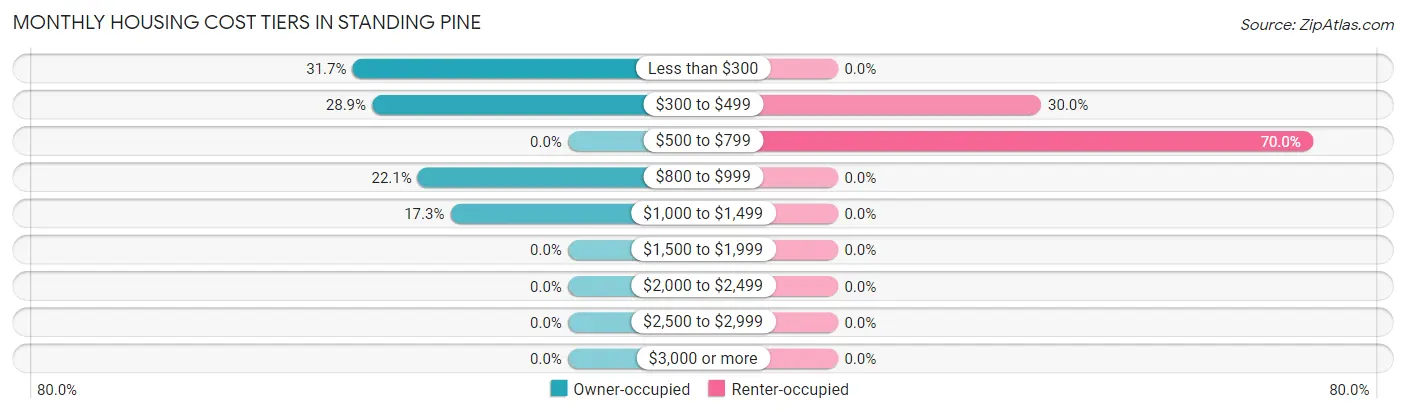
| Monthly Cost | Owner-occupied | Renter-occupied |
| Less than $300 | 33 (31.7%) | 0 (0.0%) |
| $300 to $499 | 30 (28.8%) | 9 (30.0%) |
| $500 to $799 | 0 (0.0%) | 21 (70.0%) |
| $800 to $999 | 23 (22.1%) | 0 (0.0%) |
| $1,000 to $1,499 | 18 (17.3%) | 0 (0.0%) |
| $1,500 to $1,999 | 0 (0.0%) | 0 (0.0%) |
| $2,000 to $2,499 | 0 (0.0%) | 0 (0.0%) |
| $2,500 to $2,999 | 0 (0.0%) | 0 (0.0%) |
| $3,000 or more | 0 (0.0%) | 0 (0.0%) |
| Total | 104 (100.0%) | 30 (100.0%) |
Physical Housing Characteristics in Standing Pine
Housing Structures in Standing Pine
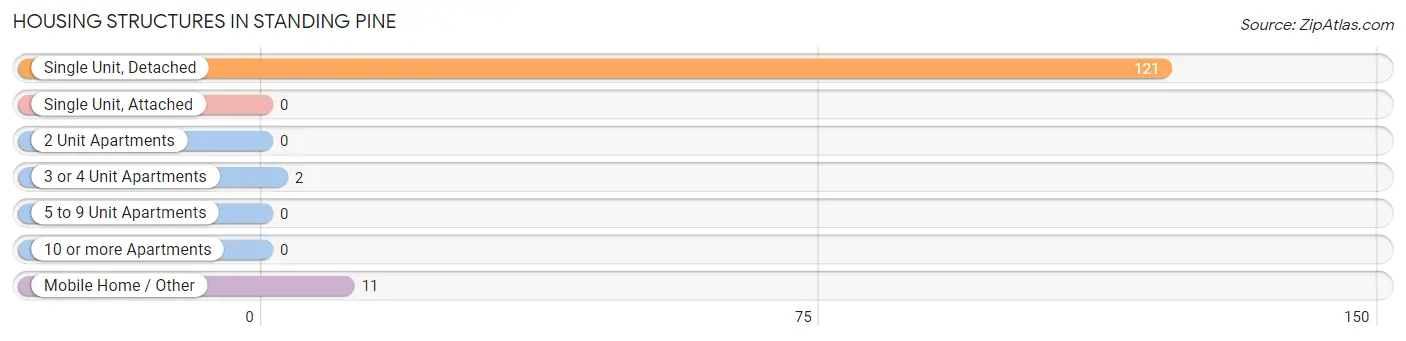
| Structure Type | # Housing Units | % Housing Units |
| Single Unit, Detached | 121 | 90.3% |
| Single Unit, Attached | 0 | 0.0% |
| 2 Unit Apartments | 0 | 0.0% |
| 3 or 4 Unit Apartments | 2 | 1.5% |
| 5 to 9 Unit Apartments | 0 | 0.0% |
| 10 or more Apartments | 0 | 0.0% |
| Mobile Home / Other | 11 | 8.2% |
| Total | 134 | 100.0% |
Housing Structures by Occupancy in Standing Pine
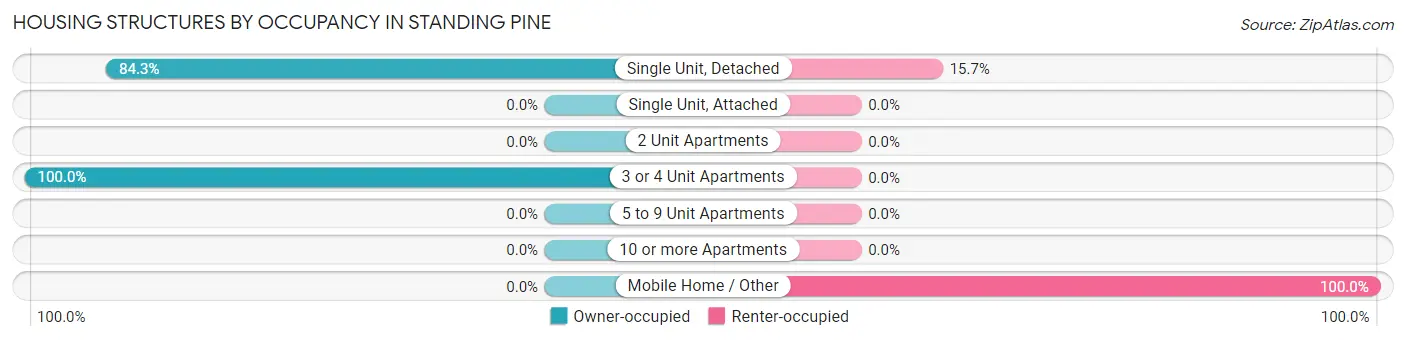
| Structure Type | Owner-occupied | Renter-occupied |
| Single Unit, Detached | 102 (84.3%) | 19 (15.7%) |
| Single Unit, Attached | 0 (0.0%) | 0 (0.0%) |
| 2 Unit Apartments | 0 (0.0%) | 0 (0.0%) |
| 3 or 4 Unit Apartments | 2 (100.0%) | 0 (0.0%) |
| 5 to 9 Unit Apartments | 0 (0.0%) | 0 (0.0%) |
| 10 or more Apartments | 0 (0.0%) | 0 (0.0%) |
| Mobile Home / Other | 0 (0.0%) | 11 (100.0%) |
| Total | 104 (77.6%) | 30 (22.4%) |
Housing Structures by Number of Rooms in Standing Pine
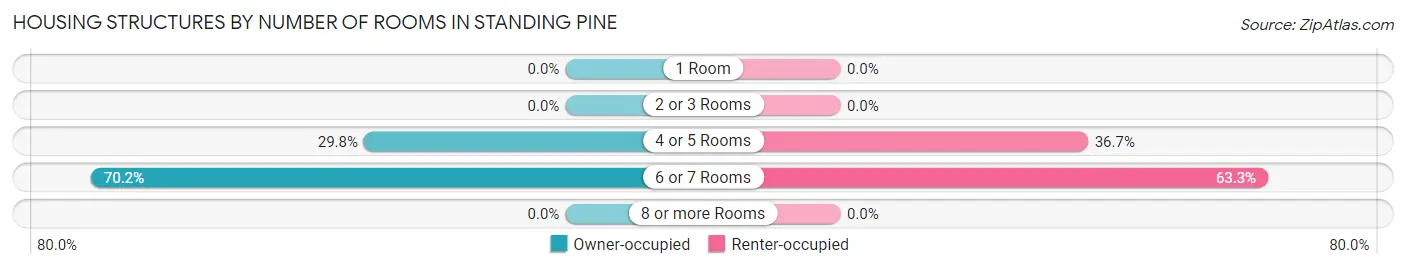
| Number of Rooms | Owner-occupied | Renter-occupied |
| 1 Room | 0 (0.0%) | 0 (0.0%) |
| 2 or 3 Rooms | 0 (0.0%) | 0 (0.0%) |
| 4 or 5 Rooms | 31 (29.8%) | 11 (36.7%) |
| 6 or 7 Rooms | 73 (70.2%) | 19 (63.3%) |
| 8 or more Rooms | 0 (0.0%) | 0 (0.0%) |
| Total | 104 (100.0%) | 30 (100.0%) |
Housing Structure by Heating Type in Standing Pine
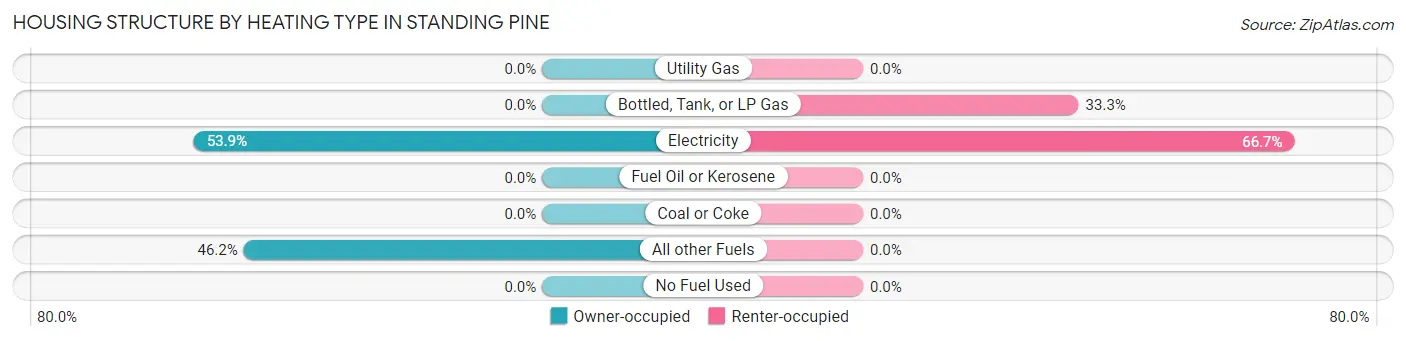
| Heating Type | Owner-occupied | Renter-occupied |
| Utility Gas | 0 (0.0%) | 0 (0.0%) |
| Bottled, Tank, or LP Gas | 0 (0.0%) | 10 (33.3%) |
| Electricity | 56 (53.8%) | 20 (66.7%) |
| Fuel Oil or Kerosene | 0 (0.0%) | 0 (0.0%) |
| Coal or Coke | 0 (0.0%) | 0 (0.0%) |
| All other Fuels | 48 (46.2%) | 0 (0.0%) |
| No Fuel Used | 0 (0.0%) | 0 (0.0%) |
| Total | 104 (100.0%) | 30 (100.0%) |
Household Vehicle Usage in Standing Pine
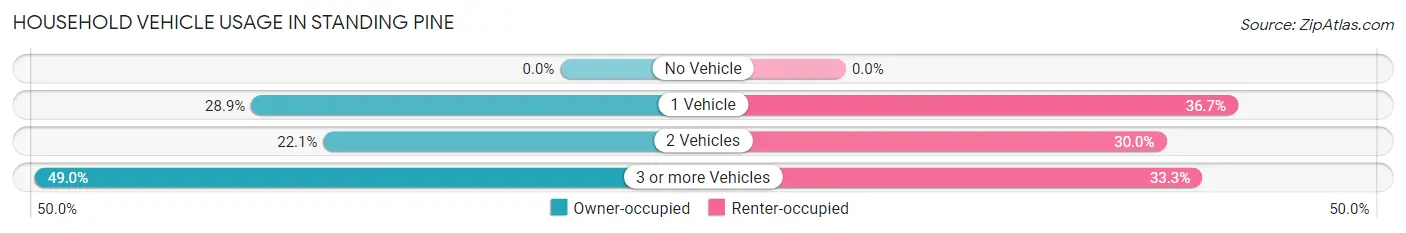
| Vehicles per Household | Owner-occupied | Renter-occupied |
| No Vehicle | 0 (0.0%) | 0 (0.0%) |
| 1 Vehicle | 30 (28.8%) | 11 (36.7%) |
| 2 Vehicles | 23 (22.1%) | 9 (30.0%) |
| 3 or more Vehicles | 51 (49.0%) | 10 (33.3%) |
| Total | 104 (100.0%) | 30 (100.0%) |
Real Estate & Mortgages in Standing Pine
Real Estate and Mortgage Overview in Standing Pine
| Characteristic | Without Mortgage | With Mortgage |
| Housing Units | 86 | 18 |
| Median Property Value | $56,400 | $0 |
| Median Household Income | $56,429 | $0 |
| Monthly Housing Costs | $368 | $0 |
| Real Estate Taxes | - | - |
Property Value by Mortgage Status in Standing Pine
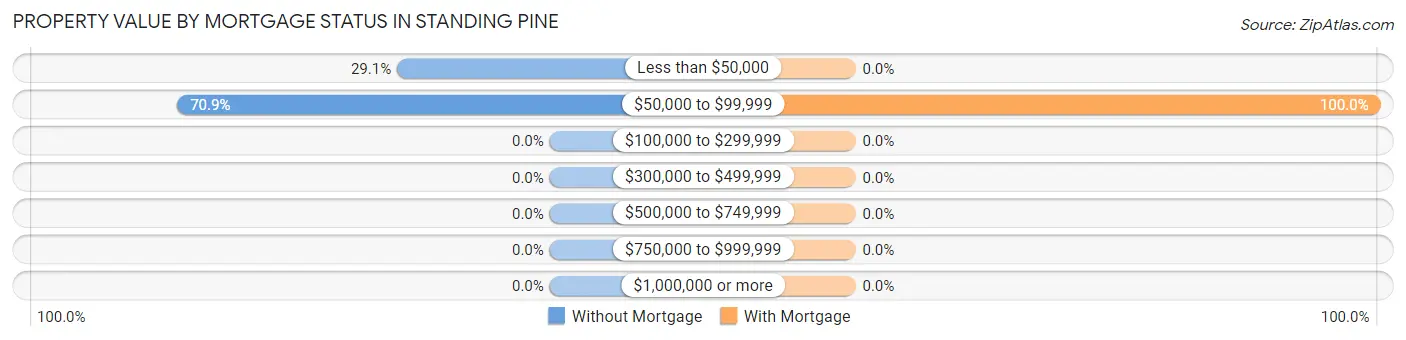
| Property Value | Without Mortgage | With Mortgage |
| Less than $50,000 | 25 (29.1%) | 0 (0.0%) |
| $50,000 to $99,999 | 61 (70.9%) | 18 (100.0%) |
| $100,000 to $299,999 | 0 (0.0%) | 0 (0.0%) |
| $300,000 to $499,999 | 0 (0.0%) | 0 (0.0%) |
| $500,000 to $749,999 | 0 (0.0%) | 0 (0.0%) |
| $750,000 to $999,999 | 0 (0.0%) | 0 (0.0%) |
| $1,000,000 or more | 0 (0.0%) | 0 (0.0%) |
| Total | 86 (100.0%) | 18 (100.0%) |
Household Income by Mortgage Status in Standing Pine
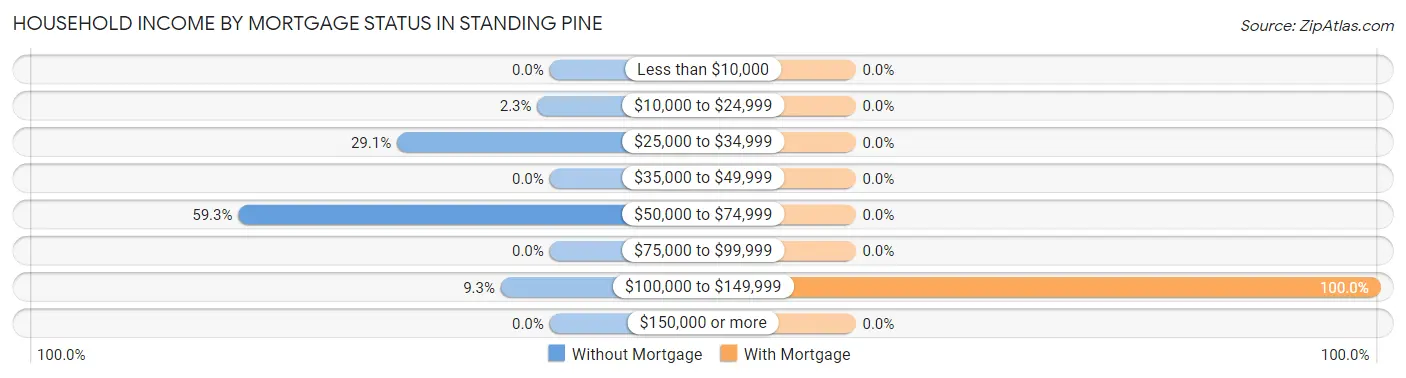
| Household Income | Without Mortgage | With Mortgage |
| Less than $10,000 | 0 (0.0%) | 0 (0.0%) |
| $10,000 to $24,999 | 2 (2.3%) | 0 (0.0%) |
| $25,000 to $34,999 | 25 (29.1%) | 0 (0.0%) |
| $35,000 to $49,999 | 0 (0.0%) | 0 (0.0%) |
| $50,000 to $74,999 | 51 (59.3%) | 0 (0.0%) |
| $75,000 to $99,999 | 0 (0.0%) | 0 (0.0%) |
| $100,000 to $149,999 | 8 (9.3%) | 18 (100.0%) |
| $150,000 or more | 0 (0.0%) | 0 (0.0%) |
| Total | 86 (100.0%) | 18 (100.0%) |
Property Value to Household Income Ratio in Standing Pine
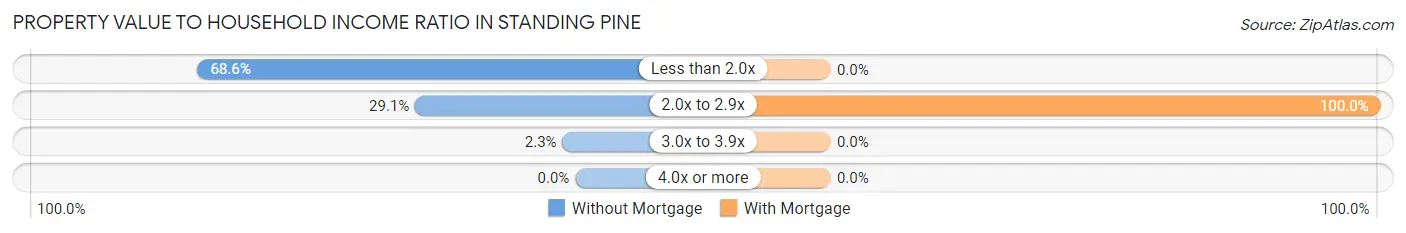
| Value-to-Income Ratio | Without Mortgage | With Mortgage |
| Less than 2.0x | 59 (68.6%) | 0 (0.0%) |
| 2.0x to 2.9x | 25 (29.1%) | 18 (100.0%) |
| 3.0x to 3.9x | 2 (2.3%) | 0 (0.0%) |
| 4.0x or more | 0 (0.0%) | 0 (0.0%) |
| Total | 86 (100.0%) | 18 (100.0%) |
Real Estate Taxes by Mortgage Status in Standing Pine
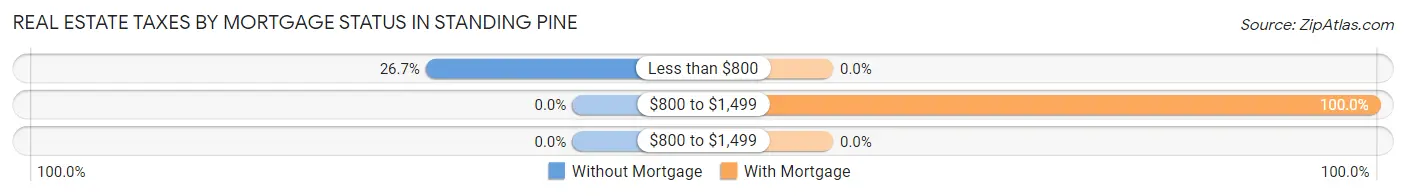
| Property Taxes | Without Mortgage | With Mortgage |
| Less than $800 | 23 (26.7%) | 0 (0.0%) |
| $800 to $1,499 | 0 (0.0%) | 18 (100.0%) |
| $800 to $1,499 | 0 (0.0%) | 0 (0.0%) |
| Total | 86 (100.0%) | 18 (100.0%) |
Health & Disability in Standing Pine
Health Insurance Coverage by Age in Standing Pine
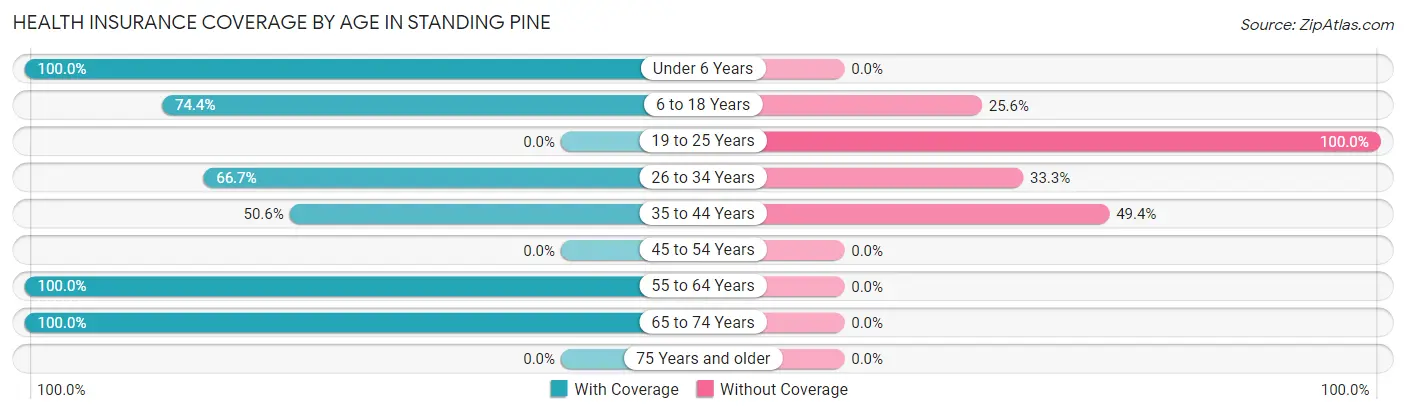
| Age Bracket | With Coverage | Without Coverage |
| Under 6 Years | 66 (100.0%) | 0 (0.0%) |
| 6 to 18 Years | 116 (74.4%) | 40 (25.6%) |
| 19 to 25 Years | 0 (0.0%) | 29 (100.0%) |
| 26 to 34 Years | 42 (66.7%) | 21 (33.3%) |
| 35 to 44 Years | 85 (50.6%) | 83 (49.4%) |
| 45 to 54 Years | 0 (0.0%) | 0 (0.0%) |
| 55 to 64 Years | 51 (100.0%) | 0 (0.0%) |
| 65 to 74 Years | 40 (100.0%) | 0 (0.0%) |
| 75 Years and older | 0 (0.0%) | 0 (0.0%) |
| Total | 400 (69.8%) | 173 (30.2%) |
Health Insurance Coverage by Citizenship Status in Standing Pine
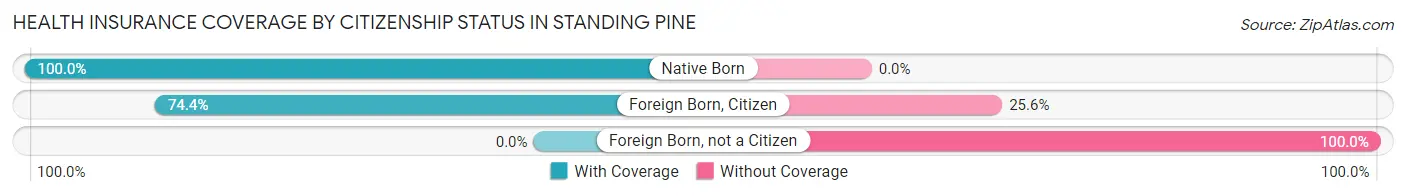
| Citizenship Status | With Coverage | Without Coverage |
| Native Born | 66 (100.0%) | 0 (0.0%) |
| Foreign Born, Citizen | 116 (74.4%) | 40 (25.6%) |
| Foreign Born, not a Citizen | 0 (0.0%) | 29 (100.0%) |
Health Insurance Coverage by Household Income in Standing Pine
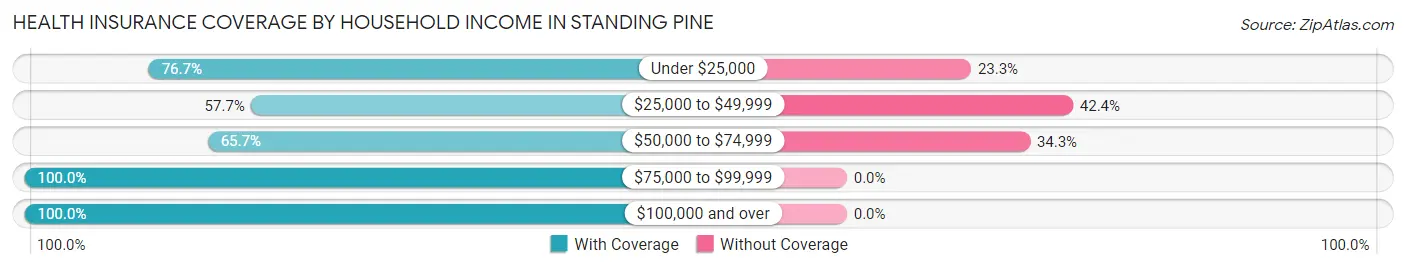
| Household Income | With Coverage | Without Coverage |
| Under $25,000 | 66 (76.7%) | 20 (23.3%) |
| $25,000 to $49,999 | 113 (57.7%) | 83 (42.3%) |
| $50,000 to $74,999 | 134 (65.7%) | 70 (34.3%) |
| $75,000 to $99,999 | 72 (100.0%) | 0 (0.0%) |
| $100,000 and over | 15 (100.0%) | 0 (0.0%) |
Public vs Private Health Insurance Coverage by Age in Standing Pine
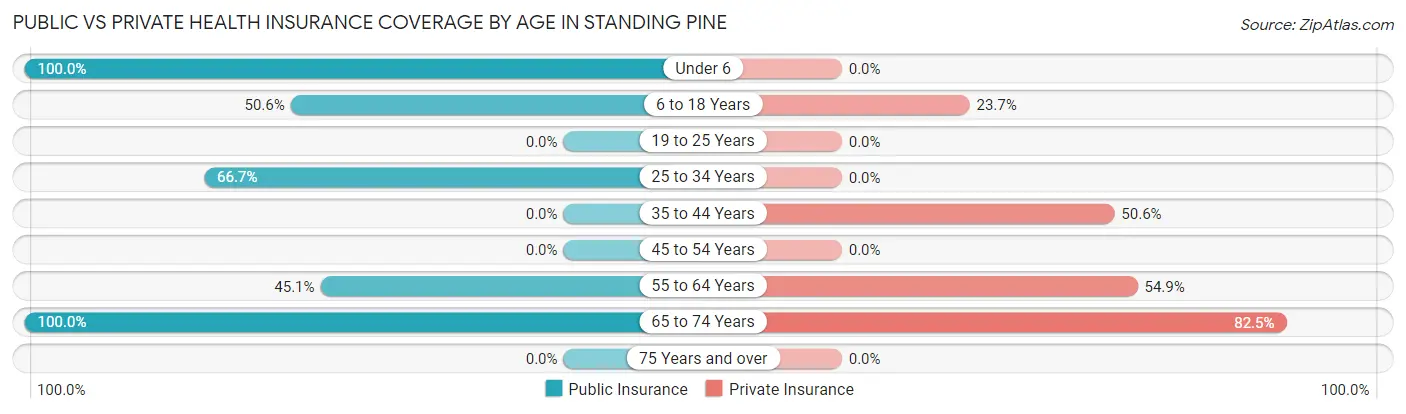
| Age Bracket | Public Insurance | Private Insurance |
| Under 6 | 66 (100.0%) | 0 (0.0%) |
| 6 to 18 Years | 79 (50.6%) | 37 (23.7%) |
| 19 to 25 Years | 0 (0.0%) | 0 (0.0%) |
| 25 to 34 Years | 42 (66.7%) | 0 (0.0%) |
| 35 to 44 Years | 0 (0.0%) | 85 (50.6%) |
| 45 to 54 Years | 0 (0.0%) | 0 (0.0%) |
| 55 to 64 Years | 23 (45.1%) | 28 (54.9%) |
| 65 to 74 Years | 40 (100.0%) | 33 (82.5%) |
| 75 Years and over | 0 (0.0%) | 0 (0.0%) |
| Total | 250 (43.6%) | 183 (31.9%) |
Disability Status by Sex by Age in Standing Pine
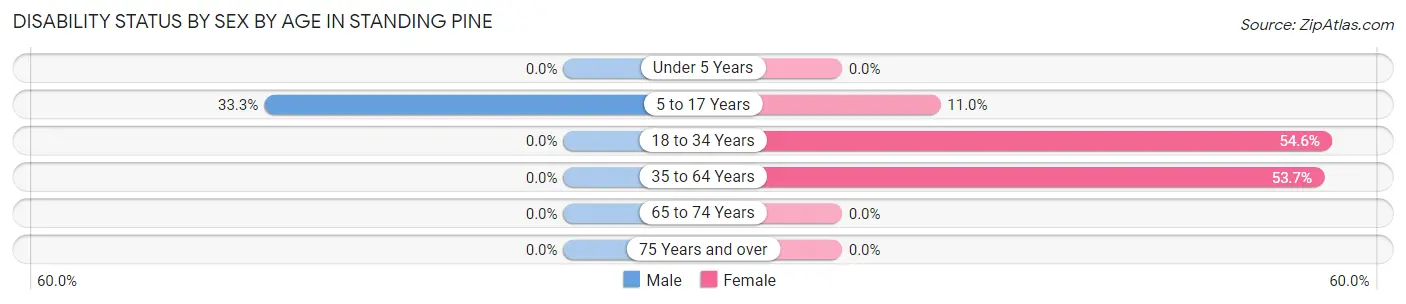
| Age Bracket | Male | Female |
| Under 5 Years | 0 (0.0%) | 0 (0.0%) |
| 5 to 17 Years | 24 (33.3%) | 9 (11.0%) |
| 18 to 34 Years | 0 (0.0%) | 42 (54.5%) |
| 35 to 64 Years | 0 (0.0%) | 51 (53.7%) |
| 65 to 74 Years | 0 (0.0%) | 0 (0.0%) |
| 75 Years and over | 0 (0.0%) | 0 (0.0%) |
Disability Class by Sex by Age in Standing Pine
Disability Class: Hearing Difficulty
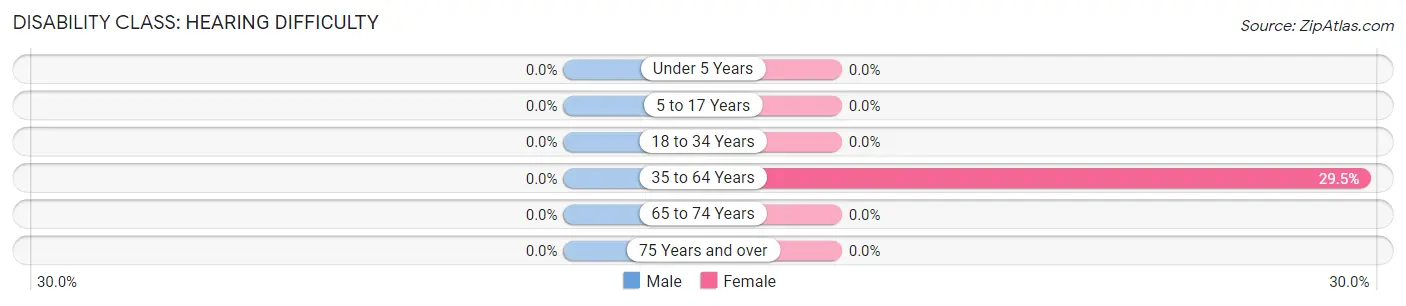
| Age Bracket | Male | Female |
| Under 5 Years | 0 (0.0%) | 0 (0.0%) |
| 5 to 17 Years | 0 (0.0%) | 0 (0.0%) |
| 18 to 34 Years | 0 (0.0%) | 0 (0.0%) |
| 35 to 64 Years | 0 (0.0%) | 28 (29.5%) |
| 65 to 74 Years | 0 (0.0%) | 0 (0.0%) |
| 75 Years and over | 0 (0.0%) | 0 (0.0%) |
Disability Class: Vision Difficulty
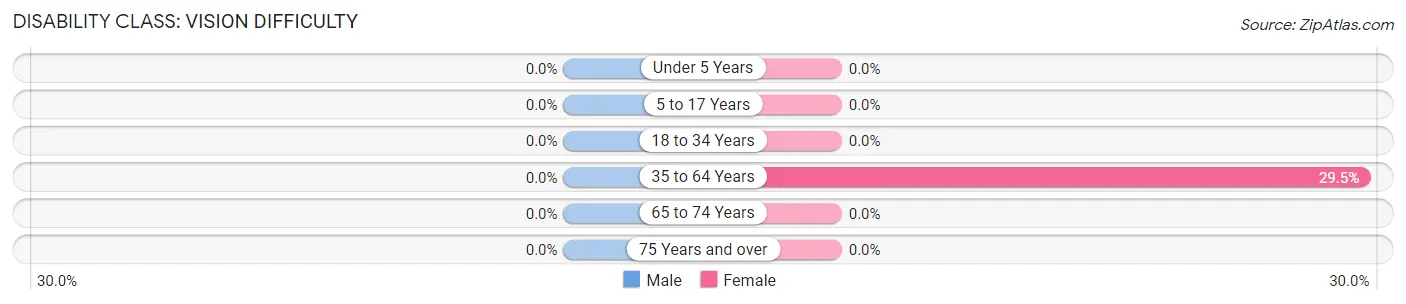
| Age Bracket | Male | Female |
| Under 5 Years | 0 (0.0%) | 0 (0.0%) |
| 5 to 17 Years | 0 (0.0%) | 0 (0.0%) |
| 18 to 34 Years | 0 (0.0%) | 0 (0.0%) |
| 35 to 64 Years | 0 (0.0%) | 28 (29.5%) |
| 65 to 74 Years | 0 (0.0%) | 0 (0.0%) |
| 75 Years and over | 0 (0.0%) | 0 (0.0%) |
Disability Class: Cognitive Difficulty
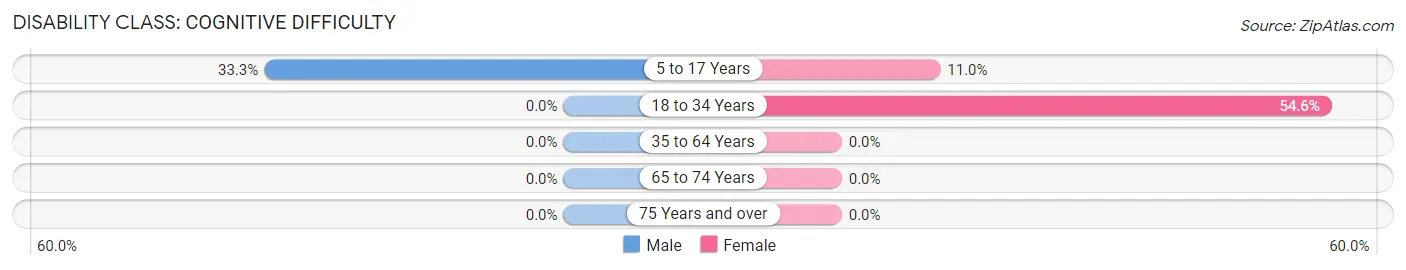
| Age Bracket | Male | Female |
| 5 to 17 Years | 24 (33.3%) | 9 (11.0%) |
| 18 to 34 Years | 0 (0.0%) | 42 (54.5%) |
| 35 to 64 Years | 0 (0.0%) | 0 (0.0%) |
| 65 to 74 Years | 0 (0.0%) | 0 (0.0%) |
| 75 Years and over | 0 (0.0%) | 0 (0.0%) |
Disability Class: Ambulatory Difficulty
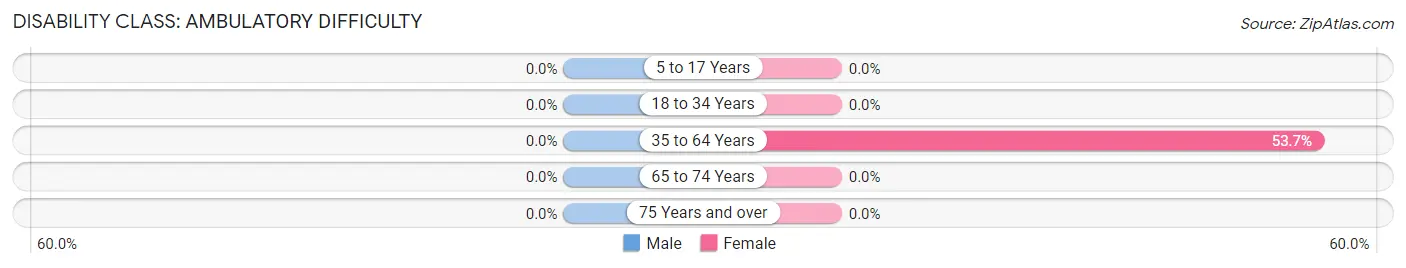
| Age Bracket | Male | Female |
| 5 to 17 Years | 0 (0.0%) | 0 (0.0%) |
| 18 to 34 Years | 0 (0.0%) | 0 (0.0%) |
| 35 to 64 Years | 0 (0.0%) | 51 (53.7%) |
| 65 to 74 Years | 0 (0.0%) | 0 (0.0%) |
| 75 Years and over | 0 (0.0%) | 0 (0.0%) |
Disability Class: Self-Care Difficulty
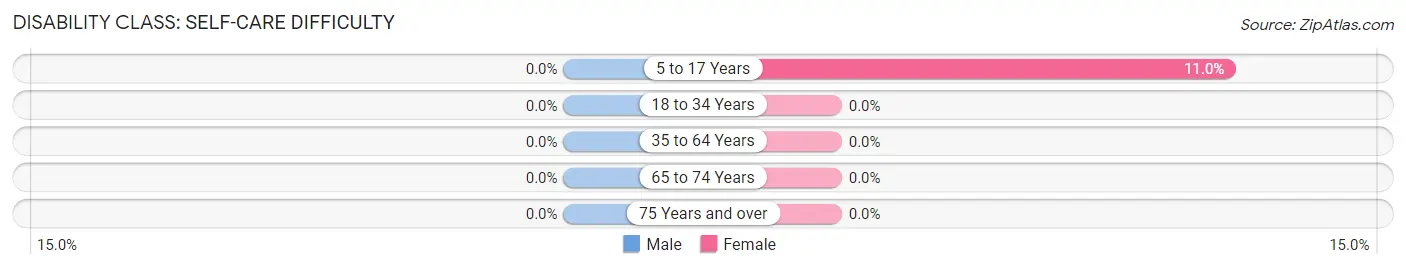
| Age Bracket | Male | Female |
| 5 to 17 Years | 0 (0.0%) | 9 (11.0%) |
| 18 to 34 Years | 0 (0.0%) | 0 (0.0%) |
| 35 to 64 Years | 0 (0.0%) | 0 (0.0%) |
| 65 to 74 Years | 0 (0.0%) | 0 (0.0%) |
| 75 Years and over | 0 (0.0%) | 0 (0.0%) |
Technology Access in Standing Pine
Computing Device Access in Standing Pine
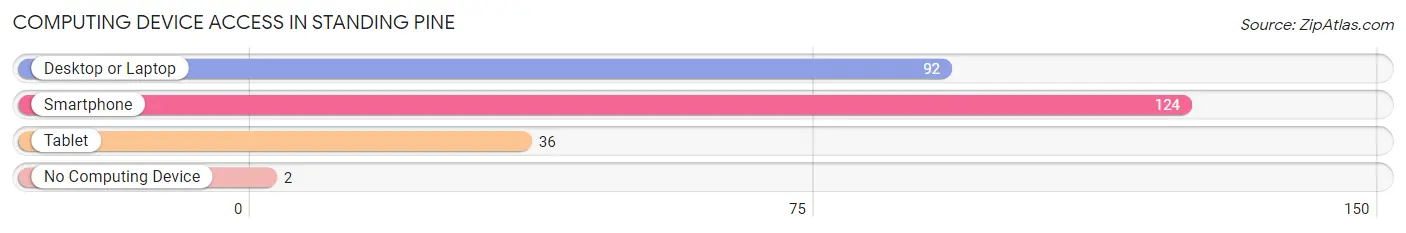
| Device Type | # Households | % Households |
| Desktop or Laptop | 92 | 68.7% |
| Smartphone | 124 | 92.5% |
| Tablet | 36 | 26.9% |
| No Computing Device | 2 | 1.5% |
| Total | 134 | 100.0% |
Internet Access in Standing Pine
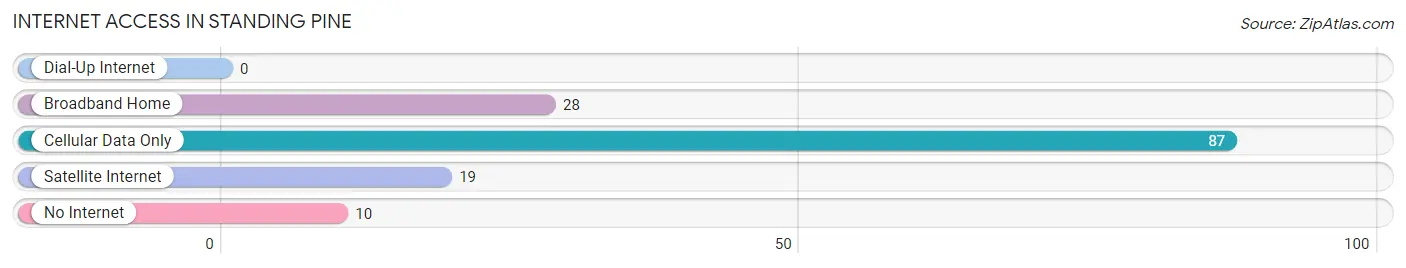
| Internet Type | # Households | % Households |
| Dial-Up Internet | 0 | 0.0% |
| Broadband Home | 28 | 20.9% |
| Cellular Data Only | 87 | 64.9% |
| Satellite Internet | 19 | 14.2% |
| No Internet | 10 | 7.5% |
| Total | 134 | 100.0% |
Standing Pine Summary
Pine, Mississippi is a small town located in the southeastern corner of the state, in Perry County. It is situated on the banks of the Leaf River, and is surrounded by rolling hills and lush forests. The town has a population of just over 1,000 people, and is known for its rural charm and friendly atmosphere.
History
Pine was first settled in the early 1800s by a group of settlers from North Carolina. The town was originally known as “Piney Woods”, and was named after the abundance of pine trees in the area. The town was officially incorporated in 1837, and was named after the nearby Piney Creek.
In the late 1800s, Pine became a popular destination for hunters and fishermen, as the area was abundant with wildlife. The town also became a hub for the timber industry, as the surrounding forests were filled with valuable timber.
In the early 1900s, Pine began to experience a period of growth and prosperity. The town was home to several businesses, including a sawmill, a gristmill, and a cotton gin. The town also had a thriving agricultural industry, with many farmers growing cotton, corn, and other crops.
Geography
Pine is located in the southeastern corner of Perry County, in the Piney Woods region of Mississippi. The town is situated on the banks of the Leaf River, and is surrounded by rolling hills and lush forests. The town is located approximately 30 miles south of Hattiesburg, and is about an hour’s drive from the Gulf Coast.
The climate in Pine is humid subtropical, with hot, humid summers and mild winters. The average annual temperature is around 70 degrees Fahrenheit, and the average annual precipitation is around 50 inches.
Economy
The economy of Pine is largely based on agriculture and timber. The town is home to several farms, which grow cotton, corn, soybeans, and other crops. The timber industry is also an important part of the local economy, as the surrounding forests are filled with valuable timber.
In addition to agriculture and timber, Pine is also home to several small businesses, including restaurants, shops, and other services. The town is also home to a few manufacturing companies, which produce furniture, clothing, and other goods.
Demographics
As of the 2010 census, the population of Pine was 1,072. The racial makeup of the town was 95.3% White, 2.7% African American, 0.3% Native American, 0.2% Asian, and 1.5% from other races. The median household income was $30,938, and the median family income was $37,813.
Pine is a small, rural town with a friendly atmosphere and a strong sense of community. The town is home to several churches, and is known for its strong religious values. The town is also home to several schools, including Pine Elementary School and Pine High School.
Common Questions
What is Per Capita Income in Standing Pine?
Per Capita income in Standing Pine is $12,929.
What is the Median Family Income in Standing Pine?
Median Family Income in Standing Pine is $44,500.
What is the Median Household income in Standing Pine?
Median Household Income in Standing Pine is $55,893.
What is Inequality or Gini Index in Standing Pine?
Inequality or Gini Index in Standing Pine is 0.25.
What is the Total Population of Standing Pine?
Total Population of Standing Pine is 573.
What is the Total Male Population of Standing Pine?
Total Male Population of Standing Pine is 253.
What is the Total Female Population of Standing Pine?
Total Female Population of Standing Pine is 320.
What is the Ratio of Males per 100 Females in Standing Pine?
There are 79.06 Males per 100 Females in Standing Pine.
What is the Ratio of Females per 100 Males in Standing Pine?
There are 126.48 Females per 100 Males in Standing Pine.
What is the Median Population Age in Standing Pine?
Median Population Age in Standing Pine is 28.6 Years.
What is the Average Family Size in Standing Pine
Average Family Size in Standing Pine is 4.2 People.
What is the Average Household Size in Standing Pine
Average Household Size in Standing Pine is 4.3 People.
How Large is the Labor Force in Standing Pine?
There are 210 People in the Labor Forcein in Standing Pine.
What is the Percentage of People in the Labor Force in Standing Pine?
52.2% of People are in the Labor Force in Standing Pine.
What is the Unemployment Rate in Standing Pine?
Unemployment Rate in Standing Pine is 5.7%.