Tunica Resorts, MS Map & Demographics
Tunica Resorts Map
Tunica Resorts Overview
$22,107
PER CAPITA INCOME
$31,853
AVG FAMILY INCOME
$46,454
AVG HOUSEHOLD INCOME
26.8%
WAGE / INCOME GAP [ % ]
73.2¢/ $1
WAGE / INCOME GAP [ $ ]
0.30
INEQUALITY / GINI INDEX
2,096
TOTAL POPULATION
1,176
MALE POPULATION
920
FEMALE POPULATION
127.83
MALES / 100 FEMALES
78.23
FEMALES / 100 MALES
30.4
MEDIAN AGE
2.9
AVG FAMILY SIZE
2.3
AVG HOUSEHOLD SIZE
1,273
LABOR FORCE [ PEOPLE ]
76.2%
PERCENT IN LABOR FORCE
4.1%
UNEMPLOYMENT RATE
Income in Tunica Resorts
Income Overview in Tunica Resorts
Per Capita Income in Tunica Resorts is $22,107, while median incomes of families and households are $31,853 and $46,454 respectively.
| Characteristic | Number | Measure |
| Per Capita Income | 2,096 | $22,107 |
| Median Family Income | 442 | $31,853 |
| Mean Family Income | 442 | $44,677 |
| Median Household Income | 915 | $46,454 |
| Mean Household Income | 915 | $46,721 |
| Income Deficit | 442 | $0 |
| Wage / Income Gap (%) | 2,096 | 26.76% |
| Wage / Income Gap ($) | 2,096 | 73.24¢ per $1 |
| Gini / Inequality Index | 2,096 | 0.30 |
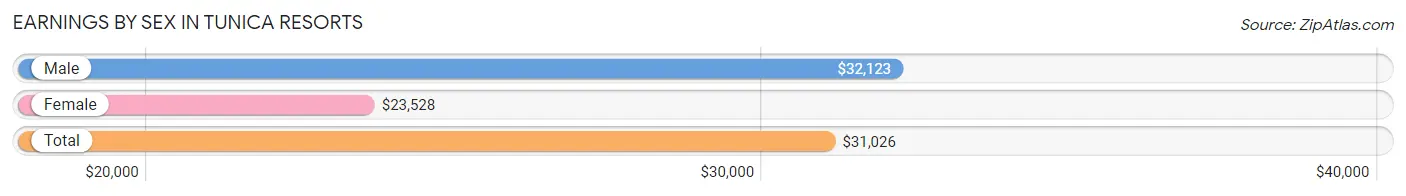
Earnings by Sex in Tunica Resorts
Average Earnings in Tunica Resorts are $31,026, $32,123 for men and $23,528 for women, a difference of 26.8%.
| Sex | Number | Average Earnings |
| Male | 689 (51.6%) | $32,123 |
| Female | 645 (48.3%) | $23,528 |
| Total | 1,334 (100.0%) | $31,026 |
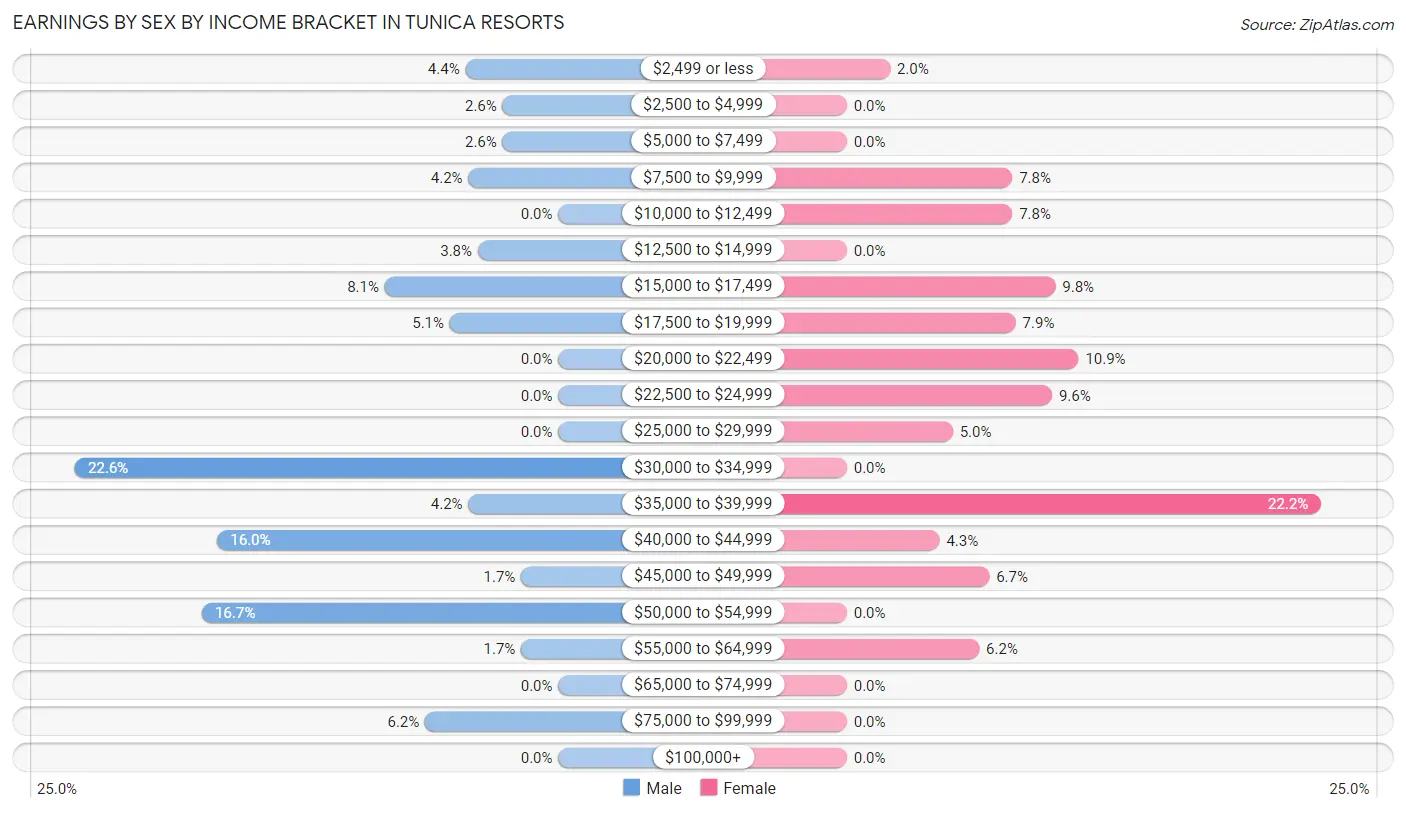
Earnings by Sex by Income Bracket in Tunica Resorts
The most common earnings brackets in Tunica Resorts are $30,000 to $34,999 for men (156 | 22.6%) and $35,000 to $39,999 for women (143 | 22.2%).
| Income | Male | Female |
| $2,499 or less | 30 (4.3%) | 13 (2.0%) |
| $2,500 to $4,999 | 18 (2.6%) | 0 (0.0%) |
| $5,000 to $7,499 | 18 (2.6%) | 0 (0.0%) |
| $7,500 to $9,999 | 29 (4.2%) | 50 (7.7%) |
| $10,000 to $12,499 | 0 (0.0%) | 50 (7.7%) |
| $12,500 to $14,999 | 26 (3.8%) | 0 (0.0%) |
| $15,000 to $17,499 | 56 (8.1%) | 63 (9.8%) |
| $17,500 to $19,999 | 35 (5.1%) | 51 (7.9%) |
| $20,000 to $22,499 | 0 (0.0%) | 70 (10.8%) |
| $22,500 to $24,999 | 0 (0.0%) | 62 (9.6%) |
| $25,000 to $29,999 | 0 (0.0%) | 32 (5.0%) |
| $30,000 to $34,999 | 156 (22.6%) | 0 (0.0%) |
| $35,000 to $39,999 | 29 (4.2%) | 143 (22.2%) |
| $40,000 to $44,999 | 110 (16.0%) | 28 (4.3%) |
| $45,000 to $49,999 | 12 (1.7%) | 43 (6.7%) |
| $50,000 to $54,999 | 115 (16.7%) | 0 (0.0%) |
| $55,000 to $64,999 | 12 (1.7%) | 40 (6.2%) |
| $65,000 to $74,999 | 0 (0.0%) | 0 (0.0%) |
| $75,000 to $99,999 | 43 (6.2%) | 0 (0.0%) |
| $100,000+ | 0 (0.0%) | 0 (0.0%) |
| Total | 689 (100.0%) | 645 (100.0%) |
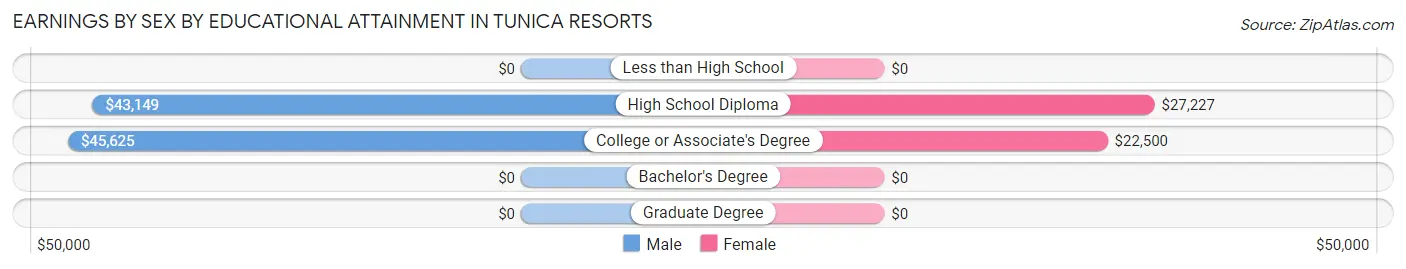
Earnings by Sex by Educational Attainment in Tunica Resorts
Average earnings in Tunica Resorts are $32,404 for men and $25,195 for women, a difference of 22.3%. Men with an educational attainment of college or associate's degree enjoy the highest average annual earnings of $45,625, while those with high school diploma education earn the least with $43,149. Women with an educational attainment of high school diploma earn the most with the average annual earnings of $27,227, while those with college or associate's degree education have the smallest earnings of $22,500.
| Educational Attainment | Male Income | Female Income |
| Less than High School | - | - |
| High School Diploma | $43,149 | $27,227 |
| College or Associate's Degree | $45,625 | $22,500 |
| Bachelor's Degree | - | - |
| Graduate Degree | - | - |
| Total | $32,404 | $25,195 |
Family Income in Tunica Resorts
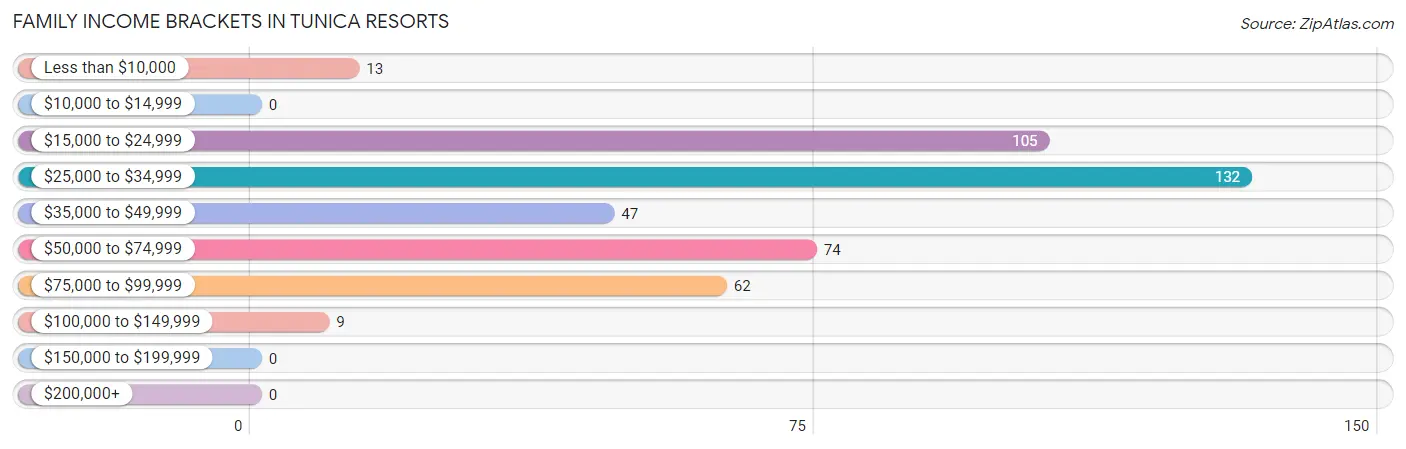
Family Income Brackets in Tunica Resorts
According to the Tunica Resorts family income data, there are 132 families falling into the $25,000 to $34,999 income range, which is the most common income bracket and makes up 29.9% of all families.
| Income Bracket | # Families | % Families |
| Less than $10,000 | 13 | 2.9% |
| $10,000 to $14,999 | 0 | 0.0% |
| $15,000 to $24,999 | 105 | 23.8% |
| $25,000 to $34,999 | 132 | 29.9% |
| $35,000 to $49,999 | 47 | 10.6% |
| $50,000 to $74,999 | 74 | 16.7% |
| $75,000 to $99,999 | 62 | 14.0% |
| $100,000 to $149,999 | 9 | 2.0% |
| $150,000 to $199,999 | 0 | 0.0% |
| $200,000+ | 0 | 0.0% |
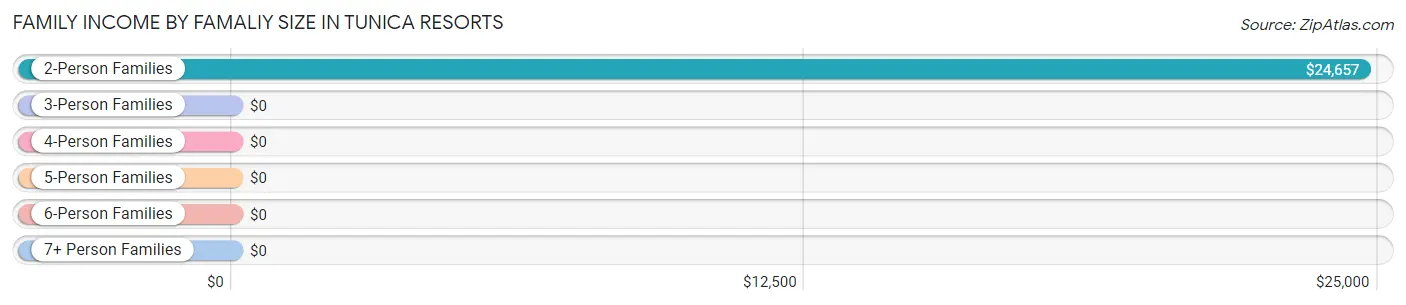
Family Income by Famaliy Size in Tunica Resorts
2-person families (219 | 49.5%) account for the highest median family income in Tunica Resorts with $24,657 per family, while 2-person families (219 | 49.5%) have the highest median income of $12,328 per family member.
| Income Bracket | # Families | Median Income |
| 2-Person Families | 219 (49.5%) | $24,657 |
| 3-Person Families | 211 (47.7%) | $0 |
| 4-Person Families | 0 (0.0%) | $0 |
| 5-Person Families | 0 (0.0%) | $0 |
| 6-Person Families | 12 (2.7%) | $0 |
| 7+ Person Families | 0 (0.0%) | $0 |
| Total | 442 (100.0%) | $31,853 |
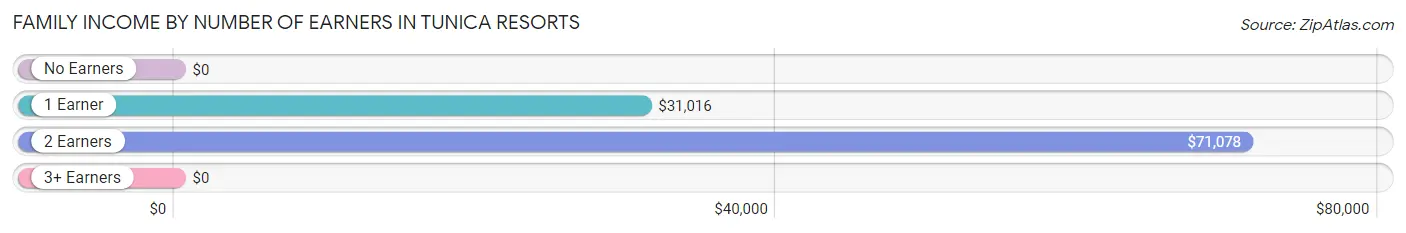
Family Income by Number of Earners in Tunica Resorts
| Number of Earners | # Families | Median Income |
| No Earners | 27 (6.1%) | $0 |
| 1 Earner | 327 (74.0%) | $31,016 |
| 2 Earners | 76 (17.2%) | $71,078 |
| 3+ Earners | 12 (2.7%) | $0 |
| Total | 442 (100.0%) | $31,853 |
Household Income in Tunica Resorts
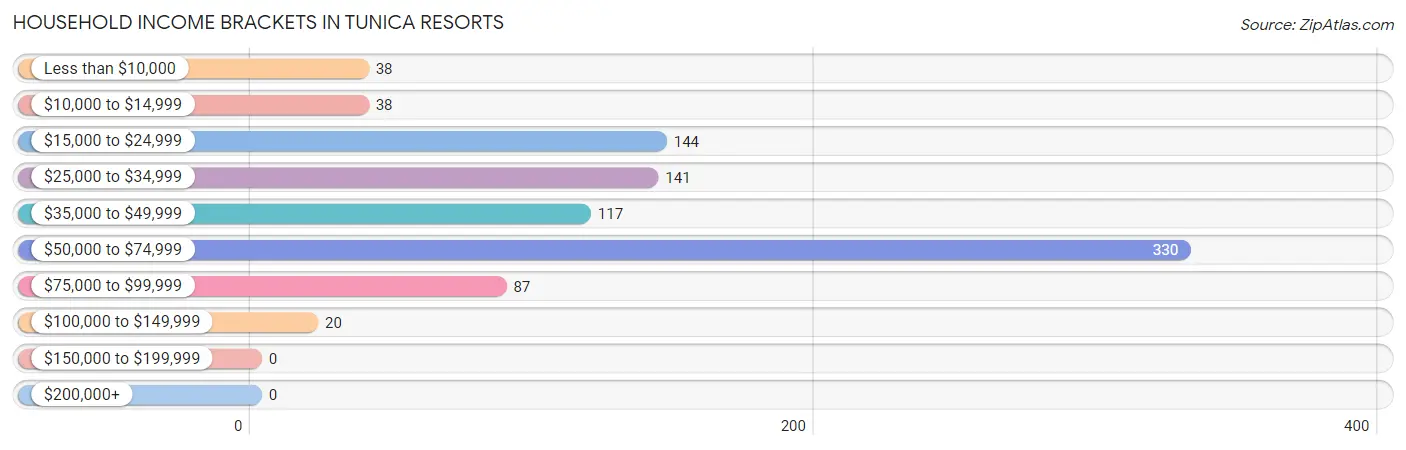
Household Income Brackets in Tunica Resorts
With 330 households falling in the category, the $50,000 to $74,999 income range is the most frequent in Tunica Resorts, accounting for 36.1% of all households.
| Income Bracket | # Households | % Households |
| Less than $10,000 | 38 | 4.2% |
| $10,000 to $14,999 | 38 | 4.2% |
| $15,000 to $24,999 | 144 | 15.7% |
| $25,000 to $34,999 | 141 | 15.4% |
| $35,000 to $49,999 | 117 | 12.8% |
| $50,000 to $74,999 | 330 | 36.1% |
| $75,000 to $99,999 | 87 | 9.5% |
| $100,000 to $149,999 | 20 | 2.2% |
| $150,000 to $199,999 | 0 | 0.0% |
| $200,000+ | 0 | 0.0% |
Household Income by Householder Age in Tunica Resorts
The median household income in Tunica Resorts is $46,454, with the highest median household income of $59,954 found in the 45 to 64 years age bracket for the primary householder. A total of 223 households (24.4%) fall into this category. Meanwhile, the 15 to 24 years age bracket for the primary householder has the lowest median household income of $0, with 19 households (2.1%) in this group.
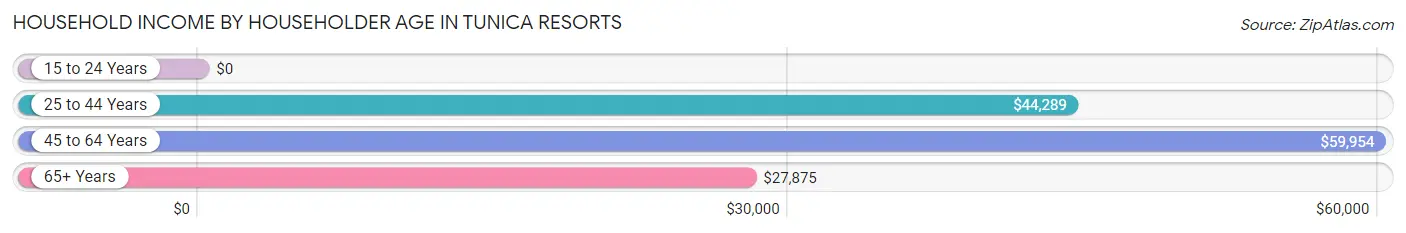
| Income Bracket | # Households | Median Income |
| 15 to 24 Years | 19 (2.1%) | $0 |
| 25 to 44 Years | 533 (58.3%) | $44,289 |
| 45 to 64 Years | 223 (24.4%) | $59,954 |
| 65+ Years | 140 (15.3%) | $27,875 |
| Total | 915 (100.0%) | $46,454 |
Poverty in Tunica Resorts
Income Below Poverty by Sex and Age in Tunica Resorts
With 8.3% poverty level for males and 13.0% for females among the residents of Tunica Resorts, 35 to 44 year old males and 18 to 24 year old females are the most vulnerable to poverty, with 38 males (26.4%) and 34 females (68.0%) in their respective age groups living below the poverty level.
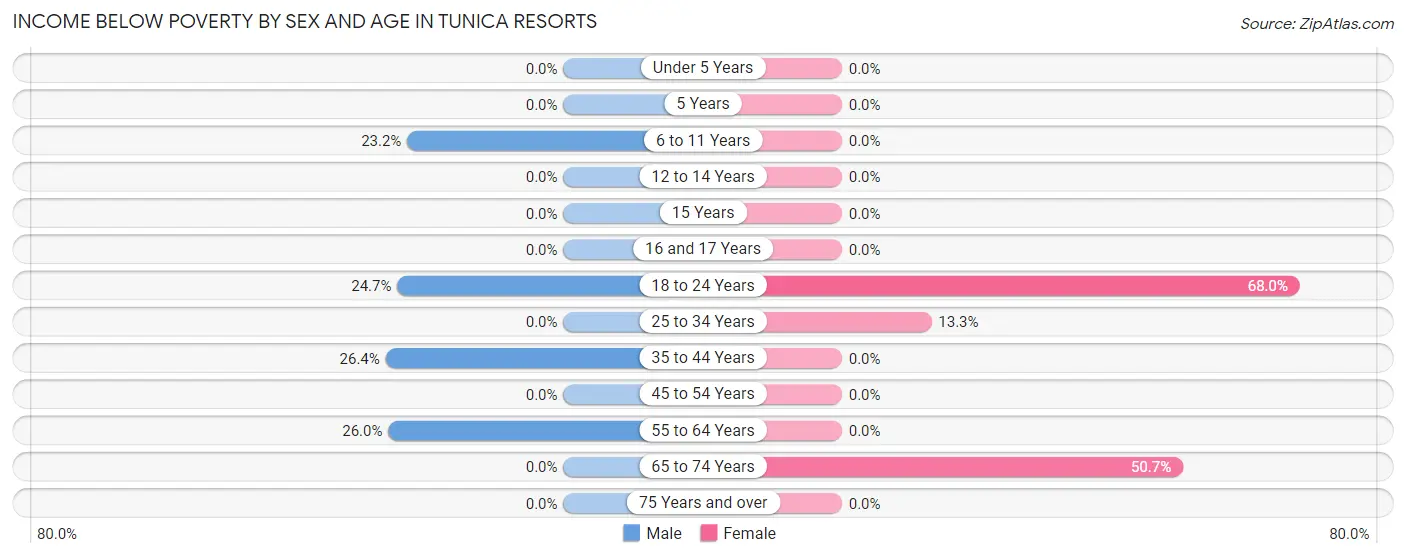
| Age Bracket | Male | Female |
| Under 5 Years | 0 (0.0%) | 0 (0.0%) |
| 5 Years | 0 (0.0%) | 0 (0.0%) |
| 6 to 11 Years | 16 (23.2%) | 0 (0.0%) |
| 12 to 14 Years | 0 (0.0%) | 0 (0.0%) |
| 15 Years | 0 (0.0%) | 0 (0.0%) |
| 16 and 17 Years | 0 (0.0%) | 0 (0.0%) |
| 18 to 24 Years | 18 (24.7%) | 34 (68.0%) |
| 25 to 34 Years | 0 (0.0%) | 48 (13.3%) |
| 35 to 44 Years | 38 (26.4%) | 0 (0.0%) |
| 45 to 54 Years | 0 (0.0%) | 0 (0.0%) |
| 55 to 64 Years | 26 (26.0%) | 0 (0.0%) |
| 65 to 74 Years | 0 (0.0%) | 38 (50.7%) |
| 75 Years and over | 0 (0.0%) | 0 (0.0%) |
| Total | 98 (8.3%) | 120 (13.0%) |
Income Above Poverty by Sex and Age in Tunica Resorts
According to the poverty statistics in Tunica Resorts, males aged under 5 years and females aged 5 years are the age groups that are most secure financially, with 100.0% of males and 100.0% of females in these age groups living above the poverty line.
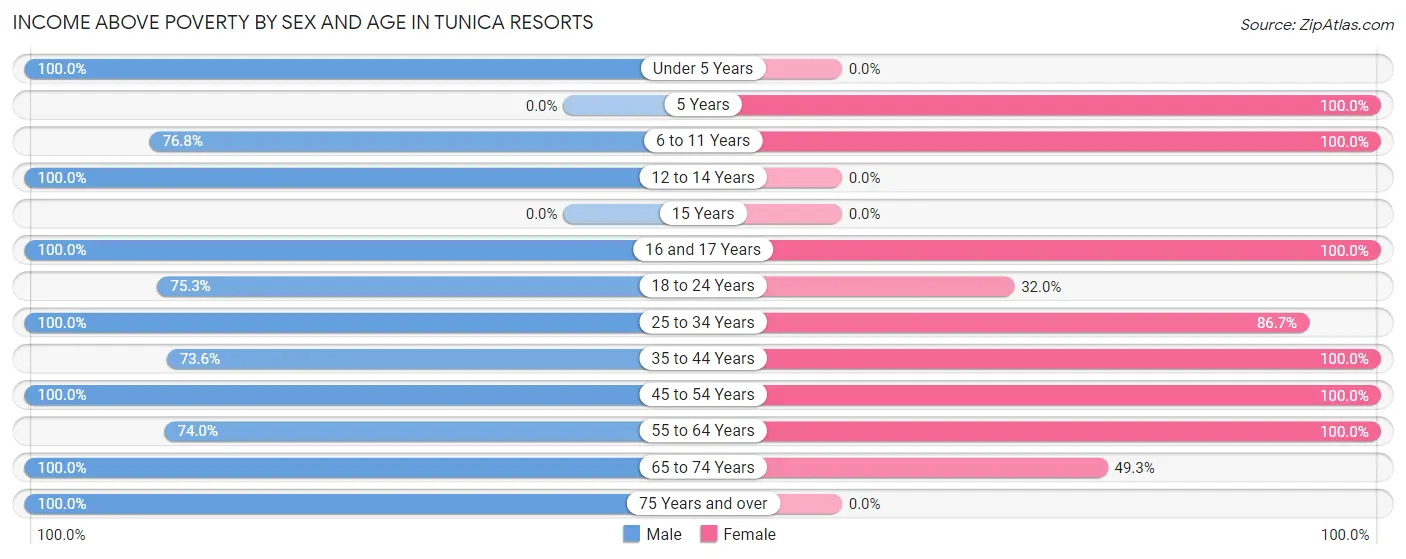
| Age Bracket | Male | Female |
| Under 5 Years | 162 (100.0%) | 0 (0.0%) |
| 5 Years | 0 (0.0%) | 65 (100.0%) |
| 6 to 11 Years | 53 (76.8%) | 76 (100.0%) |
| 12 to 14 Years | 54 (100.0%) | 0 (0.0%) |
| 15 Years | 0 (0.0%) | 0 (0.0%) |
| 16 and 17 Years | 36 (100.0%) | 28 (100.0%) |
| 18 to 24 Years | 55 (75.3%) | 16 (32.0%) |
| 25 to 34 Years | 370 (100.0%) | 313 (86.7%) |
| 35 to 44 Years | 106 (73.6%) | 134 (100.0%) |
| 45 to 54 Years | 77 (100.0%) | 37 (100.0%) |
| 55 to 64 Years | 74 (74.0%) | 94 (100.0%) |
| 65 to 74 Years | 32 (100.0%) | 37 (49.3%) |
| 75 Years and over | 59 (100.0%) | 0 (0.0%) |
| Total | 1,078 (91.7%) | 800 (87.0%) |
Income Below Poverty Among Married-Couple Families in Tunica Resorts
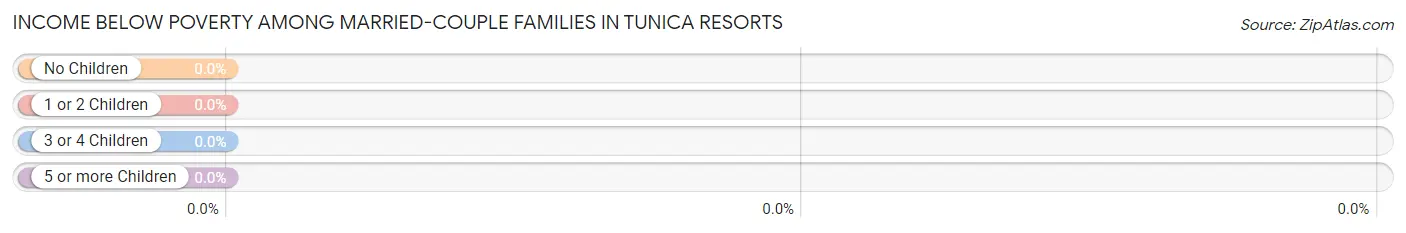
| Children | Above Poverty | Below Poverty |
| No Children | 98 (100.0%) | 0 (0.0%) |
| 1 or 2 Children | 44 (100.0%) | 0 (0.0%) |
| 3 or 4 Children | 0 (0.0%) | 0 (0.0%) |
| 5 or more Children | 0 (0.0%) | 0 (0.0%) |
| Total | 142 (100.0%) | 0 (0.0%) |
Income Below Poverty Among Single-Parent Households in Tunica Resorts
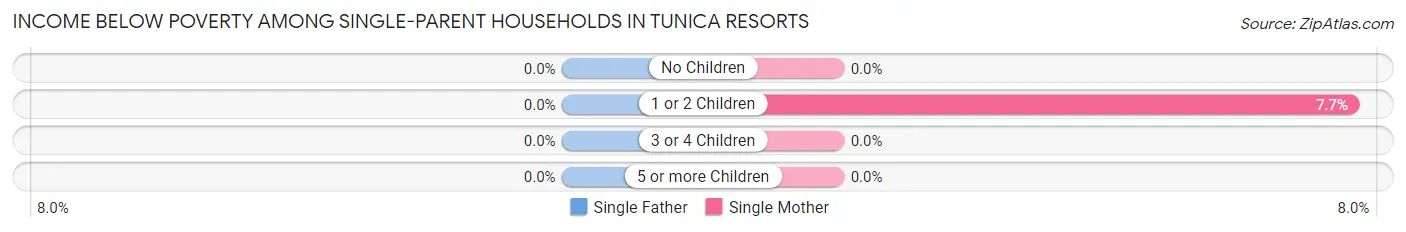
| Children | Single Father | Single Mother |
| No Children | 0 (0.0%) | 0 (0.0%) |
| 1 or 2 Children | 0 (0.0%) | 13 (7.7%) |
| 3 or 4 Children | 0 (0.0%) | 0 (0.0%) |
| 5 or more Children | 0 (0.0%) | 0 (0.0%) |
| Total | 0 (0.0%) | 13 (7.3%) |
Income Below Poverty Among Married-Couple vs Single-Parent Households in Tunica Resorts
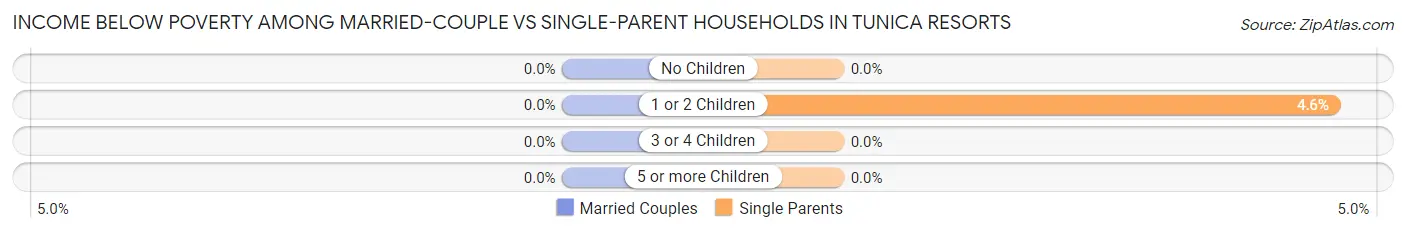
| Children | Married-Couple Families | Single-Parent Households |
| No Children | 0 (0.0%) | 0 (0.0%) |
| 1 or 2 Children | 0 (0.0%) | 13 (4.6%) |
| 3 or 4 Children | 0 (0.0%) | 0 (0.0%) |
| 5 or more Children | 0 (0.0%) | 0 (0.0%) |
| Total | 0 (0.0%) | 13 (4.3%) |
Race in Tunica Resorts
The most populous races in Tunica Resorts are Black / African American (1,637 | 78.1%), and White / Caucasian (459 | 21.9%).
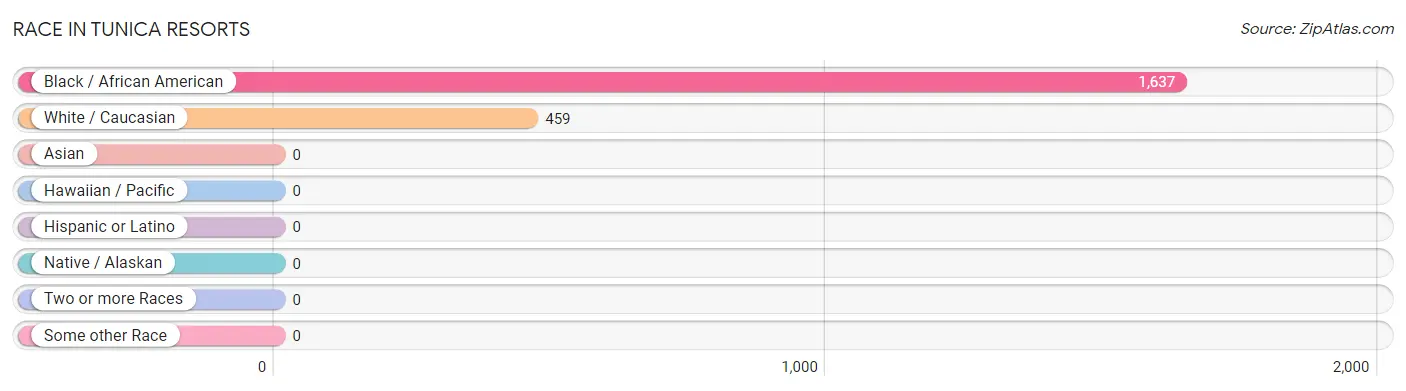
| Race | # Population | % Population |
| Asian | 0 | 0.0% |
| Black / African American | 1,637 | 78.1% |
| Hawaiian / Pacific | 0 | 0.0% |
| Hispanic or Latino | 0 | 0.0% |
| Native / Alaskan | 0 | 0.0% |
| White / Caucasian | 459 | 21.9% |
| Two or more Races | 0 | 0.0% |
| Some other Race | 0 | 0.0% |
| Total | 2,096 | 100.0% |
Ancestry in Tunica Resorts
The most populous ancestries reported in Tunica Resorts are American (87 | 4.2%), English (38 | 1.8%), French Canadian (34 | 1.6%), Irish (29 | 1.4%), and European (26 | 1.2%), together accounting for 10.2% of all Tunica Resorts residents.
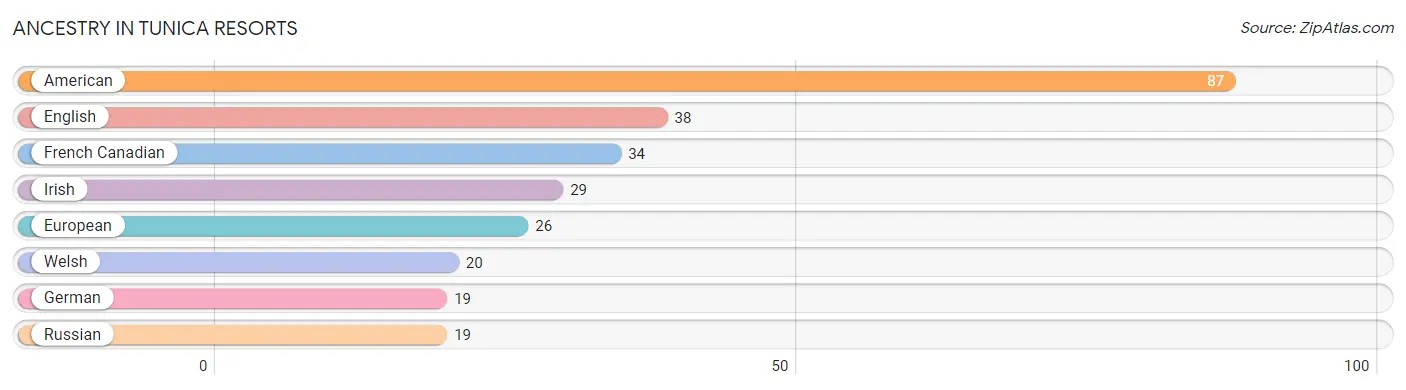
| Ancestry | # Population | % Population |
| American | 87 | 4.2% |
| English | 38 | 1.8% |
| European | 26 | 1.2% |
| French Canadian | 34 | 1.6% |
| German | 19 | 0.9% |
| Irish | 29 | 1.4% |
| Russian | 19 | 0.9% |
| Welsh | 20 | 0.9% | View All 8 Rows |
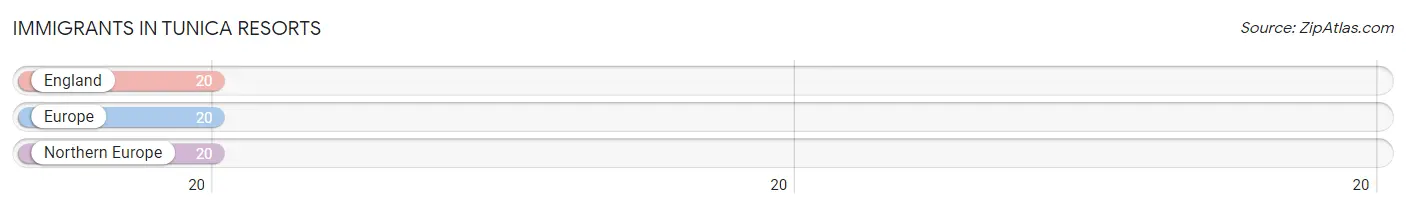
Immigrants in Tunica Resorts
The most numerous immigrant groups reported in Tunica Resorts came from England (20 | 0.9%), Europe (20 | 0.9%), and Northern Europe (20 | 0.9%), together accounting for 2.8% of all Tunica Resorts residents.
| Immigration Origin | # Population | % Population |
| England | 20 | 0.9% |
| Europe | 20 | 0.9% |
| Northern Europe | 20 | 0.9% | View All 3 Rows |
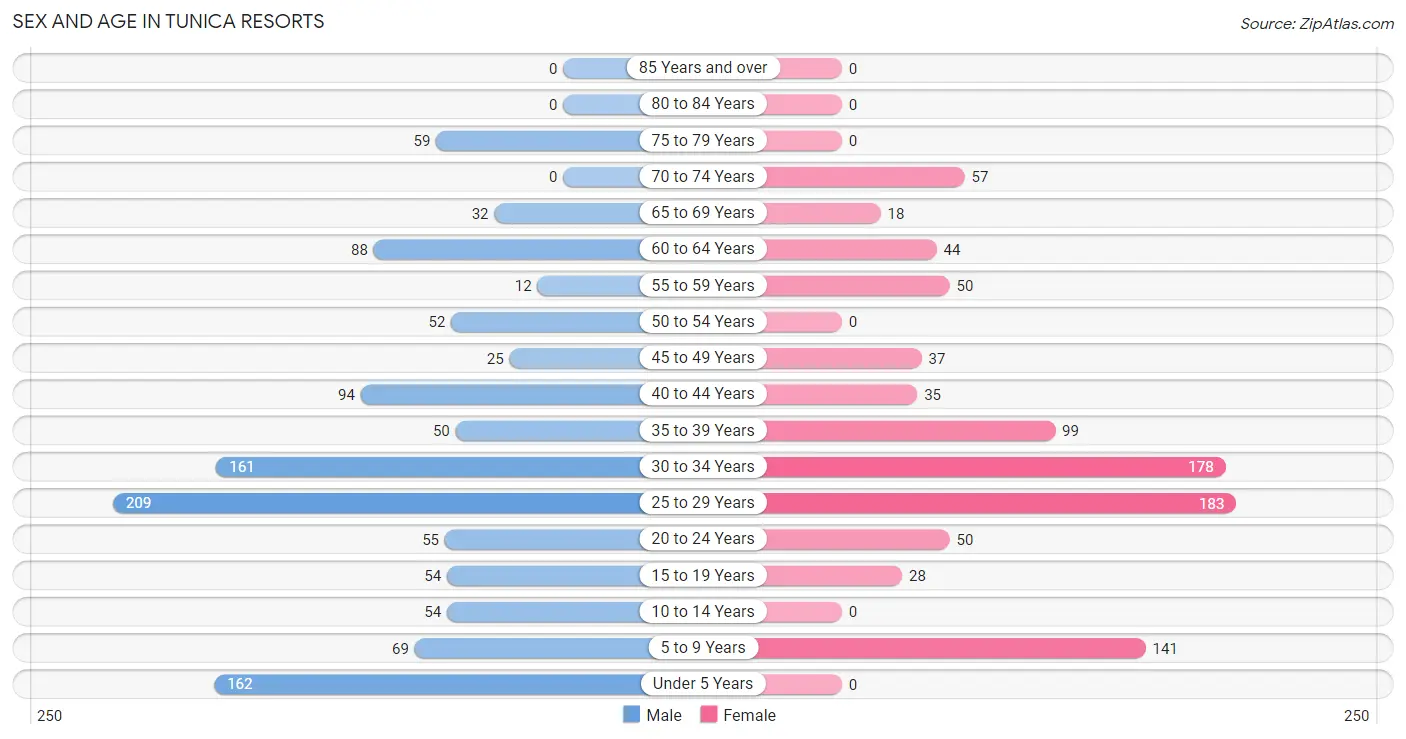
Sex and Age in Tunica Resorts
Sex and Age in Tunica Resorts
The most populous age groups in Tunica Resorts are 25 to 29 Years (209 | 17.8%) for men and 25 to 29 Years (183 | 19.9%) for women.
| Age Bracket | Male | Female |
| Under 5 Years | 162 (13.8%) | 0 (0.0%) |
| 5 to 9 Years | 69 (5.9%) | 141 (15.3%) |
| 10 to 14 Years | 54 (4.6%) | 0 (0.0%) |
| 15 to 19 Years | 54 (4.6%) | 28 (3.0%) |
| 20 to 24 Years | 55 (4.7%) | 50 (5.4%) |
| 25 to 29 Years | 209 (17.8%) | 183 (19.9%) |
| 30 to 34 Years | 161 (13.7%) | 178 (19.4%) |
| 35 to 39 Years | 50 (4.3%) | 99 (10.8%) |
| 40 to 44 Years | 94 (8.0%) | 35 (3.8%) |
| 45 to 49 Years | 25 (2.1%) | 37 (4.0%) |
| 50 to 54 Years | 52 (4.4%) | 0 (0.0%) |
| 55 to 59 Years | 12 (1.0%) | 50 (5.4%) |
| 60 to 64 Years | 88 (7.5%) | 44 (4.8%) |
| 65 to 69 Years | 32 (2.7%) | 18 (2.0%) |
| 70 to 74 Years | 0 (0.0%) | 57 (6.2%) |
| 75 to 79 Years | 59 (5.0%) | 0 (0.0%) |
| 80 to 84 Years | 0 (0.0%) | 0 (0.0%) |
| 85 Years and over | 0 (0.0%) | 0 (0.0%) |
| Total | 1,176 (100.0%) | 920 (100.0%) |
Families and Households in Tunica Resorts
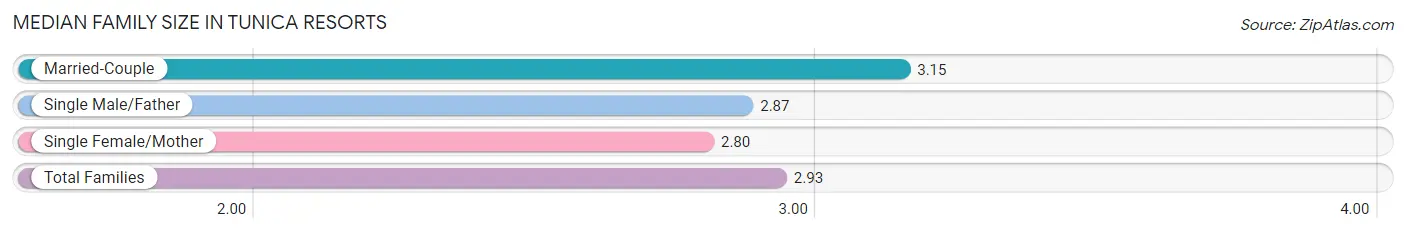
Median Family Size in Tunica Resorts
The median family size in Tunica Resorts is 2.93 persons per family, with married-couple families (142 | 32.1%) accounting for the largest median family size of 3.15 persons per family. On the other hand, single female/mother families (179 | 40.5%) represent the smallest median family size with 2.80 persons per family.
| Family Type | # Families | Family Size |
| Married-Couple | 142 (32.1%) | 3.15 |
| Single Male/Father | 121 (27.4%) | 2.87 |
| Single Female/Mother | 179 (40.5%) | 2.80 |
| Total Families | 442 (100.0%) | 2.93 |
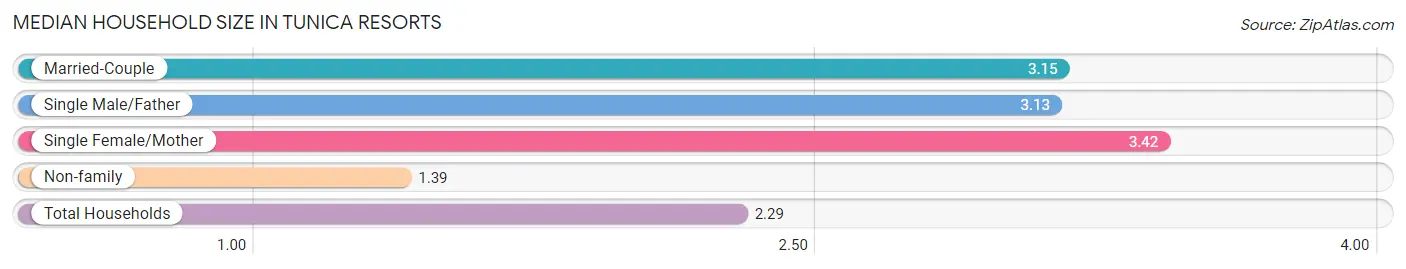
Median Household Size in Tunica Resorts
The median household size in Tunica Resorts is 2.29 persons per household, with single female/mother households (179 | 19.6%) accounting for the largest median household size of 3.42 persons per household. non-family households (473 | 51.7%) represent the smallest median household size with 1.39 persons per household.
| Household Type | # Households | Household Size |
| Married-Couple | 142 (15.5%) | 3.15 |
| Single Male/Father | 121 (13.2%) | 3.13 |
| Single Female/Mother | 179 (19.6%) | 3.42 |
| Non-family | 473 (51.7%) | 1.39 |
| Total Households | 915 (100.0%) | 2.29 |
Household Size by Marriage Status in Tunica Resorts
Out of a total of 915 households in Tunica Resorts, 442 (48.3%) are family households, while 473 (51.7%) are nonfamily households. The most numerous type of family households are 3-person households, comprising 187, and the most common type of nonfamily households are 1-person households, comprising 373.
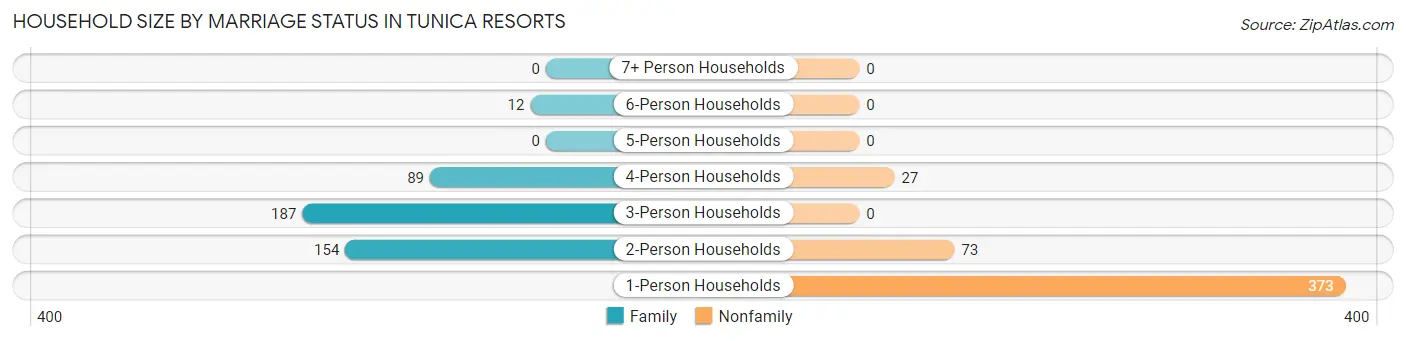
| Household Size | Family Households | Nonfamily Households |
| 1-Person Households | - | 373 (40.8%) |
| 2-Person Households | 154 (16.8%) | 73 (8.0%) |
| 3-Person Households | 187 (20.4%) | 0 (0.0%) |
| 4-Person Households | 89 (9.7%) | 27 (2.9%) |
| 5-Person Households | 0 (0.0%) | 0 (0.0%) |
| 6-Person Households | 12 (1.3%) | 0 (0.0%) |
| 7+ Person Households | 0 (0.0%) | 0 (0.0%) |
| Total | 442 (48.3%) | 473 (51.7%) |
Female Fertility in Tunica Resorts
Fertility by Age in Tunica Resorts
| Age Bracket | Women with Births | Births / 1,000 Women |
| 15 to 19 years | 0 (0.0%) | 0.0 |
| 20 to 34 years | 0 (0.0%) | 0.0 |
| 35 to 50 years | 0 (0.0%) | 0.0 |
| Total | 0 (0.0%) | 0.0 |
Fertility by Age by Marriage Status in Tunica Resorts
| Age Bracket | Married | Unmarried |
| 15 to 19 years | 0 (0.0%) | 0 (0.0%) |
| 20 to 34 years | 0 (0.0%) | 0 (0.0%) |
| 35 to 50 years | 0 (0.0%) | 0 (0.0%) |
| Total | 0 (0.0%) | 0 (0.0%) |
Fertility by Education in Tunica Resorts
| Educational Attainment | Women with Births | Births / 1,000 Women |
| Less than High School | 0 (0.0%) | 0.0 |
| High School Diploma | 0 (0.0%) | 0.0 |
| College or Associate's Degree | 0 (0.0%) | 0.0 |
| Bachelor's Degree | 0 (0.0%) | 0.0 |
| Graduate Degree | 0 (0.0%) | 0.0 |
| Total | 0 (0.0%) | 0.0 |
Fertility by Education by Marriage Status in Tunica Resorts
| Educational Attainment | Married | Unmarried |
| Less than High School | 0 (0.0%) | 0 (0.0%) |
| High School Diploma | 0 (0.0%) | 0 (0.0%) |
| College or Associate's Degree | 0 (0.0%) | 0 (0.0%) |
| Bachelor's Degree | 0 (0.0%) | 0 (0.0%) |
| Graduate Degree | 0 (0.0%) | 0 (0.0%) |
| Total | 0 (0.0%) | 0 (0.0%) |
Employment Characteristics in Tunica Resorts
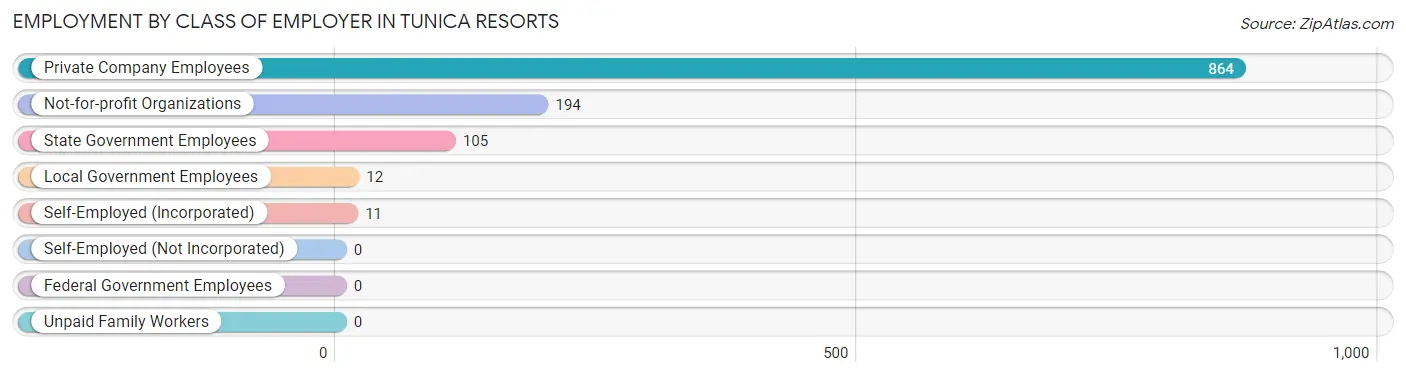
Employment by Class of Employer in Tunica Resorts
Among the 1,186 employed individuals in Tunica Resorts, private company employees (864 | 72.9%), not-for-profit organizations (194 | 16.4%), and state government employees (105 | 8.8%) make up the most common classes of employment.
| Employer Class | # Employees | % Employees |
| Private Company Employees | 864 | 72.9% |
| Self-Employed (Incorporated) | 11 | 0.9% |
| Self-Employed (Not Incorporated) | 0 | 0.0% |
| Not-for-profit Organizations | 194 | 16.4% |
| Local Government Employees | 12 | 1.0% |
| State Government Employees | 105 | 8.8% |
| Federal Government Employees | 0 | 0.0% |
| Unpaid Family Workers | 0 | 0.0% |
| Total | 1,186 | 100.0% |
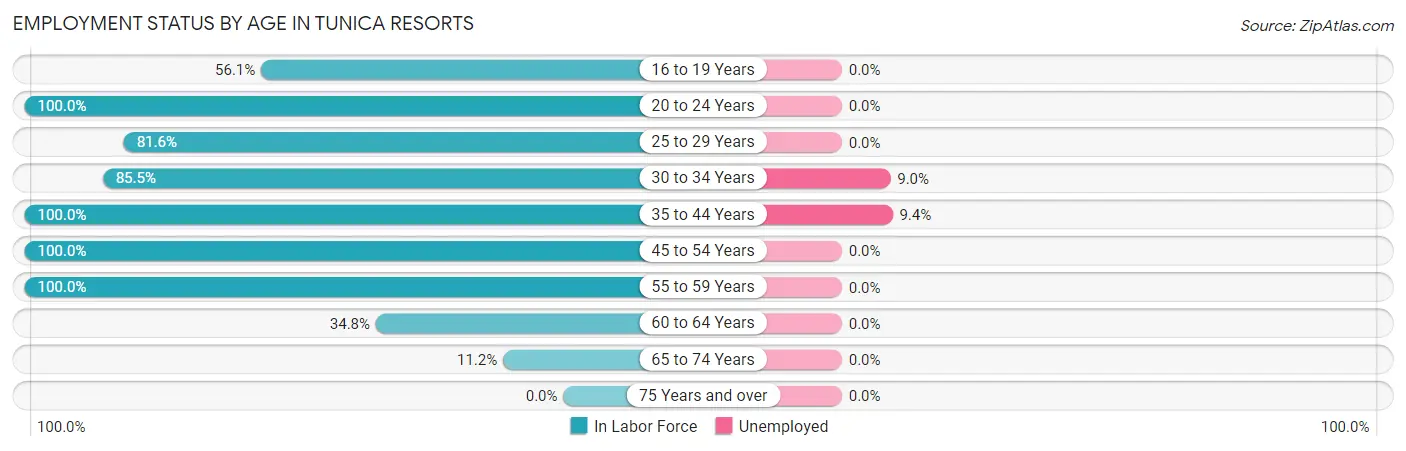
Employment Status by Age in Tunica Resorts
According to the labor force statistics for Tunica Resorts, out of the total population over 16 years of age (1,670), 76.2% or 1,273 individuals are in the labor force, with 4.1% or 52 of them unemployed. The age group with the highest labor force participation rate is 20 to 24 years, with 100.0% or 105 individuals in the labor force. Within the labor force, the 35 to 44 years age range has the highest percentage of unemployed individuals, with 9.4% or 26 of them being unemployed.
| Age Bracket | In Labor Force | Unemployed |
| 16 to 19 Years | 46 (56.1%) | 0 (0.0%) |
| 20 to 24 Years | 105 (100.0%) | 0 (0.0%) |
| 25 to 29 Years | 320 (81.6%) | 0 (0.0%) |
| 30 to 34 Years | 290 (85.5%) | 26 (9.0%) |
| 35 to 44 Years | 278 (100.0%) | 26 (9.4%) |
| 45 to 54 Years | 114 (100.0%) | 0 (0.0%) |
| 55 to 59 Years | 62 (100.0%) | 0 (0.0%) |
| 60 to 64 Years | 46 (34.8%) | 0 (0.0%) |
| 65 to 74 Years | 12 (11.2%) | 0 (0.0%) |
| 75 Years and over | 0 (0.0%) | 0 (0.0%) |
| Total | 1,273 (76.2%) | 52 (4.1%) |
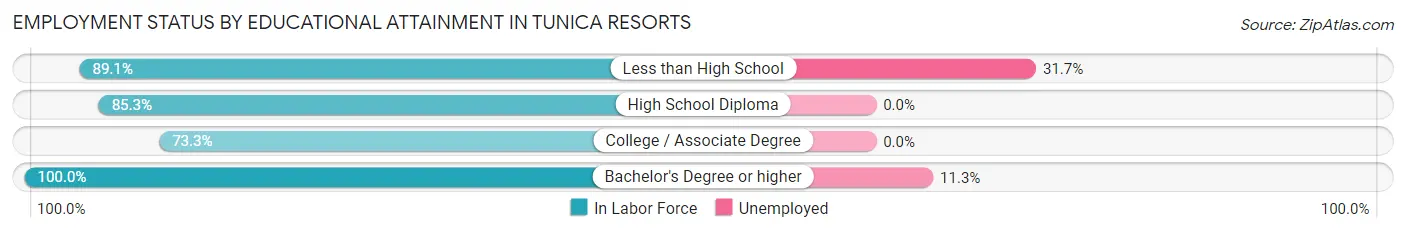
Employment Status by Educational Attainment in Tunica Resorts
According to labor force statistics for Tunica Resorts, 84.3% of individuals (1,110) out of the total population between 25 and 64 years of age (1,317) are in the labor force, with 4.7% or 52 of them being unemployed. The group with the highest labor force participation rate are those with the educational attainment of bachelor's degree or higher, with 100.0% or 230 individuals in the labor force. Within the labor force, individuals with less than high school education have the highest percentage of unemployment, with 31.7% or 26 of them being unemployed.
| Educational Attainment | In Labor Force | Unemployed |
| Less than High School | 82 (89.1%) | 29 (31.7%) |
| High School Diploma | 488 (85.3%) | 0 (0.0%) |
| College / Associate Degree | 310 (73.3%) | 0 (0.0%) |
| Bachelor's Degree or higher | 230 (100.0%) | 26 (11.3%) |
| Total | 1,110 (84.3%) | 62 (4.7%) |
Employment Occupations by Sex in Tunica Resorts
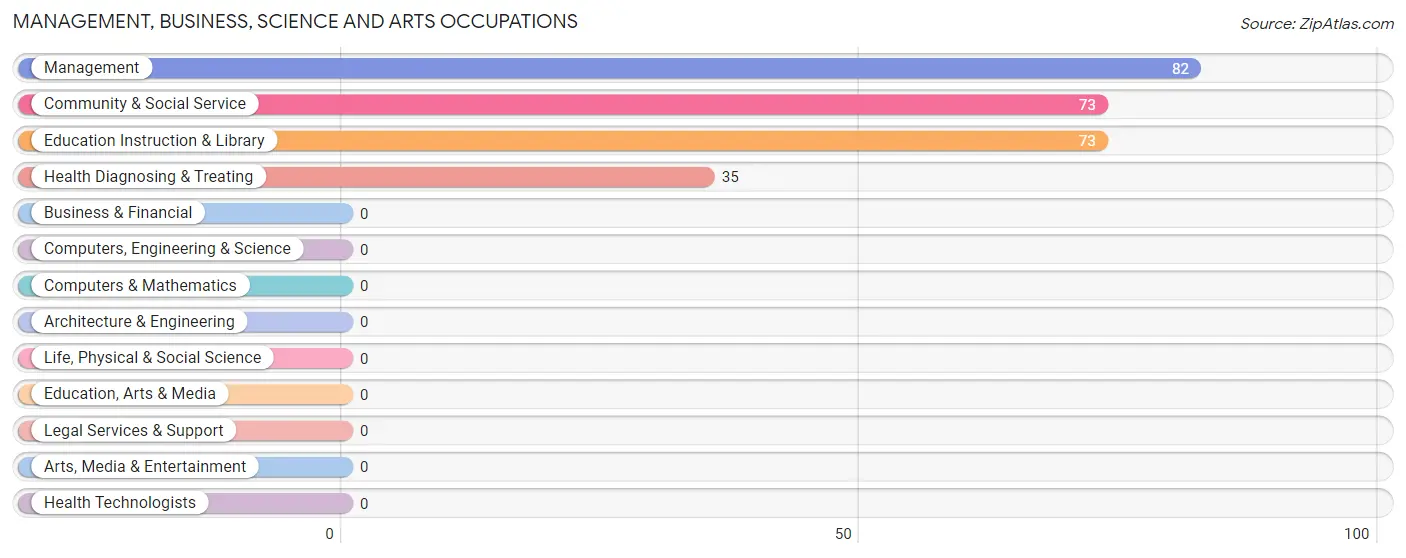
Management, Business, Science and Arts Occupations
The most common Management, Business, Science and Arts occupations in Tunica Resorts are Management (82 | 6.7%), Community & Social Service (73 | 6.0%), Education Instruction & Library (73 | 6.0%), and Health Diagnosing & Treating (35 | 2.9%).
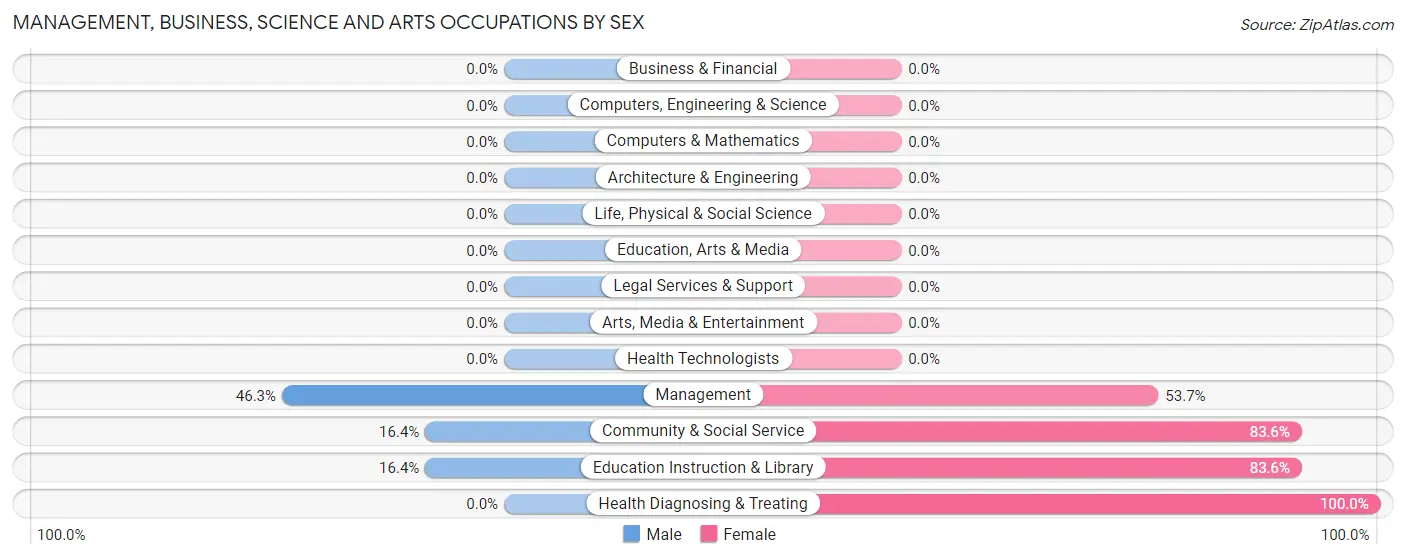
Management, Business, Science and Arts Occupations by Sex
Within the Management, Business, Science and Arts occupations in Tunica Resorts, the most male-oriented occupations are Management (46.3%), Community & Social Service (16.4%), and Education Instruction & Library (16.4%), while the most female-oriented occupations are Health Diagnosing & Treating (100.0%), Community & Social Service (83.6%), and Education Instruction & Library (83.6%).
| Occupation | Male | Female |
| Management | 38 (46.3%) | 44 (53.7%) |
| Business & Financial | 0 (0.0%) | 0 (0.0%) |
| Computers, Engineering & Science | 0 (0.0%) | 0 (0.0%) |
| Computers & Mathematics | 0 (0.0%) | 0 (0.0%) |
| Architecture & Engineering | 0 (0.0%) | 0 (0.0%) |
| Life, Physical & Social Science | 0 (0.0%) | 0 (0.0%) |
| Community & Social Service | 12 (16.4%) | 61 (83.6%) |
| Education, Arts & Media | 0 (0.0%) | 0 (0.0%) |
| Legal Services & Support | 0 (0.0%) | 0 (0.0%) |
| Education Instruction & Library | 12 (16.4%) | 61 (83.6%) |
| Arts, Media & Entertainment | 0 (0.0%) | 0 (0.0%) |
| Health Diagnosing & Treating | 0 (0.0%) | 35 (100.0%) |
| Health Technologists | 0 (0.0%) | 0 (0.0%) |
| Total (Category) | 50 (26.3%) | 140 (73.7%) |
| Total (Overall) | 621 (50.9%) | 600 (49.1%) |
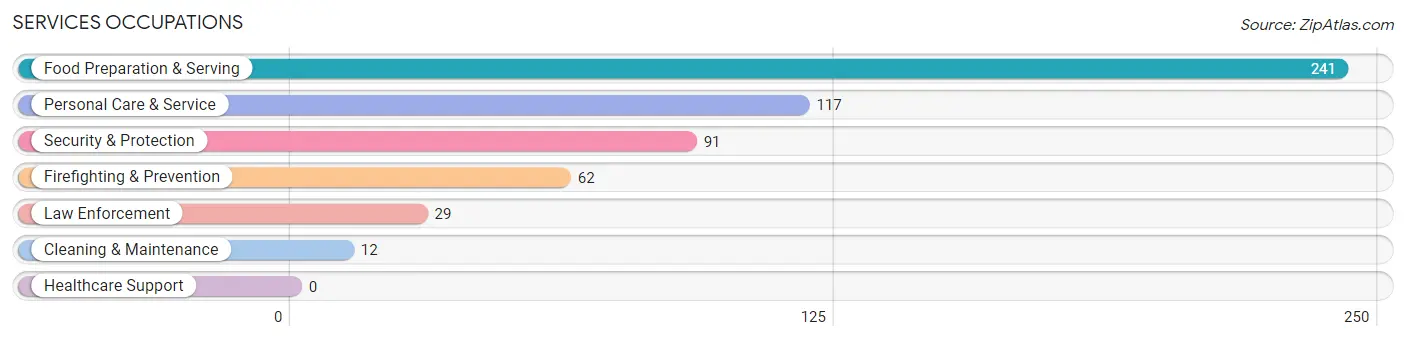
Services Occupations
The most common Services occupations in Tunica Resorts are Food Preparation & Serving (241 | 19.7%), Personal Care & Service (117 | 9.6%), Security & Protection (91 | 7.4%), Firefighting & Prevention (62 | 5.1%), and Law Enforcement (29 | 2.4%).
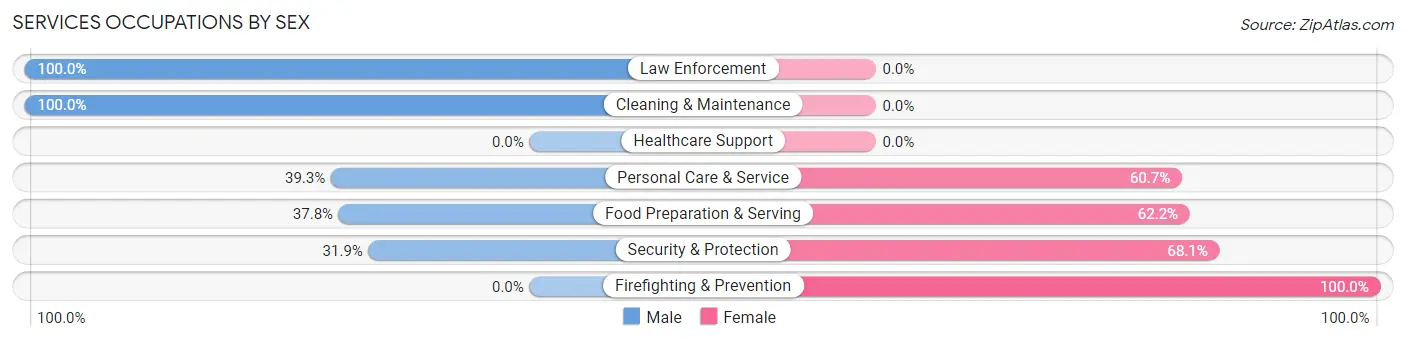
Services Occupations by Sex
Within the Services occupations in Tunica Resorts, the most male-oriented occupations are Law Enforcement (100.0%), Cleaning & Maintenance (100.0%), and Personal Care & Service (39.3%), while the most female-oriented occupations are Firefighting & Prevention (100.0%), Security & Protection (68.1%), and Food Preparation & Serving (62.2%).
| Occupation | Male | Female |
| Healthcare Support | 0 (0.0%) | 0 (0.0%) |
| Security & Protection | 29 (31.9%) | 62 (68.1%) |
| Firefighting & Prevention | 0 (0.0%) | 62 (100.0%) |
| Law Enforcement | 29 (100.0%) | 0 (0.0%) |
| Food Preparation & Serving | 91 (37.8%) | 150 (62.2%) |
| Cleaning & Maintenance | 12 (100.0%) | 0 (0.0%) |
| Personal Care & Service | 46 (39.3%) | 71 (60.7%) |
| Total (Category) | 178 (38.6%) | 283 (61.4%) |
| Total (Overall) | 621 (50.9%) | 600 (49.1%) |
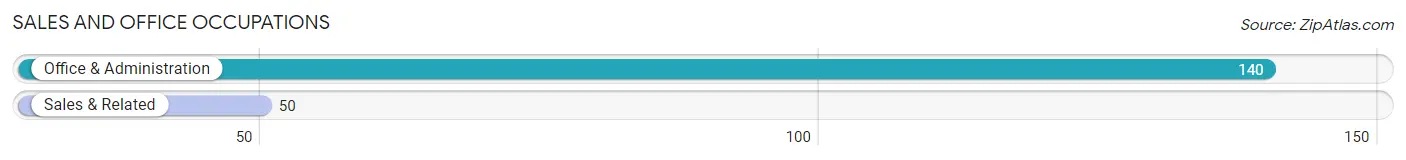
Sales and Office Occupations
The most common Sales and Office occupations in Tunica Resorts are Office & Administration (140 | 11.5%), and Sales & Related (50 | 4.1%).
Sales and Office Occupations by Sex
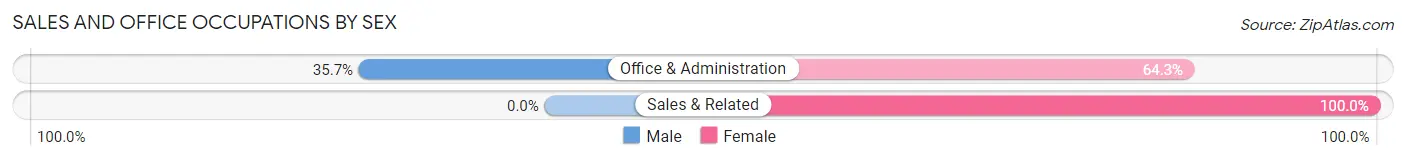
| Occupation | Male | Female |
| Sales & Related | 0 (0.0%) | 50 (100.0%) |
| Office & Administration | 50 (35.7%) | 90 (64.3%) |
| Total (Category) | 50 (26.3%) | 140 (73.7%) |
| Total (Overall) | 621 (50.9%) | 600 (49.1%) |
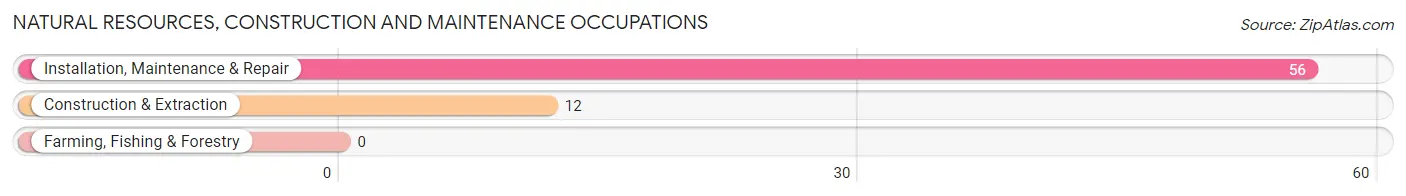
Natural Resources, Construction and Maintenance Occupations
The most common Natural Resources, Construction and Maintenance occupations in Tunica Resorts are Installation, Maintenance & Repair (56 | 4.6%), and Construction & Extraction (12 | 1.0%).
Natural Resources, Construction and Maintenance Occupations by Sex
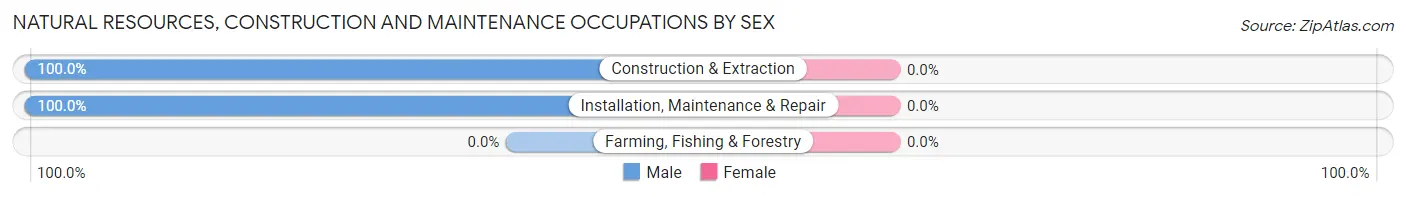
| Occupation | Male | Female |
| Farming, Fishing & Forestry | 0 (0.0%) | 0 (0.0%) |
| Construction & Extraction | 12 (100.0%) | 0 (0.0%) |
| Installation, Maintenance & Repair | 56 (100.0%) | 0 (0.0%) |
| Total (Category) | 68 (100.0%) | 0 (0.0%) |
| Total (Overall) | 621 (50.9%) | 600 (49.1%) |
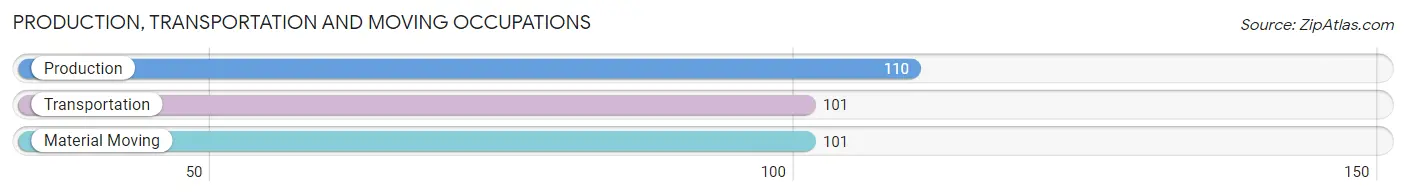
Production, Transportation and Moving Occupations
The most common Production, Transportation and Moving occupations in Tunica Resorts are Production (110 | 9.0%), Transportation (101 | 8.3%), and Material Moving (101 | 8.3%).
Production, Transportation and Moving Occupations by Sex
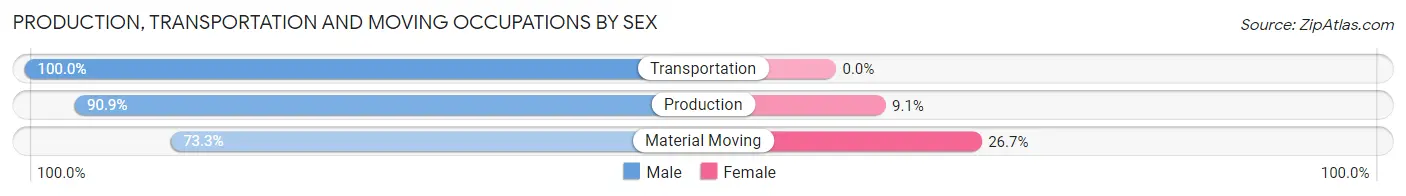
| Occupation | Male | Female |
| Production | 100 (90.9%) | 10 (9.1%) |
| Transportation | 101 (100.0%) | 0 (0.0%) |
| Material Moving | 74 (73.3%) | 27 (26.7%) |
| Total (Category) | 275 (88.1%) | 37 (11.9%) |
| Total (Overall) | 621 (50.9%) | 600 (49.1%) |
Employment Industries by Sex in Tunica Resorts
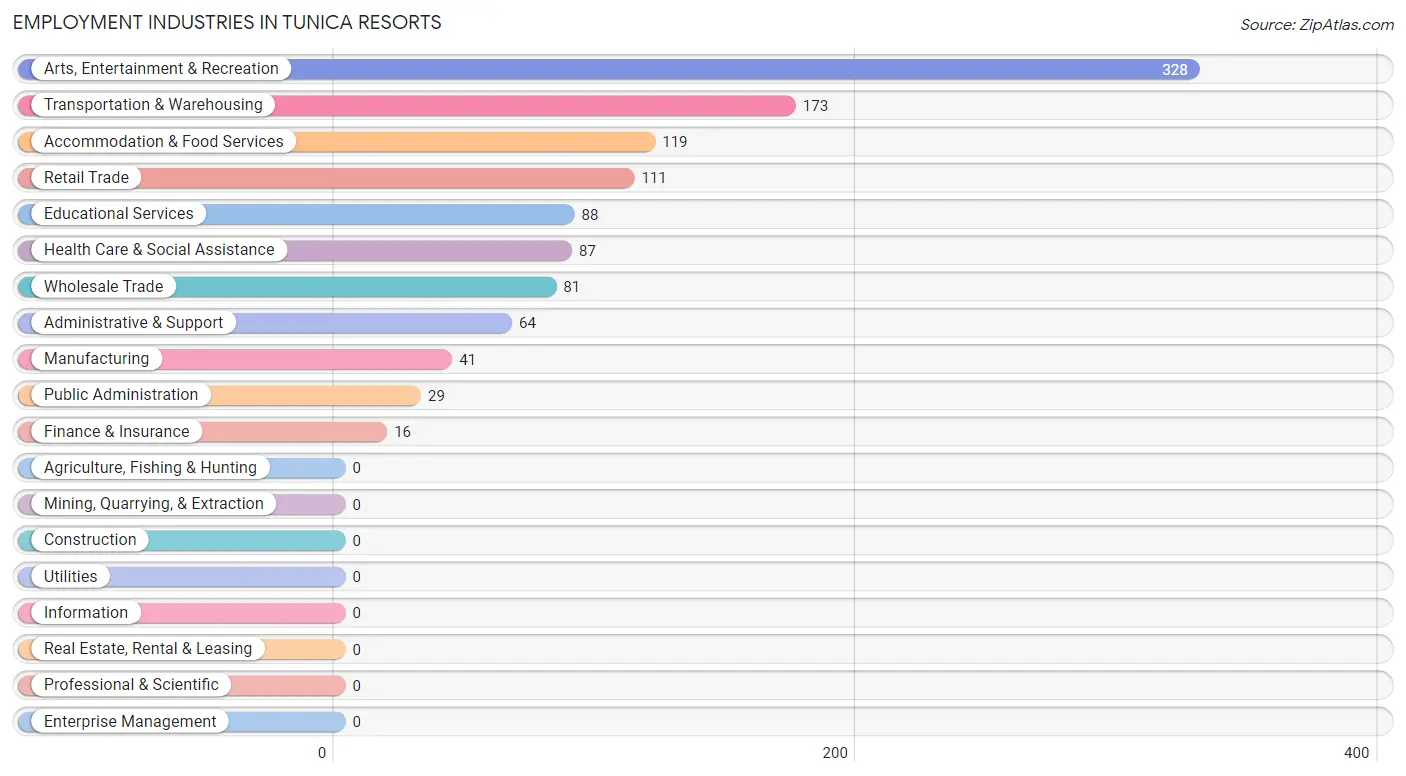
Employment Industries in Tunica Resorts
The major employment industries in Tunica Resorts include Arts, Entertainment & Recreation (328 | 26.9%), Transportation & Warehousing (173 | 14.2%), Accommodation & Food Services (119 | 9.8%), Retail Trade (111 | 9.1%), and Educational Services (88 | 7.2%).
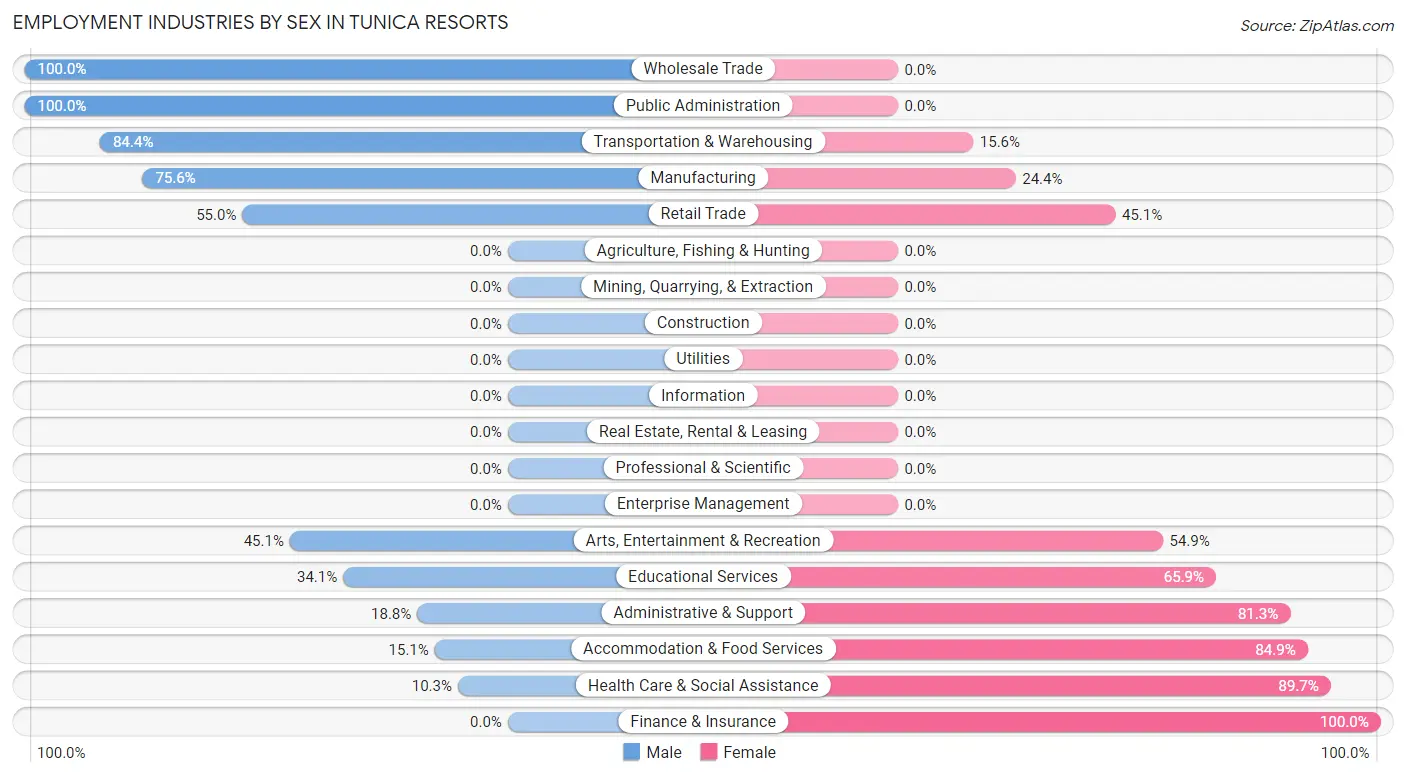
Employment Industries by Sex in Tunica Resorts
The Tunica Resorts industries that see more men than women are Wholesale Trade (100.0%), Public Administration (100.0%), and Transportation & Warehousing (84.4%), whereas the industries that tend to have a higher number of women are Finance & Insurance (100.0%), Health Care & Social Assistance (89.7%), and Accommodation & Food Services (84.9%).
| Industry | Male | Female |
| Agriculture, Fishing & Hunting | 0 (0.0%) | 0 (0.0%) |
| Mining, Quarrying, & Extraction | 0 (0.0%) | 0 (0.0%) |
| Construction | 0 (0.0%) | 0 (0.0%) |
| Manufacturing | 31 (75.6%) | 10 (24.4%) |
| Wholesale Trade | 81 (100.0%) | 0 (0.0%) |
| Retail Trade | 61 (54.9%) | 50 (45.1%) |
| Transportation & Warehousing | 146 (84.4%) | 27 (15.6%) |
| Utilities | 0 (0.0%) | 0 (0.0%) |
| Information | 0 (0.0%) | 0 (0.0%) |
| Finance & Insurance | 0 (0.0%) | 16 (100.0%) |
| Real Estate, Rental & Leasing | 0 (0.0%) | 0 (0.0%) |
| Professional & Scientific | 0 (0.0%) | 0 (0.0%) |
| Enterprise Management | 0 (0.0%) | 0 (0.0%) |
| Administrative & Support | 12 (18.8%) | 52 (81.2%) |
| Educational Services | 30 (34.1%) | 58 (65.9%) |
| Health Care & Social Assistance | 9 (10.3%) | 78 (89.7%) |
| Arts, Entertainment & Recreation | 148 (45.1%) | 180 (54.9%) |
| Accommodation & Food Services | 18 (15.1%) | 101 (84.9%) |
| Public Administration | 29 (100.0%) | 0 (0.0%) |
| Total | 621 (50.9%) | 600 (49.1%) |
Education in Tunica Resorts
School Enrollment in Tunica Resorts
The most common levels of schooling among the 459 students in Tunica Resorts are kindergarten (118 | 25.7%), college / undergraduate (115 | 25.1%), and high school (82 | 17.9%).
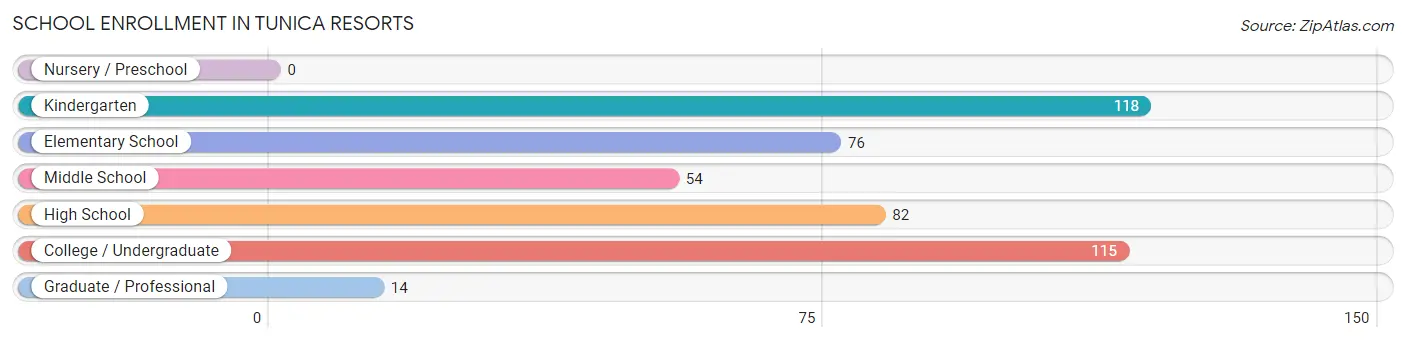
| School Level | # Students | % Students |
| Nursery / Preschool | 0 | 0.0% |
| Kindergarten | 118 | 25.7% |
| Elementary School | 76 | 16.6% |
| Middle School | 54 | 11.8% |
| High School | 82 | 17.9% |
| College / Undergraduate | 115 | 25.1% |
| Graduate / Professional | 14 | 3.0% |
| Total | 459 | 100.0% |
School Enrollment by Age by Funding Source in Tunica Resorts
Out of a total of 459 students who are enrolled in schools in Tunica Resorts, 32 (7.0%) attend a private institution, while the remaining 427 (93.0%) are enrolled in public schools. The age group of 35 years and over has the highest likelihood of being enrolled in private schools, with 32 (52.5% in the age bracket) enrolled. Conversely, the age group of 5 to 9 year old has the lowest likelihood of being enrolled in a private school, with 194 (100.0% in the age bracket) attending a public institution.
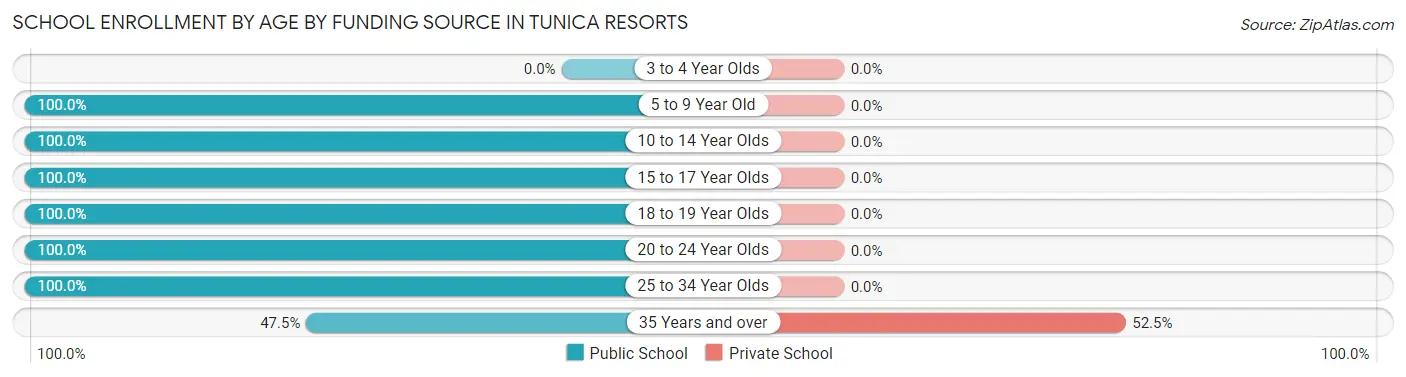
| Age Bracket | Public School | Private School |
| 3 to 4 Year Olds | 0 (0.0%) | 0 (0.0%) |
| 5 to 9 Year Old | 194 (100.0%) | 0 (0.0%) |
| 10 to 14 Year Olds | 54 (100.0%) | 0 (0.0%) |
| 15 to 17 Year Olds | 64 (100.0%) | 0 (0.0%) |
| 18 to 19 Year Olds | 18 (100.0%) | 0 (0.0%) |
| 20 to 24 Year Olds | 36 (100.0%) | 0 (0.0%) |
| 25 to 34 Year Olds | 32 (100.0%) | 0 (0.0%) |
| 35 Years and over | 29 (47.5%) | 32 (52.5%) |
| Total | 427 (93.0%) | 32 (7.0%) |
Educational Attainment by Field of Study in Tunica Resorts
Arts & humanities (97 | 37.6%), business (70 | 27.1%), communications (40 | 15.5%), liberal arts & history (28 | 10.8%), and education (12 | 4.6%) are the most common fields of study among 258 individuals in Tunica Resorts who have obtained a bachelor's degree or higher.
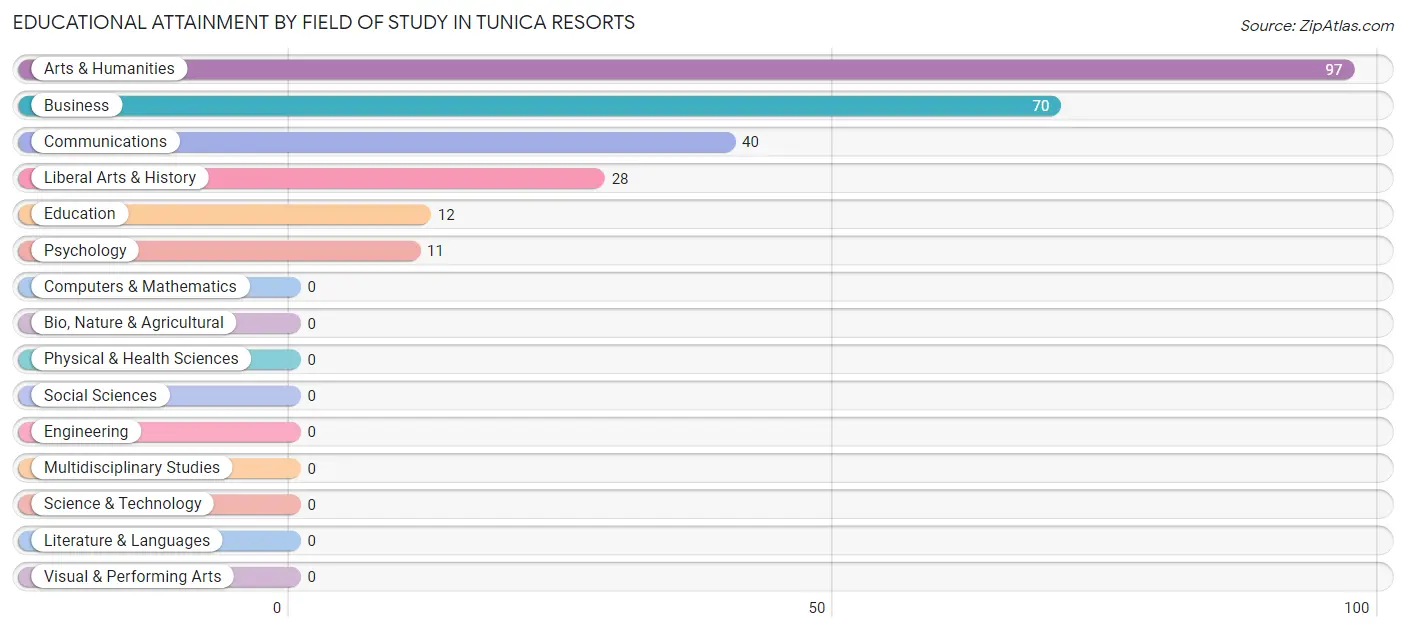
| Field of Study | # Graduates | % Graduates |
| Computers & Mathematics | 0 | 0.0% |
| Bio, Nature & Agricultural | 0 | 0.0% |
| Physical & Health Sciences | 0 | 0.0% |
| Psychology | 11 | 4.3% |
| Social Sciences | 0 | 0.0% |
| Engineering | 0 | 0.0% |
| Multidisciplinary Studies | 0 | 0.0% |
| Science & Technology | 0 | 0.0% |
| Business | 70 | 27.1% |
| Education | 12 | 4.6% |
| Literature & Languages | 0 | 0.0% |
| Liberal Arts & History | 28 | 10.8% |
| Visual & Performing Arts | 0 | 0.0% |
| Communications | 40 | 15.5% |
| Arts & Humanities | 97 | 37.6% |
| Total | 258 | 100.0% |
Transportation & Commute in Tunica Resorts
Vehicle Availability by Sex in Tunica Resorts
The most prevalent vehicle ownership categories in Tunica Resorts are males with 1 vehicle (227, accounting for 38.7%) and females with 1 vehicle (118, making up 37.8%).
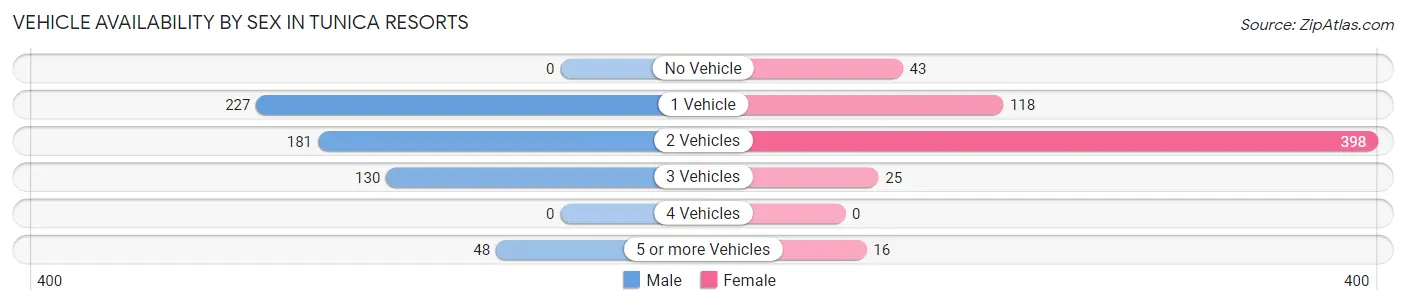
| Vehicles Available | Male | Female |
| No Vehicle | 0 (0.0%) | 43 (7.2%) |
| 1 Vehicle | 227 (38.7%) | 118 (19.7%) |
| 2 Vehicles | 181 (30.9%) | 398 (66.3%) |
| 3 Vehicles | 130 (22.2%) | 25 (4.2%) |
| 4 Vehicles | 0 (0.0%) | 0 (0.0%) |
| 5 or more Vehicles | 48 (8.2%) | 16 (2.7%) |
| Total | 586 (100.0%) | 600 (100.0%) |
Commute Time in Tunica Resorts
The most frequently occuring commute durations in Tunica Resorts are 30 to 34 minutes (310 commuters, 26.4%), 90 or more minutes (132 commuters, 11.2%), and 5 to 9 minutes (117 commuters, 10.0%).
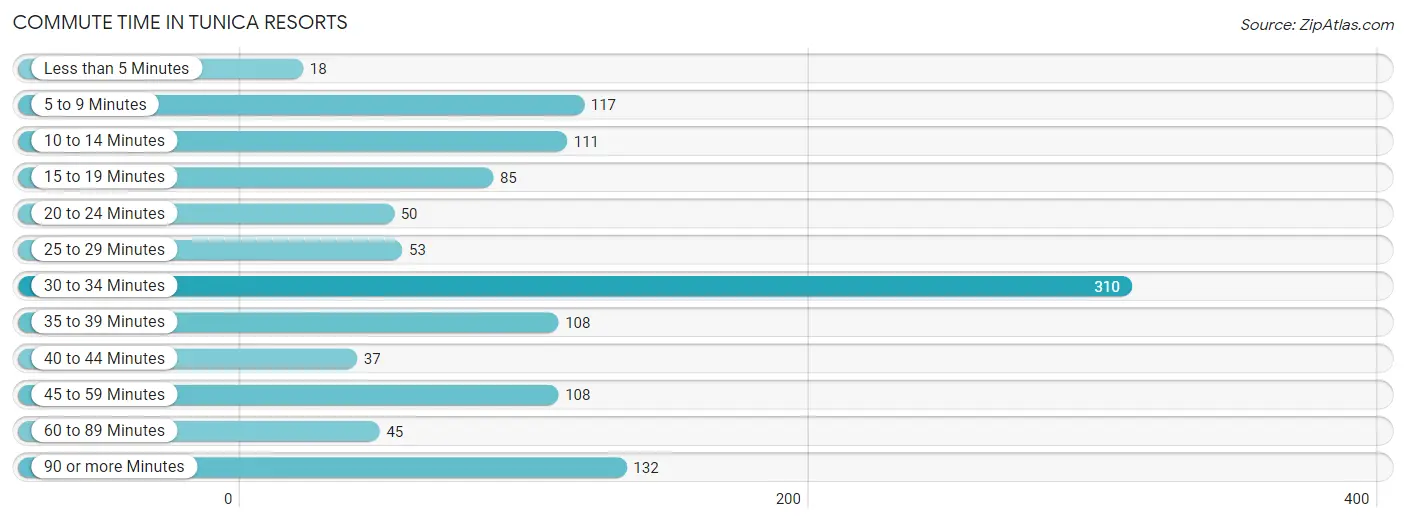
| Commute Time | # Commuters | % Commuters |
| Less than 5 Minutes | 18 | 1.5% |
| 5 to 9 Minutes | 117 | 10.0% |
| 10 to 14 Minutes | 111 | 9.5% |
| 15 to 19 Minutes | 85 | 7.2% |
| 20 to 24 Minutes | 50 | 4.3% |
| 25 to 29 Minutes | 53 | 4.5% |
| 30 to 34 Minutes | 310 | 26.4% |
| 35 to 39 Minutes | 108 | 9.2% |
| 40 to 44 Minutes | 37 | 3.2% |
| 45 to 59 Minutes | 108 | 9.2% |
| 60 to 89 Minutes | 45 | 3.8% |
| 90 or more Minutes | 132 | 11.2% |
Commute Time by Sex in Tunica Resorts
The most common commute times in Tunica Resorts are 30 to 34 minutes (101 commuters, 17.6%) for males and 30 to 34 minutes (209 commuters, 34.8%) for females.
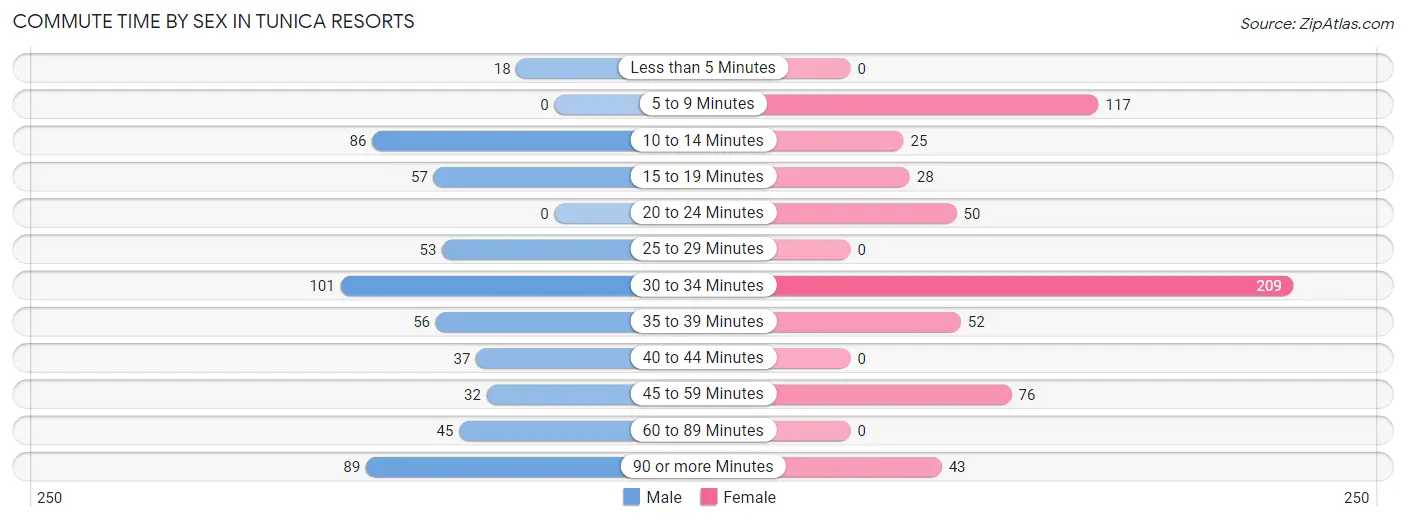
| Commute Time | Male | Female |
| Less than 5 Minutes | 18 (3.1%) | 0 (0.0%) |
| 5 to 9 Minutes | 0 (0.0%) | 117 (19.5%) |
| 10 to 14 Minutes | 86 (15.0%) | 25 (4.2%) |
| 15 to 19 Minutes | 57 (9.9%) | 28 (4.7%) |
| 20 to 24 Minutes | 0 (0.0%) | 50 (8.3%) |
| 25 to 29 Minutes | 53 (9.2%) | 0 (0.0%) |
| 30 to 34 Minutes | 101 (17.6%) | 209 (34.8%) |
| 35 to 39 Minutes | 56 (9.8%) | 52 (8.7%) |
| 40 to 44 Minutes | 37 (6.5%) | 0 (0.0%) |
| 45 to 59 Minutes | 32 (5.6%) | 76 (12.7%) |
| 60 to 89 Minutes | 45 (7.8%) | 0 (0.0%) |
| 90 or more Minutes | 89 (15.5%) | 43 (7.2%) |
Time of Departure to Work by Sex in Tunica Resorts
The most frequent times of departure to work in Tunica Resorts are 8:00 AM to 8:29 AM (163, 28.4%) for males and 12:00 AM to 4:59 AM (134, 22.3%) for females.
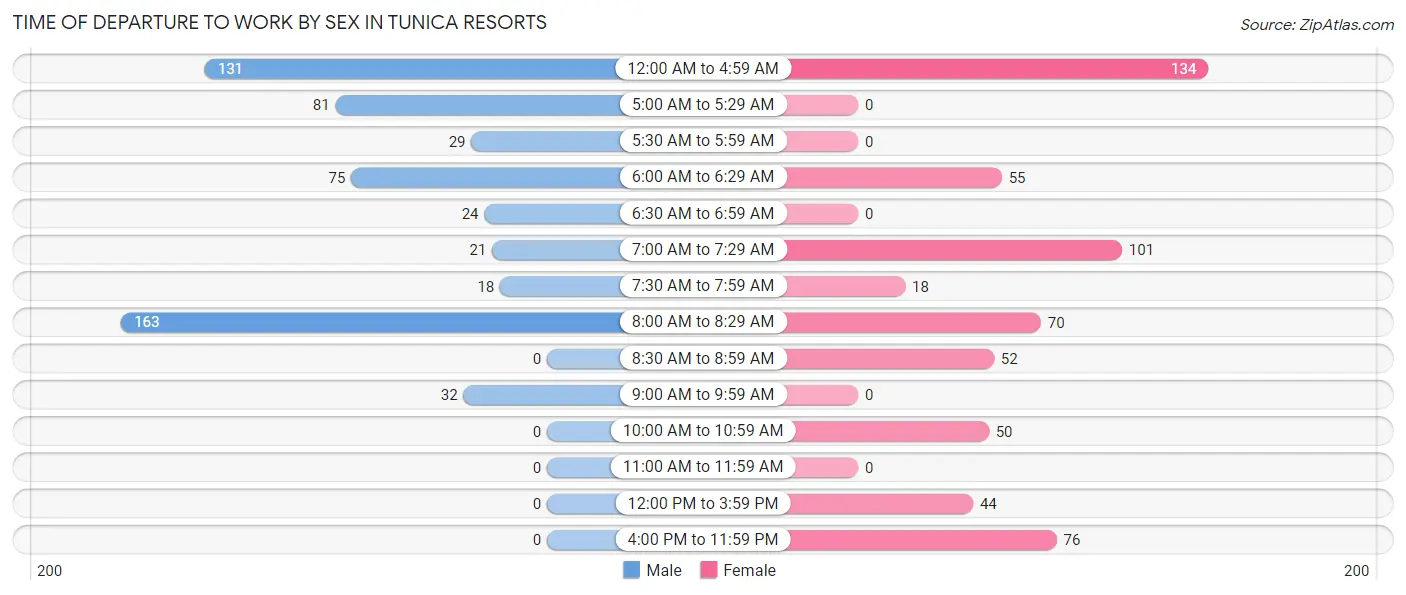
| Time of Departure | Male | Female |
| 12:00 AM to 4:59 AM | 131 (22.8%) | 134 (22.3%) |
| 5:00 AM to 5:29 AM | 81 (14.1%) | 0 (0.0%) |
| 5:30 AM to 5:59 AM | 29 (5.1%) | 0 (0.0%) |
| 6:00 AM to 6:29 AM | 75 (13.1%) | 55 (9.2%) |
| 6:30 AM to 6:59 AM | 24 (4.2%) | 0 (0.0%) |
| 7:00 AM to 7:29 AM | 21 (3.7%) | 101 (16.8%) |
| 7:30 AM to 7:59 AM | 18 (3.1%) | 18 (3.0%) |
| 8:00 AM to 8:29 AM | 163 (28.4%) | 70 (11.7%) |
| 8:30 AM to 8:59 AM | 0 (0.0%) | 52 (8.7%) |
| 9:00 AM to 9:59 AM | 32 (5.6%) | 0 (0.0%) |
| 10:00 AM to 10:59 AM | 0 (0.0%) | 50 (8.3%) |
| 11:00 AM to 11:59 AM | 0 (0.0%) | 0 (0.0%) |
| 12:00 PM to 3:59 PM | 0 (0.0%) | 44 (7.3%) |
| 4:00 PM to 11:59 PM | 0 (0.0%) | 76 (12.7%) |
| Total | 574 (100.0%) | 600 (100.0%) |
Housing Occupancy in Tunica Resorts
Occupancy by Ownership in Tunica Resorts
Of the total 915 dwellings in Tunica Resorts, owner-occupied units account for 101 (11.0%), while renter-occupied units make up 814 (89.0%).
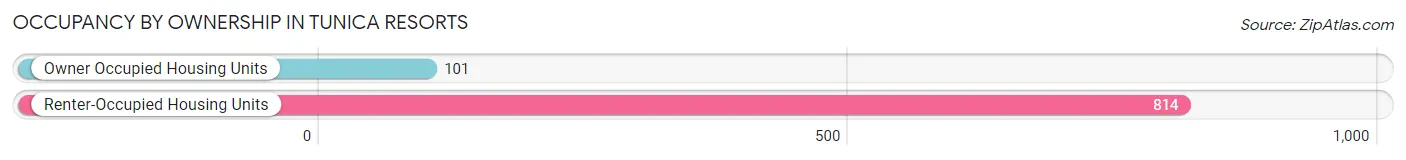
| Occupancy | # Housing Units | % Housing Units |
| Owner Occupied Housing Units | 101 | 11.0% |
| Renter-Occupied Housing Units | 814 | 89.0% |
| Total Occupied Housing Units | 915 | 100.0% |
Occupancy by Household Size in Tunica Resorts
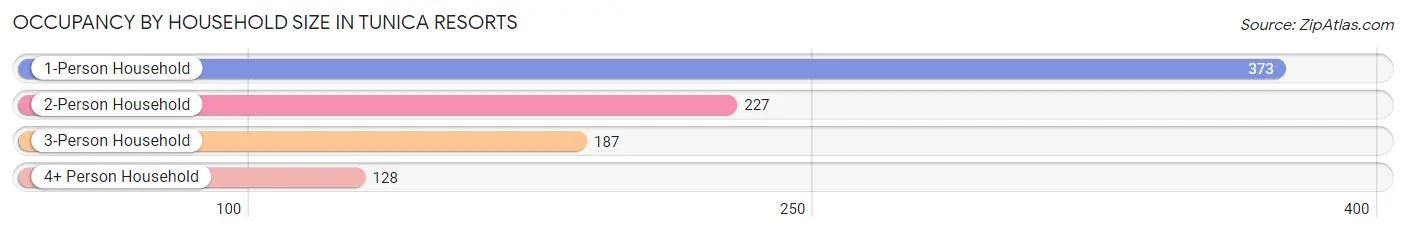
| Household Size | # Housing Units | % Housing Units |
| 1-Person Household | 373 | 40.8% |
| 2-Person Household | 227 | 24.8% |
| 3-Person Household | 187 | 20.4% |
| 4+ Person Household | 128 | 14.0% |
| Total Housing Units | 915 | 100.0% |
Occupancy by Ownership by Household Size in Tunica Resorts
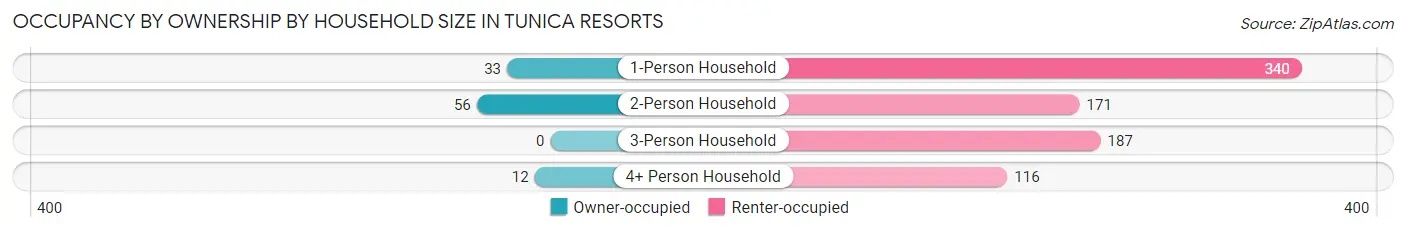
| Household Size | Owner-occupied | Renter-occupied |
| 1-Person Household | 33 (8.8%) | 340 (91.1%) |
| 2-Person Household | 56 (24.7%) | 171 (75.3%) |
| 3-Person Household | 0 (0.0%) | 187 (100.0%) |
| 4+ Person Household | 12 (9.4%) | 116 (90.6%) |
| Total Housing Units | 101 (11.0%) | 814 (89.0%) |
Occupancy by Educational Attainment in Tunica Resorts
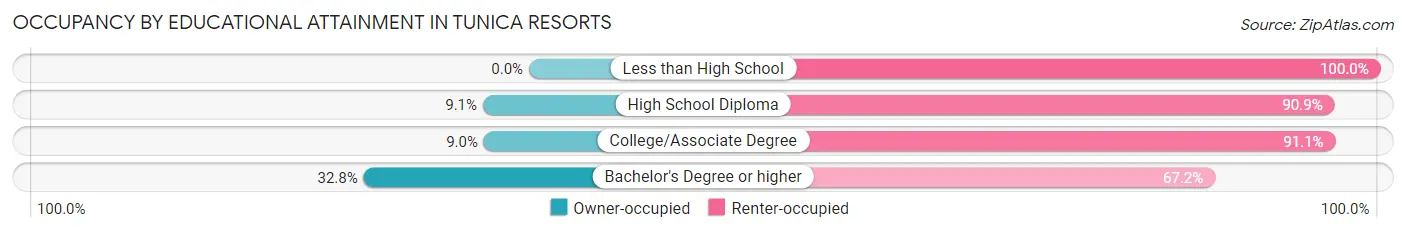
| Household Size | Owner-occupied | Renter-occupied |
| Less than High School | 0 (0.0%) | 127 (100.0%) |
| High School Diploma | 32 (9.1%) | 318 (90.9%) |
| College/Associate Degree | 28 (8.9%) | 285 (91.0%) |
| Bachelor's Degree or higher | 41 (32.8%) | 84 (67.2%) |
Occupancy by Age of Householder in Tunica Resorts

| Age Bracket | # Households | % Households |
| Under 35 Years | 474 | 51.8% |
| 35 to 44 Years | 78 | 8.5% |
| 45 to 54 Years | 114 | 12.5% |
| 55 to 64 Years | 109 | 11.9% |
| 65 to 74 Years | 81 | 8.8% |
| 75 to 84 Years | 59 | 6.5% |
| 85 Years and Over | 0 | 0.0% |
| Total | 915 | 100.0% |
Housing Finances in Tunica Resorts
Median Income by Occupancy in Tunica Resorts
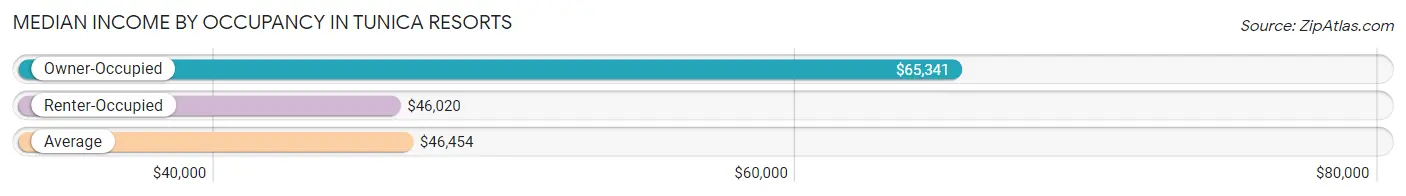
| Occupancy Type | # Households | Median Income |
| Owner-Occupied | 101 (11.0%) | $65,341 |
| Renter-Occupied | 814 (89.0%) | $46,020 |
| Average | 915 (100.0%) | $46,454 |
Occupancy by Householder Income Bracket in Tunica Resorts
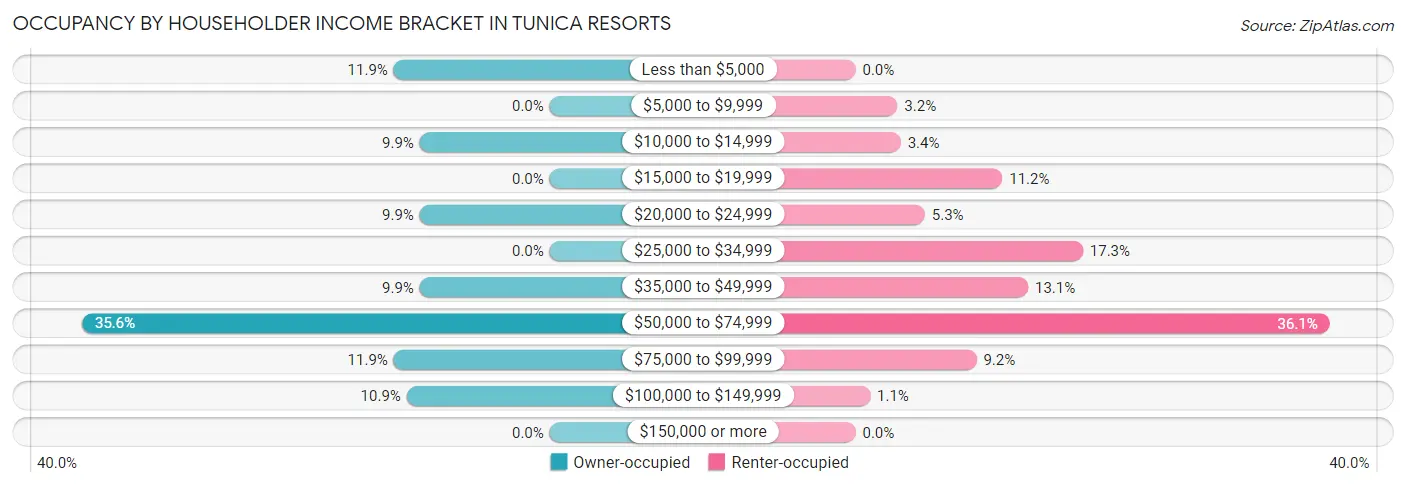
| Income Bracket | Owner-occupied | Renter-occupied |
| Less than $5,000 | 12 (11.9%) | 0 (0.0%) |
| $5,000 to $9,999 | 0 (0.0%) | 26 (3.2%) |
| $10,000 to $14,999 | 10 (9.9%) | 28 (3.4%) |
| $15,000 to $19,999 | 0 (0.0%) | 91 (11.2%) |
| $20,000 to $24,999 | 10 (9.9%) | 43 (5.3%) |
| $25,000 to $34,999 | 0 (0.0%) | 141 (17.3%) |
| $35,000 to $49,999 | 10 (9.9%) | 107 (13.1%) |
| $50,000 to $74,999 | 36 (35.6%) | 294 (36.1%) |
| $75,000 to $99,999 | 12 (11.9%) | 75 (9.2%) |
| $100,000 to $149,999 | 11 (10.9%) | 9 (1.1%) |
| $150,000 or more | 0 (0.0%) | 0 (0.0%) |
| Total | 101 (100.0%) | 814 (100.0%) |
Monthly Housing Cost Tiers in Tunica Resorts
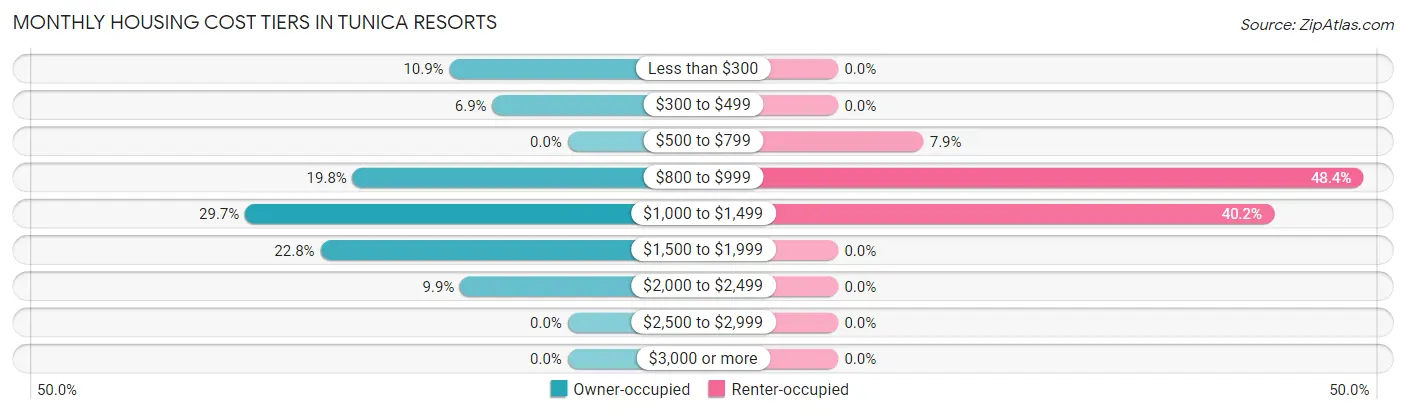
| Monthly Cost | Owner-occupied | Renter-occupied |
| Less than $300 | 11 (10.9%) | 0 (0.0%) |
| $300 to $499 | 7 (6.9%) | 0 (0.0%) |
| $500 to $799 | 0 (0.0%) | 64 (7.9%) |
| $800 to $999 | 20 (19.8%) | 394 (48.4%) |
| $1,000 to $1,499 | 30 (29.7%) | 327 (40.2%) |
| $1,500 to $1,999 | 23 (22.8%) | 0 (0.0%) |
| $2,000 to $2,499 | 10 (9.9%) | 0 (0.0%) |
| $2,500 to $2,999 | 0 (0.0%) | 0 (0.0%) |
| $3,000 or more | 0 (0.0%) | 0 (0.0%) |
| Total | 101 (100.0%) | 814 (100.0%) |
Physical Housing Characteristics in Tunica Resorts
Housing Structures in Tunica Resorts
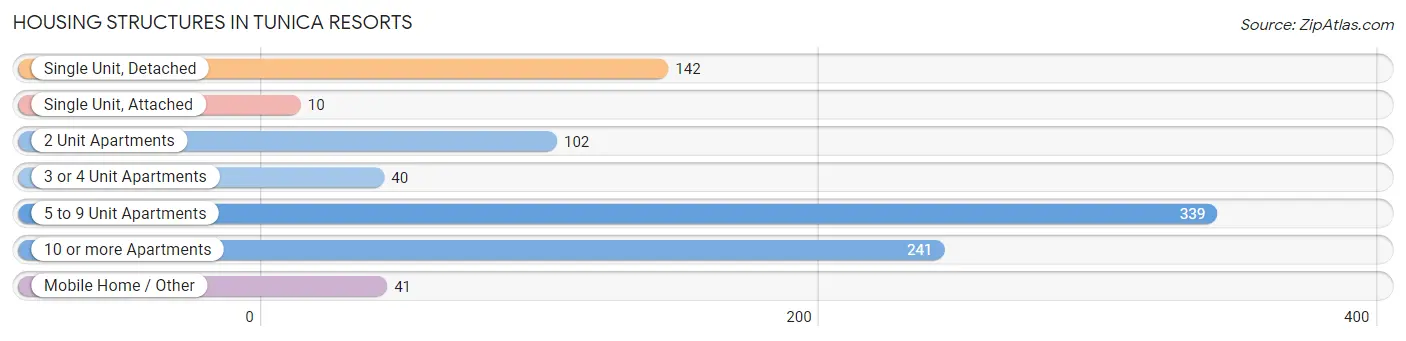
| Structure Type | # Housing Units | % Housing Units |
| Single Unit, Detached | 142 | 15.5% |
| Single Unit, Attached | 10 | 1.1% |
| 2 Unit Apartments | 102 | 11.2% |
| 3 or 4 Unit Apartments | 40 | 4.4% |
| 5 to 9 Unit Apartments | 339 | 37.0% |
| 10 or more Apartments | 241 | 26.3% |
| Mobile Home / Other | 41 | 4.5% |
| Total | 915 | 100.0% |
Housing Structures by Occupancy in Tunica Resorts
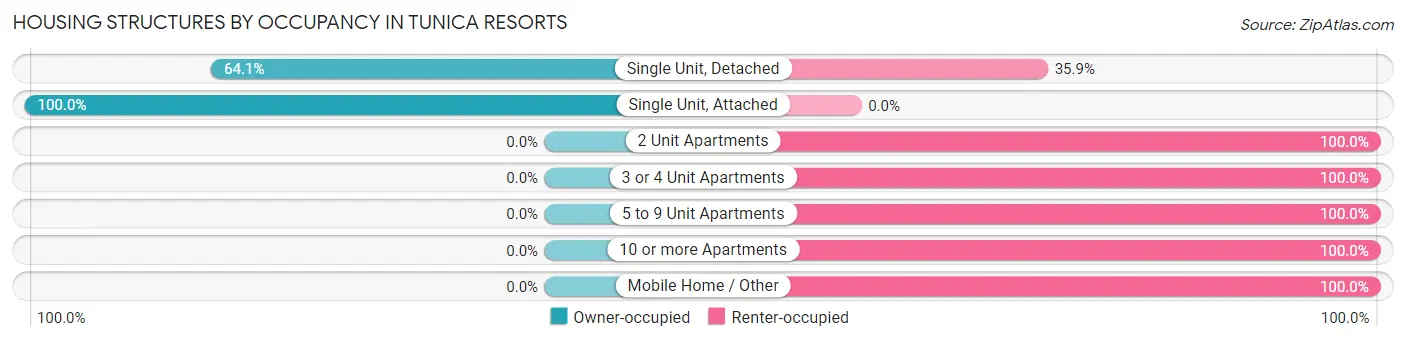
| Structure Type | Owner-occupied | Renter-occupied |
| Single Unit, Detached | 91 (64.1%) | 51 (35.9%) |
| Single Unit, Attached | 10 (100.0%) | 0 (0.0%) |
| 2 Unit Apartments | 0 (0.0%) | 102 (100.0%) |
| 3 or 4 Unit Apartments | 0 (0.0%) | 40 (100.0%) |
| 5 to 9 Unit Apartments | 0 (0.0%) | 339 (100.0%) |
| 10 or more Apartments | 0 (0.0%) | 241 (100.0%) |
| Mobile Home / Other | 0 (0.0%) | 41 (100.0%) |
| Total | 101 (11.0%) | 814 (89.0%) |
Housing Structures by Number of Rooms in Tunica Resorts
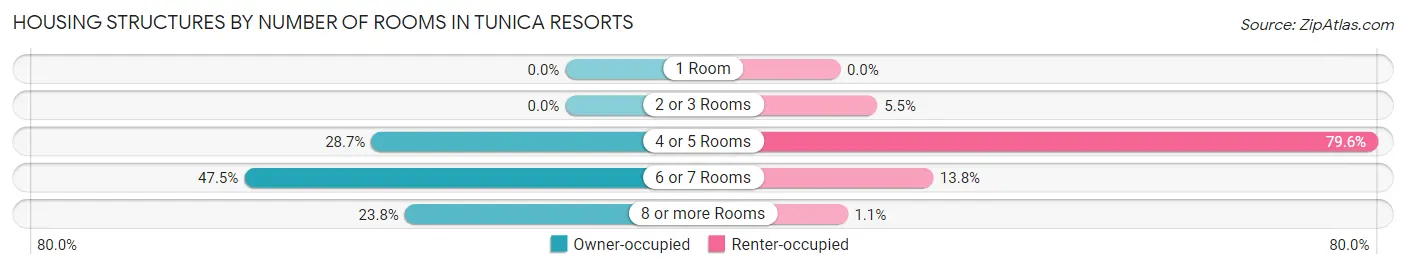
| Number of Rooms | Owner-occupied | Renter-occupied |
| 1 Room | 0 (0.0%) | 0 (0.0%) |
| 2 or 3 Rooms | 0 (0.0%) | 45 (5.5%) |
| 4 or 5 Rooms | 29 (28.7%) | 648 (79.6%) |
| 6 or 7 Rooms | 48 (47.5%) | 112 (13.8%) |
| 8 or more Rooms | 24 (23.8%) | 9 (1.1%) |
| Total | 101 (100.0%) | 814 (100.0%) |
Housing Structure by Heating Type in Tunica Resorts
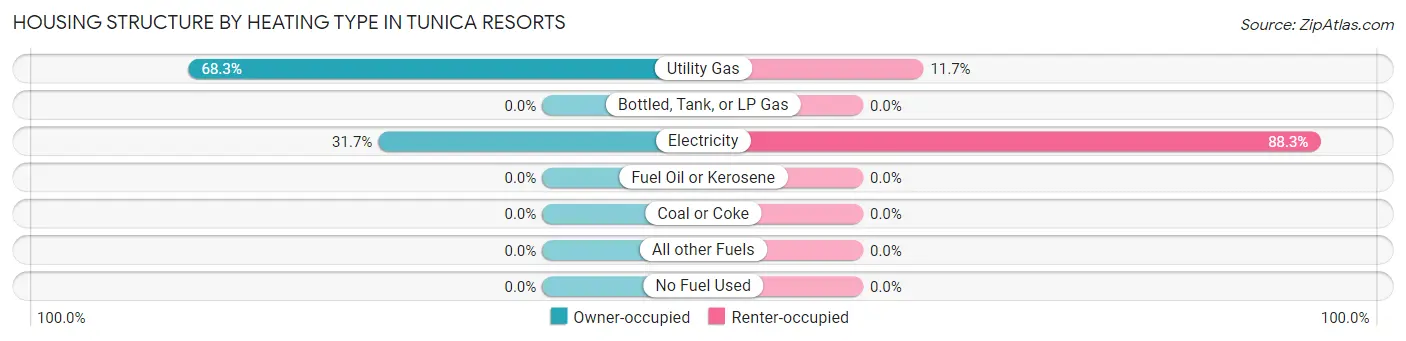
| Heating Type | Owner-occupied | Renter-occupied |
| Utility Gas | 69 (68.3%) | 95 (11.7%) |
| Bottled, Tank, or LP Gas | 0 (0.0%) | 0 (0.0%) |
| Electricity | 32 (31.7%) | 719 (88.3%) |
| Fuel Oil or Kerosene | 0 (0.0%) | 0 (0.0%) |
| Coal or Coke | 0 (0.0%) | 0 (0.0%) |
| All other Fuels | 0 (0.0%) | 0 (0.0%) |
| No Fuel Used | 0 (0.0%) | 0 (0.0%) |
| Total | 101 (100.0%) | 814 (100.0%) |
Household Vehicle Usage in Tunica Resorts
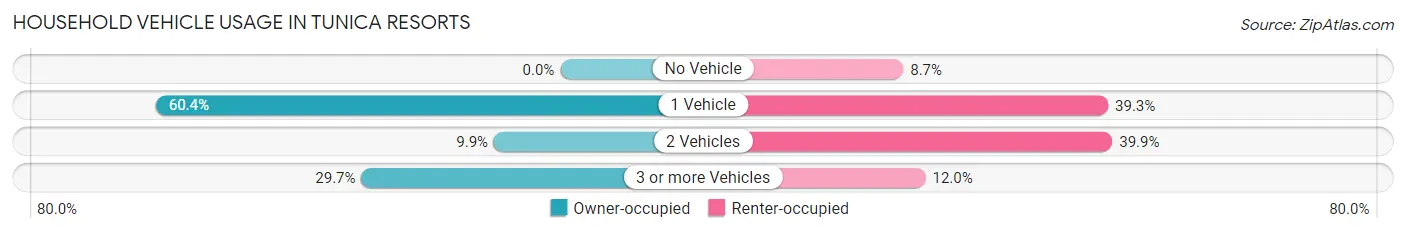
| Vehicles per Household | Owner-occupied | Renter-occupied |
| No Vehicle | 0 (0.0%) | 71 (8.7%) |
| 1 Vehicle | 61 (60.4%) | 320 (39.3%) |
| 2 Vehicles | 10 (9.9%) | 325 (39.9%) |
| 3 or more Vehicles | 30 (29.7%) | 98 (12.0%) |
| Total | 101 (100.0%) | 814 (100.0%) |
Real Estate & Mortgages in Tunica Resorts
Real Estate and Mortgage Overview in Tunica Resorts
| Characteristic | Without Mortgage | With Mortgage |
| Housing Units | 18 | 83 |
| Median Property Value | - | - |
| Median Household Income | - | - |
| Monthly Housing Costs | - | - |
| Real Estate Taxes | - | - |
Property Value by Mortgage Status in Tunica Resorts
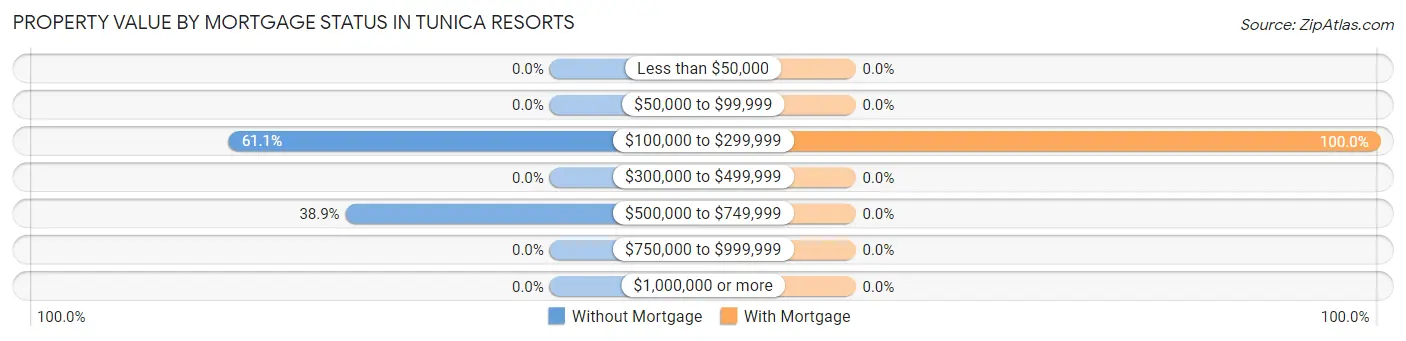
| Property Value | Without Mortgage | With Mortgage |
| Less than $50,000 | 0 (0.0%) | 0 (0.0%) |
| $50,000 to $99,999 | 0 (0.0%) | 0 (0.0%) |
| $100,000 to $299,999 | 11 (61.1%) | 83 (100.0%) |
| $300,000 to $499,999 | 0 (0.0%) | 0 (0.0%) |
| $500,000 to $749,999 | 7 (38.9%) | 0 (0.0%) |
| $750,000 to $999,999 | 0 (0.0%) | 0 (0.0%) |
| $1,000,000 or more | 0 (0.0%) | 0 (0.0%) |
| Total | 18 (100.0%) | 83 (100.0%) |
Household Income by Mortgage Status in Tunica Resorts
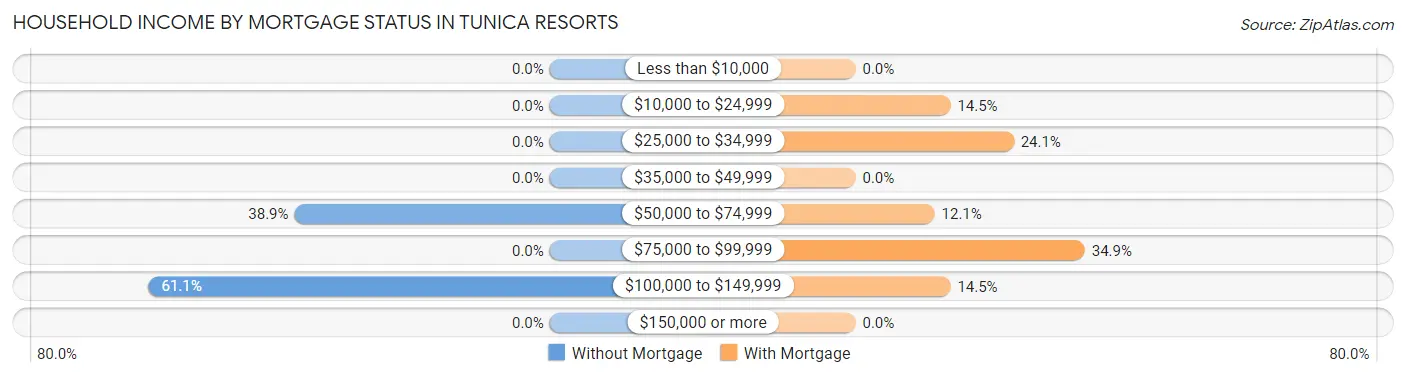
| Household Income | Without Mortgage | With Mortgage |
| Less than $10,000 | 0 (0.0%) | 0 (0.0%) |
| $10,000 to $24,999 | 0 (0.0%) | 12 (14.5%) |
| $25,000 to $34,999 | 0 (0.0%) | 20 (24.1%) |
| $35,000 to $49,999 | 0 (0.0%) | 0 (0.0%) |
| $50,000 to $74,999 | 7 (38.9%) | 10 (12.0%) |
| $75,000 to $99,999 | 0 (0.0%) | 29 (34.9%) |
| $100,000 to $149,999 | 11 (61.1%) | 12 (14.5%) |
| $150,000 or more | 0 (0.0%) | 0 (0.0%) |
| Total | 18 (100.0%) | 83 (100.0%) |
Property Value to Household Income Ratio in Tunica Resorts
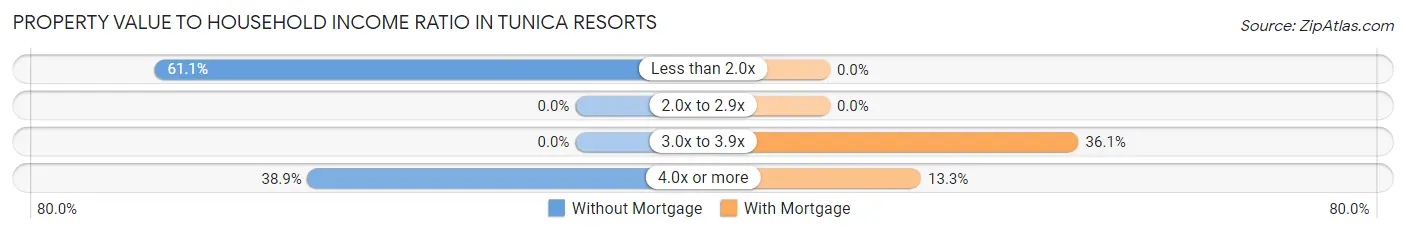
| Value-to-Income Ratio | Without Mortgage | With Mortgage |
| Less than 2.0x | 11 (61.1%) | 0 (0.0%) |
| 2.0x to 2.9x | 0 (0.0%) | 0 (0.0%) |
| 3.0x to 3.9x | 0 (0.0%) | 30 (36.1%) |
| 4.0x or more | 7 (38.9%) | 11 (13.3%) |
| Total | 18 (100.0%) | 83 (100.0%) |
Real Estate Taxes by Mortgage Status in Tunica Resorts
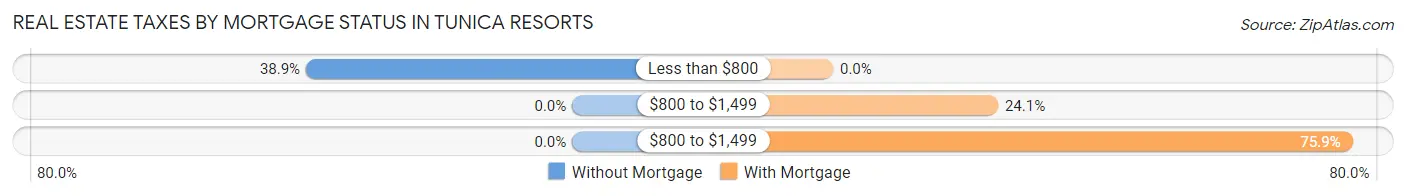
| Property Taxes | Without Mortgage | With Mortgage |
| Less than $800 | 7 (38.9%) | 0 (0.0%) |
| $800 to $1,499 | 0 (0.0%) | 20 (24.1%) |
| $800 to $1,499 | 0 (0.0%) | 63 (75.9%) |
| Total | 18 (100.0%) | 83 (100.0%) |
Health & Disability in Tunica Resorts
Health Insurance Coverage by Age in Tunica Resorts
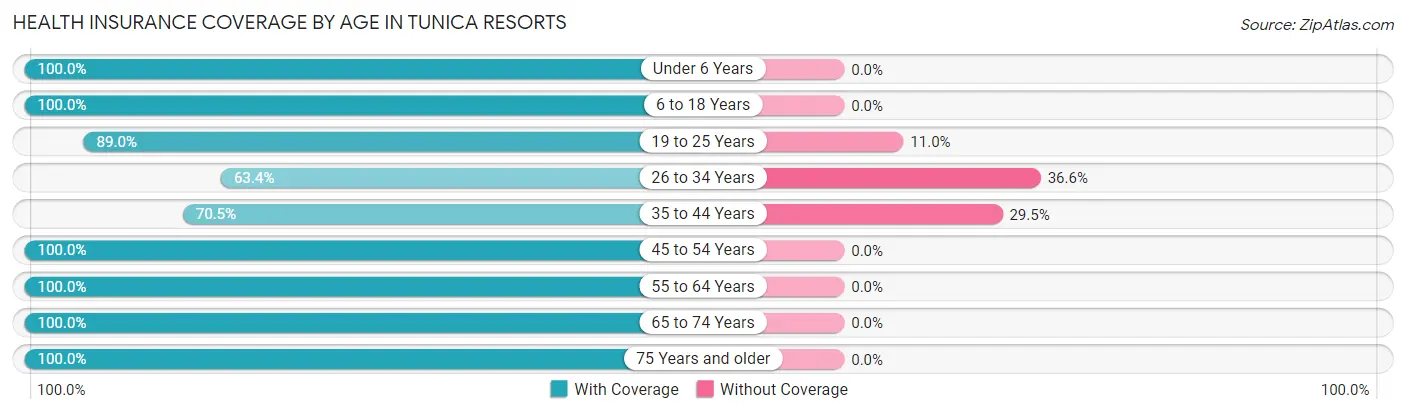
| Age Bracket | With Coverage | Without Coverage |
| Under 6 Years | 227 (100.0%) | 0 (0.0%) |
| 6 to 18 Years | 281 (100.0%) | 0 (0.0%) |
| 19 to 25 Years | 105 (89.0%) | 13 (11.0%) |
| 26 to 34 Years | 455 (63.4%) | 263 (36.6%) |
| 35 to 44 Years | 196 (70.5%) | 82 (29.5%) |
| 45 to 54 Years | 114 (100.0%) | 0 (0.0%) |
| 55 to 64 Years | 194 (100.0%) | 0 (0.0%) |
| 65 to 74 Years | 107 (100.0%) | 0 (0.0%) |
| 75 Years and older | 59 (100.0%) | 0 (0.0%) |
| Total | 1,738 (82.9%) | 358 (17.1%) |
Health Insurance Coverage by Citizenship Status in Tunica Resorts
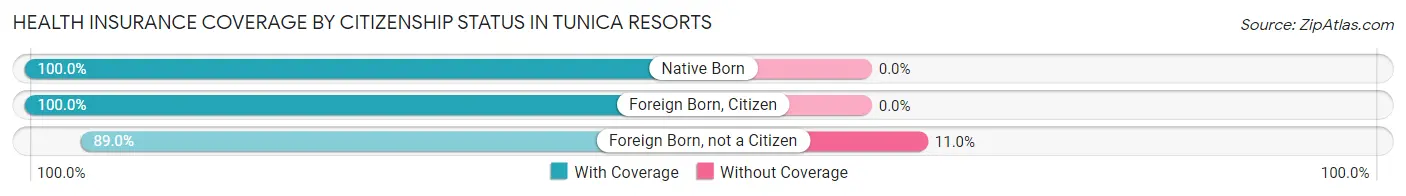
| Citizenship Status | With Coverage | Without Coverage |
| Native Born | 227 (100.0%) | 0 (0.0%) |
| Foreign Born, Citizen | 281 (100.0%) | 0 (0.0%) |
| Foreign Born, not a Citizen | 105 (89.0%) | 13 (11.0%) |
Health Insurance Coverage by Household Income in Tunica Resorts
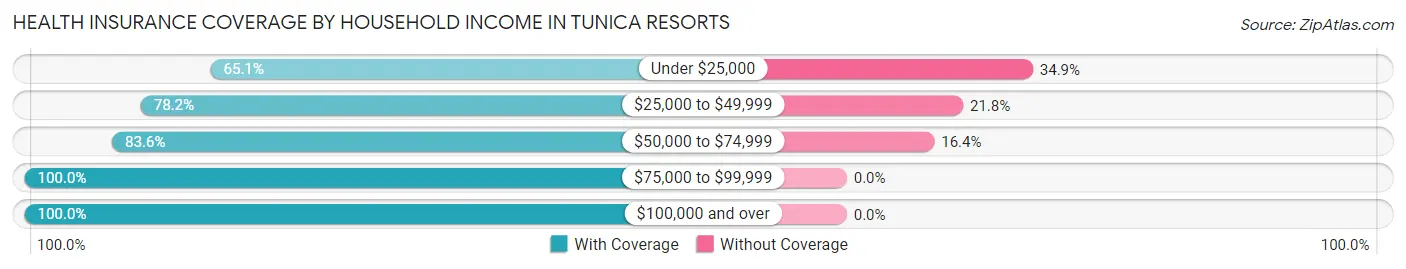
| Household Income | With Coverage | Without Coverage |
| Under $25,000 | 185 (65.1%) | 99 (34.9%) |
| $25,000 to $49,999 | 334 (78.2%) | 93 (21.8%) |
| $50,000 to $74,999 | 846 (83.6%) | 166 (16.4%) |
| $75,000 to $99,999 | 307 (100.0%) | 0 (0.0%) |
| $100,000 and over | 66 (100.0%) | 0 (0.0%) |
Public vs Private Health Insurance Coverage by Age in Tunica Resorts
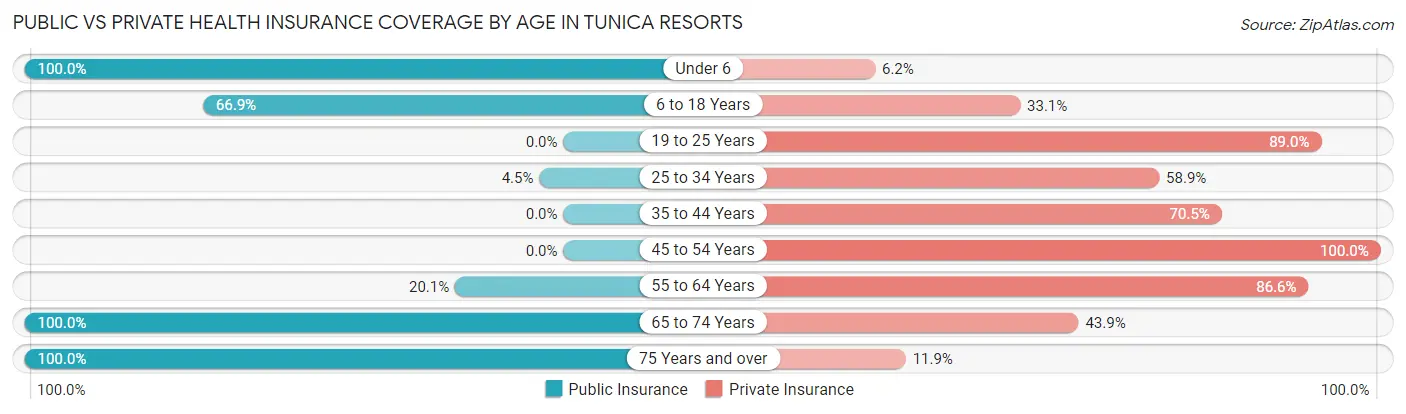
| Age Bracket | Public Insurance | Private Insurance |
| Under 6 | 227 (100.0%) | 14 (6.2%) |
| 6 to 18 Years | 188 (66.9%) | 93 (33.1%) |
| 19 to 25 Years | 0 (0.0%) | 105 (89.0%) |
| 25 to 34 Years | 32 (4.5%) | 423 (58.9%) |
| 35 to 44 Years | 0 (0.0%) | 196 (70.5%) |
| 45 to 54 Years | 0 (0.0%) | 114 (100.0%) |
| 55 to 64 Years | 39 (20.1%) | 168 (86.6%) |
| 65 to 74 Years | 107 (100.0%) | 47 (43.9%) |
| 75 Years and over | 59 (100.0%) | 7 (11.9%) |
| Total | 652 (31.1%) | 1,167 (55.7%) |
Disability Status by Sex by Age in Tunica Resorts
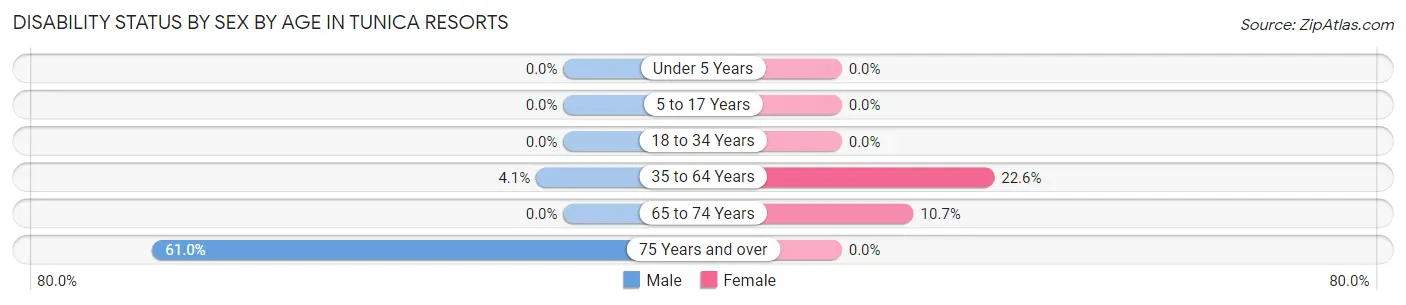
| Age Bracket | Male | Female |
| Under 5 Years | 0 (0.0%) | 0 (0.0%) |
| 5 to 17 Years | 0 (0.0%) | 0 (0.0%) |
| 18 to 34 Years | 0 (0.0%) | 0 (0.0%) |
| 35 to 64 Years | 13 (4.1%) | 60 (22.6%) |
| 65 to 74 Years | 0 (0.0%) | 8 (10.7%) |
| 75 Years and over | 36 (61.0%) | 0 (0.0%) |
Disability Class by Sex by Age in Tunica Resorts
Disability Class: Hearing Difficulty
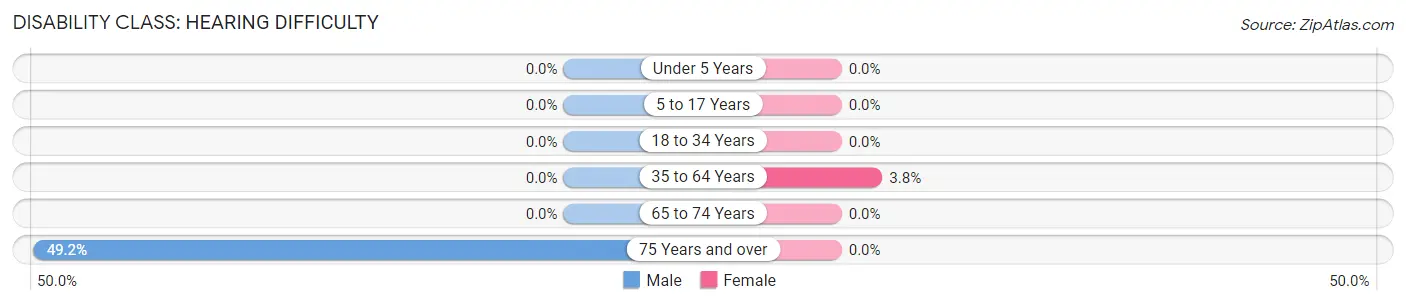
| Age Bracket | Male | Female |
| Under 5 Years | 0 (0.0%) | 0 (0.0%) |
| 5 to 17 Years | 0 (0.0%) | 0 (0.0%) |
| 18 to 34 Years | 0 (0.0%) | 0 (0.0%) |
| 35 to 64 Years | 0 (0.0%) | 10 (3.8%) |
| 65 to 74 Years | 0 (0.0%) | 0 (0.0%) |
| 75 Years and over | 29 (49.1%) | 0 (0.0%) |
Disability Class: Vision Difficulty
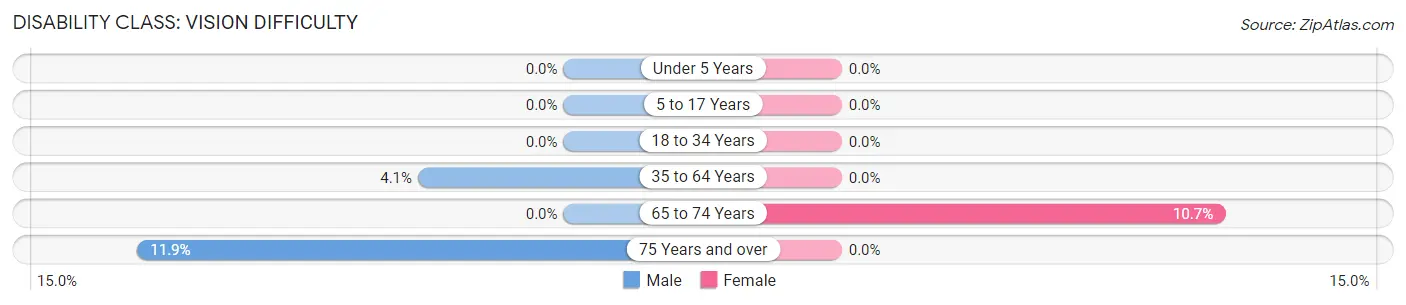
| Age Bracket | Male | Female |
| Under 5 Years | 0 (0.0%) | 0 (0.0%) |
| 5 to 17 Years | 0 (0.0%) | 0 (0.0%) |
| 18 to 34 Years | 0 (0.0%) | 0 (0.0%) |
| 35 to 64 Years | 13 (4.1%) | 0 (0.0%) |
| 65 to 74 Years | 0 (0.0%) | 8 (10.7%) |
| 75 Years and over | 7 (11.9%) | 0 (0.0%) |
Disability Class: Cognitive Difficulty
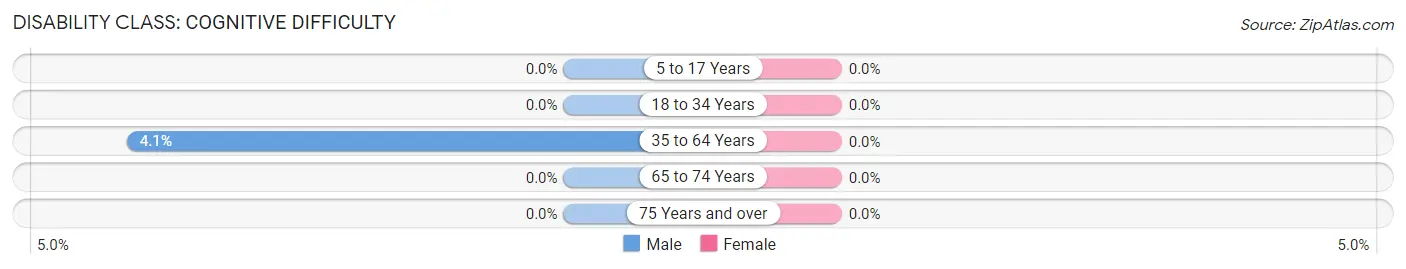
| Age Bracket | Male | Female |
| 5 to 17 Years | 0 (0.0%) | 0 (0.0%) |
| 18 to 34 Years | 0 (0.0%) | 0 (0.0%) |
| 35 to 64 Years | 13 (4.1%) | 0 (0.0%) |
| 65 to 74 Years | 0 (0.0%) | 0 (0.0%) |
| 75 Years and over | 0 (0.0%) | 0 (0.0%) |
Disability Class: Ambulatory Difficulty
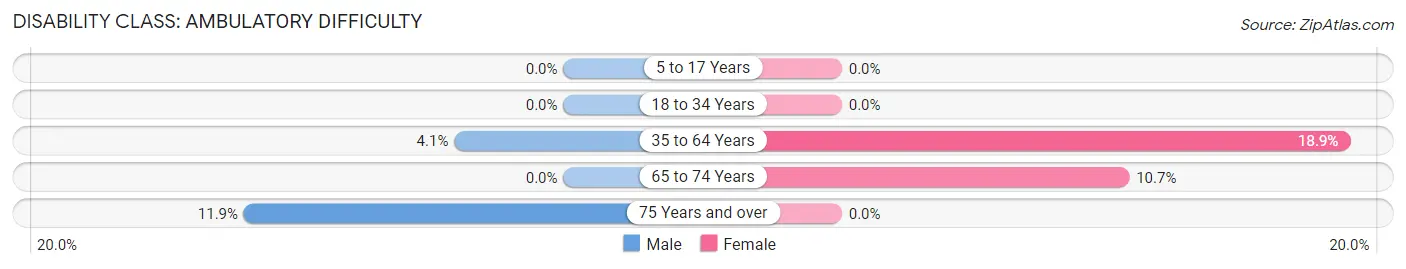
| Age Bracket | Male | Female |
| 5 to 17 Years | 0 (0.0%) | 0 (0.0%) |
| 18 to 34 Years | 0 (0.0%) | 0 (0.0%) |
| 35 to 64 Years | 13 (4.1%) | 50 (18.9%) |
| 65 to 74 Years | 0 (0.0%) | 8 (10.7%) |
| 75 Years and over | 7 (11.9%) | 0 (0.0%) |
Disability Class: Self-Care Difficulty
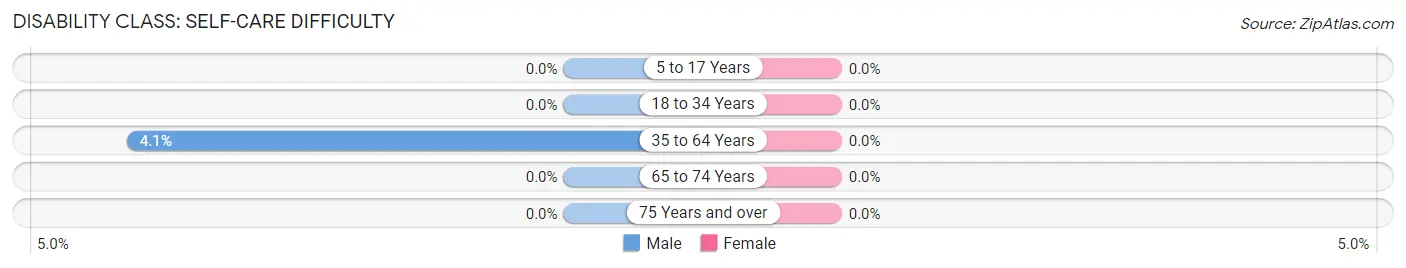
| Age Bracket | Male | Female |
| 5 to 17 Years | 0 (0.0%) | 0 (0.0%) |
| 18 to 34 Years | 0 (0.0%) | 0 (0.0%) |
| 35 to 64 Years | 13 (4.1%) | 0 (0.0%) |
| 65 to 74 Years | 0 (0.0%) | 0 (0.0%) |
| 75 Years and over | 0 (0.0%) | 0 (0.0%) |
Technology Access in Tunica Resorts
Computing Device Access in Tunica Resorts
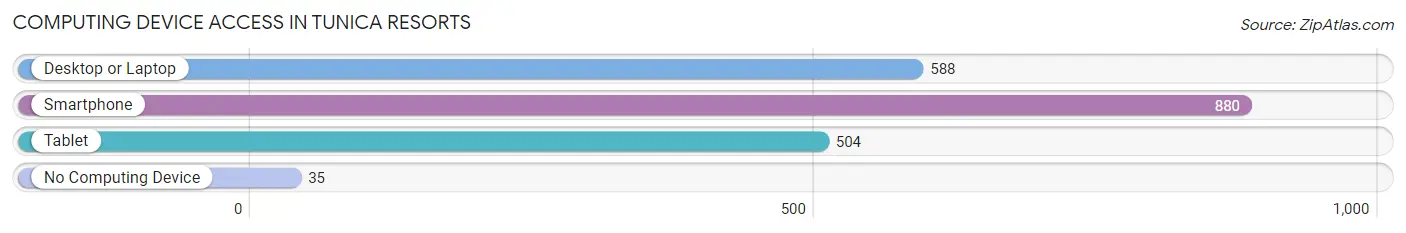
| Device Type | # Households | % Households |
| Desktop or Laptop | 588 | 64.3% |
| Smartphone | 880 | 96.2% |
| Tablet | 504 | 55.1% |
| No Computing Device | 35 | 3.8% |
| Total | 915 | 100.0% |
Internet Access in Tunica Resorts
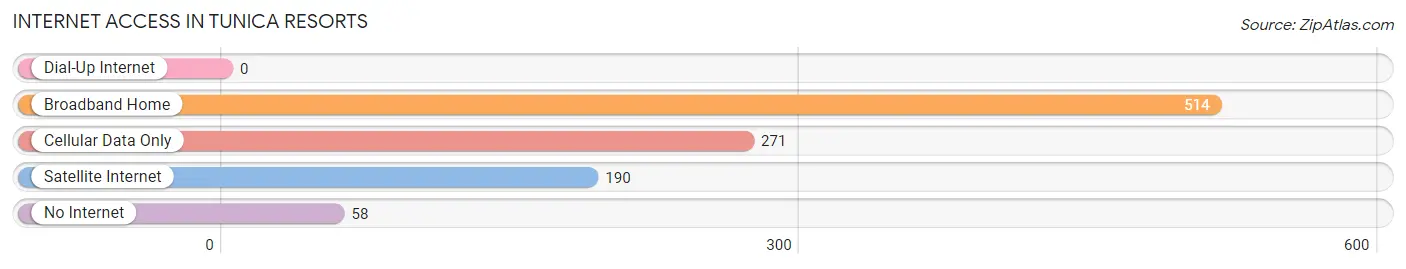
| Internet Type | # Households | % Households |
| Dial-Up Internet | 0 | 0.0% |
| Broadband Home | 514 | 56.2% |
| Cellular Data Only | 271 | 29.6% |
| Satellite Internet | 190 | 20.8% |
| No Internet | 58 | 6.3% |
| Total | 915 | 100.0% |
Tunica Resorts Summary
Tunica Resorts, Mississippi is a small town located in the northwest corner of the state, just south of Memphis, Tennessee. It is part of the larger Tunica County, which is home to a population of about 10,000 people. The town is known for its casinos, which have been a major source of economic growth in the area since the 1990s.
History
Tunica Resorts was first settled in the early 1800s by Native Americans, who were drawn to the area for its fertile soil and abundant wildlife. The town was officially founded in 1836, and was named after the Tunica tribe, which had inhabited the area for centuries. The town was initially a small farming community, but it began to grow in the late 19th century when the railroad was built through the area. This allowed for the development of the cotton industry, which became the main source of income for the town.
In the early 20th century, the town began to decline as the cotton industry moved away. The population dwindled, and the town was largely forgotten until the 1990s, when the first casino opened in the area. This sparked a new wave of economic growth, and the town quickly became a popular destination for tourists.
Geography
Tunica Resorts is located in the northwest corner of Mississippi, just south of Memphis, Tennessee. It is part of the larger Tunica County, which is home to a population of about 10,000 people. The town is situated on the banks of the Mississippi River, and is surrounded by lush forests and rolling hills. The climate is humid subtropical, with hot summers and mild winters.
Economy
The economy of Tunica Resorts is largely driven by tourism. The town is home to several casinos, which attract visitors from all over the country. These casinos provide jobs for many of the town’s residents, and they also generate a significant amount of revenue for the local economy. In addition to the casinos, the town is also home to several other businesses, including restaurants, hotels, and retail stores.
Demographics
As of the 2010 census, the population of Tunica Resorts was 2,813. The racial makeup of the town was 79.3% African American, 17.2% White, 0.7% Native American, 0.3% Asian, and 2.5% from other races. The median household income was $25,938, and the median age was 37.7 years.
Conclusion
Tunica Resorts, Mississippi is a small town located in the northwest corner of the state, just south of Memphis, Tennessee. It is part of the larger Tunica County, which is home to a population of about 10,000 people. The town is known for its casinos, which have been a major source of economic growth in the area since the 1990s. The economy of Tunica Resorts is largely driven by tourism, and the town is home to several businesses, including restaurants, hotels, and retail stores. The population of Tunica Resorts was 2,813 as of the 2010 census, and the racial makeup of the town was 79.3% African American, 17.2% White, 0.7% Native American, 0.3% Asian, and 2.5% from other races. The median household income was $25,938, and the median age was 37.7 years.
Common Questions
What is Per Capita Income in Tunica Resorts?
Per Capita income in Tunica Resorts is $22,107.
What is the Median Family Income in Tunica Resorts?
Median Family Income in Tunica Resorts is $31,853.
What is the Median Household income in Tunica Resorts?
Median Household Income in Tunica Resorts is $46,454.
What is Income or Wage Gap in Tunica Resorts?
Income or Wage Gap in Tunica Resorts is 26.8%.
Women in Tunica Resorts earn 73.2 cents for every dollar earned by a man.
What is Inequality or Gini Index in Tunica Resorts?
Inequality or Gini Index in Tunica Resorts is 0.30.
What is the Total Population of Tunica Resorts?
Total Population of Tunica Resorts is 2,096.
What is the Total Male Population of Tunica Resorts?
Total Male Population of Tunica Resorts is 1,176.
What is the Total Female Population of Tunica Resorts?
Total Female Population of Tunica Resorts is 920.
What is the Ratio of Males per 100 Females in Tunica Resorts?
There are 127.83 Males per 100 Females in Tunica Resorts.
What is the Ratio of Females per 100 Males in Tunica Resorts?
There are 78.23 Females per 100 Males in Tunica Resorts.
What is the Median Population Age in Tunica Resorts?
Median Population Age in Tunica Resorts is 30.4 Years.
What is the Average Family Size in Tunica Resorts
Average Family Size in Tunica Resorts is 2.9 People.
What is the Average Household Size in Tunica Resorts
Average Household Size in Tunica Resorts is 2.3 People.
How Large is the Labor Force in Tunica Resorts?
There are 1,273 People in the Labor Forcein in Tunica Resorts.
What is the Percentage of People in the Labor Force in Tunica Resorts?
76.2% of People are in the Labor Force in Tunica Resorts.
What is the Unemployment Rate in Tunica Resorts?
Unemployment Rate in Tunica Resorts is 4.1%.