Zip Codes with the Highest Percentage of Population Employed in Food Preparation & Serving in Columbus, MS
RELATED REPORTS & OPTIONS
Food Preparation & Serving
Columbus
Compare Zip Codes
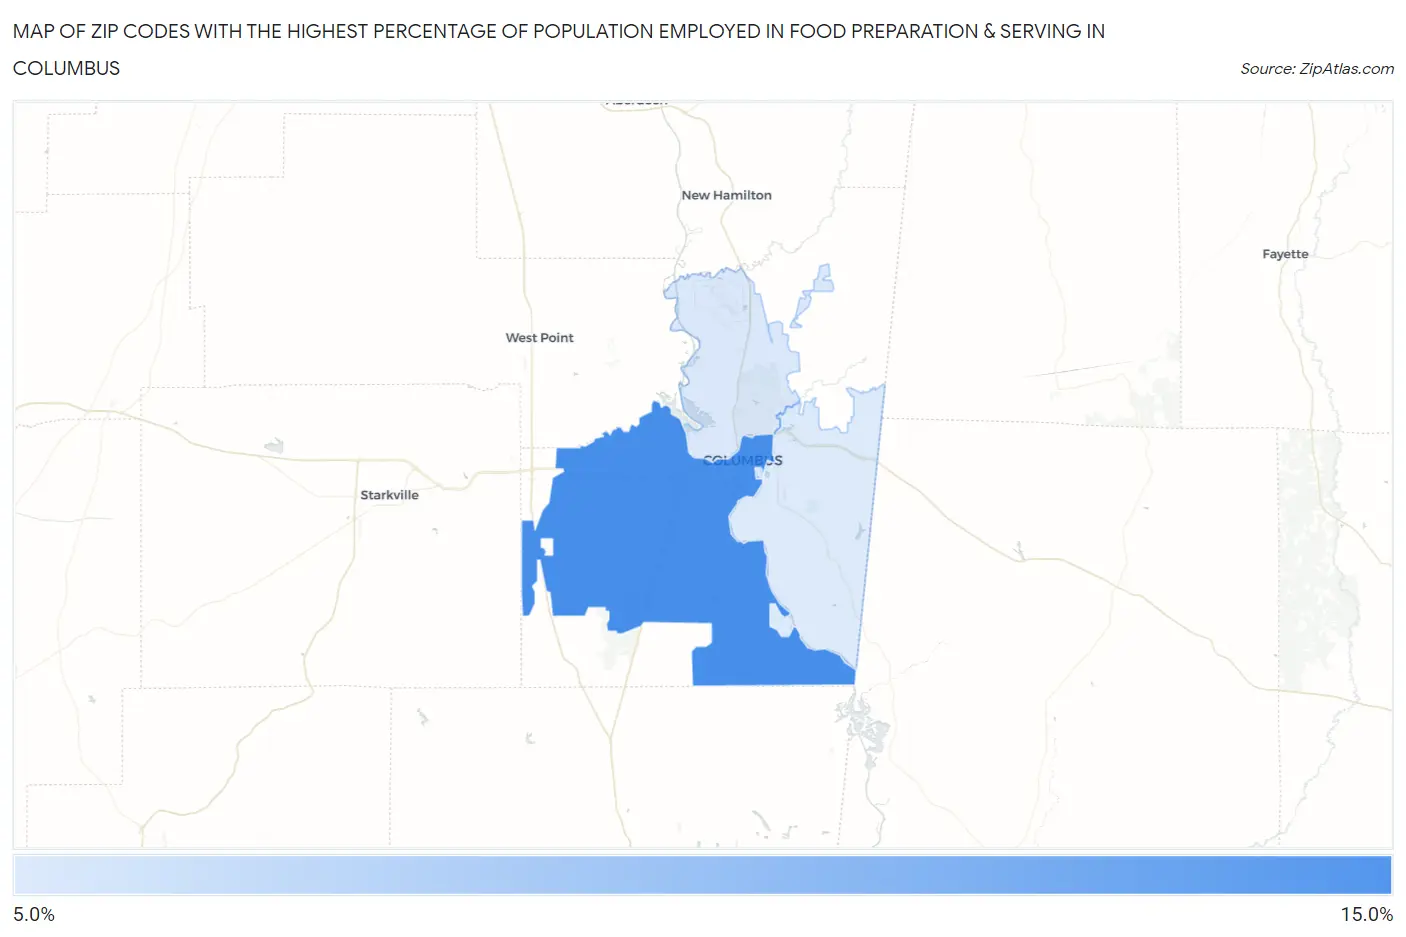
Map of Zip Codes with the Highest Percentage of Population Employed in Food Preparation & Serving in Columbus
6.2%
10.9%
Zip Codes with the Highest Percentage of Population Employed in Food Preparation & Serving in Columbus, MS
| Zip Code | % Employed | vs State | vs National | |
| 1. | 39701 | 10.9% | 5.6%(+5.31)#31 | 5.3%(+5.62)#2,102 |
| 2. | 39705 | 6.3% | 5.6%(+0.693)#112 | 5.3%(+1.000)#8,475 |
| 3. | 39702 | 6.2% | 5.6%(+0.599)#117 | 5.3%(+0.906)#8,759 |
1
Common Questions
What are the Top Zip Codes with the Highest Percentage of Population Employed in Food Preparation & Serving in Columbus, MS?
Top Zip Codes with the Highest Percentage of Population Employed in Food Preparation & Serving in Columbus, MS are:
What zip code has the Highest Percentage of Population Employed in Food Preparation & Serving in Columbus, MS?
39701 has the Highest Percentage of Population Employed in Food Preparation & Serving in Columbus, MS with 10.9%.
What is the Percentage of Population Employed in Food Preparation & Serving in Columbus, MS?
Percentage of Population Employed in Food Preparation & Serving in Columbus is 9.7%.
What is the Percentage of Population Employed in Food Preparation & Serving in Mississippi?
Percentage of Population Employed in Food Preparation & Serving in Mississippi is 5.6%.
What is the Percentage of Population Employed in Food Preparation & Serving in the United States?
Percentage of Population Employed in Food Preparation & Serving in the United States is 5.3%.