Gulf Park Estates, MS Map & Demographics
Gulf Park Estates Map
Gulf Park Estates Overview
$28,891
PER CAPITA INCOME
$59,970
AVG FAMILY INCOME
$59,895
AVG HOUSEHOLD INCOME
19.6%
WAGE / INCOME GAP [ % ]
80.4¢/ $1
WAGE / INCOME GAP [ $ ]
0.34
INEQUALITY / GINI INDEX
6,965
TOTAL POPULATION
2,992
MALE POPULATION
3,973
FEMALE POPULATION
75.31
MALES / 100 FEMALES
132.79
FEMALES / 100 MALES
37.1
MEDIAN AGE
3.0
AVG FAMILY SIZE
2.9
AVG HOUSEHOLD SIZE
3,844
LABOR FORCE [ PEOPLE ]
67.0%
PERCENT IN LABOR FORCE
1.6%
UNEMPLOYMENT RATE
Income in Gulf Park Estates
Income Overview in Gulf Park Estates
Per Capita Income in Gulf Park Estates is $28,891, while median incomes of families and households are $59,970 and $59,895 respectively.
| Characteristic | Number | Measure |
| Per Capita Income | 6,965 | $28,891 |
| Median Family Income | 1,941 | $59,970 |
| Mean Family Income | 1,941 | $80,775 |
| Median Household Income | 2,447 | $59,895 |
| Mean Household Income | 2,447 | $80,275 |
| Income Deficit | 1,941 | $0 |
| Wage / Income Gap (%) | 6,965 | 19.61% |
| Wage / Income Gap ($) | 6,965 | 80.39¢ per $1 |
| Gini / Inequality Index | 6,965 | 0.34 |
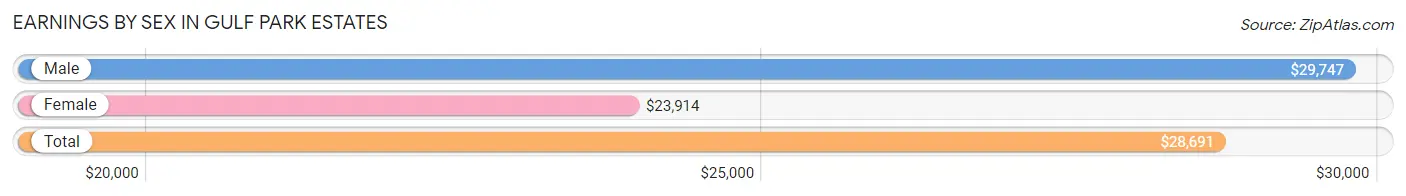
Earnings by Sex in Gulf Park Estates
Average Earnings in Gulf Park Estates are $28,691, $29,747 for men and $23,914 for women, a difference of 19.6%.
| Sex | Number | Average Earnings |
| Male | 1,841 (44.6%) | $29,747 |
| Female | 2,285 (55.4%) | $23,914 |
| Total | 4,126 (100.0%) | $28,691 |
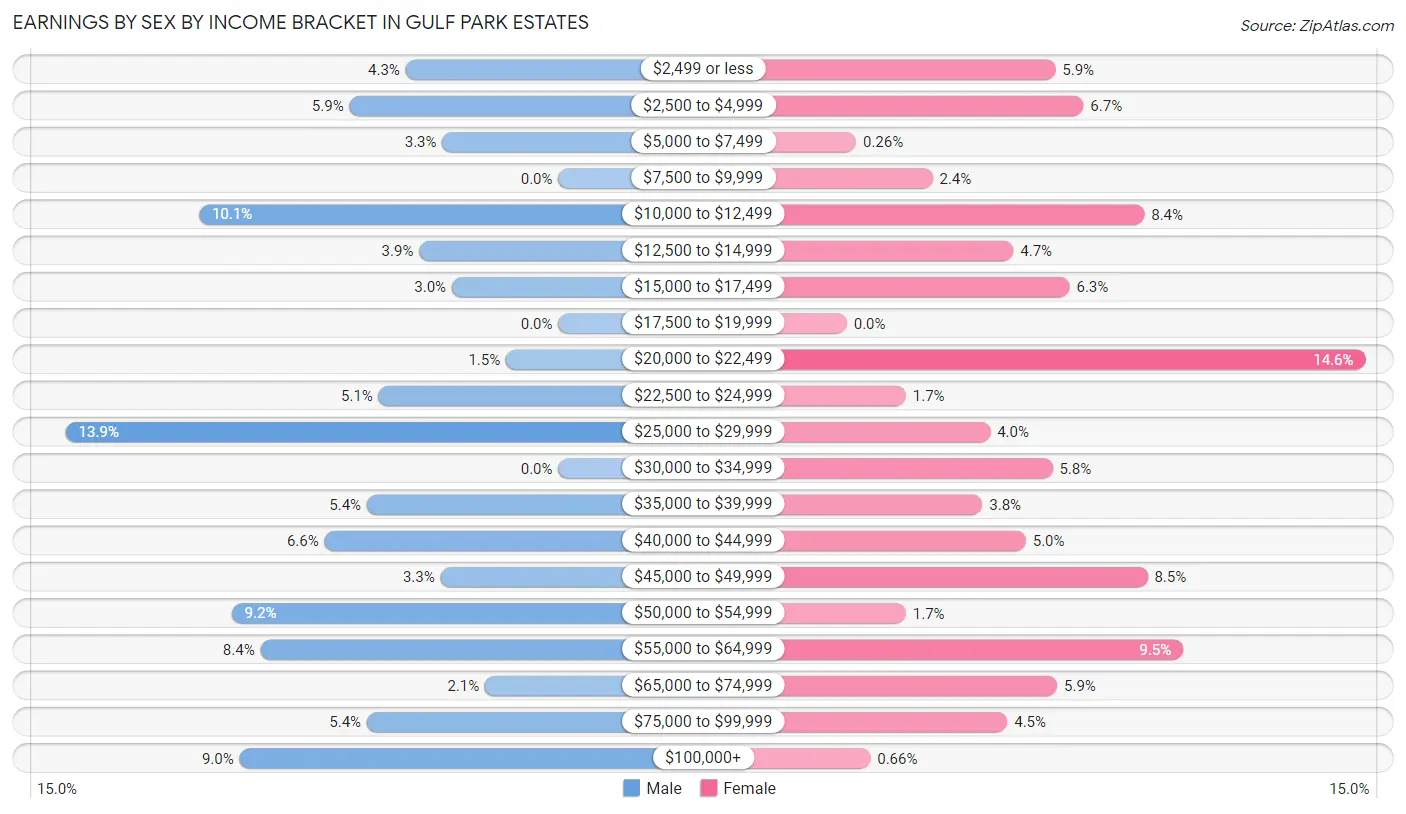
Earnings by Sex by Income Bracket in Gulf Park Estates
The most common earnings brackets in Gulf Park Estates are $25,000 to $29,999 for men (255 | 13.9%) and $20,000 to $22,499 for women (333 | 14.6%).
| Income | Male | Female |
| $2,499 or less | 79 (4.3%) | 134 (5.9%) |
| $2,500 to $4,999 | 108 (5.9%) | 152 (6.7%) |
| $5,000 to $7,499 | 60 (3.3%) | 6 (0.3%) |
| $7,500 to $9,999 | 0 (0.0%) | 55 (2.4%) |
| $10,000 to $12,499 | 186 (10.1%) | 191 (8.4%) |
| $12,500 to $14,999 | 72 (3.9%) | 107 (4.7%) |
| $15,000 to $17,499 | 55 (3.0%) | 143 (6.3%) |
| $17,500 to $19,999 | 0 (0.0%) | 0 (0.0%) |
| $20,000 to $22,499 | 27 (1.5%) | 333 (14.6%) |
| $22,500 to $24,999 | 93 (5.1%) | 38 (1.7%) |
| $25,000 to $29,999 | 255 (13.9%) | 92 (4.0%) |
| $30,000 to $34,999 | 0 (0.0%) | 132 (5.8%) |
| $35,000 to $39,999 | 99 (5.4%) | 87 (3.8%) |
| $40,000 to $44,999 | 121 (6.6%) | 115 (5.0%) |
| $45,000 to $49,999 | 61 (3.3%) | 193 (8.5%) |
| $50,000 to $54,999 | 169 (9.2%) | 38 (1.7%) |
| $55,000 to $64,999 | 154 (8.4%) | 216 (9.5%) |
| $65,000 to $74,999 | 38 (2.1%) | 135 (5.9%) |
| $75,000 to $99,999 | 99 (5.4%) | 103 (4.5%) |
| $100,000+ | 165 (9.0%) | 15 (0.7%) |
| Total | 1,841 (100.0%) | 2,285 (100.0%) |
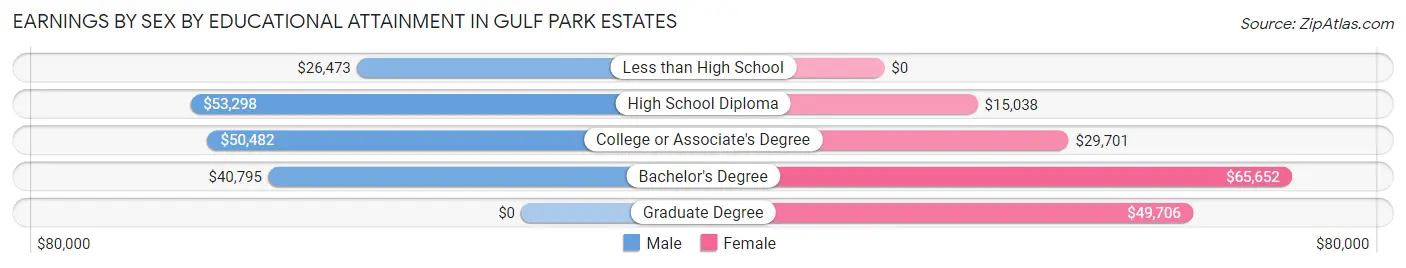
Earnings by Sex by Educational Attainment in Gulf Park Estates
Average earnings in Gulf Park Estates are $41,484 for men and $35,347 for women, a difference of 14.8%. Men with an educational attainment of high school diploma enjoy the highest average annual earnings of $53,298, while those with less than high school education earn the least with $26,473. Women with an educational attainment of bachelor's degree earn the most with the average annual earnings of $65,652, while those with high school diploma education have the smallest earnings of $15,038.
| Educational Attainment | Male Income | Female Income |
| Less than High School | $26,473 | $0 |
| High School Diploma | $53,298 | $15,038 |
| College or Associate's Degree | $50,482 | $29,701 |
| Bachelor's Degree | $40,795 | $65,652 |
| Graduate Degree | - | - |
| Total | $41,484 | $35,347 |
Family Income in Gulf Park Estates
Family Income Brackets in Gulf Park Estates
According to the Gulf Park Estates family income data, there are 602 families falling into the $35,000 to $49,999 income range, which is the most common income bracket and makes up 31.0% of all families.
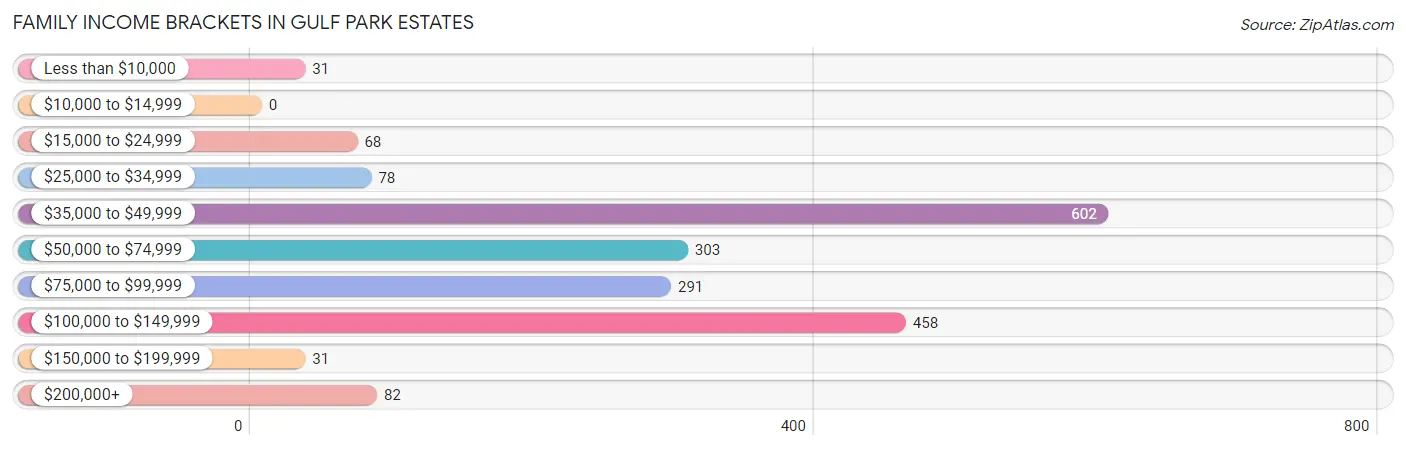
| Income Bracket | # Families | % Families |
| Less than $10,000 | 31 | 1.6% |
| $10,000 to $14,999 | 0 | 0.0% |
| $15,000 to $24,999 | 68 | 3.5% |
| $25,000 to $34,999 | 78 | 4.0% |
| $35,000 to $49,999 | 602 | 31.0% |
| $50,000 to $74,999 | 303 | 15.6% |
| $75,000 to $99,999 | 291 | 15.0% |
| $100,000 to $149,999 | 458 | 23.6% |
| $150,000 to $199,999 | 31 | 1.6% |
| $200,000+ | 82 | 4.2% |
Family Income by Famaliy Size in Gulf Park Estates
4-person families (289 | 14.9%) account for the highest median family income in Gulf Park Estates with $86,813 per family, while 2-person families (898 | 46.3%) have the highest median income of $29,375 per family member.
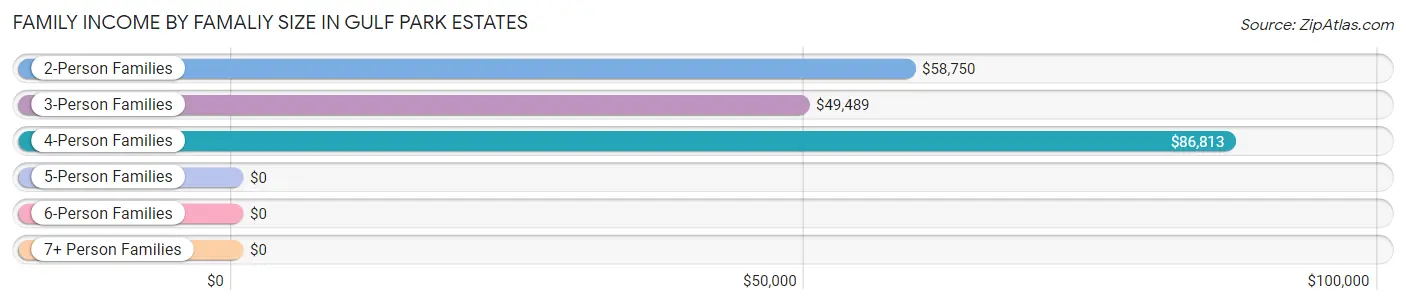
| Income Bracket | # Families | Median Income |
| 2-Person Families | 898 (46.3%) | $58,750 |
| 3-Person Families | 412 (21.2%) | $49,489 |
| 4-Person Families | 289 (14.9%) | $86,813 |
| 5-Person Families | 227 (11.7%) | $0 |
| 6-Person Families | 0 (0.0%) | $0 |
| 7+ Person Families | 115 (5.9%) | $0 |
| Total | 1,941 (100.0%) | $59,970 |
Family Income by Number of Earners in Gulf Park Estates
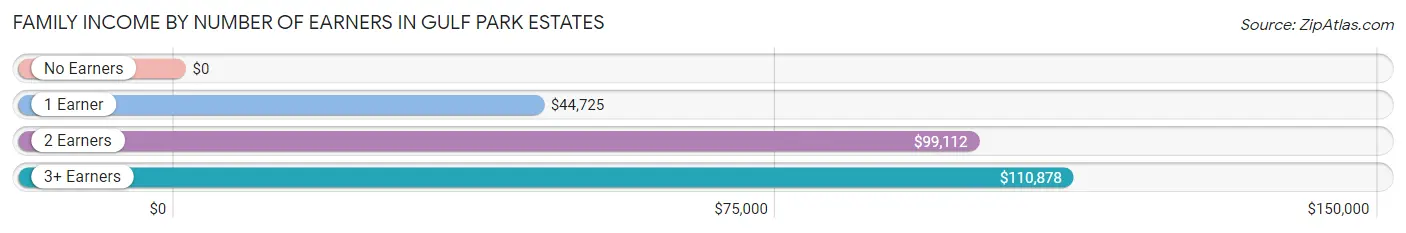
| Number of Earners | # Families | Median Income |
| No Earners | 173 (8.9%) | $0 |
| 1 Earner | 799 (41.2%) | $44,725 |
| 2 Earners | 683 (35.2%) | $99,112 |
| 3+ Earners | 286 (14.7%) | $110,878 |
| Total | 1,941 (100.0%) | $59,970 |
Household Income in Gulf Park Estates
Household Income Brackets in Gulf Park Estates
With 729 households falling in the category, the $35,000 to $49,999 income range is the most frequent in Gulf Park Estates, accounting for 29.8% of all households. In contrast, only 27 households (1.1%) fall into the $25,000 to $34,999 income bracket, making it the least populous group.
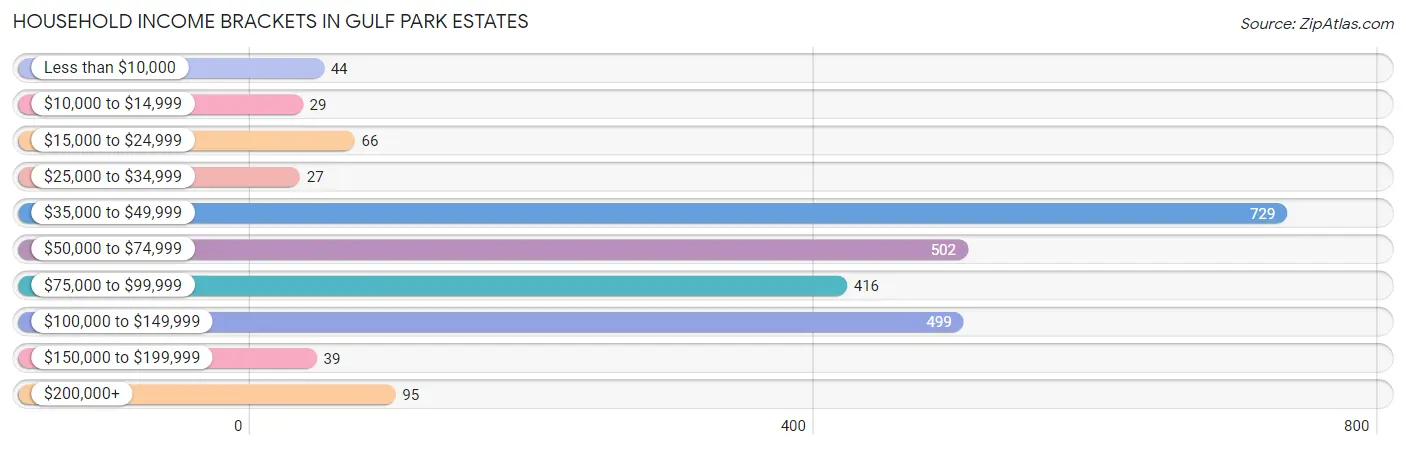
| Income Bracket | # Households | % Households |
| Less than $10,000 | 44 | 1.8% |
| $10,000 to $14,999 | 29 | 1.2% |
| $15,000 to $24,999 | 66 | 2.7% |
| $25,000 to $34,999 | 27 | 1.1% |
| $35,000 to $49,999 | 729 | 29.8% |
| $50,000 to $74,999 | 502 | 20.5% |
| $75,000 to $99,999 | 416 | 17.0% |
| $100,000 to $149,999 | 499 | 20.4% |
| $150,000 to $199,999 | 39 | 1.6% |
| $200,000+ | 95 | 3.9% |
Household Income by Householder Age in Gulf Park Estates
The median household income in Gulf Park Estates is $59,895, with the highest median household income of $86,127 found in the 45 to 64 years age bracket for the primary householder. A total of 1,161 households (47.4%) fall into this category. Meanwhile, the 15 to 24 years age bracket for the primary householder has the lowest median household income of $0, with 13 households (0.5%) in this group.
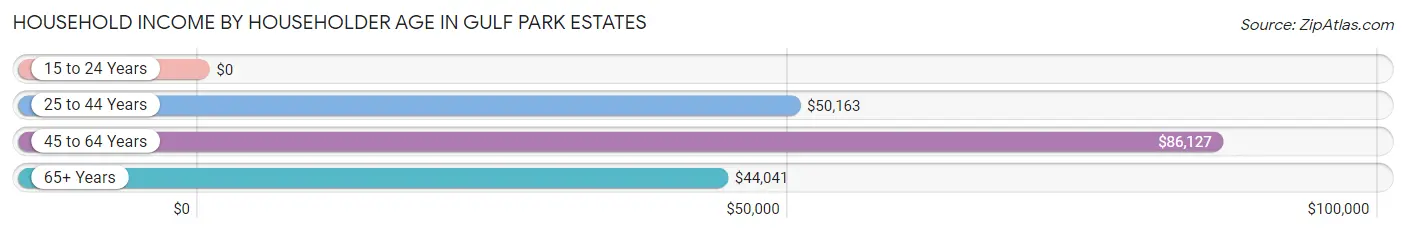
| Income Bracket | # Households | Median Income |
| 15 to 24 Years | 13 (0.5%) | $0 |
| 25 to 44 Years | 852 (34.8%) | $50,163 |
| 45 to 64 Years | 1,161 (47.4%) | $86,127 |
| 65+ Years | 421 (17.2%) | $44,041 |
| Total | 2,447 (100.0%) | $59,895 |
Poverty in Gulf Park Estates
Income Below Poverty by Sex and Age in Gulf Park Estates
With 9.3% poverty level for males and 4.8% for females among the residents of Gulf Park Estates, 55 to 64 year old males and 15 year old females are the most vulnerable to poverty, with 109 males (28.0%) and 31 females (43.7%) in their respective age groups living below the poverty level.
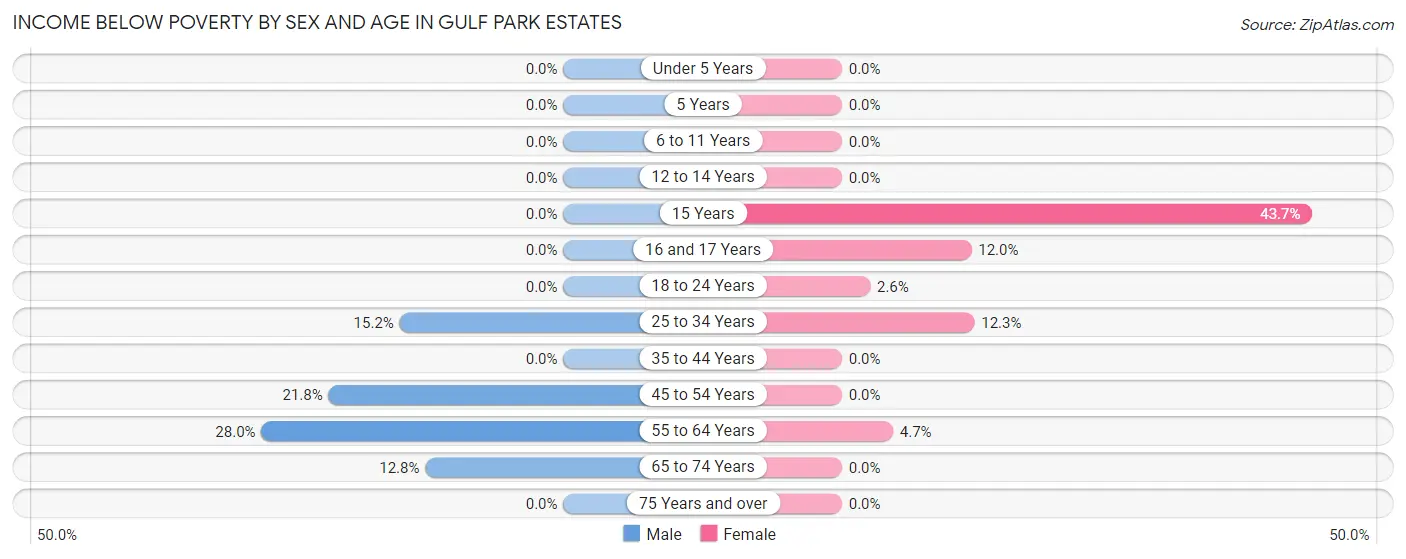
| Age Bracket | Male | Female |
| Under 5 Years | 0 (0.0%) | 0 (0.0%) |
| 5 Years | 0 (0.0%) | 0 (0.0%) |
| 6 to 11 Years | 0 (0.0%) | 0 (0.0%) |
| 12 to 14 Years | 0 (0.0%) | 0 (0.0%) |
| 15 Years | 0 (0.0%) | 31 (43.7%) |
| 16 and 17 Years | 0 (0.0%) | 31 (12.0%) |
| 18 to 24 Years | 0 (0.0%) | 9 (2.6%) |
| 25 to 34 Years | 48 (15.2%) | 90 (12.3%) |
| 35 to 44 Years | 0 (0.0%) | 0 (0.0%) |
| 45 to 54 Years | 90 (21.8%) | 0 (0.0%) |
| 55 to 64 Years | 109 (28.0%) | 26 (4.7%) |
| 65 to 74 Years | 31 (12.8%) | 0 (0.0%) |
| 75 Years and over | 0 (0.0%) | 0 (0.0%) |
| Total | 278 (9.3%) | 187 (4.8%) |
Income Above Poverty by Sex and Age in Gulf Park Estates
According to the poverty statistics in Gulf Park Estates, males aged under 5 years and females aged under 5 years are the age groups that are most secure financially, with 100.0% of males and 100.0% of females in these age groups living above the poverty line.
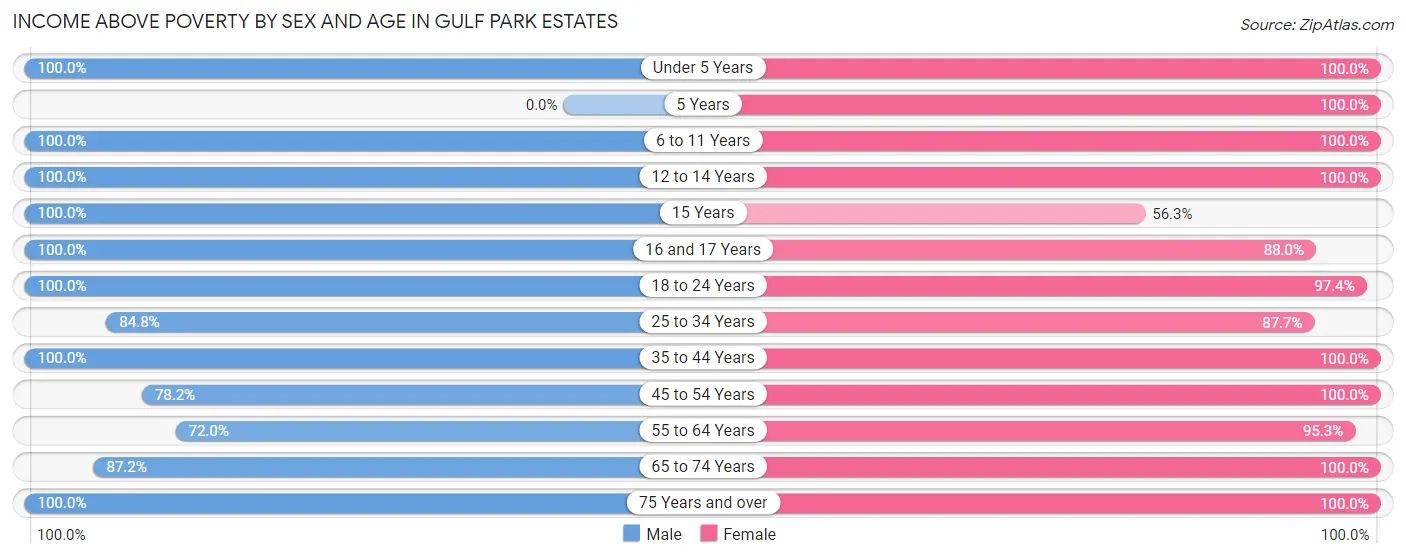
| Age Bracket | Male | Female |
| Under 5 Years | 108 (100.0%) | 227 (100.0%) |
| 5 Years | 0 (0.0%) | 59 (100.0%) |
| 6 to 11 Years | 273 (100.0%) | 162 (100.0%) |
| 12 to 14 Years | 160 (100.0%) | 74 (100.0%) |
| 15 Years | 50 (100.0%) | 40 (56.3%) |
| 16 and 17 Years | 145 (100.0%) | 227 (88.0%) |
| 18 to 24 Years | 321 (100.0%) | 334 (97.4%) |
| 25 to 34 Years | 268 (84.8%) | 642 (87.7%) |
| 35 to 44 Years | 419 (100.0%) | 306 (100.0%) |
| 45 to 54 Years | 323 (78.2%) | 507 (100.0%) |
| 55 to 64 Years | 280 (72.0%) | 522 (95.3%) |
| 65 to 74 Years | 211 (87.2%) | 384 (100.0%) |
| 75 Years and over | 156 (100.0%) | 258 (100.0%) |
| Total | 2,714 (90.7%) | 3,742 (95.2%) |
Income Below Poverty Among Married-Couple Families in Gulf Park Estates
The poverty statistics for married-couple families in Gulf Park Estates show that 2.4% or 31 of the total 1,275 families live below the poverty line. Families with no children have the highest poverty rate of 4.1%, comprising of 31 families. On the other hand, families with 1 or 2 children have the lowest poverty rate of 0.0%, which includes 0 families.
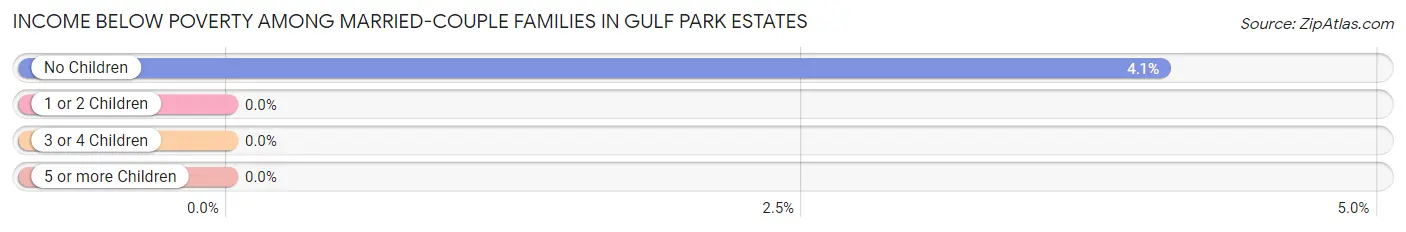
| Children | Above Poverty | Below Poverty |
| No Children | 733 (95.9%) | 31 (4.1%) |
| 1 or 2 Children | 321 (100.0%) | 0 (0.0%) |
| 3 or 4 Children | 145 (100.0%) | 0 (0.0%) |
| 5 or more Children | 45 (100.0%) | 0 (0.0%) |
| Total | 1,244 (97.6%) | 31 (2.4%) |
Income Below Poverty Among Single-Parent Households in Gulf Park Estates
| Children | Single Father | Single Mother |
| No Children | 0 (0.0%) | 0 (0.0%) |
| 1 or 2 Children | 0 (0.0%) | 0 (0.0%) |
| 3 or 4 Children | 0 (0.0%) | 0 (0.0%) |
| 5 or more Children | 0 (0.0%) | 0 (0.0%) |
| Total | 0 (0.0%) | 0 (0.0%) |
Income Below Poverty Among Married-Couple vs Single-Parent Households in Gulf Park Estates
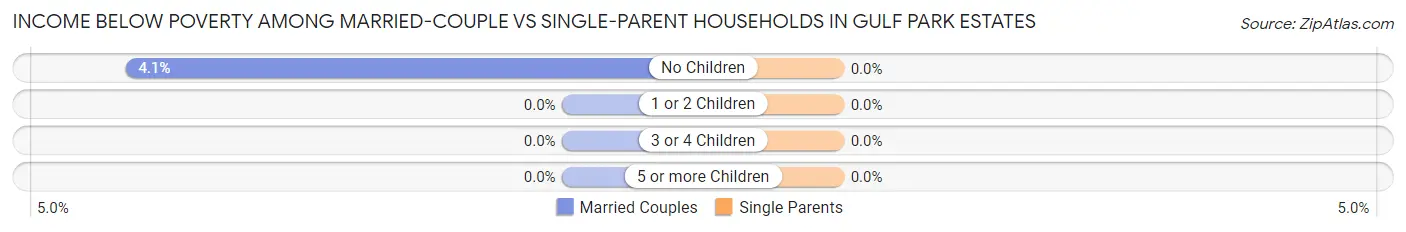
| Children | Married-Couple Families | Single-Parent Households |
| No Children | 31 (4.1%) | 0 (0.0%) |
| 1 or 2 Children | 0 (0.0%) | 0 (0.0%) |
| 3 or 4 Children | 0 (0.0%) | 0 (0.0%) |
| 5 or more Children | 0 (0.0%) | 0 (0.0%) |
| Total | 31 (2.4%) | 0 (0.0%) |
Race in Gulf Park Estates
The most populous races in Gulf Park Estates are White / Caucasian (6,285 | 90.2%), Hispanic or Latino (318 | 4.6%), and Two or more Races (293 | 4.2%).
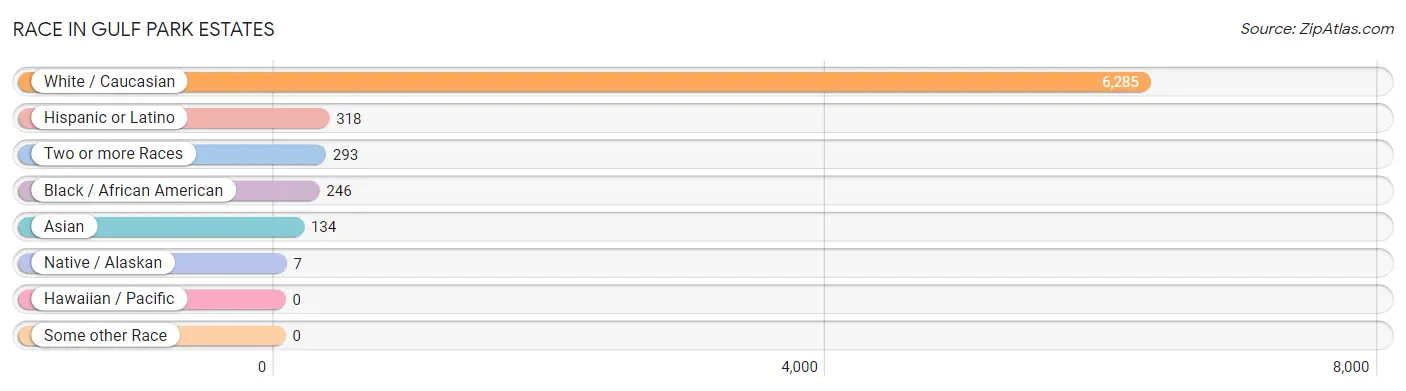
| Race | # Population | % Population |
| Asian | 134 | 1.9% |
| Black / African American | 246 | 3.5% |
| Hawaiian / Pacific | 0 | 0.0% |
| Hispanic or Latino | 318 | 4.6% |
| Native / Alaskan | 7 | 0.1% |
| White / Caucasian | 6,285 | 90.2% |
| Two or more Races | 293 | 4.2% |
| Some other Race | 0 | 0.0% |
| Total | 6,965 | 100.0% |
Ancestry in Gulf Park Estates
The most populous ancestries reported in Gulf Park Estates are English (1,587 | 22.8%), Irish (1,493 | 21.4%), German (1,131 | 16.2%), French (564 | 8.1%), and American (509 | 7.3%), together accounting for 75.9% of all Gulf Park Estates residents.
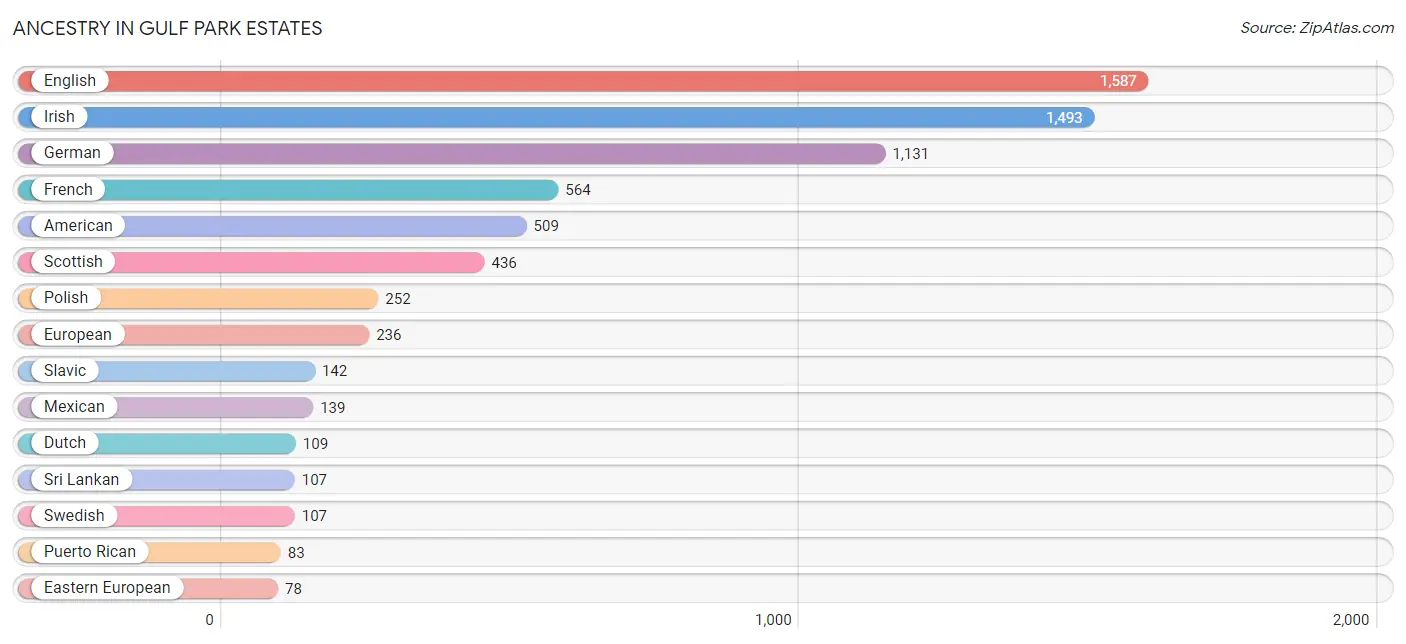
| Ancestry | # Population | % Population |
| American | 509 | 7.3% |
| Arab | 42 | 0.6% |
| British | 25 | 0.4% |
| Central American | 38 | 0.5% |
| Cherokee | 7 | 0.1% |
| Croatian | 21 | 0.3% |
| Dutch | 109 | 1.6% |
| Eastern European | 78 | 1.1% |
| English | 1,587 | 22.8% |
| Ethiopian | 38 | 0.5% |
| European | 236 | 3.4% |
| Filipino | 12 | 0.2% |
| French | 564 | 8.1% |
| French Canadian | 56 | 0.8% |
| German | 1,131 | 16.2% |
| Guatemalan | 38 | 0.5% |
| Irish | 1,493 | 21.4% |
| Italian | 35 | 0.5% |
| Korean | 27 | 0.4% |
| Lebanese | 42 | 0.6% |
| Lithuanian | 20 | 0.3% |
| Mexican | 139 | 2.0% |
| Polish | 252 | 3.6% |
| Puerto Rican | 83 | 1.2% |
| Scandinavian | 62 | 0.9% |
| Scotch-Irish | 46 | 0.7% |
| Scottish | 436 | 6.3% |
| Slavic | 142 | 2.0% |
| Spaniard | 58 | 0.8% |
| Sri Lankan | 107 | 1.5% |
| Subsaharan African | 38 | 0.5% |
| Swedish | 107 | 1.5% | View All 32 Rows |
Immigrants in Gulf Park Estates
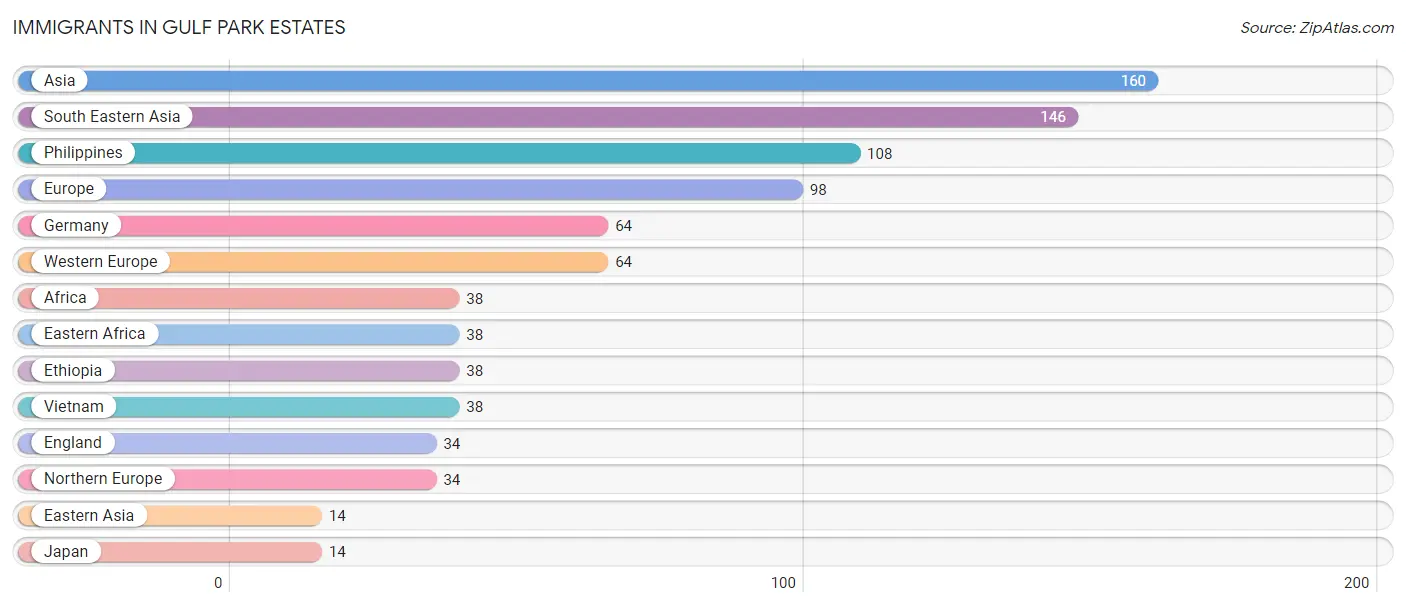
The most numerous immigrant groups reported in Gulf Park Estates came from Asia (160 | 2.3%), South Eastern Asia (146 | 2.1%), Philippines (108 | 1.5%), Europe (98 | 1.4%), and Germany (64 | 0.9%), together accounting for 8.3% of all Gulf Park Estates residents.
| Immigration Origin | # Population | % Population |
| Africa | 38 | 0.5% |
| Asia | 160 | 2.3% |
| Eastern Africa | 38 | 0.5% |
| Eastern Asia | 14 | 0.2% |
| England | 34 | 0.5% |
| Ethiopia | 38 | 0.5% |
| Europe | 98 | 1.4% |
| Germany | 64 | 0.9% |
| Japan | 14 | 0.2% |
| Northern Europe | 34 | 0.5% |
| Philippines | 108 | 1.5% |
| South Eastern Asia | 146 | 2.1% |
| Vietnam | 38 | 0.5% |
| Western Europe | 64 | 0.9% | View All 14 Rows |
Sex and Age in Gulf Park Estates
Sex and Age in Gulf Park Estates
The most populous age groups in Gulf Park Estates are 15 to 19 Years (359 | 12.0%) for men and 30 to 34 Years (425 | 10.7%) for women.
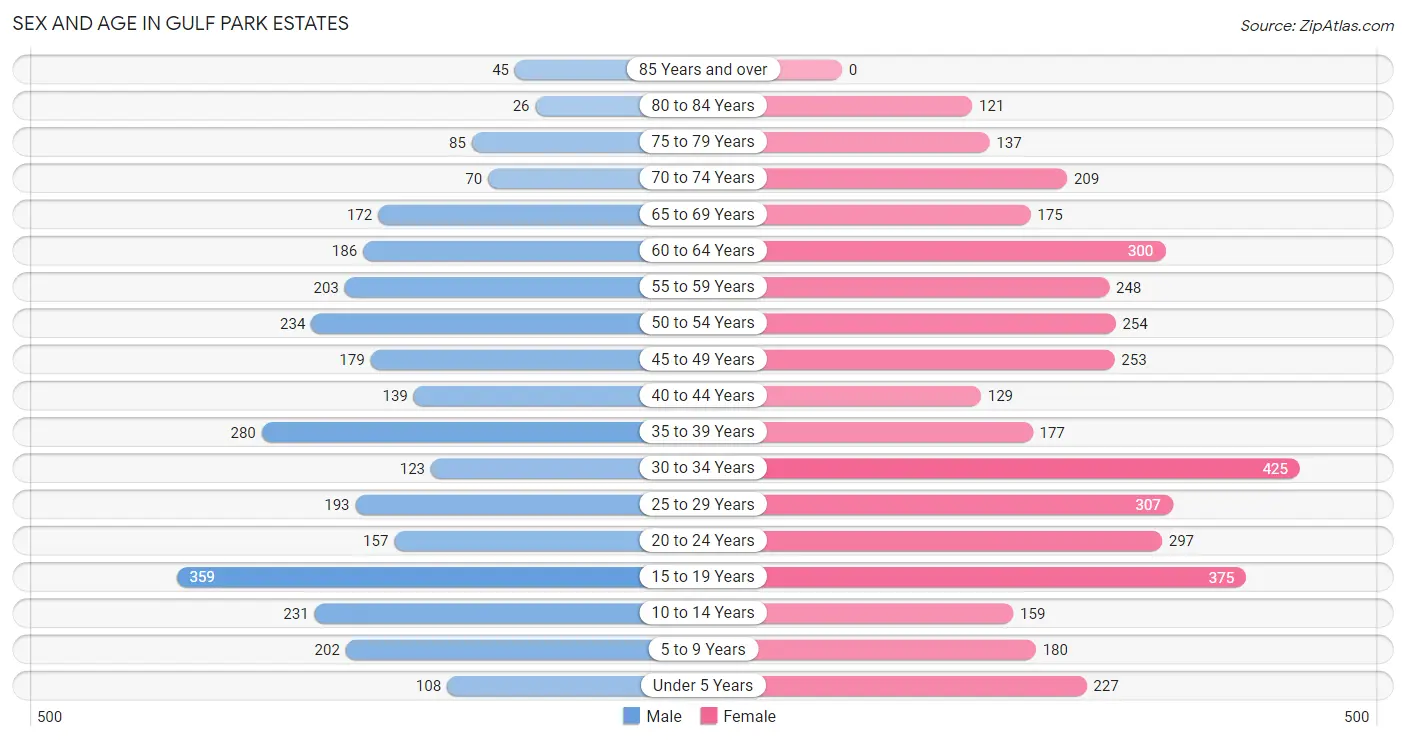
| Age Bracket | Male | Female |
| Under 5 Years | 108 (3.6%) | 227 (5.7%) |
| 5 to 9 Years | 202 (6.8%) | 180 (4.5%) |
| 10 to 14 Years | 231 (7.7%) | 159 (4.0%) |
| 15 to 19 Years | 359 (12.0%) | 375 (9.4%) |
| 20 to 24 Years | 157 (5.2%) | 297 (7.5%) |
| 25 to 29 Years | 193 (6.5%) | 307 (7.7%) |
| 30 to 34 Years | 123 (4.1%) | 425 (10.7%) |
| 35 to 39 Years | 280 (9.4%) | 177 (4.5%) |
| 40 to 44 Years | 139 (4.6%) | 129 (3.3%) |
| 45 to 49 Years | 179 (6.0%) | 253 (6.4%) |
| 50 to 54 Years | 234 (7.8%) | 254 (6.4%) |
| 55 to 59 Years | 203 (6.8%) | 248 (6.2%) |
| 60 to 64 Years | 186 (6.2%) | 300 (7.5%) |
| 65 to 69 Years | 172 (5.8%) | 175 (4.4%) |
| 70 to 74 Years | 70 (2.3%) | 209 (5.3%) |
| 75 to 79 Years | 85 (2.8%) | 137 (3.5%) |
| 80 to 84 Years | 26 (0.9%) | 121 (3.0%) |
| 85 Years and over | 45 (1.5%) | 0 (0.0%) |
| Total | 2,992 (100.0%) | 3,973 (100.0%) |
Families and Households in Gulf Park Estates
Median Family Size in Gulf Park Estates
The median family size in Gulf Park Estates is 3.02 persons per family, with single male/father families (54 | 2.8%) accounting for the largest median family size of 3.43 persons per family. On the other hand, single female/mother families (612 | 31.5%) represent the smallest median family size with 2.65 persons per family.
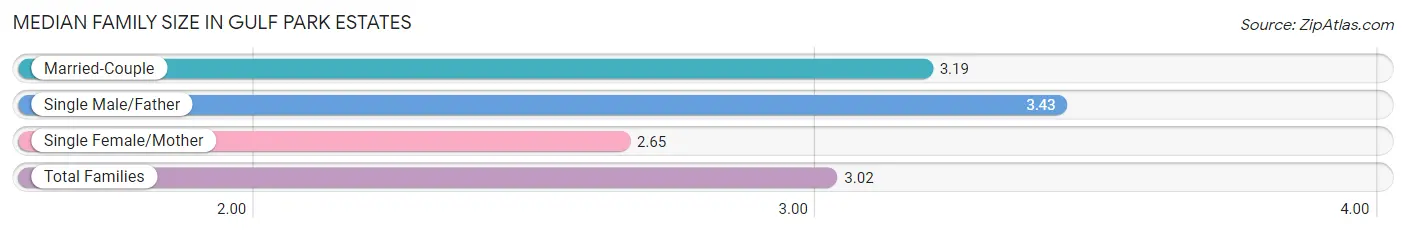
| Family Type | # Families | Family Size |
| Married-Couple | 1,275 (65.7%) | 3.19 |
| Single Male/Father | 54 (2.8%) | 3.43 |
| Single Female/Mother | 612 (31.5%) | 2.65 |
| Total Families | 1,941 (100.0%) | 3.02 |
Median Household Size in Gulf Park Estates
The median household size in Gulf Park Estates is 2.85 persons per household, with single male/father households (54 | 2.2%) accounting for the largest median household size of 3.59 persons per household. non-family households (506 | 20.7%) represent the smallest median household size with 1.73 persons per household.
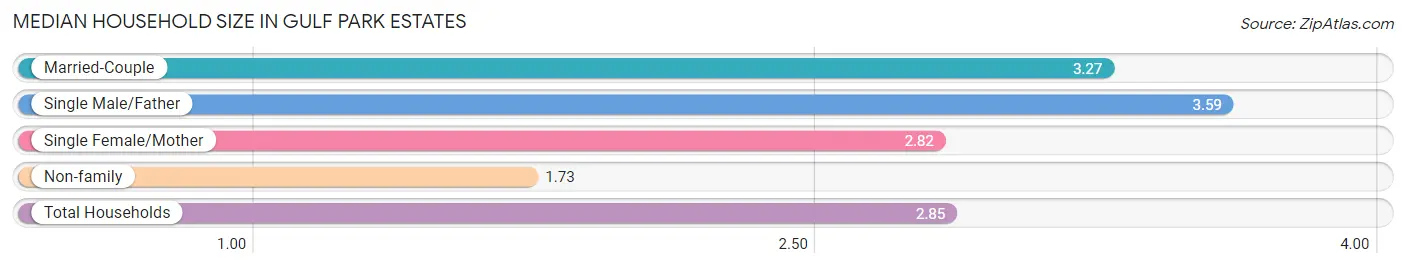
| Household Type | # Households | Household Size |
| Married-Couple | 1,275 (52.1%) | 3.27 |
| Single Male/Father | 54 (2.2%) | 3.59 |
| Single Female/Mother | 612 (25.0%) | 2.82 |
| Non-family | 506 (20.7%) | 1.73 |
| Total Households | 2,447 (100.0%) | 2.85 |
Household Size by Marriage Status in Gulf Park Estates
Out of a total of 2,447 households in Gulf Park Estates, 1,941 (79.3%) are family households, while 506 (20.7%) are nonfamily households. The most numerous type of family households are 2-person households, comprising 808, and the most common type of nonfamily households are 2-person households, comprising 289.
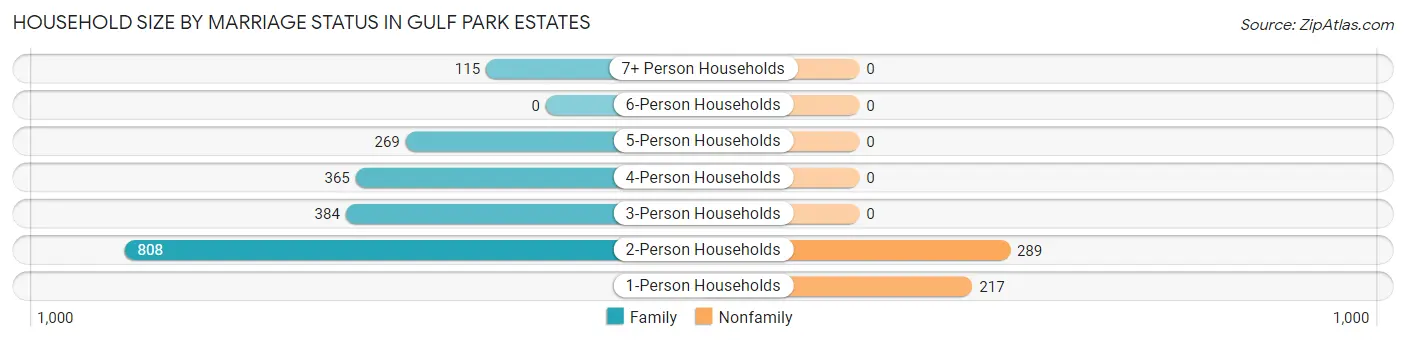
| Household Size | Family Households | Nonfamily Households |
| 1-Person Households | - | 217 (8.9%) |
| 2-Person Households | 808 (33.0%) | 289 (11.8%) |
| 3-Person Households | 384 (15.7%) | 0 (0.0%) |
| 4-Person Households | 365 (14.9%) | 0 (0.0%) |
| 5-Person Households | 269 (11.0%) | 0 (0.0%) |
| 6-Person Households | 0 (0.0%) | 0 (0.0%) |
| 7+ Person Households | 115 (4.7%) | 0 (0.0%) |
| Total | 1,941 (79.3%) | 506 (20.7%) |
Female Fertility in Gulf Park Estates
Fertility by Age in Gulf Park Estates
Average fertility rate in Gulf Park Estates is 96.0 births per 1,000 women. Women in the age bracket of 20 to 34 years have the highest fertility rate with 184.0 births per 1,000 women. Women in the age bracket of 20 to 34 years acount for 95.5% of all women with births.
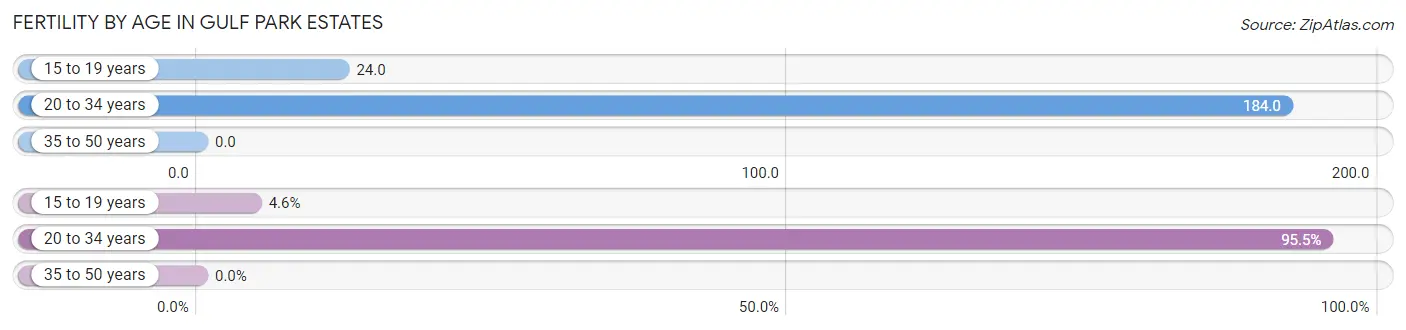
| Age Bracket | Women with Births | Births / 1,000 Women |
| 15 to 19 years | 9 (4.5%) | 24.0 |
| 20 to 34 years | 189 (95.5%) | 184.0 |
| 35 to 50 years | 0 (0.0%) | 0.0 |
| Total | 198 (100.0%) | 96.0 |
Fertility by Age by Marriage Status in Gulf Park Estates
66.7% of women with births (198) in Gulf Park Estates are married. The highest percentage of unmarried women with births falls into 15 to 19 years age bracket with 100.0% of them unmarried at the time of birth, while the lowest percentage of unmarried women with births belong to 20 to 34 years age bracket with 30.2% of them unmarried.
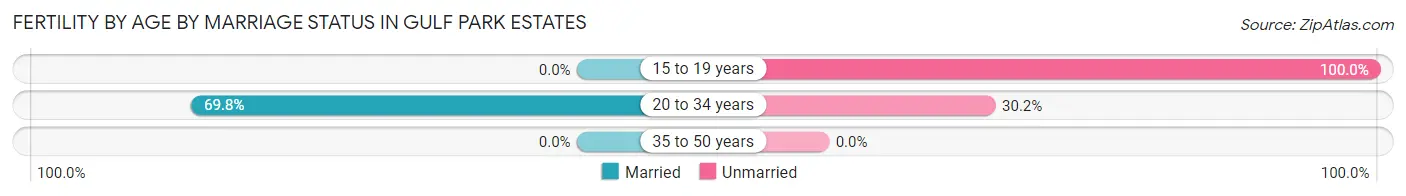
| Age Bracket | Married | Unmarried |
| 15 to 19 years | 0 (0.0%) | 9 (100.0%) |
| 20 to 34 years | 132 (69.8%) | 57 (30.2%) |
| 35 to 50 years | 0 (0.0%) | 0 (0.0%) |
| Total | 132 (66.7%) | 66 (33.3%) |
Fertility by Education in Gulf Park Estates
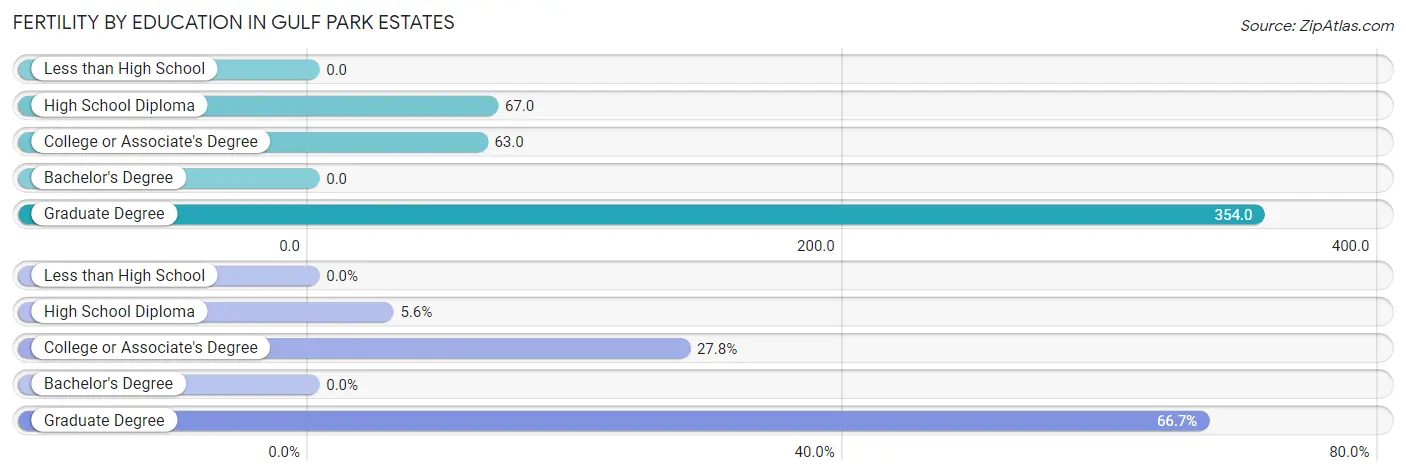
| Educational Attainment | Women with Births | Births / 1,000 Women |
| Less than High School | 0 (0.0%) | 0.0 |
| High School Diploma | 11 (5.6%) | 67.0 |
| College or Associate's Degree | 55 (27.8%) | 63.0 |
| Bachelor's Degree | 0 (0.0%) | 0.0 |
| Graduate Degree | 132 (66.7%) | 354.0 |
| Total | 198 (100.0%) | 96.0 |
Fertility by Education by Marriage Status in Gulf Park Estates
33.3% of women with births in Gulf Park Estates are unmarried. Women with the educational attainment of graduate degree are most likely to be married with 100.0% of them married at childbirth, while women with the educational attainment of high school diploma are least likely to be married with 100.0% of them unmarried at childbirth.
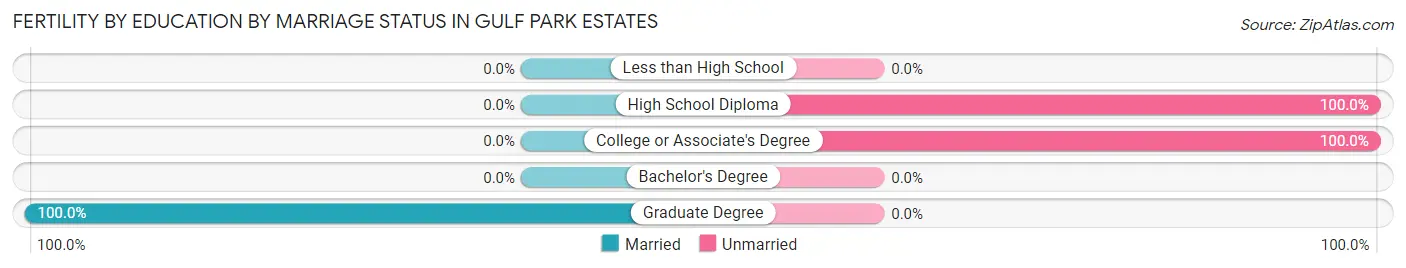
| Educational Attainment | Married | Unmarried |
| Less than High School | 0 (0.0%) | 0 (0.0%) |
| High School Diploma | 0 (0.0%) | 11 (100.0%) |
| College or Associate's Degree | 0 (0.0%) | 55 (100.0%) |
| Bachelor's Degree | 0 (0.0%) | 0 (0.0%) |
| Graduate Degree | 132 (100.0%) | 0 (0.0%) |
| Total | 132 (66.7%) | 66 (33.3%) |
Employment Characteristics in Gulf Park Estates
Employment by Class of Employer in Gulf Park Estates
Among the 3,688 employed individuals in Gulf Park Estates, private company employees (2,476 | 67.1%), federal government employees (640 | 17.3%), and local government employees (316 | 8.6%) make up the most common classes of employment.
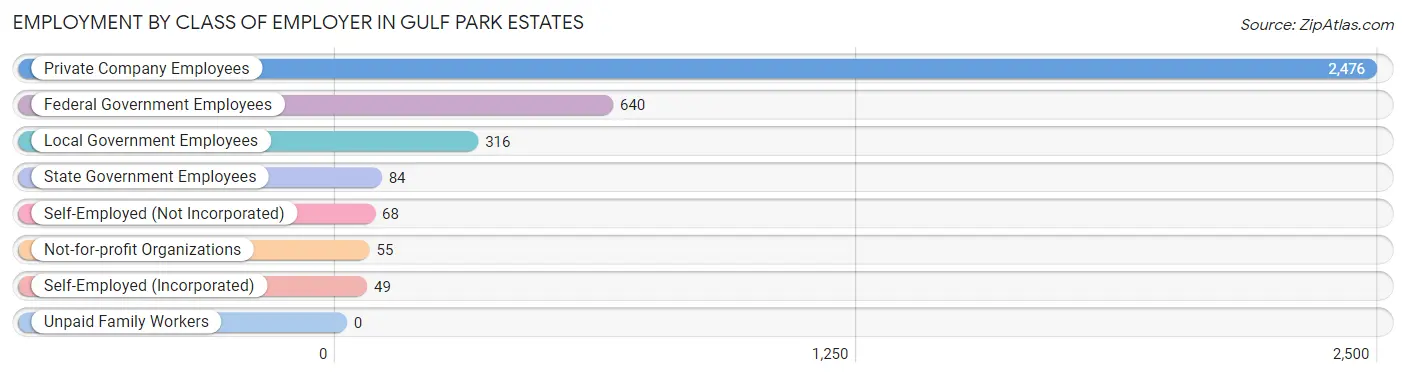
| Employer Class | # Employees | % Employees |
| Private Company Employees | 2,476 | 67.1% |
| Self-Employed (Incorporated) | 49 | 1.3% |
| Self-Employed (Not Incorporated) | 68 | 1.8% |
| Not-for-profit Organizations | 55 | 1.5% |
| Local Government Employees | 316 | 8.6% |
| State Government Employees | 84 | 2.3% |
| Federal Government Employees | 640 | 17.3% |
| Unpaid Family Workers | 0 | 0.0% |
| Total | 3,688 | 100.0% |
Employment Status by Age in Gulf Park Estates
According to the labor force statistics for Gulf Park Estates, out of the total population over 16 years of age (5,737), 67.0% or 3,844 individuals are in the labor force, with 1.6% or 62 of them unemployed. The age group with the highest labor force participation rate is 25 to 29 years, with 91.6% or 458 individuals in the labor force. Within the labor force, the 16 to 19 years age range has the highest percentage of unemployed individuals, with 12.2% or 41 of them being unemployed.
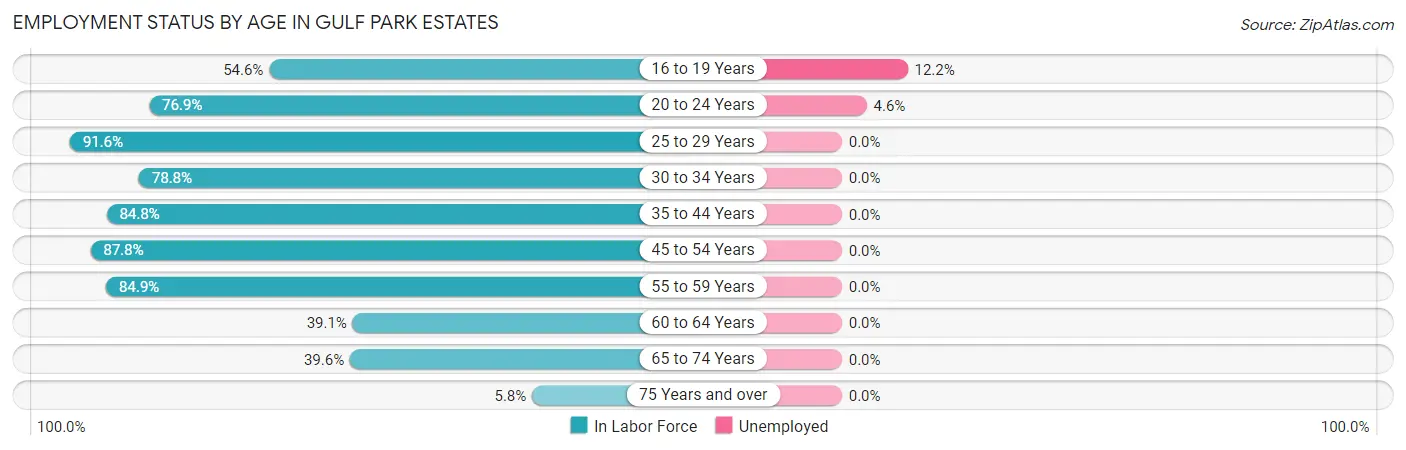
| Age Bracket | In Labor Force | Unemployed |
| 16 to 19 Years | 335 (54.6%) | 41 (12.2%) |
| 20 to 24 Years | 349 (76.9%) | 16 (4.6%) |
| 25 to 29 Years | 458 (91.6%) | 0 (0.0%) |
| 30 to 34 Years | 432 (78.8%) | 0 (0.0%) |
| 35 to 44 Years | 615 (84.8%) | 0 (0.0%) |
| 45 to 54 Years | 808 (87.8%) | 0 (0.0%) |
| 55 to 59 Years | 383 (84.9%) | 0 (0.0%) |
| 60 to 64 Years | 190 (39.1%) | 0 (0.0%) |
| 65 to 74 Years | 248 (39.6%) | 0 (0.0%) |
| 75 Years and over | 24 (5.8%) | 0 (0.0%) |
| Total | 3,844 (67.0%) | 62 (1.6%) |
Employment Status by Educational Attainment in Gulf Park Estates
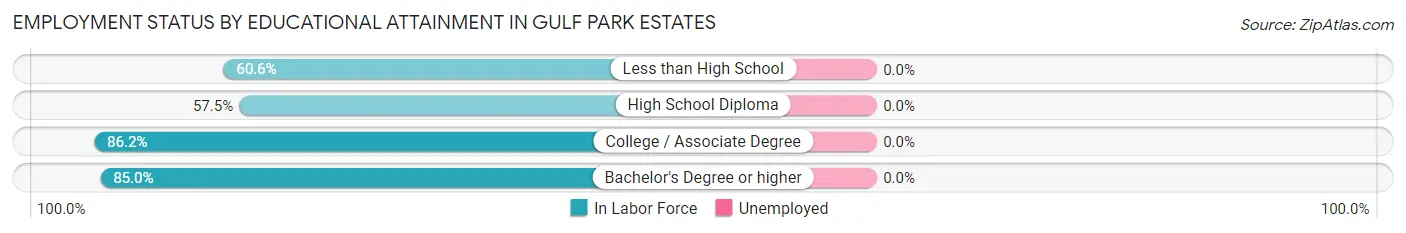
| Educational Attainment | In Labor Force | Unemployed |
| Less than High School | 191 (60.6%) | 0 (0.0%) |
| High School Diploma | 299 (57.5%) | 0 (0.0%) |
| College / Associate Degree | 1,443 (86.2%) | 0 (0.0%) |
| Bachelor's Degree or higher | 953 (85.0%) | 0 (0.0%) |
| Total | 2,886 (79.5%) | 0 (0.0%) |
Employment Occupations by Sex in Gulf Park Estates
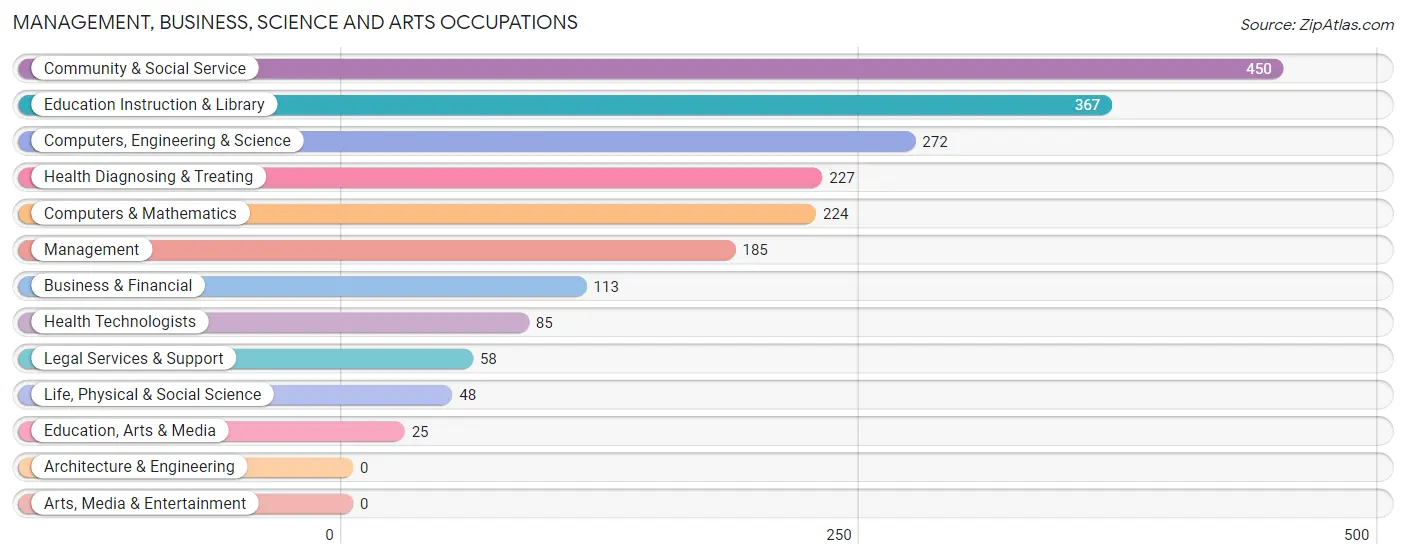
Management, Business, Science and Arts Occupations
The most common Management, Business, Science and Arts occupations in Gulf Park Estates are Community & Social Service (450 | 12.5%), Education Instruction & Library (367 | 10.2%), Computers, Engineering & Science (272 | 7.5%), Health Diagnosing & Treating (227 | 6.3%), and Computers & Mathematics (224 | 6.2%).
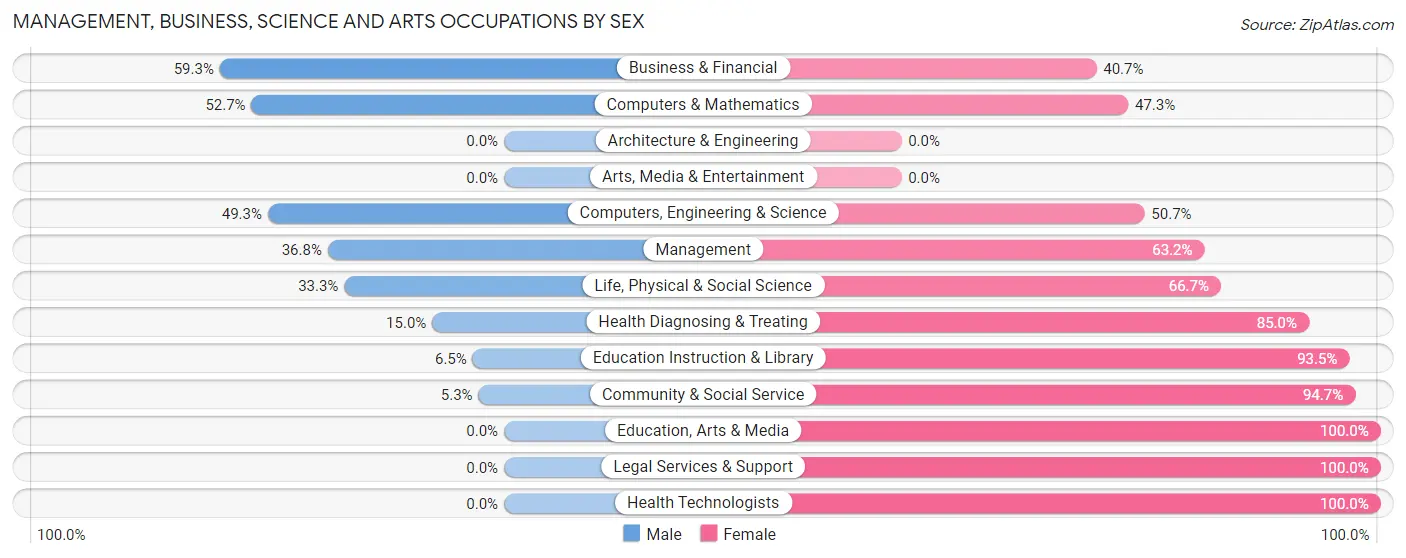
Management, Business, Science and Arts Occupations by Sex
Within the Management, Business, Science and Arts occupations in Gulf Park Estates, the most male-oriented occupations are Business & Financial (59.3%), Computers & Mathematics (52.7%), and Computers, Engineering & Science (49.3%), while the most female-oriented occupations are Education, Arts & Media (100.0%), Legal Services & Support (100.0%), and Health Technologists (100.0%).
| Occupation | Male | Female |
| Management | 68 (36.8%) | 117 (63.2%) |
| Business & Financial | 67 (59.3%) | 46 (40.7%) |
| Computers, Engineering & Science | 134 (49.3%) | 138 (50.7%) |
| Computers & Mathematics | 118 (52.7%) | 106 (47.3%) |
| Architecture & Engineering | 0 (0.0%) | 0 (0.0%) |
| Life, Physical & Social Science | 16 (33.3%) | 32 (66.7%) |
| Community & Social Service | 24 (5.3%) | 426 (94.7%) |
| Education, Arts & Media | 0 (0.0%) | 25 (100.0%) |
| Legal Services & Support | 0 (0.0%) | 58 (100.0%) |
| Education Instruction & Library | 24 (6.5%) | 343 (93.5%) |
| Arts, Media & Entertainment | 0 (0.0%) | 0 (0.0%) |
| Health Diagnosing & Treating | 34 (15.0%) | 193 (85.0%) |
| Health Technologists | 0 (0.0%) | 85 (100.0%) |
| Total (Category) | 327 (26.2%) | 920 (73.8%) |
| Total (Overall) | 1,480 (41.0%) | 2,128 (59.0%) |
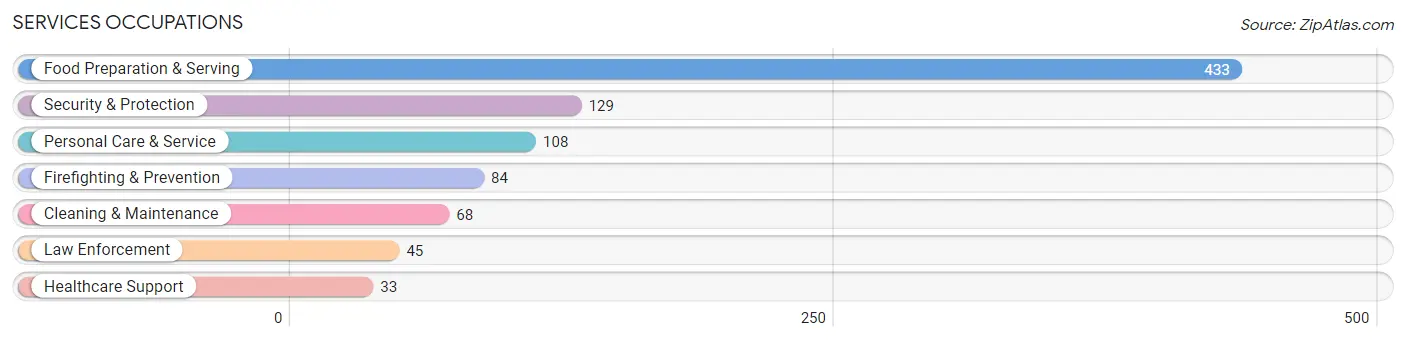
Services Occupations
The most common Services occupations in Gulf Park Estates are Food Preparation & Serving (433 | 12.0%), Security & Protection (129 | 3.6%), Personal Care & Service (108 | 3.0%), Firefighting & Prevention (84 | 2.3%), and Cleaning & Maintenance (68 | 1.9%).
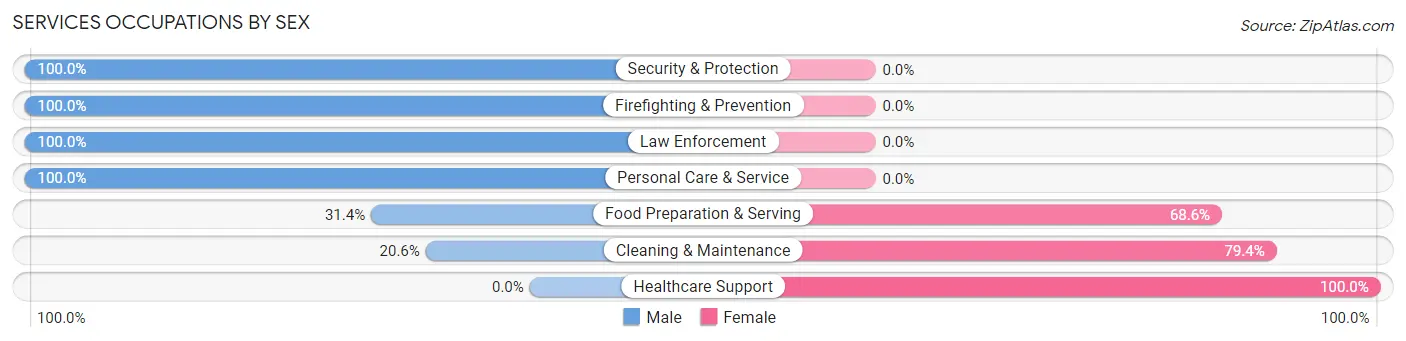
Services Occupations by Sex
Within the Services occupations in Gulf Park Estates, the most male-oriented occupations are Security & Protection (100.0%), Firefighting & Prevention (100.0%), and Law Enforcement (100.0%), while the most female-oriented occupations are Healthcare Support (100.0%), Cleaning & Maintenance (79.4%), and Food Preparation & Serving (68.6%).
| Occupation | Male | Female |
| Healthcare Support | 0 (0.0%) | 33 (100.0%) |
| Security & Protection | 129 (100.0%) | 0 (0.0%) |
| Firefighting & Prevention | 84 (100.0%) | 0 (0.0%) |
| Law Enforcement | 45 (100.0%) | 0 (0.0%) |
| Food Preparation & Serving | 136 (31.4%) | 297 (68.6%) |
| Cleaning & Maintenance | 14 (20.6%) | 54 (79.4%) |
| Personal Care & Service | 108 (100.0%) | 0 (0.0%) |
| Total (Category) | 387 (50.2%) | 384 (49.8%) |
| Total (Overall) | 1,480 (41.0%) | 2,128 (59.0%) |
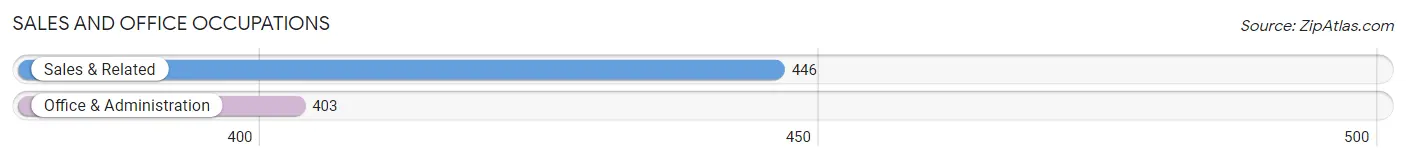
Sales and Office Occupations
The most common Sales and Office occupations in Gulf Park Estates are Sales & Related (446 | 12.4%), and Office & Administration (403 | 11.2%).
Sales and Office Occupations by Sex
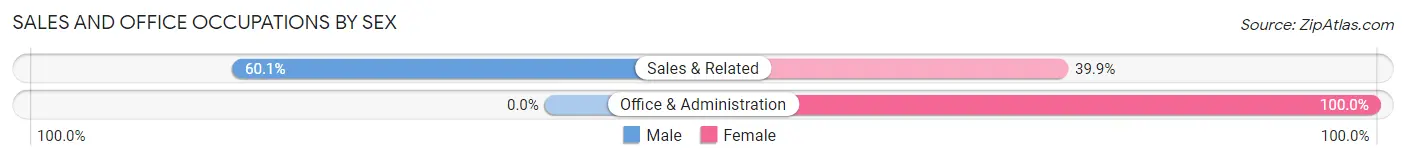
| Occupation | Male | Female |
| Sales & Related | 268 (60.1%) | 178 (39.9%) |
| Office & Administration | 0 (0.0%) | 403 (100.0%) |
| Total (Category) | 268 (31.6%) | 581 (68.4%) |
| Total (Overall) | 1,480 (41.0%) | 2,128 (59.0%) |
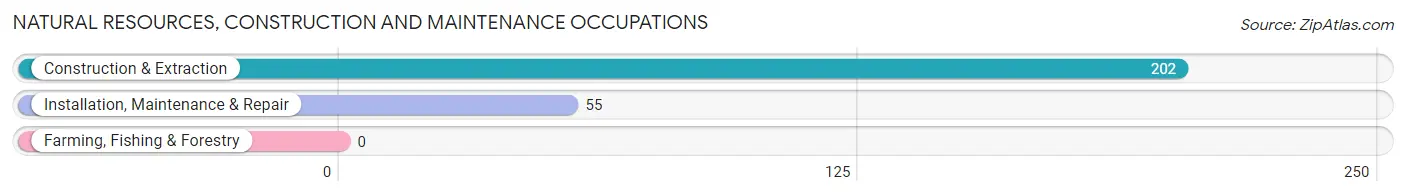
Natural Resources, Construction and Maintenance Occupations
The most common Natural Resources, Construction and Maintenance occupations in Gulf Park Estates are Construction & Extraction (202 | 5.6%), and Installation, Maintenance & Repair (55 | 1.5%).
Natural Resources, Construction and Maintenance Occupations by Sex
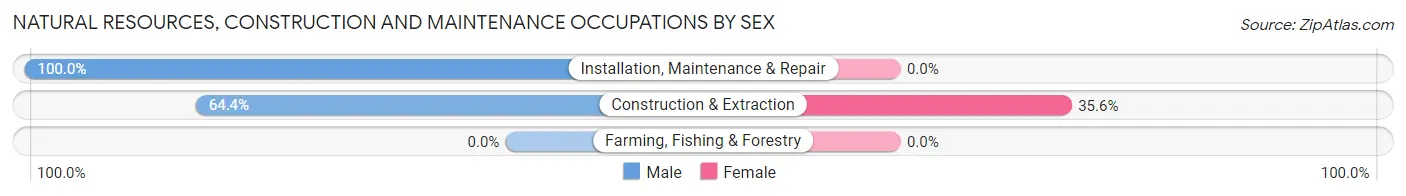
| Occupation | Male | Female |
| Farming, Fishing & Forestry | 0 (0.0%) | 0 (0.0%) |
| Construction & Extraction | 130 (64.4%) | 72 (35.6%) |
| Installation, Maintenance & Repair | 55 (100.0%) | 0 (0.0%) |
| Total (Category) | 185 (72.0%) | 72 (28.0%) |
| Total (Overall) | 1,480 (41.0%) | 2,128 (59.0%) |
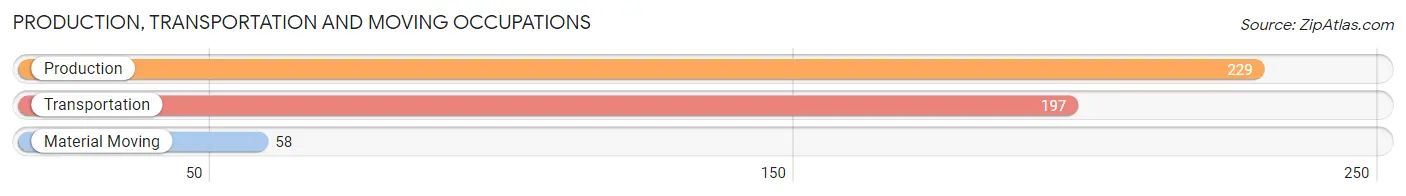
Production, Transportation and Moving Occupations
The most common Production, Transportation and Moving occupations in Gulf Park Estates are Production (229 | 6.4%), Transportation (197 | 5.5%), and Material Moving (58 | 1.6%).
Production, Transportation and Moving Occupations by Sex
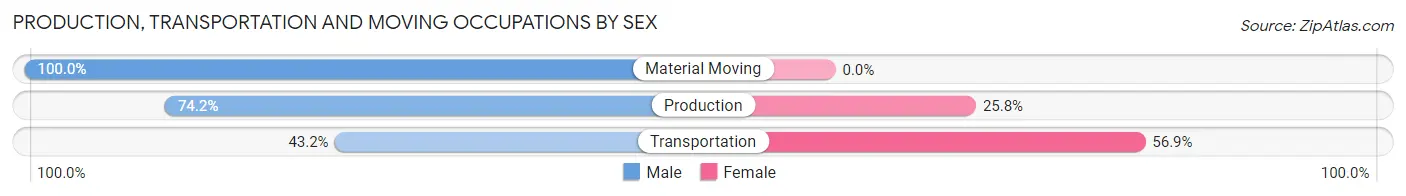
| Occupation | Male | Female |
| Production | 170 (74.2%) | 59 (25.8%) |
| Transportation | 85 (43.1%) | 112 (56.9%) |
| Material Moving | 58 (100.0%) | 0 (0.0%) |
| Total (Category) | 313 (64.7%) | 171 (35.3%) |
| Total (Overall) | 1,480 (41.0%) | 2,128 (59.0%) |
Employment Industries by Sex in Gulf Park Estates
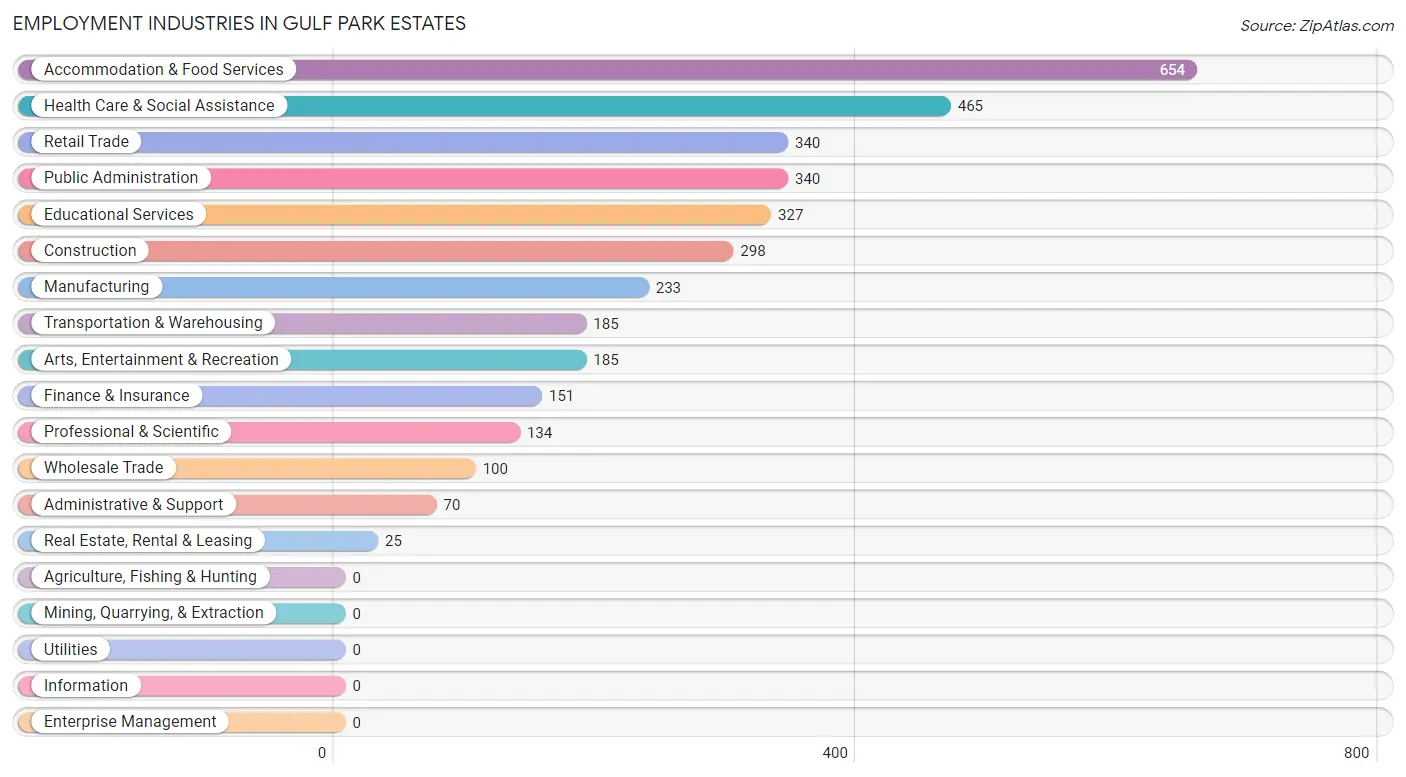
Employment Industries in Gulf Park Estates
The major employment industries in Gulf Park Estates include Accommodation & Food Services (654 | 18.1%), Health Care & Social Assistance (465 | 12.9%), Retail Trade (340 | 9.4%), Public Administration (340 | 9.4%), and Educational Services (327 | 9.1%).
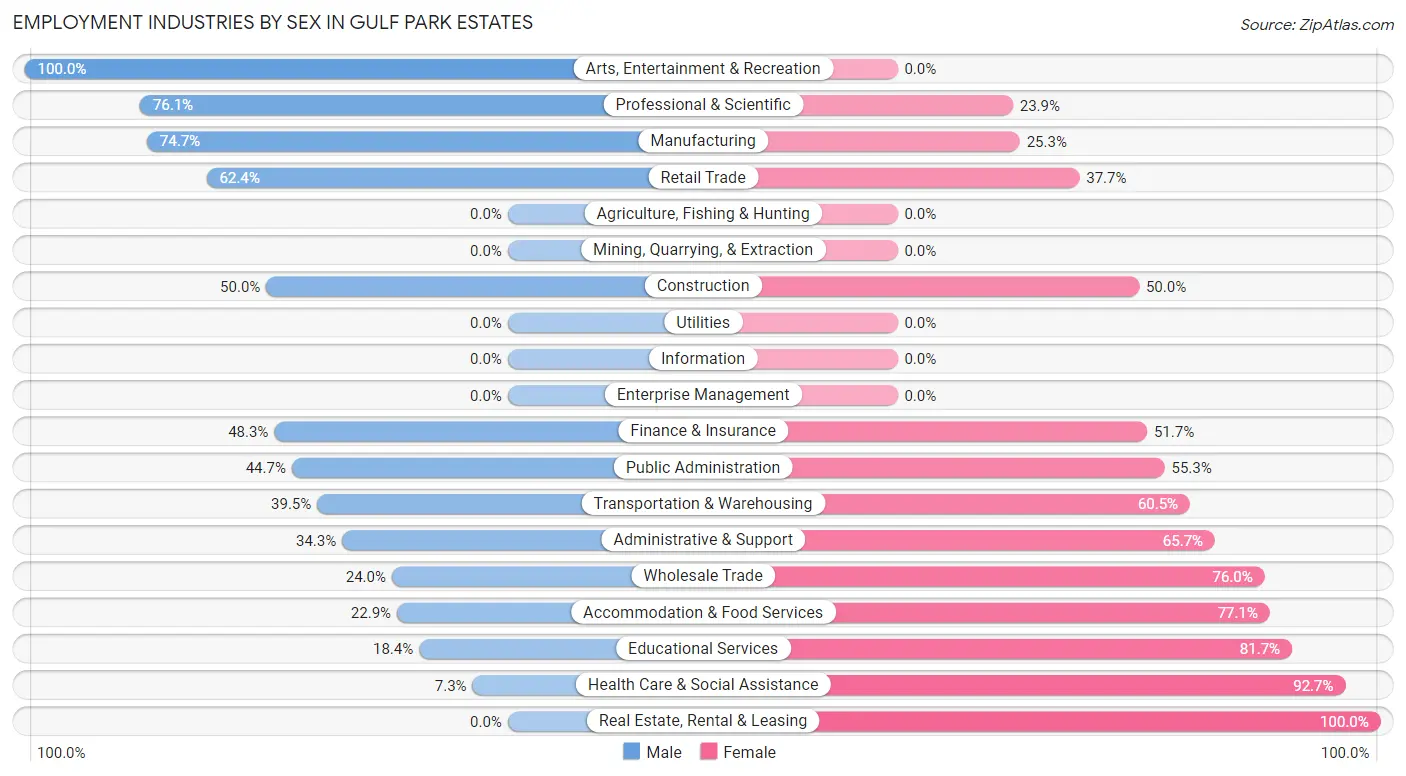
Employment Industries by Sex in Gulf Park Estates
The Gulf Park Estates industries that see more men than women are Arts, Entertainment & Recreation (100.0%), Professional & Scientific (76.1%), and Manufacturing (74.7%), whereas the industries that tend to have a higher number of women are Real Estate, Rental & Leasing (100.0%), Health Care & Social Assistance (92.7%), and Educational Services (81.7%).
| Industry | Male | Female |
| Agriculture, Fishing & Hunting | 0 (0.0%) | 0 (0.0%) |
| Mining, Quarrying, & Extraction | 0 (0.0%) | 0 (0.0%) |
| Construction | 149 (50.0%) | 149 (50.0%) |
| Manufacturing | 174 (74.7%) | 59 (25.3%) |
| Wholesale Trade | 24 (24.0%) | 76 (76.0%) |
| Retail Trade | 212 (62.4%) | 128 (37.7%) |
| Transportation & Warehousing | 73 (39.5%) | 112 (60.5%) |
| Utilities | 0 (0.0%) | 0 (0.0%) |
| Information | 0 (0.0%) | 0 (0.0%) |
| Finance & Insurance | 73 (48.3%) | 78 (51.7%) |
| Real Estate, Rental & Leasing | 0 (0.0%) | 25 (100.0%) |
| Professional & Scientific | 102 (76.1%) | 32 (23.9%) |
| Enterprise Management | 0 (0.0%) | 0 (0.0%) |
| Administrative & Support | 24 (34.3%) | 46 (65.7%) |
| Educational Services | 60 (18.3%) | 267 (81.7%) |
| Health Care & Social Assistance | 34 (7.3%) | 431 (92.7%) |
| Arts, Entertainment & Recreation | 185 (100.0%) | 0 (0.0%) |
| Accommodation & Food Services | 150 (22.9%) | 504 (77.1%) |
| Public Administration | 152 (44.7%) | 188 (55.3%) |
| Total | 1,480 (41.0%) | 2,128 (59.0%) |
Education in Gulf Park Estates
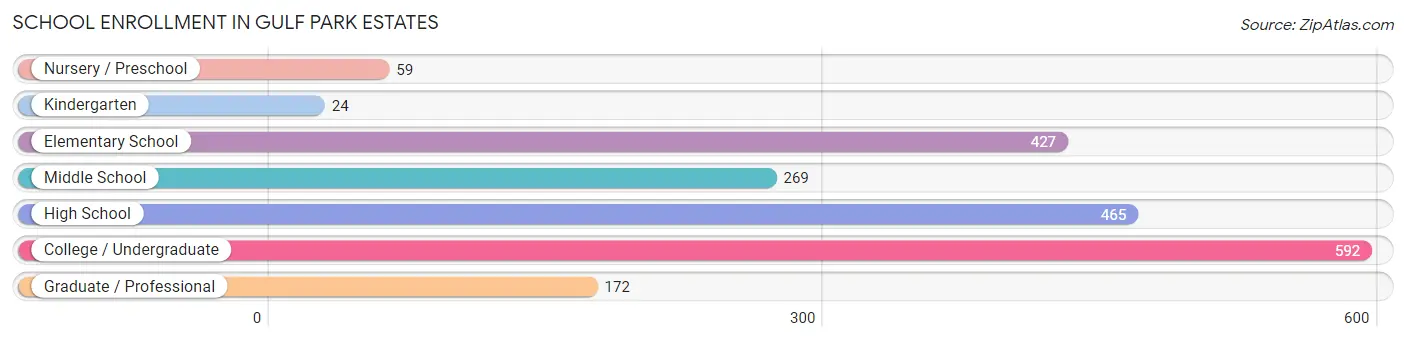
School Enrollment in Gulf Park Estates
The most common levels of schooling among the 2,008 students in Gulf Park Estates are college / undergraduate (592 | 29.5%), high school (465 | 23.2%), and elementary school (427 | 21.3%).
| School Level | # Students | % Students |
| Nursery / Preschool | 59 | 2.9% |
| Kindergarten | 24 | 1.2% |
| Elementary School | 427 | 21.3% |
| Middle School | 269 | 13.4% |
| High School | 465 | 23.2% |
| College / Undergraduate | 592 | 29.5% |
| Graduate / Professional | 172 | 8.6% |
| Total | 2,008 | 100.0% |
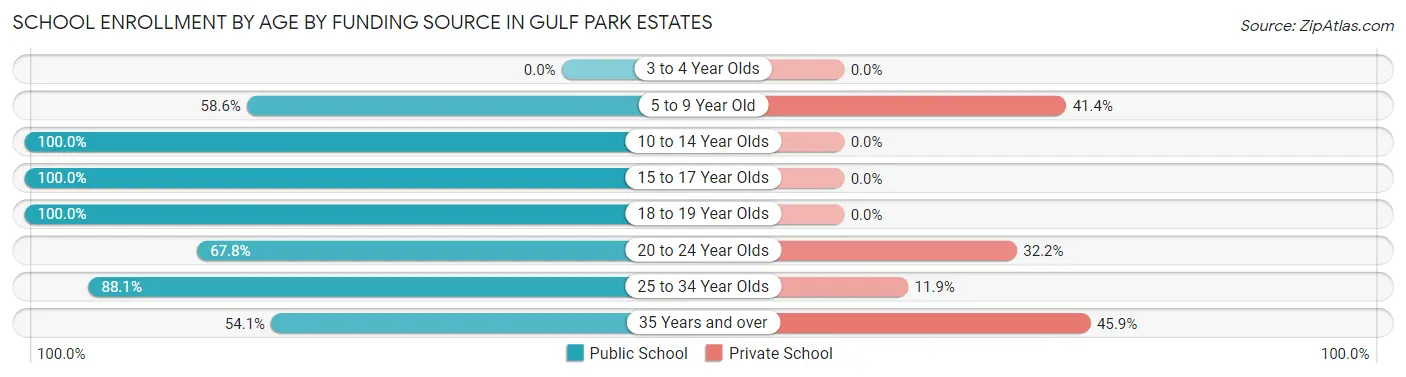
School Enrollment by Age by Funding Source in Gulf Park Estates
Out of a total of 2,008 students who are enrolled in schools in Gulf Park Estates, 331 (16.5%) attend a private institution, while the remaining 1,677 (83.5%) are enrolled in public schools. The age group of 35 years and over has the highest likelihood of being enrolled in private schools, with 78 (45.9% in the age bracket) enrolled. Conversely, the age group of 10 to 14 year olds has the lowest likelihood of being enrolled in a private school, with 390 (100.0% in the age bracket) attending a public institution.
| Age Bracket | Public School | Private School |
| 3 to 4 Year Olds | 0 (0.0%) | 0 (0.0%) |
| 5 to 9 Year Old | 224 (58.6%) | 158 (41.4%) |
| 10 to 14 Year Olds | 390 (100.0%) | 0 (0.0%) |
| 15 to 17 Year Olds | 461 (100.0%) | 0 (0.0%) |
| 18 to 19 Year Olds | 90 (100.0%) | 0 (0.0%) |
| 20 to 24 Year Olds | 116 (67.8%) | 55 (32.2%) |
| 25 to 34 Year Olds | 303 (88.1%) | 41 (11.9%) |
| 35 Years and over | 92 (54.1%) | 78 (45.9%) |
| Total | 1,677 (83.5%) | 331 (16.5%) |
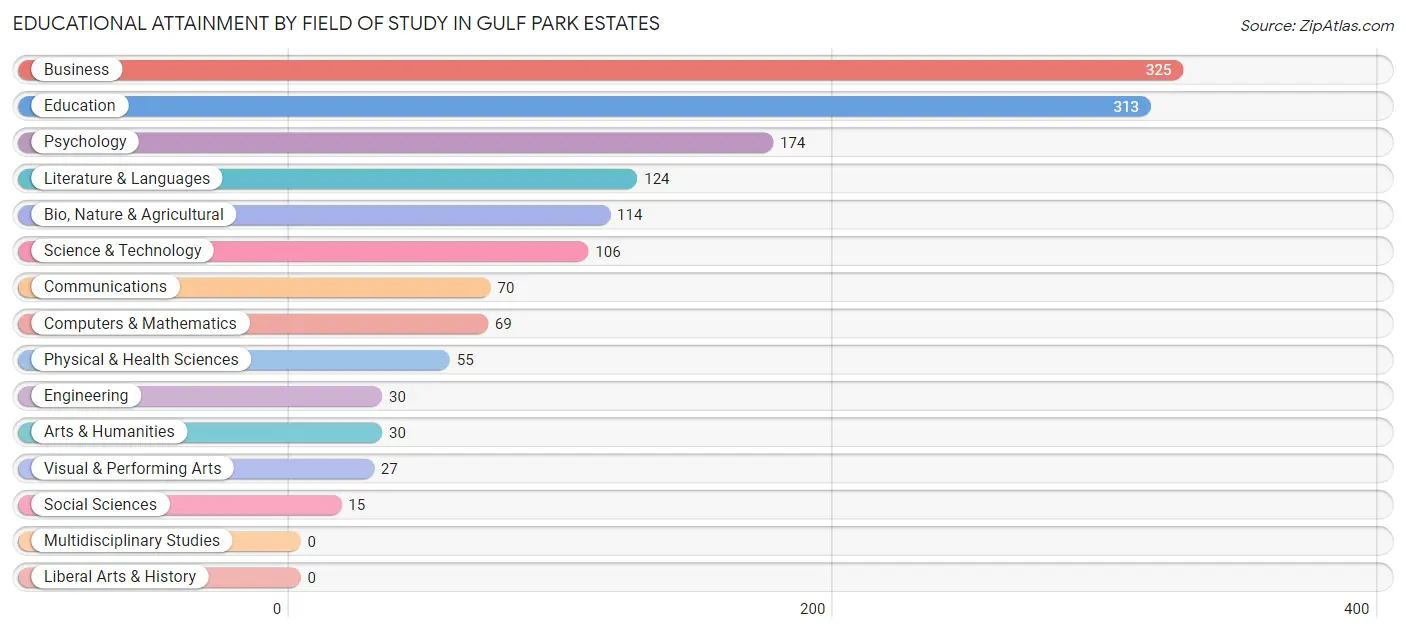
Educational Attainment by Field of Study in Gulf Park Estates
Business (325 | 22.4%), education (313 | 21.6%), psychology (174 | 12.0%), literature & languages (124 | 8.5%), and bio, nature & agricultural (114 | 7.9%) are the most common fields of study among 1,452 individuals in Gulf Park Estates who have obtained a bachelor's degree or higher.
| Field of Study | # Graduates | % Graduates |
| Computers & Mathematics | 69 | 4.8% |
| Bio, Nature & Agricultural | 114 | 7.9% |
| Physical & Health Sciences | 55 | 3.8% |
| Psychology | 174 | 12.0% |
| Social Sciences | 15 | 1.0% |
| Engineering | 30 | 2.1% |
| Multidisciplinary Studies | 0 | 0.0% |
| Science & Technology | 106 | 7.3% |
| Business | 325 | 22.4% |
| Education | 313 | 21.6% |
| Literature & Languages | 124 | 8.5% |
| Liberal Arts & History | 0 | 0.0% |
| Visual & Performing Arts | 27 | 1.9% |
| Communications | 70 | 4.8% |
| Arts & Humanities | 30 | 2.1% |
| Total | 1,452 | 100.0% |
Transportation & Commute in Gulf Park Estates
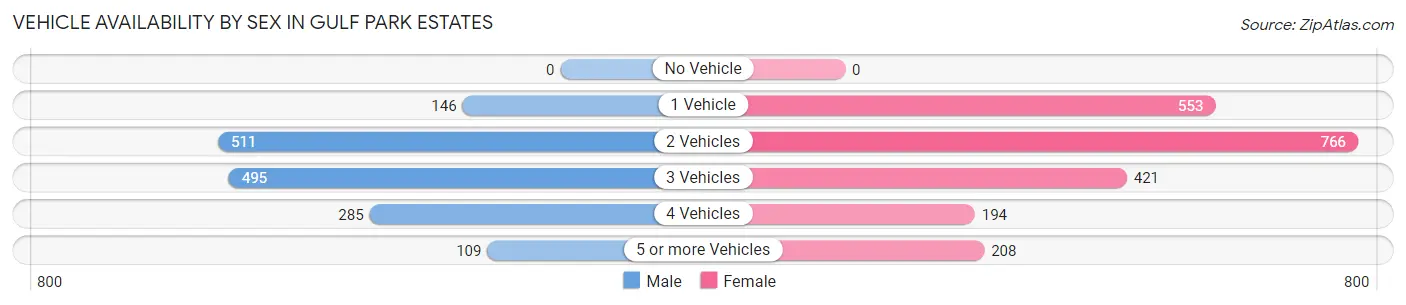
Vehicle Availability by Sex in Gulf Park Estates
The most prevalent vehicle ownership categories in Gulf Park Estates are males with 2 vehicles (511, accounting for 33.1%) and females with 2 vehicles (766, making up 23.9%).
| Vehicles Available | Male | Female |
| No Vehicle | 0 (0.0%) | 0 (0.0%) |
| 1 Vehicle | 146 (9.4%) | 553 (25.8%) |
| 2 Vehicles | 511 (33.1%) | 766 (35.8%) |
| 3 Vehicles | 495 (32.0%) | 421 (19.7%) |
| 4 Vehicles | 285 (18.4%) | 194 (9.1%) |
| 5 or more Vehicles | 109 (7.0%) | 208 (9.7%) |
| Total | 1,546 (100.0%) | 2,142 (100.0%) |
Commute Time in Gulf Park Estates
The most frequently occuring commute durations in Gulf Park Estates are 30 to 34 minutes (505 commuters, 14.0%), 15 to 19 minutes (498 commuters, 13.8%), and 5 to 9 minutes (491 commuters, 13.6%).
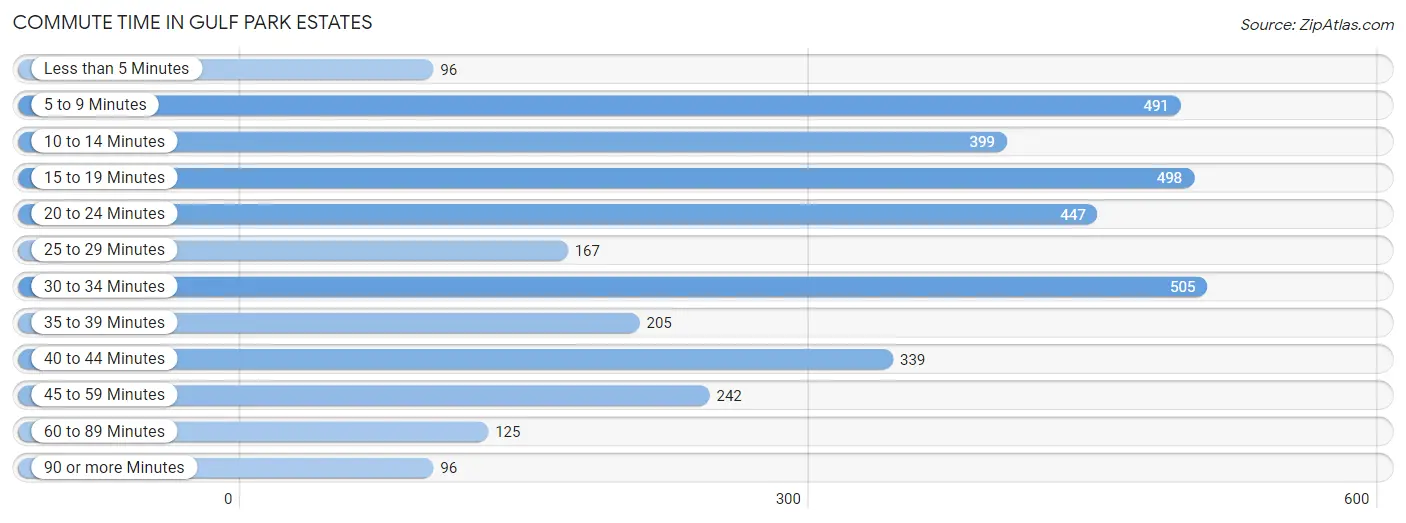
| Commute Time | # Commuters | % Commuters |
| Less than 5 Minutes | 96 | 2.7% |
| 5 to 9 Minutes | 491 | 13.6% |
| 10 to 14 Minutes | 399 | 11.1% |
| 15 to 19 Minutes | 498 | 13.8% |
| 20 to 24 Minutes | 447 | 12.4% |
| 25 to 29 Minutes | 167 | 4.6% |
| 30 to 34 Minutes | 505 | 14.0% |
| 35 to 39 Minutes | 205 | 5.7% |
| 40 to 44 Minutes | 339 | 9.4% |
| 45 to 59 Minutes | 242 | 6.7% |
| 60 to 89 Minutes | 125 | 3.5% |
| 90 or more Minutes | 96 | 2.7% |
Commute Time by Sex in Gulf Park Estates
The most common commute times in Gulf Park Estates are 15 to 19 minutes (220 commuters, 14.8%) for males and 5 to 9 minutes (317 commuters, 14.9%) for females.
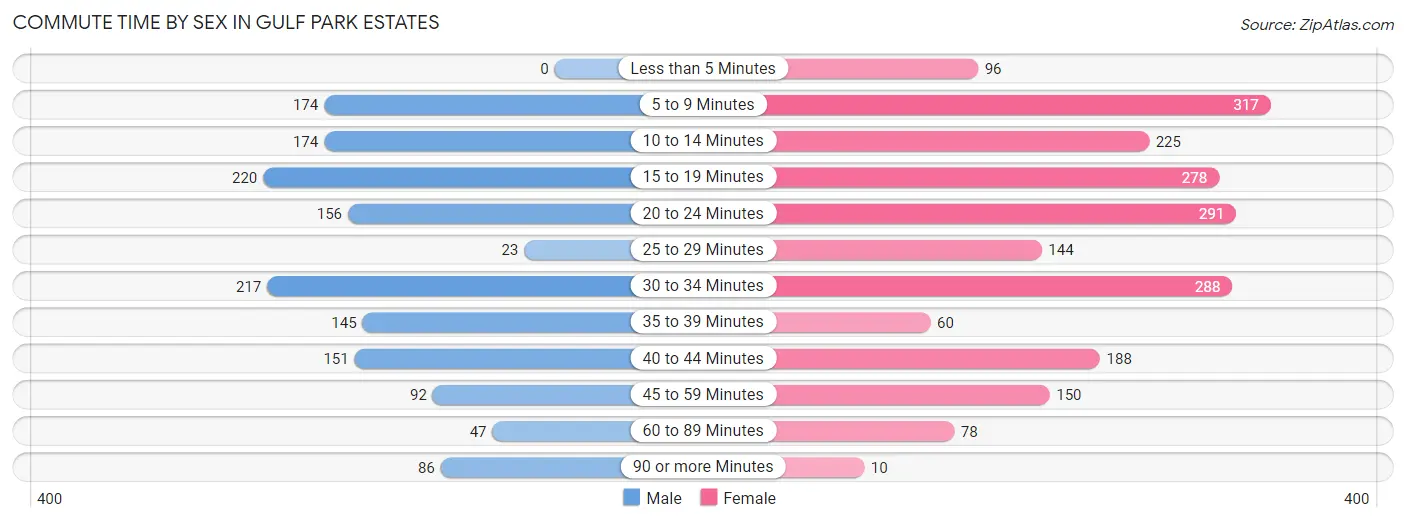
| Commute Time | Male | Female |
| Less than 5 Minutes | 0 (0.0%) | 96 (4.5%) |
| 5 to 9 Minutes | 174 (11.7%) | 317 (14.9%) |
| 10 to 14 Minutes | 174 (11.7%) | 225 (10.6%) |
| 15 to 19 Minutes | 220 (14.8%) | 278 (13.1%) |
| 20 to 24 Minutes | 156 (10.5%) | 291 (13.7%) |
| 25 to 29 Minutes | 23 (1.5%) | 144 (6.8%) |
| 30 to 34 Minutes | 217 (14.6%) | 288 (13.6%) |
| 35 to 39 Minutes | 145 (9.8%) | 60 (2.8%) |
| 40 to 44 Minutes | 151 (10.2%) | 188 (8.8%) |
| 45 to 59 Minutes | 92 (6.2%) | 150 (7.1%) |
| 60 to 89 Minutes | 47 (3.2%) | 78 (3.7%) |
| 90 or more Minutes | 86 (5.8%) | 10 (0.5%) |
Time of Departure to Work by Sex in Gulf Park Estates
The most frequent times of departure to work in Gulf Park Estates are 6:00 AM to 6:29 AM (244, 16.4%) for males and 7:00 AM to 7:29 AM (474, 22.3%) for females.
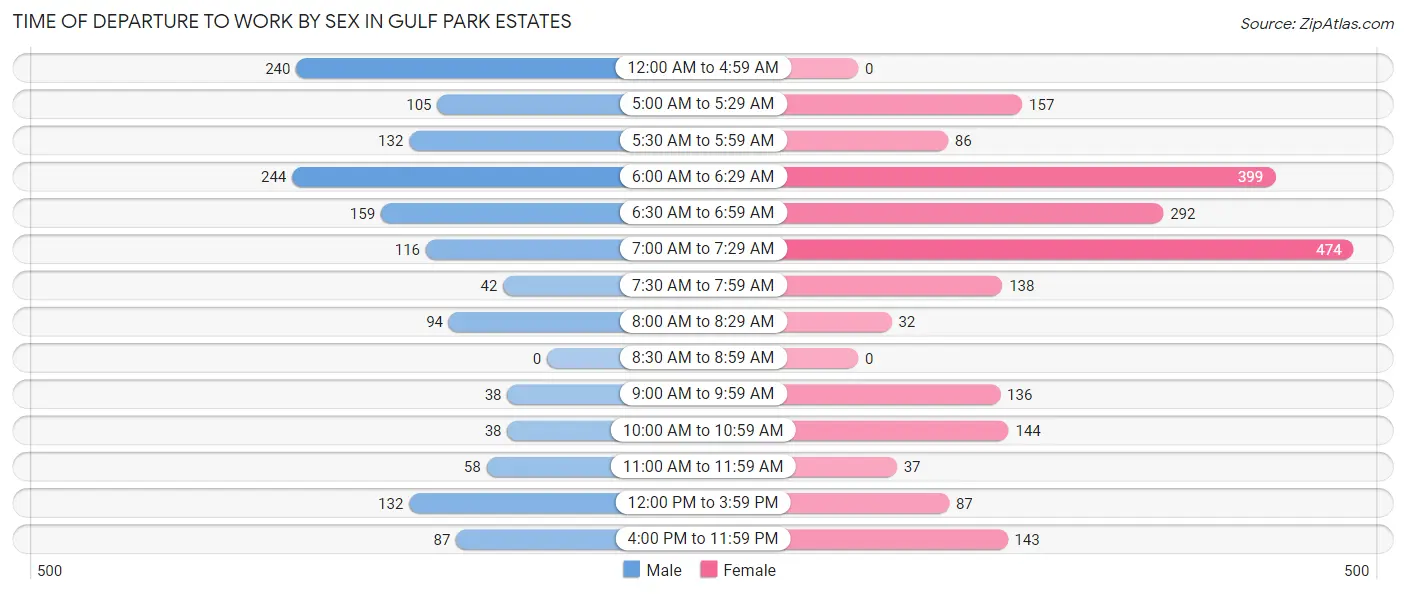
| Time of Departure | Male | Female |
| 12:00 AM to 4:59 AM | 240 (16.2%) | 0 (0.0%) |
| 5:00 AM to 5:29 AM | 105 (7.1%) | 157 (7.4%) |
| 5:30 AM to 5:59 AM | 132 (8.9%) | 86 (4.1%) |
| 6:00 AM to 6:29 AM | 244 (16.4%) | 399 (18.8%) |
| 6:30 AM to 6:59 AM | 159 (10.7%) | 292 (13.7%) |
| 7:00 AM to 7:29 AM | 116 (7.8%) | 474 (22.3%) |
| 7:30 AM to 7:59 AM | 42 (2.8%) | 138 (6.5%) |
| 8:00 AM to 8:29 AM | 94 (6.3%) | 32 (1.5%) |
| 8:30 AM to 8:59 AM | 0 (0.0%) | 0 (0.0%) |
| 9:00 AM to 9:59 AM | 38 (2.6%) | 136 (6.4%) |
| 10:00 AM to 10:59 AM | 38 (2.6%) | 144 (6.8%) |
| 11:00 AM to 11:59 AM | 58 (3.9%) | 37 (1.7%) |
| 12:00 PM to 3:59 PM | 132 (8.9%) | 87 (4.1%) |
| 4:00 PM to 11:59 PM | 87 (5.9%) | 143 (6.7%) |
| Total | 1,485 (100.0%) | 2,125 (100.0%) |
Housing Occupancy in Gulf Park Estates
Occupancy by Ownership in Gulf Park Estates
Of the total 2,447 dwellings in Gulf Park Estates, owner-occupied units account for 1,594 (65.1%), while renter-occupied units make up 853 (34.9%).
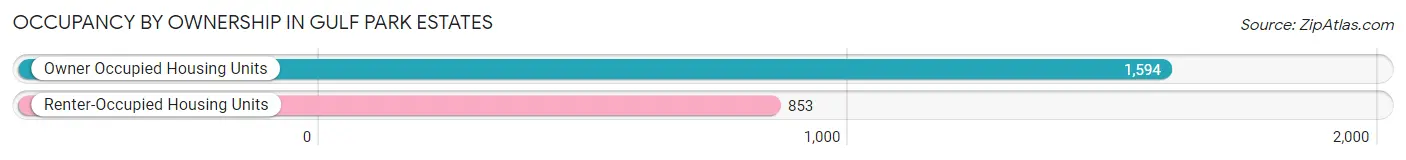
| Occupancy | # Housing Units | % Housing Units |
| Owner Occupied Housing Units | 1,594 | 65.1% |
| Renter-Occupied Housing Units | 853 | 34.9% |
| Total Occupied Housing Units | 2,447 | 100.0% |
Occupancy by Household Size in Gulf Park Estates
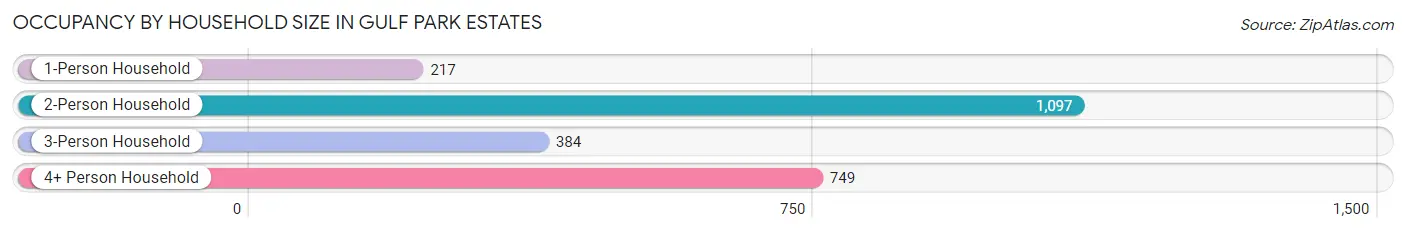
| Household Size | # Housing Units | % Housing Units |
| 1-Person Household | 217 | 8.9% |
| 2-Person Household | 1,097 | 44.8% |
| 3-Person Household | 384 | 15.7% |
| 4+ Person Household | 749 | 30.6% |
| Total Housing Units | 2,447 | 100.0% |
Occupancy by Ownership by Household Size in Gulf Park Estates
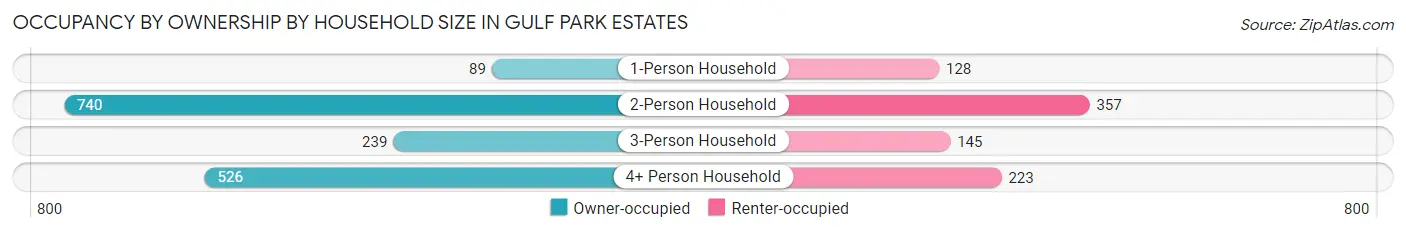
| Household Size | Owner-occupied | Renter-occupied |
| 1-Person Household | 89 (41.0%) | 128 (59.0%) |
| 2-Person Household | 740 (67.5%) | 357 (32.5%) |
| 3-Person Household | 239 (62.2%) | 145 (37.8%) |
| 4+ Person Household | 526 (70.2%) | 223 (29.8%) |
| Total Housing Units | 1,594 (65.1%) | 853 (34.9%) |
Occupancy by Educational Attainment in Gulf Park Estates
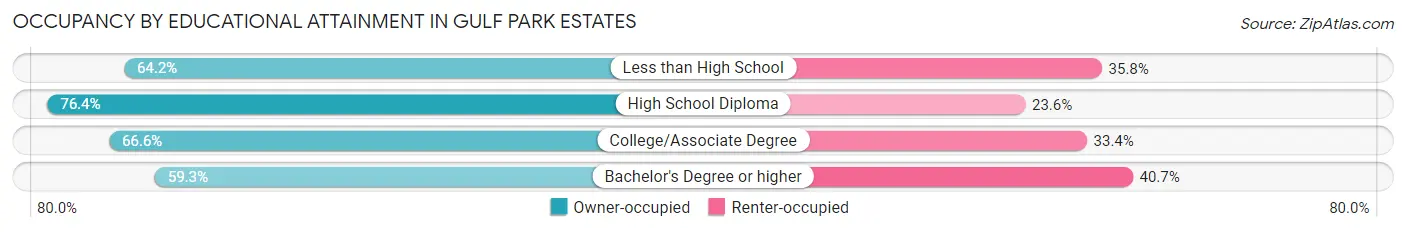
| Household Size | Owner-occupied | Renter-occupied |
| Less than High School | 106 (64.2%) | 59 (35.8%) |
| High School Diploma | 178 (76.4%) | 55 (23.6%) |
| College/Associate Degree | 862 (66.6%) | 432 (33.4%) |
| Bachelor's Degree or higher | 448 (59.3%) | 307 (40.7%) |
Occupancy by Age of Householder in Gulf Park Estates
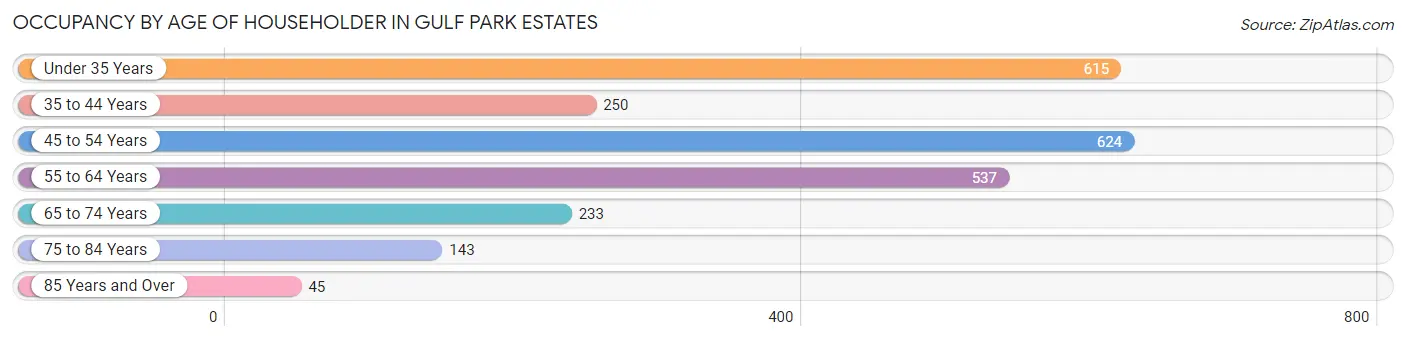
| Age Bracket | # Households | % Households |
| Under 35 Years | 615 | 25.1% |
| 35 to 44 Years | 250 | 10.2% |
| 45 to 54 Years | 624 | 25.5% |
| 55 to 64 Years | 537 | 22.0% |
| 65 to 74 Years | 233 | 9.5% |
| 75 to 84 Years | 143 | 5.8% |
| 85 Years and Over | 45 | 1.8% |
| Total | 2,447 | 100.0% |
Housing Finances in Gulf Park Estates
Median Income by Occupancy in Gulf Park Estates
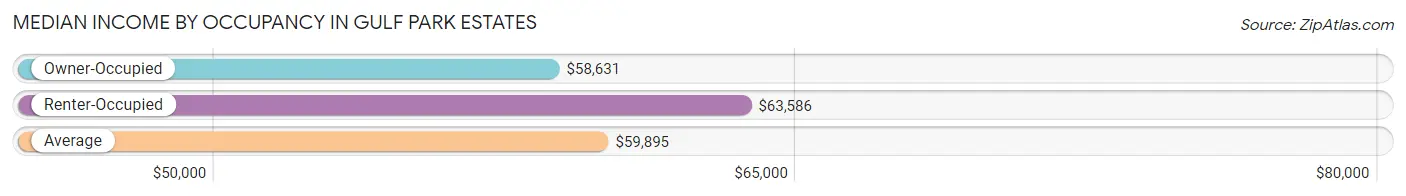
| Occupancy Type | # Households | Median Income |
| Owner-Occupied | 1,594 (65.1%) | $58,631 |
| Renter-Occupied | 853 (34.9%) | $63,586 |
| Average | 2,447 (100.0%) | $59,895 |
Occupancy by Householder Income Bracket in Gulf Park Estates
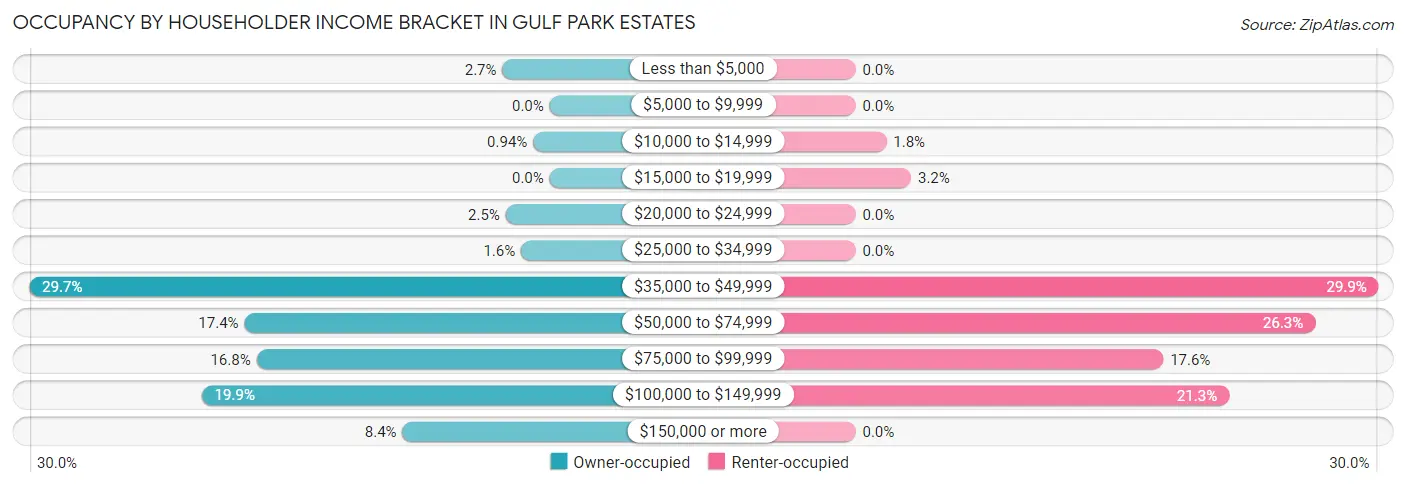
| Income Bracket | Owner-occupied | Renter-occupied |
| Less than $5,000 | 43 (2.7%) | 0 (0.0%) |
| $5,000 to $9,999 | 0 (0.0%) | 0 (0.0%) |
| $10,000 to $14,999 | 15 (0.9%) | 15 (1.8%) |
| $15,000 to $19,999 | 0 (0.0%) | 27 (3.2%) |
| $20,000 to $24,999 | 40 (2.5%) | 0 (0.0%) |
| $25,000 to $34,999 | 26 (1.6%) | 0 (0.0%) |
| $35,000 to $49,999 | 474 (29.7%) | 255 (29.9%) |
| $50,000 to $74,999 | 278 (17.4%) | 224 (26.3%) |
| $75,000 to $99,999 | 267 (16.8%) | 150 (17.6%) |
| $100,000 to $149,999 | 317 (19.9%) | 182 (21.3%) |
| $150,000 or more | 134 (8.4%) | 0 (0.0%) |
| Total | 1,594 (100.0%) | 853 (100.0%) |
Monthly Housing Cost Tiers in Gulf Park Estates
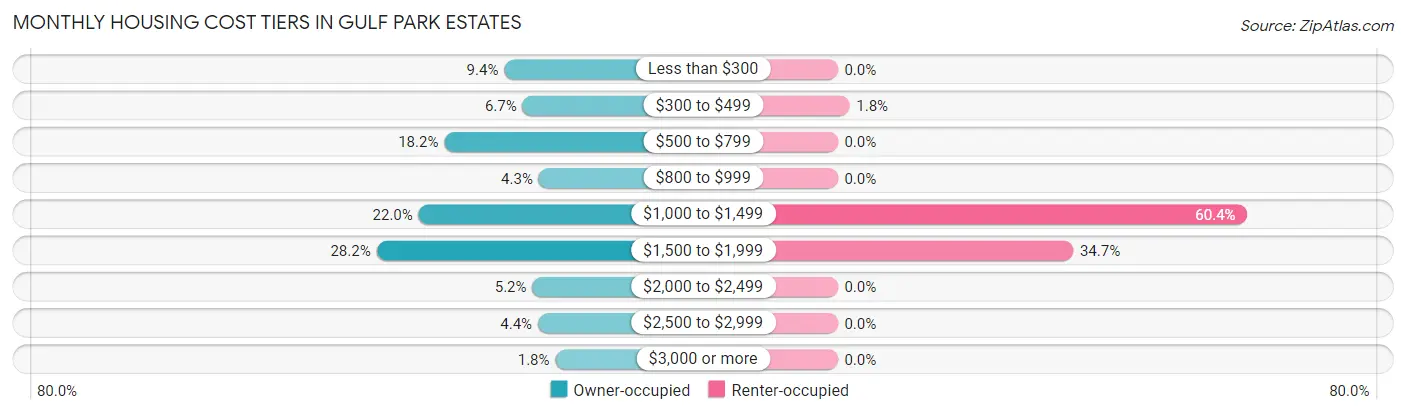
| Monthly Cost | Owner-occupied | Renter-occupied |
| Less than $300 | 149 (9.3%) | 0 (0.0%) |
| $300 to $499 | 106 (6.7%) | 15 (1.8%) |
| $500 to $799 | 290 (18.2%) | 0 (0.0%) |
| $800 to $999 | 68 (4.3%) | 0 (0.0%) |
| $1,000 to $1,499 | 350 (22.0%) | 515 (60.4%) |
| $1,500 to $1,999 | 449 (28.2%) | 296 (34.7%) |
| $2,000 to $2,499 | 83 (5.2%) | 0 (0.0%) |
| $2,500 to $2,999 | 70 (4.4%) | 0 (0.0%) |
| $3,000 or more | 29 (1.8%) | 0 (0.0%) |
| Total | 1,594 (100.0%) | 853 (100.0%) |
Physical Housing Characteristics in Gulf Park Estates
Housing Structures in Gulf Park Estates
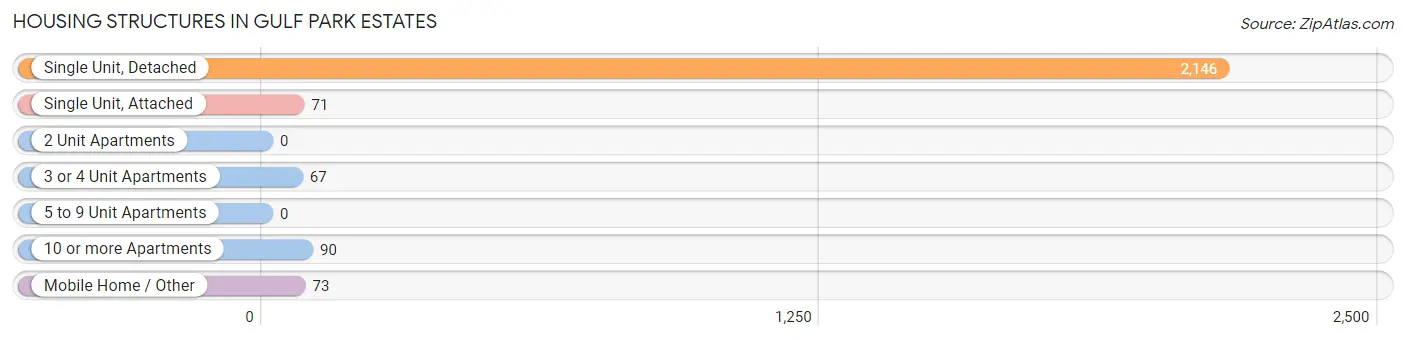
| Structure Type | # Housing Units | % Housing Units |
| Single Unit, Detached | 2,146 | 87.7% |
| Single Unit, Attached | 71 | 2.9% |
| 2 Unit Apartments | 0 | 0.0% |
| 3 or 4 Unit Apartments | 67 | 2.7% |
| 5 to 9 Unit Apartments | 0 | 0.0% |
| 10 or more Apartments | 90 | 3.7% |
| Mobile Home / Other | 73 | 3.0% |
| Total | 2,447 | 100.0% |
Housing Structures by Occupancy in Gulf Park Estates
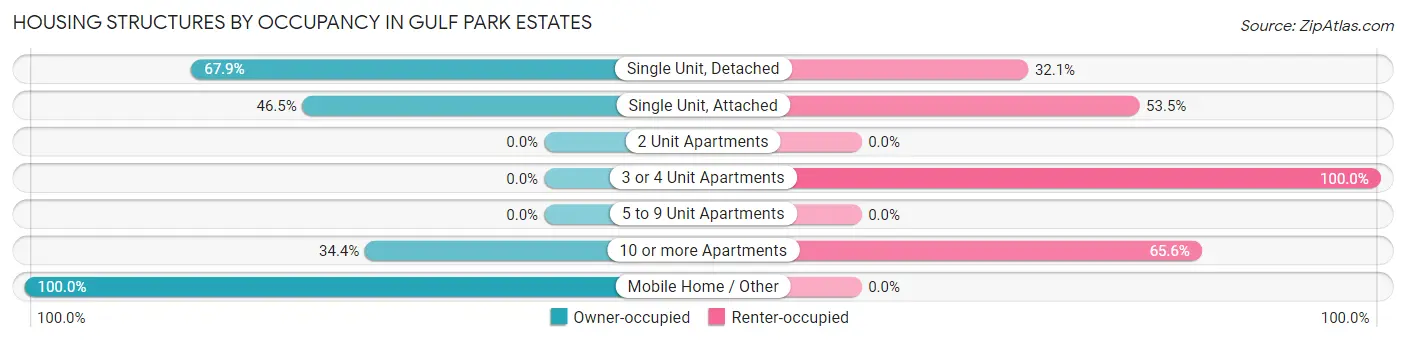
| Structure Type | Owner-occupied | Renter-occupied |
| Single Unit, Detached | 1,457 (67.9%) | 689 (32.1%) |
| Single Unit, Attached | 33 (46.5%) | 38 (53.5%) |
| 2 Unit Apartments | 0 (0.0%) | 0 (0.0%) |
| 3 or 4 Unit Apartments | 0 (0.0%) | 67 (100.0%) |
| 5 to 9 Unit Apartments | 0 (0.0%) | 0 (0.0%) |
| 10 or more Apartments | 31 (34.4%) | 59 (65.6%) |
| Mobile Home / Other | 73 (100.0%) | 0 (0.0%) |
| Total | 1,594 (65.1%) | 853 (34.9%) |
Housing Structures by Number of Rooms in Gulf Park Estates
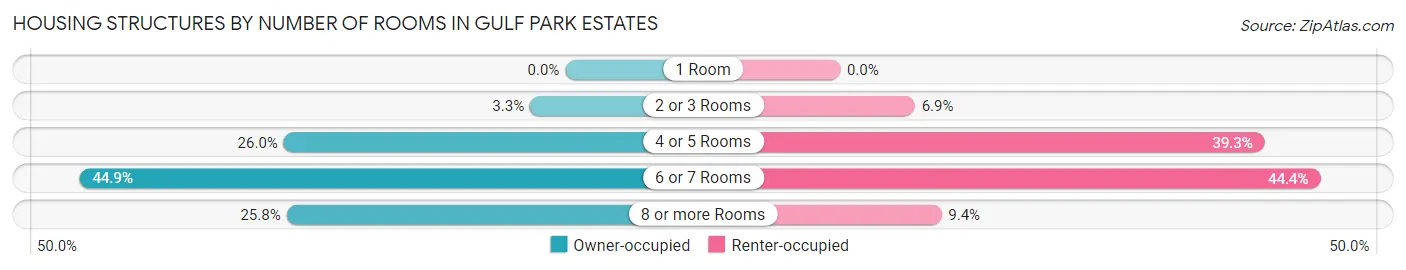
| Number of Rooms | Owner-occupied | Renter-occupied |
| 1 Room | 0 (0.0%) | 0 (0.0%) |
| 2 or 3 Rooms | 52 (3.3%) | 59 (6.9%) |
| 4 or 5 Rooms | 415 (26.0%) | 335 (39.3%) |
| 6 or 7 Rooms | 716 (44.9%) | 379 (44.4%) |
| 8 or more Rooms | 411 (25.8%) | 80 (9.4%) |
| Total | 1,594 (100.0%) | 853 (100.0%) |
Housing Structure by Heating Type in Gulf Park Estates
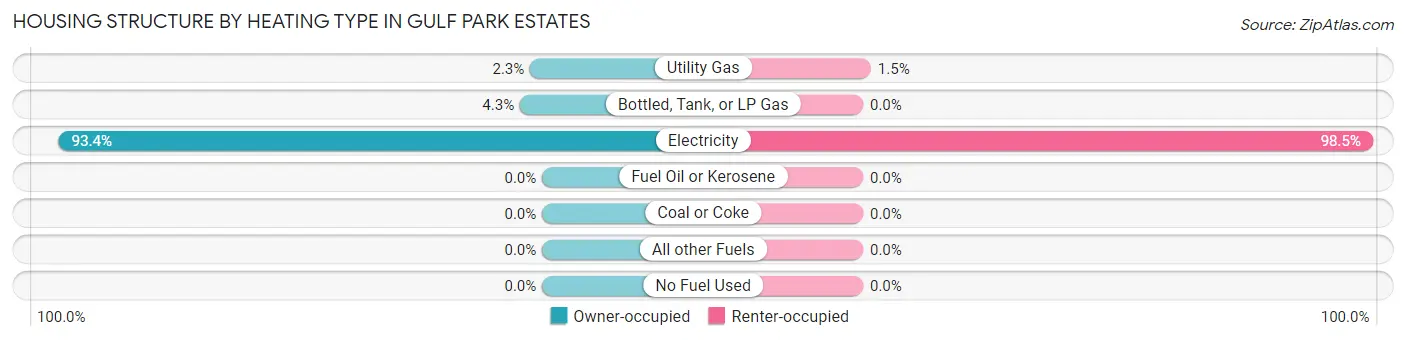
| Heating Type | Owner-occupied | Renter-occupied |
| Utility Gas | 37 (2.3%) | 13 (1.5%) |
| Bottled, Tank, or LP Gas | 68 (4.3%) | 0 (0.0%) |
| Electricity | 1,489 (93.4%) | 840 (98.5%) |
| Fuel Oil or Kerosene | 0 (0.0%) | 0 (0.0%) |
| Coal or Coke | 0 (0.0%) | 0 (0.0%) |
| All other Fuels | 0 (0.0%) | 0 (0.0%) |
| No Fuel Used | 0 (0.0%) | 0 (0.0%) |
| Total | 1,594 (100.0%) | 853 (100.0%) |
Household Vehicle Usage in Gulf Park Estates
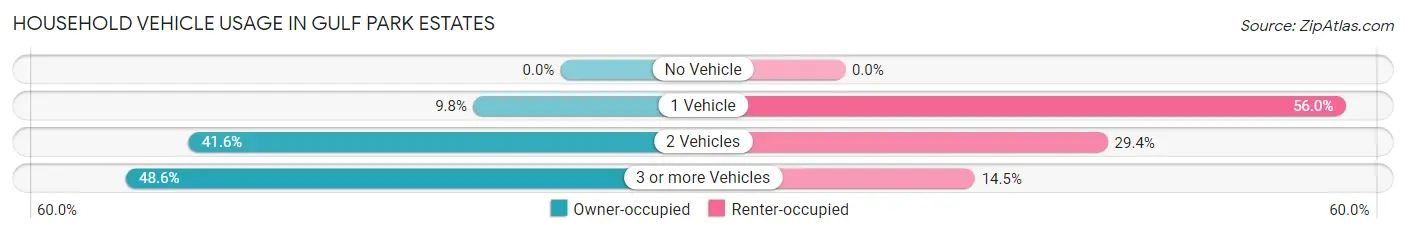
| Vehicles per Household | Owner-occupied | Renter-occupied |
| No Vehicle | 0 (0.0%) | 0 (0.0%) |
| 1 Vehicle | 156 (9.8%) | 478 (56.0%) |
| 2 Vehicles | 663 (41.6%) | 251 (29.4%) |
| 3 or more Vehicles | 775 (48.6%) | 124 (14.5%) |
| Total | 1,594 (100.0%) | 853 (100.0%) |
Real Estate & Mortgages in Gulf Park Estates
Real Estate and Mortgage Overview in Gulf Park Estates
| Characteristic | Without Mortgage | With Mortgage |
| Housing Units | 613 | 981 |
| Median Property Value | $186,000 | $199,500 |
| Median Household Income | $50,702 | $86 |
| Monthly Housing Costs | $548 | $29 |
| Real Estate Taxes | $1,122 | $0 |
Property Value by Mortgage Status in Gulf Park Estates
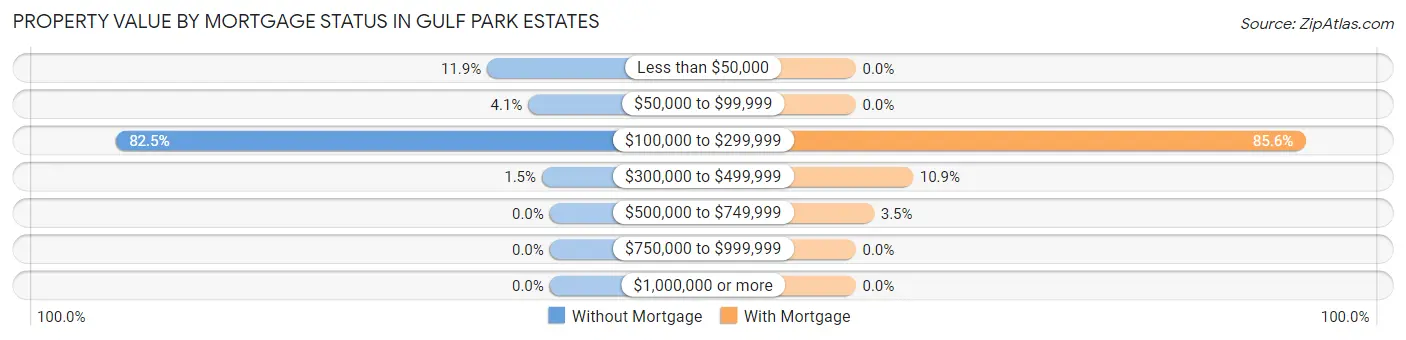
| Property Value | Without Mortgage | With Mortgage |
| Less than $50,000 | 73 (11.9%) | 0 (0.0%) |
| $50,000 to $99,999 | 25 (4.1%) | 0 (0.0%) |
| $100,000 to $299,999 | 506 (82.5%) | 840 (85.6%) |
| $300,000 to $499,999 | 9 (1.5%) | 107 (10.9%) |
| $500,000 to $749,999 | 0 (0.0%) | 34 (3.5%) |
| $750,000 to $999,999 | 0 (0.0%) | 0 (0.0%) |
| $1,000,000 or more | 0 (0.0%) | 0 (0.0%) |
| Total | 613 (100.0%) | 981 (100.0%) |
Household Income by Mortgage Status in Gulf Park Estates
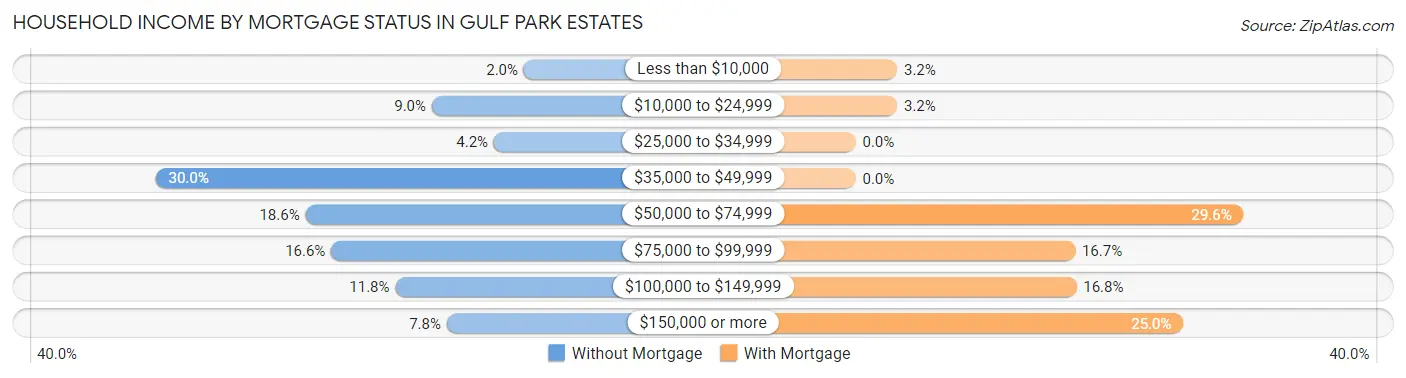
| Household Income | Without Mortgage | With Mortgage |
| Less than $10,000 | 12 (2.0%) | 31 (3.2%) |
| $10,000 to $24,999 | 55 (9.0%) | 31 (3.2%) |
| $25,000 to $34,999 | 26 (4.2%) | 0 (0.0%) |
| $35,000 to $49,999 | 184 (30.0%) | 0 (0.0%) |
| $50,000 to $74,999 | 114 (18.6%) | 290 (29.6%) |
| $75,000 to $99,999 | 102 (16.6%) | 164 (16.7%) |
| $100,000 to $149,999 | 72 (11.7%) | 165 (16.8%) |
| $150,000 or more | 48 (7.8%) | 245 (25.0%) |
| Total | 613 (100.0%) | 981 (100.0%) |
Property Value to Household Income Ratio in Gulf Park Estates
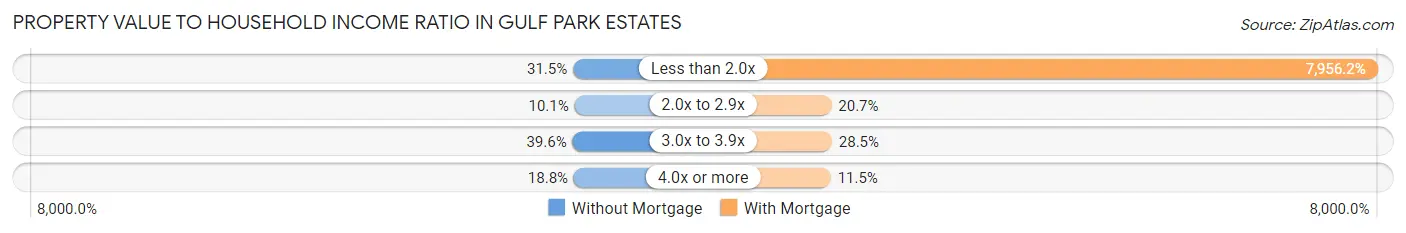
| Value-to-Income Ratio | Without Mortgage | With Mortgage |
| Less than 2.0x | 193 (31.5%) | 78,050 (7,956.2%) |
| 2.0x to 2.9x | 62 (10.1%) | 203 (20.7%) |
| 3.0x to 3.9x | 243 (39.6%) | 280 (28.5%) |
| 4.0x or more | 115 (18.8%) | 113 (11.5%) |
| Total | 613 (100.0%) | 981 (100.0%) |
Real Estate Taxes by Mortgage Status in Gulf Park Estates
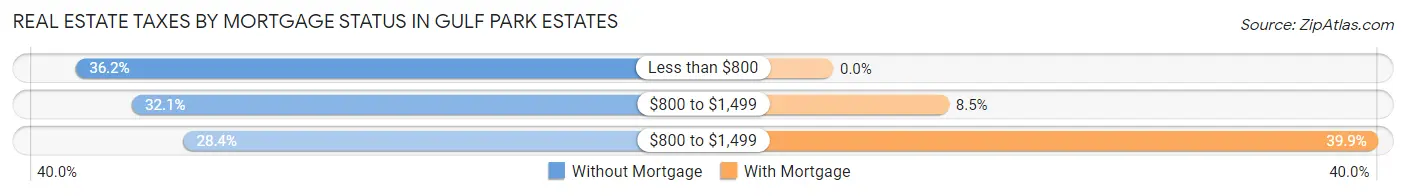
| Property Taxes | Without Mortgage | With Mortgage |
| Less than $800 | 222 (36.2%) | 0 (0.0%) |
| $800 to $1,499 | 197 (32.1%) | 83 (8.5%) |
| $800 to $1,499 | 174 (28.4%) | 391 (39.9%) |
| Total | 613 (100.0%) | 981 (100.0%) |
Health & Disability in Gulf Park Estates
Health Insurance Coverage by Age in Gulf Park Estates
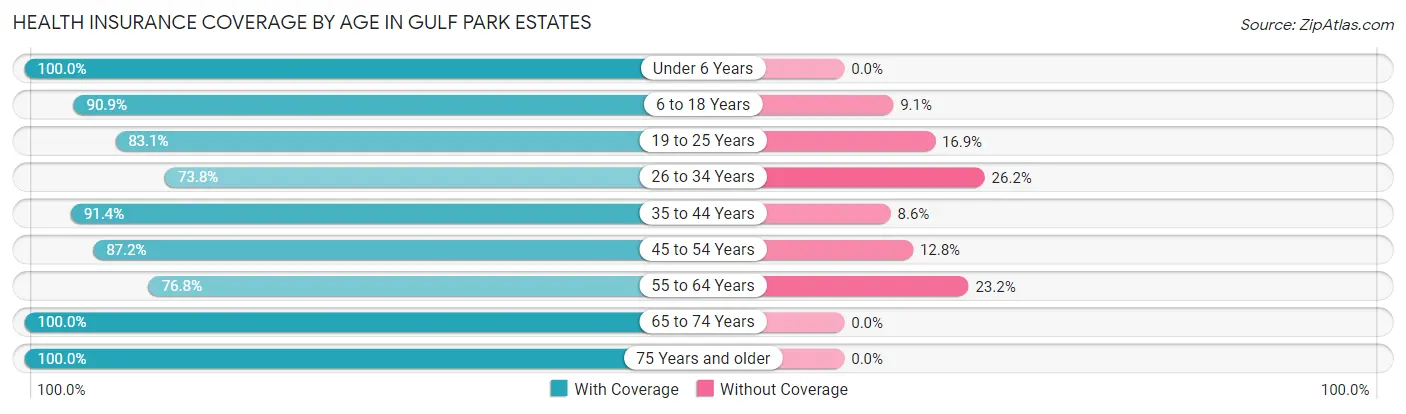
| Age Bracket | With Coverage | Without Coverage |
| Under 6 Years | 394 (100.0%) | 0 (0.0%) |
| 6 to 18 Years | 1,224 (90.9%) | 123 (9.1%) |
| 19 to 25 Years | 526 (83.1%) | 107 (16.9%) |
| 26 to 34 Years | 691 (73.8%) | 245 (26.2%) |
| 35 to 44 Years | 572 (91.4%) | 54 (8.6%) |
| 45 to 54 Years | 763 (87.2%) | 112 (12.8%) |
| 55 to 64 Years | 720 (76.8%) | 217 (23.2%) |
| 65 to 74 Years | 626 (100.0%) | 0 (0.0%) |
| 75 Years and older | 414 (100.0%) | 0 (0.0%) |
| Total | 5,930 (87.4%) | 858 (12.6%) |
Health Insurance Coverage by Citizenship Status in Gulf Park Estates
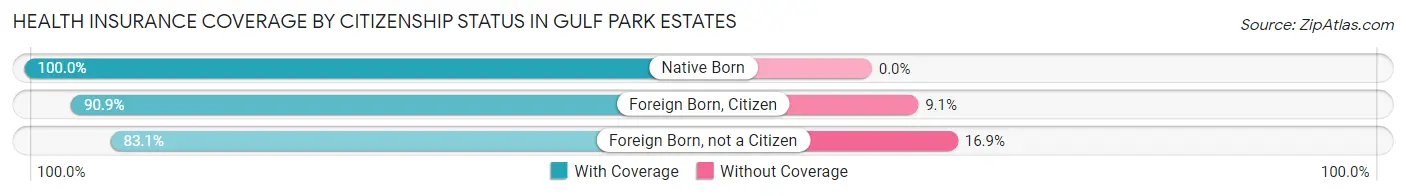
| Citizenship Status | With Coverage | Without Coverage |
| Native Born | 394 (100.0%) | 0 (0.0%) |
| Foreign Born, Citizen | 1,224 (90.9%) | 123 (9.1%) |
| Foreign Born, not a Citizen | 526 (83.1%) | 107 (16.9%) |
Health Insurance Coverage by Household Income in Gulf Park Estates
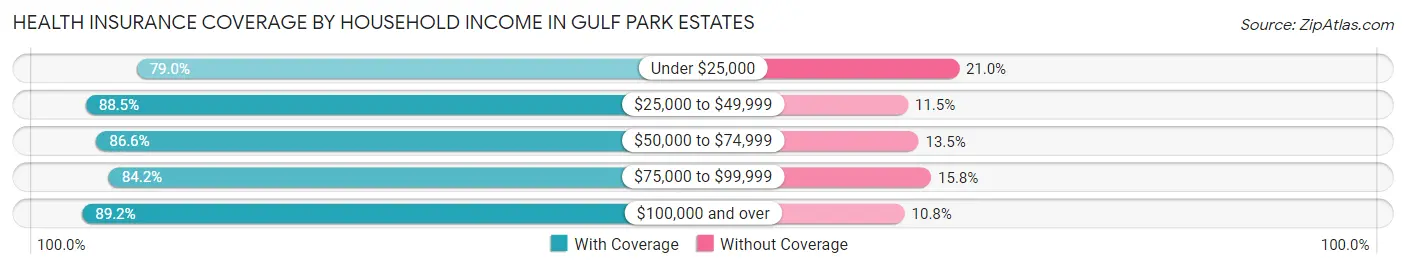
| Household Income | With Coverage | Without Coverage |
| Under $25,000 | 188 (79.0%) | 50 (21.0%) |
| $25,000 to $49,999 | 1,551 (88.5%) | 201 (11.5%) |
| $50,000 to $74,999 | 1,152 (86.6%) | 179 (13.5%) |
| $75,000 to $99,999 | 890 (84.2%) | 167 (15.8%) |
| $100,000 and over | 2,149 (89.2%) | 261 (10.8%) |
Public vs Private Health Insurance Coverage by Age in Gulf Park Estates
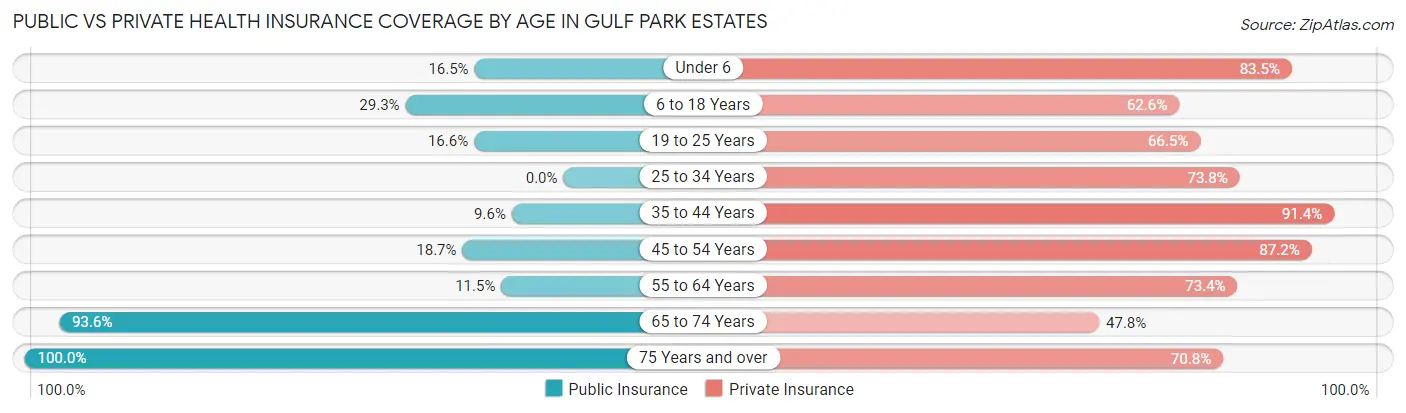
| Age Bracket | Public Insurance | Private Insurance |
| Under 6 | 65 (16.5%) | 329 (83.5%) |
| 6 to 18 Years | 395 (29.3%) | 843 (62.6%) |
| 19 to 25 Years | 105 (16.6%) | 421 (66.5%) |
| 25 to 34 Years | 0 (0.0%) | 691 (73.8%) |
| 35 to 44 Years | 60 (9.6%) | 572 (91.4%) |
| 45 to 54 Years | 164 (18.7%) | 763 (87.2%) |
| 55 to 64 Years | 108 (11.5%) | 688 (73.4%) |
| 65 to 74 Years | 586 (93.6%) | 299 (47.8%) |
| 75 Years and over | 414 (100.0%) | 293 (70.8%) |
| Total | 1,897 (28.0%) | 4,899 (72.2%) |
Disability Status by Sex by Age in Gulf Park Estates
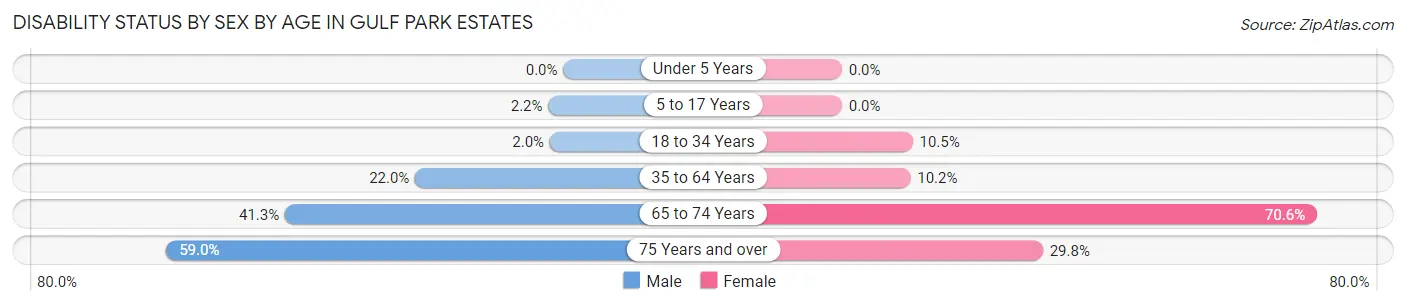
| Age Bracket | Male | Female |
| Under 5 Years | 0 (0.0%) | 0 (0.0%) |
| 5 to 17 Years | 14 (2.2%) | 0 (0.0%) |
| 18 to 34 Years | 12 (2.0%) | 113 (10.5%) |
| 35 to 64 Years | 240 (22.0%) | 137 (10.2%) |
| 65 to 74 Years | 100 (41.3%) | 271 (70.6%) |
| 75 Years and over | 92 (59.0%) | 77 (29.8%) |
Disability Class by Sex by Age in Gulf Park Estates
Disability Class: Hearing Difficulty
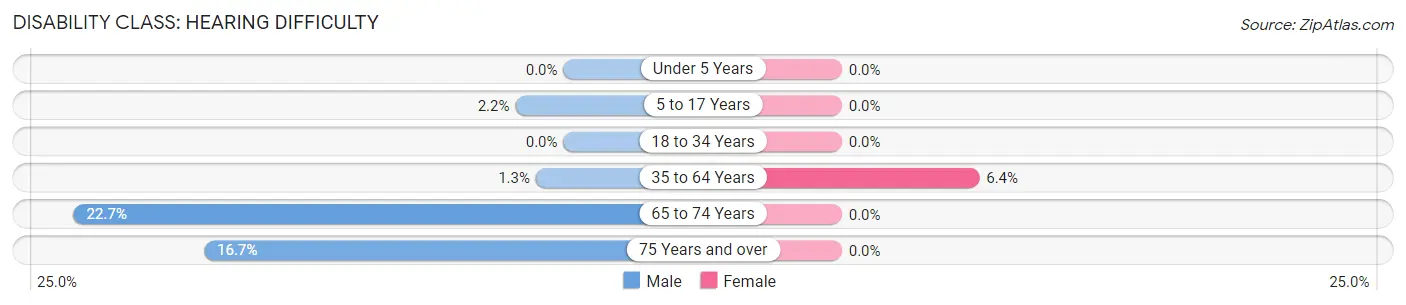
| Age Bracket | Male | Female |
| Under 5 Years | 0 (0.0%) | 0 (0.0%) |
| 5 to 17 Years | 14 (2.2%) | 0 (0.0%) |
| 18 to 34 Years | 0 (0.0%) | 0 (0.0%) |
| 35 to 64 Years | 14 (1.3%) | 86 (6.4%) |
| 65 to 74 Years | 55 (22.7%) | 0 (0.0%) |
| 75 Years and over | 26 (16.7%) | 0 (0.0%) |
Disability Class: Vision Difficulty
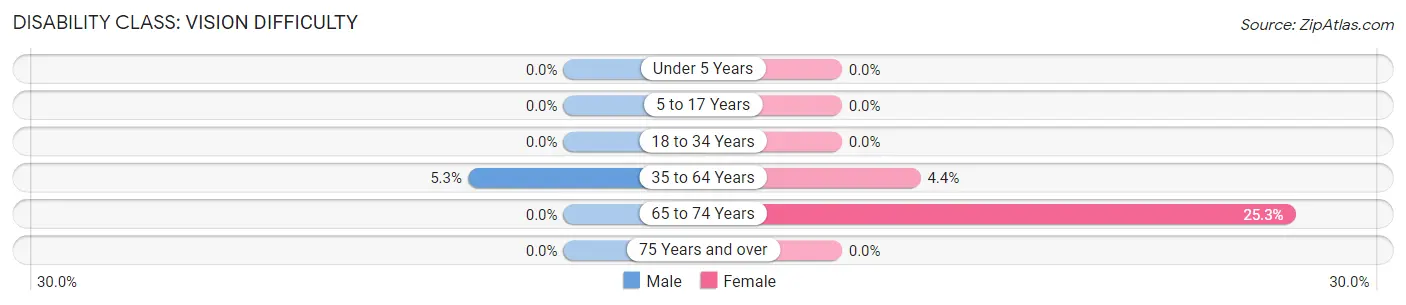
| Age Bracket | Male | Female |
| Under 5 Years | 0 (0.0%) | 0 (0.0%) |
| 5 to 17 Years | 0 (0.0%) | 0 (0.0%) |
| 18 to 34 Years | 0 (0.0%) | 0 (0.0%) |
| 35 to 64 Years | 58 (5.3%) | 59 (4.4%) |
| 65 to 74 Years | 0 (0.0%) | 97 (25.3%) |
| 75 Years and over | 0 (0.0%) | 0 (0.0%) |
Disability Class: Cognitive Difficulty
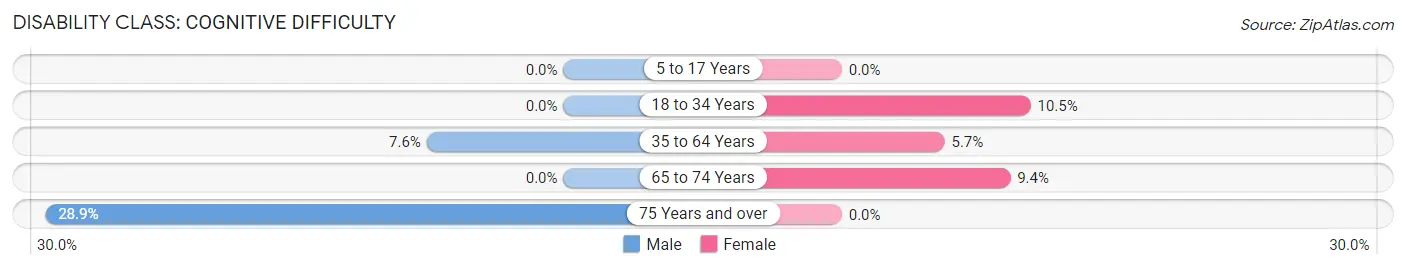
| Age Bracket | Male | Female |
| 5 to 17 Years | 0 (0.0%) | 0 (0.0%) |
| 18 to 34 Years | 0 (0.0%) | 113 (10.5%) |
| 35 to 64 Years | 83 (7.6%) | 77 (5.7%) |
| 65 to 74 Years | 0 (0.0%) | 36 (9.4%) |
| 75 Years and over | 45 (28.8%) | 0 (0.0%) |
Disability Class: Ambulatory Difficulty
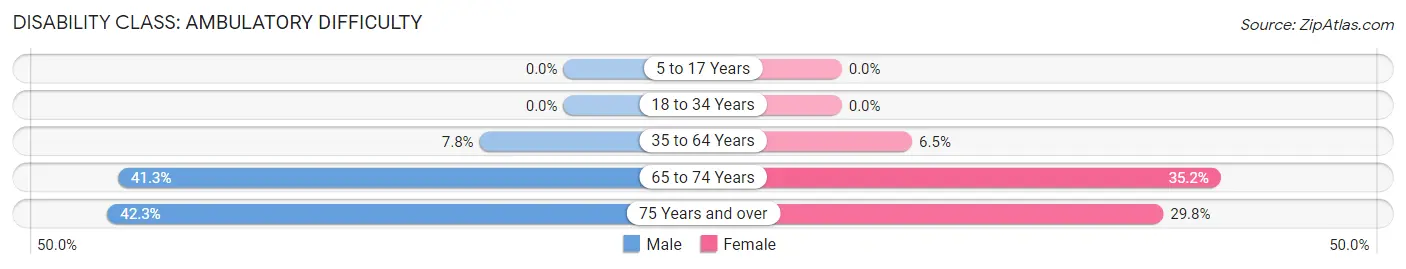
| Age Bracket | Male | Female |
| 5 to 17 Years | 0 (0.0%) | 0 (0.0%) |
| 18 to 34 Years | 0 (0.0%) | 0 (0.0%) |
| 35 to 64 Years | 85 (7.8%) | 88 (6.5%) |
| 65 to 74 Years | 100 (41.3%) | 135 (35.2%) |
| 75 Years and over | 66 (42.3%) | 77 (29.8%) |
Disability Class: Self-Care Difficulty
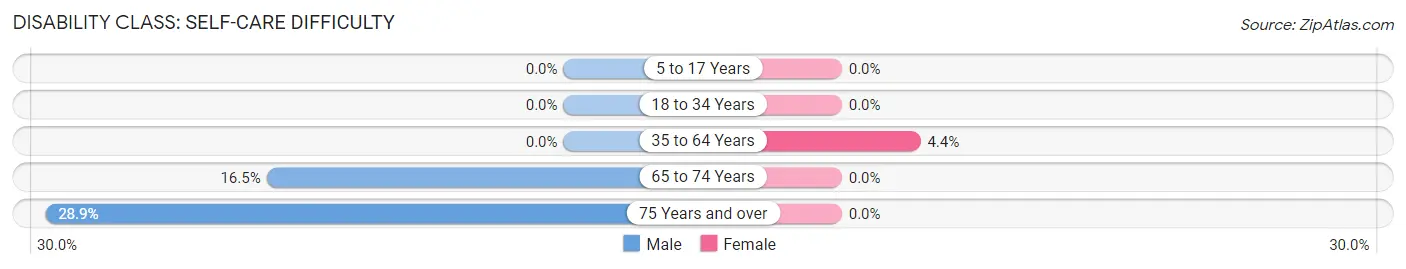
| Age Bracket | Male | Female |
| 5 to 17 Years | 0 (0.0%) | 0 (0.0%) |
| 18 to 34 Years | 0 (0.0%) | 0 (0.0%) |
| 35 to 64 Years | 0 (0.0%) | 59 (4.4%) |
| 65 to 74 Years | 40 (16.5%) | 0 (0.0%) |
| 75 Years and over | 45 (28.8%) | 0 (0.0%) |
Technology Access in Gulf Park Estates
Computing Device Access in Gulf Park Estates
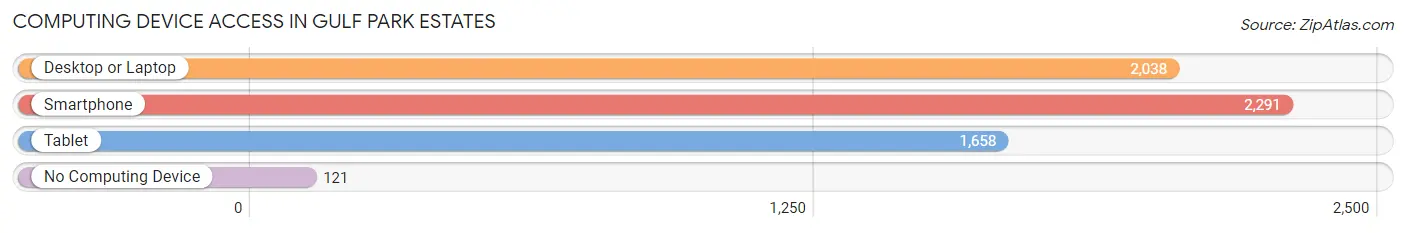
| Device Type | # Households | % Households |
| Desktop or Laptop | 2,038 | 83.3% |
| Smartphone | 2,291 | 93.6% |
| Tablet | 1,658 | 67.8% |
| No Computing Device | 121 | 4.9% |
| Total | 2,447 | 100.0% |
Internet Access in Gulf Park Estates
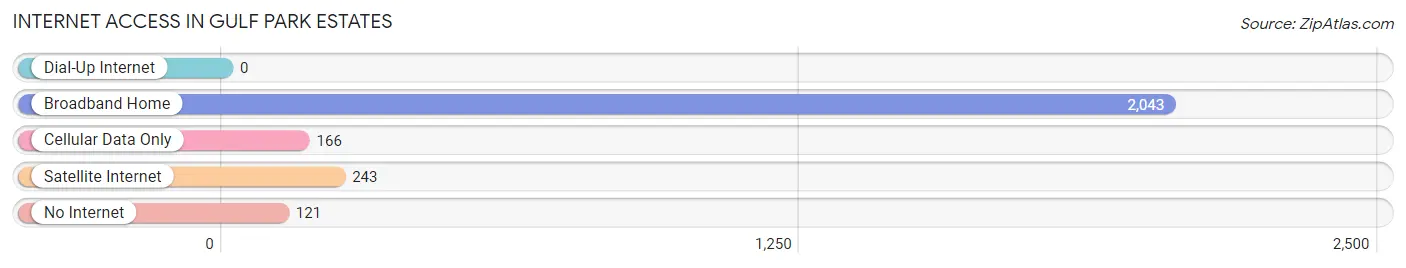
| Internet Type | # Households | % Households |
| Dial-Up Internet | 0 | 0.0% |
| Broadband Home | 2,043 | 83.5% |
| Cellular Data Only | 166 | 6.8% |
| Satellite Internet | 243 | 9.9% |
| No Internet | 121 | 4.9% |
| Total | 2,447 | 100.0% |
Gulf Park Estates Summary
Gulf Park Estates is a census-designated place (CDP) located in Harrison County, Mississippi. It is situated along the Gulf of Mexico, approximately 10 miles east of Biloxi. The population of Gulf Park Estates was 1,845 at the 2010 census.
History
Gulf Park Estates was originally part of the Gulf Park subdivision, which was developed in the 1950s. The subdivision was created by the Gulf Park Corporation, which was owned by the family of former Mississippi Governor Paul B. Johnson, Sr. The subdivision was designed to be a residential community for middle-class families.
In the 1960s, the Gulf Park Corporation began to develop the area into a resort community. The corporation built a marina, a golf course, and a hotel. The development of the resort community was interrupted by Hurricane Camille in 1969, which caused extensive damage to the area.
In the 1970s, the Gulf Park Corporation began to develop the area into a residential community. The corporation built a number of single-family homes and condominiums. The development of the residential community was interrupted by Hurricane Katrina in 2005, which caused extensive damage to the area.
Geography
Gulf Park Estates is located at 30°20'25" North, 88°51'17" West (30.340278, -88.854722). The CDP has a total area of 2.2 square miles, all of which is land.
Economy
The economy of Gulf Park Estates is largely based on tourism. The area is home to a number of hotels, restaurants, and other tourist attractions. The area is also home to a number of marinas, which provide access to the Gulf of Mexico.
Demographics
As of the 2010 census, there were 1,845 people, 790 households, and 517 families residing in the CDP. The population density was 837.5 people per square mile. The racial makeup of the CDP was 94.2% White, 2.2% African American, 0.3% Native American, 0.7% Asian, 0.1% Pacific Islander, 0.9% from other races, and 1.6% from two or more races. Hispanic or Latino of any race were 2.7% of the population.
The median income for a household in the CDP was $41,250, and the median income for a family was $50,000. Males had a median income of $36,250 versus $25,000 for females. The per capita income for the CDP was $20,945. About 8.3% of families and 10.2% of the population were below the poverty line, including 15.2% of those under age 18 and 6.3% of those age 65 or over.
Common Questions
What is Per Capita Income in Gulf Park Estates?
Per Capita income in Gulf Park Estates is $28,891.
What is the Median Family Income in Gulf Park Estates?
Median Family Income in Gulf Park Estates is $59,970.
What is the Median Household income in Gulf Park Estates?
Median Household Income in Gulf Park Estates is $59,895.
What is Income or Wage Gap in Gulf Park Estates?
Income or Wage Gap in Gulf Park Estates is 19.6%.
Women in Gulf Park Estates earn 80.4 cents for every dollar earned by a man.
What is Inequality or Gini Index in Gulf Park Estates?
Inequality or Gini Index in Gulf Park Estates is 0.34.
What is the Total Population of Gulf Park Estates?
Total Population of Gulf Park Estates is 6,965.
What is the Total Male Population of Gulf Park Estates?
Total Male Population of Gulf Park Estates is 2,992.
What is the Total Female Population of Gulf Park Estates?
Total Female Population of Gulf Park Estates is 3,973.
What is the Ratio of Males per 100 Females in Gulf Park Estates?
There are 75.31 Males per 100 Females in Gulf Park Estates.
What is the Ratio of Females per 100 Males in Gulf Park Estates?
There are 132.79 Females per 100 Males in Gulf Park Estates.
What is the Median Population Age in Gulf Park Estates?
Median Population Age in Gulf Park Estates is 37.1 Years.
What is the Average Family Size in Gulf Park Estates
Average Family Size in Gulf Park Estates is 3.0 People.
What is the Average Household Size in Gulf Park Estates
Average Household Size in Gulf Park Estates is 2.9 People.
How Large is the Labor Force in Gulf Park Estates?
There are 3,844 People in the Labor Forcein in Gulf Park Estates.
What is the Percentage of People in the Labor Force in Gulf Park Estates?
67.0% of People are in the Labor Force in Gulf Park Estates.
What is the Unemployment Rate in Gulf Park Estates?
Unemployment Rate in Gulf Park Estates is 1.6%.