Arnold Line, MS Map & Demographics
Arnold Line Map
Arnold Line Overview
$29,937
PER CAPITA INCOME
$41,232
AVG HOUSEHOLD INCOME
0.52
INEQUALITY / GINI INDEX
1,789
TOTAL POPULATION
817
MALE POPULATION
972
FEMALE POPULATION
84.05
MALES / 100 FEMALES
118.97
FEMALES / 100 MALES
32.9
MEDIAN AGE
2.7
AVG FAMILY SIZE
2.6
AVG HOUSEHOLD SIZE
678
LABOR FORCE [ PEOPLE ]
45.0%
PERCENT IN LABOR FORCE
5.6%
UNEMPLOYMENT RATE
Income in Arnold Line
Income Overview in Arnold Line
| Characteristic | Number | Measure |
| Per Capita Income | 1,789 | $29,937 |
| Median Family Income | 440 | $0 |
| Mean Family Income | 440 | $65,893 |
| Median Household Income | 698 | $41,232 |
| Mean Household Income | 698 | $62,592 |
| Income Deficit | 440 | $0 |
| Wage / Income Gap (%) | 1,789 | 0.00% |
| Wage / Income Gap ($) | 1,789 | 100.00¢ per $1 |
| Gini / Inequality Index | 1,789 | 0.52 |
Earnings by Sex in Arnold Line
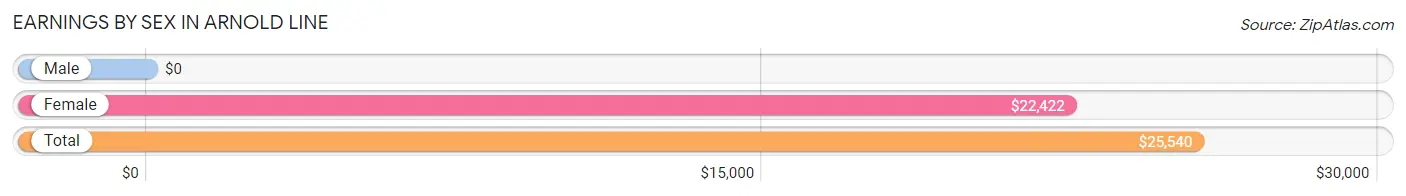
| Sex | Number | Average Earnings |
| Male | 357 (46.2%) | $0 |
| Female | 416 (53.8%) | $22,422 |
| Total | 773 (100.0%) | $25,540 |
Earnings by Sex by Income Bracket in Arnold Line
The most common earnings brackets in Arnold Line are $2,500 to $4,999 for men (85 | 23.8%) and $7,500 to $9,999 for women (76 | 18.3%).
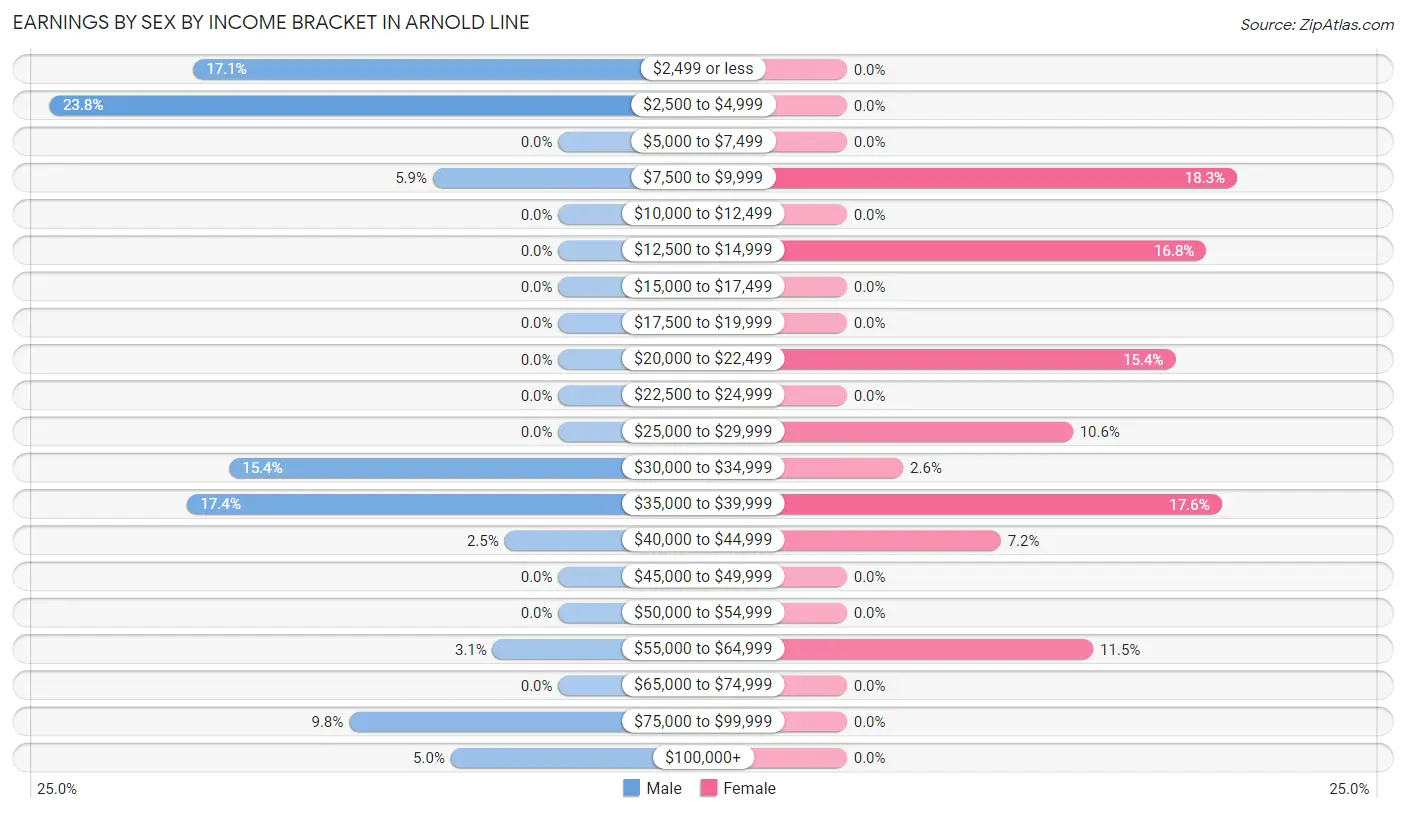
| Income | Male | Female |
| $2,499 or less | 61 (17.1%) | 0 (0.0%) |
| $2,500 to $4,999 | 85 (23.8%) | 0 (0.0%) |
| $5,000 to $7,499 | 0 (0.0%) | 0 (0.0%) |
| $7,500 to $9,999 | 21 (5.9%) | 76 (18.3%) |
| $10,000 to $12,499 | 0 (0.0%) | 0 (0.0%) |
| $12,500 to $14,999 | 0 (0.0%) | 70 (16.8%) |
| $15,000 to $17,499 | 0 (0.0%) | 0 (0.0%) |
| $17,500 to $19,999 | 0 (0.0%) | 0 (0.0%) |
| $20,000 to $22,499 | 0 (0.0%) | 64 (15.4%) |
| $22,500 to $24,999 | 0 (0.0%) | 0 (0.0%) |
| $25,000 to $29,999 | 0 (0.0%) | 44 (10.6%) |
| $30,000 to $34,999 | 55 (15.4%) | 11 (2.6%) |
| $35,000 to $39,999 | 62 (17.4%) | 73 (17.5%) |
| $40,000 to $44,999 | 9 (2.5%) | 30 (7.2%) |
| $45,000 to $49,999 | 0 (0.0%) | 0 (0.0%) |
| $50,000 to $54,999 | 0 (0.0%) | 0 (0.0%) |
| $55,000 to $64,999 | 11 (3.1%) | 48 (11.5%) |
| $65,000 to $74,999 | 0 (0.0%) | 0 (0.0%) |
| $75,000 to $99,999 | 35 (9.8%) | 0 (0.0%) |
| $100,000+ | 18 (5.0%) | 0 (0.0%) |
| Total | 357 (100.0%) | 416 (100.0%) |
Earnings by Sex by Educational Attainment in Arnold Line

| Educational Attainment | Male Income | Female Income |
| Less than High School | - | - |
| High School Diploma | - | - |
| College or Associate's Degree | - | - |
| Bachelor's Degree | - | - |
| Graduate Degree | - | - |
| Total | $31,909 | $25,455 |
Family Income in Arnold Line
Family Income Brackets in Arnold Line
According to the Arnold Line family income data, there are 107 families falling into the $50,000 to $74,999 income range, which is the most common income bracket and makes up 24.3% of all families.
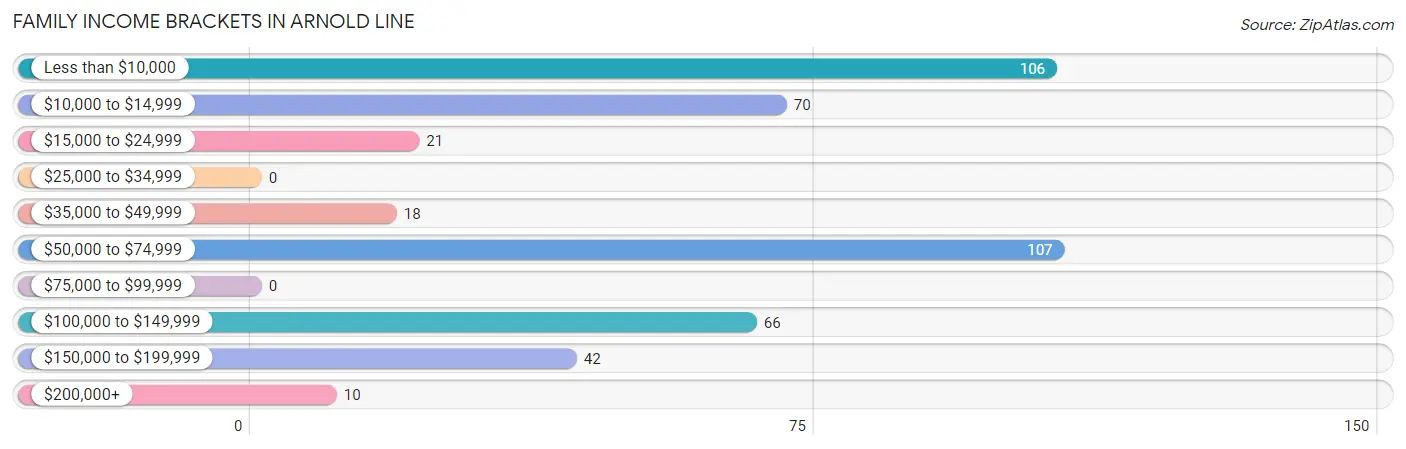
| Income Bracket | # Families | % Families |
| Less than $10,000 | 106 | 24.1% |
| $10,000 to $14,999 | 70 | 15.9% |
| $15,000 to $24,999 | 21 | 4.8% |
| $25,000 to $34,999 | 0 | 0.0% |
| $35,000 to $49,999 | 18 | 4.1% |
| $50,000 to $74,999 | 107 | 24.3% |
| $75,000 to $99,999 | 0 | 0.0% |
| $100,000 to $149,999 | 66 | 15.0% |
| $150,000 to $199,999 | 42 | 9.5% |
| $200,000+ | 10 | 2.3% |
Family Income by Famaliy Size in Arnold Line
4-person families (75 | 17.1%) account for the highest median family income in Arnold Line with $53,795 per family, while 4-person families (75 | 17.1%) have the highest median income of $13,449 per family member.
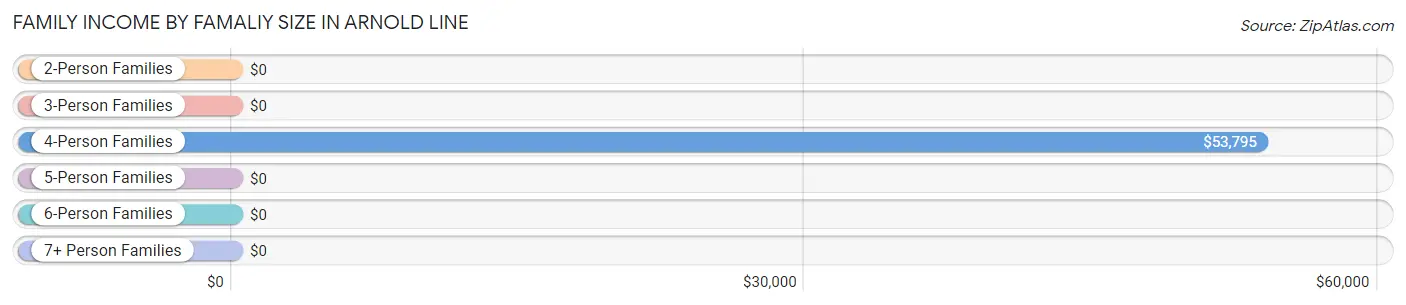
| Income Bracket | # Families | Median Income |
| 2-Person Families | 274 (62.3%) | $0 |
| 3-Person Families | 0 (0.0%) | $0 |
| 4-Person Families | 75 (17.1%) | $53,795 |
| 5-Person Families | 91 (20.7%) | $0 |
| 6-Person Families | 0 (0.0%) | $0 |
| 7+ Person Families | 0 (0.0%) | $0 |
| Total | 440 (100.0%) | $0 |
Family Income by Number of Earners in Arnold Line
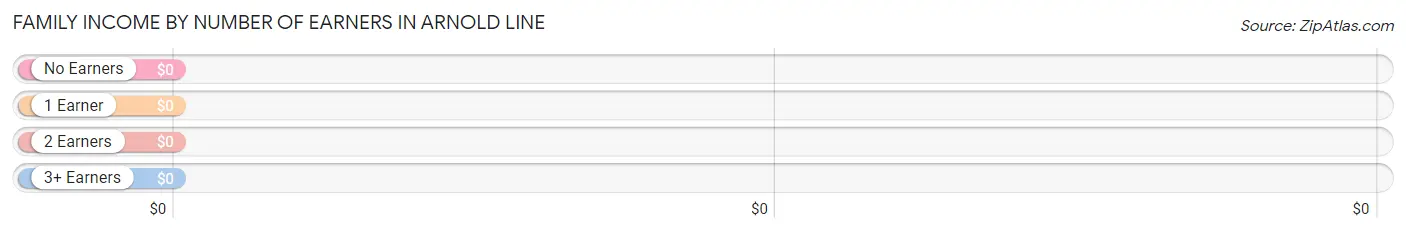
| Number of Earners | # Families | Median Income |
| No Earners | 220 (50.0%) | $0 |
| 1 Earner | 119 (27.1%) | $0 |
| 2 Earners | 46 (10.4%) | $0 |
| 3+ Earners | 55 (12.5%) | $0 |
| Total | 440 (100.0%) | $0 |
Household Income in Arnold Line
Household Income Brackets in Arnold Line
With 173 households falling in the category, the $35,000 to $49,999 income range is the most frequent in Arnold Line, accounting for 24.8% of all households.
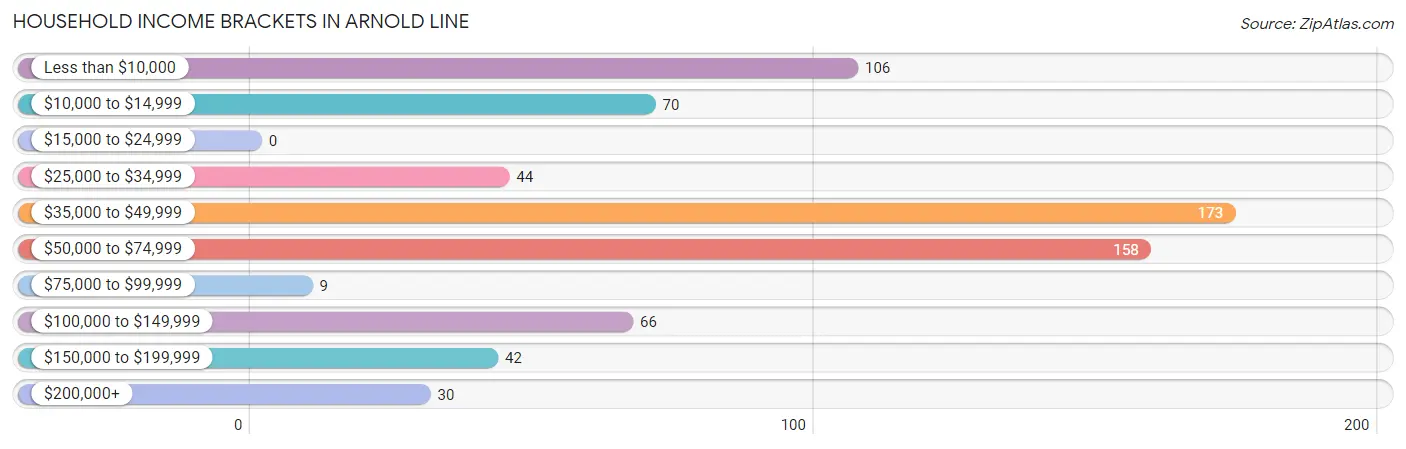
| Income Bracket | # Households | % Households |
| Less than $10,000 | 106 | 15.2% |
| $10,000 to $14,999 | 70 | 10.0% |
| $15,000 to $24,999 | 0 | 0.0% |
| $25,000 to $34,999 | 44 | 6.3% |
| $35,000 to $49,999 | 173 | 24.8% |
| $50,000 to $74,999 | 158 | 22.6% |
| $75,000 to $99,999 | 9 | 1.3% |
| $100,000 to $149,999 | 66 | 9.5% |
| $150,000 to $199,999 | 42 | 6.0% |
| $200,000+ | 30 | 4.3% |
Household Income by Householder Age in Arnold Line
The median household income in Arnold Line is $41,232, with the highest median household income of $41,757 found in the 65+ years age bracket for the primary householder. A total of 185 households (26.5%) fall into this category. Meanwhile, the 15 to 24 years age bracket for the primary householder has the lowest median household income of $0, with 20 households (2.9%) in this group.
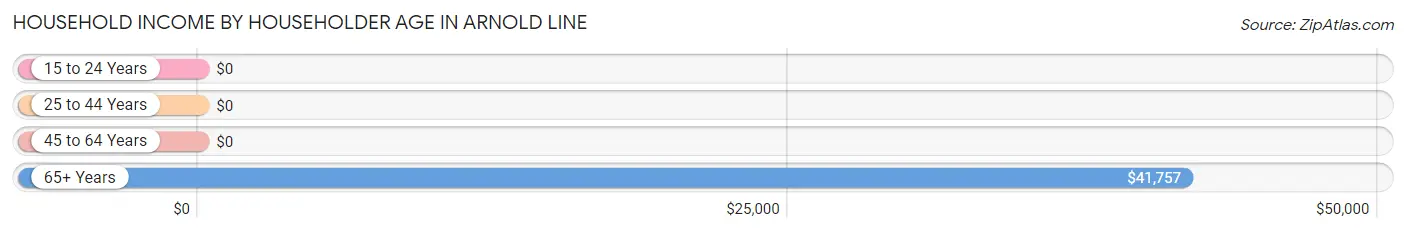
| Income Bracket | # Households | Median Income |
| 15 to 24 Years | 20 (2.9%) | $0 |
| 25 to 44 Years | 330 (47.3%) | $0 |
| 45 to 64 Years | 163 (23.4%) | $0 |
| 65+ Years | 185 (26.5%) | $41,757 |
| Total | 698 (100.0%) | $41,232 |
Poverty in Arnold Line
Income Below Poverty by Sex and Age in Arnold Line
With 44.3% poverty level for males and 43.6% for females among the residents of Arnold Line, under 5 year old males and 12 to 14 year old females are the most vulnerable to poverty, with 34 males (100.0%) and 35 females (100.0%) in their respective age groups living below the poverty level.
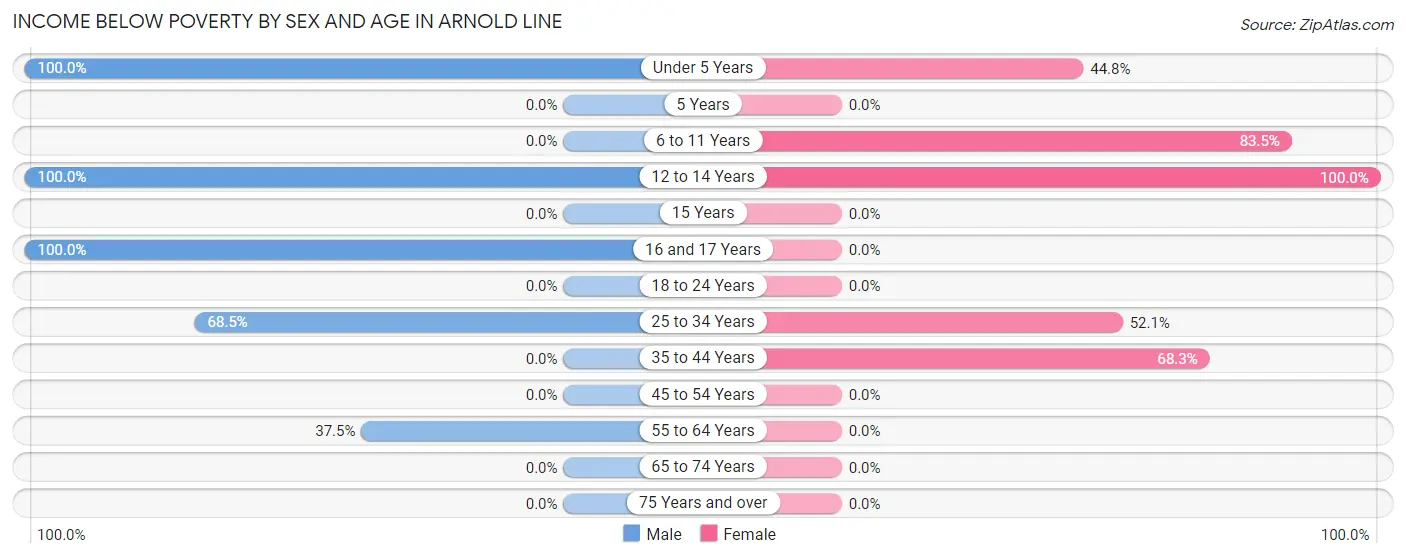
| Age Bracket | Male | Female |
| Under 5 Years | 34 (100.0%) | 13 (44.8%) |
| 5 Years | 0 (0.0%) | 0 (0.0%) |
| 6 to 11 Years | 0 (0.0%) | 86 (83.5%) |
| 12 to 14 Years | 33 (100.0%) | 35 (100.0%) |
| 15 Years | 0 (0.0%) | 0 (0.0%) |
| 16 and 17 Years | 114 (100.0%) | 0 (0.0%) |
| 18 to 24 Years | 0 (0.0%) | 0 (0.0%) |
| 25 to 34 Years | 139 (68.5%) | 146 (52.1%) |
| 35 to 44 Years | 0 (0.0%) | 144 (68.2%) |
| 45 to 54 Years | 0 (0.0%) | 0 (0.0%) |
| 55 to 64 Years | 21 (37.5%) | 0 (0.0%) |
| 65 to 74 Years | 0 (0.0%) | 0 (0.0%) |
| 75 Years and over | 0 (0.0%) | 0 (0.0%) |
| Total | 341 (44.3%) | 424 (43.6%) |
Income Above Poverty by Sex and Age in Arnold Line
According to the poverty statistics in Arnold Line, males aged 18 to 24 years and females aged 16 and 17 years are the age groups that are most secure financially, with 100.0% of males and 100.0% of females in these age groups living above the poverty line.
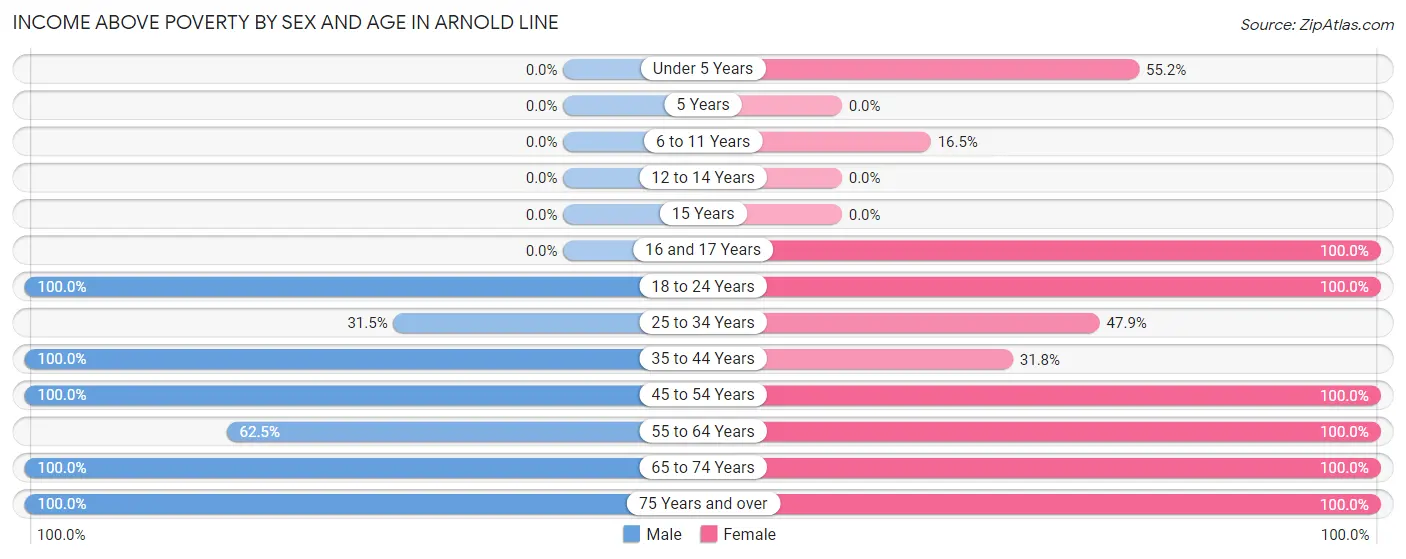
| Age Bracket | Male | Female |
| Under 5 Years | 0 (0.0%) | 16 (55.2%) |
| 5 Years | 0 (0.0%) | 0 (0.0%) |
| 6 to 11 Years | 0 (0.0%) | 17 (16.5%) |
| 12 to 14 Years | 0 (0.0%) | 0 (0.0%) |
| 15 Years | 0 (0.0%) | 0 (0.0%) |
| 16 and 17 Years | 0 (0.0%) | 38 (100.0%) |
| 18 to 24 Years | 61 (100.0%) | 20 (100.0%) |
| 25 to 34 Years | 64 (31.5%) | 134 (47.9%) |
| 35 to 44 Years | 42 (100.0%) | 67 (31.8%) |
| 45 to 54 Years | 73 (100.0%) | 10 (100.0%) |
| 55 to 64 Years | 35 (62.5%) | 100 (100.0%) |
| 65 to 74 Years | 70 (100.0%) | 61 (100.0%) |
| 75 Years and over | 83 (100.0%) | 85 (100.0%) |
| Total | 428 (55.7%) | 548 (56.4%) |
Income Below Poverty Among Married-Couple Families in Arnold Line
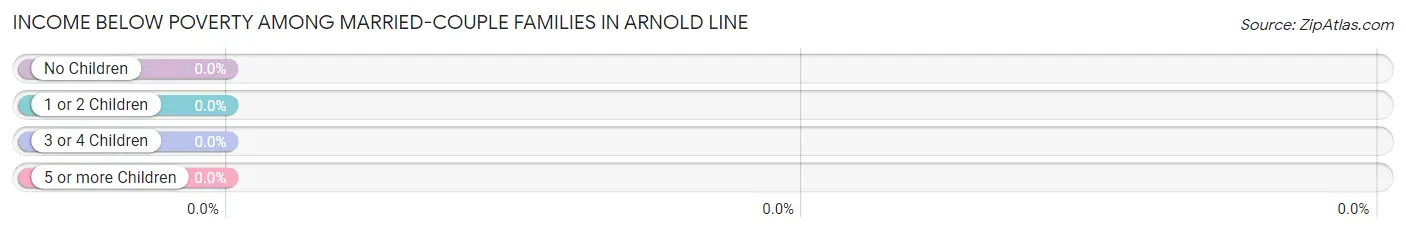
| Children | Above Poverty | Below Poverty |
| No Children | 159 (100.0%) | 0 (0.0%) |
| 1 or 2 Children | 66 (100.0%) | 0 (0.0%) |
| 3 or 4 Children | 0 (0.0%) | 0 (0.0%) |
| 5 or more Children | 0 (0.0%) | 0 (0.0%) |
| Total | 225 (100.0%) | 0 (0.0%) |
Income Below Poverty Among Single-Parent Households in Arnold Line
According to the poverty data in Arnold Line, 53.8% or 21 single-father households and 100.0% or 176 single-mother households are living below the poverty line. Among single-father households, those with 3 or 4 children have the highest poverty rate, with 21 households (100.0%) experiencing poverty. Likewise, among single-mother households, those with 1 or 2 children have the highest poverty rate, with 106 households (100.0%) falling below the poverty line.
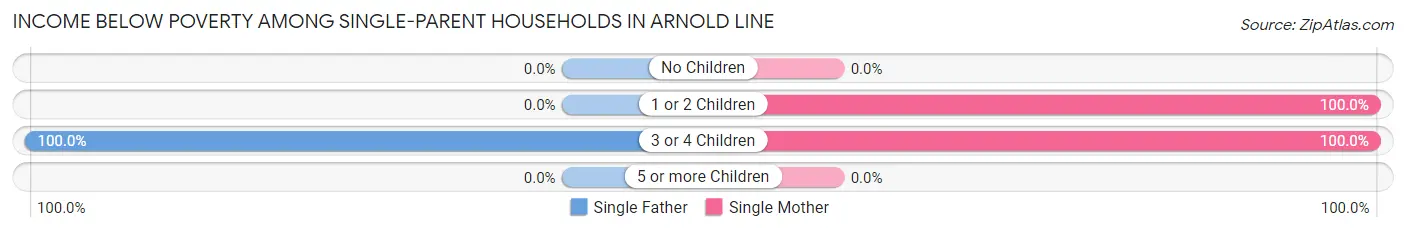
| Children | Single Father | Single Mother |
| No Children | 0 (0.0%) | 0 (0.0%) |
| 1 or 2 Children | 0 (0.0%) | 106 (100.0%) |
| 3 or 4 Children | 21 (100.0%) | 70 (100.0%) |
| 5 or more Children | 0 (0.0%) | 0 (0.0%) |
| Total | 21 (53.8%) | 176 (100.0%) |
Income Below Poverty Among Married-Couple vs Single-Parent Households in Arnold Line
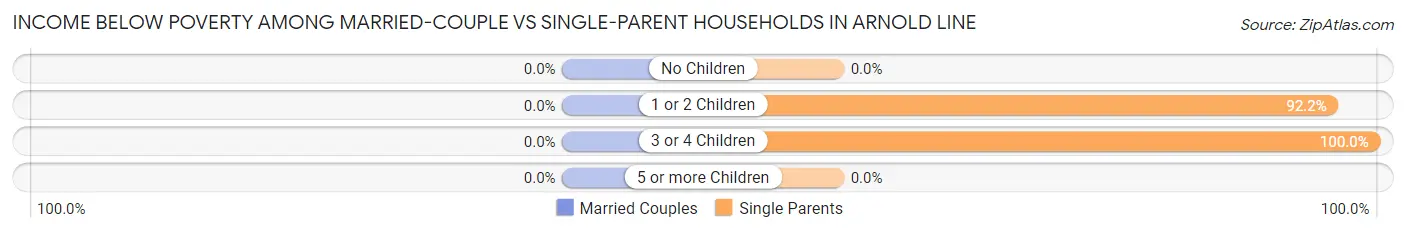
| Children | Married-Couple Families | Single-Parent Households |
| No Children | 0 (0.0%) | 0 (0.0%) |
| 1 or 2 Children | 0 (0.0%) | 106 (92.2%) |
| 3 or 4 Children | 0 (0.0%) | 91 (100.0%) |
| 5 or more Children | 0 (0.0%) | 0 (0.0%) |
| Total | 0 (0.0%) | 197 (91.6%) |
Race in Arnold Line
The most populous races in Arnold Line are Black / African American (956 | 53.4%), White / Caucasian (805 | 45.0%), and Asian (17 | 0.9%).
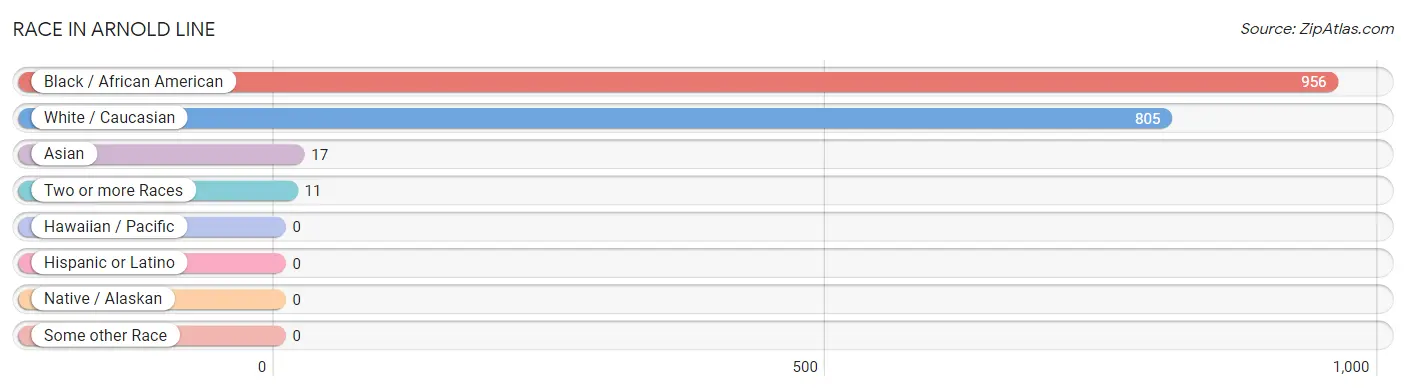
| Race | # Population | % Population |
| Asian | 17 | 0.9% |
| Black / African American | 956 | 53.4% |
| Hawaiian / Pacific | 0 | 0.0% |
| Hispanic or Latino | 0 | 0.0% |
| Native / Alaskan | 0 | 0.0% |
| White / Caucasian | 805 | 45.0% |
| Two or more Races | 11 | 0.6% |
| Some other Race | 0 | 0.0% |
| Total | 1,789 | 100.0% |
Ancestry in Arnold Line
The most populous ancestries reported in Arnold Line are English (282 | 15.8%), Irish (254 | 14.2%), German (125 | 7.0%), American (102 | 5.7%), and Swedish (76 | 4.3%), together accounting for 46.9% of all Arnold Line residents.
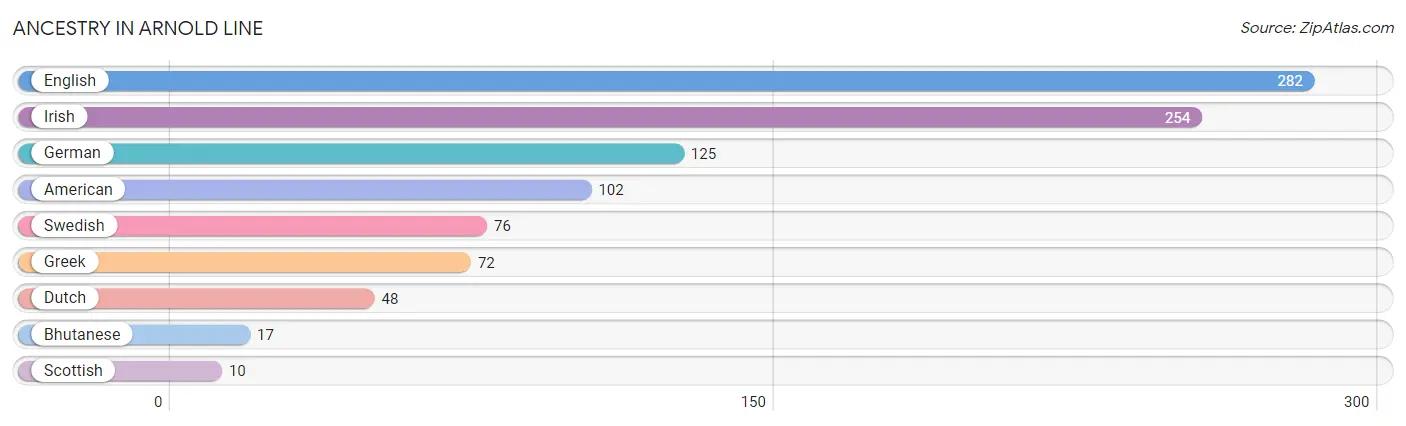
| Ancestry | # Population | % Population |
| American | 102 | 5.7% |
| Bhutanese | 17 | 0.9% |
| Dutch | 48 | 2.7% |
| English | 282 | 15.8% |
| German | 125 | 7.0% |
| Greek | 72 | 4.0% |
| Irish | 254 | 14.2% |
| Scottish | 10 | 0.6% |
| Swedish | 76 | 4.3% | View All 9 Rows |
Immigrants in Arnold Line
The most numerous immigrant groups reported in Arnold Line came from Asia (17 | 0.9%), Eastern Asia (17 | 0.9%), and Japan (17 | 0.9%), together accounting for 2.8% of all Arnold Line residents.
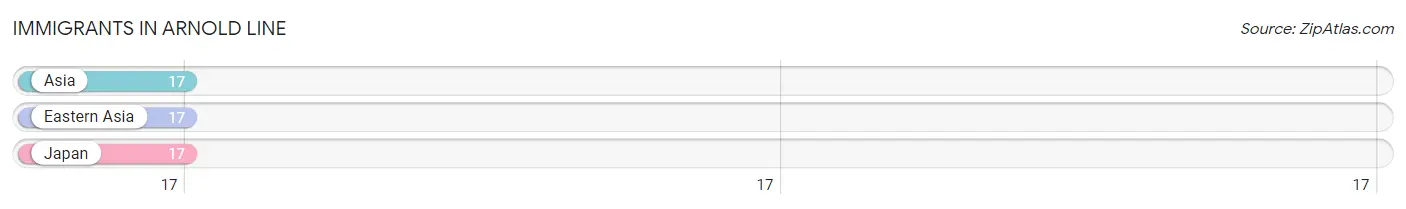
| Immigration Origin | # Population | % Population |
| Asia | 17 | 0.9% |
| Eastern Asia | 17 | 0.9% |
| Japan | 17 | 0.9% | View All 3 Rows |
Sex and Age in Arnold Line
Sex and Age in Arnold Line
The most populous age groups in Arnold Line are 15 to 19 Years (175 | 21.4%) for men and 30 to 34 Years (190 | 19.6%) for women.
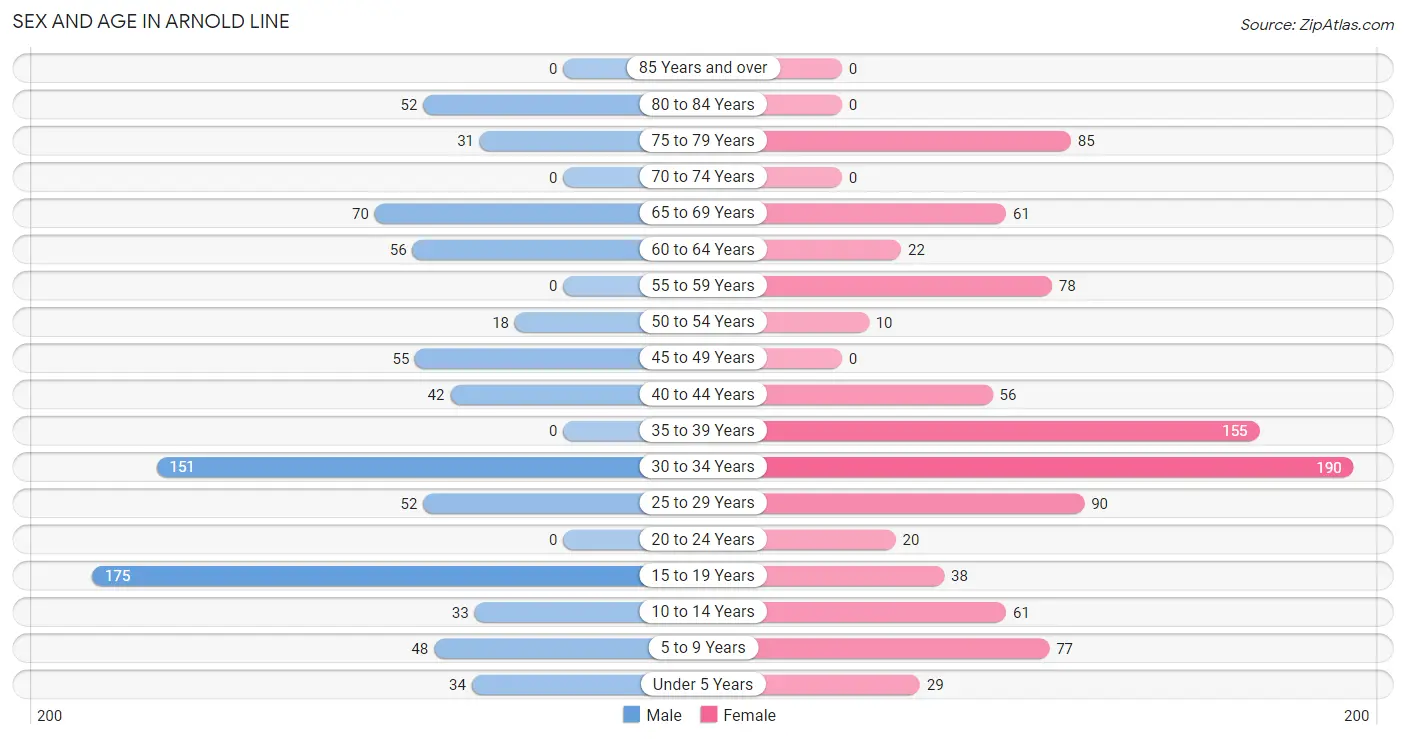
| Age Bracket | Male | Female |
| Under 5 Years | 34 (4.2%) | 29 (3.0%) |
| 5 to 9 Years | 48 (5.9%) | 77 (7.9%) |
| 10 to 14 Years | 33 (4.0%) | 61 (6.3%) |
| 15 to 19 Years | 175 (21.4%) | 38 (3.9%) |
| 20 to 24 Years | 0 (0.0%) | 20 (2.1%) |
| 25 to 29 Years | 52 (6.4%) | 90 (9.3%) |
| 30 to 34 Years | 151 (18.5%) | 190 (19.6%) |
| 35 to 39 Years | 0 (0.0%) | 155 (16.0%) |
| 40 to 44 Years | 42 (5.1%) | 56 (5.8%) |
| 45 to 49 Years | 55 (6.7%) | 0 (0.0%) |
| 50 to 54 Years | 18 (2.2%) | 10 (1.0%) |
| 55 to 59 Years | 0 (0.0%) | 78 (8.0%) |
| 60 to 64 Years | 56 (6.9%) | 22 (2.3%) |
| 65 to 69 Years | 70 (8.6%) | 61 (6.3%) |
| 70 to 74 Years | 0 (0.0%) | 0 (0.0%) |
| 75 to 79 Years | 31 (3.8%) | 85 (8.7%) |
| 80 to 84 Years | 52 (6.4%) | 0 (0.0%) |
| 85 Years and over | 0 (0.0%) | 0 (0.0%) |
| Total | 817 (100.0%) | 972 (100.0%) |
Families and Households in Arnold Line
Median Family Size in Arnold Line
The median family size in Arnold Line is 2.69 persons per family, with single male/father families (39 | 8.9%) accounting for the largest median family size of 5.23 persons per family. On the other hand, single female/mother families (176 | 40.0%) represent the smallest median family size with 2.31 persons per family.
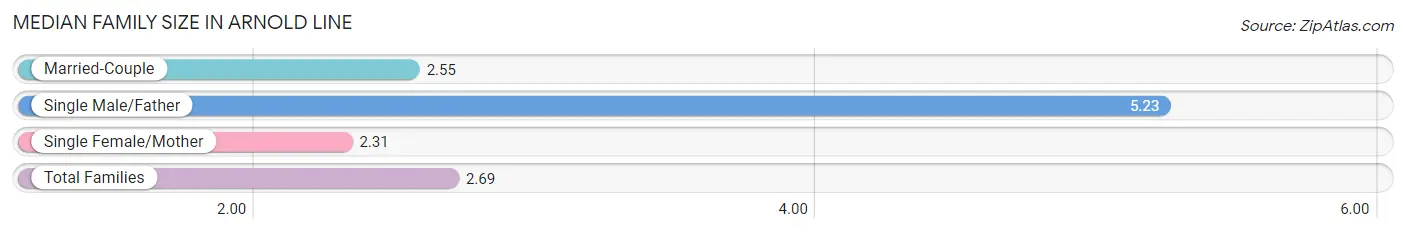
| Family Type | # Families | Family Size |
| Married-Couple | 225 (51.1%) | 2.55 |
| Single Male/Father | 39 (8.9%) | 5.23 |
| Single Female/Mother | 176 (40.0%) | 2.31 |
| Total Families | 440 (100.0%) | 2.69 |
Median Household Size in Arnold Line
The median household size in Arnold Line is 2.56 persons per household, with single male/father households (39 | 5.6%) accounting for the largest median household size of 6.08 persons per household. non-family households (258 | 37.0%) represent the smallest median household size with 1.81 persons per household.
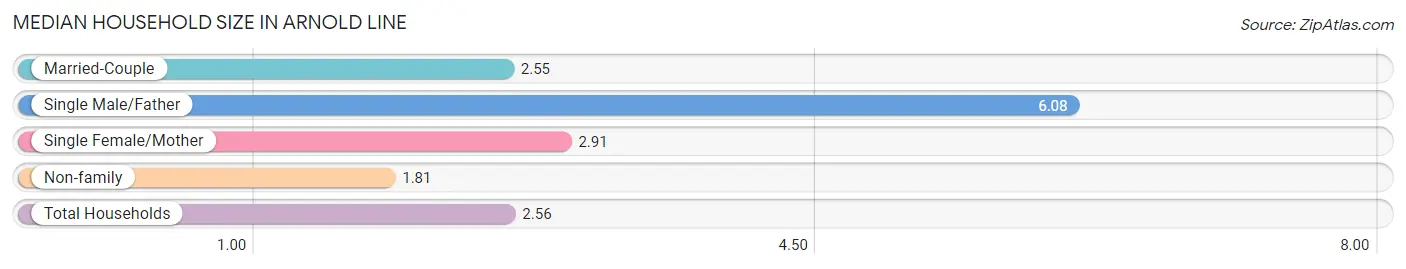
| Household Type | # Households | Household Size |
| Married-Couple | 225 (32.2%) | 2.55 |
| Single Male/Father | 39 (5.6%) | 6.08 |
| Single Female/Mother | 176 (25.2%) | 2.91 |
| Non-family | 258 (37.0%) | 1.81 |
| Total Households | 698 (100.0%) | 2.56 |
Household Size by Marriage Status in Arnold Line
Out of a total of 698 households in Arnold Line, 440 (63.0%) are family households, while 258 (37.0%) are nonfamily households. The most numerous type of family households are 2-person households, comprising 159, and the most common type of nonfamily households are 1-person households, comprising 194.
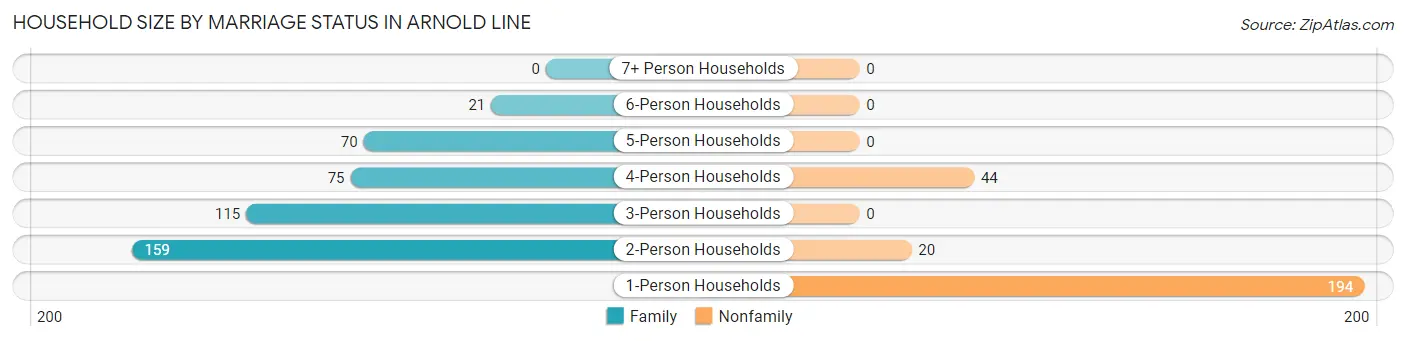
| Household Size | Family Households | Nonfamily Households |
| 1-Person Households | - | 194 (27.8%) |
| 2-Person Households | 159 (22.8%) | 20 (2.9%) |
| 3-Person Households | 115 (16.5%) | 0 (0.0%) |
| 4-Person Households | 75 (10.7%) | 44 (6.3%) |
| 5-Person Households | 70 (10.0%) | 0 (0.0%) |
| 6-Person Households | 21 (3.0%) | 0 (0.0%) |
| 7+ Person Households | 0 (0.0%) | 0 (0.0%) |
| Total | 440 (63.0%) | 258 (37.0%) |
Female Fertility in Arnold Line
Fertility by Age in Arnold Line
| Age Bracket | Women with Births | Births / 1,000 Women |
| 15 to 19 years | 0 (0.0%) | 0.0 |
| 20 to 34 years | 0 (0.0%) | 0.0 |
| 35 to 50 years | 0 (0.0%) | 0.0 |
| Total | 0 (0.0%) | 0.0 |
Fertility by Age by Marriage Status in Arnold Line
| Age Bracket | Married | Unmarried |
| 15 to 19 years | 0 (0.0%) | 0 (0.0%) |
| 20 to 34 years | 0 (0.0%) | 0 (0.0%) |
| 35 to 50 years | 0 (0.0%) | 0 (0.0%) |
| Total | 0 (0.0%) | 0 (0.0%) |
Fertility by Education in Arnold Line
| Educational Attainment | Women with Births | Births / 1,000 Women |
| Less than High School | 0 (0.0%) | 0.0 |
| High School Diploma | 0 (0.0%) | 0.0 |
| College or Associate's Degree | 0 (0.0%) | 0.0 |
| Bachelor's Degree | 0 (0.0%) | 0.0 |
| Graduate Degree | 0 (0.0%) | 0.0 |
| Total | 0 (0.0%) | 0.0 |
Fertility by Education by Marriage Status in Arnold Line
| Educational Attainment | Married | Unmarried |
| Less than High School | 0 (0.0%) | 0 (0.0%) |
| High School Diploma | 0 (0.0%) | 0 (0.0%) |
| College or Associate's Degree | 0 (0.0%) | 0 (0.0%) |
| Bachelor's Degree | 0 (0.0%) | 0 (0.0%) |
| Graduate Degree | 0 (0.0%) | 0 (0.0%) |
| Total | 0 (0.0%) | 0 (0.0%) |
Employment Characteristics in Arnold Line
Employment by Class of Employer in Arnold Line
Among the 640 employed individuals in Arnold Line, private company employees (482 | 75.3%), local government employees (62 | 9.7%), and self-employed (not incorporated) (43 | 6.7%) make up the most common classes of employment.
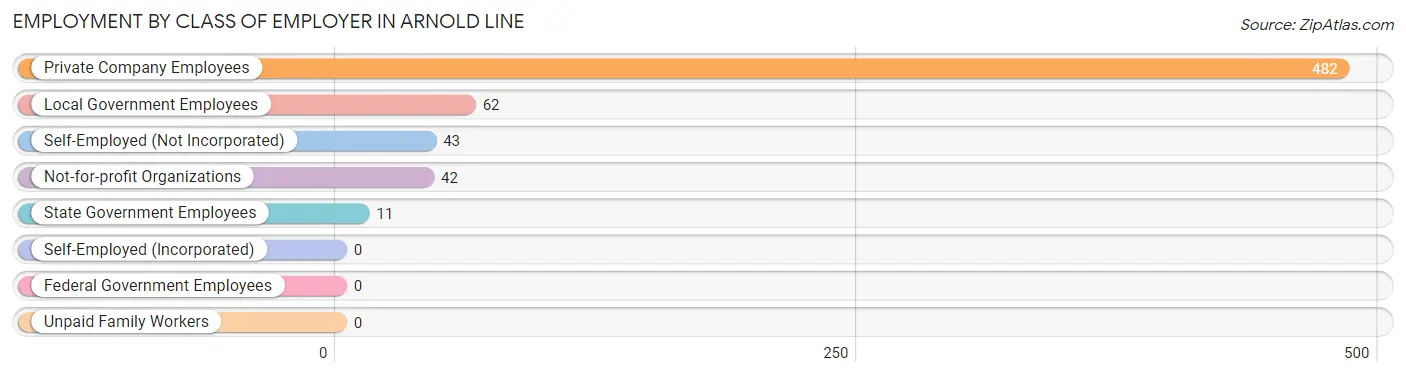
| Employer Class | # Employees | % Employees |
| Private Company Employees | 482 | 75.3% |
| Self-Employed (Incorporated) | 0 | 0.0% |
| Self-Employed (Not Incorporated) | 43 | 6.7% |
| Not-for-profit Organizations | 42 | 6.6% |
| Local Government Employees | 62 | 9.7% |
| State Government Employees | 11 | 1.7% |
| Federal Government Employees | 0 | 0.0% |
| Unpaid Family Workers | 0 | 0.0% |
| Total | 640 | 100.0% |
Employment Status by Age in Arnold Line
According to the labor force statistics for Arnold Line, out of the total population over 16 years of age (1,507), 45.0% or 678 individuals are in the labor force, with 5.6% or 38 of them unemployed. The age group with the highest labor force participation rate is 60 to 64 years, with 100.0% or 78 individuals in the labor force. Within the labor force, the 35 to 44 years age range has the highest percentage of unemployed individuals, with 30.4% or 38 of them being unemployed.
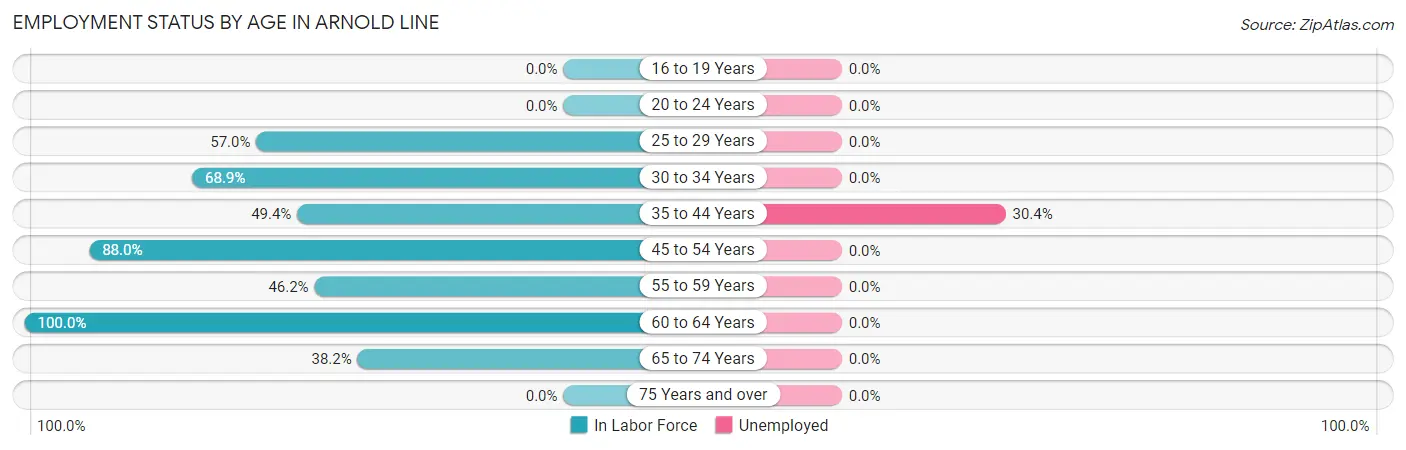
| Age Bracket | In Labor Force | Unemployed |
| 16 to 19 Years | 0 (0.0%) | 0 (0.0%) |
| 20 to 24 Years | 0 (0.0%) | 0 (0.0%) |
| 25 to 29 Years | 81 (57.0%) | 0 (0.0%) |
| 30 to 34 Years | 235 (68.9%) | 0 (0.0%) |
| 35 to 44 Years | 125 (49.4%) | 38 (30.4%) |
| 45 to 54 Years | 73 (88.0%) | 0 (0.0%) |
| 55 to 59 Years | 36 (46.2%) | 0 (0.0%) |
| 60 to 64 Years | 78 (100.0%) | 0 (0.0%) |
| 65 to 74 Years | 50 (38.2%) | 0 (0.0%) |
| 75 Years and over | 0 (0.0%) | 0 (0.0%) |
| Total | 678 (45.0%) | 38 (5.6%) |
Employment Status by Educational Attainment in Arnold Line
According to labor force statistics for Arnold Line, 64.4% of individuals (628) out of the total population between 25 and 64 years of age (975) are in the labor force, with 6.1% or 38 of them being unemployed. The group with the highest labor force participation rate are those with the educational attainment of college / associate degree, with 100.0% or 230 individuals in the labor force. Within the labor force, individuals with high school diploma education have the highest percentage of unemployment, with 16.6% or 38 of them being unemployed.
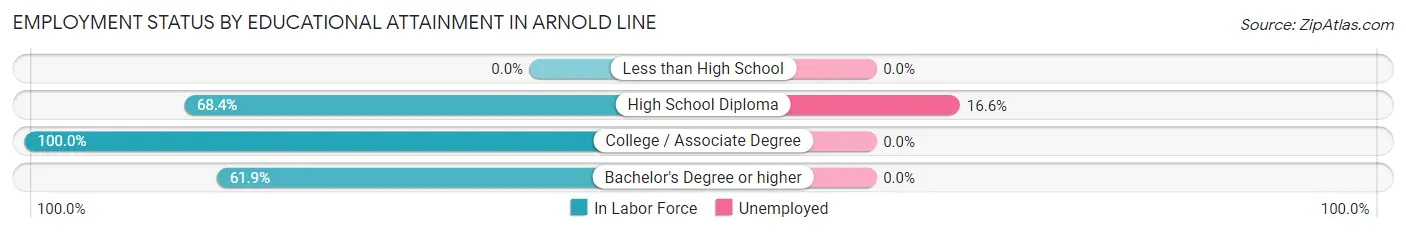
| Educational Attainment | In Labor Force | Unemployed |
| Less than High School | 0 (0.0%) | 0 (0.0%) |
| High School Diploma | 229 (68.4%) | 56 (16.6%) |
| College / Associate Degree | 230 (100.0%) | 0 (0.0%) |
| Bachelor's Degree or higher | 169 (61.9%) | 0 (0.0%) |
| Total | 628 (64.4%) | 59 (6.1%) |
Employment Occupations by Sex in Arnold Line
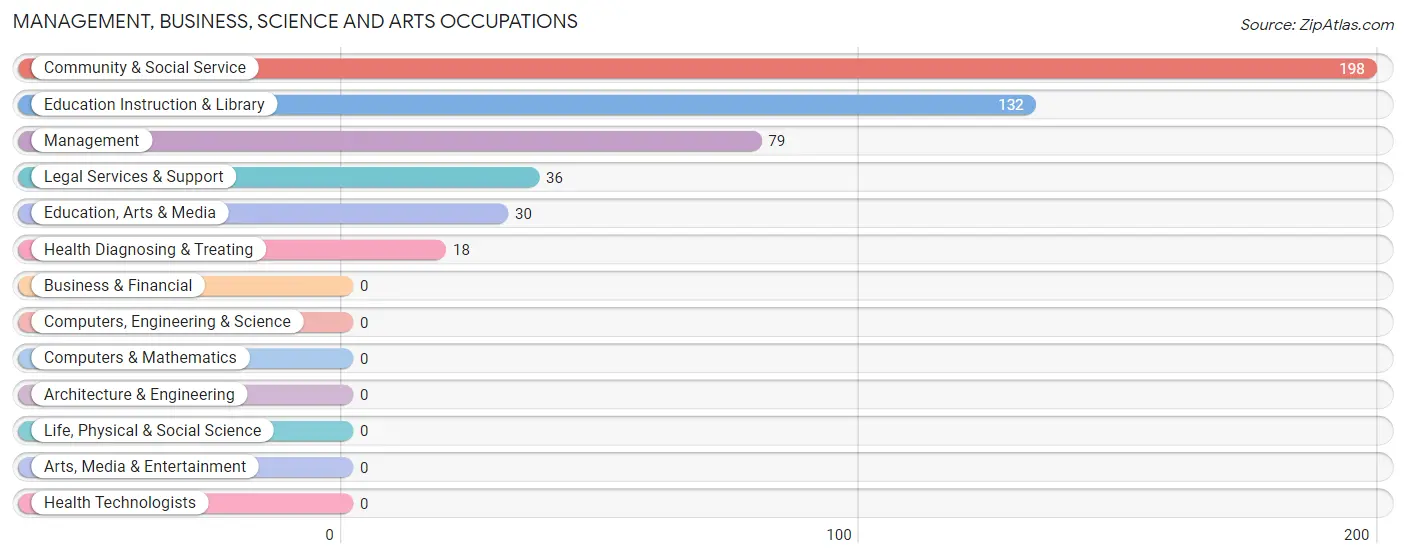
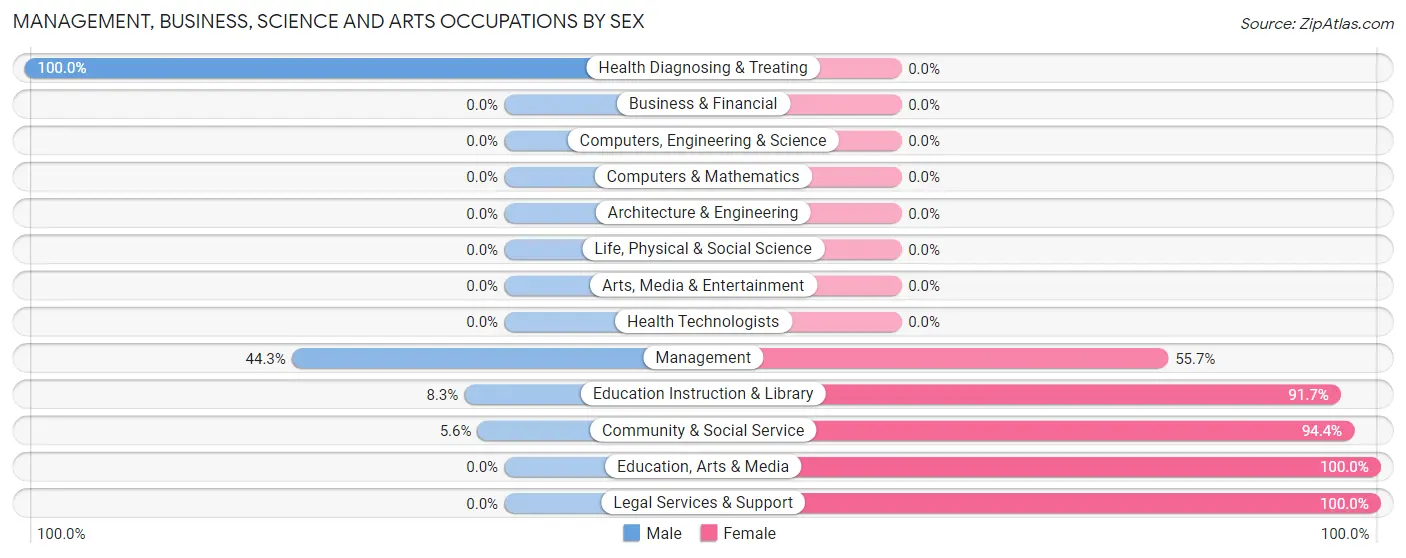
Management, Business, Science and Arts Occupations
The most common Management, Business, Science and Arts occupations in Arnold Line are Community & Social Service (198 | 30.9%), Education Instruction & Library (132 | 20.6%), Management (79 | 12.3%), Legal Services & Support (36 | 5.6%), and Education, Arts & Media (30 | 4.7%).
Management, Business, Science and Arts Occupations by Sex
Within the Management, Business, Science and Arts occupations in Arnold Line, the most male-oriented occupations are Health Diagnosing & Treating (100.0%), Management (44.3%), and Education Instruction & Library (8.3%), while the most female-oriented occupations are Education, Arts & Media (100.0%), Legal Services & Support (100.0%), and Community & Social Service (94.4%).
| Occupation | Male | Female |
| Management | 35 (44.3%) | 44 (55.7%) |
| Business & Financial | 0 (0.0%) | 0 (0.0%) |
| Computers, Engineering & Science | 0 (0.0%) | 0 (0.0%) |
| Computers & Mathematics | 0 (0.0%) | 0 (0.0%) |
| Architecture & Engineering | 0 (0.0%) | 0 (0.0%) |
| Life, Physical & Social Science | 0 (0.0%) | 0 (0.0%) |
| Community & Social Service | 11 (5.6%) | 187 (94.4%) |
| Education, Arts & Media | 0 (0.0%) | 30 (100.0%) |
| Legal Services & Support | 0 (0.0%) | 36 (100.0%) |
| Education Instruction & Library | 11 (8.3%) | 121 (91.7%) |
| Arts, Media & Entertainment | 0 (0.0%) | 0 (0.0%) |
| Health Diagnosing & Treating | 18 (100.0%) | 0 (0.0%) |
| Health Technologists | 0 (0.0%) | 0 (0.0%) |
| Total (Category) | 64 (21.7%) | 231 (78.3%) |
| Total (Overall) | 244 (38.1%) | 396 (61.9%) |
Services Occupations
The most common Services occupations in Arnold Line are Food Preparation & Serving (131 | 20.5%), Healthcare Support (44 | 6.9%), and Personal Care & Service (22 | 3.4%).
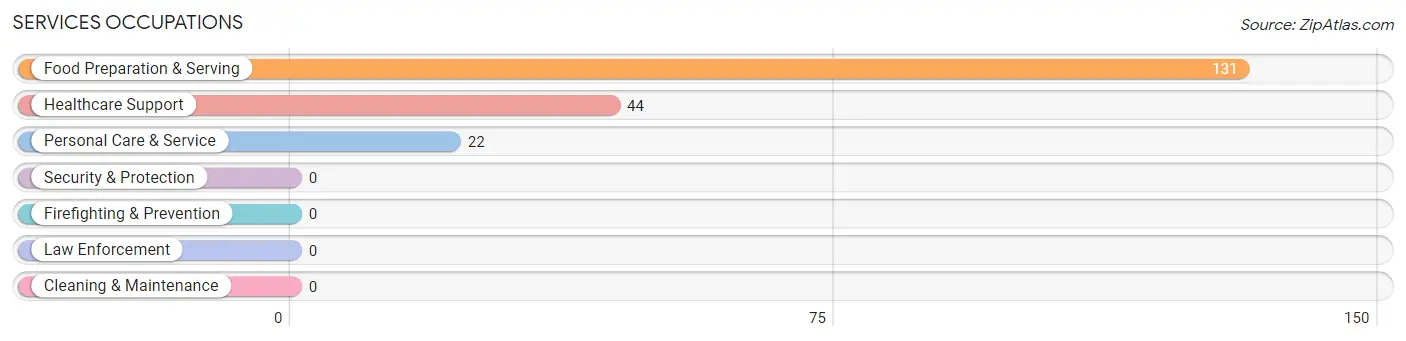
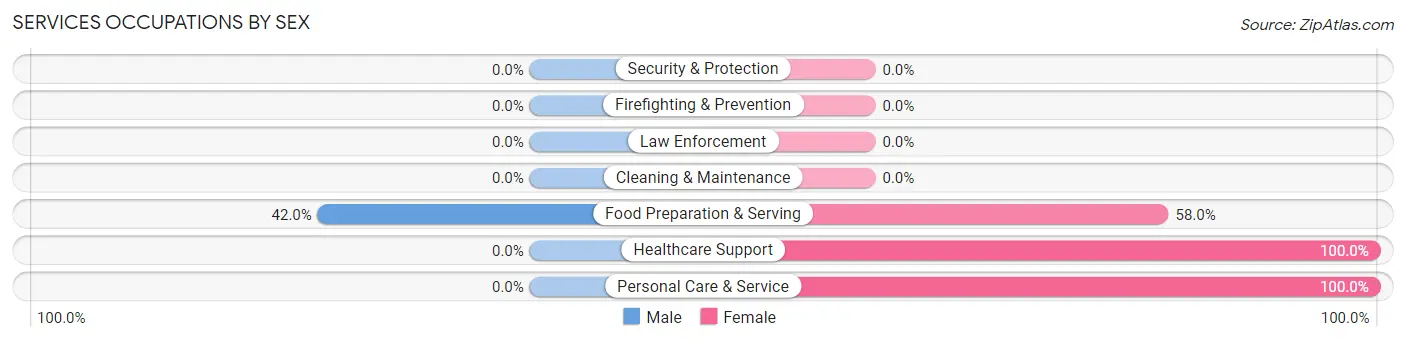
Services Occupations by Sex
| Occupation | Male | Female |
| Healthcare Support | 0 (0.0%) | 44 (100.0%) |
| Security & Protection | 0 (0.0%) | 0 (0.0%) |
| Firefighting & Prevention | 0 (0.0%) | 0 (0.0%) |
| Law Enforcement | 0 (0.0%) | 0 (0.0%) |
| Food Preparation & Serving | 55 (42.0%) | 76 (58.0%) |
| Cleaning & Maintenance | 0 (0.0%) | 0 (0.0%) |
| Personal Care & Service | 0 (0.0%) | 22 (100.0%) |
| Total (Category) | 55 (27.9%) | 142 (72.1%) |
| Total (Overall) | 244 (38.1%) | 396 (61.9%) |
Sales and Office Occupations
The most common Sales and Office occupations in Arnold Line are , and Office & Administration (32 | 5.0%).
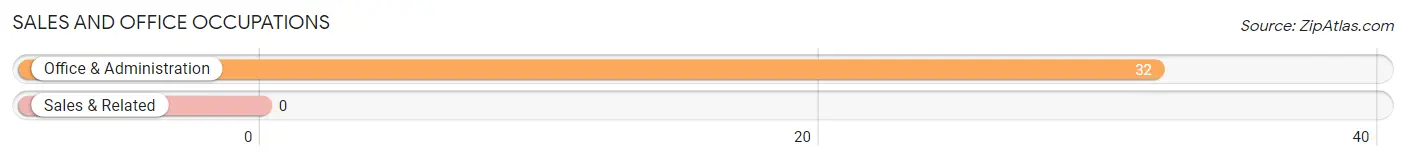
Sales and Office Occupations by Sex
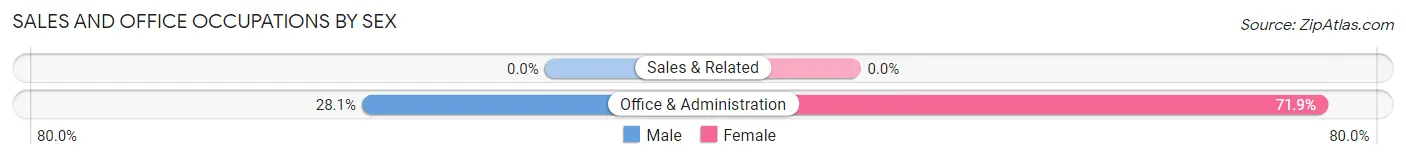
| Occupation | Male | Female |
| Sales & Related | 0 (0.0%) | 0 (0.0%) |
| Office & Administration | 9 (28.1%) | 23 (71.9%) |
| Total (Category) | 9 (28.1%) | 23 (71.9%) |
| Total (Overall) | 244 (38.1%) | 396 (61.9%) |
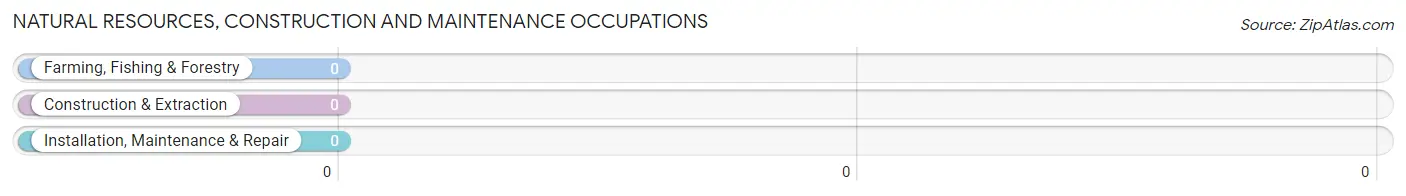
Natural Resources, Construction and Maintenance Occupations
Natural Resources, Construction and Maintenance Occupations by Sex
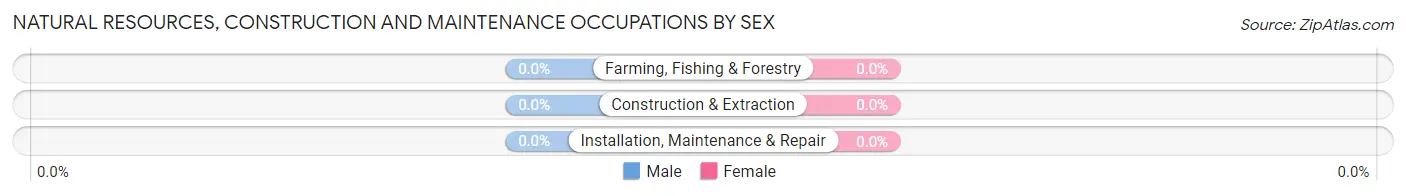
| Occupation | Male | Female |
| Farming, Fishing & Forestry | 0 (0.0%) | 0 (0.0%) |
| Construction & Extraction | 0 (0.0%) | 0 (0.0%) |
| Installation, Maintenance & Repair | 0 (0.0%) | 0 (0.0%) |
| Total (Category) | 0 (0.0%) | 0 (0.0%) |
| Total (Overall) | 244 (38.1%) | 396 (61.9%) |
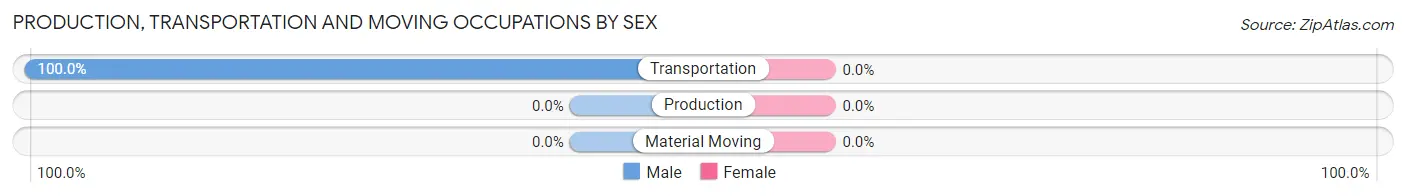
Production, Transportation and Moving Occupations
The most common Production, Transportation and Moving occupations in Arnold Line are , and Transportation (116 | 18.1%).
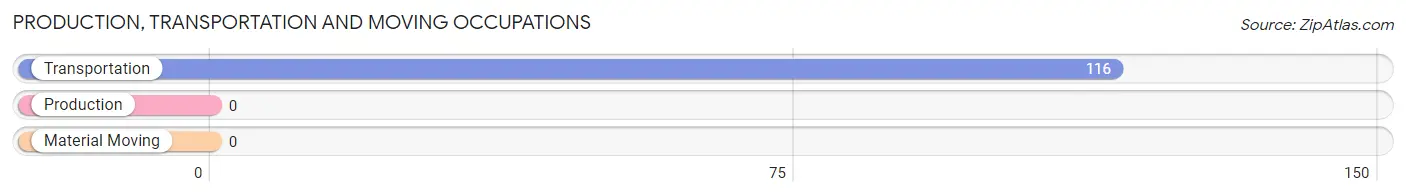
Production, Transportation and Moving Occupations by Sex
| Occupation | Male | Female |
| Production | 0 (0.0%) | 0 (0.0%) |
| Transportation | 116 (100.0%) | 0 (0.0%) |
| Material Moving | 0 (0.0%) | 0 (0.0%) |
| Total (Category) | 116 (100.0%) | 0 (0.0%) |
| Total (Overall) | 244 (38.1%) | 396 (61.9%) |
Employment Industries by Sex in Arnold Line
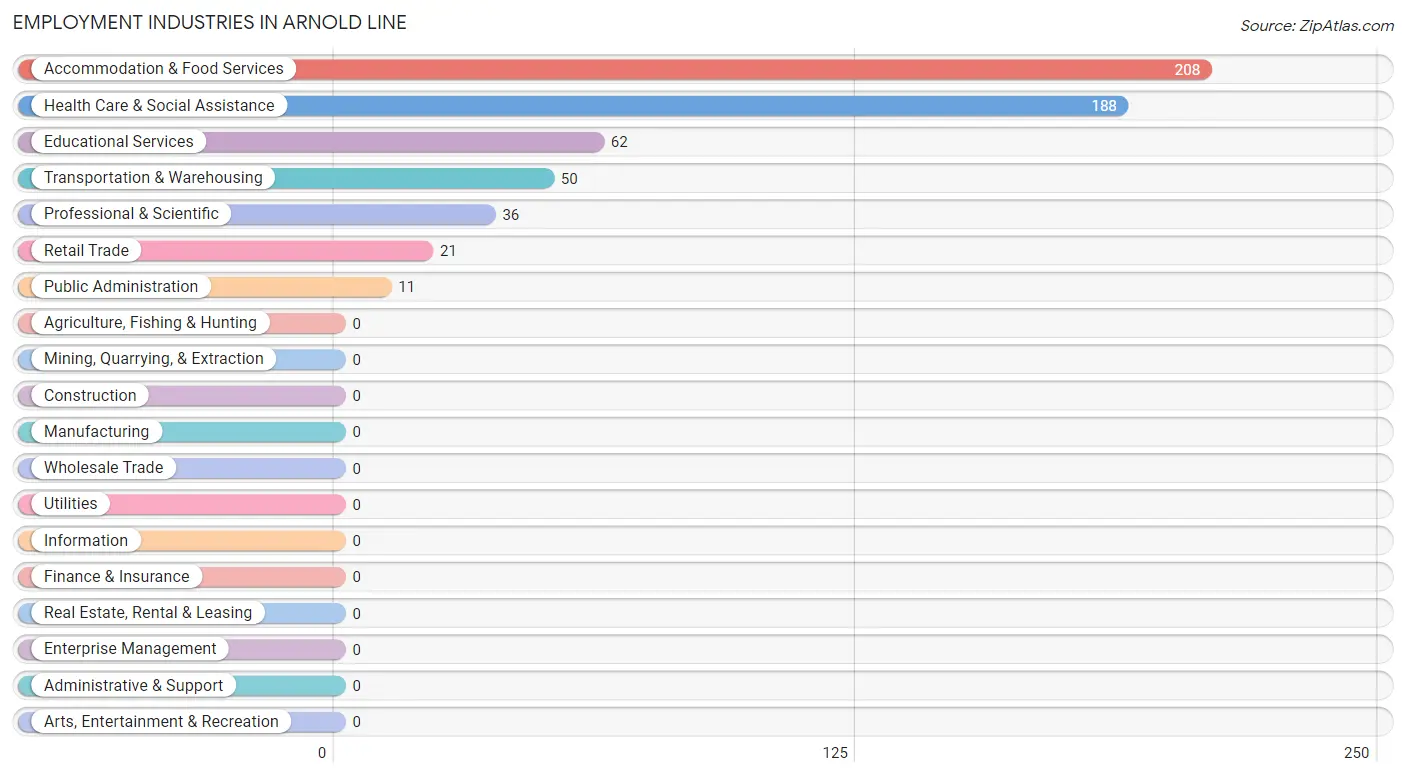
Employment Industries in Arnold Line
The major employment industries in Arnold Line include Accommodation & Food Services (208 | 32.5%), Health Care & Social Assistance (188 | 29.4%), Educational Services (62 | 9.7%), Transportation & Warehousing (50 | 7.8%), and Professional & Scientific (36 | 5.6%).
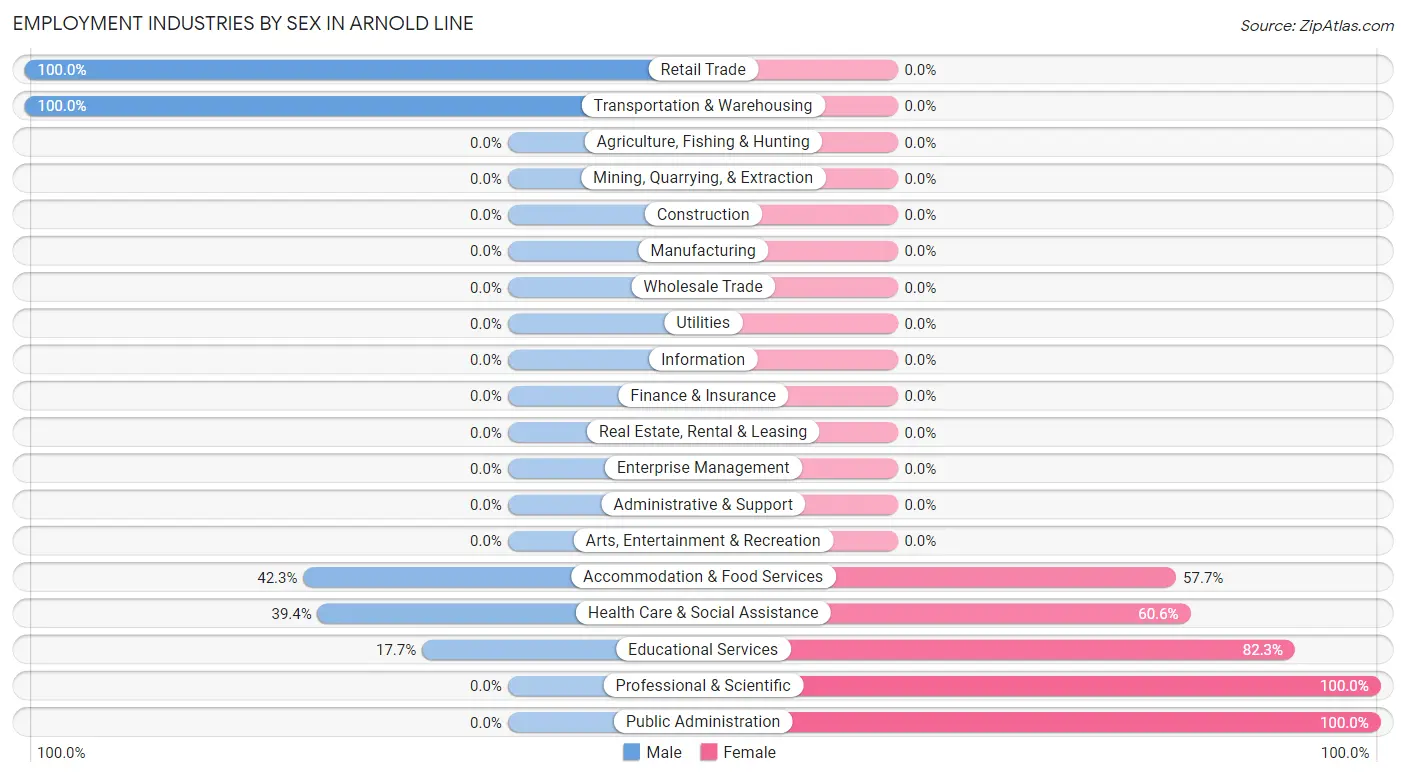
Employment Industries by Sex in Arnold Line
The Arnold Line industries that see more men than women are Retail Trade (100.0%), Transportation & Warehousing (100.0%), and Accommodation & Food Services (42.3%), whereas the industries that tend to have a higher number of women are Professional & Scientific (100.0%), Public Administration (100.0%), and Educational Services (82.3%).
| Industry | Male | Female |
| Agriculture, Fishing & Hunting | 0 (0.0%) | 0 (0.0%) |
| Mining, Quarrying, & Extraction | 0 (0.0%) | 0 (0.0%) |
| Construction | 0 (0.0%) | 0 (0.0%) |
| Manufacturing | 0 (0.0%) | 0 (0.0%) |
| Wholesale Trade | 0 (0.0%) | 0 (0.0%) |
| Retail Trade | 21 (100.0%) | 0 (0.0%) |
| Transportation & Warehousing | 50 (100.0%) | 0 (0.0%) |
| Utilities | 0 (0.0%) | 0 (0.0%) |
| Information | 0 (0.0%) | 0 (0.0%) |
| Finance & Insurance | 0 (0.0%) | 0 (0.0%) |
| Real Estate, Rental & Leasing | 0 (0.0%) | 0 (0.0%) |
| Professional & Scientific | 0 (0.0%) | 36 (100.0%) |
| Enterprise Management | 0 (0.0%) | 0 (0.0%) |
| Administrative & Support | 0 (0.0%) | 0 (0.0%) |
| Educational Services | 11 (17.7%) | 51 (82.3%) |
| Health Care & Social Assistance | 74 (39.4%) | 114 (60.6%) |
| Arts, Entertainment & Recreation | 0 (0.0%) | 0 (0.0%) |
| Accommodation & Food Services | 88 (42.3%) | 120 (57.7%) |
| Public Administration | 0 (0.0%) | 11 (100.0%) |
| Total | 244 (38.1%) | 396 (61.9%) |
Education in Arnold Line
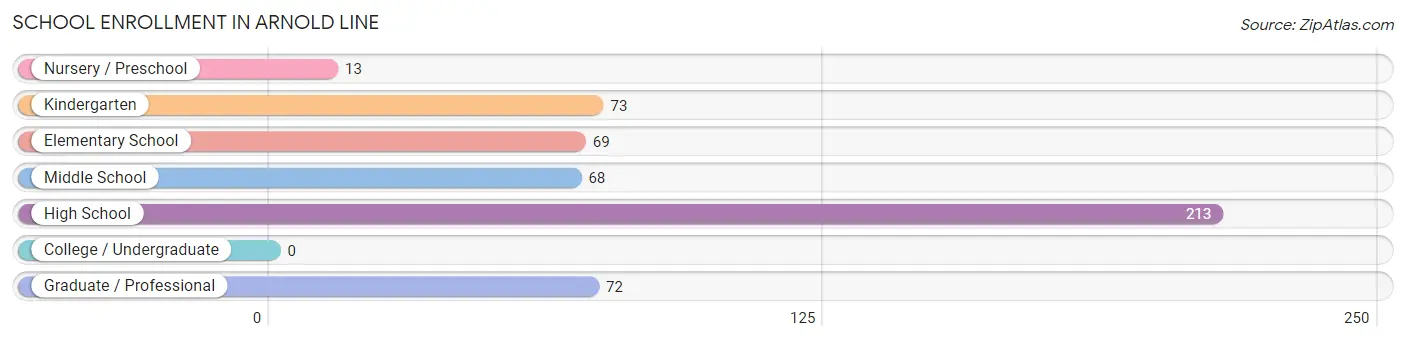
School Enrollment in Arnold Line
The most common levels of schooling among the 508 students in Arnold Line are high school (213 | 41.9%), kindergarten (73 | 14.4%), and graduate / professional (72 | 14.2%).
| School Level | # Students | % Students |
| Nursery / Preschool | 13 | 2.6% |
| Kindergarten | 73 | 14.4% |
| Elementary School | 69 | 13.6% |
| Middle School | 68 | 13.4% |
| High School | 213 | 41.9% |
| College / Undergraduate | 0 | 0.0% |
| Graduate / Professional | 72 | 14.2% |
| Total | 508 | 100.0% |
School Enrollment by Age by Funding Source in Arnold Line
Out of a total of 508 students who are enrolled in schools in Arnold Line, 85 (16.7%) attend a private institution, while the remaining 423 (83.3%) are enrolled in public schools. The age group of 3 to 4 year olds has the highest likelihood of being enrolled in private schools, with 13 (100.0% in the age bracket) enrolled. Conversely, the age group of 5 to 9 year old has the lowest likelihood of being enrolled in a private school, with 116 (100.0% in the age bracket) attending a public institution.
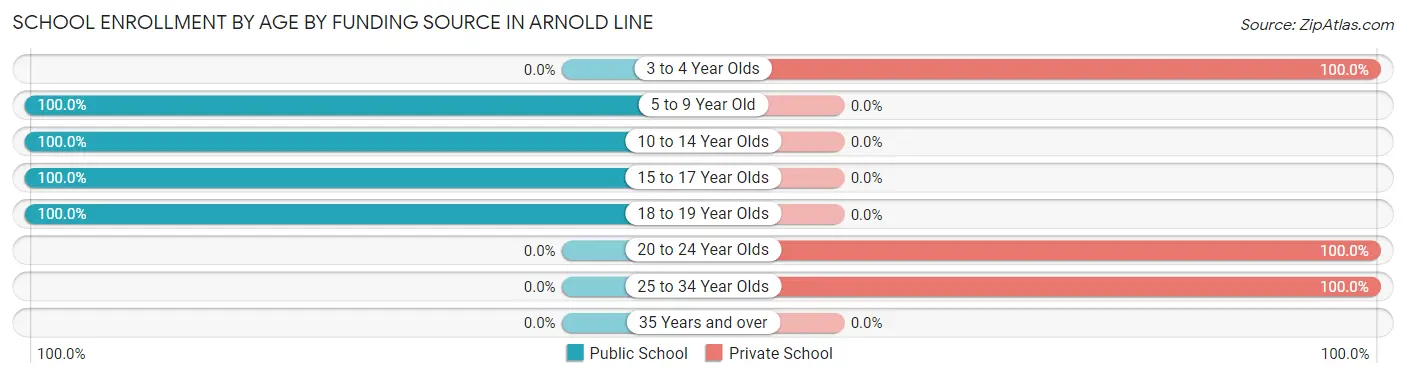
| Age Bracket | Public School | Private School |
| 3 to 4 Year Olds | 0 (0.0%) | 13 (100.0%) |
| 5 to 9 Year Old | 116 (100.0%) | 0 (0.0%) |
| 10 to 14 Year Olds | 94 (100.0%) | 0 (0.0%) |
| 15 to 17 Year Olds | 152 (100.0%) | 0 (0.0%) |
| 18 to 19 Year Olds | 61 (100.0%) | 0 (0.0%) |
| 20 to 24 Year Olds | 0 (0.0%) | 20 (100.0%) |
| 25 to 34 Year Olds | 0 (0.0%) | 52 (100.0%) |
| 35 Years and over | 0 (0.0%) | 0 (0.0%) |
| Total | 423 (83.3%) | 85 (16.7%) |
Educational Attainment by Field of Study in Arnold Line
Education (136 | 44.7%), business (65 | 21.4%), liberal arts & history (52 | 17.1%), engineering (28 | 9.2%), and visual & performing arts (23 | 7.6%) are the most common fields of study among 304 individuals in Arnold Line who have obtained a bachelor's degree or higher.
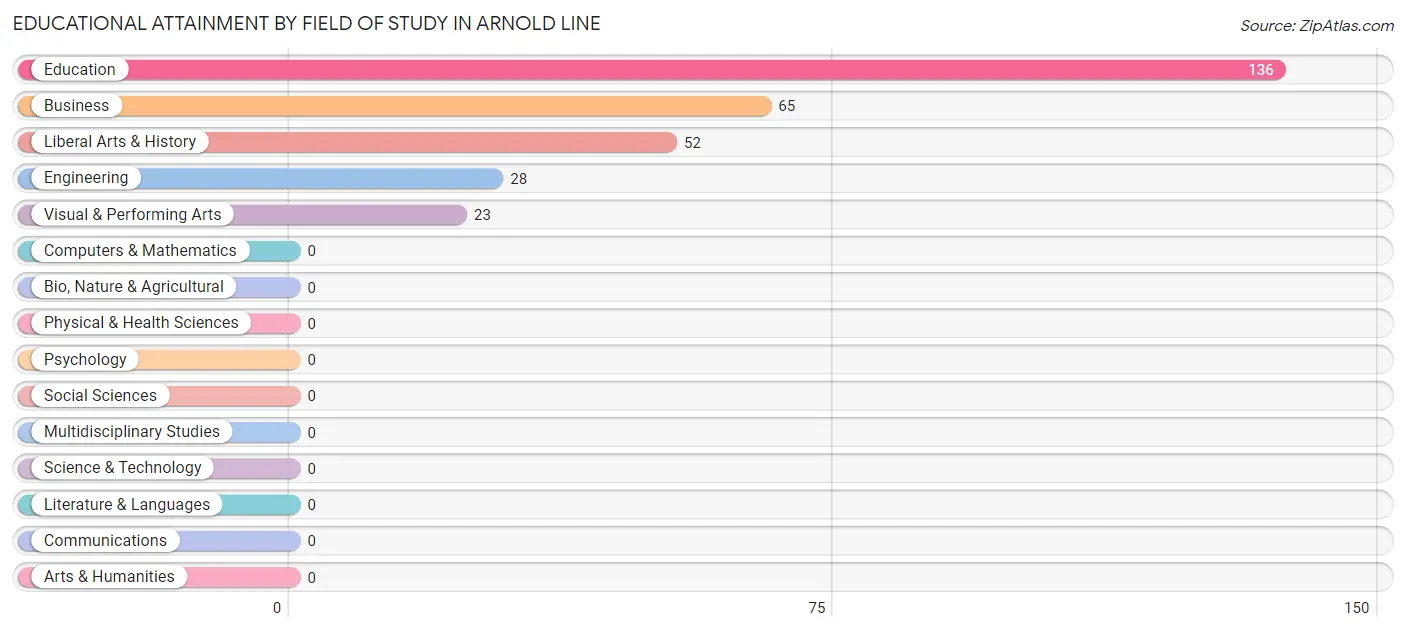
| Field of Study | # Graduates | % Graduates |
| Computers & Mathematics | 0 | 0.0% |
| Bio, Nature & Agricultural | 0 | 0.0% |
| Physical & Health Sciences | 0 | 0.0% |
| Psychology | 0 | 0.0% |
| Social Sciences | 0 | 0.0% |
| Engineering | 28 | 9.2% |
| Multidisciplinary Studies | 0 | 0.0% |
| Science & Technology | 0 | 0.0% |
| Business | 65 | 21.4% |
| Education | 136 | 44.7% |
| Literature & Languages | 0 | 0.0% |
| Liberal Arts & History | 52 | 17.1% |
| Visual & Performing Arts | 23 | 7.6% |
| Communications | 0 | 0.0% |
| Arts & Humanities | 0 | 0.0% |
| Total | 304 | 100.0% |
Transportation & Commute in Arnold Line
Vehicle Availability by Sex in Arnold Line
The most prevalent vehicle ownership categories in Arnold Line are males with 2 vehicles (88, accounting for 36.1%) and females with 2 vehicles (179, making up 22.2%).
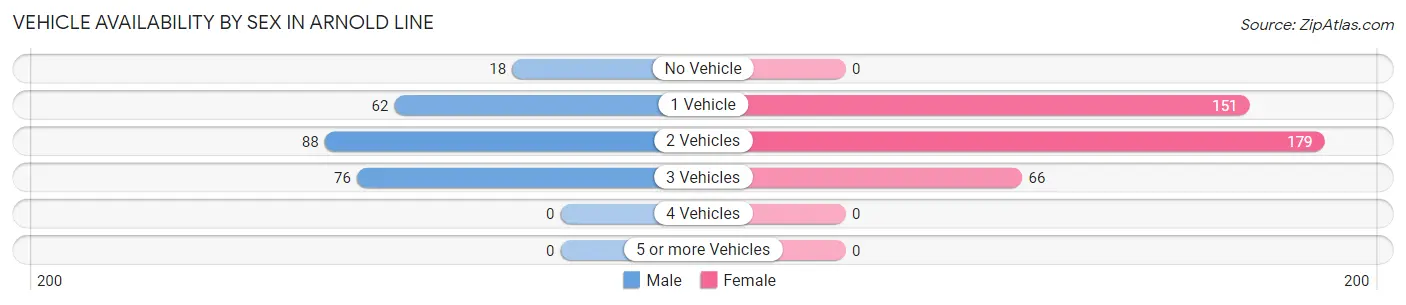
| Vehicles Available | Male | Female |
| No Vehicle | 18 (7.4%) | 0 (0.0%) |
| 1 Vehicle | 62 (25.4%) | 151 (38.1%) |
| 2 Vehicles | 88 (36.1%) | 179 (45.2%) |
| 3 Vehicles | 76 (31.1%) | 66 (16.7%) |
| 4 Vehicles | 0 (0.0%) | 0 (0.0%) |
| 5 or more Vehicles | 0 (0.0%) | 0 (0.0%) |
| Total | 244 (100.0%) | 396 (100.0%) |
Commute Time in Arnold Line
The most frequently occuring commute durations in Arnold Line are 10 to 14 minutes (221 commuters, 34.5%), 15 to 19 minutes (154 commuters, 24.1%), and 60 to 89 minutes (95 commuters, 14.8%).
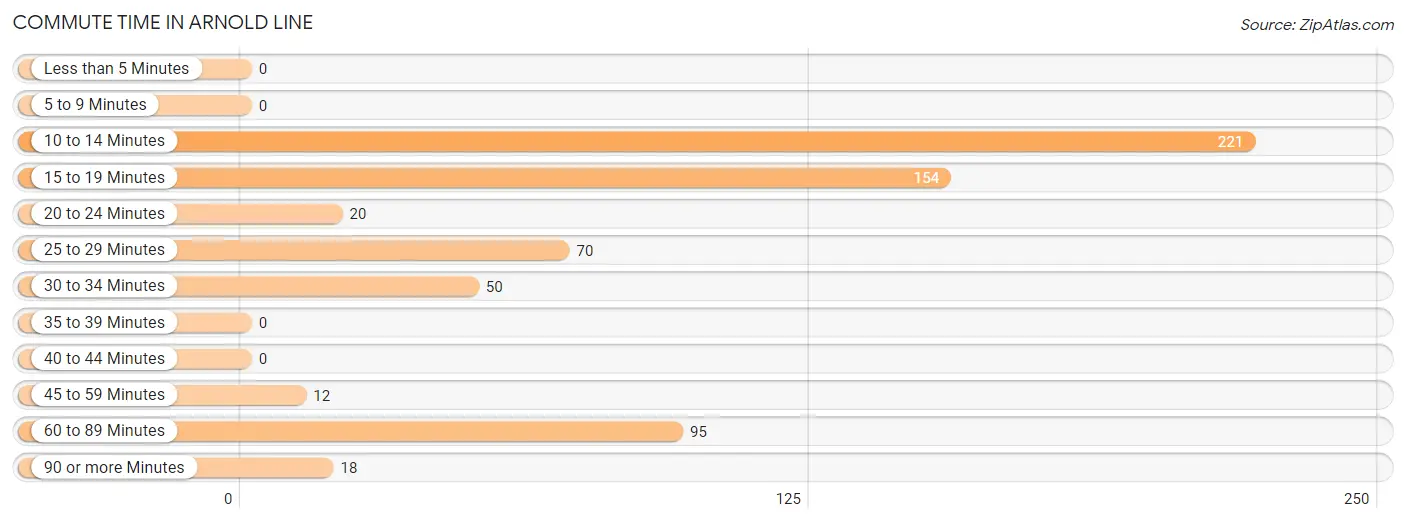
| Commute Time | # Commuters | % Commuters |
| Less than 5 Minutes | 0 | 0.0% |
| 5 to 9 Minutes | 0 | 0.0% |
| 10 to 14 Minutes | 221 | 34.5% |
| 15 to 19 Minutes | 154 | 24.1% |
| 20 to 24 Minutes | 20 | 3.1% |
| 25 to 29 Minutes | 70 | 10.9% |
| 30 to 34 Minutes | 50 | 7.8% |
| 35 to 39 Minutes | 0 | 0.0% |
| 40 to 44 Minutes | 0 | 0.0% |
| 45 to 59 Minutes | 12 | 1.9% |
| 60 to 89 Minutes | 95 | 14.8% |
| 90 or more Minutes | 18 | 2.8% |
Commute Time by Sex in Arnold Line
The most common commute times in Arnold Line are 10 to 14 minutes (89 commuters, 36.5%) for males and 10 to 14 minutes (132 commuters, 33.3%) for females.
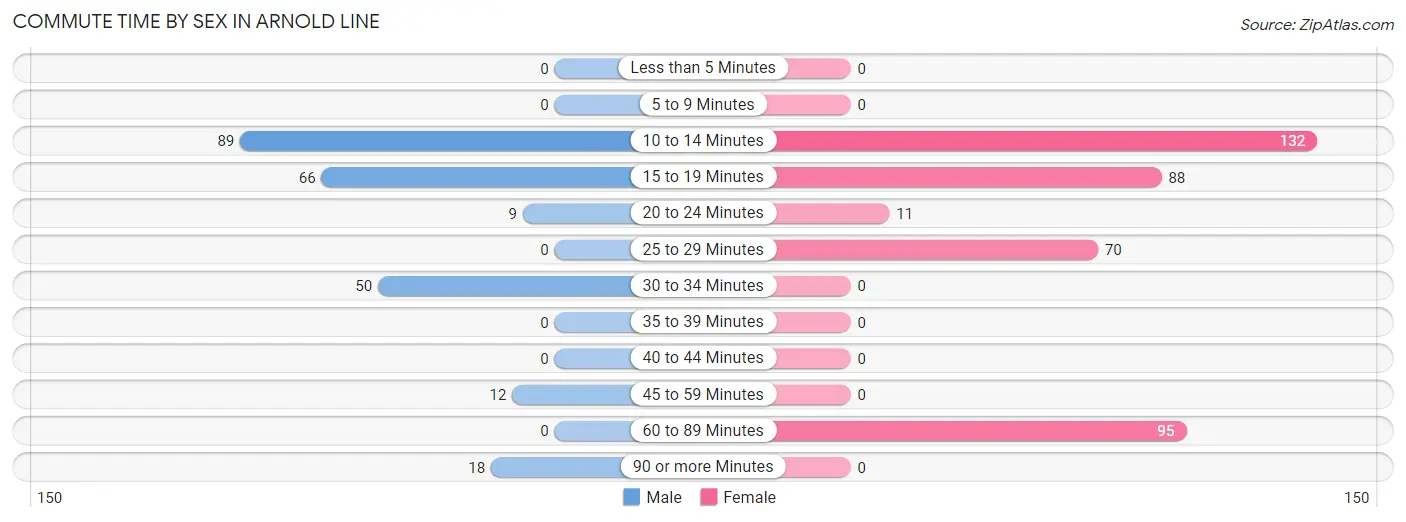
| Commute Time | Male | Female |
| Less than 5 Minutes | 0 (0.0%) | 0 (0.0%) |
| 5 to 9 Minutes | 0 (0.0%) | 0 (0.0%) |
| 10 to 14 Minutes | 89 (36.5%) | 132 (33.3%) |
| 15 to 19 Minutes | 66 (27.1%) | 88 (22.2%) |
| 20 to 24 Minutes | 9 (3.7%) | 11 (2.8%) |
| 25 to 29 Minutes | 0 (0.0%) | 70 (17.7%) |
| 30 to 34 Minutes | 50 (20.5%) | 0 (0.0%) |
| 35 to 39 Minutes | 0 (0.0%) | 0 (0.0%) |
| 40 to 44 Minutes | 0 (0.0%) | 0 (0.0%) |
| 45 to 59 Minutes | 12 (4.9%) | 0 (0.0%) |
| 60 to 89 Minutes | 0 (0.0%) | 95 (24.0%) |
| 90 or more Minutes | 18 (7.4%) | 0 (0.0%) |
Time of Departure to Work by Sex in Arnold Line
The most frequent times of departure to work in Arnold Line are 7:00 AM to 7:29 AM (67, 27.5%) for males and 7:00 AM to 7:29 AM (95, 24.0%) for females.
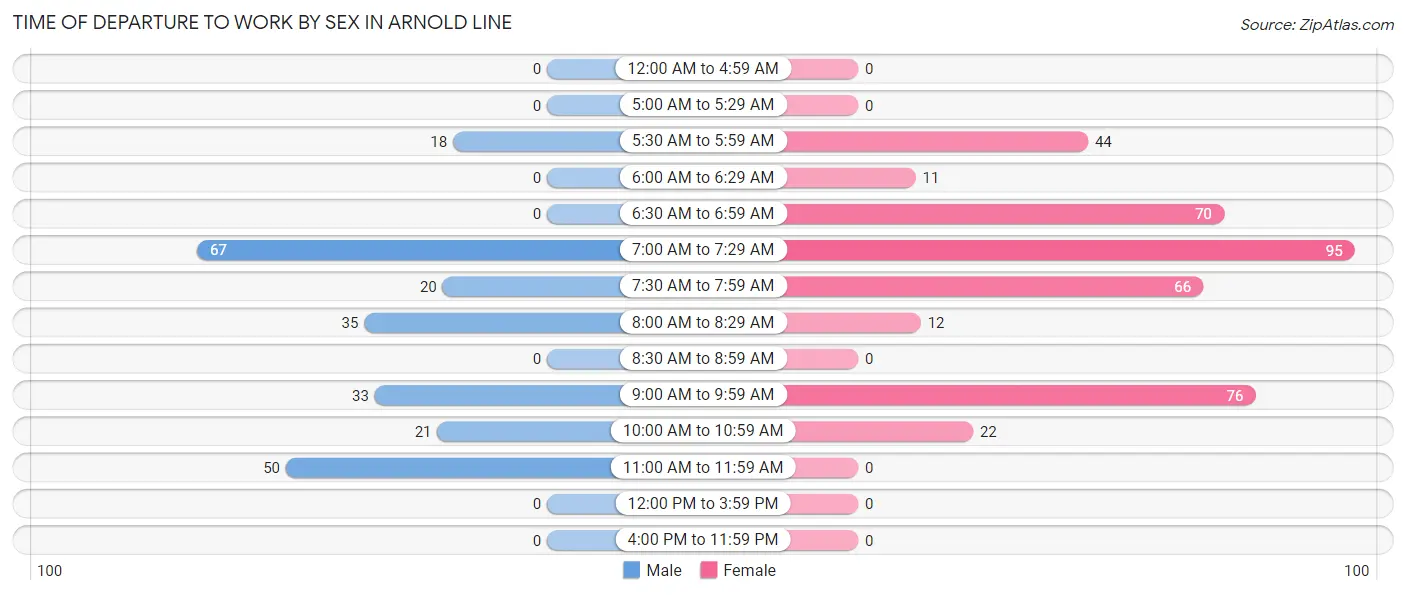
| Time of Departure | Male | Female |
| 12:00 AM to 4:59 AM | 0 (0.0%) | 0 (0.0%) |
| 5:00 AM to 5:29 AM | 0 (0.0%) | 0 (0.0%) |
| 5:30 AM to 5:59 AM | 18 (7.4%) | 44 (11.1%) |
| 6:00 AM to 6:29 AM | 0 (0.0%) | 11 (2.8%) |
| 6:30 AM to 6:59 AM | 0 (0.0%) | 70 (17.7%) |
| 7:00 AM to 7:29 AM | 67 (27.5%) | 95 (24.0%) |
| 7:30 AM to 7:59 AM | 20 (8.2%) | 66 (16.7%) |
| 8:00 AM to 8:29 AM | 35 (14.3%) | 12 (3.0%) |
| 8:30 AM to 8:59 AM | 0 (0.0%) | 0 (0.0%) |
| 9:00 AM to 9:59 AM | 33 (13.5%) | 76 (19.2%) |
| 10:00 AM to 10:59 AM | 21 (8.6%) | 22 (5.6%) |
| 11:00 AM to 11:59 AM | 50 (20.5%) | 0 (0.0%) |
| 12:00 PM to 3:59 PM | 0 (0.0%) | 0 (0.0%) |
| 4:00 PM to 11:59 PM | 0 (0.0%) | 0 (0.0%) |
| Total | 244 (100.0%) | 396 (100.0%) |
Housing Occupancy in Arnold Line
Occupancy by Ownership in Arnold Line
Of the total 698 dwellings in Arnold Line, owner-occupied units account for 469 (67.2%), while renter-occupied units make up 229 (32.8%).
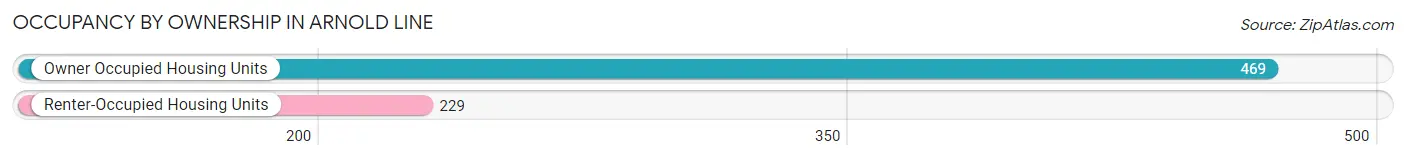
| Occupancy | # Housing Units | % Housing Units |
| Owner Occupied Housing Units | 469 | 67.2% |
| Renter-Occupied Housing Units | 229 | 32.8% |
| Total Occupied Housing Units | 698 | 100.0% |
Occupancy by Household Size in Arnold Line
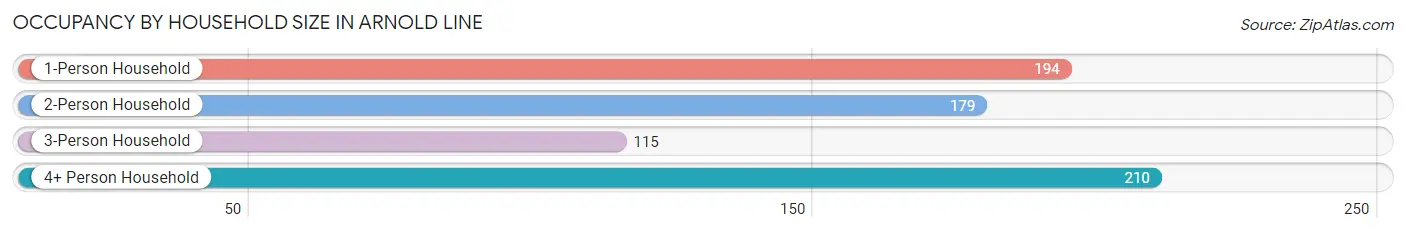
| Household Size | # Housing Units | % Housing Units |
| 1-Person Household | 194 | 27.8% |
| 2-Person Household | 179 | 25.6% |
| 3-Person Household | 115 | 16.5% |
| 4+ Person Household | 210 | 30.1% |
| Total Housing Units | 698 | 100.0% |
Occupancy by Ownership by Household Size in Arnold Line
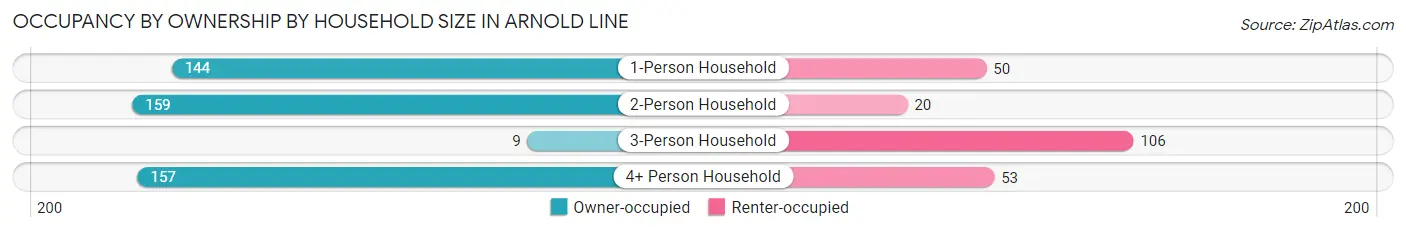
| Household Size | Owner-occupied | Renter-occupied |
| 1-Person Household | 144 (74.2%) | 50 (25.8%) |
| 2-Person Household | 159 (88.8%) | 20 (11.2%) |
| 3-Person Household | 9 (7.8%) | 106 (92.2%) |
| 4+ Person Household | 157 (74.8%) | 53 (25.2%) |
| Total Housing Units | 469 (67.2%) | 229 (32.8%) |
Occupancy by Educational Attainment in Arnold Line
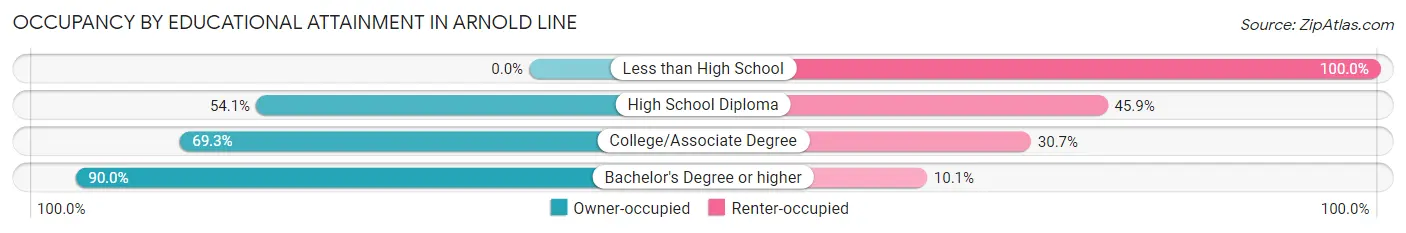
| Household Size | Owner-occupied | Renter-occupied |
| Less than High School | 0 (0.0%) | 9 (100.0%) |
| High School Diploma | 177 (54.1%) | 150 (45.9%) |
| College/Associate Degree | 113 (69.3%) | 50 (30.7%) |
| Bachelor's Degree or higher | 179 (89.9%) | 20 (10.1%) |
Occupancy by Age of Householder in Arnold Line
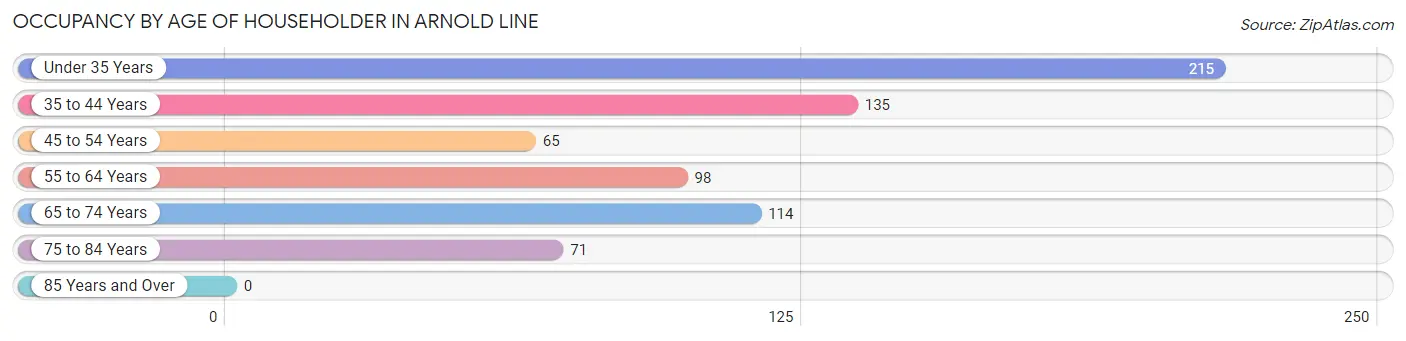
| Age Bracket | # Households | % Households |
| Under 35 Years | 215 | 30.8% |
| 35 to 44 Years | 135 | 19.3% |
| 45 to 54 Years | 65 | 9.3% |
| 55 to 64 Years | 98 | 14.0% |
| 65 to 74 Years | 114 | 16.3% |
| 75 to 84 Years | 71 | 10.2% |
| 85 Years and Over | 0 | 0.0% |
| Total | 698 | 100.0% |
Housing Finances in Arnold Line
Median Income by Occupancy in Arnold Line
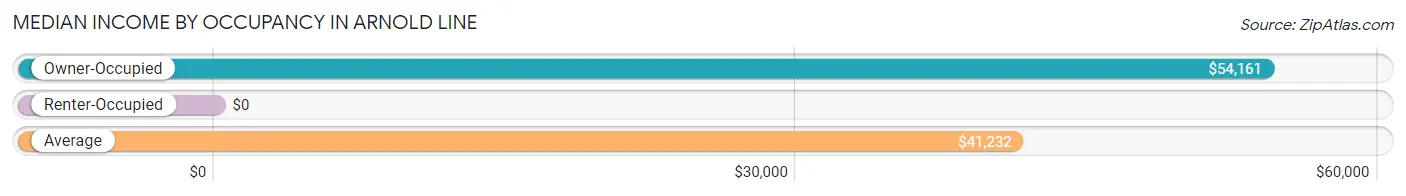
| Occupancy Type | # Households | Median Income |
| Owner-Occupied | 469 (67.2%) | $54,161 |
| Renter-Occupied | 229 (32.8%) | $0 |
| Average | 698 (100.0%) | $41,232 |
Occupancy by Householder Income Bracket in Arnold Line
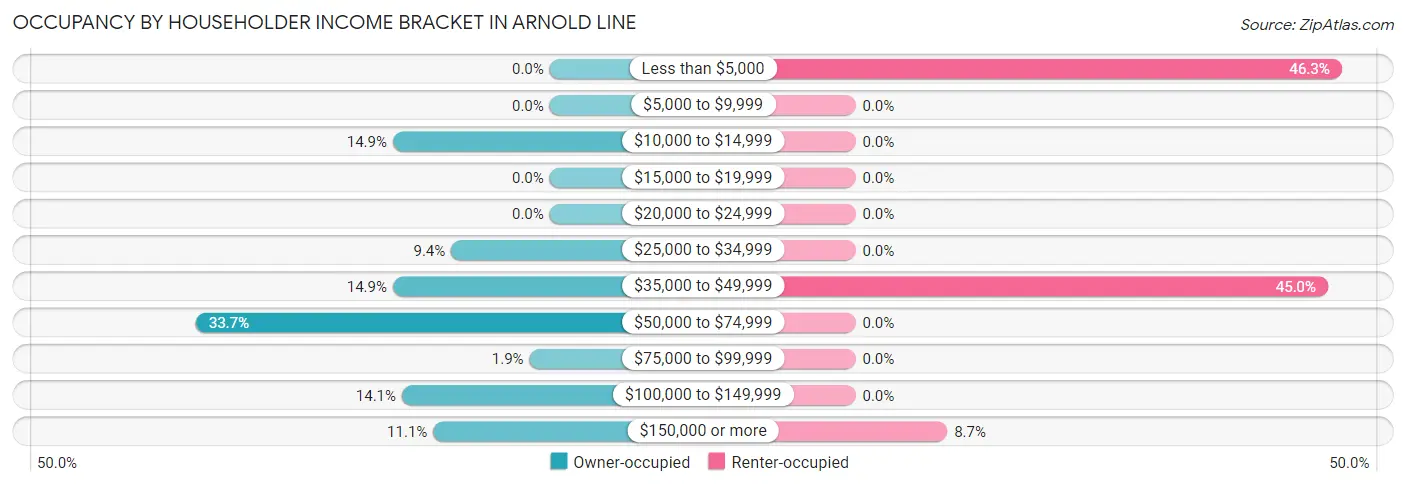
| Income Bracket | Owner-occupied | Renter-occupied |
| Less than $5,000 | 0 (0.0%) | 106 (46.3%) |
| $5,000 to $9,999 | 0 (0.0%) | 0 (0.0%) |
| $10,000 to $14,999 | 70 (14.9%) | 0 (0.0%) |
| $15,000 to $19,999 | 0 (0.0%) | 0 (0.0%) |
| $20,000 to $24,999 | 0 (0.0%) | 0 (0.0%) |
| $25,000 to $34,999 | 44 (9.4%) | 0 (0.0%) |
| $35,000 to $49,999 | 70 (14.9%) | 103 (45.0%) |
| $50,000 to $74,999 | 158 (33.7%) | 0 (0.0%) |
| $75,000 to $99,999 | 9 (1.9%) | 0 (0.0%) |
| $100,000 to $149,999 | 66 (14.1%) | 0 (0.0%) |
| $150,000 or more | 52 (11.1%) | 20 (8.7%) |
| Total | 469 (100.0%) | 229 (100.0%) |
Monthly Housing Cost Tiers in Arnold Line
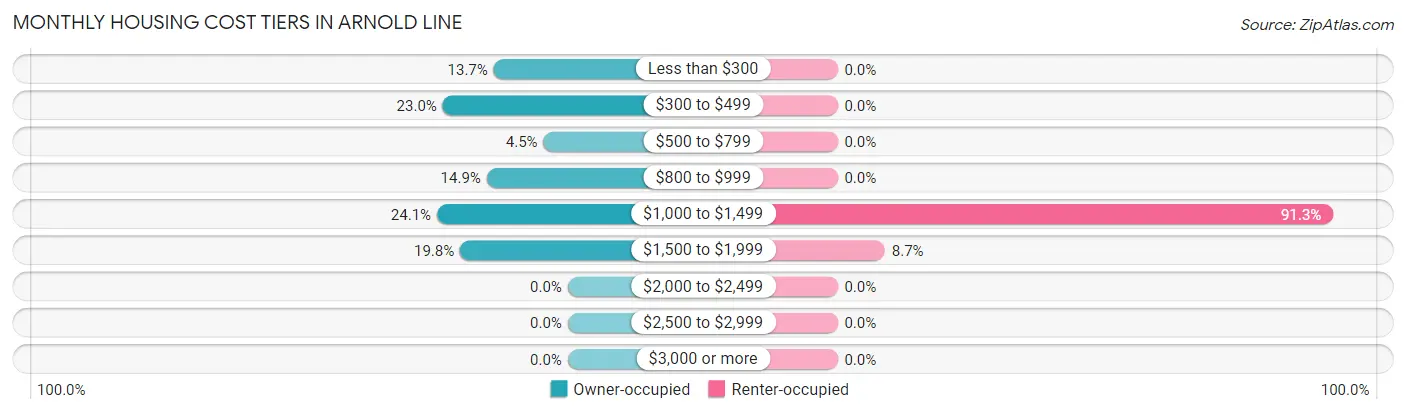
| Monthly Cost | Owner-occupied | Renter-occupied |
| Less than $300 | 64 (13.7%) | 0 (0.0%) |
| $300 to $499 | 108 (23.0%) | 0 (0.0%) |
| $500 to $799 | 21 (4.5%) | 0 (0.0%) |
| $800 to $999 | 70 (14.9%) | 0 (0.0%) |
| $1,000 to $1,499 | 113 (24.1%) | 209 (91.3%) |
| $1,500 to $1,999 | 93 (19.8%) | 20 (8.7%) |
| $2,000 to $2,499 | 0 (0.0%) | 0 (0.0%) |
| $2,500 to $2,999 | 0 (0.0%) | 0 (0.0%) |
| $3,000 or more | 0 (0.0%) | 0 (0.0%) |
| Total | 469 (100.0%) | 229 (100.0%) |
Physical Housing Characteristics in Arnold Line
Housing Structures in Arnold Line
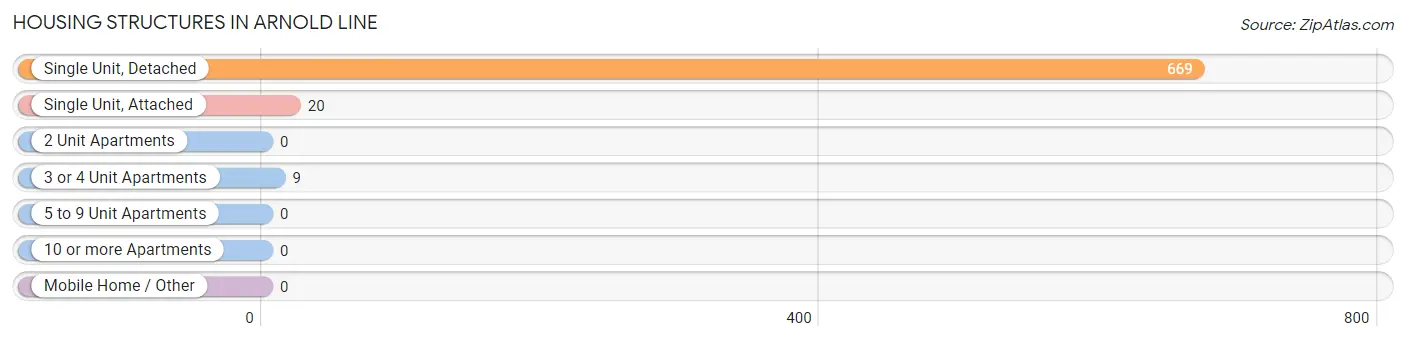
| Structure Type | # Housing Units | % Housing Units |
| Single Unit, Detached | 669 | 95.9% |
| Single Unit, Attached | 20 | 2.9% |
| 2 Unit Apartments | 0 | 0.0% |
| 3 or 4 Unit Apartments | 9 | 1.3% |
| 5 to 9 Unit Apartments | 0 | 0.0% |
| 10 or more Apartments | 0 | 0.0% |
| Mobile Home / Other | 0 | 0.0% |
| Total | 698 | 100.0% |
Housing Structures by Occupancy in Arnold Line
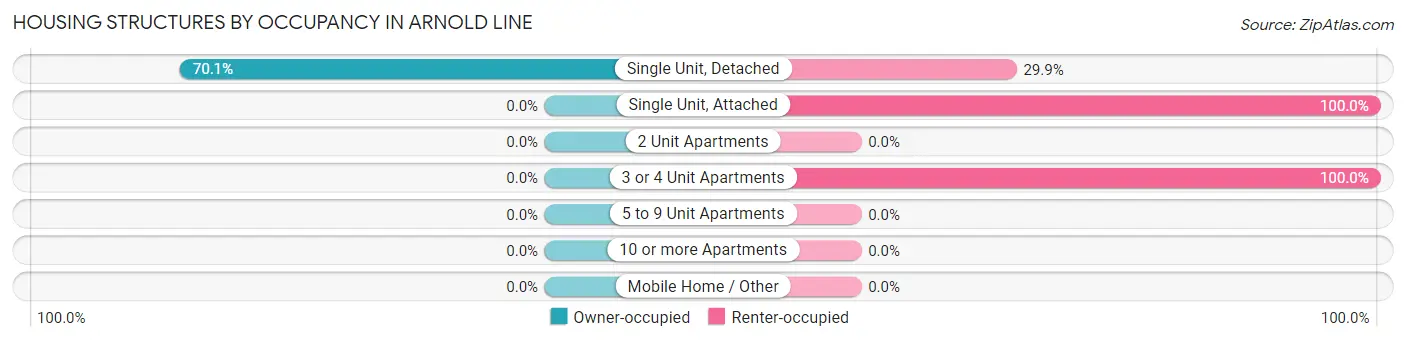
| Structure Type | Owner-occupied | Renter-occupied |
| Single Unit, Detached | 469 (70.1%) | 200 (29.9%) |
| Single Unit, Attached | 0 (0.0%) | 20 (100.0%) |
| 2 Unit Apartments | 0 (0.0%) | 0 (0.0%) |
| 3 or 4 Unit Apartments | 0 (0.0%) | 9 (100.0%) |
| 5 to 9 Unit Apartments | 0 (0.0%) | 0 (0.0%) |
| 10 or more Apartments | 0 (0.0%) | 0 (0.0%) |
| Mobile Home / Other | 0 (0.0%) | 0 (0.0%) |
| Total | 469 (67.2%) | 229 (32.8%) |
Housing Structures by Number of Rooms in Arnold Line
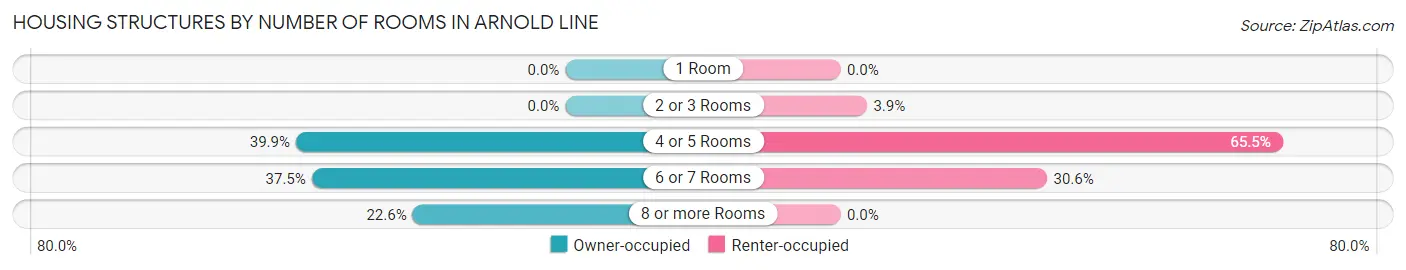
| Number of Rooms | Owner-occupied | Renter-occupied |
| 1 Room | 0 (0.0%) | 0 (0.0%) |
| 2 or 3 Rooms | 0 (0.0%) | 9 (3.9%) |
| 4 or 5 Rooms | 187 (39.9%) | 150 (65.5%) |
| 6 or 7 Rooms | 176 (37.5%) | 70 (30.6%) |
| 8 or more Rooms | 106 (22.6%) | 0 (0.0%) |
| Total | 469 (100.0%) | 229 (100.0%) |
Housing Structure by Heating Type in Arnold Line
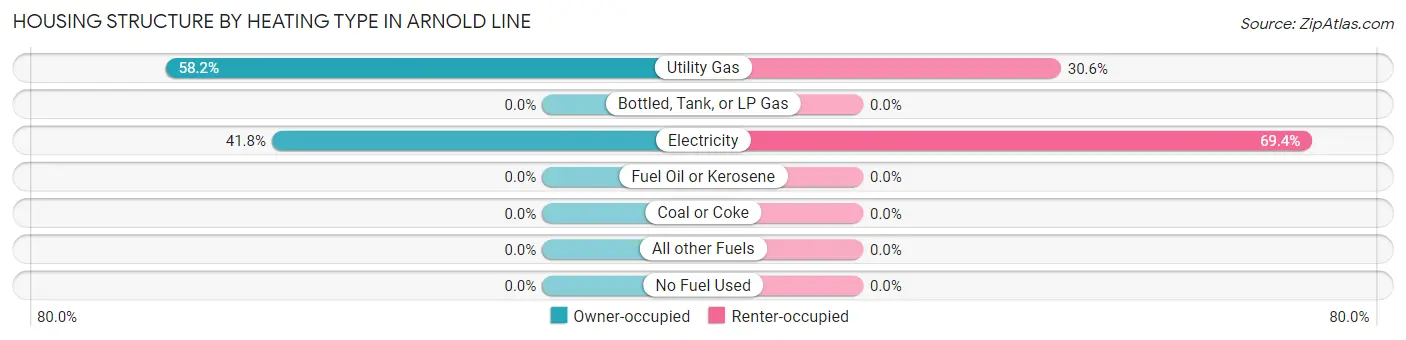
| Heating Type | Owner-occupied | Renter-occupied |
| Utility Gas | 273 (58.2%) | 70 (30.6%) |
| Bottled, Tank, or LP Gas | 0 (0.0%) | 0 (0.0%) |
| Electricity | 196 (41.8%) | 159 (69.4%) |
| Fuel Oil or Kerosene | 0 (0.0%) | 0 (0.0%) |
| Coal or Coke | 0 (0.0%) | 0 (0.0%) |
| All other Fuels | 0 (0.0%) | 0 (0.0%) |
| No Fuel Used | 0 (0.0%) | 0 (0.0%) |
| Total | 469 (100.0%) | 229 (100.0%) |
Household Vehicle Usage in Arnold Line
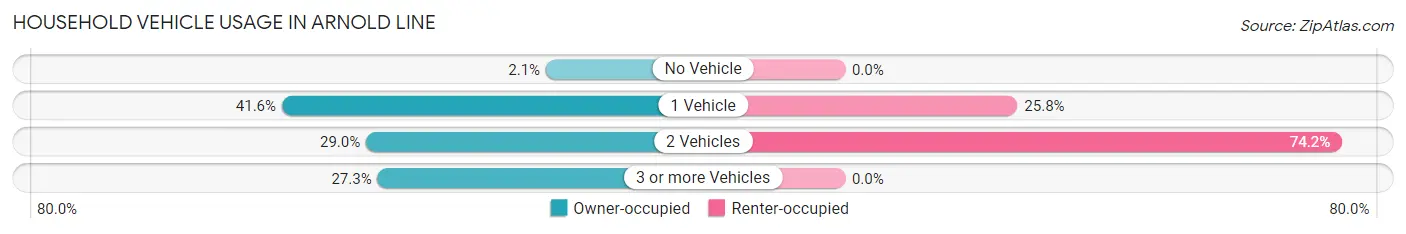
| Vehicles per Household | Owner-occupied | Renter-occupied |
| No Vehicle | 10 (2.1%) | 0 (0.0%) |
| 1 Vehicle | 195 (41.6%) | 59 (25.8%) |
| 2 Vehicles | 136 (29.0%) | 170 (74.2%) |
| 3 or more Vehicles | 128 (27.3%) | 0 (0.0%) |
| Total | 469 (100.0%) | 229 (100.0%) |
Real Estate & Mortgages in Arnold Line
Real Estate and Mortgage Overview in Arnold Line
| Characteristic | Without Mortgage | With Mortgage |
| Housing Units | 182 | 287 |
| Median Property Value | $126,700 | $158,100 |
| Median Household Income | $66,250 | $42 |
| Monthly Housing Costs | $318 | $0 |
| Real Estate Taxes | - | - |
Property Value by Mortgage Status in Arnold Line
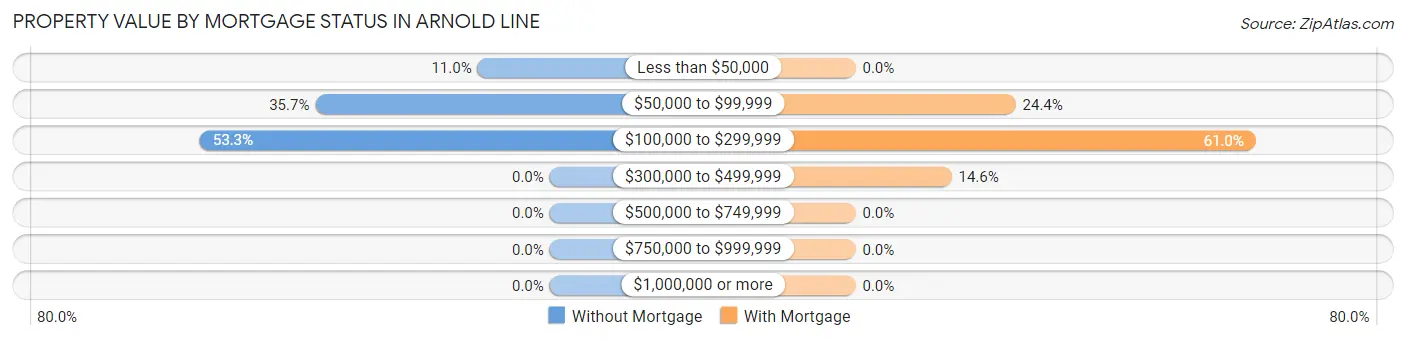
| Property Value | Without Mortgage | With Mortgage |
| Less than $50,000 | 20 (11.0%) | 0 (0.0%) |
| $50,000 to $99,999 | 65 (35.7%) | 70 (24.4%) |
| $100,000 to $299,999 | 97 (53.3%) | 175 (61.0%) |
| $300,000 to $499,999 | 0 (0.0%) | 42 (14.6%) |
| $500,000 to $749,999 | 0 (0.0%) | 0 (0.0%) |
| $750,000 to $999,999 | 0 (0.0%) | 0 (0.0%) |
| $1,000,000 or more | 0 (0.0%) | 0 (0.0%) |
| Total | 182 (100.0%) | 287 (100.0%) |
Household Income by Mortgage Status in Arnold Line
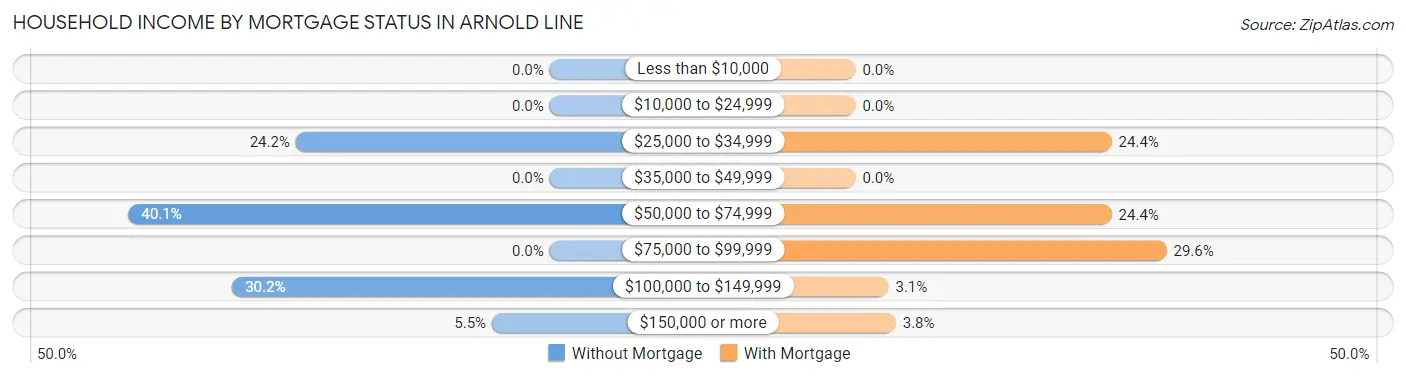
| Household Income | Without Mortgage | With Mortgage |
| Less than $10,000 | 0 (0.0%) | 0 (0.0%) |
| $10,000 to $24,999 | 0 (0.0%) | 0 (0.0%) |
| $25,000 to $34,999 | 44 (24.2%) | 70 (24.4%) |
| $35,000 to $49,999 | 0 (0.0%) | 0 (0.0%) |
| $50,000 to $74,999 | 73 (40.1%) | 70 (24.4%) |
| $75,000 to $99,999 | 0 (0.0%) | 85 (29.6%) |
| $100,000 to $149,999 | 55 (30.2%) | 9 (3.1%) |
| $150,000 or more | 10 (5.5%) | 11 (3.8%) |
| Total | 182 (100.0%) | 287 (100.0%) |
Property Value to Household Income Ratio in Arnold Line
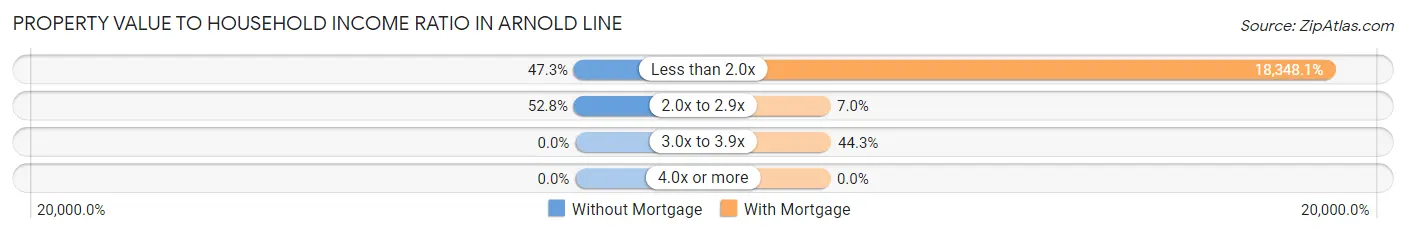
| Value-to-Income Ratio | Without Mortgage | With Mortgage |
| Less than 2.0x | 86 (47.2%) | 52,659 (18,348.1%) |
| 2.0x to 2.9x | 96 (52.7%) | 20 (7.0%) |
| 3.0x to 3.9x | 0 (0.0%) | 127 (44.3%) |
| 4.0x or more | 0 (0.0%) | 0 (0.0%) |
| Total | 182 (100.0%) | 287 (100.0%) |
Real Estate Taxes by Mortgage Status in Arnold Line
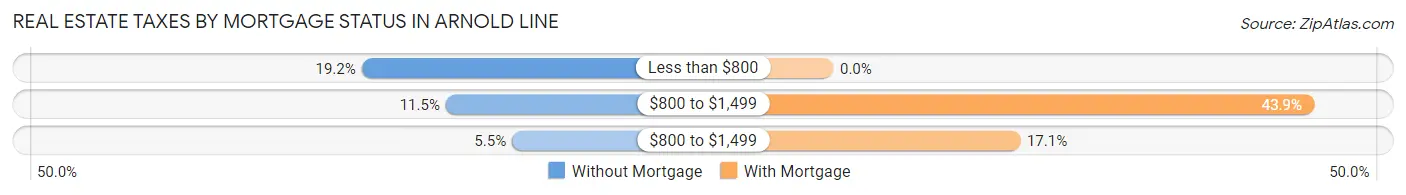
| Property Taxes | Without Mortgage | With Mortgage |
| Less than $800 | 35 (19.2%) | 0 (0.0%) |
| $800 to $1,499 | 21 (11.5%) | 126 (43.9%) |
| $800 to $1,499 | 10 (5.5%) | 49 (17.1%) |
| Total | 182 (100.0%) | 287 (100.0%) |
Health & Disability in Arnold Line
Health Insurance Coverage by Age in Arnold Line
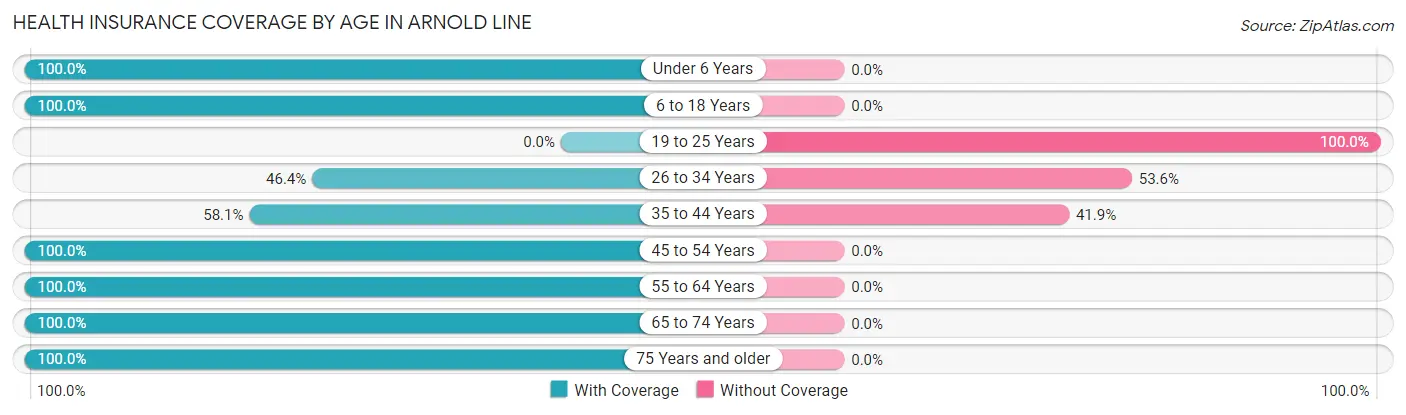
| Age Bracket | With Coverage | Without Coverage |
| Under 6 Years | 111 (100.0%) | 0 (0.0%) |
| 6 to 18 Years | 323 (100.0%) | 0 (0.0%) |
| 19 to 25 Years | 0 (0.0%) | 81 (100.0%) |
| 26 to 34 Years | 224 (46.4%) | 259 (53.6%) |
| 35 to 44 Years | 147 (58.1%) | 106 (41.9%) |
| 45 to 54 Years | 83 (100.0%) | 0 (0.0%) |
| 55 to 64 Years | 156 (100.0%) | 0 (0.0%) |
| 65 to 74 Years | 131 (100.0%) | 0 (0.0%) |
| 75 Years and older | 168 (100.0%) | 0 (0.0%) |
| Total | 1,343 (75.1%) | 446 (24.9%) |
Health Insurance Coverage by Citizenship Status in Arnold Line
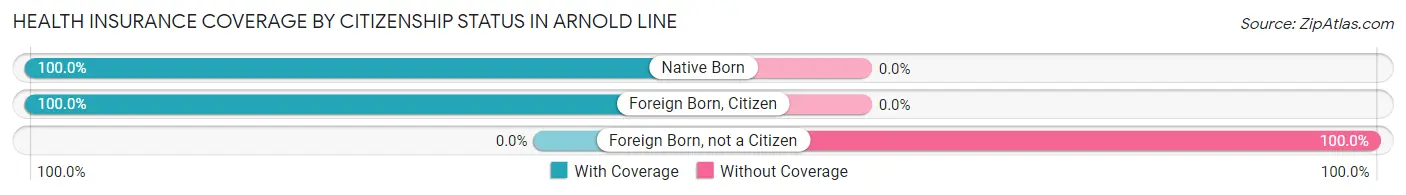
| Citizenship Status | With Coverage | Without Coverage |
| Native Born | 111 (100.0%) | 0 (0.0%) |
| Foreign Born, Citizen | 323 (100.0%) | 0 (0.0%) |
| Foreign Born, not a Citizen | 0 (0.0%) | 81 (100.0%) |
Health Insurance Coverage by Household Income in Arnold Line
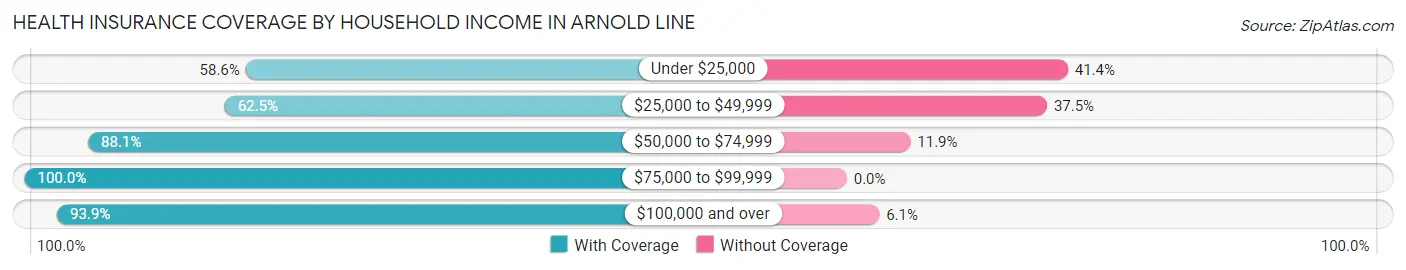
| Household Income | With Coverage | Without Coverage |
| Under $25,000 | 300 (58.6%) | 212 (41.4%) |
| $25,000 to $49,999 | 255 (62.5%) | 153 (37.5%) |
| $50,000 to $74,999 | 451 (88.1%) | 61 (11.9%) |
| $75,000 to $99,999 | 28 (100.0%) | 0 (0.0%) |
| $100,000 and over | 309 (93.9%) | 20 (6.1%) |
Public vs Private Health Insurance Coverage by Age in Arnold Line
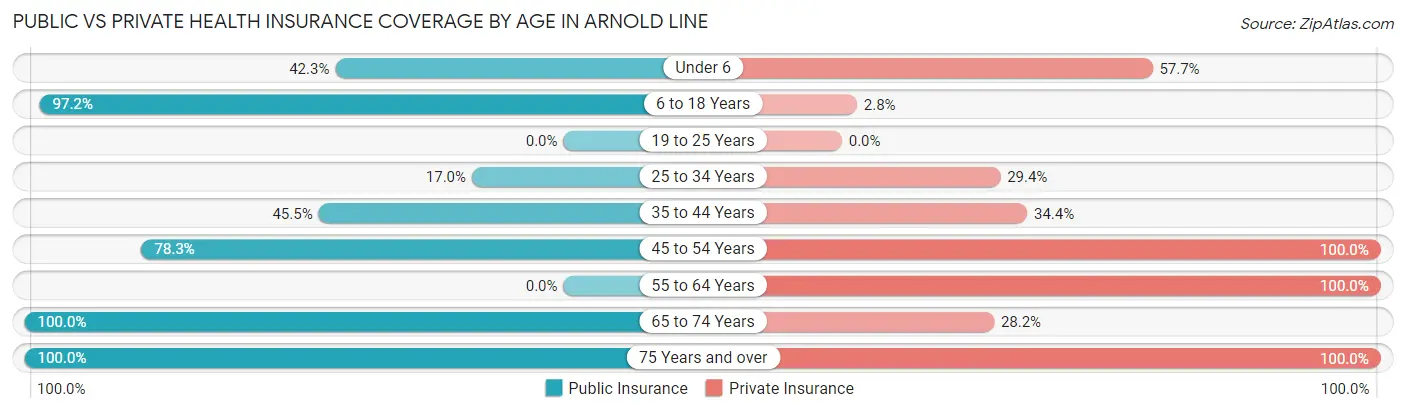
| Age Bracket | Public Insurance | Private Insurance |
| Under 6 | 47 (42.3%) | 64 (57.7%) |
| 6 to 18 Years | 314 (97.2%) | 9 (2.8%) |
| 19 to 25 Years | 0 (0.0%) | 0 (0.0%) |
| 25 to 34 Years | 82 (17.0%) | 142 (29.4%) |
| 35 to 44 Years | 115 (45.5%) | 87 (34.4%) |
| 45 to 54 Years | 65 (78.3%) | 83 (100.0%) |
| 55 to 64 Years | 0 (0.0%) | 156 (100.0%) |
| 65 to 74 Years | 131 (100.0%) | 37 (28.2%) |
| 75 Years and over | 168 (100.0%) | 168 (100.0%) |
| Total | 922 (51.5%) | 746 (41.7%) |
Disability Status by Sex by Age in Arnold Line
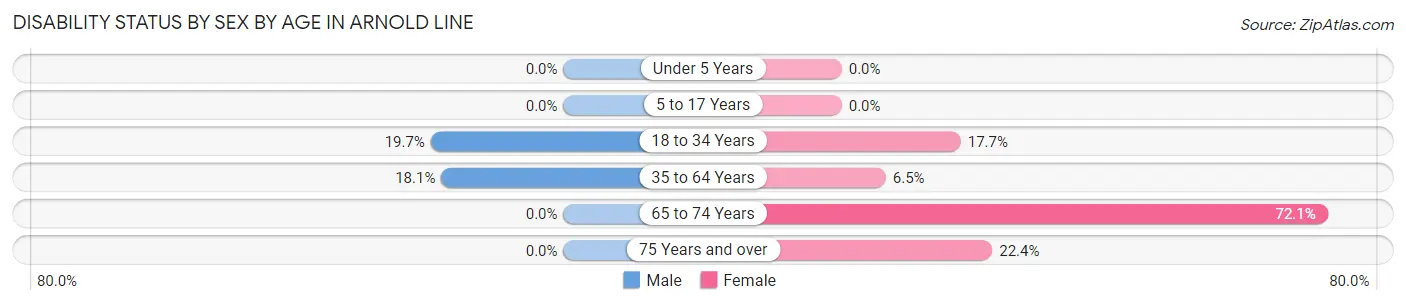
| Age Bracket | Male | Female |
| Under 5 Years | 0 (0.0%) | 0 (0.0%) |
| 5 to 17 Years | 0 (0.0%) | 0 (0.0%) |
| 18 to 34 Years | 52 (19.7%) | 53 (17.7%) |
| 35 to 64 Years | 31 (18.1%) | 21 (6.5%) |
| 65 to 74 Years | 0 (0.0%) | 44 (72.1%) |
| 75 Years and over | 0 (0.0%) | 19 (22.4%) |
Disability Class by Sex by Age in Arnold Line
Disability Class: Hearing Difficulty
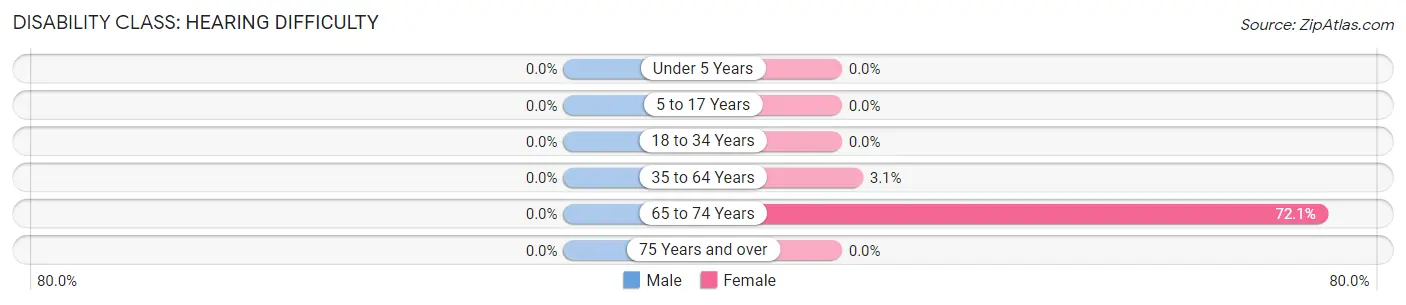
| Age Bracket | Male | Female |
| Under 5 Years | 0 (0.0%) | 0 (0.0%) |
| 5 to 17 Years | 0 (0.0%) | 0 (0.0%) |
| 18 to 34 Years | 0 (0.0%) | 0 (0.0%) |
| 35 to 64 Years | 0 (0.0%) | 10 (3.1%) |
| 65 to 74 Years | 0 (0.0%) | 44 (72.1%) |
| 75 Years and over | 0 (0.0%) | 0 (0.0%) |
Disability Class: Vision Difficulty
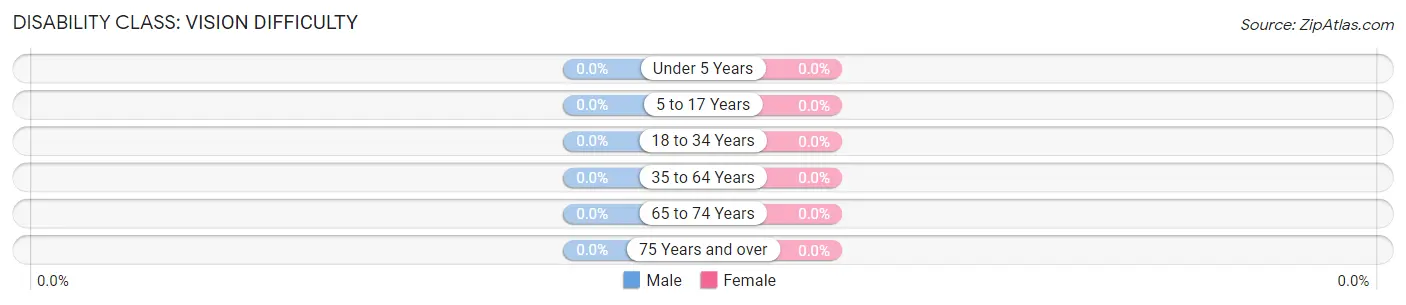
| Age Bracket | Male | Female |
| Under 5 Years | 0 (0.0%) | 0 (0.0%) |
| 5 to 17 Years | 0 (0.0%) | 0 (0.0%) |
| 18 to 34 Years | 0 (0.0%) | 0 (0.0%) |
| 35 to 64 Years | 0 (0.0%) | 0 (0.0%) |
| 65 to 74 Years | 0 (0.0%) | 0 (0.0%) |
| 75 Years and over | 0 (0.0%) | 0 (0.0%) |
Disability Class: Cognitive Difficulty
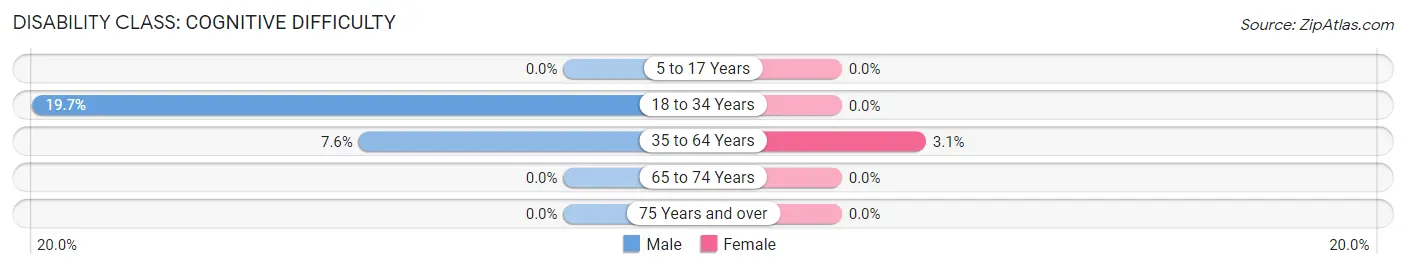
| Age Bracket | Male | Female |
| 5 to 17 Years | 0 (0.0%) | 0 (0.0%) |
| 18 to 34 Years | 52 (19.7%) | 0 (0.0%) |
| 35 to 64 Years | 13 (7.6%) | 10 (3.1%) |
| 65 to 74 Years | 0 (0.0%) | 0 (0.0%) |
| 75 Years and over | 0 (0.0%) | 0 (0.0%) |
Disability Class: Ambulatory Difficulty
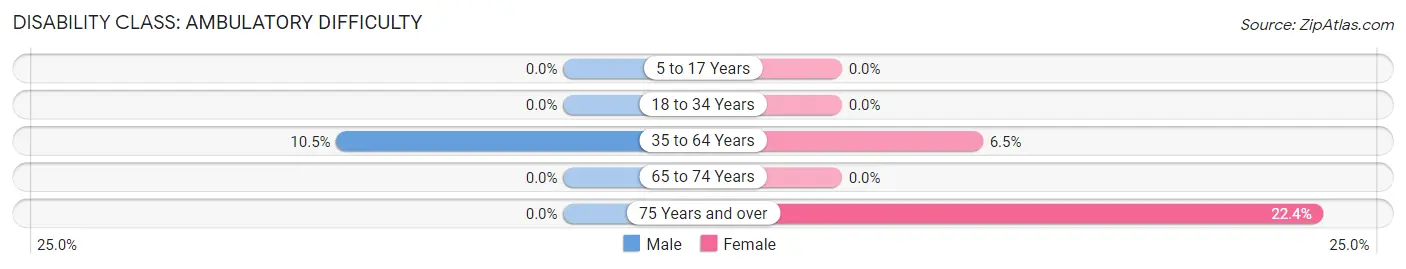
| Age Bracket | Male | Female |
| 5 to 17 Years | 0 (0.0%) | 0 (0.0%) |
| 18 to 34 Years | 0 (0.0%) | 0 (0.0%) |
| 35 to 64 Years | 18 (10.5%) | 21 (6.5%) |
| 65 to 74 Years | 0 (0.0%) | 0 (0.0%) |
| 75 Years and over | 0 (0.0%) | 19 (22.4%) |
Disability Class: Self-Care Difficulty
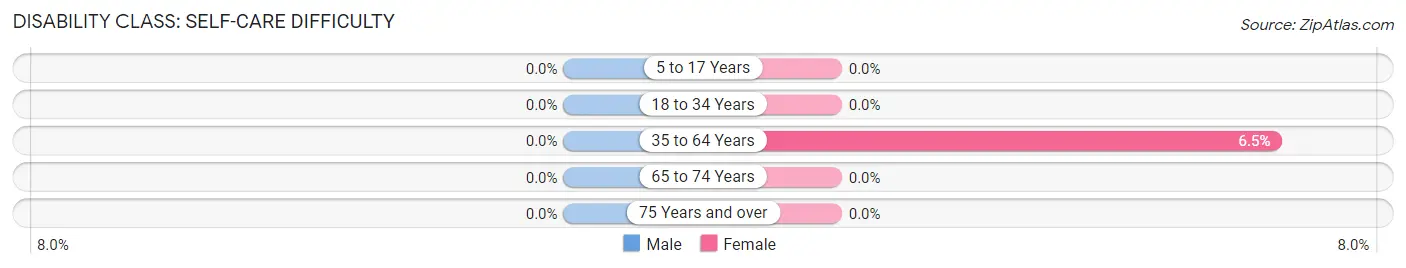
| Age Bracket | Male | Female |
| 5 to 17 Years | 0 (0.0%) | 0 (0.0%) |
| 18 to 34 Years | 0 (0.0%) | 0 (0.0%) |
| 35 to 64 Years | 0 (0.0%) | 21 (6.5%) |
| 65 to 74 Years | 0 (0.0%) | 0 (0.0%) |
| 75 Years and over | 0 (0.0%) | 0 (0.0%) |
Technology Access in Arnold Line
Computing Device Access in Arnold Line
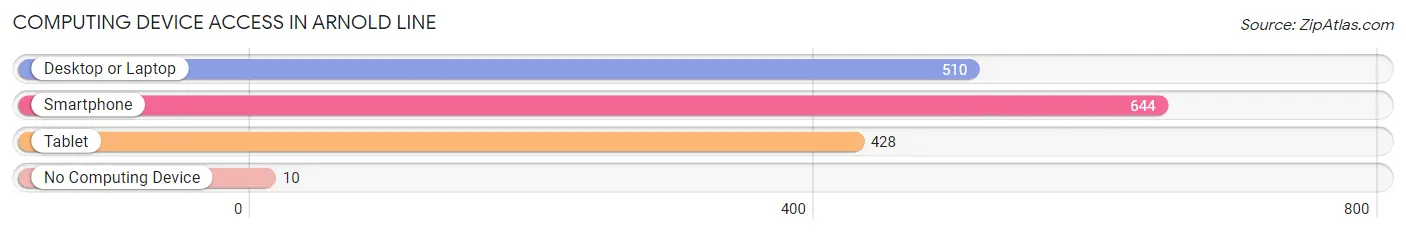
| Device Type | # Households | % Households |
| Desktop or Laptop | 510 | 73.1% |
| Smartphone | 644 | 92.3% |
| Tablet | 428 | 61.3% |
| No Computing Device | 10 | 1.4% |
| Total | 698 | 100.0% |
Internet Access in Arnold Line
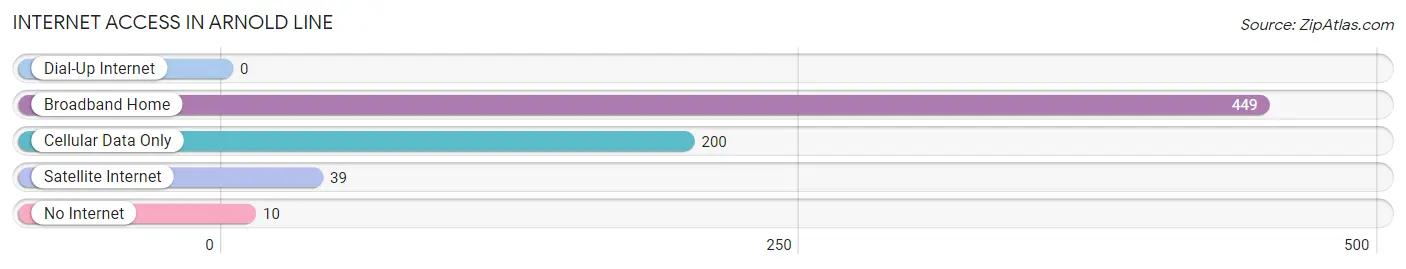
| Internet Type | # Households | % Households |
| Dial-Up Internet | 0 | 0.0% |
| Broadband Home | 449 | 64.3% |
| Cellular Data Only | 200 | 28.6% |
| Satellite Internet | 39 | 5.6% |
| No Internet | 10 | 1.4% |
| Total | 698 | 100.0% |
Arnold Line Summary
The Arnold Line is a historic boundary line that separates the states of Mississippi and Alabama. It was established in 1820 by the United States Congress as part of the Mississippi-Alabama boundary settlement. The line was named after Thomas Arnold, a surveyor who was hired to survey the area. The line runs from the Tennessee River in the north to the Gulf of Mexico in the south.
History
The Arnold Line was established in 1820 as part of the Mississippi-Alabama boundary settlement. The line was named after Thomas Arnold, a surveyor who was hired to survey the area. The line was established to settle a dispute between the two states over the boundary between them. The dispute had been ongoing since the early 1800s, when the two states were part of the Mississippi Territory. The dispute was finally settled in 1820 when the United States Congress passed the Mississippi-Alabama Boundary Act. The act established the Arnold Line as the boundary between the two states.
Geography
The Arnold Line runs from the Tennessee River in the north to the Gulf of Mexico in the south. The line is approximately 300 miles long and runs through several counties in both states. The line passes through the counties of Lauderdale, Colbert, Franklin, Marion, Lamar, and Jones in Mississippi, and the counties of Limestone, Madison, Jackson, and Mobile in Alabama. The line also passes through the cities of Florence, Muscle Shoals, and Mobile.
Economy
The Arnold Line has had a significant impact on the economy of both states. The line has served as a natural barrier between the two states, which has helped to create distinct economic regions. The northern part of Mississippi is more industrialized and has a more diverse economy than the southern part of the state. The southern part of the state is more rural and agricultural. The same is true for Alabama, with the northern part of the state being more industrialized and the southern part being more rural and agricultural.
The Arnold Line has also had an impact on the transportation infrastructure of both states. The line has served as a natural barrier between the two states, which has helped to create distinct transportation networks. The northern part of Mississippi is served by the Tennessee Valley Authority, which provides electricity and other services to the region. The southern part of the state is served by the Alabama Power Company, which provides electricity and other services to the region.
Demographics
The Arnold Line has had a significant impact on the demographics of both states. The line has served as a natural barrier between the two states, which has helped to create distinct demographic regions. The northern part of Mississippi is more diverse and has a larger population than the southern part of the state. The southern part of the state is more rural and has a smaller population. The same is true for Alabama, with the northern part of the state being more diverse and the southern part being more rural.
The Arnold Line has also had an impact on the racial demographics of both states. The line has served as a natural barrier between the two states, which has helped to create distinct racial regions. The northern part of Mississippi is more diverse and has a larger African American population than the southern part of the state. The southern part of the state is more rural and has a smaller African American population. The same is true for Alabama, with the northern part of the state being more diverse and the southern part being more rural.
Conclusion
The Arnold Line is an important boundary line that separates the states of Mississippi and Alabama. The line was established in 1820 as part of the Mississippi-Alabama boundary settlement and has had a significant impact on the history, geography, economy, and demographics of both states. The line has served as a natural barrier between the two states, which has helped to create distinct economic, demographic, and racial regions.
Common Questions
What is Per Capita Income in Arnold Line?
Per Capita income in Arnold Line is $29,937.
What is the Median Household income in Arnold Line?
Median Household Income in Arnold Line is $41,232.
What is Inequality or Gini Index in Arnold Line?
Inequality or Gini Index in Arnold Line is 0.52.
What is the Total Population of Arnold Line?
Total Population of Arnold Line is 1,789.
What is the Total Male Population of Arnold Line?
Total Male Population of Arnold Line is 817.
What is the Total Female Population of Arnold Line?
Total Female Population of Arnold Line is 972.
What is the Ratio of Males per 100 Females in Arnold Line?
There are 84.05 Males per 100 Females in Arnold Line.
What is the Ratio of Females per 100 Males in Arnold Line?
There are 118.97 Females per 100 Males in Arnold Line.
What is the Median Population Age in Arnold Line?
Median Population Age in Arnold Line is 32.9 Years.
What is the Average Family Size in Arnold Line
Average Family Size in Arnold Line is 2.7 People.
What is the Average Household Size in Arnold Line
Average Household Size in Arnold Line is 2.6 People.
How Large is the Labor Force in Arnold Line?
There are 678 People in the Labor Forcein in Arnold Line.
What is the Percentage of People in the Labor Force in Arnold Line?
45.0% of People are in the Labor Force in Arnold Line.
What is the Unemployment Rate in Arnold Line?
Unemployment Rate in Arnold Line is 5.6%.