Latimer, MS Map & Demographics
Latimer Map
Latimer Overview
$28,651
PER CAPITA INCOME
$56,671
AVG FAMILY INCOME
$60,567
AVG HOUSEHOLD INCOME
38.9%
WAGE / INCOME GAP [ % ]
61.1¢/ $1
WAGE / INCOME GAP [ $ ]
0.41
INEQUALITY / GINI INDEX
6,436
TOTAL POPULATION
3,509
MALE POPULATION
2,927
FEMALE POPULATION
119.88
MALES / 100 FEMALES
83.41
FEMALES / 100 MALES
38.0
MEDIAN AGE
3.0
AVG FAMILY SIZE
2.8
AVG HOUSEHOLD SIZE
3,363
LABOR FORCE [ PEOPLE ]
64.1%
PERCENT IN LABOR FORCE
8.0%
UNEMPLOYMENT RATE
Income in Latimer
Income Overview in Latimer
Per Capita Income in Latimer is $28,651, while median incomes of families and households are $56,671 and $60,567 respectively.
| Characteristic | Number | Measure |
| Per Capita Income | 6,436 | $28,651 |
| Median Family Income | 1,619 | $56,671 |
| Mean Family Income | 1,619 | $81,852 |
| Median Household Income | 2,284 | $60,567 |
| Mean Household Income | 2,284 | $76,338 |
| Income Deficit | 1,619 | $0 |
| Wage / Income Gap (%) | 6,436 | 38.92% |
| Wage / Income Gap ($) | 6,436 | 61.08¢ per $1 |
| Gini / Inequality Index | 6,436 | 0.41 |
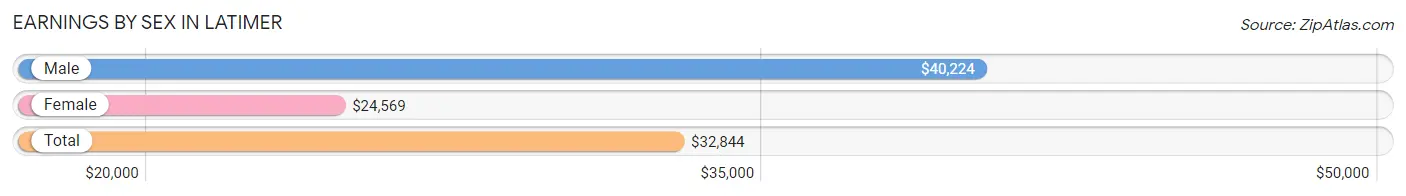
Earnings by Sex in Latimer
Average Earnings in Latimer are $32,844, $40,224 for men and $24,569 for women, a difference of 38.9%.
| Sex | Number | Average Earnings |
| Male | 1,894 (54.8%) | $40,224 |
| Female | 1,564 (45.2%) | $24,569 |
| Total | 3,458 (100.0%) | $32,844 |
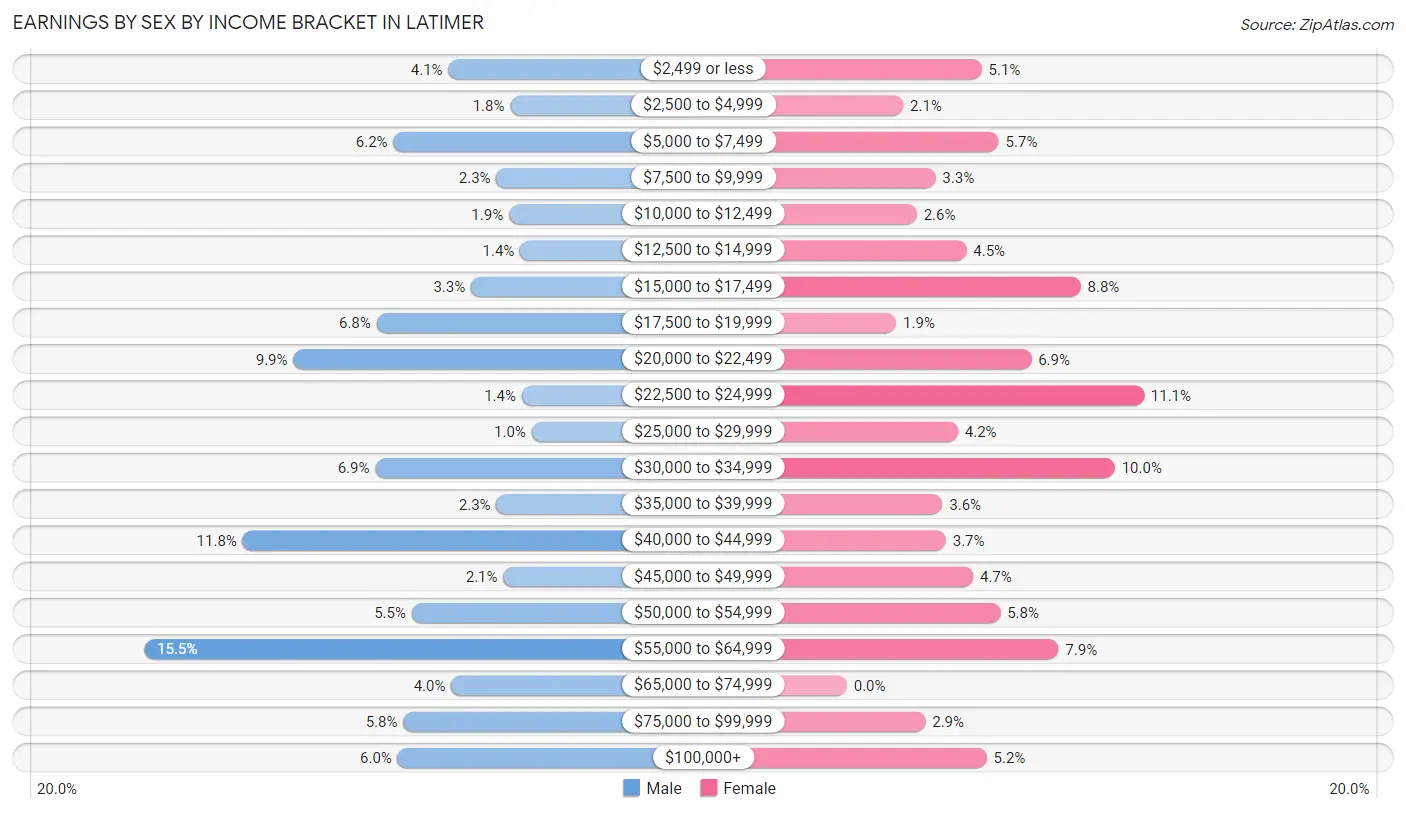
Earnings by Sex by Income Bracket in Latimer
The most common earnings brackets in Latimer are $55,000 to $64,999 for men (294 | 15.5%) and $22,500 to $24,999 for women (174 | 11.1%).
| Income | Male | Female |
| $2,499 or less | 78 (4.1%) | 79 (5.1%) |
| $2,500 to $4,999 | 34 (1.8%) | 33 (2.1%) |
| $5,000 to $7,499 | 117 (6.2%) | 89 (5.7%) |
| $7,500 to $9,999 | 44 (2.3%) | 52 (3.3%) |
| $10,000 to $12,499 | 35 (1.8%) | 41 (2.6%) |
| $12,500 to $14,999 | 27 (1.4%) | 70 (4.5%) |
| $15,000 to $17,499 | 62 (3.3%) | 137 (8.8%) |
| $17,500 to $19,999 | 129 (6.8%) | 29 (1.8%) |
| $20,000 to $22,499 | 188 (9.9%) | 108 (6.9%) |
| $22,500 to $24,999 | 26 (1.4%) | 174 (11.1%) |
| $25,000 to $29,999 | 19 (1.0%) | 65 (4.2%) |
| $30,000 to $34,999 | 130 (6.9%) | 157 (10.0%) |
| $35,000 to $39,999 | 44 (2.3%) | 56 (3.6%) |
| $40,000 to $44,999 | 224 (11.8%) | 58 (3.7%) |
| $45,000 to $49,999 | 39 (2.1%) | 74 (4.7%) |
| $50,000 to $54,999 | 104 (5.5%) | 90 (5.8%) |
| $55,000 to $64,999 | 294 (15.5%) | 124 (7.9%) |
| $65,000 to $74,999 | 76 (4.0%) | 0 (0.0%) |
| $75,000 to $99,999 | 110 (5.8%) | 46 (2.9%) |
| $100,000+ | 114 (6.0%) | 82 (5.2%) |
| Total | 1,894 (100.0%) | 1,564 (100.0%) |
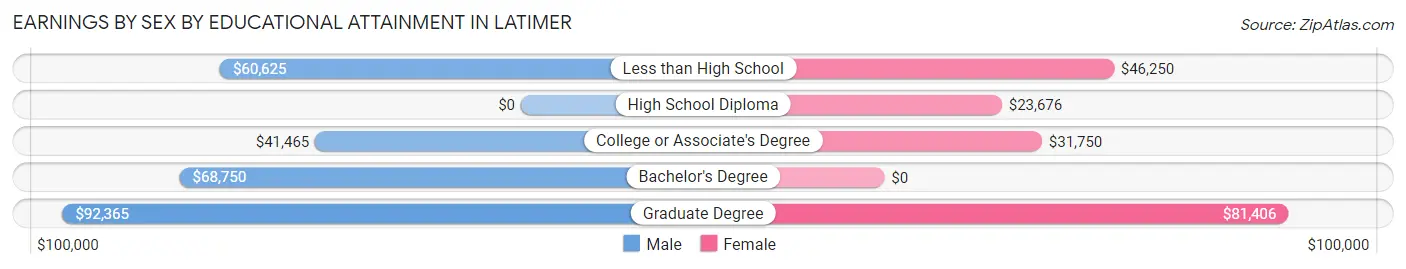
Earnings by Sex by Educational Attainment in Latimer
Average earnings in Latimer are $42,396 for men and $33,045 for women, a difference of 22.1%. Men with an educational attainment of graduate degree enjoy the highest average annual earnings of $92,365, while those with college or associate's degree education earn the least with $41,465. Women with an educational attainment of graduate degree earn the most with the average annual earnings of $81,406, while those with high school diploma education have the smallest earnings of $23,676.
| Educational Attainment | Male Income | Female Income |
| Less than High School | $60,625 | $46,250 |
| High School Diploma | - | - |
| College or Associate's Degree | $41,465 | $31,750 |
| Bachelor's Degree | $68,750 | $0 |
| Graduate Degree | $92,365 | $81,406 |
| Total | $42,396 | $33,045 |
Family Income in Latimer
Family Income Brackets in Latimer
According to the Latimer family income data, there are 316 families falling into the $35,000 to $49,999 income range, which is the most common income bracket and makes up 19.5% of all families. Conversely, the $10,000 to $14,999 income bracket is the least frequent group with only 42 families (2.6%) belonging to this category.
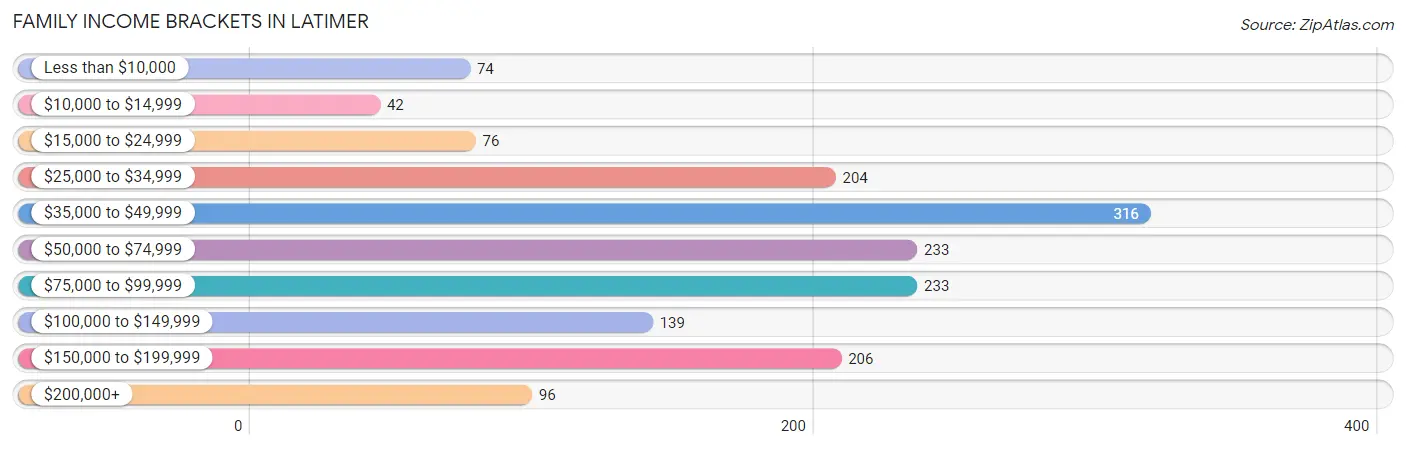
| Income Bracket | # Families | % Families |
| Less than $10,000 | 74 | 4.6% |
| $10,000 to $14,999 | 42 | 2.6% |
| $15,000 to $24,999 | 76 | 4.7% |
| $25,000 to $34,999 | 204 | 12.6% |
| $35,000 to $49,999 | 316 | 19.5% |
| $50,000 to $74,999 | 233 | 14.4% |
| $75,000 to $99,999 | 233 | 14.4% |
| $100,000 to $149,999 | 139 | 8.6% |
| $150,000 to $199,999 | 206 | 12.7% |
| $200,000+ | 96 | 5.9% |
Family Income by Famaliy Size in Latimer
5-person families (79 | 4.9%) account for the highest median family income in Latimer with $170,446 per family, while 5-person families (79 | 4.9%) have the highest median income of $34,089 per family member.
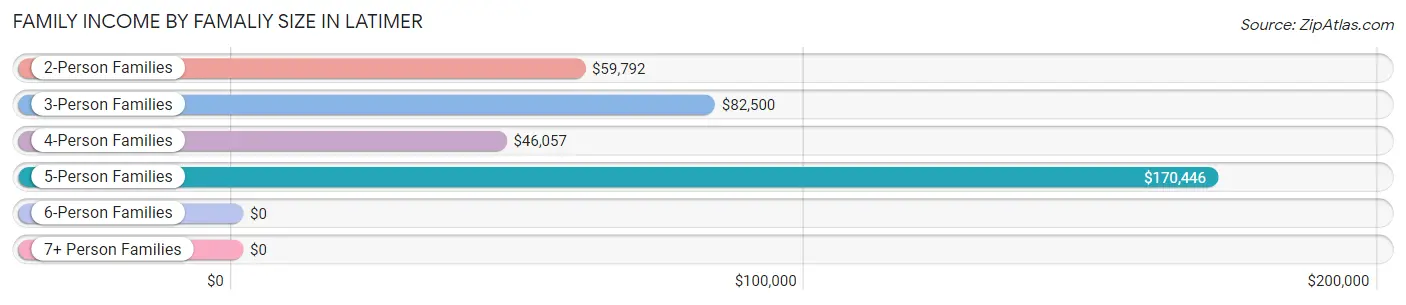
| Income Bracket | # Families | Median Income |
| 2-Person Families | 899 (55.5%) | $59,792 |
| 3-Person Families | 248 (15.3%) | $82,500 |
| 4-Person Families | 336 (20.7%) | $46,057 |
| 5-Person Families | 79 (4.9%) | $170,446 |
| 6-Person Families | 12 (0.7%) | $0 |
| 7+ Person Families | 45 (2.8%) | $0 |
| Total | 1,619 (100.0%) | $56,671 |
Family Income by Number of Earners in Latimer
The median family income in Latimer is $56,671, with families comprising 3+ earners (247) having the highest median family income of $107,321, while families with 1 earner (421) have the lowest median family income of $38,750, accounting for 15.3% and 26.0% of families, respectively.
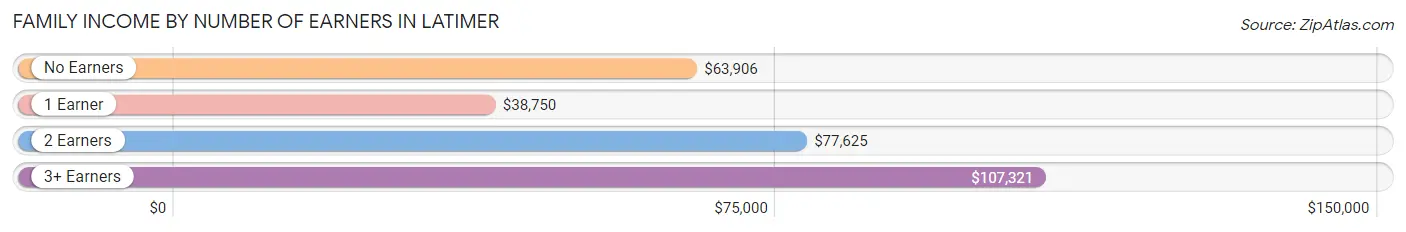
| Number of Earners | # Families | Median Income |
| No Earners | 267 (16.5%) | $63,906 |
| 1 Earner | 421 (26.0%) | $38,750 |
| 2 Earners | 684 (42.2%) | $77,625 |
| 3+ Earners | 247 (15.3%) | $107,321 |
| Total | 1,619 (100.0%) | $56,671 |
Household Income in Latimer
Household Income Brackets in Latimer
With 450 households falling in the category, the $50,000 to $74,999 income range is the most frequent in Latimer, accounting for 19.7% of all households. In contrast, only 75 households (3.3%) fall into the less than $10,000 income bracket, making it the least populous group.
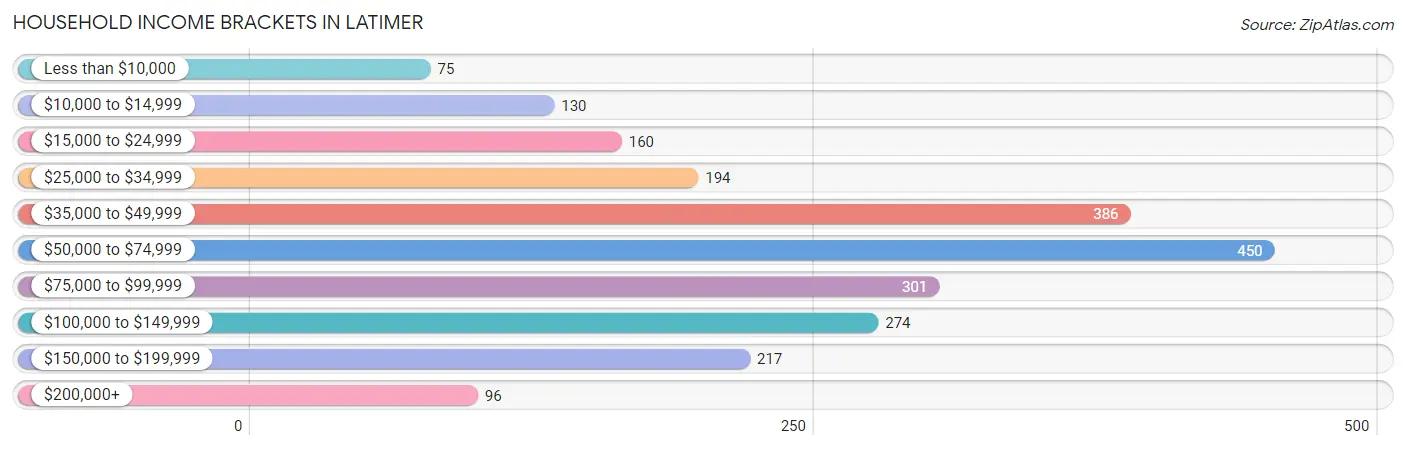
| Income Bracket | # Households | % Households |
| Less than $10,000 | 75 | 3.3% |
| $10,000 to $14,999 | 130 | 5.7% |
| $15,000 to $24,999 | 160 | 7.0% |
| $25,000 to $34,999 | 194 | 8.5% |
| $35,000 to $49,999 | 386 | 16.9% |
| $50,000 to $74,999 | 450 | 19.7% |
| $75,000 to $99,999 | 301 | 13.2% |
| $100,000 to $149,999 | 274 | 12.0% |
| $150,000 to $199,999 | 217 | 9.5% |
| $200,000+ | 96 | 4.2% |
Household Income by Householder Age in Latimer
The median household income in Latimer is $60,567, with the highest median household income of $68,083 found in the 45 to 64 years age bracket for the primary householder. A total of 959 households (42.0%) fall into this category. Meanwhile, the 15 to 24 years age bracket for the primary householder has the lowest median household income of $39,207, with 118 households (5.2%) in this group.
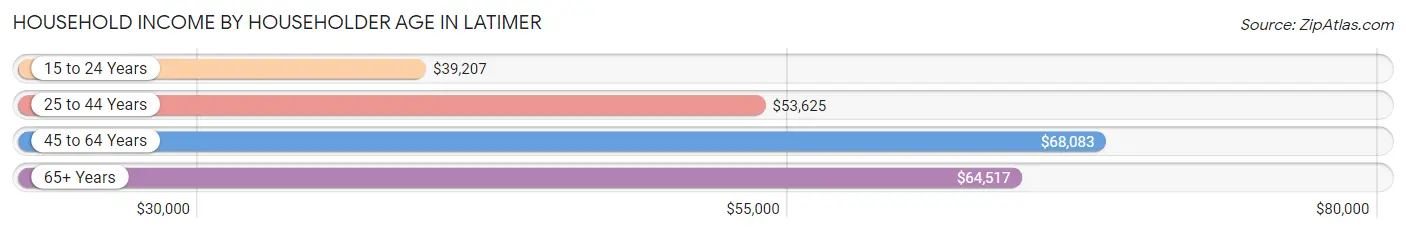
| Income Bracket | # Households | Median Income |
| 15 to 24 Years | 118 (5.2%) | $39,207 |
| 25 to 44 Years | 660 (28.9%) | $53,625 |
| 45 to 64 Years | 959 (42.0%) | $68,083 |
| 65+ Years | 547 (23.9%) | $64,517 |
| Total | 2,284 (100.0%) | $60,567 |
Poverty in Latimer
Income Below Poverty by Sex and Age in Latimer
With 18.6% poverty level for males and 24.6% for females among the residents of Latimer, under 5 year old males and under 5 year old females are the most vulnerable to poverty, with 177 males (68.9%) and 117 females (70.1%) in their respective age groups living below the poverty level.
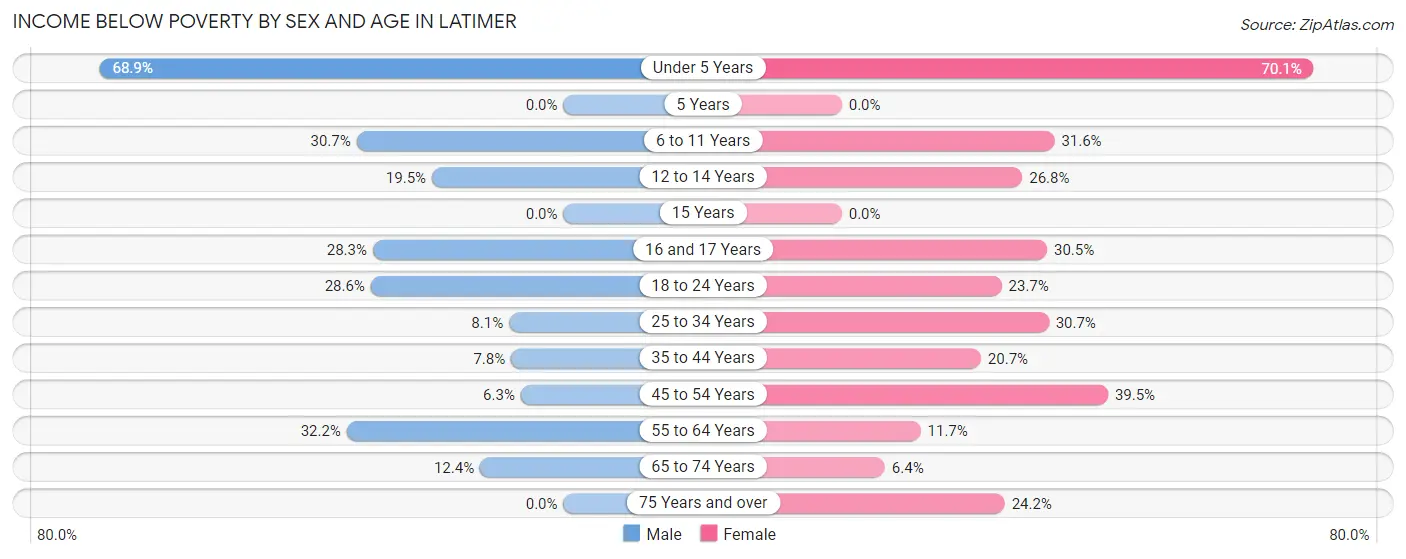
| Age Bracket | Male | Female |
| Under 5 Years | 177 (68.9%) | 117 (70.1%) |
| 5 Years | 0 (0.0%) | 0 (0.0%) |
| 6 to 11 Years | 39 (30.7%) | 18 (31.6%) |
| 12 to 14 Years | 49 (19.5%) | 41 (26.8%) |
| 15 Years | 0 (0.0%) | 0 (0.0%) |
| 16 and 17 Years | 15 (28.3%) | 57 (30.5%) |
| 18 to 24 Years | 109 (28.6%) | 75 (23.7%) |
| 25 to 34 Years | 26 (8.1%) | 102 (30.7%) |
| 35 to 44 Years | 40 (7.8%) | 94 (20.7%) |
| 45 to 54 Years | 24 (6.3%) | 115 (39.5%) |
| 55 to 64 Years | 111 (32.2%) | 66 (11.7%) |
| 65 to 74 Years | 64 (12.4%) | 19 (6.4%) |
| 75 Years and over | 0 (0.0%) | 15 (24.2%) |
| Total | 654 (18.6%) | 719 (24.6%) |
Income Above Poverty by Sex and Age in Latimer
According to the poverty statistics in Latimer, males aged 5 years and females aged 5 years are the age groups that are most secure financially, with 100.0% of males and 100.0% of females in these age groups living above the poverty line.
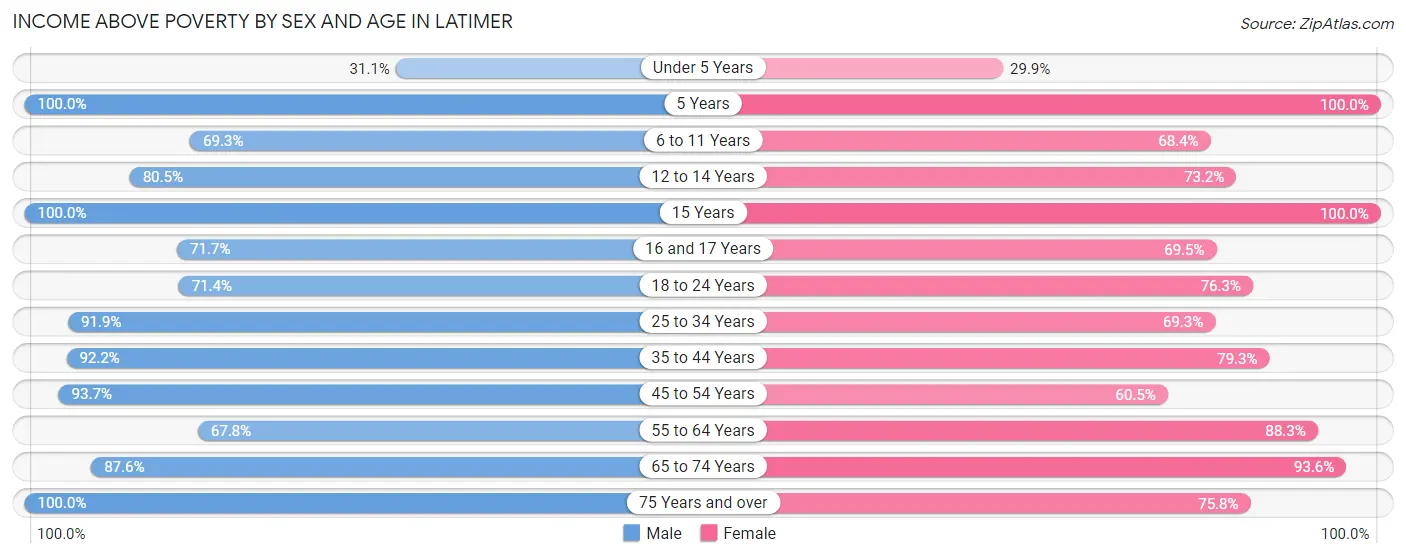
| Age Bracket | Male | Female |
| Under 5 Years | 80 (31.1%) | 50 (29.9%) |
| 5 Years | 10 (100.0%) | 18 (100.0%) |
| 6 to 11 Years | 88 (69.3%) | 39 (68.4%) |
| 12 to 14 Years | 202 (80.5%) | 112 (73.2%) |
| 15 Years | 121 (100.0%) | 28 (100.0%) |
| 16 and 17 Years | 38 (71.7%) | 130 (69.5%) |
| 18 to 24 Years | 272 (71.4%) | 241 (76.3%) |
| 25 to 34 Years | 296 (91.9%) | 230 (69.3%) |
| 35 to 44 Years | 475 (92.2%) | 361 (79.3%) |
| 45 to 54 Years | 355 (93.7%) | 176 (60.5%) |
| 55 to 64 Years | 234 (67.8%) | 498 (88.3%) |
| 65 to 74 Years | 453 (87.6%) | 278 (93.6%) |
| 75 Years and over | 231 (100.0%) | 47 (75.8%) |
| Total | 2,855 (81.4%) | 2,208 (75.4%) |
Income Below Poverty Among Married-Couple Families in Latimer
The poverty statistics for married-couple families in Latimer show that 9.0% or 93 of the total 1,035 families live below the poverty line. Families with 1 or 2 children have the highest poverty rate of 25.2%, comprising of 43 families. On the other hand, families with 3 or 4 children have the lowest poverty rate of 0.0%, which includes 0 families.
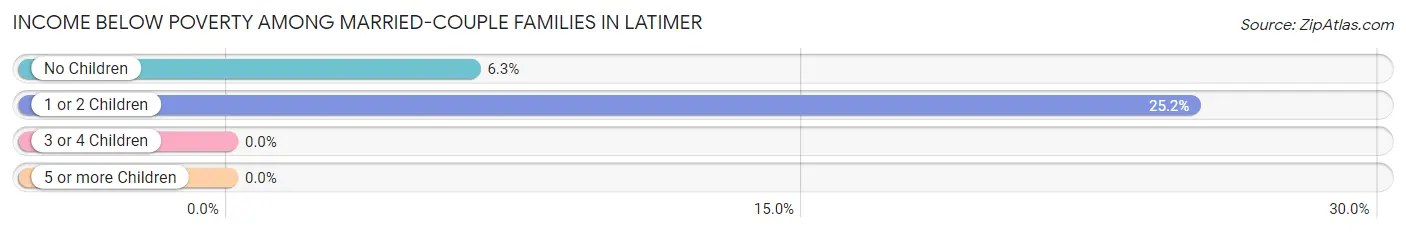
| Children | Above Poverty | Below Poverty |
| No Children | 740 (93.7%) | 50 (6.3%) |
| 1 or 2 Children | 128 (74.9%) | 43 (25.2%) |
| 3 or 4 Children | 74 (100.0%) | 0 (0.0%) |
| 5 or more Children | 0 (0.0%) | 0 (0.0%) |
| Total | 942 (91.0%) | 93 (9.0%) |
Income Below Poverty Among Single-Parent Households in Latimer
According to the poverty data in Latimer, 18.6% or 43 single-father households and 26.4% or 93 single-mother households are living below the poverty line. Among single-father households, those with no children have the highest poverty rate, with 31 households (52.5%) experiencing poverty. Likewise, among single-mother households, those with 5 or more children have the highest poverty rate, with 30 households (100.0%) falling below the poverty line.
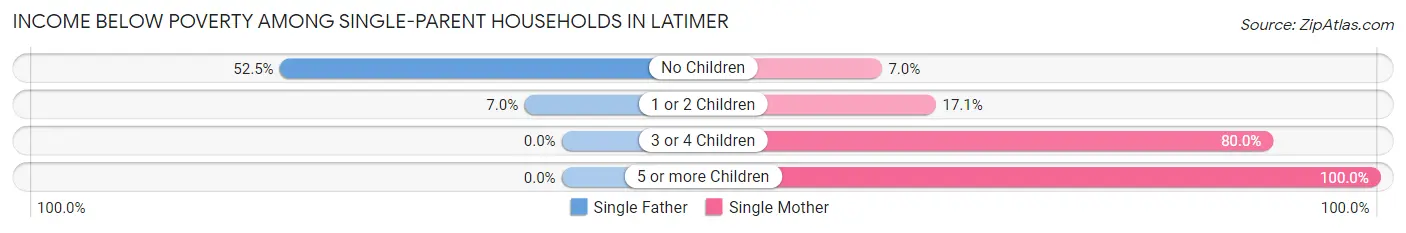
| Children | Single Father | Single Mother |
| No Children | 31 (52.5%) | 10 (7.0%) |
| 1 or 2 Children | 12 (7.0%) | 25 (17.1%) |
| 3 or 4 Children | 0 (0.0%) | 28 (80.0%) |
| 5 or more Children | 0 (0.0%) | 30 (100.0%) |
| Total | 43 (18.6%) | 93 (26.4%) |
Income Below Poverty Among Married-Couple vs Single-Parent Households in Latimer
The poverty data for Latimer shows that 93 of the married-couple family households (9.0%) and 136 of the single-parent households (23.3%) are living below the poverty level. Within the married-couple family households, those with 1 or 2 children have the highest poverty rate, with 43 households (25.2%) falling below the poverty line. Among the single-parent households, those with 5 or more children have the highest poverty rate, with 30 household (100.0%) living below poverty.
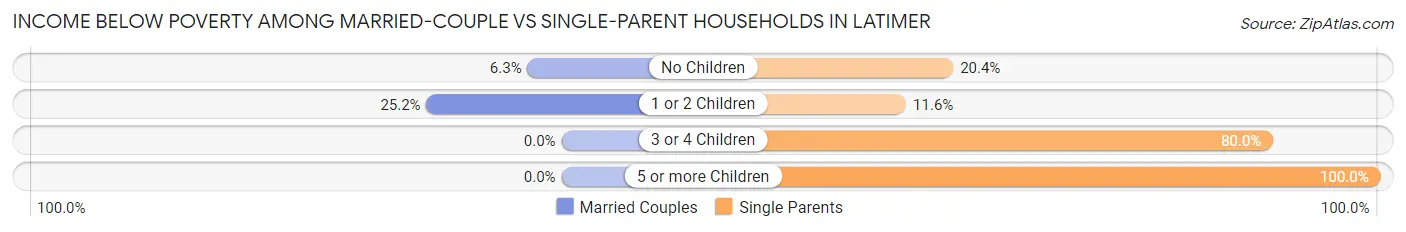
| Children | Married-Couple Families | Single-Parent Households |
| No Children | 50 (6.3%) | 41 (20.4%) |
| 1 or 2 Children | 43 (25.2%) | 37 (11.6%) |
| 3 or 4 Children | 0 (0.0%) | 28 (80.0%) |
| 5 or more Children | 0 (0.0%) | 30 (100.0%) |
| Total | 93 (9.0%) | 136 (23.3%) |
Race in Latimer
The most populous races in Latimer are White / Caucasian (4,713 | 73.2%), Two or more Races (696 | 10.8%), and Hispanic or Latino (528 | 8.2%).
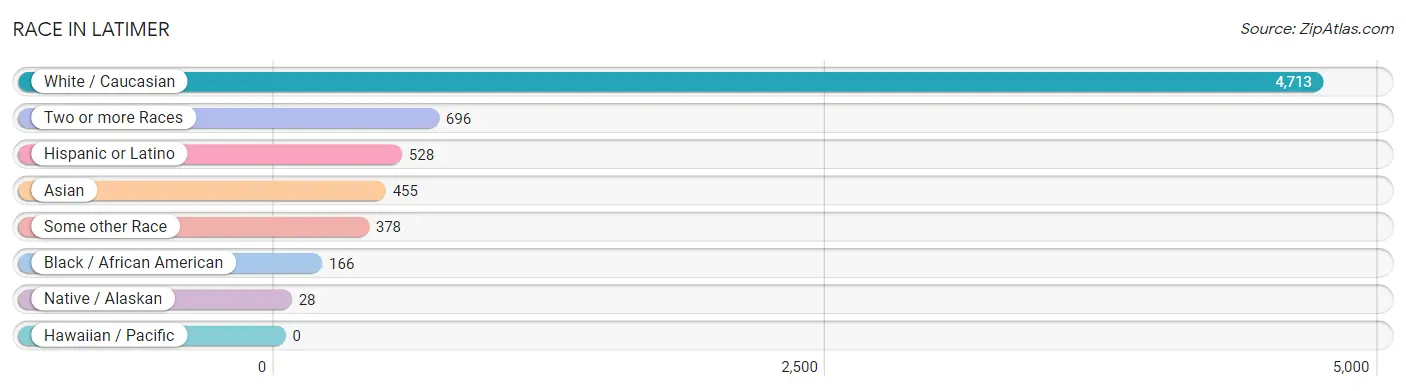
| Race | # Population | % Population |
| Asian | 455 | 7.1% |
| Black / African American | 166 | 2.6% |
| Hawaiian / Pacific | 0 | 0.0% |
| Hispanic or Latino | 528 | 8.2% |
| Native / Alaskan | 28 | 0.4% |
| White / Caucasian | 4,713 | 73.2% |
| Two or more Races | 696 | 10.8% |
| Some other Race | 378 | 5.9% |
| Total | 6,436 | 100.0% |
Ancestry in Latimer
The most populous ancestries reported in Latimer are American (963 | 15.0%), English (888 | 13.8%), German (634 | 9.9%), Irish (585 | 9.1%), and Puerto Rican (392 | 6.1%), together accounting for 53.8% of all Latimer residents.
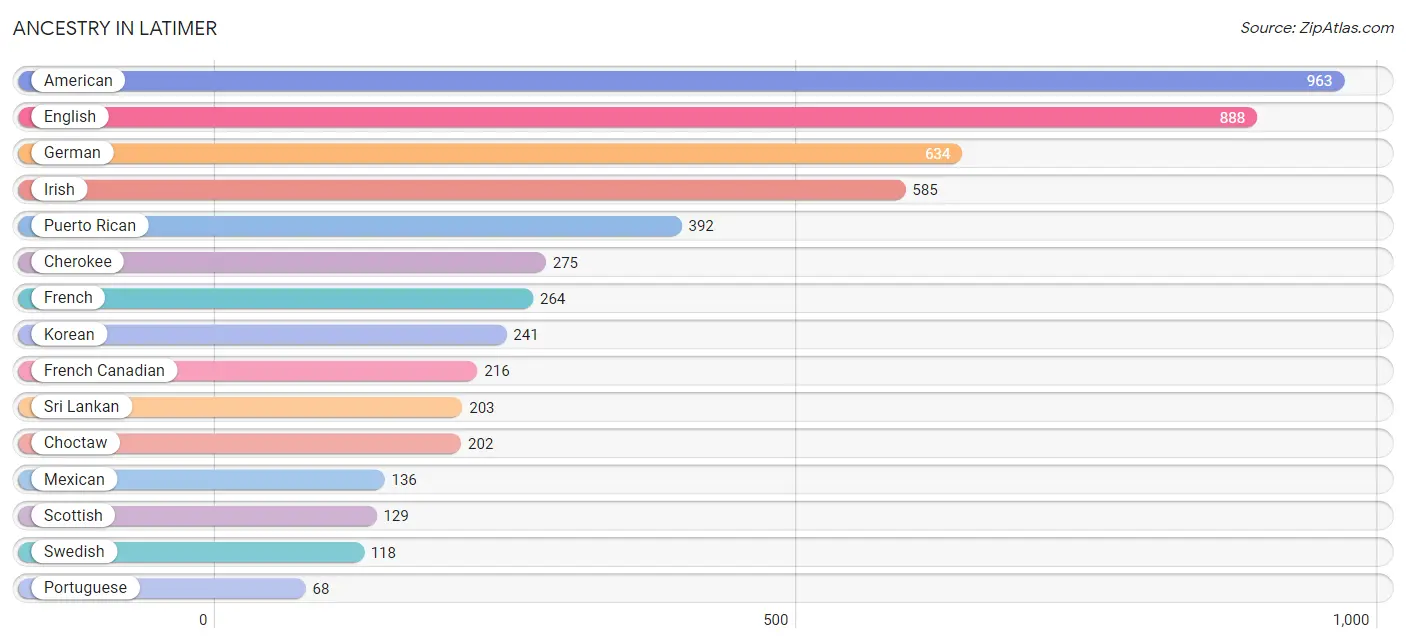
| Ancestry | # Population | % Population |
| American | 963 | 15.0% |
| British | 21 | 0.3% |
| Burmese | 30 | 0.5% |
| Cherokee | 275 | 4.3% |
| Choctaw | 202 | 3.1% |
| Danish | 20 | 0.3% |
| Dutch | 33 | 0.5% |
| Eastern European | 15 | 0.2% |
| English | 888 | 13.8% |
| French | 264 | 4.1% |
| French Canadian | 216 | 3.4% |
| German | 634 | 9.9% |
| Greek | 25 | 0.4% |
| Irish | 585 | 9.1% |
| Italian | 30 | 0.5% |
| Korean | 241 | 3.7% |
| Lithuanian | 29 | 0.4% |
| Mexican | 136 | 2.1% |
| Native Hawaiian | 28 | 0.4% |
| Norwegian | 48 | 0.7% |
| Pakistani | 9 | 0.1% |
| Polish | 21 | 0.3% |
| Portuguese | 68 | 1.1% |
| Puerto Rican | 392 | 6.1% |
| Scandinavian | 19 | 0.3% |
| Scottish | 129 | 2.0% |
| Sioux | 3 | 0.1% |
| Sri Lankan | 203 | 3.2% |
| Swedish | 118 | 1.8% |
| Thai | 36 | 0.6% |
| Yugoslavian | 22 | 0.3% | View All 31 Rows |
Immigrants in Latimer
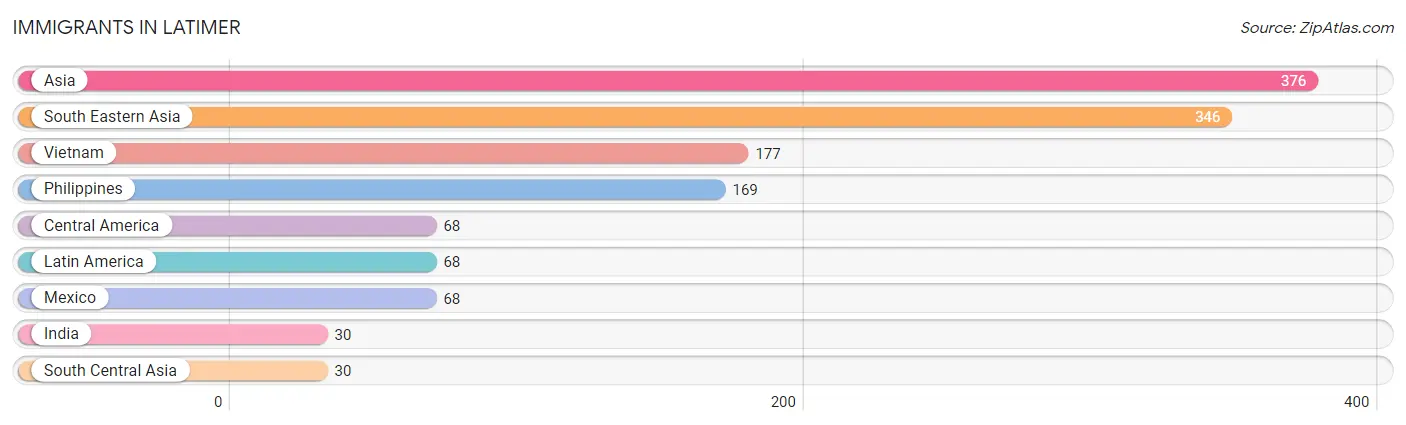
The most numerous immigrant groups reported in Latimer came from Asia (376 | 5.8%), South Eastern Asia (346 | 5.4%), Vietnam (177 | 2.8%), Philippines (169 | 2.6%), and Central America (68 | 1.1%), together accounting for 17.7% of all Latimer residents.
| Immigration Origin | # Population | % Population |
| Asia | 376 | 5.8% |
| Central America | 68 | 1.1% |
| India | 30 | 0.5% |
| Latin America | 68 | 1.1% |
| Mexico | 68 | 1.1% |
| Philippines | 169 | 2.6% |
| South Central Asia | 30 | 0.5% |
| South Eastern Asia | 346 | 5.4% |
| Vietnam | 177 | 2.8% | View All 9 Rows |
Sex and Age in Latimer
Sex and Age in Latimer
The most populous age groups in Latimer are 15 to 19 Years (325 | 9.3%) for men and 60 to 64 Years (340 | 11.6%) for women.
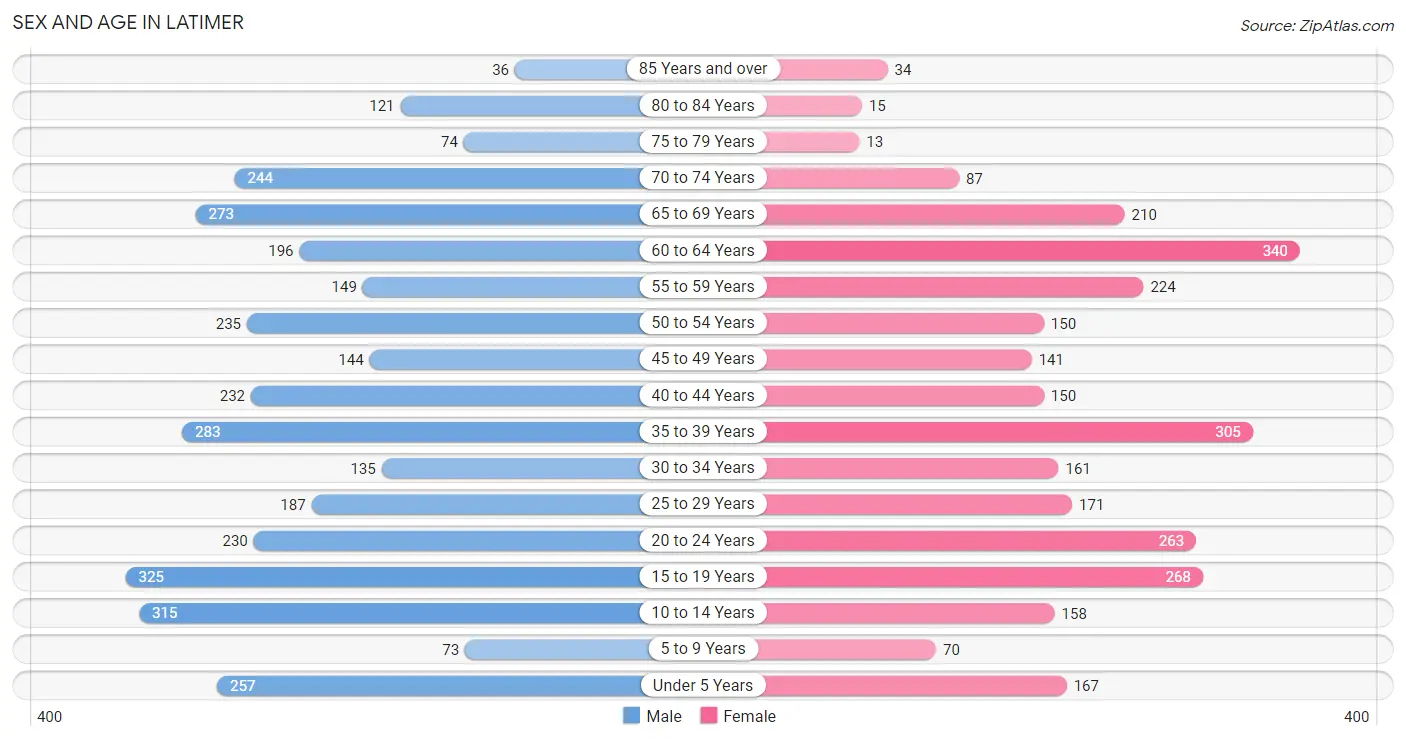
| Age Bracket | Male | Female |
| Under 5 Years | 257 (7.3%) | 167 (5.7%) |
| 5 to 9 Years | 73 (2.1%) | 70 (2.4%) |
| 10 to 14 Years | 315 (9.0%) | 158 (5.4%) |
| 15 to 19 Years | 325 (9.3%) | 268 (9.2%) |
| 20 to 24 Years | 230 (6.6%) | 263 (9.0%) |
| 25 to 29 Years | 187 (5.3%) | 171 (5.8%) |
| 30 to 34 Years | 135 (3.8%) | 161 (5.5%) |
| 35 to 39 Years | 283 (8.1%) | 305 (10.4%) |
| 40 to 44 Years | 232 (6.6%) | 150 (5.1%) |
| 45 to 49 Years | 144 (4.1%) | 141 (4.8%) |
| 50 to 54 Years | 235 (6.7%) | 150 (5.1%) |
| 55 to 59 Years | 149 (4.3%) | 224 (7.6%) |
| 60 to 64 Years | 196 (5.6%) | 340 (11.6%) |
| 65 to 69 Years | 273 (7.8%) | 210 (7.2%) |
| 70 to 74 Years | 244 (7.0%) | 87 (3.0%) |
| 75 to 79 Years | 74 (2.1%) | 13 (0.4%) |
| 80 to 84 Years | 121 (3.5%) | 15 (0.5%) |
| 85 Years and over | 36 (1.0%) | 34 (1.2%) |
| Total | 3,509 (100.0%) | 2,927 (100.0%) |
Families and Households in Latimer
Median Family Size in Latimer
The median family size in Latimer is 3.04 persons per family, with single female/mother families (353 | 21.8%) accounting for the largest median family size of 4.16 persons per family. On the other hand, single male/father families (231 | 14.3%) represent the smallest median family size with 2.64 persons per family.
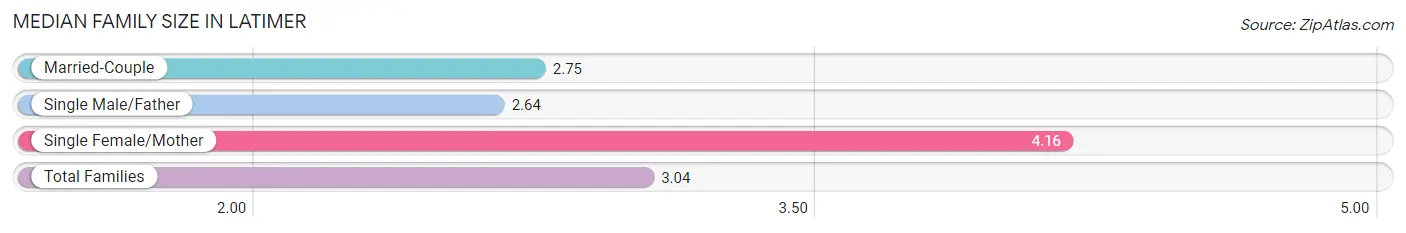
| Family Type | # Families | Family Size |
| Married-Couple | 1,035 (63.9%) | 2.75 |
| Single Male/Father | 231 (14.3%) | 2.64 |
| Single Female/Mother | 353 (21.8%) | 4.16 |
| Total Families | 1,619 (100.0%) | 3.04 |
Median Household Size in Latimer
The median household size in Latimer is 2.82 persons per household, with single female/mother households (353 | 15.5%) accounting for the largest median household size of 5.01 persons per household. non-family households (665 | 29.1%) represent the smallest median household size with 1.75 persons per household.
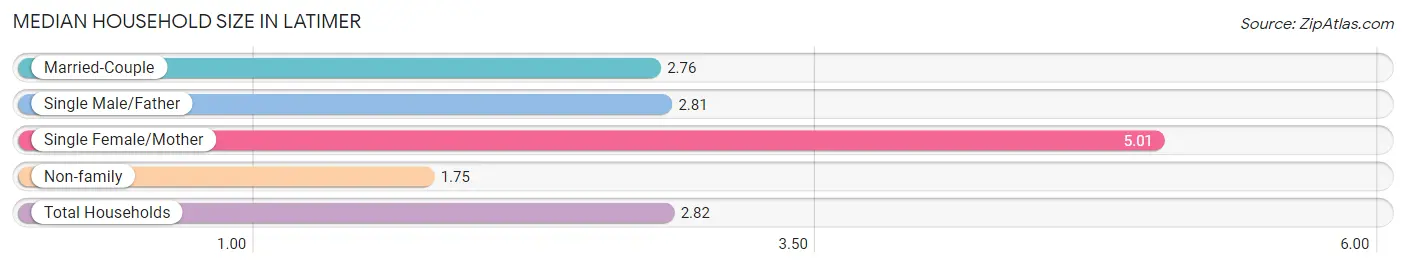
| Household Type | # Households | Household Size |
| Married-Couple | 1,035 (45.3%) | 2.76 |
| Single Male/Father | 231 (10.1%) | 2.81 |
| Single Female/Mother | 353 (15.5%) | 5.01 |
| Non-family | 665 (29.1%) | 1.75 |
| Total Households | 2,284 (100.0%) | 2.82 |
Household Size by Marriage Status in Latimer
Out of a total of 2,284 households in Latimer, 1,619 (70.9%) are family households, while 665 (29.1%) are nonfamily households. The most numerous type of family households are 2-person households, comprising 766, and the most common type of nonfamily households are 1-person households, comprising 423.
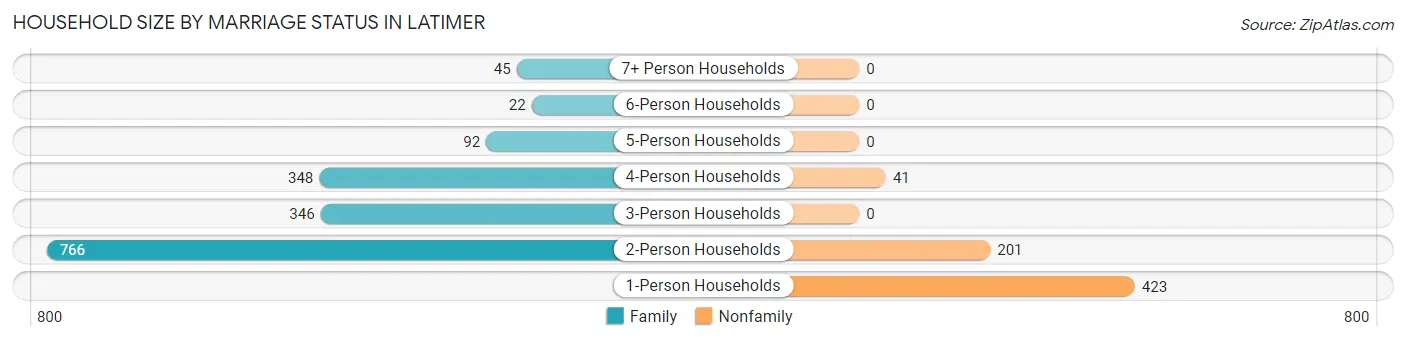
| Household Size | Family Households | Nonfamily Households |
| 1-Person Households | - | 423 (18.5%) |
| 2-Person Households | 766 (33.5%) | 201 (8.8%) |
| 3-Person Households | 346 (15.1%) | 0 (0.0%) |
| 4-Person Households | 348 (15.2%) | 41 (1.8%) |
| 5-Person Households | 92 (4.0%) | 0 (0.0%) |
| 6-Person Households | 22 (1.0%) | 0 (0.0%) |
| 7+ Person Households | 45 (2.0%) | 0 (0.0%) |
| Total | 1,619 (70.9%) | 665 (29.1%) |
Female Fertility in Latimer
Fertility by Age in Latimer
Average fertility rate in Latimer is 72.0 births per 1,000 women. Women in the age bracket of 15 to 19 years have the highest fertility rate with 104.0 births per 1,000 women. Women in the age bracket of 20 to 34 years acount for 42.4% of all women with births.
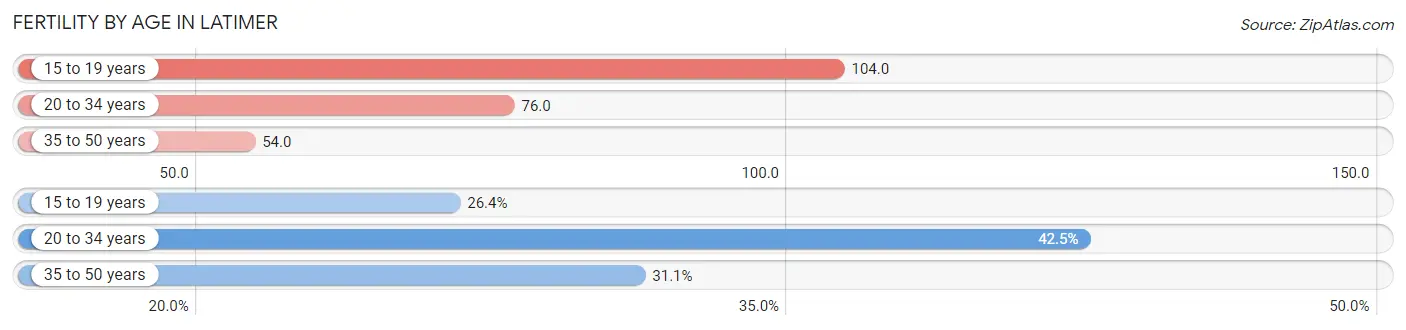
| Age Bracket | Women with Births | Births / 1,000 Women |
| 15 to 19 years | 28 (26.4%) | 104.0 |
| 20 to 34 years | 45 (42.4%) | 76.0 |
| 35 to 50 years | 33 (31.1%) | 54.0 |
| Total | 106 (100.0%) | 72.0 |
Fertility by Age by Marriage Status in Latimer
7.5% of women with births (106) in Latimer are married. The highest percentage of unmarried women with births falls into 15 to 19 years age bracket with 100.0% of them unmarried at the time of birth, while the lowest percentage of unmarried women with births belong to 35 to 50 years age bracket with 75.8% of them unmarried.
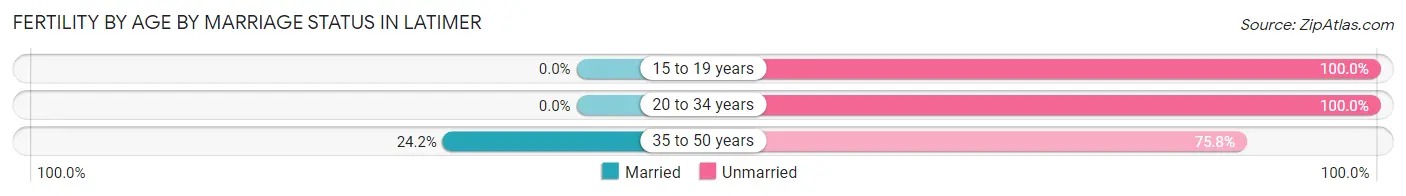
| Age Bracket | Married | Unmarried |
| 15 to 19 years | 0 (0.0%) | 28 (100.0%) |
| 20 to 34 years | 0 (0.0%) | 45 (100.0%) |
| 35 to 50 years | 8 (24.2%) | 25 (75.8%) |
| Total | 8 (7.5%) | 98 (92.4%) |
Fertility by Education in Latimer
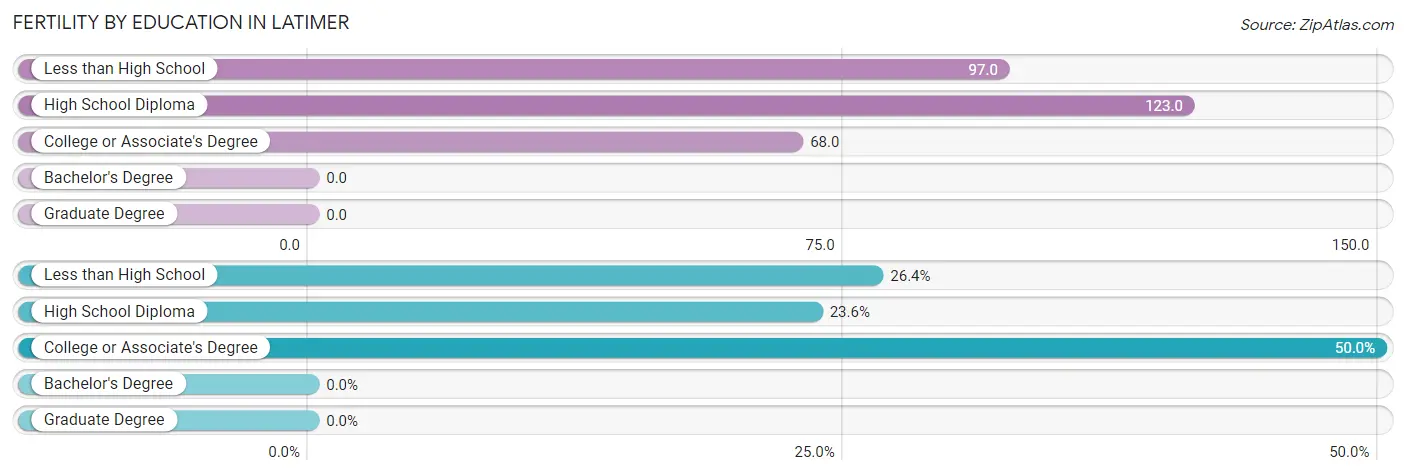
| Educational Attainment | Women with Births | Births / 1,000 Women |
| Less than High School | 28 (26.4%) | 97.0 |
| High School Diploma | 25 (23.6%) | 123.0 |
| College or Associate's Degree | 53 (50.0%) | 68.0 |
| Bachelor's Degree | 0 (0.0%) | 0.0 |
| Graduate Degree | 0 (0.0%) | 0.0 |
| Total | 106 (100.0%) | 72.0 |
Fertility by Education by Marriage Status in Latimer
92.4% of women with births in Latimer are unmarried. Women with the educational attainment of college or associate's degree are most likely to be married with 15.1% of them married at childbirth, while women with the educational attainment of less than high school are least likely to be married with 100.0% of them unmarried at childbirth.
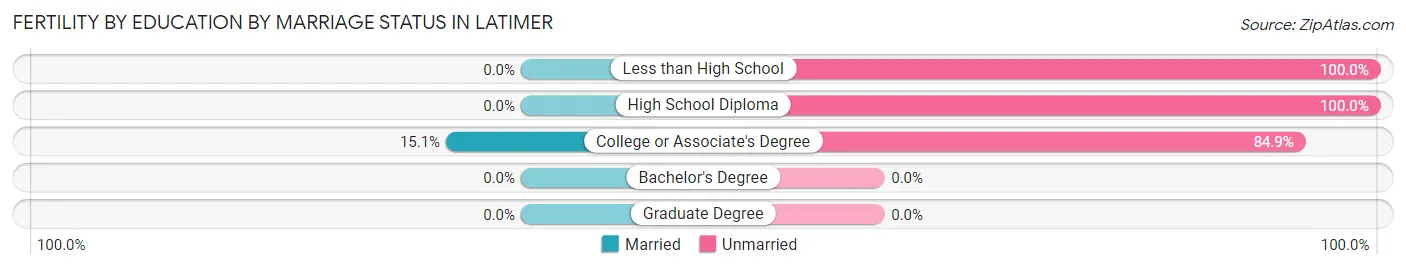
| Educational Attainment | Married | Unmarried |
| Less than High School | 0 (0.0%) | 28 (100.0%) |
| High School Diploma | 0 (0.0%) | 25 (100.0%) |
| College or Associate's Degree | 8 (15.1%) | 45 (84.9%) |
| Bachelor's Degree | 0 (0.0%) | 0 (0.0%) |
| Graduate Degree | 0 (0.0%) | 0 (0.0%) |
| Total | 8 (7.5%) | 98 (92.4%) |
Employment Characteristics in Latimer
Employment by Class of Employer in Latimer
Among the 3,090 employed individuals in Latimer, private company employees (1,863 | 60.3%), federal government employees (442 | 14.3%), and not-for-profit organizations (270 | 8.7%) make up the most common classes of employment.
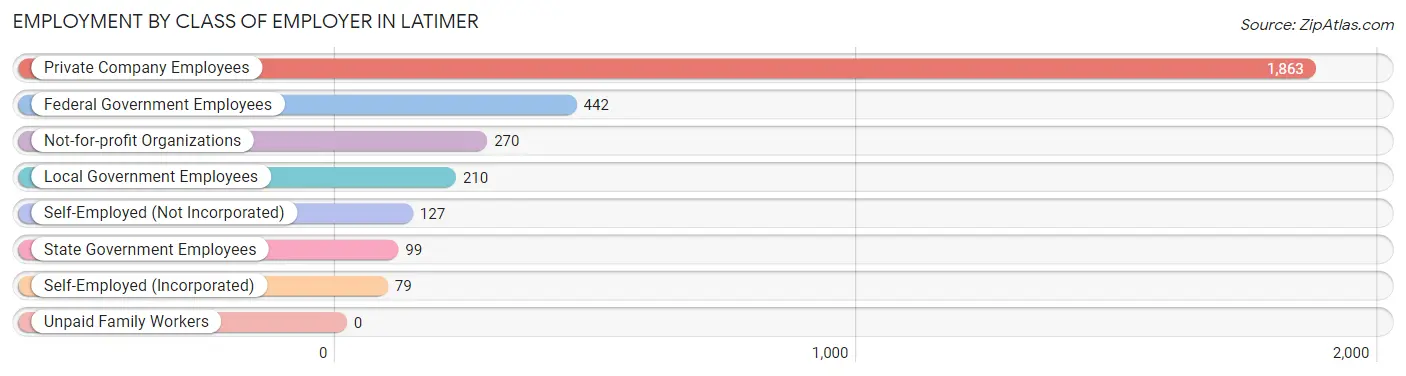
| Employer Class | # Employees | % Employees |
| Private Company Employees | 1,863 | 60.3% |
| Self-Employed (Incorporated) | 79 | 2.6% |
| Self-Employed (Not Incorporated) | 127 | 4.1% |
| Not-for-profit Organizations | 270 | 8.7% |
| Local Government Employees | 210 | 6.8% |
| State Government Employees | 99 | 3.2% |
| Federal Government Employees | 442 | 14.3% |
| Unpaid Family Workers | 0 | 0.0% |
| Total | 3,090 | 100.0% |
Employment Status by Age in Latimer
According to the labor force statistics for Latimer, out of the total population over 16 years of age (5,247), 64.1% or 3,363 individuals are in the labor force, with 8.0% or 269 of them unemployed. The age group with the highest labor force participation rate is 30 to 34 years, with 91.2% or 270 individuals in the labor force. Within the labor force, the 16 to 19 years age range has the highest percentage of unemployed individuals, with 39.4% or 100 of them being unemployed.
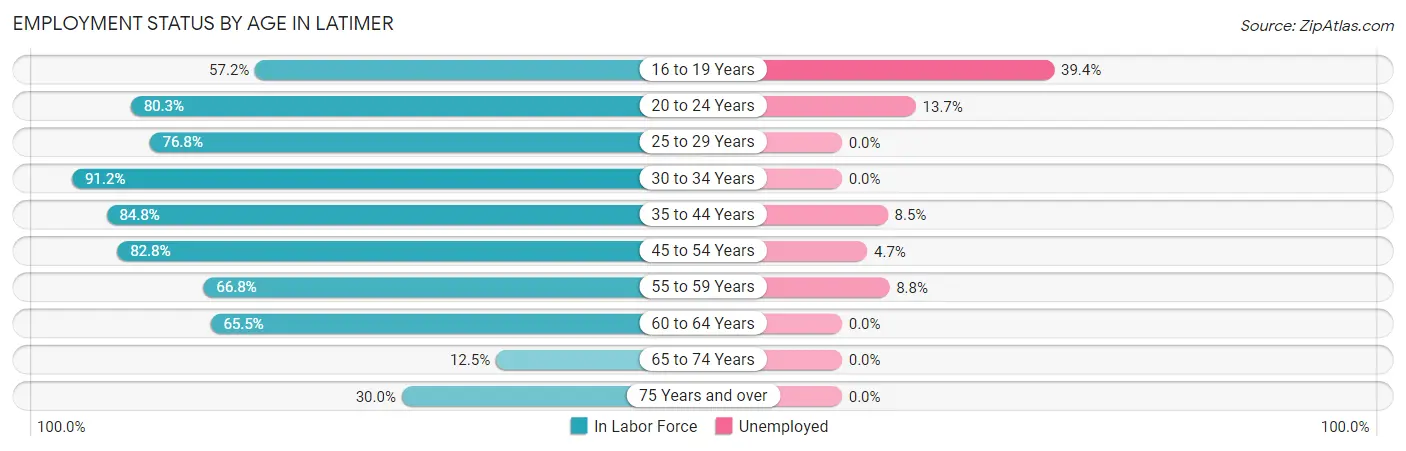
| Age Bracket | In Labor Force | Unemployed |
| 16 to 19 Years | 254 (57.2%) | 100 (39.4%) |
| 20 to 24 Years | 396 (80.3%) | 54 (13.7%) |
| 25 to 29 Years | 275 (76.8%) | 0 (0.0%) |
| 30 to 34 Years | 270 (91.2%) | 0 (0.0%) |
| 35 to 44 Years | 823 (84.8%) | 70 (8.5%) |
| 45 to 54 Years | 555 (82.8%) | 26 (4.7%) |
| 55 to 59 Years | 249 (66.8%) | 22 (8.8%) |
| 60 to 64 Years | 351 (65.5%) | 0 (0.0%) |
| 65 to 74 Years | 102 (12.5%) | 0 (0.0%) |
| 75 Years and over | 88 (30.0%) | 0 (0.0%) |
| Total | 3,363 (64.1%) | 269 (8.0%) |
Employment Status by Educational Attainment in Latimer
According to labor force statistics for Latimer, 78.8% of individuals (2,524) out of the total population between 25 and 64 years of age (3,203) are in the labor force, with 4.6% or 116 of them being unemployed. The group with the highest labor force participation rate are those with the educational attainment of bachelor's degree or higher, with 82.8% or 391 individuals in the labor force. Within the labor force, individuals with less than high school education have the highest percentage of unemployment, with 10.1% or 16 of them being unemployed.
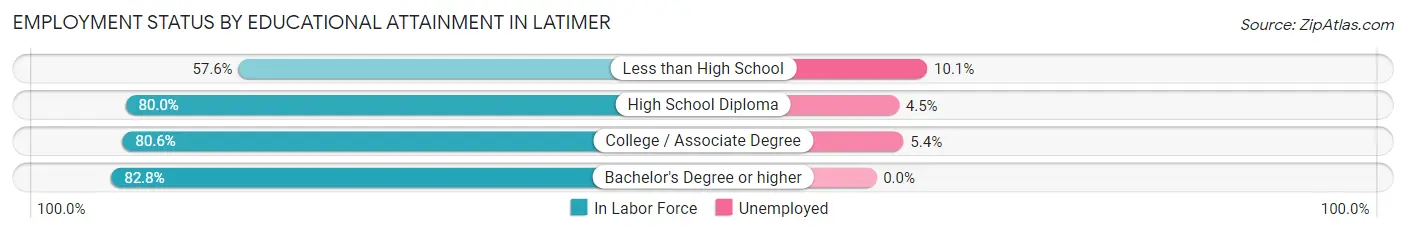
| Educational Attainment | In Labor Force | Unemployed |
| Less than High School | 159 (57.6%) | 28 (10.1%) |
| High School Diploma | 740 (80.0%) | 42 (4.5%) |
| College / Associate Degree | 1,233 (80.6%) | 83 (5.4%) |
| Bachelor's Degree or higher | 391 (82.8%) | 0 (0.0%) |
| Total | 2,524 (78.8%) | 147 (4.6%) |
Employment Occupations by Sex in Latimer
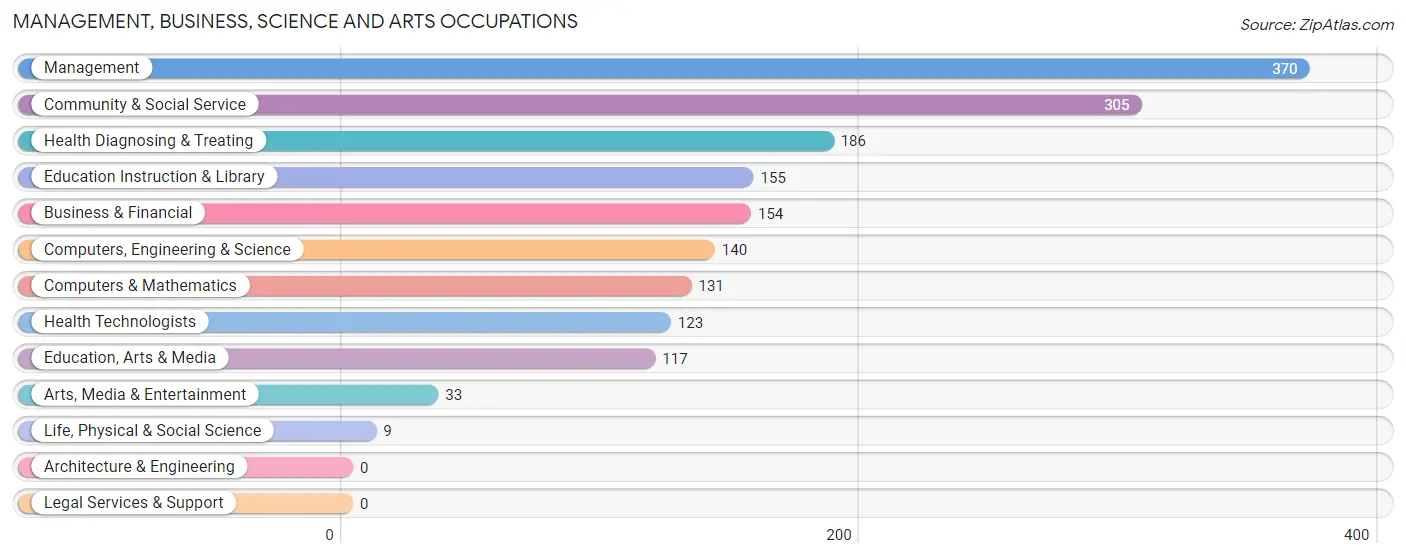
Management, Business, Science and Arts Occupations
The most common Management, Business, Science and Arts occupations in Latimer are Management (370 | 12.3%), Community & Social Service (305 | 10.2%), Health Diagnosing & Treating (186 | 6.2%), Education Instruction & Library (155 | 5.2%), and Business & Financial (154 | 5.1%).
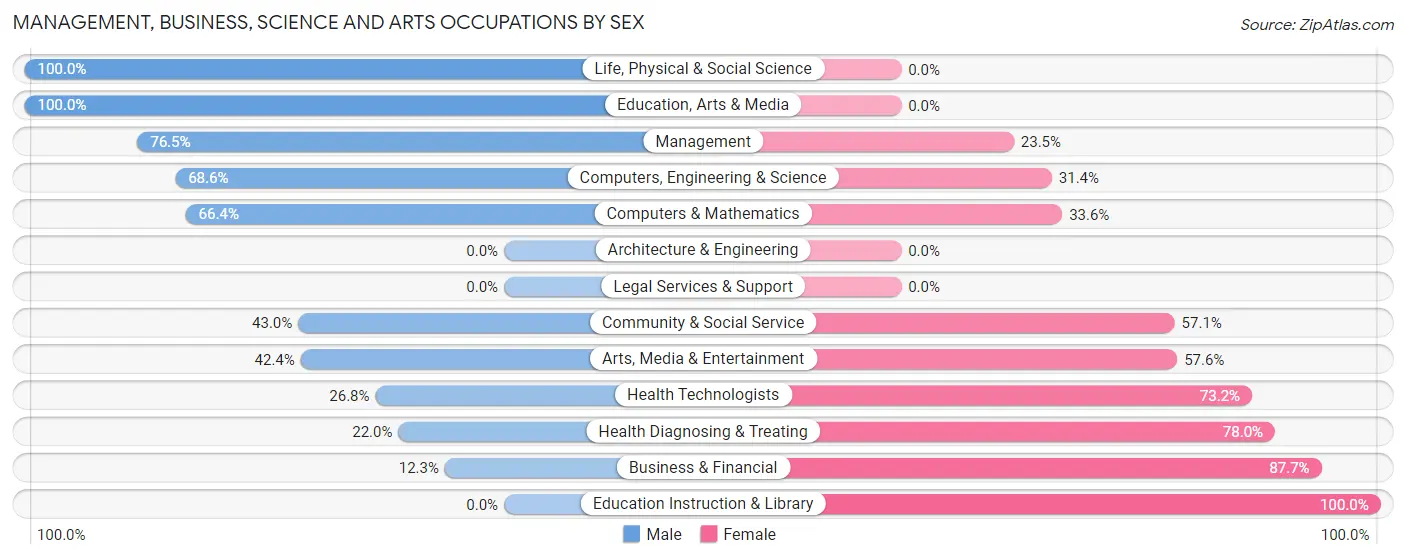
Management, Business, Science and Arts Occupations by Sex
Within the Management, Business, Science and Arts occupations in Latimer, the most male-oriented occupations are Life, Physical & Social Science (100.0%), Education, Arts & Media (100.0%), and Management (76.5%), while the most female-oriented occupations are Education Instruction & Library (100.0%), Business & Financial (87.7%), and Health Diagnosing & Treating (78.0%).
| Occupation | Male | Female |
| Management | 283 (76.5%) | 87 (23.5%) |
| Business & Financial | 19 (12.3%) | 135 (87.7%) |
| Computers, Engineering & Science | 96 (68.6%) | 44 (31.4%) |
| Computers & Mathematics | 87 (66.4%) | 44 (33.6%) |
| Architecture & Engineering | 0 (0.0%) | 0 (0.0%) |
| Life, Physical & Social Science | 9 (100.0%) | 0 (0.0%) |
| Community & Social Service | 131 (42.9%) | 174 (57.1%) |
| Education, Arts & Media | 117 (100.0%) | 0 (0.0%) |
| Legal Services & Support | 0 (0.0%) | 0 (0.0%) |
| Education Instruction & Library | 0 (0.0%) | 155 (100.0%) |
| Arts, Media & Entertainment | 14 (42.4%) | 19 (57.6%) |
| Health Diagnosing & Treating | 41 (22.0%) | 145 (78.0%) |
| Health Technologists | 33 (26.8%) | 90 (73.2%) |
| Total (Category) | 570 (49.3%) | 585 (50.6%) |
| Total (Overall) | 1,646 (54.8%) | 1,359 (45.2%) |
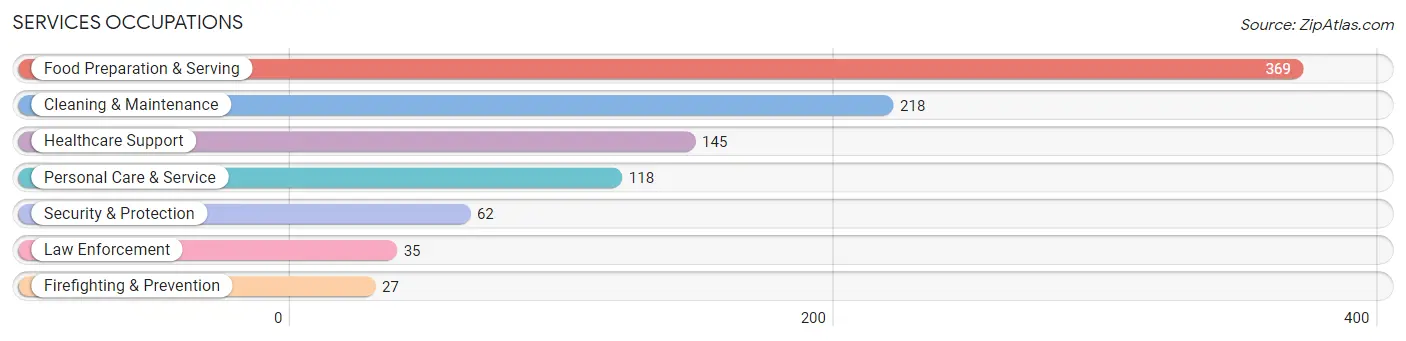
Services Occupations
The most common Services occupations in Latimer are Food Preparation & Serving (369 | 12.3%), Cleaning & Maintenance (218 | 7.2%), Healthcare Support (145 | 4.8%), Personal Care & Service (118 | 3.9%), and Security & Protection (62 | 2.1%).
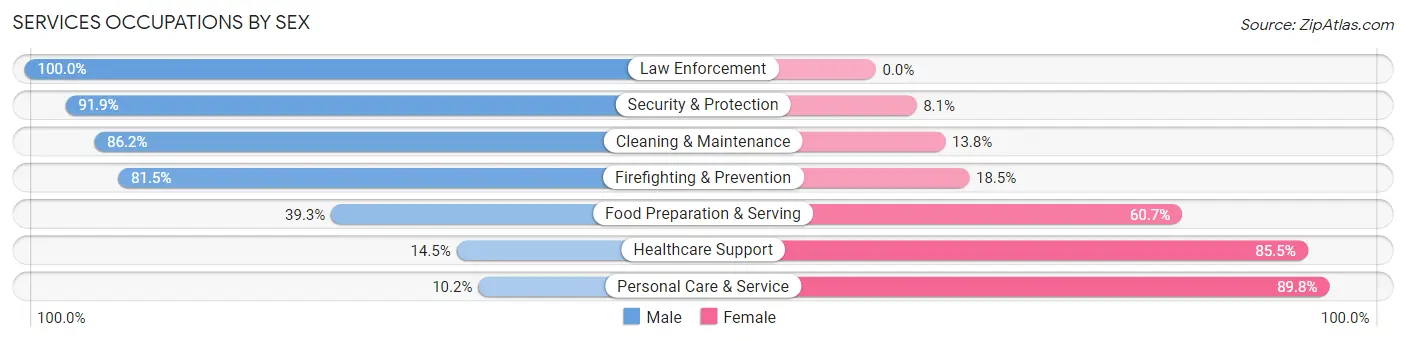
Services Occupations by Sex
Within the Services occupations in Latimer, the most male-oriented occupations are Law Enforcement (100.0%), Security & Protection (91.9%), and Cleaning & Maintenance (86.2%), while the most female-oriented occupations are Personal Care & Service (89.8%), Healthcare Support (85.5%), and Food Preparation & Serving (60.7%).
| Occupation | Male | Female |
| Healthcare Support | 21 (14.5%) | 124 (85.5%) |
| Security & Protection | 57 (91.9%) | 5 (8.1%) |
| Firefighting & Prevention | 22 (81.5%) | 5 (18.5%) |
| Law Enforcement | 35 (100.0%) | 0 (0.0%) |
| Food Preparation & Serving | 145 (39.3%) | 224 (60.7%) |
| Cleaning & Maintenance | 188 (86.2%) | 30 (13.8%) |
| Personal Care & Service | 12 (10.2%) | 106 (89.8%) |
| Total (Category) | 423 (46.4%) | 489 (53.6%) |
| Total (Overall) | 1,646 (54.8%) | 1,359 (45.2%) |
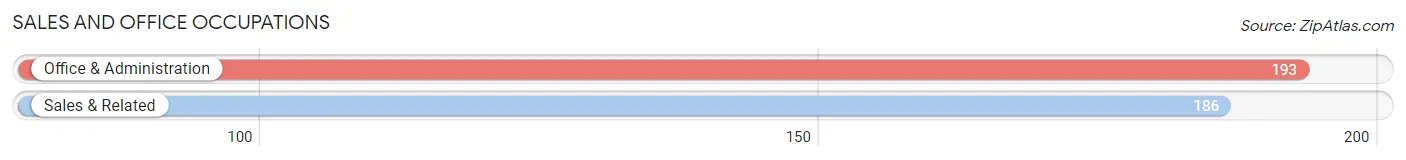
Sales and Office Occupations
The most common Sales and Office occupations in Latimer are Office & Administration (193 | 6.4%), and Sales & Related (186 | 6.2%).
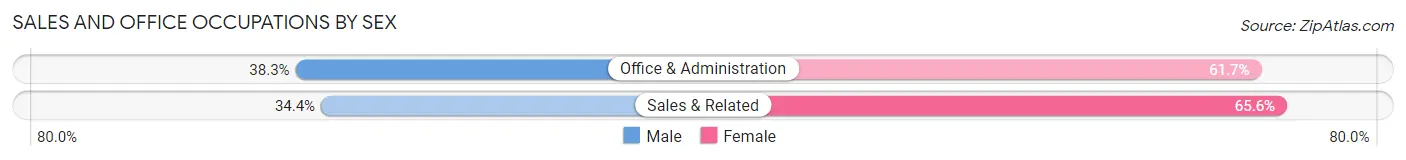
Sales and Office Occupations by Sex
| Occupation | Male | Female |
| Sales & Related | 64 (34.4%) | 122 (65.6%) |
| Office & Administration | 74 (38.3%) | 119 (61.7%) |
| Total (Category) | 138 (36.4%) | 241 (63.6%) |
| Total (Overall) | 1,646 (54.8%) | 1,359 (45.2%) |
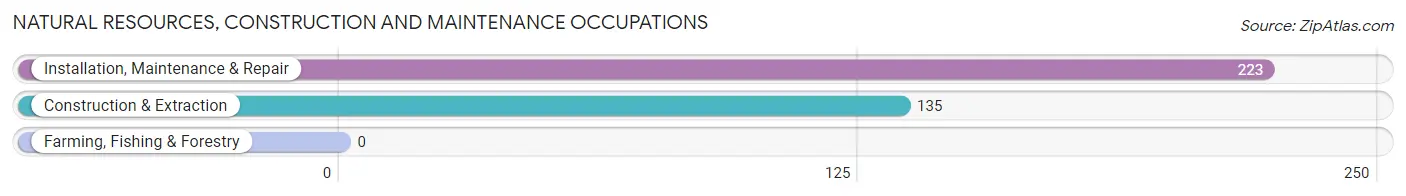
Natural Resources, Construction and Maintenance Occupations
The most common Natural Resources, Construction and Maintenance occupations in Latimer are Installation, Maintenance & Repair (223 | 7.4%), and Construction & Extraction (135 | 4.5%).
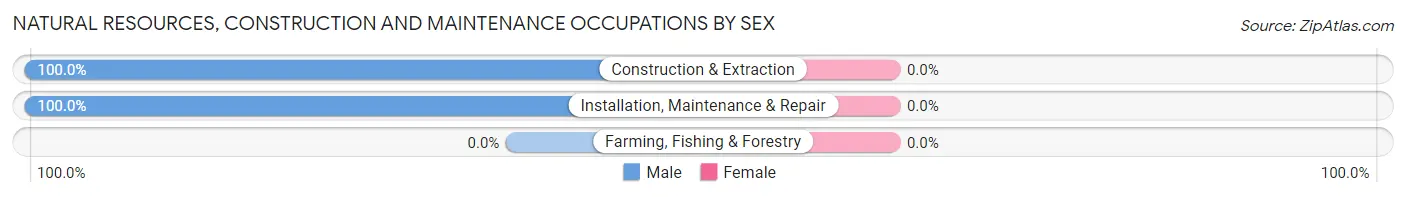
Natural Resources, Construction and Maintenance Occupations by Sex
| Occupation | Male | Female |
| Farming, Fishing & Forestry | 0 (0.0%) | 0 (0.0%) |
| Construction & Extraction | 135 (100.0%) | 0 (0.0%) |
| Installation, Maintenance & Repair | 223 (100.0%) | 0 (0.0%) |
| Total (Category) | 358 (100.0%) | 0 (0.0%) |
| Total (Overall) | 1,646 (54.8%) | 1,359 (45.2%) |
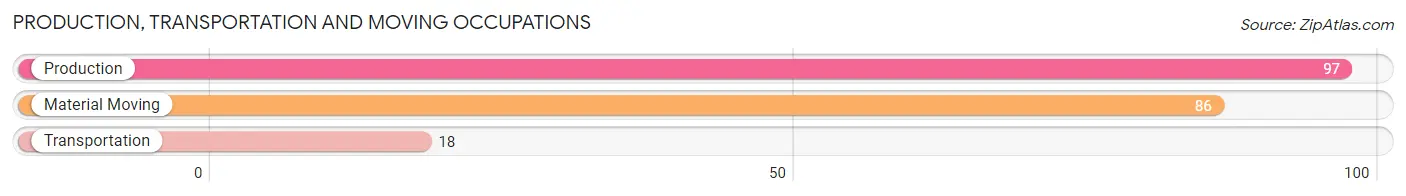
Production, Transportation and Moving Occupations
The most common Production, Transportation and Moving occupations in Latimer are Production (97 | 3.2%), Material Moving (86 | 2.9%), and Transportation (18 | 0.6%).
Production, Transportation and Moving Occupations by Sex
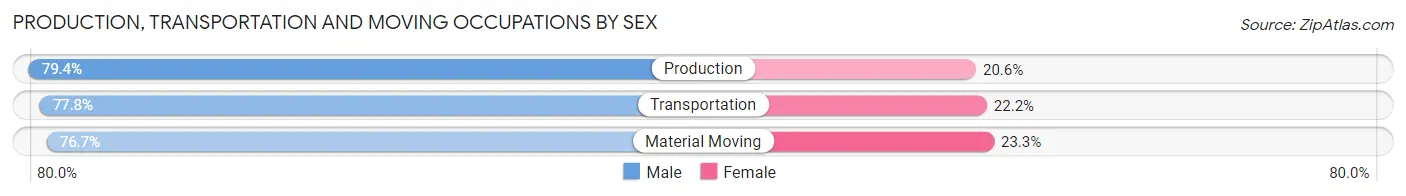
| Occupation | Male | Female |
| Production | 77 (79.4%) | 20 (20.6%) |
| Transportation | 14 (77.8%) | 4 (22.2%) |
| Material Moving | 66 (76.7%) | 20 (23.3%) |
| Total (Category) | 157 (78.1%) | 44 (21.9%) |
| Total (Overall) | 1,646 (54.8%) | 1,359 (45.2%) |
Employment Industries by Sex in Latimer
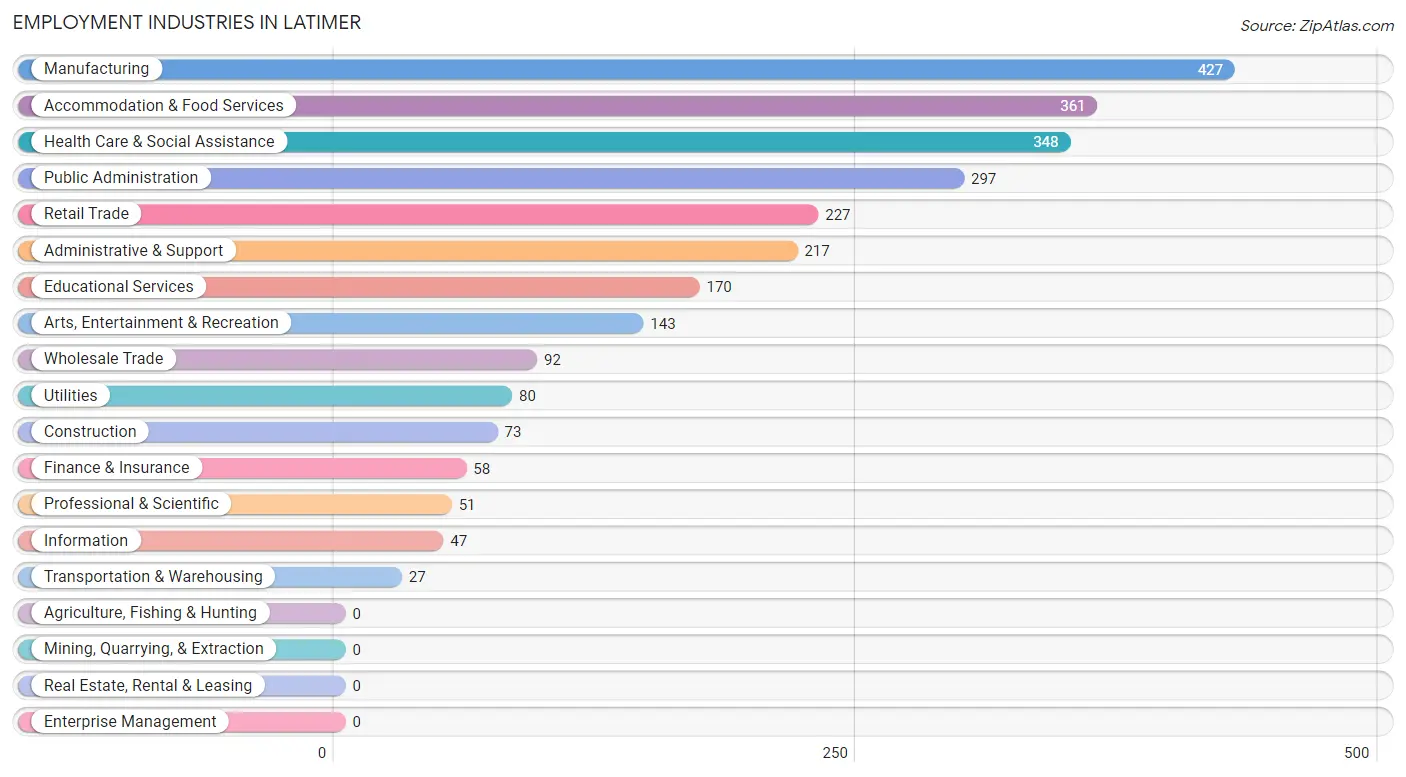
Employment Industries in Latimer
The major employment industries in Latimer include Manufacturing (427 | 14.2%), Accommodation & Food Services (361 | 12.0%), Health Care & Social Assistance (348 | 11.6%), Public Administration (297 | 9.9%), and Retail Trade (227 | 7.5%).
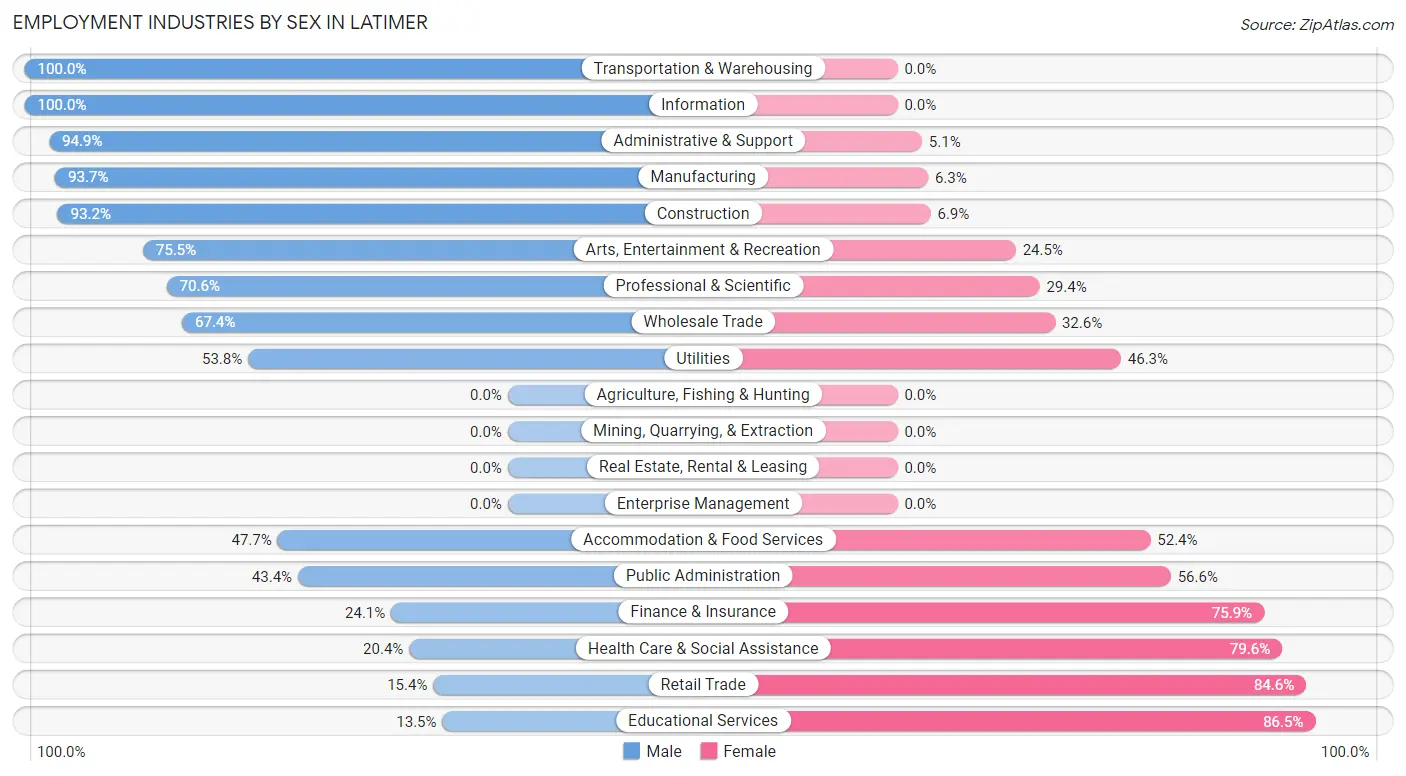
Employment Industries by Sex in Latimer
The Latimer industries that see more men than women are Transportation & Warehousing (100.0%), Information (100.0%), and Administrative & Support (94.9%), whereas the industries that tend to have a higher number of women are Educational Services (86.5%), Retail Trade (84.6%), and Health Care & Social Assistance (79.6%).
| Industry | Male | Female |
| Agriculture, Fishing & Hunting | 0 (0.0%) | 0 (0.0%) |
| Mining, Quarrying, & Extraction | 0 (0.0%) | 0 (0.0%) |
| Construction | 68 (93.1%) | 5 (6.9%) |
| Manufacturing | 400 (93.7%) | 27 (6.3%) |
| Wholesale Trade | 62 (67.4%) | 30 (32.6%) |
| Retail Trade | 35 (15.4%) | 192 (84.6%) |
| Transportation & Warehousing | 27 (100.0%) | 0 (0.0%) |
| Utilities | 43 (53.7%) | 37 (46.3%) |
| Information | 47 (100.0%) | 0 (0.0%) |
| Finance & Insurance | 14 (24.1%) | 44 (75.9%) |
| Real Estate, Rental & Leasing | 0 (0.0%) | 0 (0.0%) |
| Professional & Scientific | 36 (70.6%) | 15 (29.4%) |
| Enterprise Management | 0 (0.0%) | 0 (0.0%) |
| Administrative & Support | 206 (94.9%) | 11 (5.1%) |
| Educational Services | 23 (13.5%) | 147 (86.5%) |
| Health Care & Social Assistance | 71 (20.4%) | 277 (79.6%) |
| Arts, Entertainment & Recreation | 108 (75.5%) | 35 (24.5%) |
| Accommodation & Food Services | 172 (47.6%) | 189 (52.3%) |
| Public Administration | 129 (43.4%) | 168 (56.6%) |
| Total | 1,646 (54.8%) | 1,359 (45.2%) |
Education in Latimer
School Enrollment in Latimer
The most common levels of schooling among the 1,548 students in Latimer are college / undergraduate (459 | 29.6%), high school (434 | 28.0%), and middle school (383 | 24.7%).
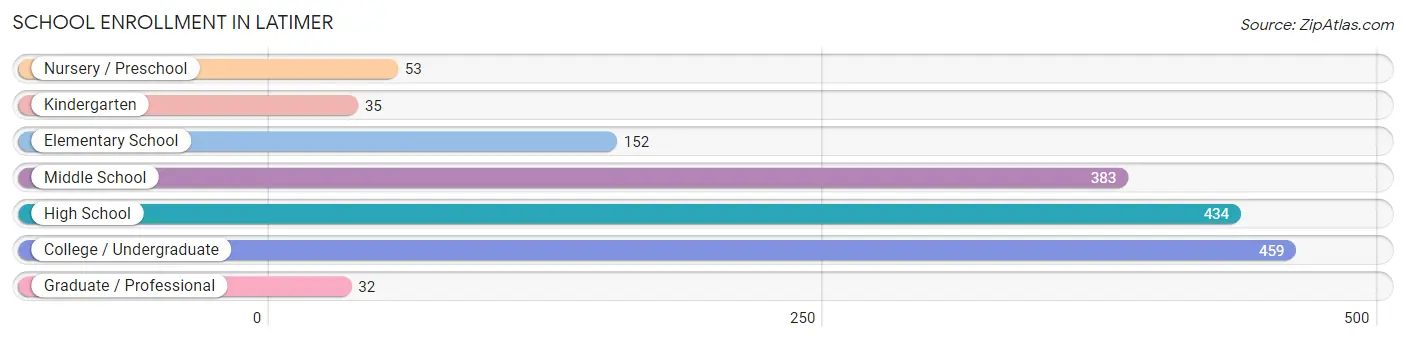
| School Level | # Students | % Students |
| Nursery / Preschool | 53 | 3.4% |
| Kindergarten | 35 | 2.3% |
| Elementary School | 152 | 9.8% |
| Middle School | 383 | 24.7% |
| High School | 434 | 28.0% |
| College / Undergraduate | 459 | 29.6% |
| Graduate / Professional | 32 | 2.1% |
| Total | 1,548 | 100.0% |
School Enrollment by Age by Funding Source in Latimer
Out of a total of 1,548 students who are enrolled in schools in Latimer, 88 (5.7%) attend a private institution, while the remaining 1,460 (94.3%) are enrolled in public schools. The age group of 5 to 9 year old has the highest likelihood of being enrolled in private schools, with 27 (18.9% in the age bracket) enrolled. Conversely, the age group of 18 to 19 year olds has the lowest likelihood of being enrolled in a private school, with 90 (100.0% in the age bracket) attending a public institution.
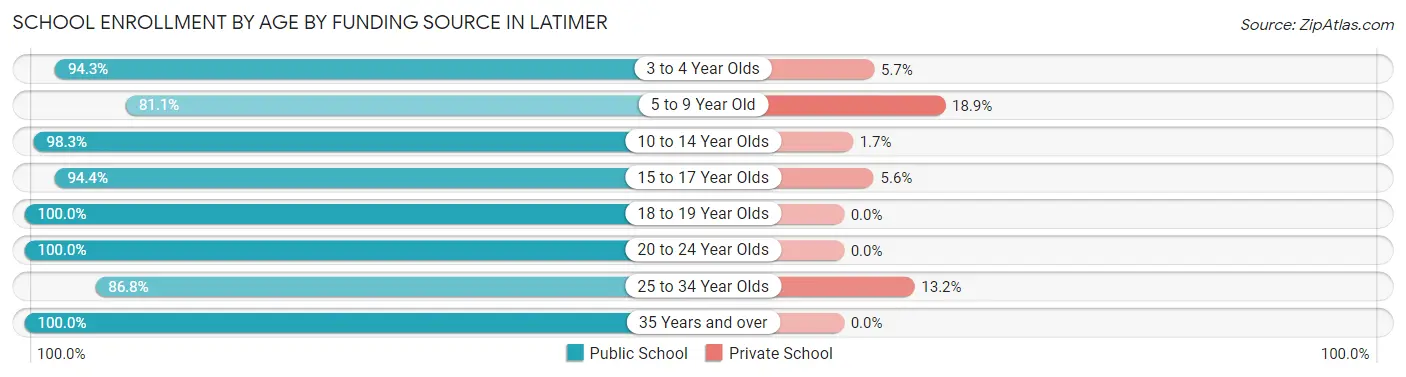
| Age Bracket | Public School | Private School |
| 3 to 4 Year Olds | 50 (94.3%) | 3 (5.7%) |
| 5 to 9 Year Old | 116 (81.1%) | 27 (18.9%) |
| 10 to 14 Year Olds | 465 (98.3%) | 8 (1.7%) |
| 15 to 17 Year Olds | 322 (94.4%) | 19 (5.6%) |
| 18 to 19 Year Olds | 90 (100.0%) | 0 (0.0%) |
| 20 to 24 Year Olds | 139 (100.0%) | 0 (0.0%) |
| 25 to 34 Year Olds | 211 (86.8%) | 32 (13.2%) |
| 35 Years and over | 66 (100.0%) | 0 (0.0%) |
| Total | 1,460 (94.3%) | 88 (5.7%) |
Educational Attainment by Field of Study in Latimer
Computers & mathematics (107 | 15.2%), liberal arts & history (97 | 13.8%), science & technology (90 | 12.8%), business (85 | 12.1%), and arts & humanities (66 | 9.4%) are the most common fields of study among 702 individuals in Latimer who have obtained a bachelor's degree or higher.
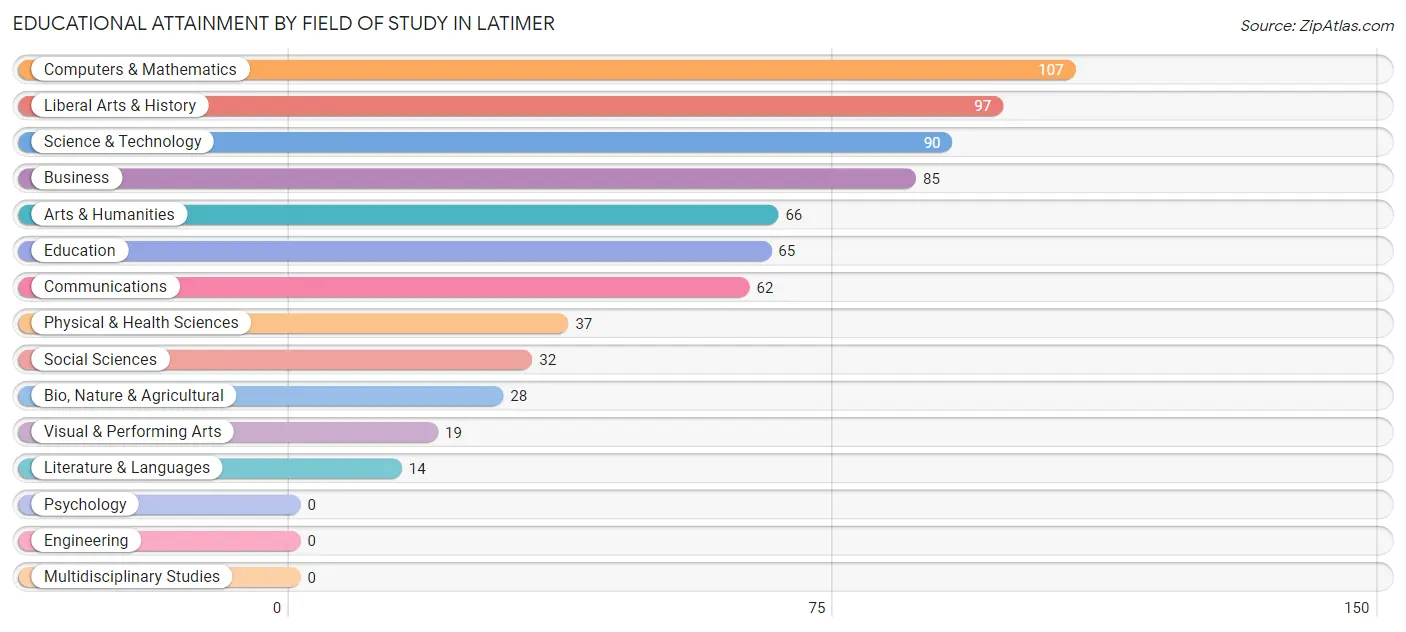
| Field of Study | # Graduates | % Graduates |
| Computers & Mathematics | 107 | 15.2% |
| Bio, Nature & Agricultural | 28 | 4.0% |
| Physical & Health Sciences | 37 | 5.3% |
| Psychology | 0 | 0.0% |
| Social Sciences | 32 | 4.6% |
| Engineering | 0 | 0.0% |
| Multidisciplinary Studies | 0 | 0.0% |
| Science & Technology | 90 | 12.8% |
| Business | 85 | 12.1% |
| Education | 65 | 9.3% |
| Literature & Languages | 14 | 2.0% |
| Liberal Arts & History | 97 | 13.8% |
| Visual & Performing Arts | 19 | 2.7% |
| Communications | 62 | 8.8% |
| Arts & Humanities | 66 | 9.4% |
| Total | 702 | 100.0% |
Transportation & Commute in Latimer
Vehicle Availability by Sex in Latimer
The most prevalent vehicle ownership categories in Latimer are males with 3 vehicles (806, accounting for 46.3%) and females with 3 vehicles (585, making up 59.8%).
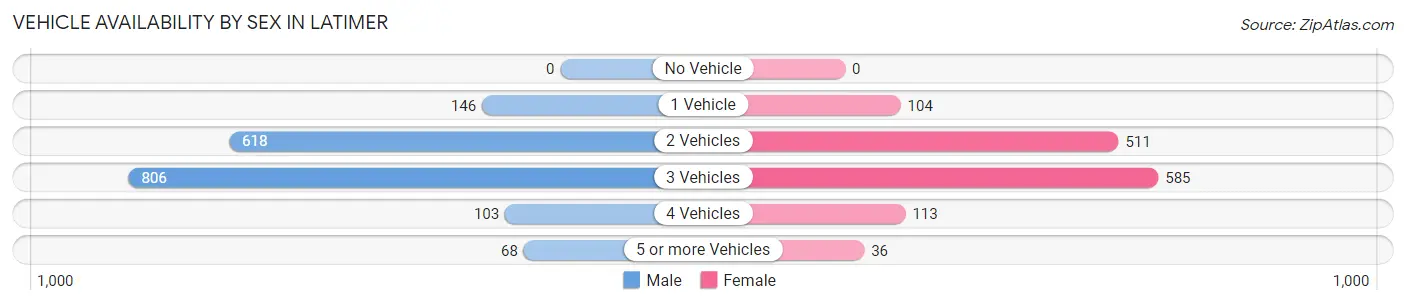
| Vehicles Available | Male | Female |
| No Vehicle | 0 (0.0%) | 0 (0.0%) |
| 1 Vehicle | 146 (8.4%) | 104 (7.7%) |
| 2 Vehicles | 618 (35.5%) | 511 (37.9%) |
| 3 Vehicles | 806 (46.3%) | 585 (43.4%) |
| 4 Vehicles | 103 (5.9%) | 113 (8.4%) |
| 5 or more Vehicles | 68 (3.9%) | 36 (2.7%) |
| Total | 1,741 (100.0%) | 1,349 (100.0%) |
Commute Time in Latimer
The most frequently occuring commute durations in Latimer are 20 to 24 minutes (979 commuters, 32.2%), 15 to 19 minutes (717 commuters, 23.6%), and 30 to 34 minutes (330 commuters, 10.9%).
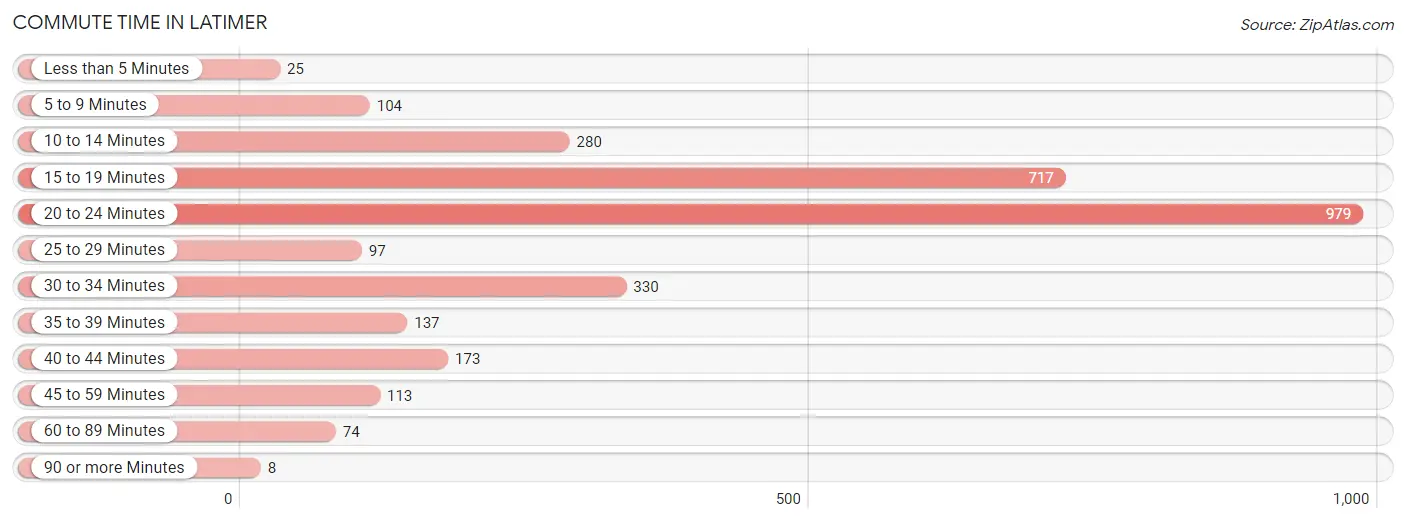
| Commute Time | # Commuters | % Commuters |
| Less than 5 Minutes | 25 | 0.8% |
| 5 to 9 Minutes | 104 | 3.4% |
| 10 to 14 Minutes | 280 | 9.2% |
| 15 to 19 Minutes | 717 | 23.6% |
| 20 to 24 Minutes | 979 | 32.2% |
| 25 to 29 Minutes | 97 | 3.2% |
| 30 to 34 Minutes | 330 | 10.9% |
| 35 to 39 Minutes | 137 | 4.5% |
| 40 to 44 Minutes | 173 | 5.7% |
| 45 to 59 Minutes | 113 | 3.7% |
| 60 to 89 Minutes | 74 | 2.4% |
| 90 or more Minutes | 8 | 0.3% |
Commute Time by Sex in Latimer
The most common commute times in Latimer are 20 to 24 minutes (540 commuters, 31.3%) for males and 15 to 19 minutes (486 commuters, 37.1%) for females.
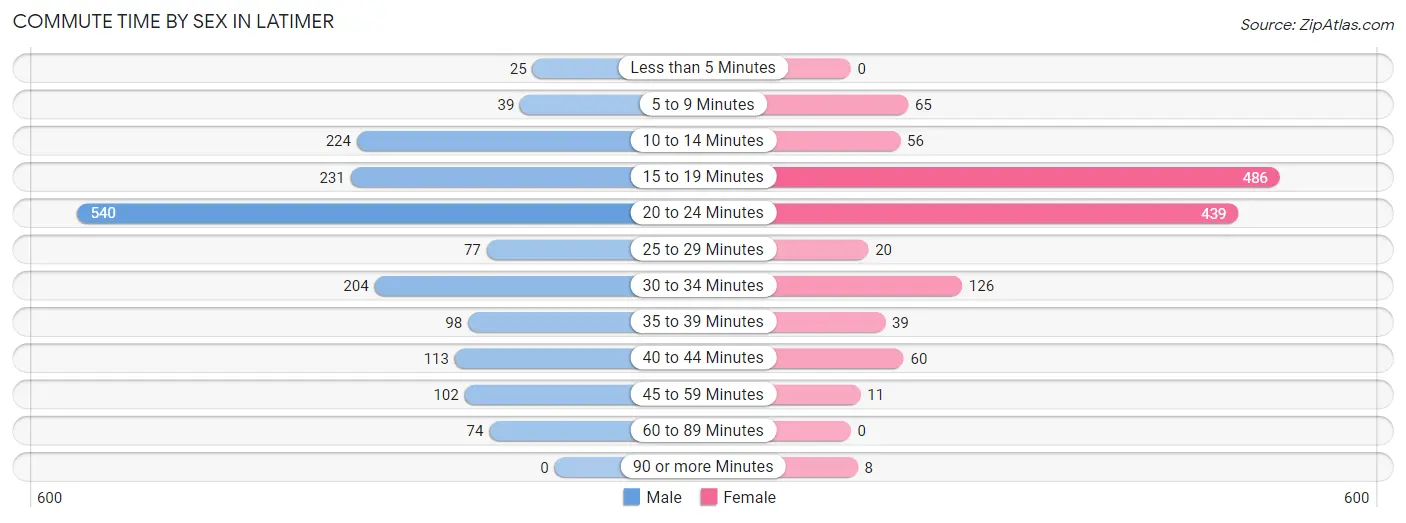
| Commute Time | Male | Female |
| Less than 5 Minutes | 25 (1.5%) | 0 (0.0%) |
| 5 to 9 Minutes | 39 (2.3%) | 65 (5.0%) |
| 10 to 14 Minutes | 224 (13.0%) | 56 (4.3%) |
| 15 to 19 Minutes | 231 (13.4%) | 486 (37.1%) |
| 20 to 24 Minutes | 540 (31.3%) | 439 (33.5%) |
| 25 to 29 Minutes | 77 (4.5%) | 20 (1.5%) |
| 30 to 34 Minutes | 204 (11.8%) | 126 (9.6%) |
| 35 to 39 Minutes | 98 (5.7%) | 39 (3.0%) |
| 40 to 44 Minutes | 113 (6.5%) | 60 (4.6%) |
| 45 to 59 Minutes | 102 (5.9%) | 11 (0.8%) |
| 60 to 89 Minutes | 74 (4.3%) | 0 (0.0%) |
| 90 or more Minutes | 0 (0.0%) | 8 (0.6%) |
Time of Departure to Work by Sex in Latimer
The most frequent times of departure to work in Latimer are 6:00 AM to 6:29 AM (406, 23.5%) for males and 7:30 AM to 7:59 AM (209, 16.0%) for females.
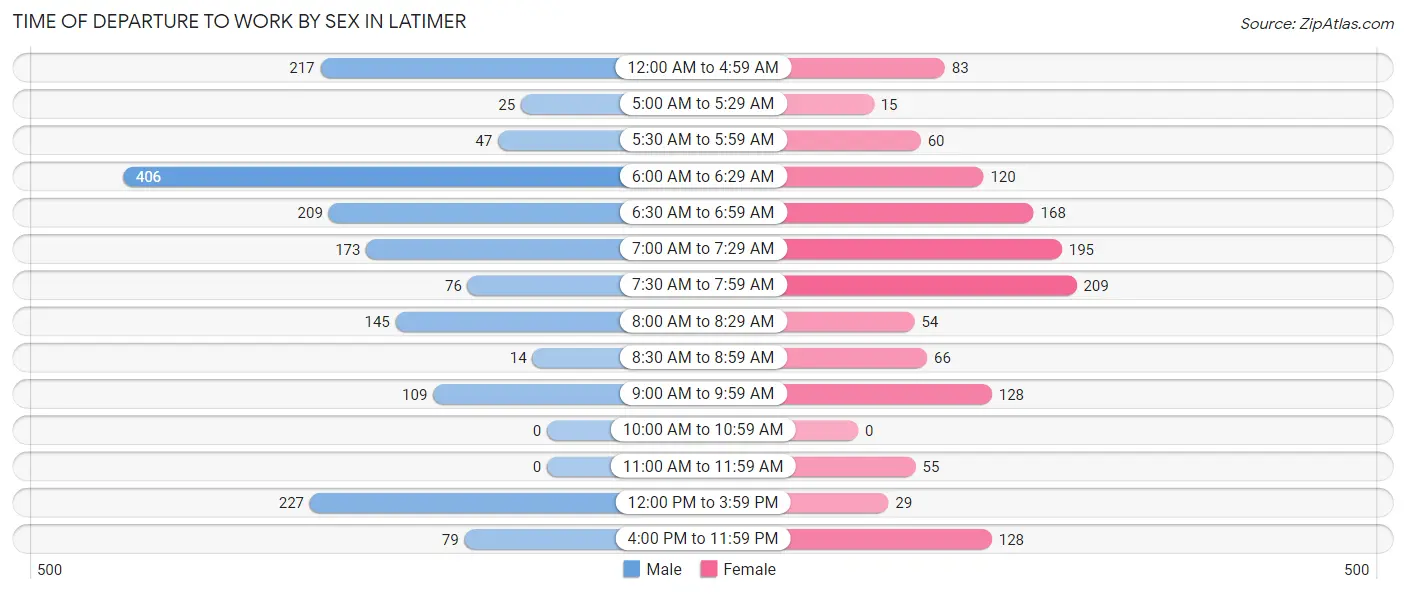
| Time of Departure | Male | Female |
| 12:00 AM to 4:59 AM | 217 (12.6%) | 83 (6.3%) |
| 5:00 AM to 5:29 AM | 25 (1.5%) | 15 (1.1%) |
| 5:30 AM to 5:59 AM | 47 (2.7%) | 60 (4.6%) |
| 6:00 AM to 6:29 AM | 406 (23.5%) | 120 (9.2%) |
| 6:30 AM to 6:59 AM | 209 (12.1%) | 168 (12.8%) |
| 7:00 AM to 7:29 AM | 173 (10.0%) | 195 (14.9%) |
| 7:30 AM to 7:59 AM | 76 (4.4%) | 209 (16.0%) |
| 8:00 AM to 8:29 AM | 145 (8.4%) | 54 (4.1%) |
| 8:30 AM to 8:59 AM | 14 (0.8%) | 66 (5.0%) |
| 9:00 AM to 9:59 AM | 109 (6.3%) | 128 (9.8%) |
| 10:00 AM to 10:59 AM | 0 (0.0%) | 0 (0.0%) |
| 11:00 AM to 11:59 AM | 0 (0.0%) | 55 (4.2%) |
| 12:00 PM to 3:59 PM | 227 (13.1%) | 29 (2.2%) |
| 4:00 PM to 11:59 PM | 79 (4.6%) | 128 (9.8%) |
| Total | 1,727 (100.0%) | 1,310 (100.0%) |
Housing Occupancy in Latimer
Occupancy by Ownership in Latimer
Of the total 2,284 dwellings in Latimer, owner-occupied units account for 1,731 (75.8%), while renter-occupied units make up 553 (24.2%).
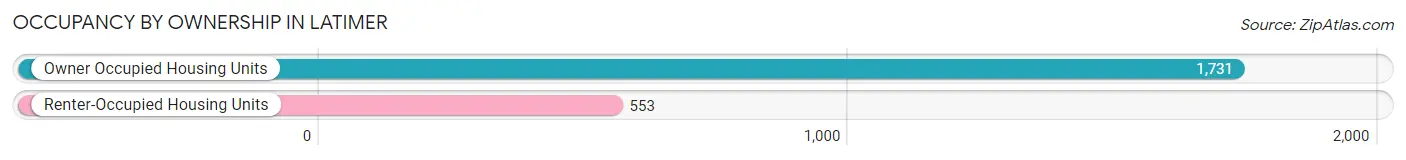
| Occupancy | # Housing Units | % Housing Units |
| Owner Occupied Housing Units | 1,731 | 75.8% |
| Renter-Occupied Housing Units | 553 | 24.2% |
| Total Occupied Housing Units | 2,284 | 100.0% |
Occupancy by Household Size in Latimer
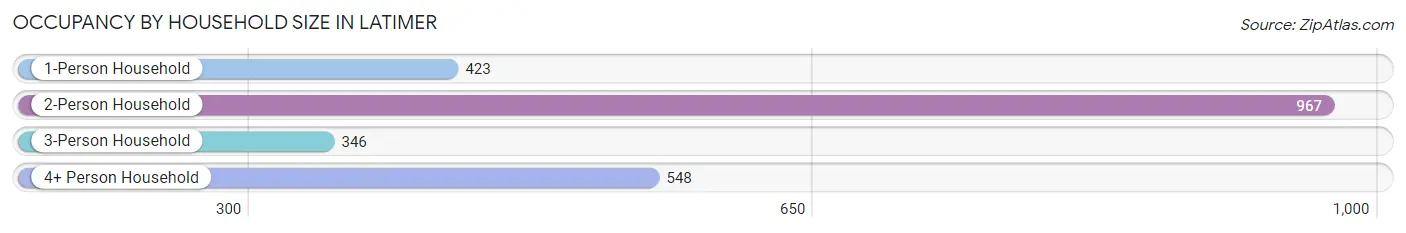
| Household Size | # Housing Units | % Housing Units |
| 1-Person Household | 423 | 18.5% |
| 2-Person Household | 967 | 42.3% |
| 3-Person Household | 346 | 15.1% |
| 4+ Person Household | 548 | 24.0% |
| Total Housing Units | 2,284 | 100.0% |
Occupancy by Ownership by Household Size in Latimer
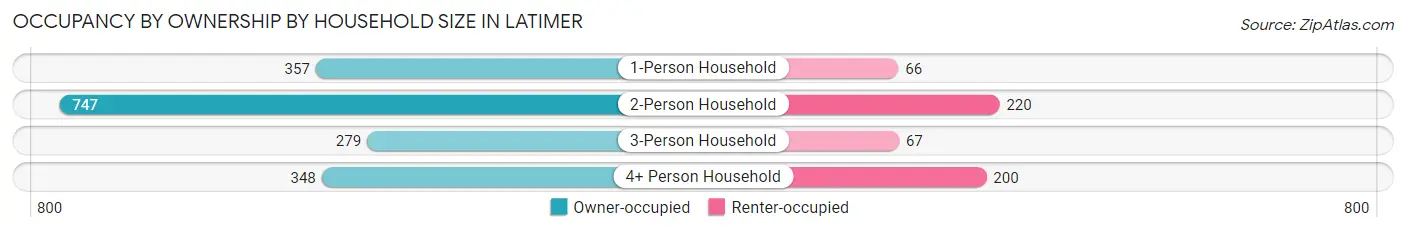
| Household Size | Owner-occupied | Renter-occupied |
| 1-Person Household | 357 (84.4%) | 66 (15.6%) |
| 2-Person Household | 747 (77.2%) | 220 (22.8%) |
| 3-Person Household | 279 (80.6%) | 67 (19.4%) |
| 4+ Person Household | 348 (63.5%) | 200 (36.5%) |
| Total Housing Units | 1,731 (75.8%) | 553 (24.2%) |
Occupancy by Educational Attainment in Latimer
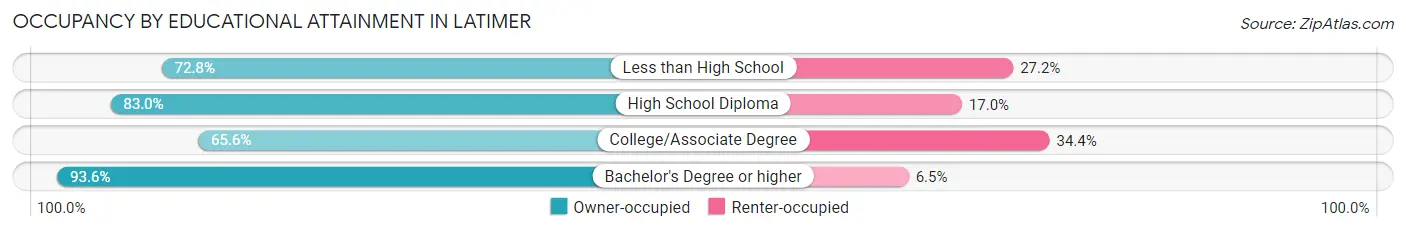
| Household Size | Owner-occupied | Renter-occupied |
| Less than High School | 260 (72.8%) | 97 (27.2%) |
| High School Diploma | 449 (83.0%) | 92 (17.0%) |
| College/Associate Degree | 645 (65.6%) | 338 (34.4%) |
| Bachelor's Degree or higher | 377 (93.5%) | 26 (6.5%) |
Occupancy by Age of Householder in Latimer
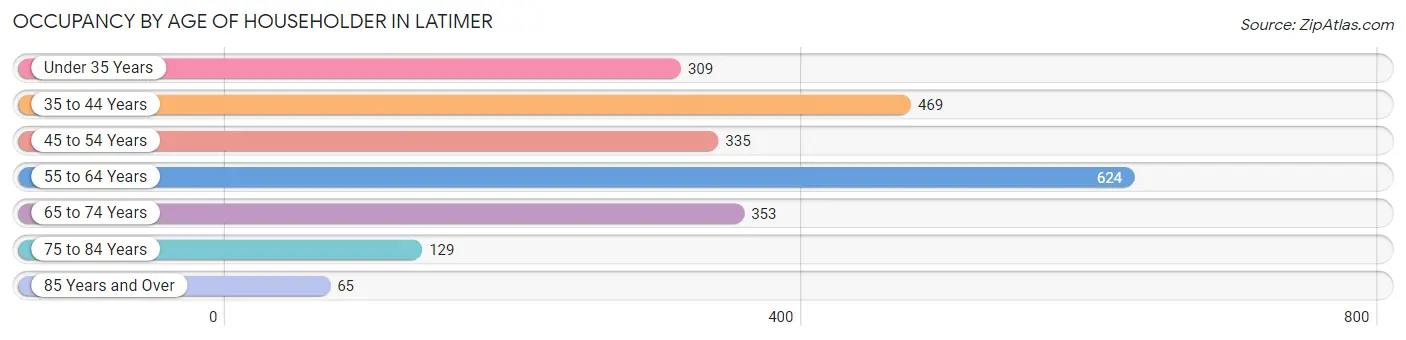
| Age Bracket | # Households | % Households |
| Under 35 Years | 309 | 13.5% |
| 35 to 44 Years | 469 | 20.5% |
| 45 to 54 Years | 335 | 14.7% |
| 55 to 64 Years | 624 | 27.3% |
| 65 to 74 Years | 353 | 15.5% |
| 75 to 84 Years | 129 | 5.7% |
| 85 Years and Over | 65 | 2.9% |
| Total | 2,284 | 100.0% |
Housing Finances in Latimer
Median Income by Occupancy in Latimer
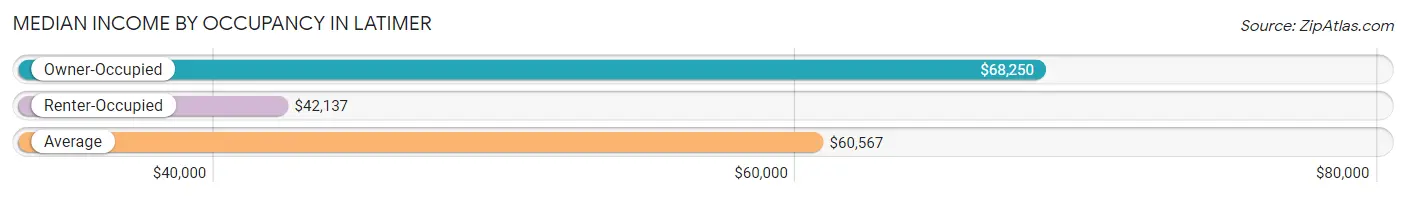
| Occupancy Type | # Households | Median Income |
| Owner-Occupied | 1,731 (75.8%) | $68,250 |
| Renter-Occupied | 553 (24.2%) | $42,137 |
| Average | 2,284 (100.0%) | $60,567 |
Occupancy by Householder Income Bracket in Latimer
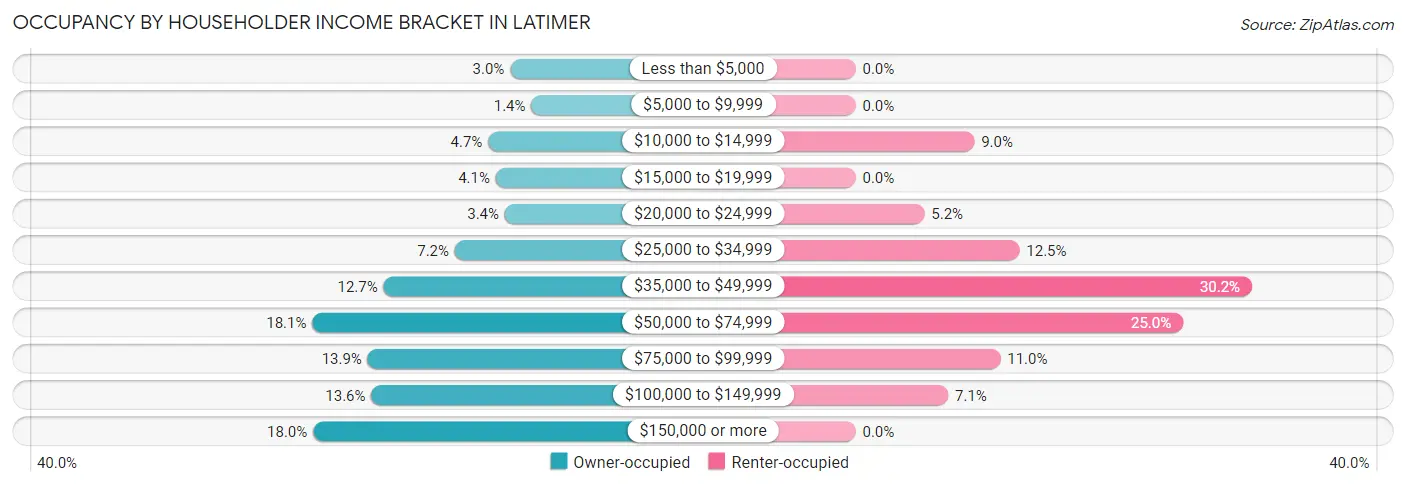
| Income Bracket | Owner-occupied | Renter-occupied |
| Less than $5,000 | 52 (3.0%) | 0 (0.0%) |
| $5,000 to $9,999 | 24 (1.4%) | 0 (0.0%) |
| $10,000 to $14,999 | 81 (4.7%) | 50 (9.0%) |
| $15,000 to $19,999 | 71 (4.1%) | 0 (0.0%) |
| $20,000 to $24,999 | 59 (3.4%) | 29 (5.2%) |
| $25,000 to $34,999 | 125 (7.2%) | 69 (12.5%) |
| $35,000 to $49,999 | 219 (12.7%) | 167 (30.2%) |
| $50,000 to $74,999 | 313 (18.1%) | 138 (24.9%) |
| $75,000 to $99,999 | 240 (13.9%) | 61 (11.0%) |
| $100,000 to $149,999 | 235 (13.6%) | 39 (7.0%) |
| $150,000 or more | 312 (18.0%) | 0 (0.0%) |
| Total | 1,731 (100.0%) | 553 (100.0%) |
Monthly Housing Cost Tiers in Latimer
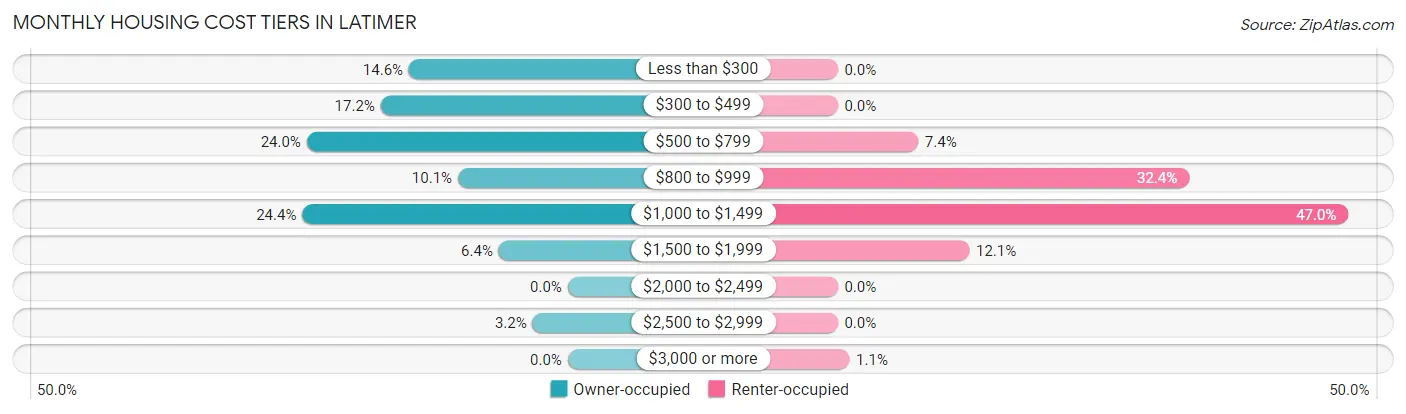
| Monthly Cost | Owner-occupied | Renter-occupied |
| Less than $300 | 253 (14.6%) | 0 (0.0%) |
| $300 to $499 | 298 (17.2%) | 0 (0.0%) |
| $500 to $799 | 416 (24.0%) | 41 (7.4%) |
| $800 to $999 | 175 (10.1%) | 179 (32.4%) |
| $1,000 to $1,499 | 423 (24.4%) | 260 (47.0%) |
| $1,500 to $1,999 | 110 (6.4%) | 67 (12.1%) |
| $2,000 to $2,499 | 0 (0.0%) | 0 (0.0%) |
| $2,500 to $2,999 | 56 (3.2%) | 0 (0.0%) |
| $3,000 or more | 0 (0.0%) | 6 (1.1%) |
| Total | 1,731 (100.0%) | 553 (100.0%) |
Physical Housing Characteristics in Latimer
Housing Structures in Latimer
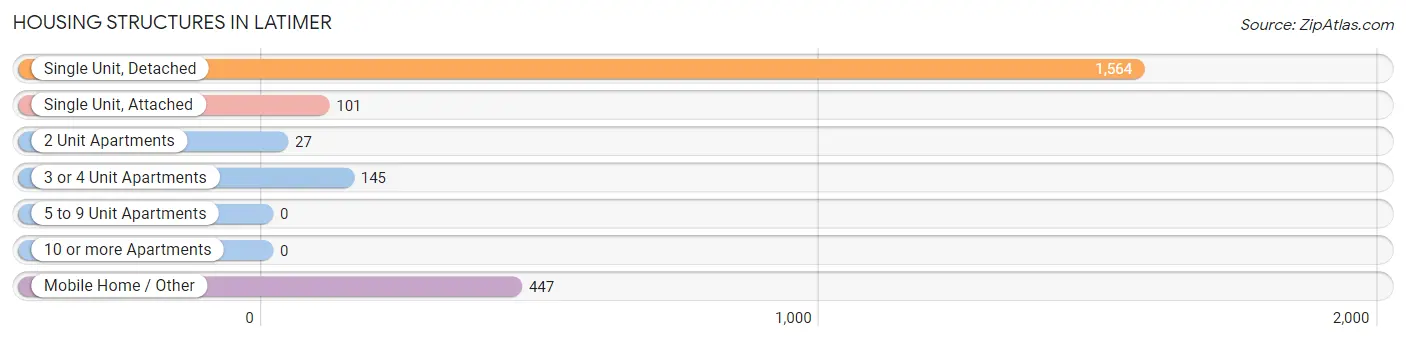
| Structure Type | # Housing Units | % Housing Units |
| Single Unit, Detached | 1,564 | 68.5% |
| Single Unit, Attached | 101 | 4.4% |
| 2 Unit Apartments | 27 | 1.2% |
| 3 or 4 Unit Apartments | 145 | 6.4% |
| 5 to 9 Unit Apartments | 0 | 0.0% |
| 10 or more Apartments | 0 | 0.0% |
| Mobile Home / Other | 447 | 19.6% |
| Total | 2,284 | 100.0% |
Housing Structures by Occupancy in Latimer
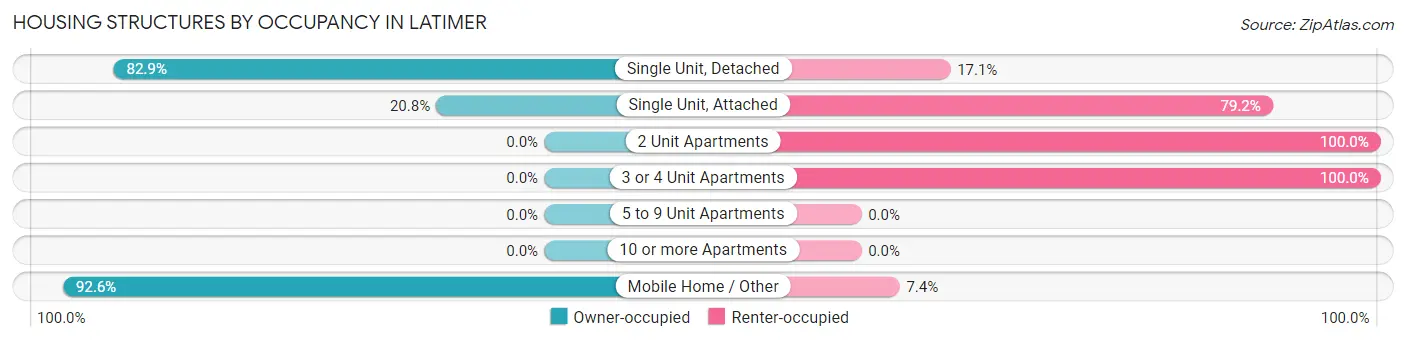
| Structure Type | Owner-occupied | Renter-occupied |
| Single Unit, Detached | 1,296 (82.9%) | 268 (17.1%) |
| Single Unit, Attached | 21 (20.8%) | 80 (79.2%) |
| 2 Unit Apartments | 0 (0.0%) | 27 (100.0%) |
| 3 or 4 Unit Apartments | 0 (0.0%) | 145 (100.0%) |
| 5 to 9 Unit Apartments | 0 (0.0%) | 0 (0.0%) |
| 10 or more Apartments | 0 (0.0%) | 0 (0.0%) |
| Mobile Home / Other | 414 (92.6%) | 33 (7.4%) |
| Total | 1,731 (75.8%) | 553 (24.2%) |
Housing Structures by Number of Rooms in Latimer
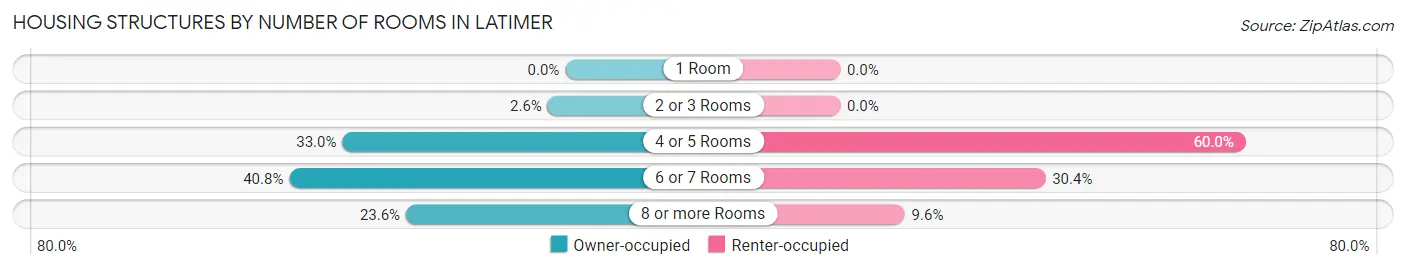
| Number of Rooms | Owner-occupied | Renter-occupied |
| 1 Room | 0 (0.0%) | 0 (0.0%) |
| 2 or 3 Rooms | 45 (2.6%) | 0 (0.0%) |
| 4 or 5 Rooms | 571 (33.0%) | 332 (60.0%) |
| 6 or 7 Rooms | 707 (40.8%) | 168 (30.4%) |
| 8 or more Rooms | 408 (23.6%) | 53 (9.6%) |
| Total | 1,731 (100.0%) | 553 (100.0%) |
Housing Structure by Heating Type in Latimer
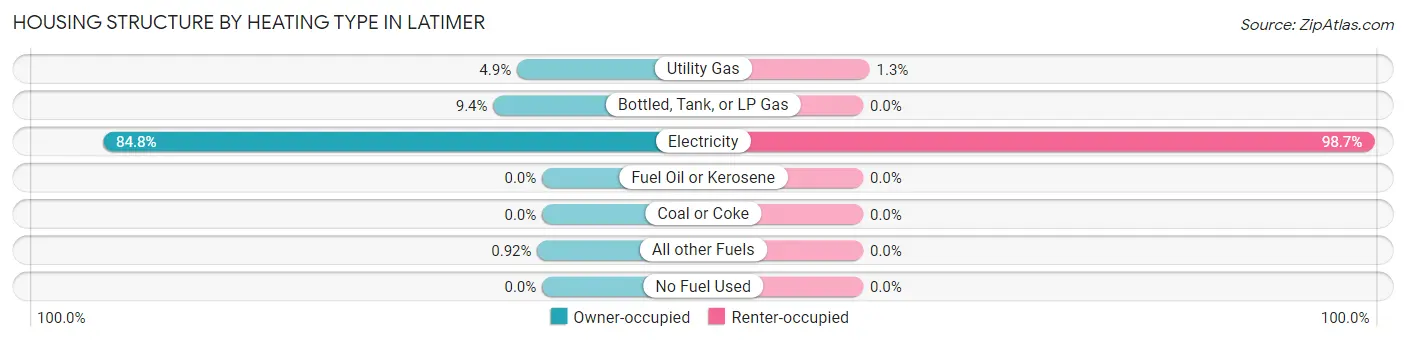
| Heating Type | Owner-occupied | Renter-occupied |
| Utility Gas | 84 (4.9%) | 7 (1.3%) |
| Bottled, Tank, or LP Gas | 163 (9.4%) | 0 (0.0%) |
| Electricity | 1,468 (84.8%) | 546 (98.7%) |
| Fuel Oil or Kerosene | 0 (0.0%) | 0 (0.0%) |
| Coal or Coke | 0 (0.0%) | 0 (0.0%) |
| All other Fuels | 16 (0.9%) | 0 (0.0%) |
| No Fuel Used | 0 (0.0%) | 0 (0.0%) |
| Total | 1,731 (100.0%) | 553 (100.0%) |
Household Vehicle Usage in Latimer
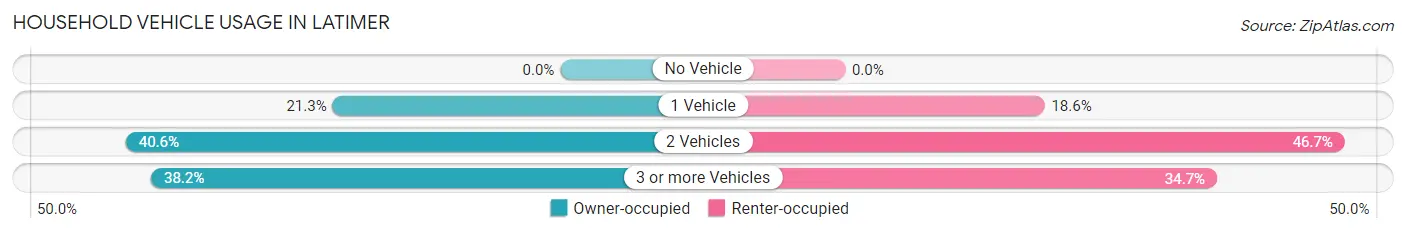
| Vehicles per Household | Owner-occupied | Renter-occupied |
| No Vehicle | 0 (0.0%) | 0 (0.0%) |
| 1 Vehicle | 368 (21.3%) | 103 (18.6%) |
| 2 Vehicles | 702 (40.6%) | 258 (46.7%) |
| 3 or more Vehicles | 661 (38.2%) | 192 (34.7%) |
| Total | 1,731 (100.0%) | 553 (100.0%) |
Real Estate & Mortgages in Latimer
Real Estate and Mortgage Overview in Latimer
| Characteristic | Without Mortgage | With Mortgage |
| Housing Units | 889 | 842 |
| Median Property Value | $146,300 | $154,200 |
| Median Household Income | $63,324 | $206 |
| Monthly Housing Costs | $445 | $0 |
| Real Estate Taxes | $820 | $128 |
Property Value by Mortgage Status in Latimer
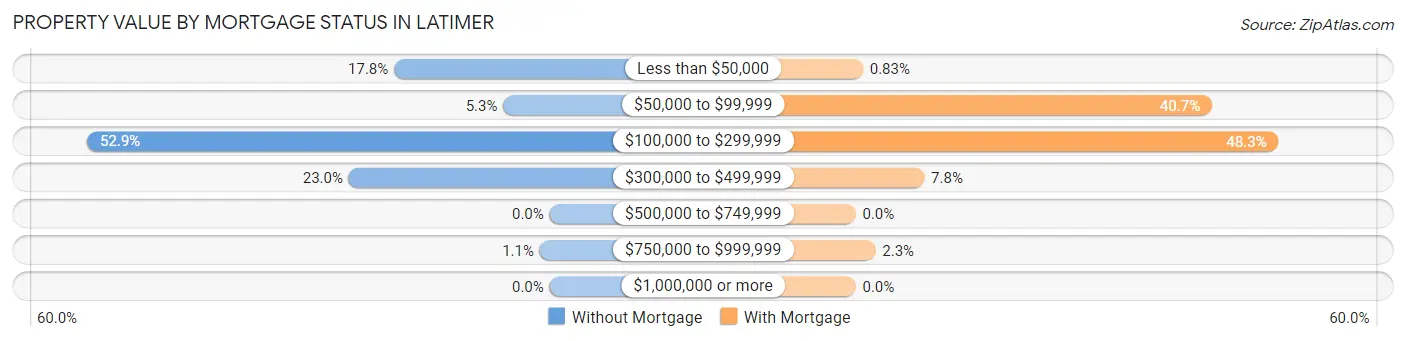
| Property Value | Without Mortgage | With Mortgage |
| Less than $50,000 | 158 (17.8%) | 7 (0.8%) |
| $50,000 to $99,999 | 47 (5.3%) | 343 (40.7%) |
| $100,000 to $299,999 | 470 (52.9%) | 407 (48.3%) |
| $300,000 to $499,999 | 204 (23.0%) | 66 (7.8%) |
| $500,000 to $749,999 | 0 (0.0%) | 0 (0.0%) |
| $750,000 to $999,999 | 10 (1.1%) | 19 (2.3%) |
| $1,000,000 or more | 0 (0.0%) | 0 (0.0%) |
| Total | 889 (100.0%) | 842 (100.0%) |
Household Income by Mortgage Status in Latimer
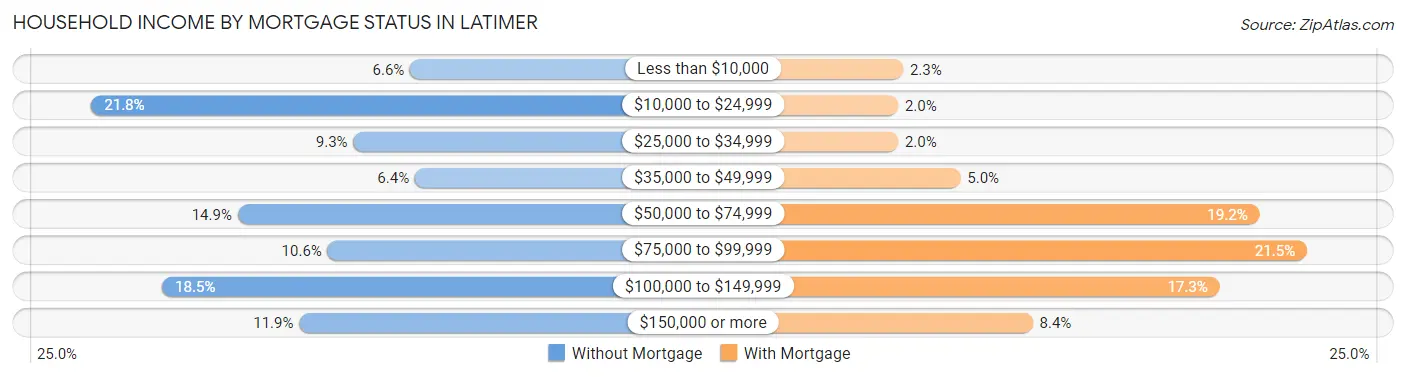
| Household Income | Without Mortgage | With Mortgage |
| Less than $10,000 | 59 (6.6%) | 19 (2.3%) |
| $10,000 to $24,999 | 194 (21.8%) | 17 (2.0%) |
| $25,000 to $34,999 | 83 (9.3%) | 17 (2.0%) |
| $35,000 to $49,999 | 57 (6.4%) | 42 (5.0%) |
| $50,000 to $74,999 | 132 (14.8%) | 162 (19.2%) |
| $75,000 to $99,999 | 94 (10.6%) | 181 (21.5%) |
| $100,000 to $149,999 | 164 (18.4%) | 146 (17.3%) |
| $150,000 or more | 106 (11.9%) | 71 (8.4%) |
| Total | 889 (100.0%) | 842 (100.0%) |
Property Value to Household Income Ratio in Latimer
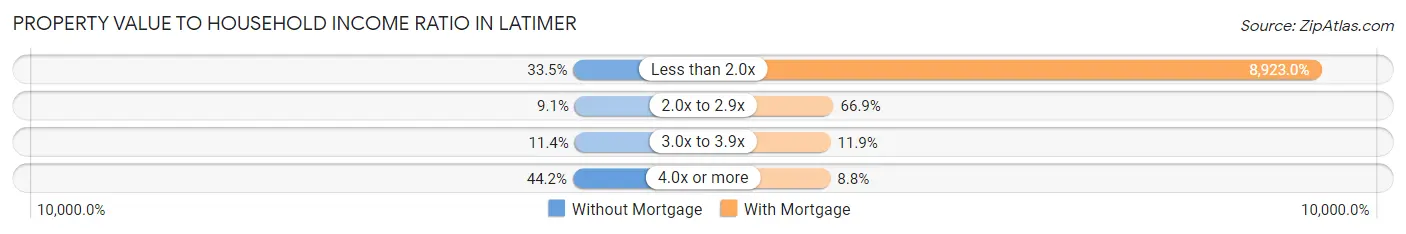
| Value-to-Income Ratio | Without Mortgage | With Mortgage |
| Less than 2.0x | 298 (33.5%) | 75,132 (8,923.0%) |
| 2.0x to 2.9x | 81 (9.1%) | 563 (66.9%) |
| 3.0x to 3.9x | 101 (11.4%) | 100 (11.9%) |
| 4.0x or more | 393 (44.2%) | 74 (8.8%) |
| Total | 889 (100.0%) | 842 (100.0%) |
Real Estate Taxes by Mortgage Status in Latimer
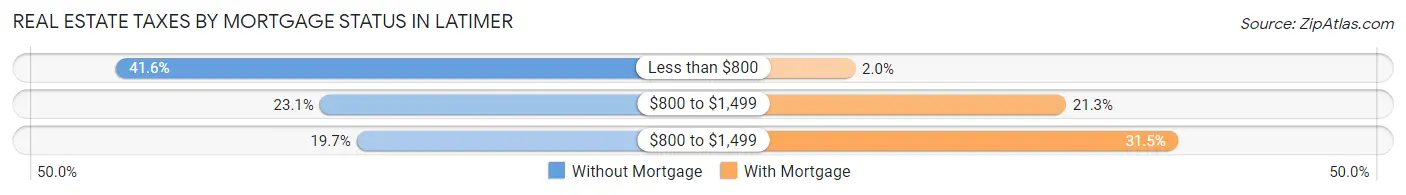
| Property Taxes | Without Mortgage | With Mortgage |
| Less than $800 | 370 (41.6%) | 17 (2.0%) |
| $800 to $1,499 | 205 (23.1%) | 179 (21.3%) |
| $800 to $1,499 | 175 (19.7%) | 265 (31.5%) |
| Total | 889 (100.0%) | 842 (100.0%) |
Health & Disability in Latimer
Health Insurance Coverage by Age in Latimer
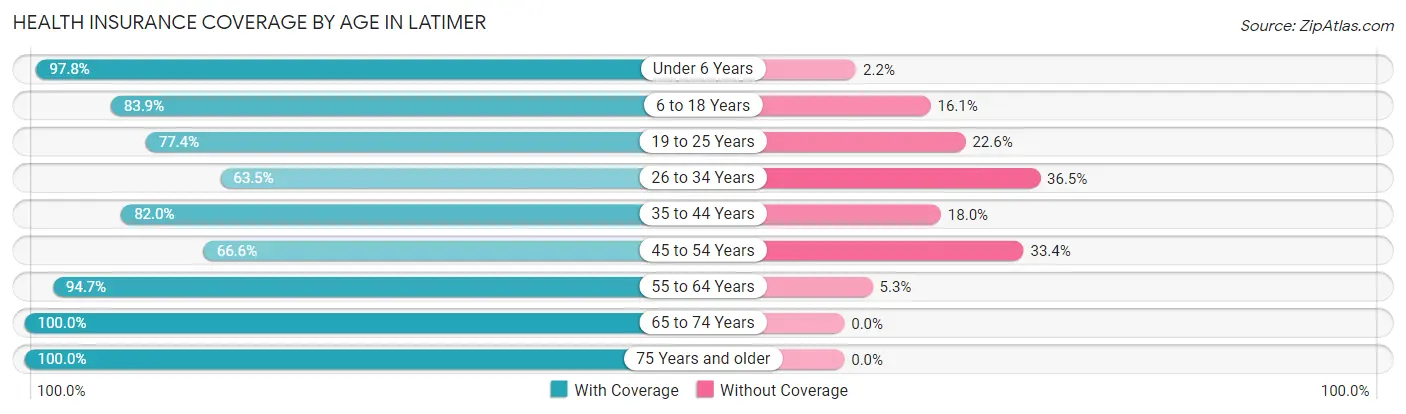
| Age Bracket | With Coverage | Without Coverage |
| Under 6 Years | 442 (97.8%) | 10 (2.2%) |
| 6 to 18 Years | 871 (83.9%) | 167 (16.1%) |
| 19 to 25 Years | 541 (77.4%) | 158 (22.6%) |
| 26 to 34 Years | 360 (63.5%) | 207 (36.5%) |
| 35 to 44 Years | 737 (82.0%) | 162 (18.0%) |
| 45 to 54 Years | 446 (66.6%) | 224 (33.4%) |
| 55 to 64 Years | 861 (94.7%) | 48 (5.3%) |
| 65 to 74 Years | 814 (100.0%) | 0 (0.0%) |
| 75 Years and older | 293 (100.0%) | 0 (0.0%) |
| Total | 5,365 (84.6%) | 976 (15.4%) |
Health Insurance Coverage by Citizenship Status in Latimer
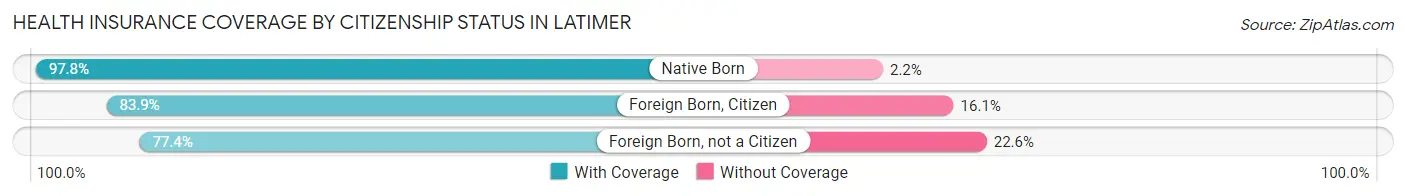
| Citizenship Status | With Coverage | Without Coverage |
| Native Born | 442 (97.8%) | 10 (2.2%) |
| Foreign Born, Citizen | 871 (83.9%) | 167 (16.1%) |
| Foreign Born, not a Citizen | 541 (77.4%) | 158 (22.6%) |
Health Insurance Coverage by Household Income in Latimer
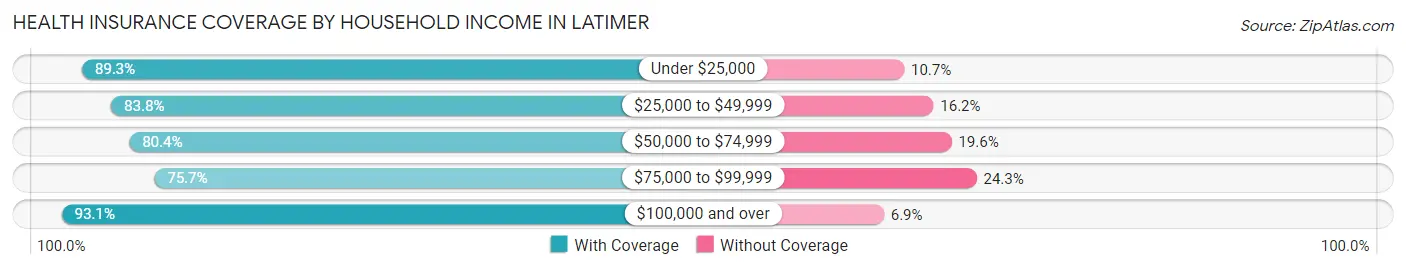
| Household Income | With Coverage | Without Coverage |
| Under $25,000 | 549 (89.3%) | 66 (10.7%) |
| $25,000 to $49,999 | 1,508 (83.8%) | 292 (16.2%) |
| $50,000 to $74,999 | 1,033 (80.4%) | 252 (19.6%) |
| $75,000 to $99,999 | 797 (75.7%) | 256 (24.3%) |
| $100,000 and over | 1,478 (93.1%) | 110 (6.9%) |
Public vs Private Health Insurance Coverage by Age in Latimer
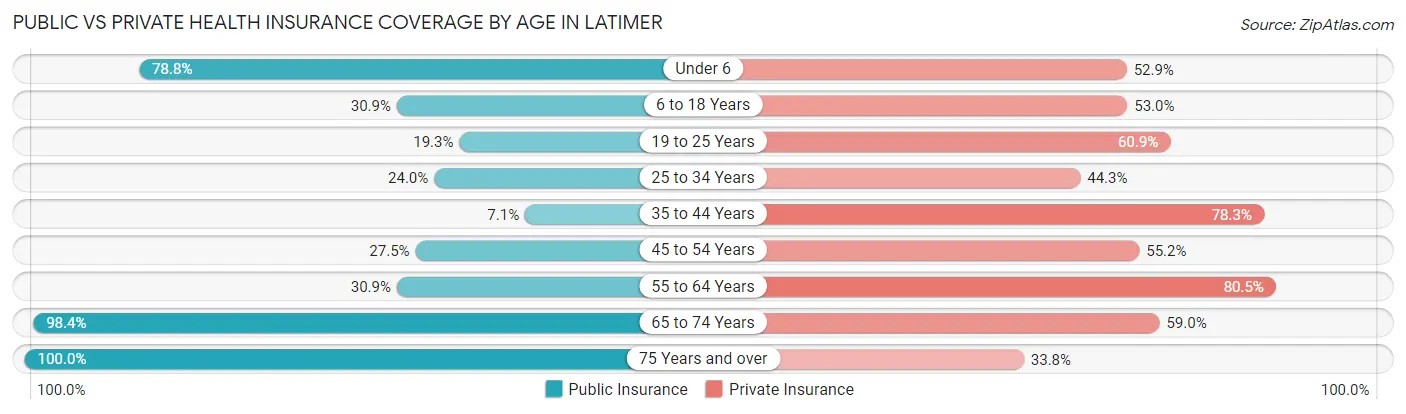
| Age Bracket | Public Insurance | Private Insurance |
| Under 6 | 356 (78.8%) | 239 (52.9%) |
| 6 to 18 Years | 321 (30.9%) | 550 (53.0%) |
| 19 to 25 Years | 135 (19.3%) | 426 (60.9%) |
| 25 to 34 Years | 136 (24.0%) | 251 (44.3%) |
| 35 to 44 Years | 64 (7.1%) | 704 (78.3%) |
| 45 to 54 Years | 184 (27.5%) | 370 (55.2%) |
| 55 to 64 Years | 281 (30.9%) | 732 (80.5%) |
| 65 to 74 Years | 801 (98.4%) | 480 (59.0%) |
| 75 Years and over | 293 (100.0%) | 99 (33.8%) |
| Total | 2,571 (40.6%) | 3,851 (60.7%) |
Disability Status by Sex by Age in Latimer
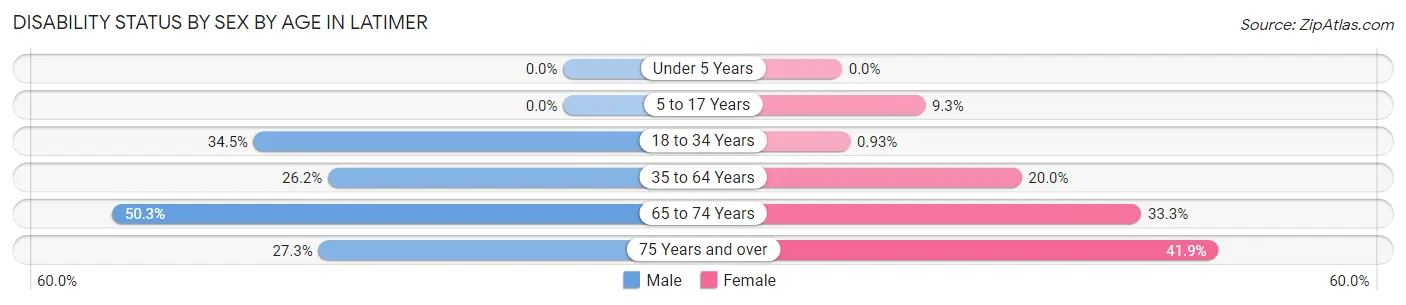
| Age Bracket | Male | Female |
| Under 5 Years | 0 (0.0%) | 0 (0.0%) |
| 5 to 17 Years | 0 (0.0%) | 41 (9.3%) |
| 18 to 34 Years | 234 (34.5%) | 6 (0.9%) |
| 35 to 64 Years | 306 (26.2%) | 262 (20.0%) |
| 65 to 74 Years | 260 (50.3%) | 99 (33.3%) |
| 75 Years and over | 63 (27.3%) | 26 (41.9%) |
Disability Class by Sex by Age in Latimer
Disability Class: Hearing Difficulty
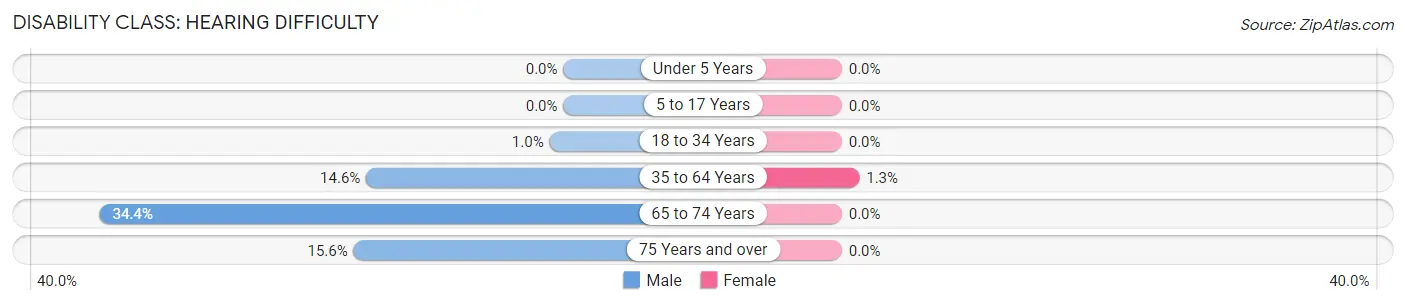
| Age Bracket | Male | Female |
| Under 5 Years | 0 (0.0%) | 0 (0.0%) |
| 5 to 17 Years | 0 (0.0%) | 0 (0.0%) |
| 18 to 34 Years | 7 (1.0%) | 0 (0.0%) |
| 35 to 64 Years | 171 (14.6%) | 17 (1.3%) |
| 65 to 74 Years | 178 (34.4%) | 0 (0.0%) |
| 75 Years and over | 36 (15.6%) | 0 (0.0%) |
Disability Class: Vision Difficulty
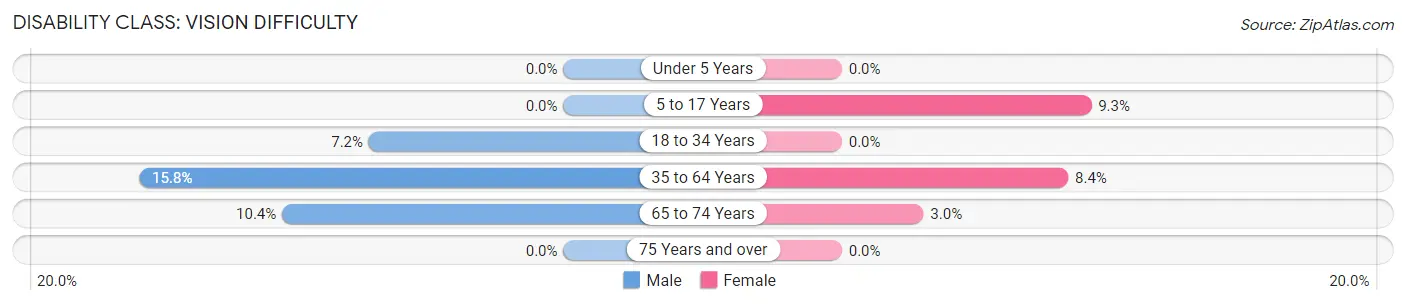
| Age Bracket | Male | Female |
| Under 5 Years | 0 (0.0%) | 0 (0.0%) |
| 5 to 17 Years | 0 (0.0%) | 41 (9.3%) |
| 18 to 34 Years | 49 (7.2%) | 0 (0.0%) |
| 35 to 64 Years | 184 (15.8%) | 110 (8.4%) |
| 65 to 74 Years | 54 (10.4%) | 9 (3.0%) |
| 75 Years and over | 0 (0.0%) | 0 (0.0%) |
Disability Class: Cognitive Difficulty
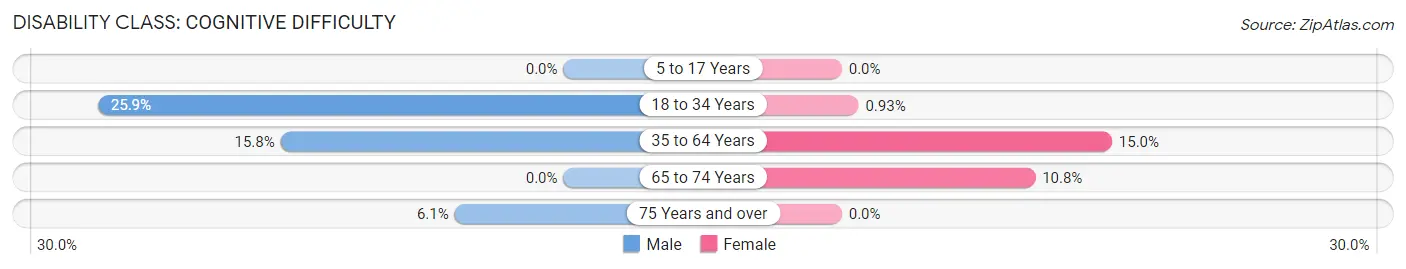
| Age Bracket | Male | Female |
| 5 to 17 Years | 0 (0.0%) | 0 (0.0%) |
| 18 to 34 Years | 176 (25.9%) | 6 (0.9%) |
| 35 to 64 Years | 184 (15.8%) | 197 (15.0%) |
| 65 to 74 Years | 0 (0.0%) | 32 (10.8%) |
| 75 Years and over | 14 (6.1%) | 0 (0.0%) |
Disability Class: Ambulatory Difficulty
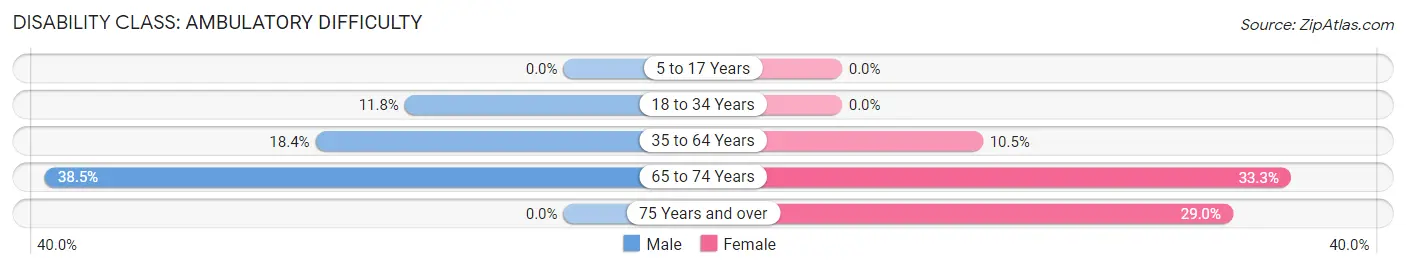
| Age Bracket | Male | Female |
| 5 to 17 Years | 0 (0.0%) | 0 (0.0%) |
| 18 to 34 Years | 80 (11.8%) | 0 (0.0%) |
| 35 to 64 Years | 215 (18.4%) | 137 (10.5%) |
| 65 to 74 Years | 199 (38.5%) | 99 (33.3%) |
| 75 Years and over | 0 (0.0%) | 18 (29.0%) |
Disability Class: Self-Care Difficulty
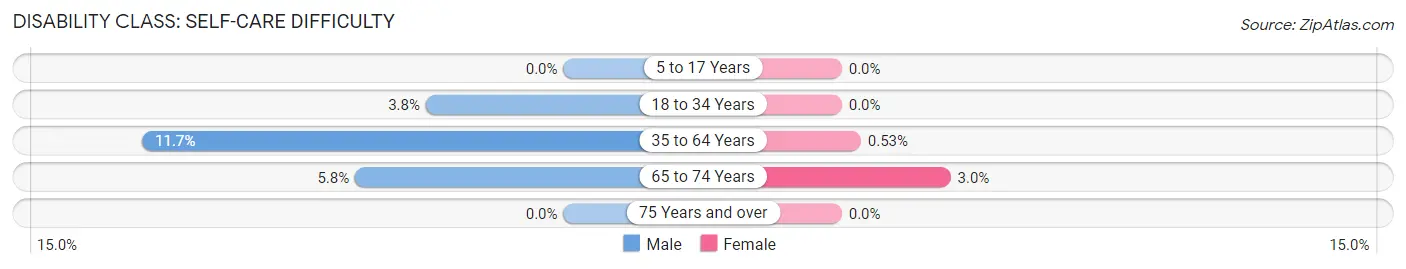
| Age Bracket | Male | Female |
| 5 to 17 Years | 0 (0.0%) | 0 (0.0%) |
| 18 to 34 Years | 26 (3.8%) | 0 (0.0%) |
| 35 to 64 Years | 137 (11.7%) | 7 (0.5%) |
| 65 to 74 Years | 30 (5.8%) | 9 (3.0%) |
| 75 Years and over | 0 (0.0%) | 0 (0.0%) |
Technology Access in Latimer
Computing Device Access in Latimer
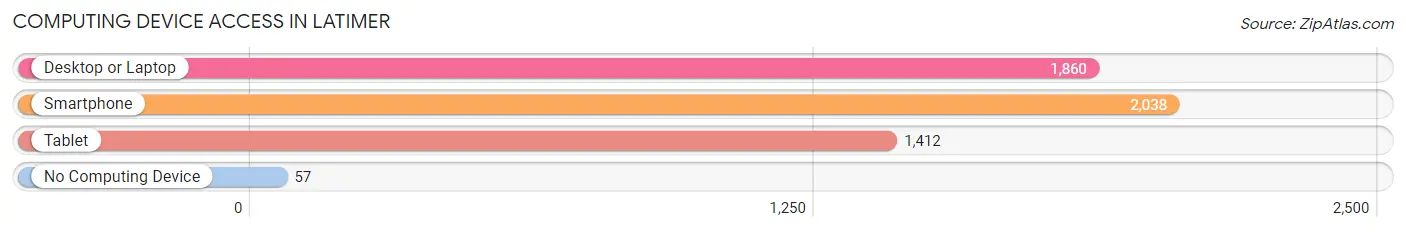
| Device Type | # Households | % Households |
| Desktop or Laptop | 1,860 | 81.4% |
| Smartphone | 2,038 | 89.2% |
| Tablet | 1,412 | 61.8% |
| No Computing Device | 57 | 2.5% |
| Total | 2,284 | 100.0% |
Internet Access in Latimer
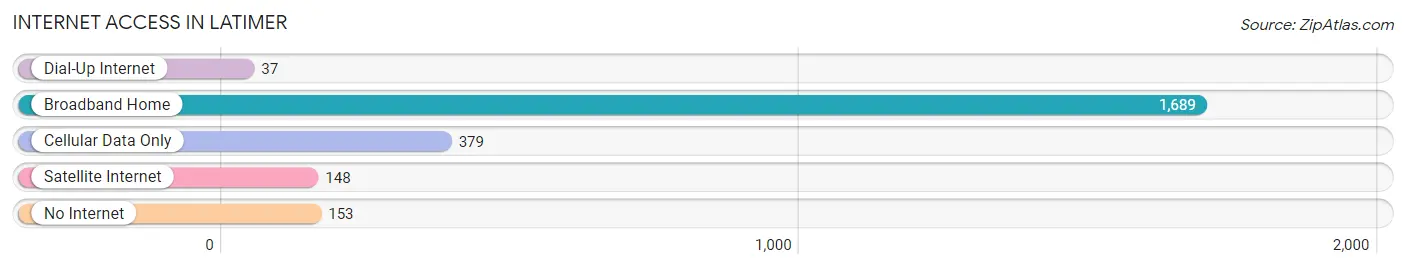
| Internet Type | # Households | % Households |
| Dial-Up Internet | 37 | 1.6% |
| Broadband Home | 1,689 | 74.0% |
| Cellular Data Only | 379 | 16.6% |
| Satellite Internet | 148 | 6.5% |
| No Internet | 153 | 6.7% |
| Total | 2,284 | 100.0% |
Latimer Summary
Latimer is a small town located in the state of Mississippi, in the United States of America. It is situated in the northern part of the state, in the county of Itawamba. The town has a population of approximately 1,000 people, and is located about 30 miles south of Tupelo, the county seat.
Latimer was founded in 1837, and was named after the Latimer family, who were among the first settlers in the area. The town was originally a farming community, and the main crops grown were cotton, corn, and soybeans. The town also had a sawmill, which provided lumber for the local area.
Latimer is located in the foothills of the Appalachian Mountains, and the terrain is mostly hilly and wooded. The town is situated on the banks of the Tombigbee River, and is surrounded by several small lakes. The climate in Latimer is humid subtropical, with hot summers and mild winters.
The economy of Latimer is largely based on agriculture, with the main crops being cotton, corn, and soybeans. The town also has a few small businesses, such as a grocery store, a hardware store, and a few restaurants. The town is also home to a few manufacturing plants, which produce furniture, clothing, and other items.
The demographics of Latimer are mostly white, with a small African American population. The median household income is around $30,000, and the median home value is around $90,000. The town has a low unemployment rate, and the poverty rate is below the national average.
Latimer is served by the Itawamba County School District, which includes two elementary schools, one middle school, and one high school. The town also has a library, a post office, and a few churches.
Latimer is a small town with a rich history and a strong sense of community. The town is a great place to live, work, and raise a family. The town is surrounded by beautiful scenery, and the people are friendly and welcoming. Latimer is a great place to call home.
Common Questions
What is Per Capita Income in Latimer?
Per Capita income in Latimer is $28,651.
What is the Median Family Income in Latimer?
Median Family Income in Latimer is $56,671.
What is the Median Household income in Latimer?
Median Household Income in Latimer is $60,567.
What is Income or Wage Gap in Latimer?
Income or Wage Gap in Latimer is 38.9%.
Women in Latimer earn 61.1 cents for every dollar earned by a man.
What is Inequality or Gini Index in Latimer?
Inequality or Gini Index in Latimer is 0.41.
What is the Total Population of Latimer?
Total Population of Latimer is 6,436.
What is the Total Male Population of Latimer?
Total Male Population of Latimer is 3,509.
What is the Total Female Population of Latimer?
Total Female Population of Latimer is 2,927.
What is the Ratio of Males per 100 Females in Latimer?
There are 119.88 Males per 100 Females in Latimer.
What is the Ratio of Females per 100 Males in Latimer?
There are 83.41 Females per 100 Males in Latimer.
What is the Median Population Age in Latimer?
Median Population Age in Latimer is 38.0 Years.
What is the Average Family Size in Latimer
Average Family Size in Latimer is 3.0 People.
What is the Average Household Size in Latimer
Average Household Size in Latimer is 2.8 People.
How Large is the Labor Force in Latimer?
There are 3,363 People in the Labor Forcein in Latimer.
What is the Percentage of People in the Labor Force in Latimer?
64.1% of People are in the Labor Force in Latimer.
What is the Unemployment Rate in Latimer?
Unemployment Rate in Latimer is 8.0%.