Palmyra, MO Map & Demographics
Palmyra Map
Palmyra Overview
$27,957
PER CAPITA INCOME
$71,921
AVG FAMILY INCOME
$60,694
AVG HOUSEHOLD INCOME
28.9%
WAGE / INCOME GAP [ % ]
71.1¢/ $1
WAGE / INCOME GAP [ $ ]
0.38
INEQUALITY / GINI INDEX
3,613
TOTAL POPULATION
1,801
MALE POPULATION
1,812
FEMALE POPULATION
99.39
MALES / 100 FEMALES
100.61
FEMALES / 100 MALES
36.4
MEDIAN AGE
3.1
AVG FAMILY SIZE
2.4
AVG HOUSEHOLD SIZE
1,723
LABOR FORCE [ PEOPLE ]
63.4%
PERCENT IN LABOR FORCE
1.6%
UNEMPLOYMENT RATE
Palmyra Zip Codes
Palmyra Area Codes
Income in Palmyra
Income Overview in Palmyra
Per Capita Income in Palmyra is $27,957, while median incomes of families and households are $71,921 and $60,694 respectively.
| Characteristic | Number | Measure |
| Per Capita Income | 3,613 | $27,957 |
| Median Family Income | 891 | $71,921 |
| Mean Family Income | 891 | $80,688 |
| Median Household Income | 1,433 | $60,694 |
| Mean Household Income | 1,433 | $70,069 |
| Income Deficit | 891 | $0 |
| Wage / Income Gap (%) | 3,613 | 28.94% |
| Wage / Income Gap ($) | 3,613 | 71.06¢ per $1 |
| Gini / Inequality Index | 3,613 | 0.38 |
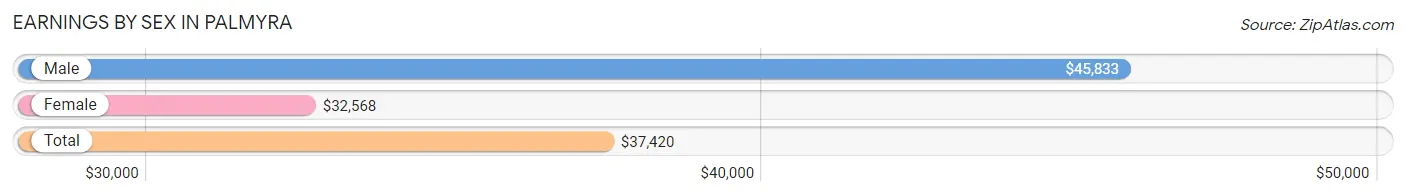
Earnings by Sex in Palmyra
Average Earnings in Palmyra are $37,420, $45,833 for men and $32,568 for women, a difference of 28.9%.
| Sex | Number | Average Earnings |
| Male | 1,016 (56.5%) | $45,833 |
| Female | 781 (43.5%) | $32,568 |
| Total | 1,797 (100.0%) | $37,420 |
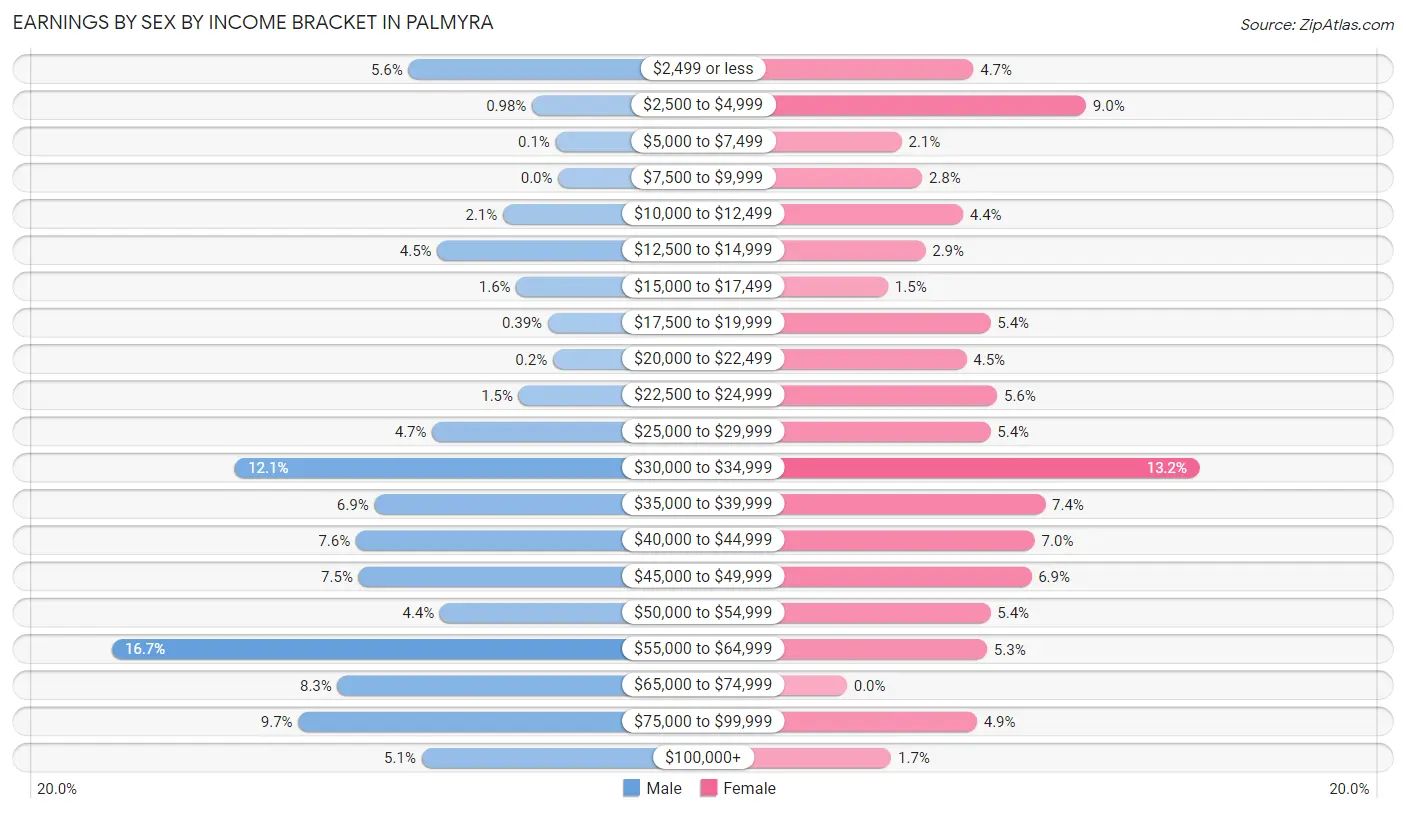
Earnings by Sex by Income Bracket in Palmyra
The most common earnings brackets in Palmyra are $55,000 to $64,999 for men (170 | 16.7%) and $30,000 to $34,999 for women (103 | 13.2%).
| Income | Male | Female |
| $2,499 or less | 57 (5.6%) | 37 (4.7%) |
| $2,500 to $4,999 | 10 (1.0%) | 70 (9.0%) |
| $5,000 to $7,499 | 1 (0.1%) | 16 (2.1%) |
| $7,500 to $9,999 | 0 (0.0%) | 22 (2.8%) |
| $10,000 to $12,499 | 21 (2.1%) | 34 (4.3%) |
| $12,500 to $14,999 | 46 (4.5%) | 23 (2.9%) |
| $15,000 to $17,499 | 16 (1.6%) | 12 (1.5%) |
| $17,500 to $19,999 | 4 (0.4%) | 42 (5.4%) |
| $20,000 to $22,499 | 2 (0.2%) | 35 (4.5%) |
| $22,500 to $24,999 | 15 (1.5%) | 44 (5.6%) |
| $25,000 to $29,999 | 48 (4.7%) | 42 (5.4%) |
| $30,000 to $34,999 | 123 (12.1%) | 103 (13.2%) |
| $35,000 to $39,999 | 70 (6.9%) | 58 (7.4%) |
| $40,000 to $44,999 | 77 (7.6%) | 55 (7.0%) |
| $45,000 to $49,999 | 76 (7.5%) | 54 (6.9%) |
| $50,000 to $54,999 | 45 (4.4%) | 42 (5.4%) |
| $55,000 to $64,999 | 170 (16.7%) | 41 (5.2%) |
| $65,000 to $74,999 | 84 (8.3%) | 0 (0.0%) |
| $75,000 to $99,999 | 99 (9.7%) | 38 (4.9%) |
| $100,000+ | 52 (5.1%) | 13 (1.7%) |
| Total | 1,016 (100.0%) | 781 (100.0%) |
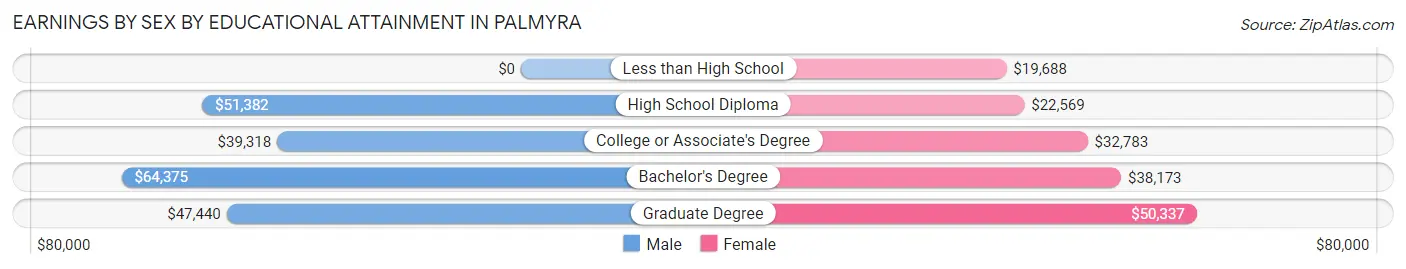
Earnings by Sex by Educational Attainment in Palmyra
Average earnings in Palmyra are $49,489 for men and $32,677 for women, a difference of 34.0%. Men with an educational attainment of bachelor's degree enjoy the highest average annual earnings of $64,375, while those with college or associate's degree education earn the least with $39,318. Women with an educational attainment of graduate degree earn the most with the average annual earnings of $50,337, while those with less than high school education have the smallest earnings of $19,688.
| Educational Attainment | Male Income | Female Income |
| Less than High School | - | - |
| High School Diploma | $51,382 | $22,569 |
| College or Associate's Degree | $39,318 | $32,783 |
| Bachelor's Degree | $64,375 | $38,173 |
| Graduate Degree | $47,440 | $50,337 |
| Total | $49,489 | $32,677 |
Family Income in Palmyra
Family Income Brackets in Palmyra
According to the Palmyra family income data, there are 214 families falling into the $50,000 to $74,999 income range, which is the most common income bracket and makes up 24.0% of all families.
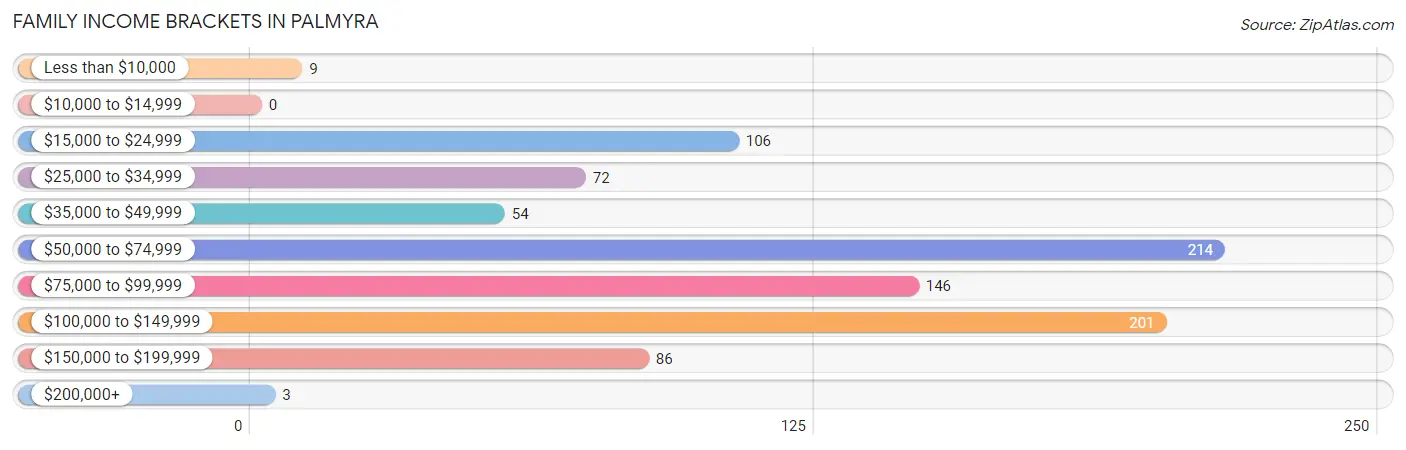
| Income Bracket | # Families | % Families |
| Less than $10,000 | 9 | 1.0% |
| $10,000 to $14,999 | 0 | 0.0% |
| $15,000 to $24,999 | 106 | 11.9% |
| $25,000 to $34,999 | 72 | 8.1% |
| $35,000 to $49,999 | 54 | 6.1% |
| $50,000 to $74,999 | 214 | 24.0% |
| $75,000 to $99,999 | 146 | 16.4% |
| $100,000 to $149,999 | 201 | 22.6% |
| $150,000 to $199,999 | 86 | 9.7% |
| $200,000+ | 3 | 0.3% |
Family Income by Famaliy Size in Palmyra
5-person families (52 | 5.8%) account for the highest median family income in Palmyra with $121,591 per family, while 2-person families (324 | 36.4%) have the highest median income of $32,110 per family member.
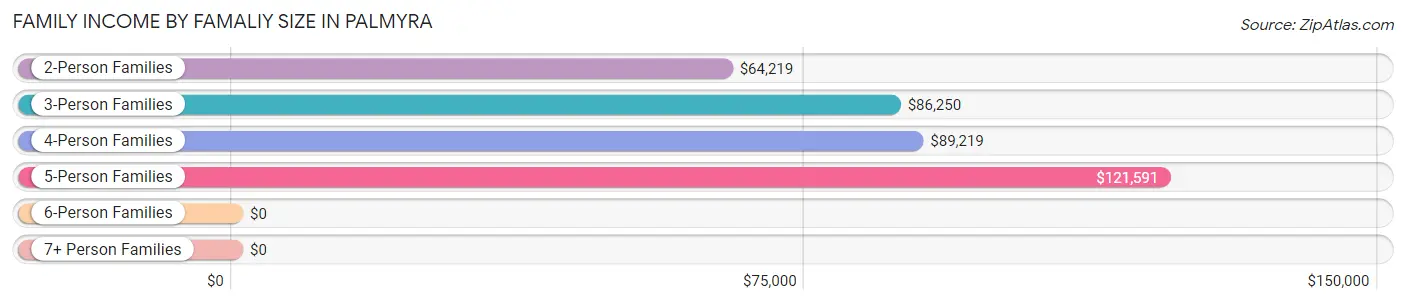
| Income Bracket | # Families | Median Income |
| 2-Person Families | 324 (36.4%) | $64,219 |
| 3-Person Families | 222 (24.9%) | $86,250 |
| 4-Person Families | 261 (29.3%) | $89,219 |
| 5-Person Families | 52 (5.8%) | $121,591 |
| 6-Person Families | 24 (2.7%) | $0 |
| 7+ Person Families | 8 (0.9%) | $0 |
| Total | 891 (100.0%) | $71,921 |
Family Income by Number of Earners in Palmyra
The median family income in Palmyra is $71,921, with families comprising 3+ earners (143) having the highest median family income of $121,705, while families with 1 earner (401) have the lowest median family income of $49,904, accounting for 16.1% and 45.0% of families, respectively.
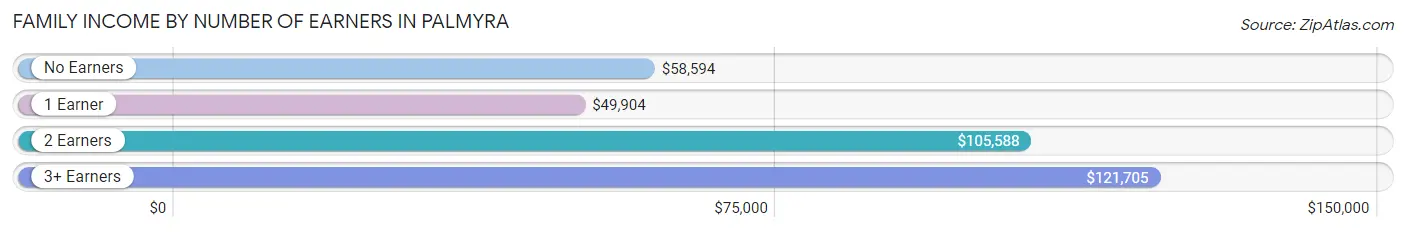
| Number of Earners | # Families | Median Income |
| No Earners | 73 (8.2%) | $58,594 |
| 1 Earner | 401 (45.0%) | $49,904 |
| 2 Earners | 274 (30.7%) | $105,588 |
| 3+ Earners | 143 (16.1%) | $121,705 |
| Total | 891 (100.0%) | $71,921 |
Household Income in Palmyra
Household Income Brackets in Palmyra
With 295 households falling in the category, the $50,000 to $74,999 income range is the most frequent in Palmyra, accounting for 20.6% of all households. In contrast, only 14 households (1.0%) fall into the $200,000+ income bracket, making it the least populous group.
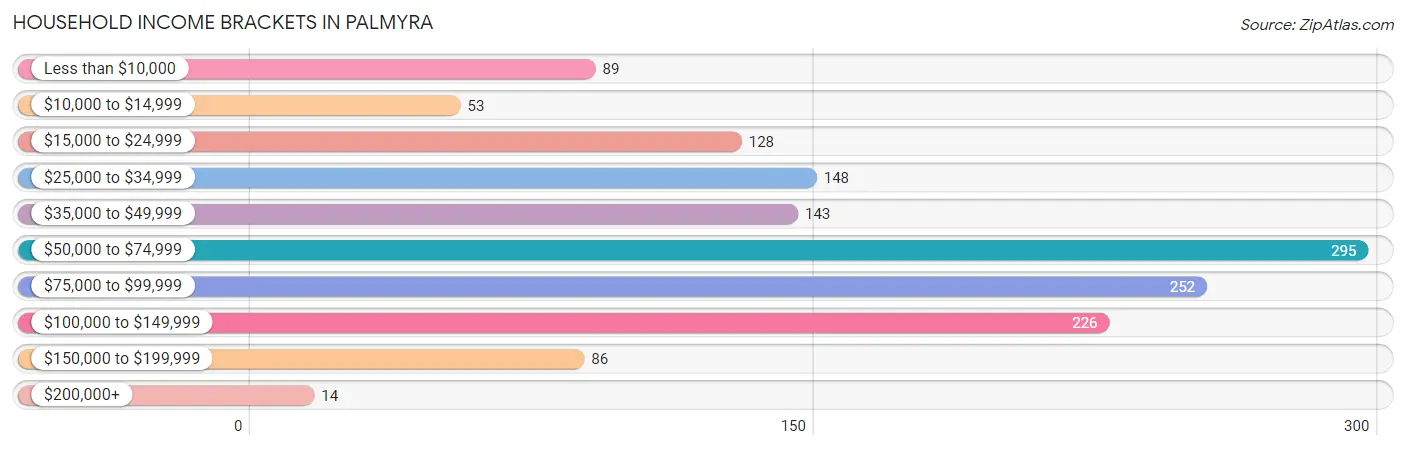
| Income Bracket | # Households | % Households |
| Less than $10,000 | 89 | 6.2% |
| $10,000 to $14,999 | 53 | 3.7% |
| $15,000 to $24,999 | 128 | 8.9% |
| $25,000 to $34,999 | 148 | 10.3% |
| $35,000 to $49,999 | 143 | 10.0% |
| $50,000 to $74,999 | 295 | 20.6% |
| $75,000 to $99,999 | 252 | 17.6% |
| $100,000 to $149,999 | 226 | 15.8% |
| $150,000 to $199,999 | 86 | 6.0% |
| $200,000+ | 14 | 1.0% |
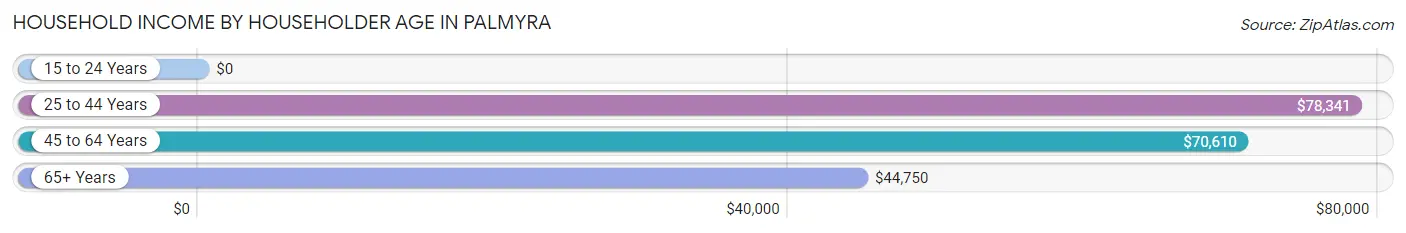
Household Income by Householder Age in Palmyra
The median household income in Palmyra is $60,694, with the highest median household income of $78,341 found in the 25 to 44 years age bracket for the primary householder. A total of 627 households (43.8%) fall into this category. Meanwhile, the 15 to 24 years age bracket for the primary householder has the lowest median household income of $0, with 29 households (2.0%) in this group.
| Income Bracket | # Households | Median Income |
| 15 to 24 Years | 29 (2.0%) | $0 |
| 25 to 44 Years | 627 (43.8%) | $78,341 |
| 45 to 64 Years | 362 (25.3%) | $70,610 |
| 65+ Years | 415 (29.0%) | $44,750 |
| Total | 1,433 (100.0%) | $60,694 |
Poverty in Palmyra
Income Below Poverty by Sex and Age in Palmyra
With 11.3% poverty level for males and 16.8% for females among the residents of Palmyra, 15 year old males and 5 year old females are the most vulnerable to poverty, with 27 males (100.0%) and 47 females (38.8%) in their respective age groups living below the poverty level.
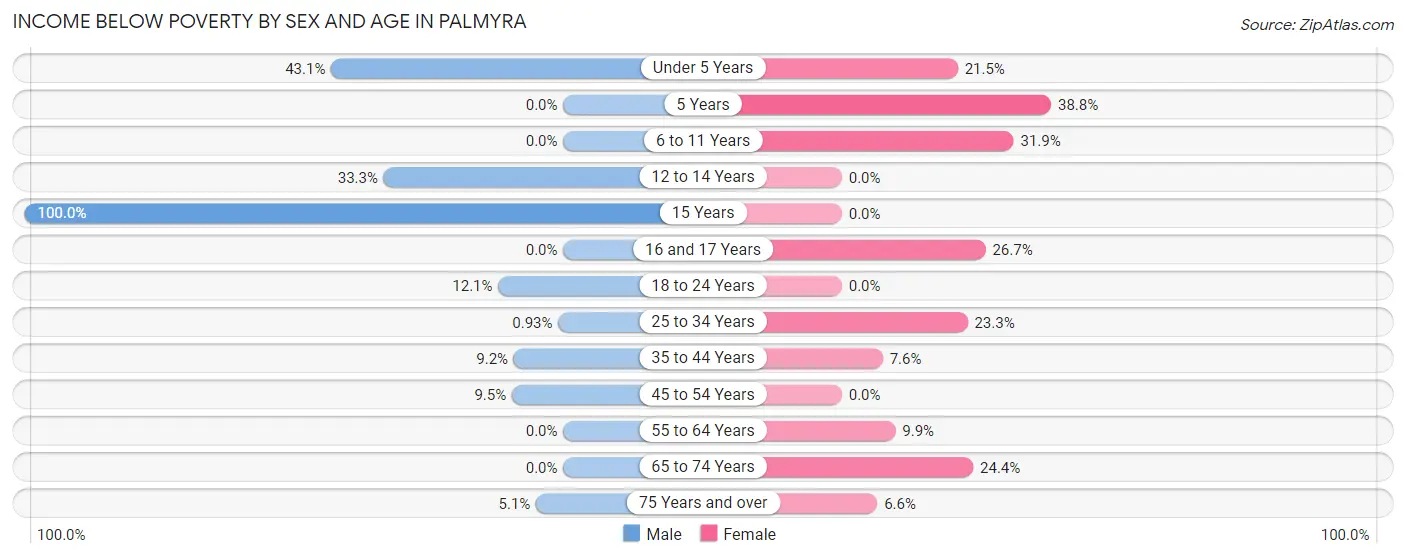
| Age Bracket | Male | Female |
| Under 5 Years | 56 (43.1%) | 37 (21.5%) |
| 5 Years | 0 (0.0%) | 47 (38.8%) |
| 6 to 11 Years | 0 (0.0%) | 44 (31.9%) |
| 12 to 14 Years | 28 (33.3%) | 0 (0.0%) |
| 15 Years | 27 (100.0%) | 0 (0.0%) |
| 16 and 17 Years | 0 (0.0%) | 8 (26.7%) |
| 18 to 24 Years | 24 (12.1%) | 0 (0.0%) |
| 25 to 34 Years | 2 (0.9%) | 70 (23.3%) |
| 35 to 44 Years | 32 (9.2%) | 20 (7.6%) |
| 45 to 54 Years | 16 (9.5%) | 0 (0.0%) |
| 55 to 64 Years | 0 (0.0%) | 16 (9.9%) |
| 65 to 74 Years | 0 (0.0%) | 48 (24.4%) |
| 75 Years and over | 5 (5.1%) | 9 (6.6%) |
| Total | 190 (11.3%) | 299 (16.8%) |
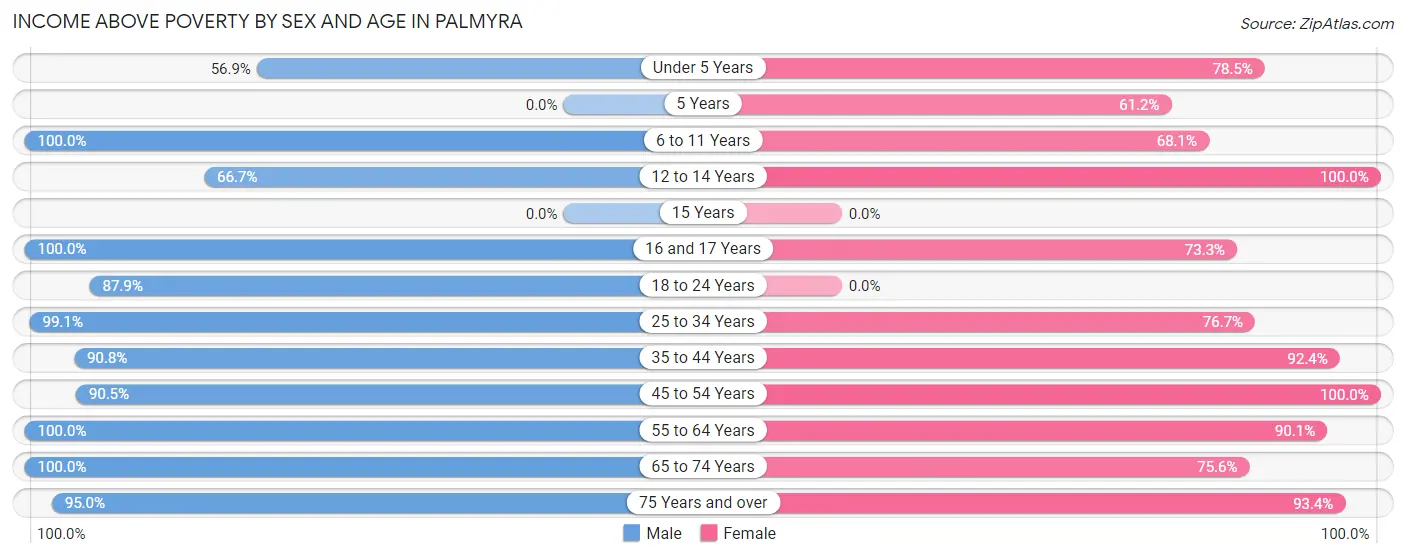
Income Above Poverty by Sex and Age in Palmyra
According to the poverty statistics in Palmyra, males aged 6 to 11 years and females aged 12 to 14 years are the age groups that are most secure financially, with 100.0% of males and 100.0% of females in these age groups living above the poverty line.
| Age Bracket | Male | Female |
| Under 5 Years | 74 (56.9%) | 135 (78.5%) |
| 5 Years | 0 (0.0%) | 74 (61.2%) |
| 6 to 11 Years | 116 (100.0%) | 94 (68.1%) |
| 12 to 14 Years | 56 (66.7%) | 108 (100.0%) |
| 15 Years | 0 (0.0%) | 0 (0.0%) |
| 16 and 17 Years | 45 (100.0%) | 22 (73.3%) |
| 18 to 24 Years | 175 (87.9%) | 0 (0.0%) |
| 25 to 34 Years | 213 (99.1%) | 230 (76.7%) |
| 35 to 44 Years | 317 (90.8%) | 243 (92.4%) |
| 45 to 54 Years | 152 (90.5%) | 149 (100.0%) |
| 55 to 64 Years | 137 (100.0%) | 145 (90.1%) |
| 65 to 74 Years | 119 (100.0%) | 149 (75.6%) |
| 75 Years and over | 94 (95.0%) | 128 (93.4%) |
| Total | 1,498 (88.7%) | 1,477 (83.2%) |
Income Below Poverty Among Married-Couple Families in Palmyra
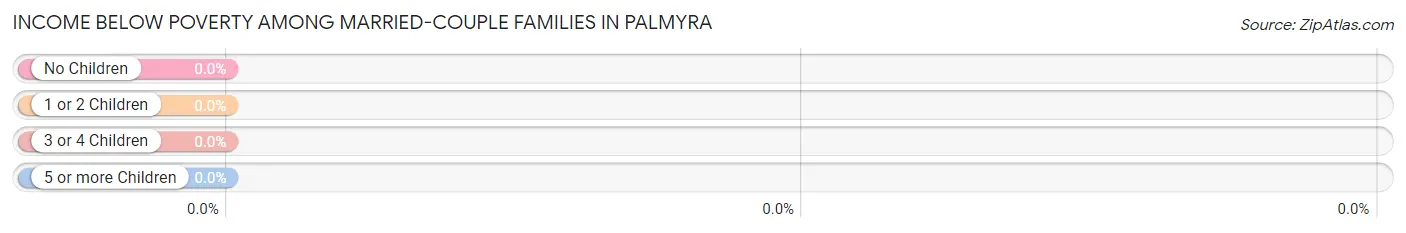
| Children | Above Poverty | Below Poverty |
| No Children | 338 (100.0%) | 0 (0.0%) |
| 1 or 2 Children | 205 (100.0%) | 0 (0.0%) |
| 3 or 4 Children | 59 (100.0%) | 0 (0.0%) |
| 5 or more Children | 0 (0.0%) | 0 (0.0%) |
| Total | 602 (100.0%) | 0 (0.0%) |
Income Below Poverty Among Single-Parent Households in Palmyra
According to the poverty data in Palmyra, 33.3% or 31 single-father households and 35.2% or 69 single-mother households are living below the poverty line. Among single-father households, those with 3 or 4 children have the highest poverty rate, with 31 households (75.6%) experiencing poverty. Likewise, among single-mother households, those with 3 or 4 children have the highest poverty rate, with 34 households (85.0%) falling below the poverty line.
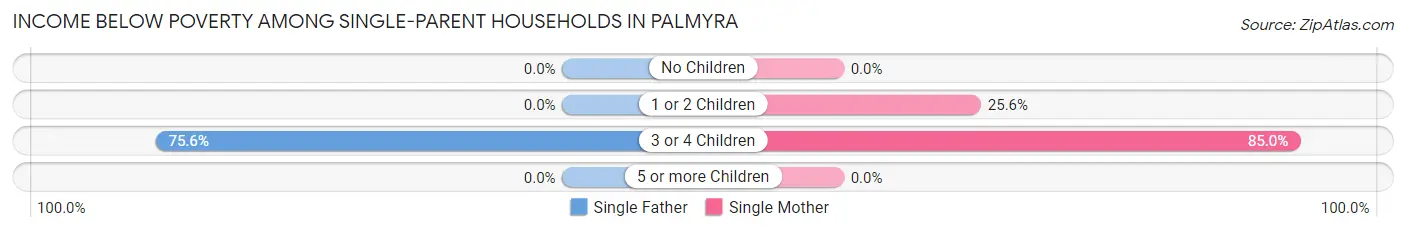
| Children | Single Father | Single Mother |
| No Children | 0 (0.0%) | 0 (0.0%) |
| 1 or 2 Children | 0 (0.0%) | 35 (25.6%) |
| 3 or 4 Children | 31 (75.6%) | 34 (85.0%) |
| 5 or more Children | 0 (0.0%) | 0 (0.0%) |
| Total | 31 (33.3%) | 69 (35.2%) |
Income Below Poverty Among Married-Couple vs Single-Parent Households in Palmyra
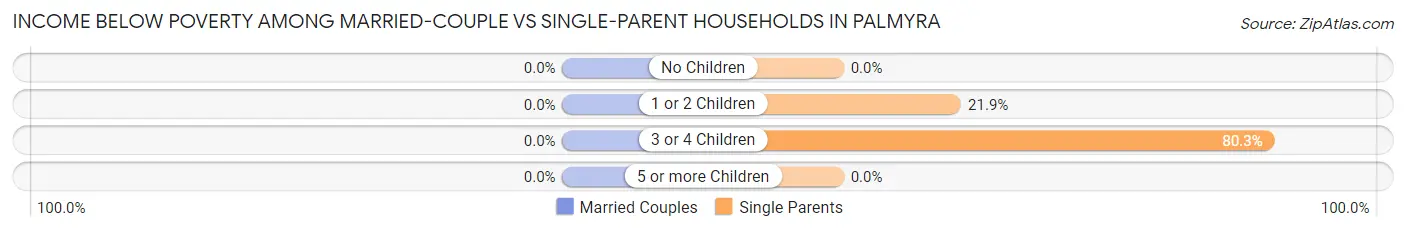
| Children | Married-Couple Families | Single-Parent Households |
| No Children | 0 (0.0%) | 0 (0.0%) |
| 1 or 2 Children | 0 (0.0%) | 35 (21.9%) |
| 3 or 4 Children | 0 (0.0%) | 65 (80.2%) |
| 5 or more Children | 0 (0.0%) | 0 (0.0%) |
| Total | 0 (0.0%) | 100 (34.6%) |
Race in Palmyra
The most populous races in Palmyra are White / Caucasian (3,020 | 83.6%), Two or more Races (361 | 10.0%), and Black / African American (187 | 5.2%).
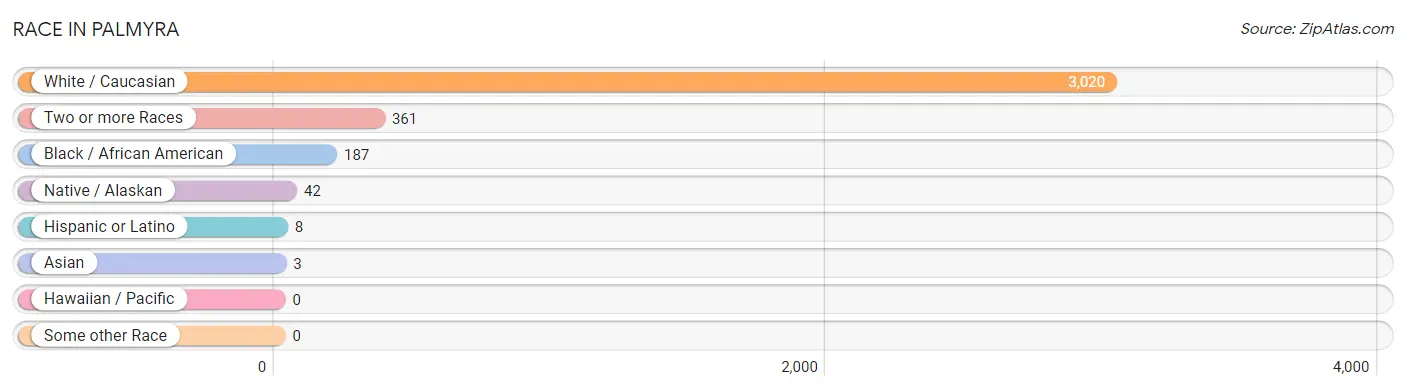
| Race | # Population | % Population |
| Asian | 3 | 0.1% |
| Black / African American | 187 | 5.2% |
| Hawaiian / Pacific | 0 | 0.0% |
| Hispanic or Latino | 8 | 0.2% |
| Native / Alaskan | 42 | 1.2% |
| White / Caucasian | 3,020 | 83.6% |
| Two or more Races | 361 | 10.0% |
| Some other Race | 0 | 0.0% |
| Total | 3,613 | 100.0% |
Ancestry in Palmyra
The most populous ancestries reported in Palmyra are German (1,033 | 28.6%), Irish (365 | 10.1%), English (341 | 9.4%), American (151 | 4.2%), and French (119 | 3.3%), together accounting for 55.6% of all Palmyra residents.
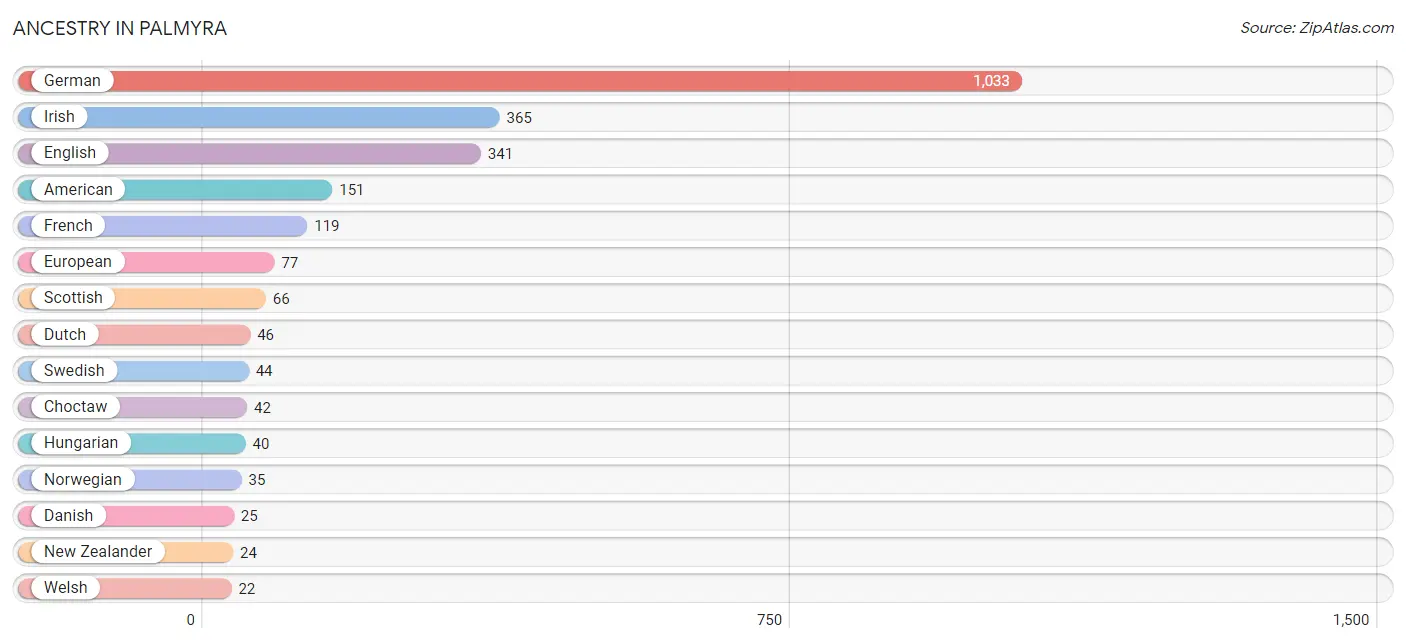
| Ancestry | # Population | % Population |
| American | 151 | 4.2% |
| British | 4 | 0.1% |
| Cherokee | 13 | 0.4% |
| Choctaw | 42 | 1.2% |
| Croatian | 11 | 0.3% |
| Danish | 25 | 0.7% |
| Dutch | 46 | 1.3% |
| English | 341 | 9.4% |
| European | 77 | 2.1% |
| Finnish | 3 | 0.1% |
| French | 119 | 3.3% |
| German | 1,033 | 28.6% |
| Greek | 2 | 0.1% |
| Hungarian | 40 | 1.1% |
| Irish | 365 | 10.1% |
| Italian | 2 | 0.1% |
| Korean | 13 | 0.4% |
| Mexican | 8 | 0.2% |
| New Zealander | 24 | 0.7% |
| Norwegian | 35 | 1.0% |
| Polish | 12 | 0.3% |
| Scottish | 66 | 1.8% |
| Sioux | 3 | 0.1% |
| Sri Lankan | 3 | 0.1% |
| Swedish | 44 | 1.2% |
| Welsh | 22 | 0.6% | View All 26 Rows |
Immigrants in Palmyra
The most numerous immigrant groups reported in Palmyra came from , and Oceania (24 | 0.7%), together accounting for 0.7% of all Palmyra residents.

| Immigration Origin | # Population | % Population |
| Oceania | 24 | 0.7% | View All 1 Rows |
Sex and Age in Palmyra
Sex and Age in Palmyra
The most populous age groups in Palmyra are 35 to 39 Years (220 | 12.2%) for men and 5 to 9 Years (244 | 13.5%) for women.
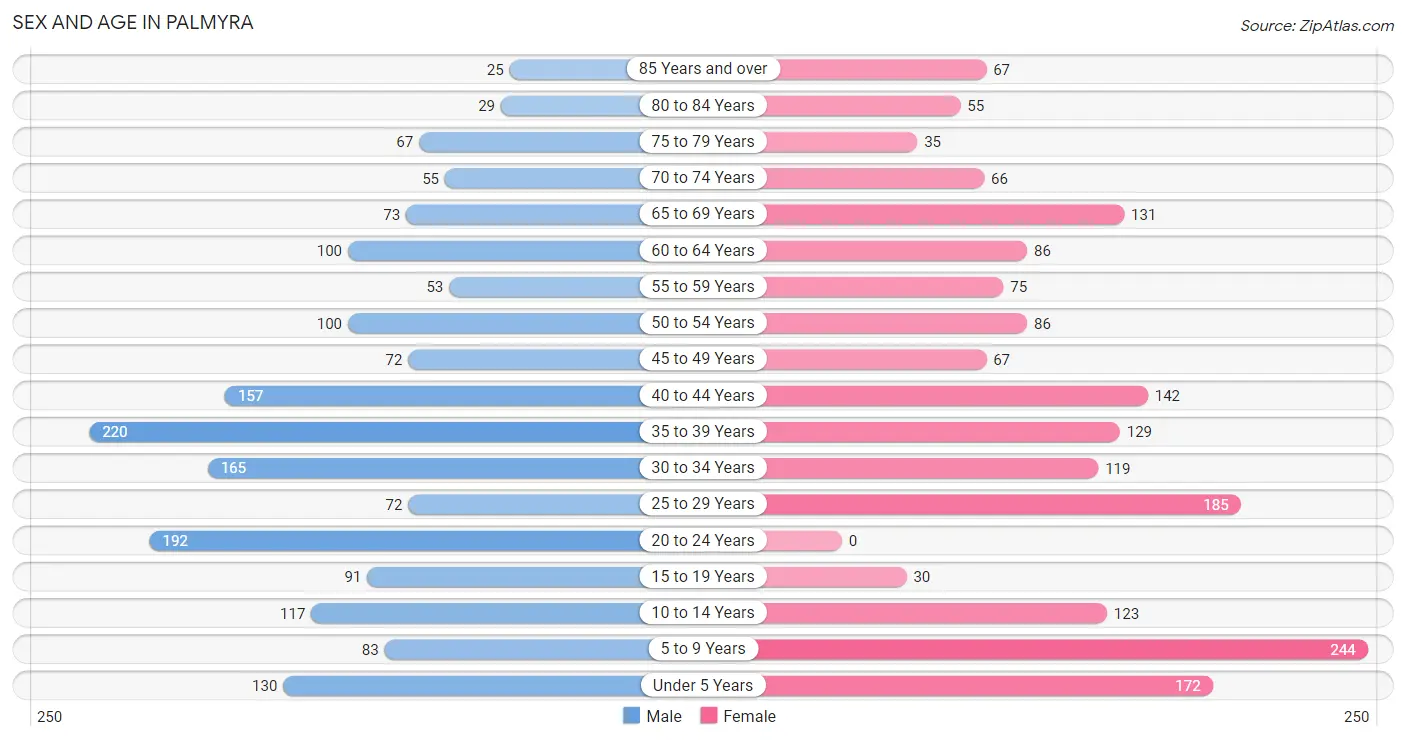
| Age Bracket | Male | Female |
| Under 5 Years | 130 (7.2%) | 172 (9.5%) |
| 5 to 9 Years | 83 (4.6%) | 244 (13.5%) |
| 10 to 14 Years | 117 (6.5%) | 123 (6.8%) |
| 15 to 19 Years | 91 (5.1%) | 30 (1.7%) |
| 20 to 24 Years | 192 (10.7%) | 0 (0.0%) |
| 25 to 29 Years | 72 (4.0%) | 185 (10.2%) |
| 30 to 34 Years | 165 (9.2%) | 119 (6.6%) |
| 35 to 39 Years | 220 (12.2%) | 129 (7.1%) |
| 40 to 44 Years | 157 (8.7%) | 142 (7.8%) |
| 45 to 49 Years | 72 (4.0%) | 67 (3.7%) |
| 50 to 54 Years | 100 (5.6%) | 86 (4.8%) |
| 55 to 59 Years | 53 (2.9%) | 75 (4.1%) |
| 60 to 64 Years | 100 (5.6%) | 86 (4.8%) |
| 65 to 69 Years | 73 (4.1%) | 131 (7.2%) |
| 70 to 74 Years | 55 (3.0%) | 66 (3.6%) |
| 75 to 79 Years | 67 (3.7%) | 35 (1.9%) |
| 80 to 84 Years | 29 (1.6%) | 55 (3.0%) |
| 85 Years and over | 25 (1.4%) | 67 (3.7%) |
| Total | 1,801 (100.0%) | 1,812 (100.0%) |
Families and Households in Palmyra
Median Family Size in Palmyra
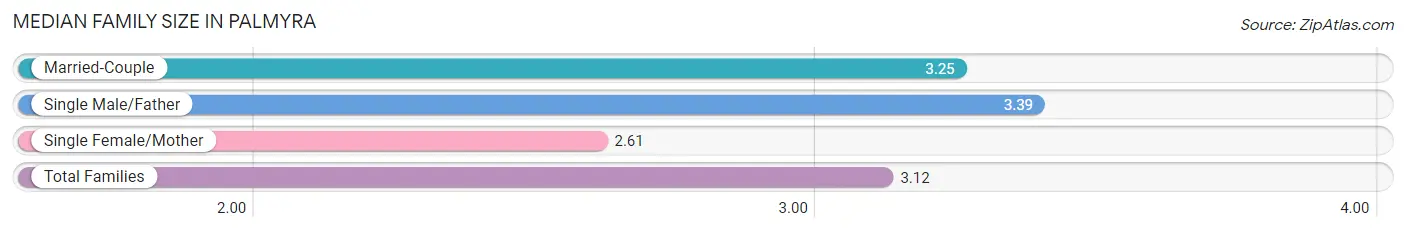
The median family size in Palmyra is 3.12 persons per family, with single male/father families (93 | 10.4%) accounting for the largest median family size of 3.39 persons per family. On the other hand, single female/mother families (196 | 22.0%) represent the smallest median family size with 2.61 persons per family.
| Family Type | # Families | Family Size |
| Married-Couple | 602 (67.6%) | 3.25 |
| Single Male/Father | 93 (10.4%) | 3.39 |
| Single Female/Mother | 196 (22.0%) | 2.61 |
| Total Families | 891 (100.0%) | 3.12 |
Median Household Size in Palmyra
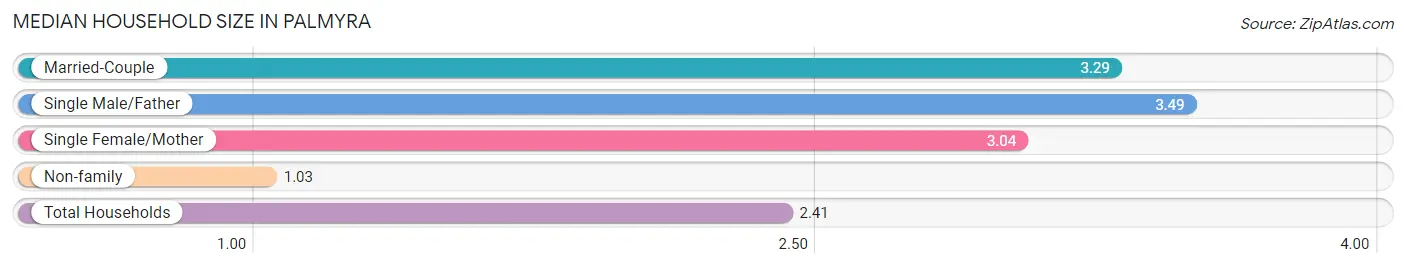
The median household size in Palmyra is 2.41 persons per household, with single male/father households (93 | 6.5%) accounting for the largest median household size of 3.49 persons per household. non-family households (542 | 37.8%) represent the smallest median household size with 1.03 persons per household.
| Household Type | # Households | Household Size |
| Married-Couple | 602 (42.0%) | 3.29 |
| Single Male/Father | 93 (6.5%) | 3.49 |
| Single Female/Mother | 196 (13.7%) | 3.04 |
| Non-family | 542 (37.8%) | 1.03 |
| Total Households | 1,433 (100.0%) | 2.41 |
Household Size by Marriage Status in Palmyra
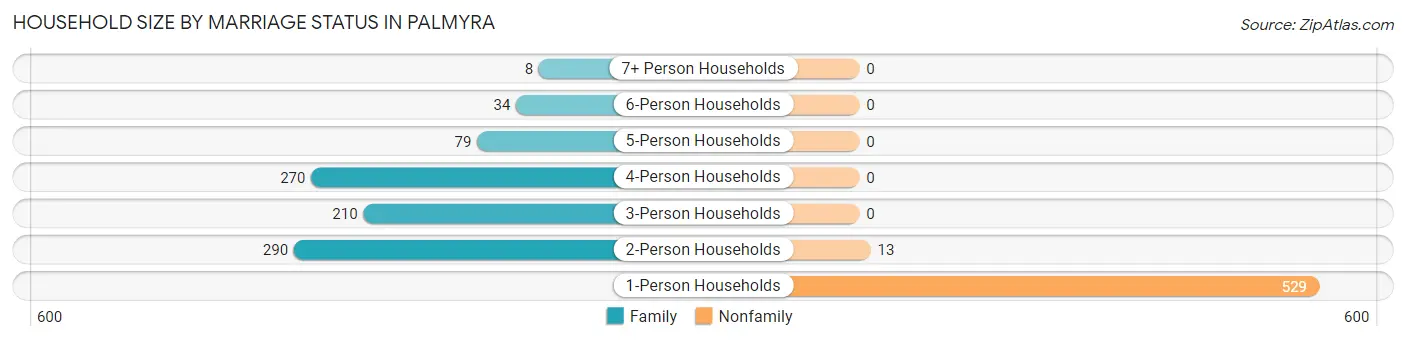
Out of a total of 1,433 households in Palmyra, 891 (62.2%) are family households, while 542 (37.8%) are nonfamily households. The most numerous type of family households are 2-person households, comprising 290, and the most common type of nonfamily households are 1-person households, comprising 529.
| Household Size | Family Households | Nonfamily Households |
| 1-Person Households | - | 529 (36.9%) |
| 2-Person Households | 290 (20.2%) | 13 (0.9%) |
| 3-Person Households | 210 (14.6%) | 0 (0.0%) |
| 4-Person Households | 270 (18.8%) | 0 (0.0%) |
| 5-Person Households | 79 (5.5%) | 0 (0.0%) |
| 6-Person Households | 34 (2.4%) | 0 (0.0%) |
| 7+ Person Households | 8 (0.6%) | 0 (0.0%) |
| Total | 891 (62.2%) | 542 (37.8%) |
Female Fertility in Palmyra
Fertility by Age in Palmyra
Average fertility rate in Palmyra is 94.0 births per 1,000 women. Women in the age bracket of 20 to 34 years have the highest fertility rate with 148.0 births per 1,000 women. Women in the age bracket of 20 to 34 years acount for 69.2% of all women with births.
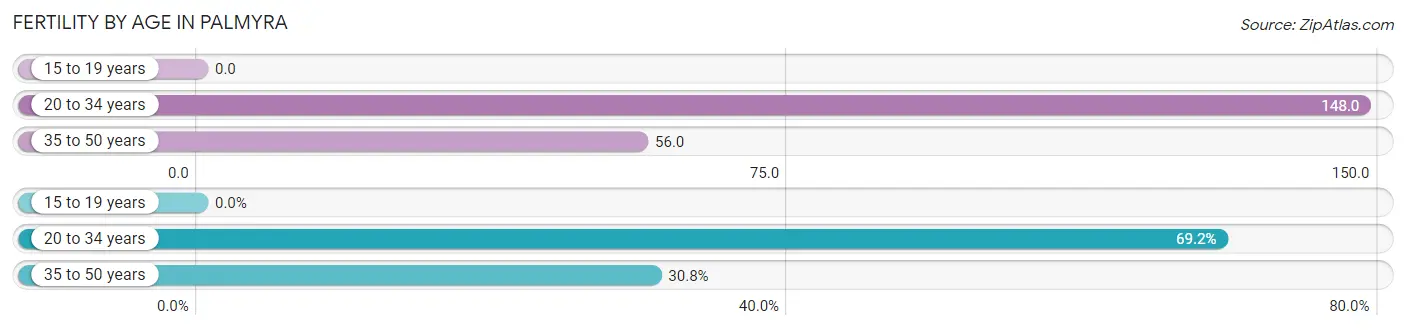
| Age Bracket | Women with Births | Births / 1,000 Women |
| 15 to 19 years | 0 (0.0%) | 0.0 |
| 20 to 34 years | 45 (69.2%) | 148.0 |
| 35 to 50 years | 20 (30.8%) | 56.0 |
| Total | 65 (100.0%) | 94.0 |
Fertility by Age by Marriage Status in Palmyra
33.8% of women with births (65) in Palmyra are married. The highest percentage of unmarried women with births falls into 20 to 34 years age bracket with 75.6% of them unmarried at the time of birth, while the lowest percentage of unmarried women with births belong to 35 to 50 years age bracket with 45.0% of them unmarried.
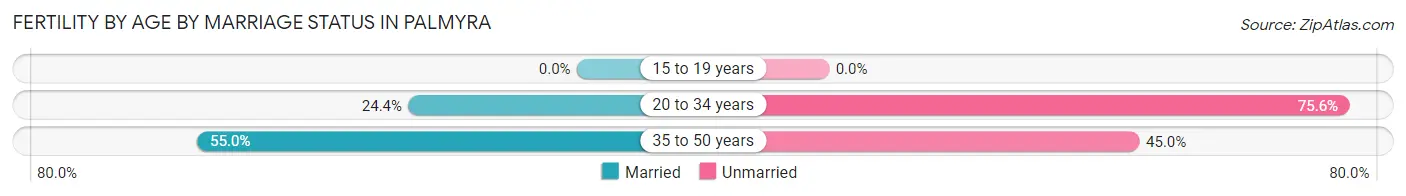
| Age Bracket | Married | Unmarried |
| 15 to 19 years | 0 (0.0%) | 0 (0.0%) |
| 20 to 34 years | 11 (24.4%) | 34 (75.6%) |
| 35 to 50 years | 11 (55.0%) | 9 (45.0%) |
| Total | 22 (33.9%) | 43 (66.1%) |
Fertility by Education in Palmyra
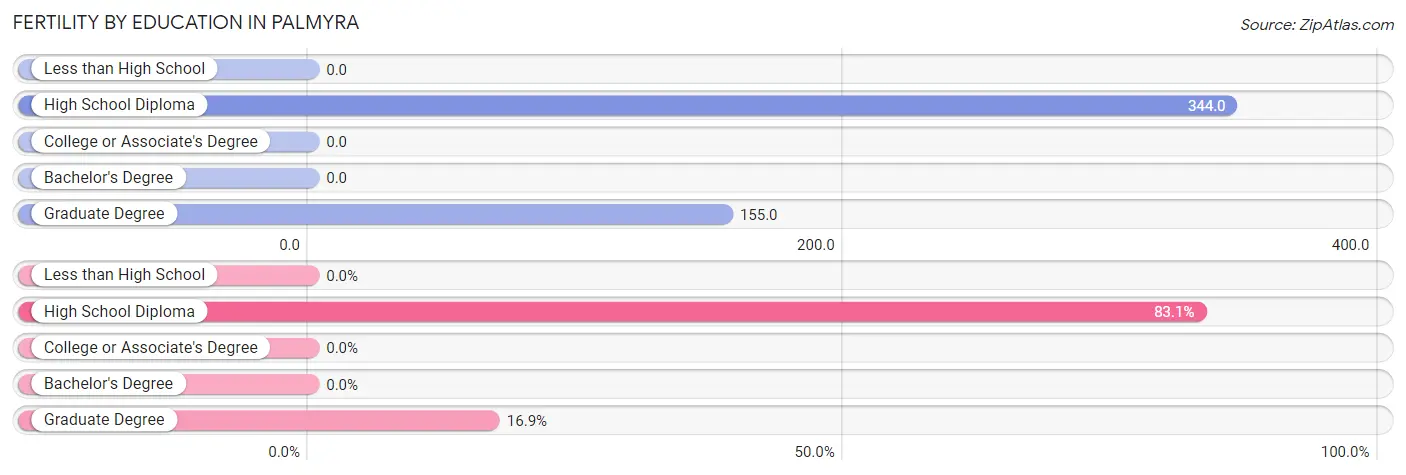
| Educational Attainment | Women with Births | Births / 1,000 Women |
| Less than High School | 0 (0.0%) | 0.0 |
| High School Diploma | 54 (83.1%) | 344.0 |
| College or Associate's Degree | 0 (0.0%) | 0.0 |
| Bachelor's Degree | 0 (0.0%) | 0.0 |
| Graduate Degree | 11 (16.9%) | 155.0 |
| Total | 65 (100.0%) | 94.0 |
Fertility by Education by Marriage Status in Palmyra
66.1% of women with births in Palmyra are unmarried. Women with the educational attainment of graduate degree are most likely to be married with 100.0% of them married at childbirth, while women with the educational attainment of high school diploma are least likely to be married with 79.6% of them unmarried at childbirth.
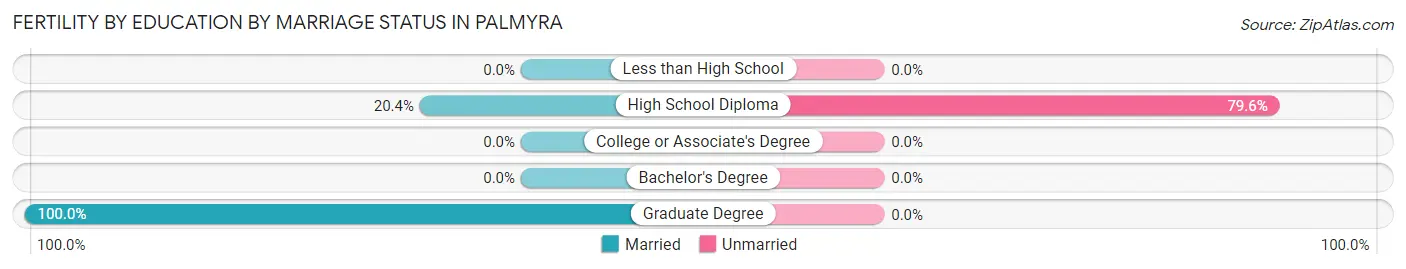
| Educational Attainment | Married | Unmarried |
| Less than High School | 0 (0.0%) | 0 (0.0%) |
| High School Diploma | 11 (20.4%) | 43 (79.6%) |
| College or Associate's Degree | 0 (0.0%) | 0 (0.0%) |
| Bachelor's Degree | 0 (0.0%) | 0 (0.0%) |
| Graduate Degree | 11 (100.0%) | 0 (0.0%) |
| Total | 22 (33.9%) | 43 (66.1%) |
Employment Characteristics in Palmyra
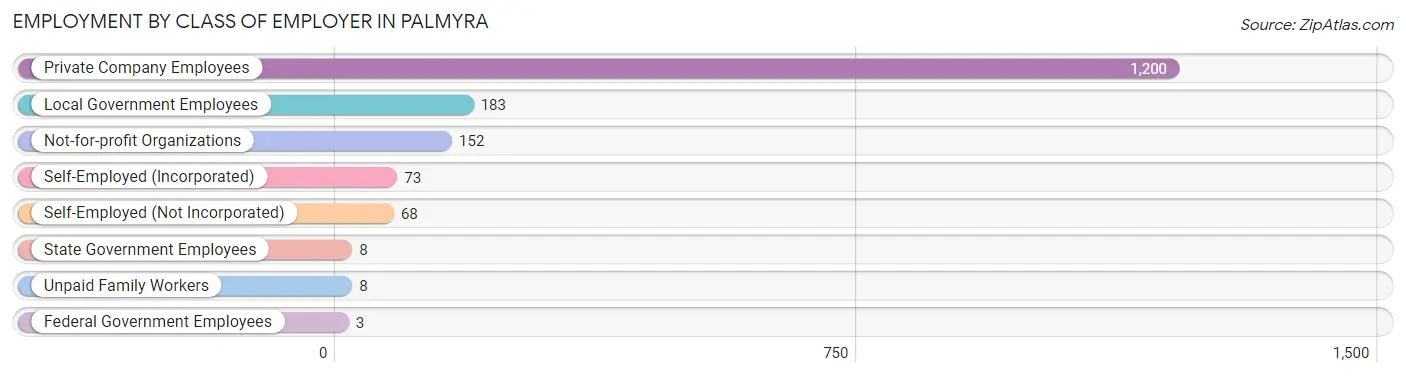
Employment by Class of Employer in Palmyra
Among the 1,695 employed individuals in Palmyra, private company employees (1,200 | 70.8%), local government employees (183 | 10.8%), and not-for-profit organizations (152 | 9.0%) make up the most common classes of employment.
| Employer Class | # Employees | % Employees |
| Private Company Employees | 1,200 | 70.8% |
| Self-Employed (Incorporated) | 73 | 4.3% |
| Self-Employed (Not Incorporated) | 68 | 4.0% |
| Not-for-profit Organizations | 152 | 9.0% |
| Local Government Employees | 183 | 10.8% |
| State Government Employees | 8 | 0.5% |
| Federal Government Employees | 3 | 0.2% |
| Unpaid Family Workers | 8 | 0.5% |
| Total | 1,695 | 100.0% |
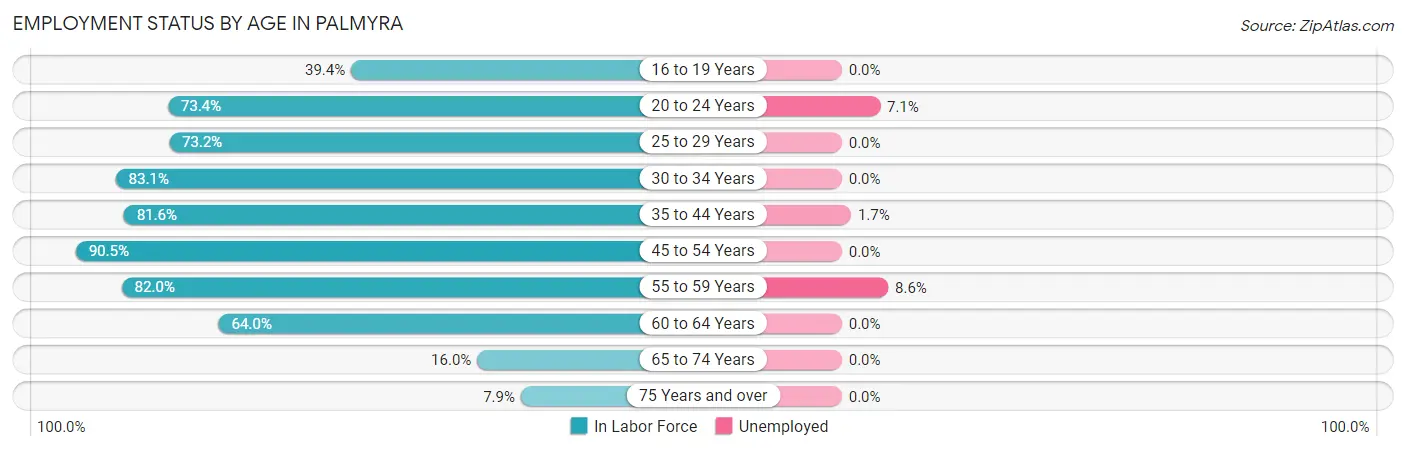
Employment Status by Age in Palmyra
According to the labor force statistics for Palmyra, out of the total population over 16 years of age (2,717), 63.4% or 1,723 individuals are in the labor force, with 1.6% or 28 of them unemployed. The age group with the highest labor force participation rate is 45 to 54 years, with 90.5% or 294 individuals in the labor force. Within the labor force, the 55 to 59 years age range has the highest percentage of unemployed individuals, with 8.6% or 9 of them being unemployed.
| Age Bracket | In Labor Force | Unemployed |
| 16 to 19 Years | 37 (39.4%) | 0 (0.0%) |
| 20 to 24 Years | 141 (73.4%) | 10 (7.1%) |
| 25 to 29 Years | 188 (73.2%) | 0 (0.0%) |
| 30 to 34 Years | 236 (83.1%) | 0 (0.0%) |
| 35 to 44 Years | 529 (81.6%) | 9 (1.7%) |
| 45 to 54 Years | 294 (90.5%) | 0 (0.0%) |
| 55 to 59 Years | 105 (82.0%) | 9 (8.6%) |
| 60 to 64 Years | 119 (64.0%) | 0 (0.0%) |
| 65 to 74 Years | 52 (16.0%) | 0 (0.0%) |
| 75 Years and over | 22 (7.9%) | 0 (0.0%) |
| Total | 1,723 (63.4%) | 28 (1.6%) |
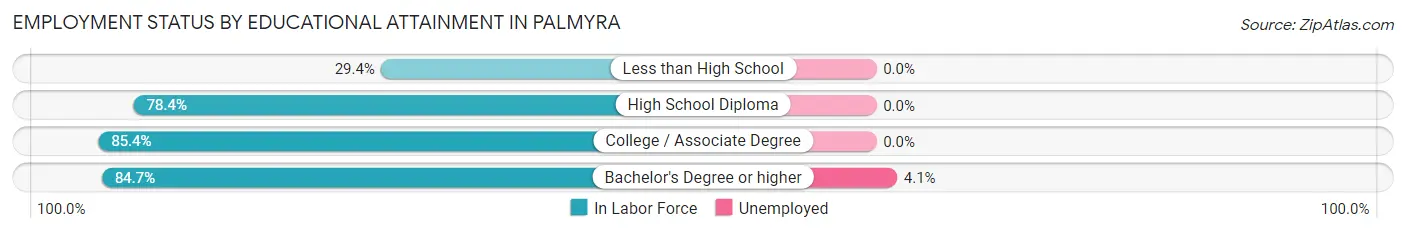
Employment Status by Educational Attainment in Palmyra
According to labor force statistics for Palmyra, 80.5% of individuals (1,472) out of the total population between 25 and 64 years of age (1,828) are in the labor force, with 1.2% or 18 of them being unemployed. The group with the highest labor force participation rate are those with the educational attainment of college / associate degree, with 85.4% or 573 individuals in the labor force. Within the labor force, individuals with bachelor's degree or higher education have the highest percentage of unemployment, with 4.1% or 18 of them being unemployed.
| Educational Attainment | In Labor Force | Unemployed |
| Less than High School | 25 (29.4%) | 0 (0.0%) |
| High School Diploma | 436 (78.4%) | 0 (0.0%) |
| College / Associate Degree | 573 (85.4%) | 0 (0.0%) |
| Bachelor's Degree or higher | 437 (84.7%) | 21 (4.1%) |
| Total | 1,472 (80.5%) | 22 (1.2%) |
Employment Occupations by Sex in Palmyra
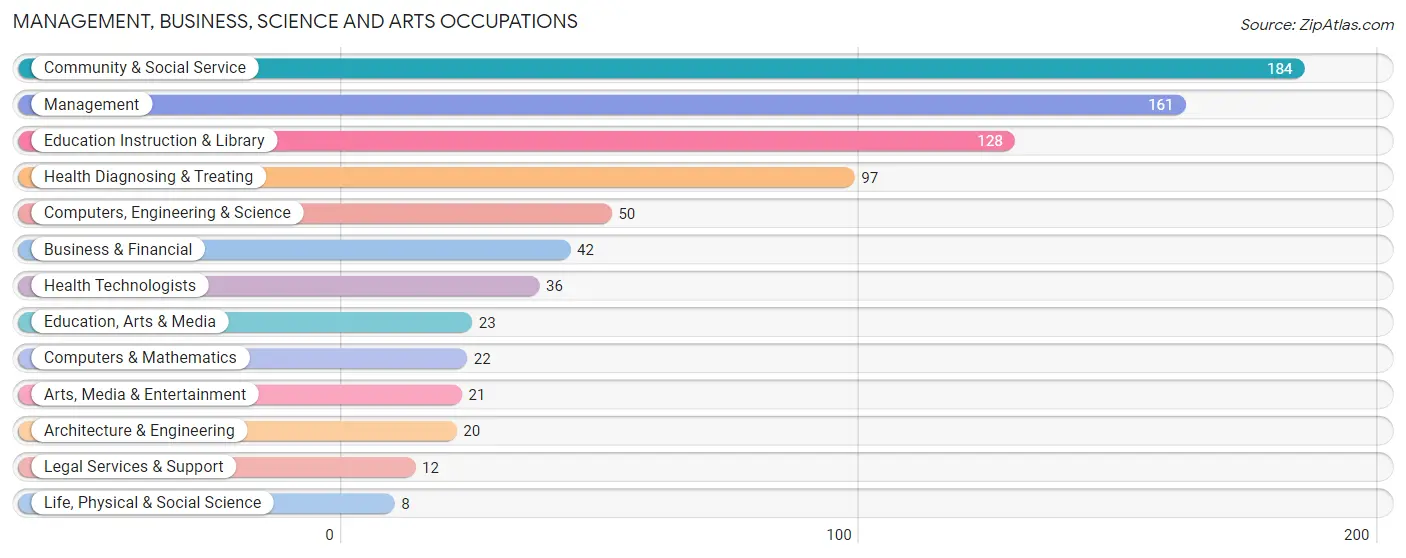
Management, Business, Science and Arts Occupations
The most common Management, Business, Science and Arts occupations in Palmyra are Community & Social Service (184 | 10.9%), Management (161 | 9.5%), Education Instruction & Library (128 | 7.5%), Health Diagnosing & Treating (97 | 5.7%), and Computers, Engineering & Science (50 | 2.9%).
Management, Business, Science and Arts Occupations by Sex
Within the Management, Business, Science and Arts occupations in Palmyra, the most male-oriented occupations are Business & Financial (100.0%), Life, Physical & Social Science (100.0%), and Computers, Engineering & Science (60.0%), while the most female-oriented occupations are Legal Services & Support (100.0%), Health Technologists (100.0%), and Health Diagnosing & Treating (89.7%).
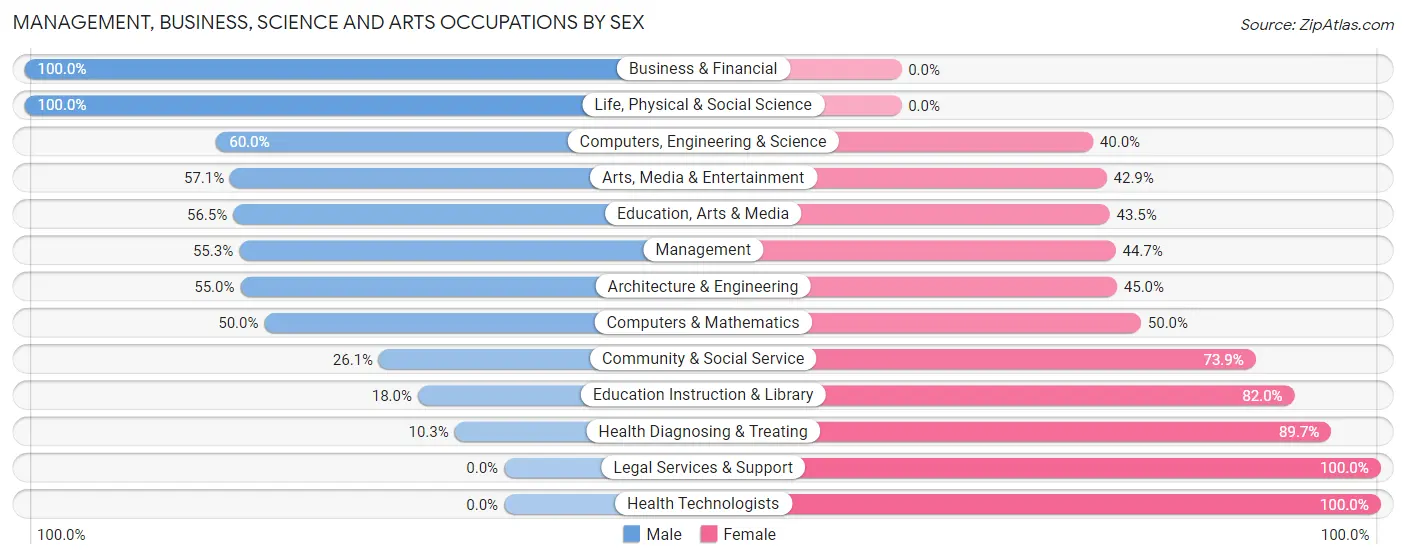
| Occupation | Male | Female |
| Management | 89 (55.3%) | 72 (44.7%) |
| Business & Financial | 42 (100.0%) | 0 (0.0%) |
| Computers, Engineering & Science | 30 (60.0%) | 20 (40.0%) |
| Computers & Mathematics | 11 (50.0%) | 11 (50.0%) |
| Architecture & Engineering | 11 (55.0%) | 9 (45.0%) |
| Life, Physical & Social Science | 8 (100.0%) | 0 (0.0%) |
| Community & Social Service | 48 (26.1%) | 136 (73.9%) |
| Education, Arts & Media | 13 (56.5%) | 10 (43.5%) |
| Legal Services & Support | 0 (0.0%) | 12 (100.0%) |
| Education Instruction & Library | 23 (18.0%) | 105 (82.0%) |
| Arts, Media & Entertainment | 12 (57.1%) | 9 (42.9%) |
| Health Diagnosing & Treating | 10 (10.3%) | 87 (89.7%) |
| Health Technologists | 0 (0.0%) | 36 (100.0%) |
| Total (Category) | 219 (41.0%) | 315 (59.0%) |
| Total (Overall) | 933 (55.0%) | 762 (45.0%) |
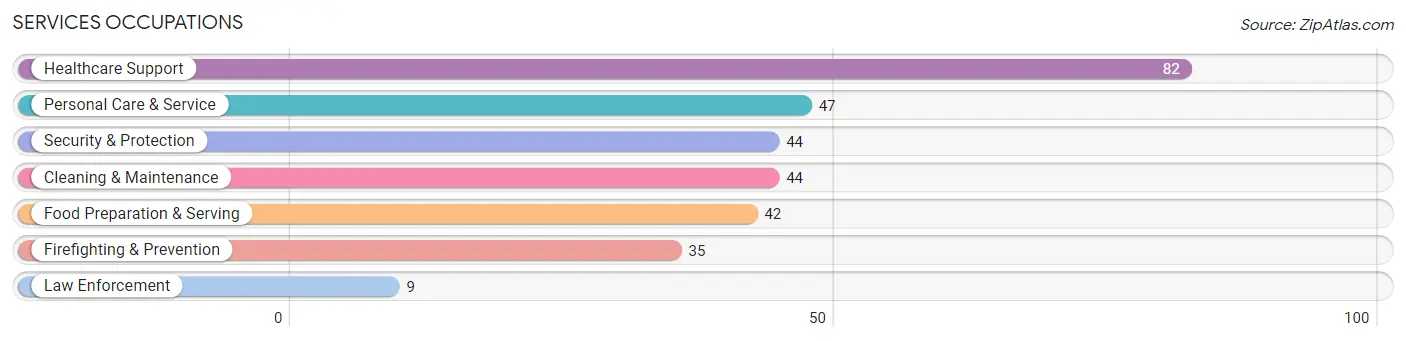
Services Occupations
The most common Services occupations in Palmyra are Healthcare Support (82 | 4.8%), Personal Care & Service (47 | 2.8%), Security & Protection (44 | 2.6%), Cleaning & Maintenance (44 | 2.6%), and Food Preparation & Serving (42 | 2.5%).
Services Occupations by Sex
Within the Services occupations in Palmyra, the most male-oriented occupations are Security & Protection (100.0%), Firefighting & Prevention (100.0%), and Law Enforcement (100.0%), while the most female-oriented occupations are Healthcare Support (100.0%), Food Preparation & Serving (100.0%), and Personal Care & Service (85.1%).
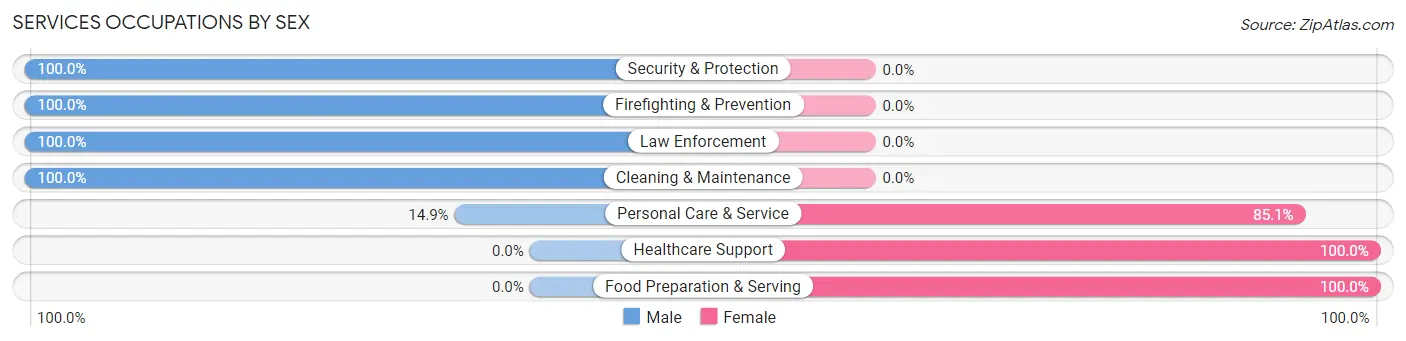
| Occupation | Male | Female |
| Healthcare Support | 0 (0.0%) | 82 (100.0%) |
| Security & Protection | 44 (100.0%) | 0 (0.0%) |
| Firefighting & Prevention | 35 (100.0%) | 0 (0.0%) |
| Law Enforcement | 9 (100.0%) | 0 (0.0%) |
| Food Preparation & Serving | 0 (0.0%) | 42 (100.0%) |
| Cleaning & Maintenance | 44 (100.0%) | 0 (0.0%) |
| Personal Care & Service | 7 (14.9%) | 40 (85.1%) |
| Total (Category) | 95 (36.7%) | 164 (63.3%) |
| Total (Overall) | 933 (55.0%) | 762 (45.0%) |
Sales and Office Occupations
The most common Sales and Office occupations in Palmyra are Sales & Related (233 | 13.8%), and Office & Administration (187 | 11.0%).
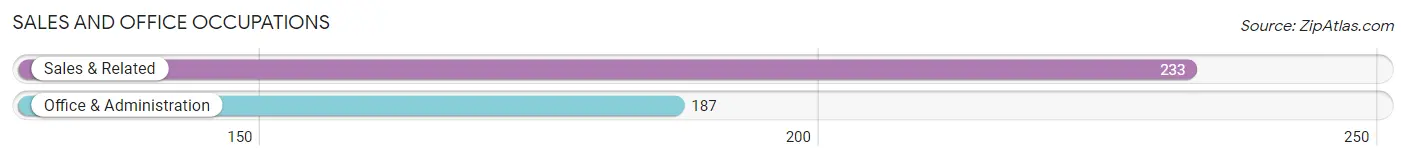
Sales and Office Occupations by Sex
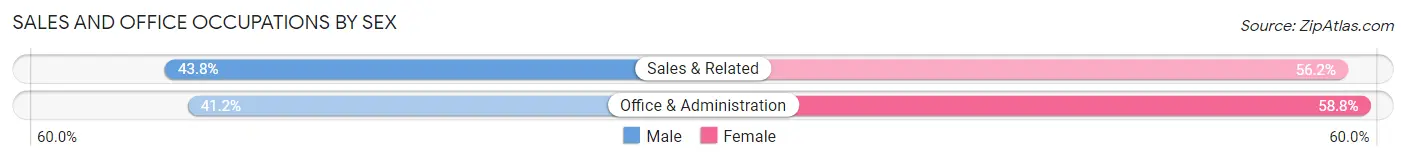
| Occupation | Male | Female |
| Sales & Related | 102 (43.8%) | 131 (56.2%) |
| Office & Administration | 77 (41.2%) | 110 (58.8%) |
| Total (Category) | 179 (42.6%) | 241 (57.4%) |
| Total (Overall) | 933 (55.0%) | 762 (45.0%) |
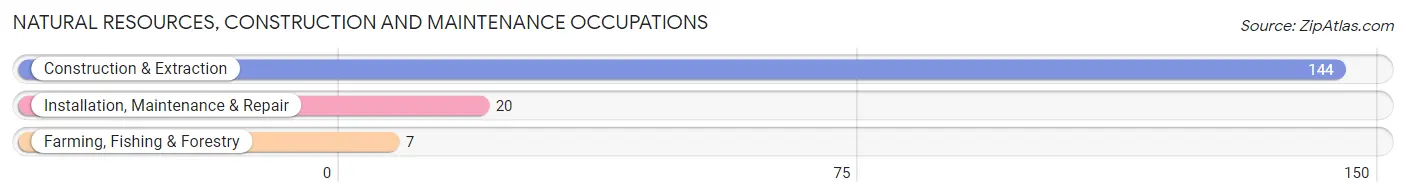
Natural Resources, Construction and Maintenance Occupations
The most common Natural Resources, Construction and Maintenance occupations in Palmyra are Construction & Extraction (144 | 8.5%), Installation, Maintenance & Repair (20 | 1.2%), and Farming, Fishing & Forestry (7 | 0.4%).
Natural Resources, Construction and Maintenance Occupations by Sex
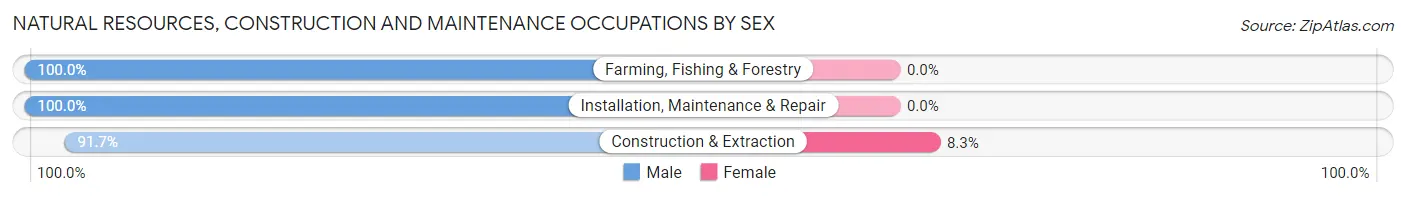
| Occupation | Male | Female |
| Farming, Fishing & Forestry | 7 (100.0%) | 0 (0.0%) |
| Construction & Extraction | 132 (91.7%) | 12 (8.3%) |
| Installation, Maintenance & Repair | 20 (100.0%) | 0 (0.0%) |
| Total (Category) | 159 (93.0%) | 12 (7.0%) |
| Total (Overall) | 933 (55.0%) | 762 (45.0%) |
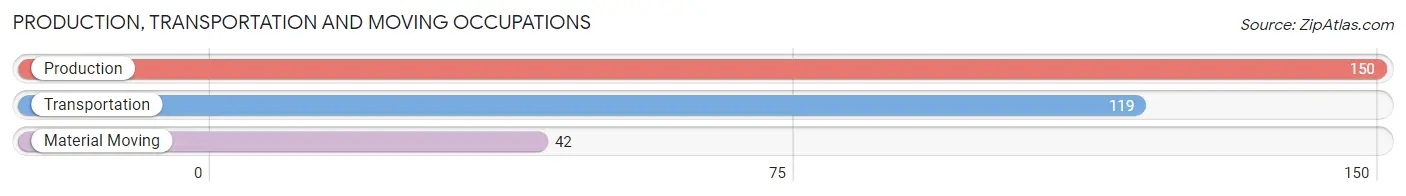
Production, Transportation and Moving Occupations
The most common Production, Transportation and Moving occupations in Palmyra are Production (150 | 8.8%), Transportation (119 | 7.0%), and Material Moving (42 | 2.5%).
Production, Transportation and Moving Occupations by Sex
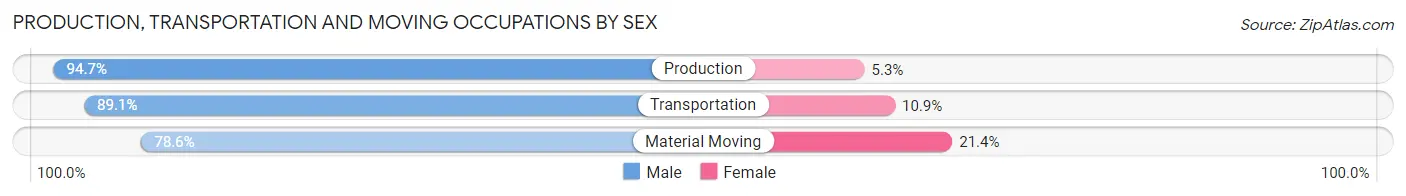
| Occupation | Male | Female |
| Production | 142 (94.7%) | 8 (5.3%) |
| Transportation | 106 (89.1%) | 13 (10.9%) |
| Material Moving | 33 (78.6%) | 9 (21.4%) |
| Total (Category) | 281 (90.3%) | 30 (9.7%) |
| Total (Overall) | 933 (55.0%) | 762 (45.0%) |
Employment Industries by Sex in Palmyra
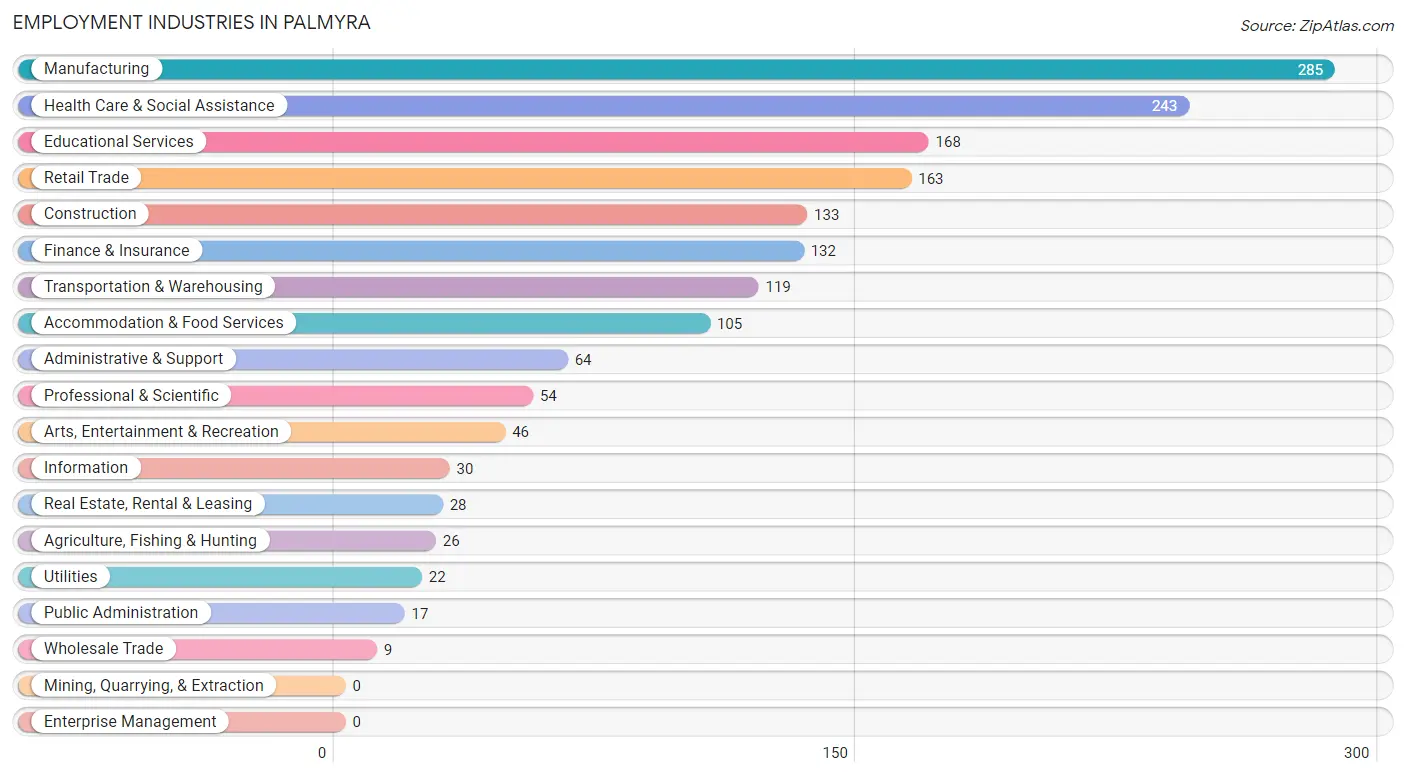
Employment Industries in Palmyra
The major employment industries in Palmyra include Manufacturing (285 | 16.8%), Health Care & Social Assistance (243 | 14.3%), Educational Services (168 | 9.9%), Retail Trade (163 | 9.6%), and Construction (133 | 7.9%).
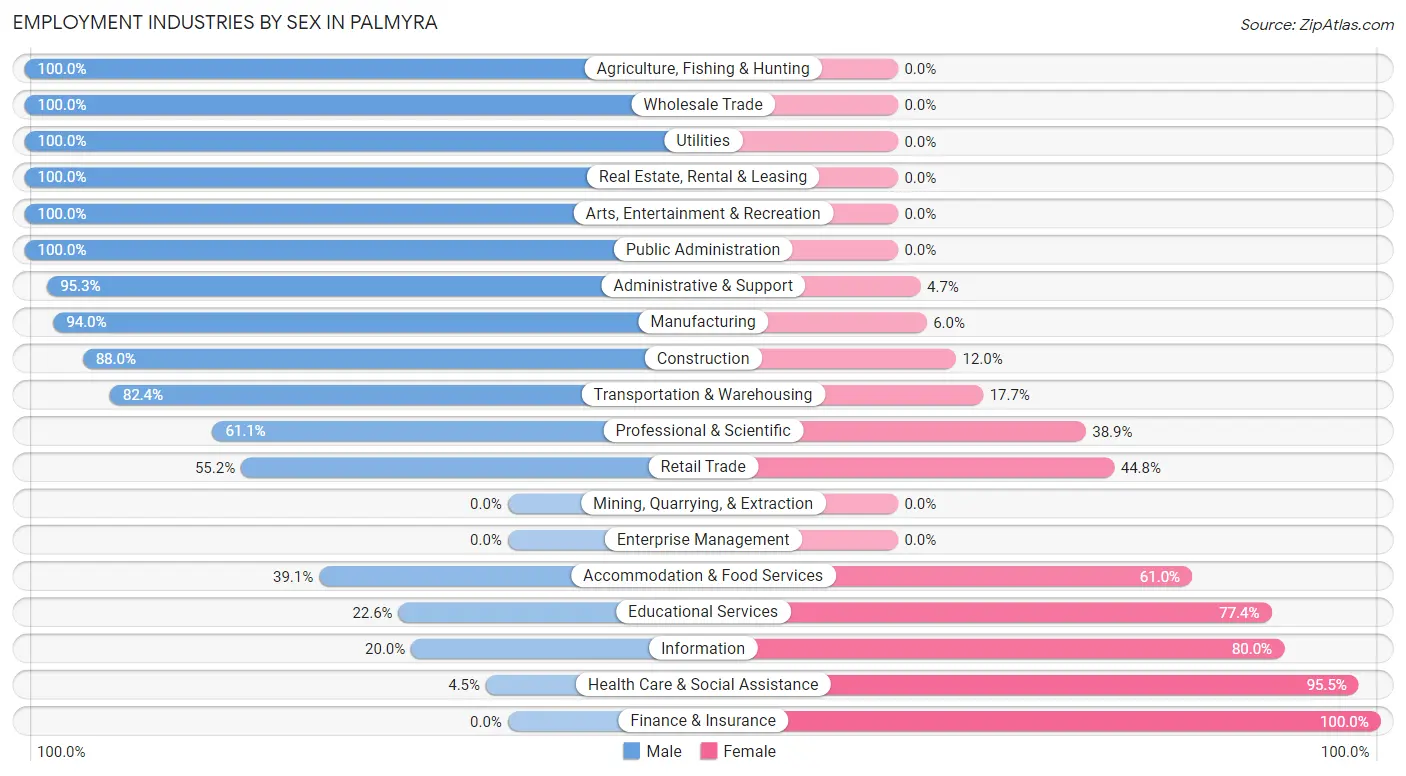
Employment Industries by Sex in Palmyra
The Palmyra industries that see more men than women are Agriculture, Fishing & Hunting (100.0%), Wholesale Trade (100.0%), and Utilities (100.0%), whereas the industries that tend to have a higher number of women are Finance & Insurance (100.0%), Health Care & Social Assistance (95.5%), and Information (80.0%).
| Industry | Male | Female |
| Agriculture, Fishing & Hunting | 26 (100.0%) | 0 (0.0%) |
| Mining, Quarrying, & Extraction | 0 (0.0%) | 0 (0.0%) |
| Construction | 117 (88.0%) | 16 (12.0%) |
| Manufacturing | 268 (94.0%) | 17 (6.0%) |
| Wholesale Trade | 9 (100.0%) | 0 (0.0%) |
| Retail Trade | 90 (55.2%) | 73 (44.8%) |
| Transportation & Warehousing | 98 (82.4%) | 21 (17.6%) |
| Utilities | 22 (100.0%) | 0 (0.0%) |
| Information | 6 (20.0%) | 24 (80.0%) |
| Finance & Insurance | 0 (0.0%) | 132 (100.0%) |
| Real Estate, Rental & Leasing | 28 (100.0%) | 0 (0.0%) |
| Professional & Scientific | 33 (61.1%) | 21 (38.9%) |
| Enterprise Management | 0 (0.0%) | 0 (0.0%) |
| Administrative & Support | 61 (95.3%) | 3 (4.7%) |
| Educational Services | 38 (22.6%) | 130 (77.4%) |
| Health Care & Social Assistance | 11 (4.5%) | 232 (95.5%) |
| Arts, Entertainment & Recreation | 46 (100.0%) | 0 (0.0%) |
| Accommodation & Food Services | 41 (39.1%) | 64 (61.0%) |
| Public Administration | 17 (100.0%) | 0 (0.0%) |
| Total | 933 (55.0%) | 762 (45.0%) |
Education in Palmyra
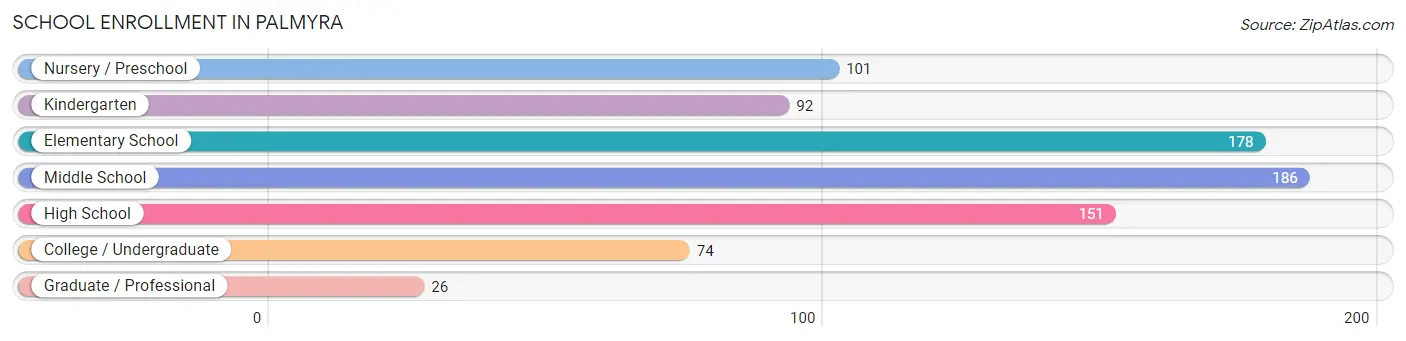
School Enrollment in Palmyra
The most common levels of schooling among the 808 students in Palmyra are middle school (186 | 23.0%), elementary school (178 | 22.0%), and high school (151 | 18.7%).
| School Level | # Students | % Students |
| Nursery / Preschool | 101 | 12.5% |
| Kindergarten | 92 | 11.4% |
| Elementary School | 178 | 22.0% |
| Middle School | 186 | 23.0% |
| High School | 151 | 18.7% |
| College / Undergraduate | 74 | 9.2% |
| Graduate / Professional | 26 | 3.2% |
| Total | 808 | 100.0% |
School Enrollment by Age by Funding Source in Palmyra
Out of a total of 808 students who are enrolled in schools in Palmyra, 64 (7.9%) attend a private institution, while the remaining 744 (92.1%) are enrolled in public schools. The age group of 25 to 34 year olds has the highest likelihood of being enrolled in private schools, with 41 (83.7% in the age bracket) enrolled. Conversely, the age group of 5 to 9 year old has the lowest likelihood of being enrolled in a private school, with 327 (100.0% in the age bracket) attending a public institution.
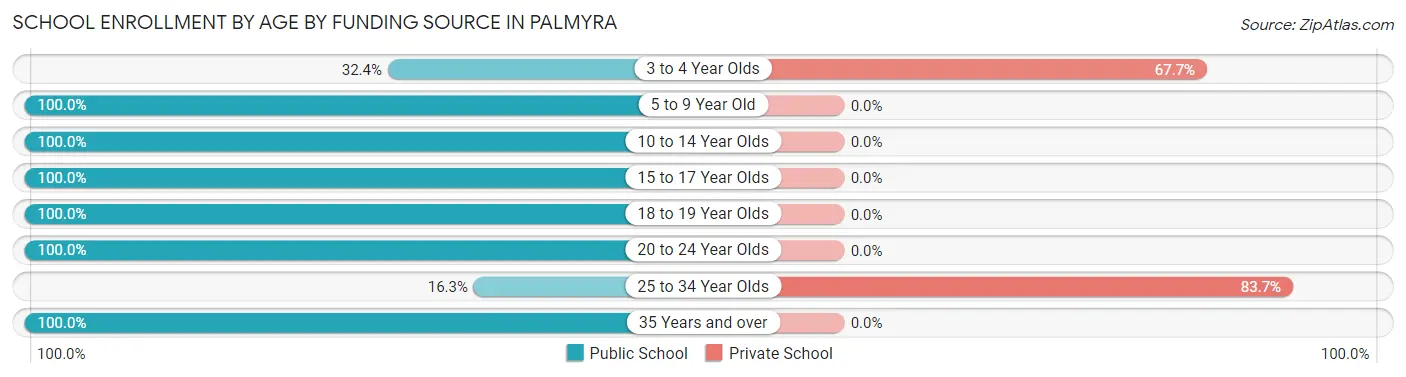
| Age Bracket | Public School | Private School |
| 3 to 4 Year Olds | 11 (32.4%) | 23 (67.6%) |
| 5 to 9 Year Old | 327 (100.0%) | 0 (0.0%) |
| 10 to 14 Year Olds | 240 (100.0%) | 0 (0.0%) |
| 15 to 17 Year Olds | 102 (100.0%) | 0 (0.0%) |
| 18 to 19 Year Olds | 5 (100.0%) | 0 (0.0%) |
| 20 to 24 Year Olds | 42 (100.0%) | 0 (0.0%) |
| 25 to 34 Year Olds | 8 (16.3%) | 41 (83.7%) |
| 35 Years and over | 9 (100.0%) | 0 (0.0%) |
| Total | 744 (92.1%) | 64 (7.9%) |
Educational Attainment by Field of Study in Palmyra
Business (216 | 33.8%), education (130 | 20.3%), science & technology (70 | 10.9%), arts & humanities (69 | 10.8%), and visual & performing arts (32 | 5.0%) are the most common fields of study among 640 individuals in Palmyra who have obtained a bachelor's degree or higher.
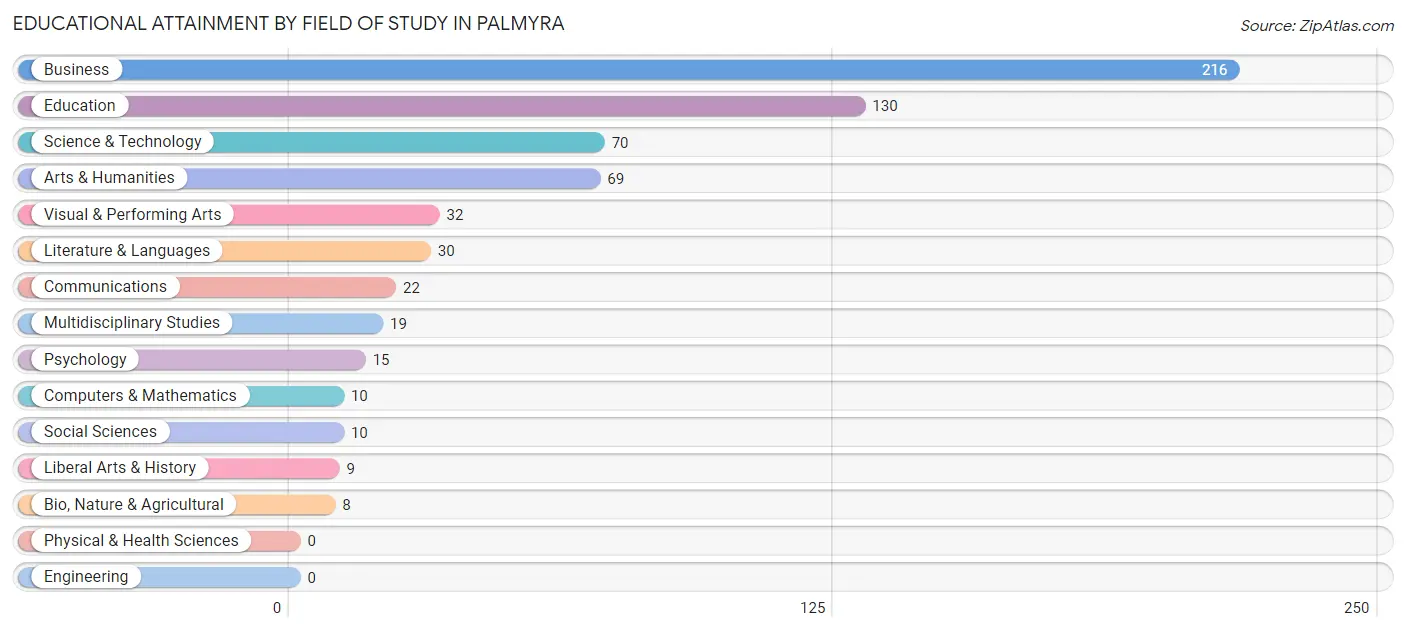
| Field of Study | # Graduates | % Graduates |
| Computers & Mathematics | 10 | 1.6% |
| Bio, Nature & Agricultural | 8 | 1.3% |
| Physical & Health Sciences | 0 | 0.0% |
| Psychology | 15 | 2.3% |
| Social Sciences | 10 | 1.6% |
| Engineering | 0 | 0.0% |
| Multidisciplinary Studies | 19 | 3.0% |
| Science & Technology | 70 | 10.9% |
| Business | 216 | 33.8% |
| Education | 130 | 20.3% |
| Literature & Languages | 30 | 4.7% |
| Liberal Arts & History | 9 | 1.4% |
| Visual & Performing Arts | 32 | 5.0% |
| Communications | 22 | 3.4% |
| Arts & Humanities | 69 | 10.8% |
| Total | 640 | 100.0% |
Transportation & Commute in Palmyra
Vehicle Availability by Sex in Palmyra
The most prevalent vehicle ownership categories in Palmyra are males with 2 vehicles (313, accounting for 33.6%) and females with 2 vehicles (349, making up 41.2%).
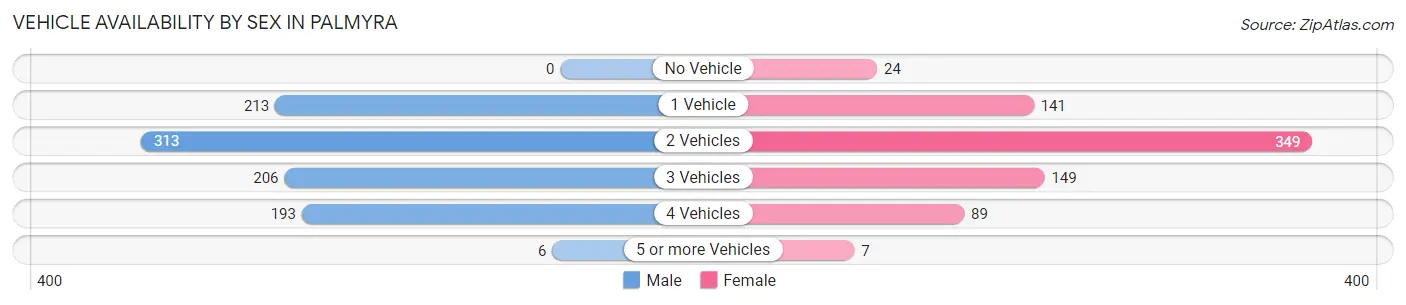
| Vehicles Available | Male | Female |
| No Vehicle | 0 (0.0%) | 24 (3.2%) |
| 1 Vehicle | 213 (22.9%) | 141 (18.6%) |
| 2 Vehicles | 313 (33.6%) | 349 (46.0%) |
| 3 Vehicles | 206 (22.1%) | 149 (19.6%) |
| 4 Vehicles | 193 (20.7%) | 89 (11.7%) |
| 5 or more Vehicles | 6 (0.6%) | 7 (0.9%) |
| Total | 931 (100.0%) | 759 (100.0%) |
Commute Time in Palmyra
The most frequently occuring commute durations in Palmyra are 15 to 19 minutes (288 commuters, 18.6%), 20 to 24 minutes (285 commuters, 18.4%), and 30 to 34 minutes (250 commuters, 16.2%).
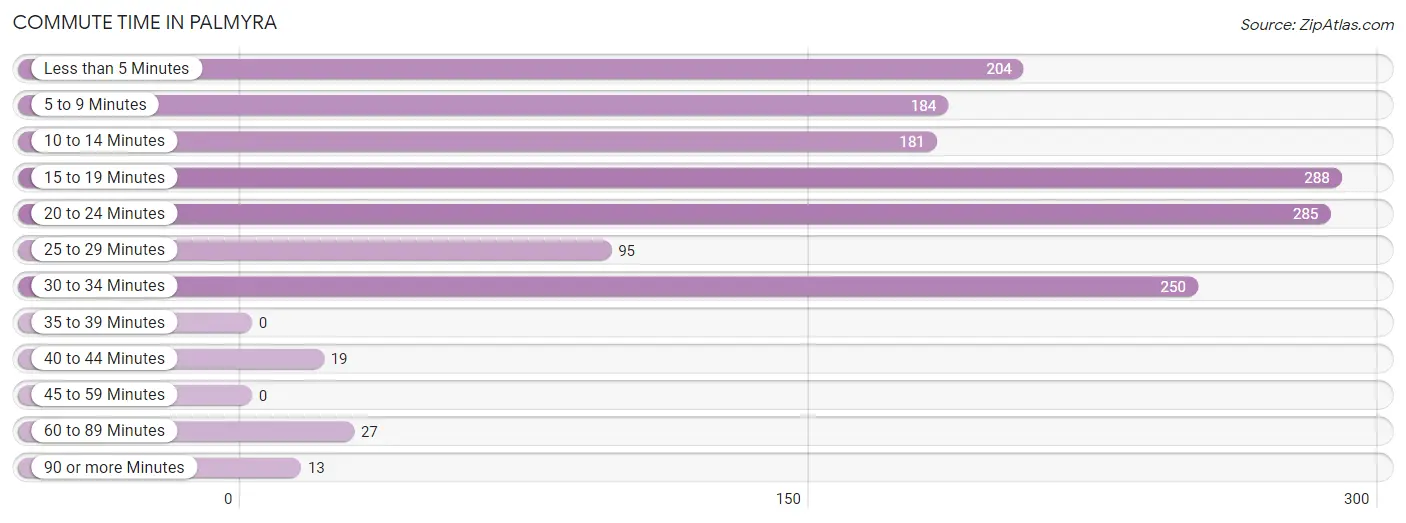
| Commute Time | # Commuters | % Commuters |
| Less than 5 Minutes | 204 | 13.2% |
| 5 to 9 Minutes | 184 | 11.9% |
| 10 to 14 Minutes | 181 | 11.7% |
| 15 to 19 Minutes | 288 | 18.6% |
| 20 to 24 Minutes | 285 | 18.4% |
| 25 to 29 Minutes | 95 | 6.1% |
| 30 to 34 Minutes | 250 | 16.2% |
| 35 to 39 Minutes | 0 | 0.0% |
| 40 to 44 Minutes | 19 | 1.2% |
| 45 to 59 Minutes | 0 | 0.0% |
| 60 to 89 Minutes | 27 | 1.8% |
| 90 or more Minutes | 13 | 0.8% |
Commute Time by Sex in Palmyra
The most common commute times in Palmyra are 15 to 19 minutes (188 commuters, 20.9%) for males and 20 to 24 minutes (135 commuters, 20.9%) for females.
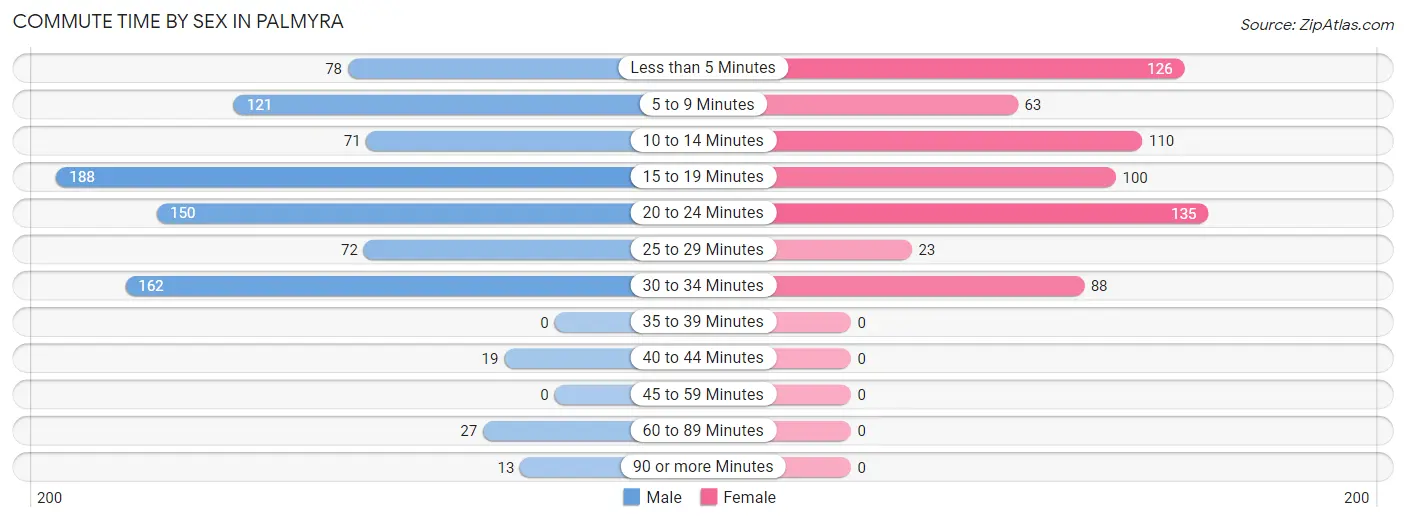
| Commute Time | Male | Female |
| Less than 5 Minutes | 78 (8.7%) | 126 (19.5%) |
| 5 to 9 Minutes | 121 (13.4%) | 63 (9.8%) |
| 10 to 14 Minutes | 71 (7.9%) | 110 (17.1%) |
| 15 to 19 Minutes | 188 (20.9%) | 100 (15.5%) |
| 20 to 24 Minutes | 150 (16.7%) | 135 (20.9%) |
| 25 to 29 Minutes | 72 (8.0%) | 23 (3.6%) |
| 30 to 34 Minutes | 162 (18.0%) | 88 (13.6%) |
| 35 to 39 Minutes | 0 (0.0%) | 0 (0.0%) |
| 40 to 44 Minutes | 19 (2.1%) | 0 (0.0%) |
| 45 to 59 Minutes | 0 (0.0%) | 0 (0.0%) |
| 60 to 89 Minutes | 27 (3.0%) | 0 (0.0%) |
| 90 or more Minutes | 13 (1.4%) | 0 (0.0%) |
Time of Departure to Work by Sex in Palmyra
The most frequent times of departure to work in Palmyra are 4:00 PM to 11:59 PM (188, 20.9%) for males and 7:30 AM to 7:59 AM (235, 36.4%) for females.
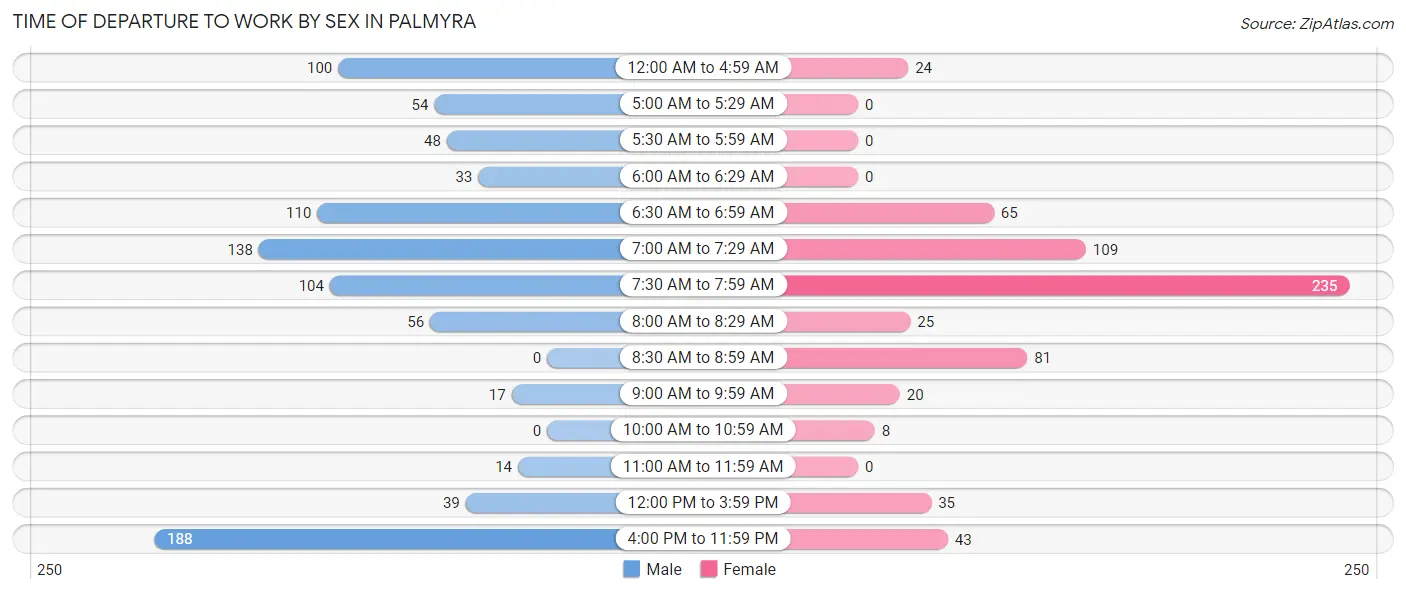
| Time of Departure | Male | Female |
| 12:00 AM to 4:59 AM | 100 (11.1%) | 24 (3.7%) |
| 5:00 AM to 5:29 AM | 54 (6.0%) | 0 (0.0%) |
| 5:30 AM to 5:59 AM | 48 (5.3%) | 0 (0.0%) |
| 6:00 AM to 6:29 AM | 33 (3.7%) | 0 (0.0%) |
| 6:30 AM to 6:59 AM | 110 (12.2%) | 65 (10.1%) |
| 7:00 AM to 7:29 AM | 138 (15.3%) | 109 (16.9%) |
| 7:30 AM to 7:59 AM | 104 (11.5%) | 235 (36.4%) |
| 8:00 AM to 8:29 AM | 56 (6.2%) | 25 (3.9%) |
| 8:30 AM to 8:59 AM | 0 (0.0%) | 81 (12.6%) |
| 9:00 AM to 9:59 AM | 17 (1.9%) | 20 (3.1%) |
| 10:00 AM to 10:59 AM | 0 (0.0%) | 8 (1.2%) |
| 11:00 AM to 11:59 AM | 14 (1.5%) | 0 (0.0%) |
| 12:00 PM to 3:59 PM | 39 (4.3%) | 35 (5.4%) |
| 4:00 PM to 11:59 PM | 188 (20.9%) | 43 (6.7%) |
| Total | 901 (100.0%) | 645 (100.0%) |
Housing Occupancy in Palmyra
Occupancy by Ownership in Palmyra
Of the total 1,433 dwellings in Palmyra, owner-occupied units account for 1,017 (71.0%), while renter-occupied units make up 416 (29.0%).
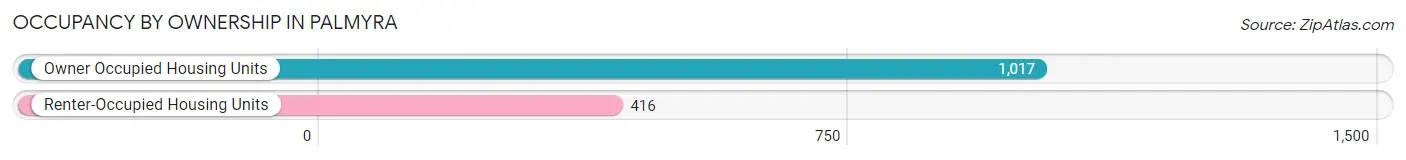
| Occupancy | # Housing Units | % Housing Units |
| Owner Occupied Housing Units | 1,017 | 71.0% |
| Renter-Occupied Housing Units | 416 | 29.0% |
| Total Occupied Housing Units | 1,433 | 100.0% |
Occupancy by Household Size in Palmyra
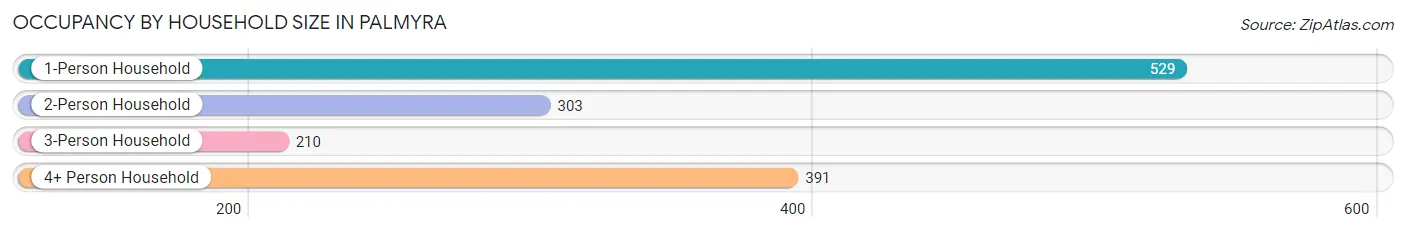
| Household Size | # Housing Units | % Housing Units |
| 1-Person Household | 529 | 36.9% |
| 2-Person Household | 303 | 21.1% |
| 3-Person Household | 210 | 14.6% |
| 4+ Person Household | 391 | 27.3% |
| Total Housing Units | 1,433 | 100.0% |
Occupancy by Ownership by Household Size in Palmyra
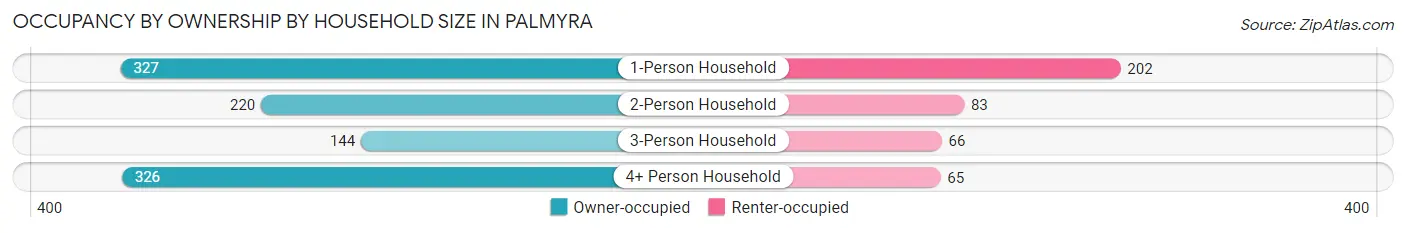
| Household Size | Owner-occupied | Renter-occupied |
| 1-Person Household | 327 (61.8%) | 202 (38.2%) |
| 2-Person Household | 220 (72.6%) | 83 (27.4%) |
| 3-Person Household | 144 (68.6%) | 66 (31.4%) |
| 4+ Person Household | 326 (83.4%) | 65 (16.6%) |
| Total Housing Units | 1,017 (71.0%) | 416 (29.0%) |
Occupancy by Educational Attainment in Palmyra
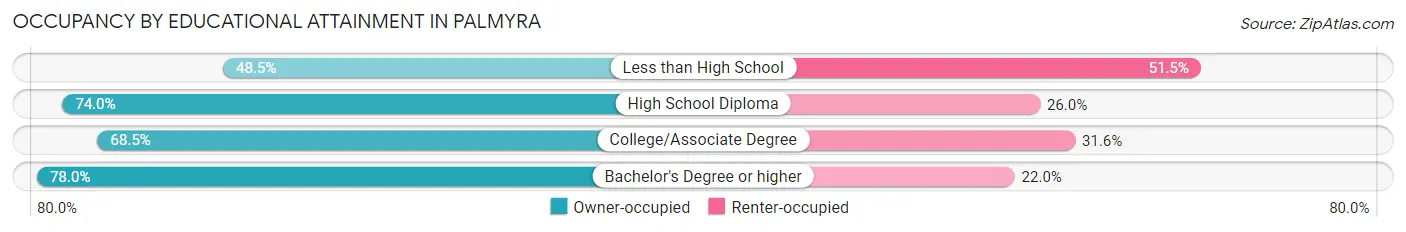
| Household Size | Owner-occupied | Renter-occupied |
| Less than High School | 49 (48.5%) | 52 (51.5%) |
| High School Diploma | 359 (74.0%) | 126 (26.0%) |
| College/Associate Degree | 371 (68.4%) | 171 (31.6%) |
| Bachelor's Degree or higher | 238 (78.0%) | 67 (22.0%) |
Occupancy by Age of Householder in Palmyra
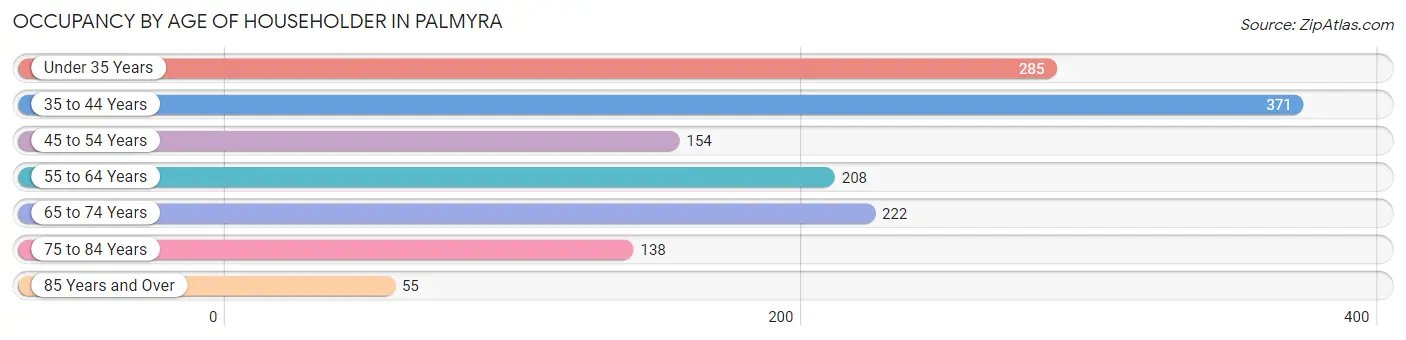
| Age Bracket | # Households | % Households |
| Under 35 Years | 285 | 19.9% |
| 35 to 44 Years | 371 | 25.9% |
| 45 to 54 Years | 154 | 10.7% |
| 55 to 64 Years | 208 | 14.5% |
| 65 to 74 Years | 222 | 15.5% |
| 75 to 84 Years | 138 | 9.6% |
| 85 Years and Over | 55 | 3.8% |
| Total | 1,433 | 100.0% |
Housing Finances in Palmyra
Median Income by Occupancy in Palmyra
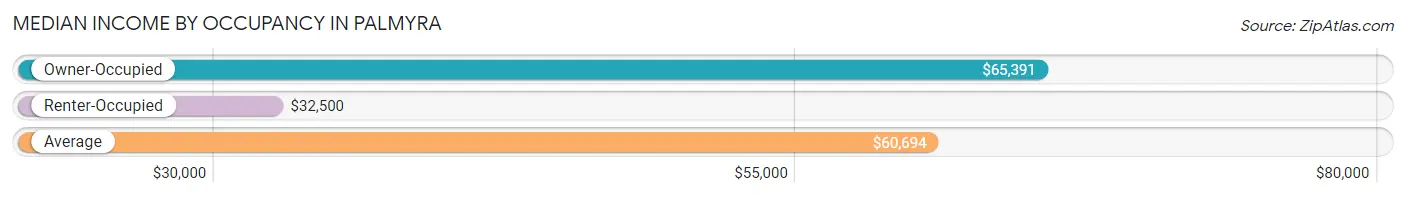
| Occupancy Type | # Households | Median Income |
| Owner-Occupied | 1,017 (71.0%) | $65,391 |
| Renter-Occupied | 416 (29.0%) | $32,500 |
| Average | 1,433 (100.0%) | $60,694 |
Occupancy by Householder Income Bracket in Palmyra
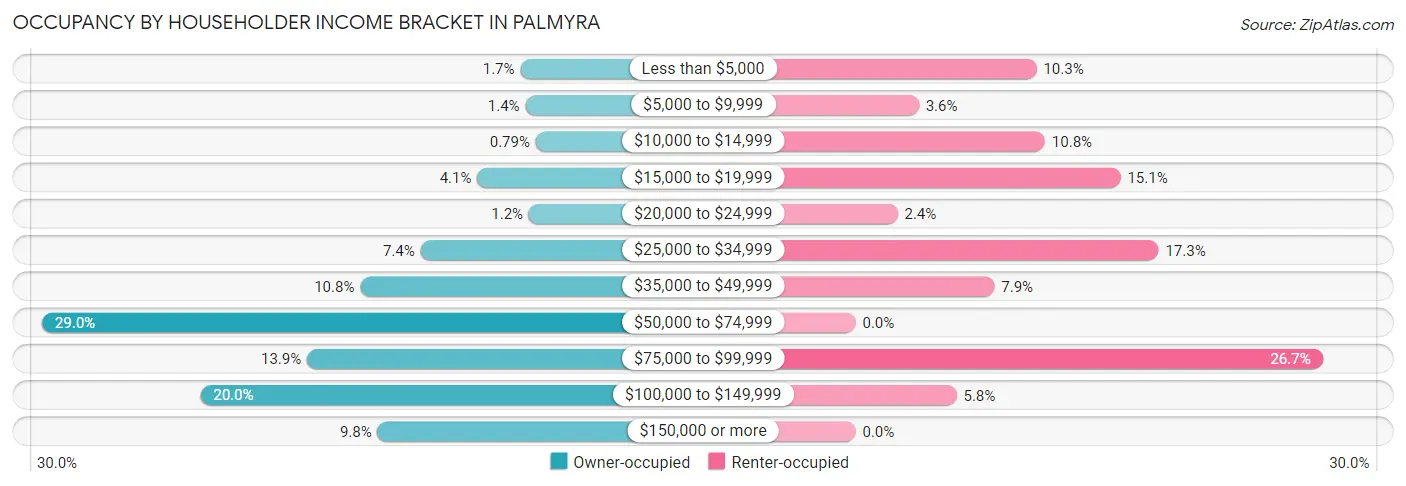
| Income Bracket | Owner-occupied | Renter-occupied |
| Less than $5,000 | 17 (1.7%) | 43 (10.3%) |
| $5,000 to $9,999 | 14 (1.4%) | 15 (3.6%) |
| $10,000 to $14,999 | 8 (0.8%) | 45 (10.8%) |
| $15,000 to $19,999 | 42 (4.1%) | 63 (15.1%) |
| $20,000 to $24,999 | 12 (1.2%) | 10 (2.4%) |
| $25,000 to $34,999 | 75 (7.4%) | 72 (17.3%) |
| $35,000 to $49,999 | 110 (10.8%) | 33 (7.9%) |
| $50,000 to $74,999 | 295 (29.0%) | 0 (0.0%) |
| $75,000 to $99,999 | 141 (13.9%) | 111 (26.7%) |
| $100,000 to $149,999 | 203 (20.0%) | 24 (5.8%) |
| $150,000 or more | 100 (9.8%) | 0 (0.0%) |
| Total | 1,017 (100.0%) | 416 (100.0%) |
Monthly Housing Cost Tiers in Palmyra
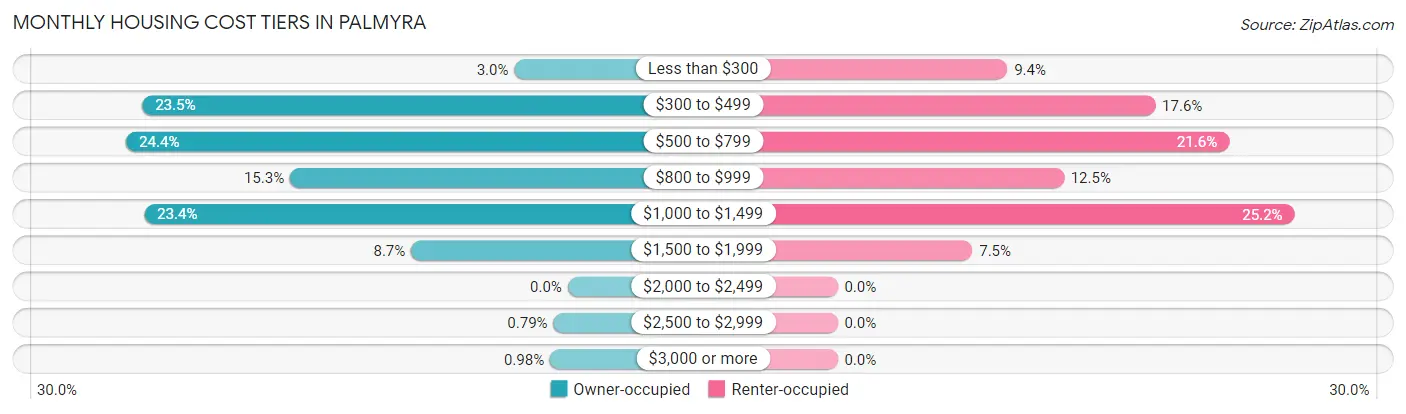
| Monthly Cost | Owner-occupied | Renter-occupied |
| Less than $300 | 30 (2.9%) | 39 (9.4%) |
| $300 to $499 | 239 (23.5%) | 73 (17.5%) |
| $500 to $799 | 248 (24.4%) | 90 (21.6%) |
| $800 to $999 | 156 (15.3%) | 52 (12.5%) |
| $1,000 to $1,499 | 238 (23.4%) | 105 (25.2%) |
| $1,500 to $1,999 | 88 (8.6%) | 31 (7.4%) |
| $2,000 to $2,499 | 0 (0.0%) | 0 (0.0%) |
| $2,500 to $2,999 | 8 (0.8%) | 0 (0.0%) |
| $3,000 or more | 10 (1.0%) | 0 (0.0%) |
| Total | 1,017 (100.0%) | 416 (100.0%) |
Physical Housing Characteristics in Palmyra
Housing Structures in Palmyra
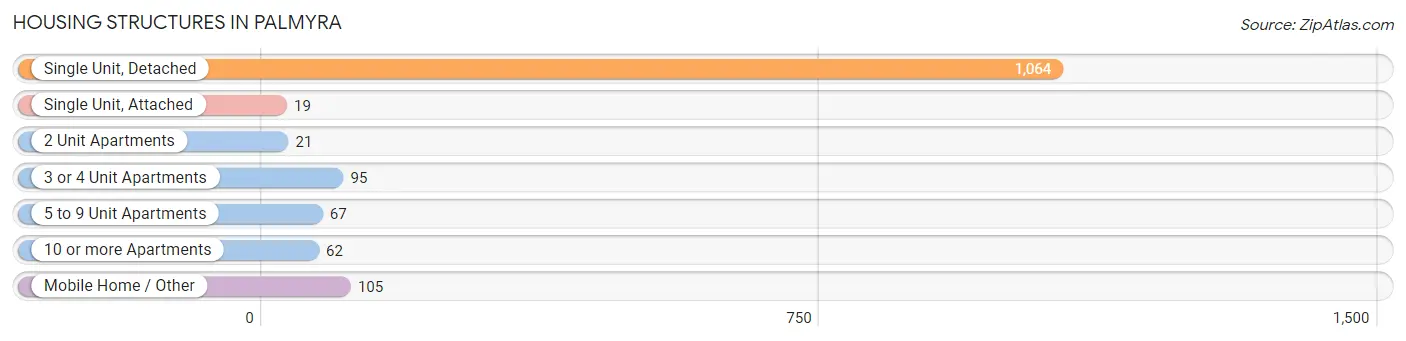
| Structure Type | # Housing Units | % Housing Units |
| Single Unit, Detached | 1,064 | 74.3% |
| Single Unit, Attached | 19 | 1.3% |
| 2 Unit Apartments | 21 | 1.5% |
| 3 or 4 Unit Apartments | 95 | 6.6% |
| 5 to 9 Unit Apartments | 67 | 4.7% |
| 10 or more Apartments | 62 | 4.3% |
| Mobile Home / Other | 105 | 7.3% |
| Total | 1,433 | 100.0% |
Housing Structures by Occupancy in Palmyra
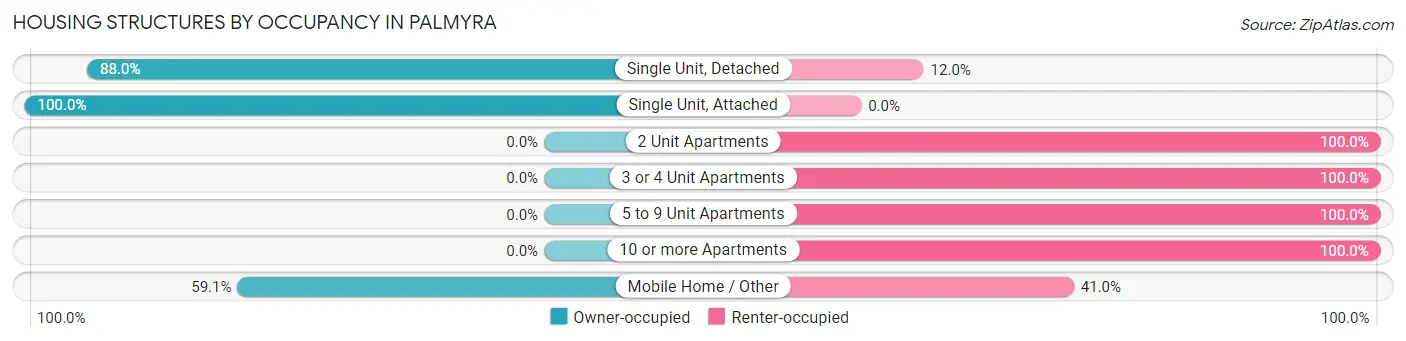
| Structure Type | Owner-occupied | Renter-occupied |
| Single Unit, Detached | 936 (88.0%) | 128 (12.0%) |
| Single Unit, Attached | 19 (100.0%) | 0 (0.0%) |
| 2 Unit Apartments | 0 (0.0%) | 21 (100.0%) |
| 3 or 4 Unit Apartments | 0 (0.0%) | 95 (100.0%) |
| 5 to 9 Unit Apartments | 0 (0.0%) | 67 (100.0%) |
| 10 or more Apartments | 0 (0.0%) | 62 (100.0%) |
| Mobile Home / Other | 62 (59.1%) | 43 (40.9%) |
| Total | 1,017 (71.0%) | 416 (29.0%) |
Housing Structures by Number of Rooms in Palmyra
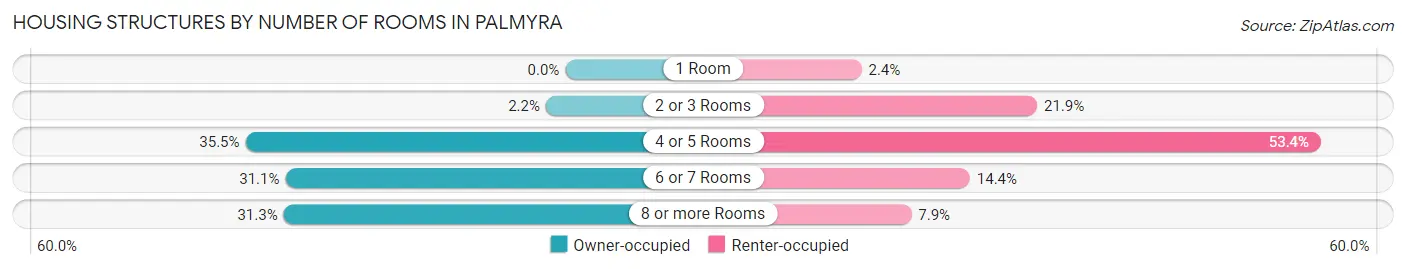
| Number of Rooms | Owner-occupied | Renter-occupied |
| 1 Room | 0 (0.0%) | 10 (2.4%) |
| 2 or 3 Rooms | 22 (2.2%) | 91 (21.9%) |
| 4 or 5 Rooms | 361 (35.5%) | 222 (53.4%) |
| 6 or 7 Rooms | 316 (31.1%) | 60 (14.4%) |
| 8 or more Rooms | 318 (31.3%) | 33 (7.9%) |
| Total | 1,017 (100.0%) | 416 (100.0%) |
Housing Structure by Heating Type in Palmyra
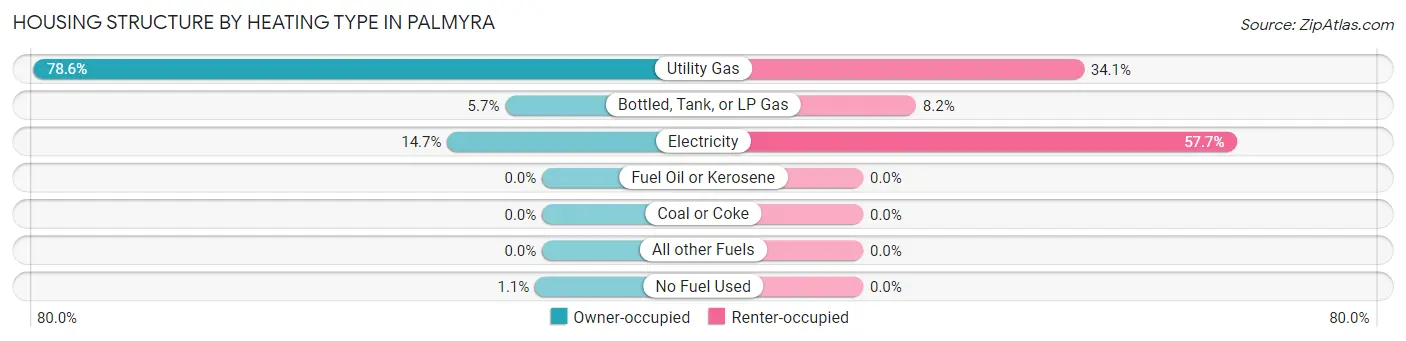
| Heating Type | Owner-occupied | Renter-occupied |
| Utility Gas | 799 (78.6%) | 142 (34.1%) |
| Bottled, Tank, or LP Gas | 58 (5.7%) | 34 (8.2%) |
| Electricity | 149 (14.6%) | 240 (57.7%) |
| Fuel Oil or Kerosene | 0 (0.0%) | 0 (0.0%) |
| Coal or Coke | 0 (0.0%) | 0 (0.0%) |
| All other Fuels | 0 (0.0%) | 0 (0.0%) |
| No Fuel Used | 11 (1.1%) | 0 (0.0%) |
| Total | 1,017 (100.0%) | 416 (100.0%) |
Household Vehicle Usage in Palmyra
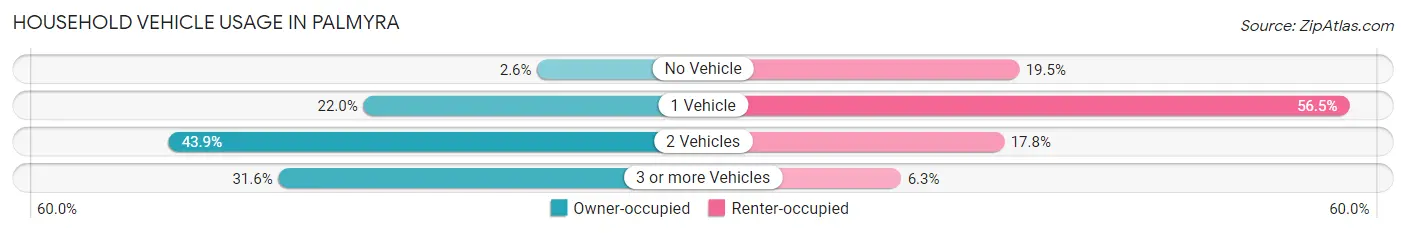
| Vehicles per Household | Owner-occupied | Renter-occupied |
| No Vehicle | 26 (2.6%) | 81 (19.5%) |
| 1 Vehicle | 224 (22.0%) | 235 (56.5%) |
| 2 Vehicles | 446 (43.9%) | 74 (17.8%) |
| 3 or more Vehicles | 321 (31.6%) | 26 (6.2%) |
| Total | 1,017 (100.0%) | 416 (100.0%) |
Real Estate & Mortgages in Palmyra
Real Estate and Mortgage Overview in Palmyra
| Characteristic | Without Mortgage | With Mortgage |
| Housing Units | 468 | 549 |
| Median Property Value | $110,400 | $157,900 |
| Median Household Income | $53,684 | $81 |
| Monthly Housing Costs | $440 | $10 |
| Real Estate Taxes | $1,282 | $0 |
Property Value by Mortgage Status in Palmyra
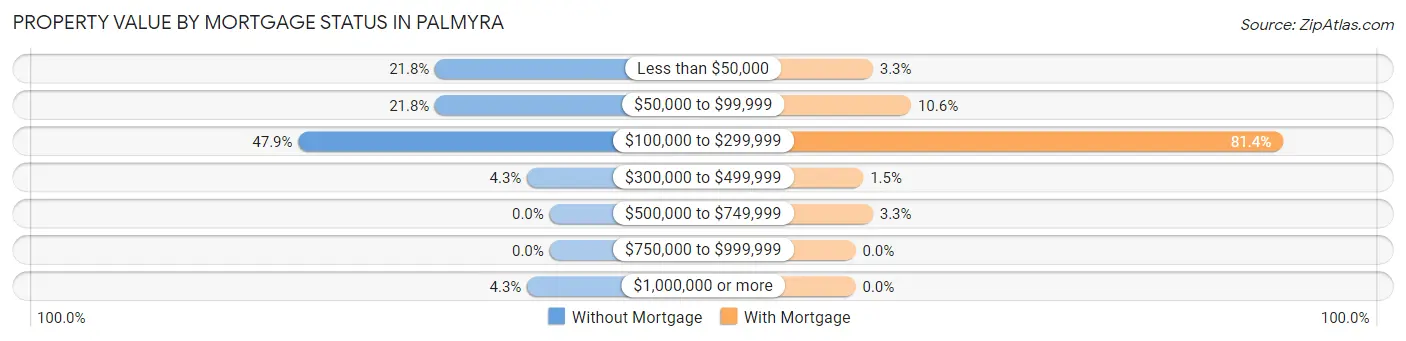
| Property Value | Without Mortgage | With Mortgage |
| Less than $50,000 | 102 (21.8%) | 18 (3.3%) |
| $50,000 to $99,999 | 102 (21.8%) | 58 (10.6%) |
| $100,000 to $299,999 | 224 (47.9%) | 447 (81.4%) |
| $300,000 to $499,999 | 20 (4.3%) | 8 (1.5%) |
| $500,000 to $749,999 | 0 (0.0%) | 18 (3.3%) |
| $750,000 to $999,999 | 0 (0.0%) | 0 (0.0%) |
| $1,000,000 or more | 20 (4.3%) | 0 (0.0%) |
| Total | 468 (100.0%) | 549 (100.0%) |
Household Income by Mortgage Status in Palmyra
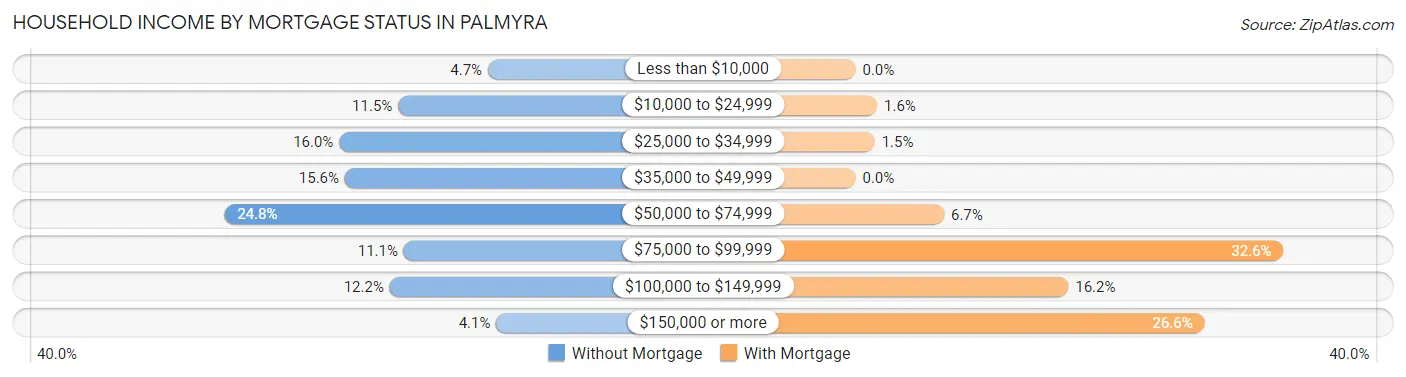
| Household Income | Without Mortgage | With Mortgage |
| Less than $10,000 | 22 (4.7%) | 0 (0.0%) |
| $10,000 to $24,999 | 54 (11.5%) | 9 (1.6%) |
| $25,000 to $34,999 | 75 (16.0%) | 8 (1.5%) |
| $35,000 to $49,999 | 73 (15.6%) | 0 (0.0%) |
| $50,000 to $74,999 | 116 (24.8%) | 37 (6.7%) |
| $75,000 to $99,999 | 52 (11.1%) | 179 (32.6%) |
| $100,000 to $149,999 | 57 (12.2%) | 89 (16.2%) |
| $150,000 or more | 19 (4.1%) | 146 (26.6%) |
| Total | 468 (100.0%) | 549 (100.0%) |
Property Value to Household Income Ratio in Palmyra
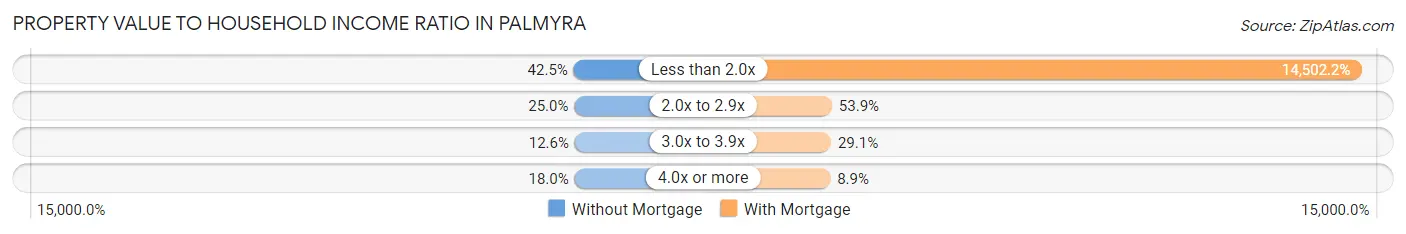
| Value-to-Income Ratio | Without Mortgage | With Mortgage |
| Less than 2.0x | 199 (42.5%) | 79,617 (14,502.2%) |
| 2.0x to 2.9x | 117 (25.0%) | 296 (53.9%) |
| 3.0x to 3.9x | 59 (12.6%) | 160 (29.1%) |
| 4.0x or more | 84 (17.9%) | 49 (8.9%) |
| Total | 468 (100.0%) | 549 (100.0%) |
Real Estate Taxes by Mortgage Status in Palmyra
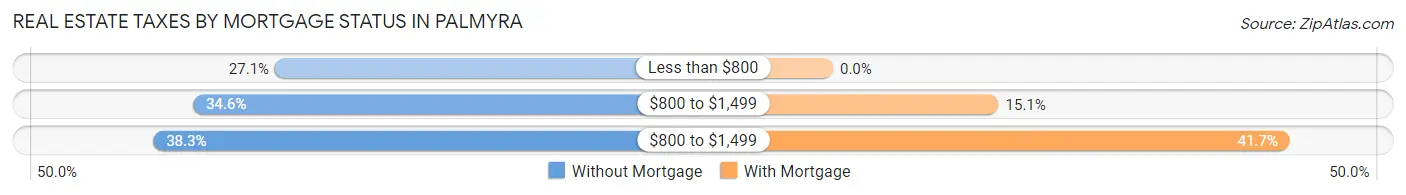
| Property Taxes | Without Mortgage | With Mortgage |
| Less than $800 | 127 (27.1%) | 0 (0.0%) |
| $800 to $1,499 | 162 (34.6%) | 83 (15.1%) |
| $800 to $1,499 | 179 (38.3%) | 229 (41.7%) |
| Total | 468 (100.0%) | 549 (100.0%) |
Health & Disability in Palmyra
Health Insurance Coverage by Age in Palmyra
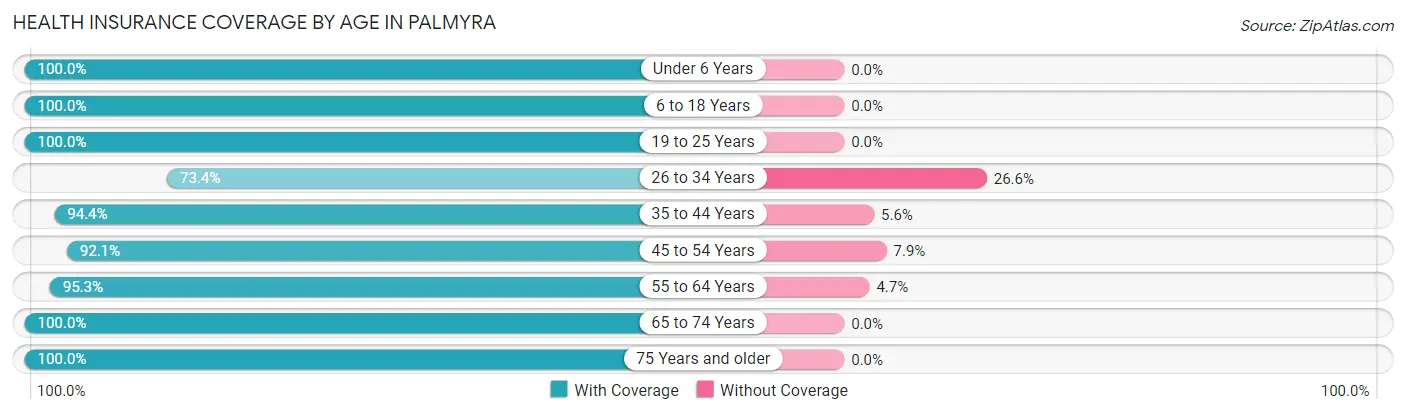
| Age Bracket | With Coverage | Without Coverage |
| Under 6 Years | 423 (100.0%) | 0 (0.0%) |
| 6 to 18 Years | 553 (100.0%) | 0 (0.0%) |
| 19 to 25 Years | 220 (100.0%) | 0 (0.0%) |
| 26 to 34 Years | 359 (73.4%) | 130 (26.6%) |
| 35 to 44 Years | 578 (94.4%) | 34 (5.6%) |
| 45 to 54 Years | 292 (92.1%) | 25 (7.9%) |
| 55 to 64 Years | 284 (95.3%) | 14 (4.7%) |
| 65 to 74 Years | 316 (100.0%) | 0 (0.0%) |
| 75 Years and older | 236 (100.0%) | 0 (0.0%) |
| Total | 3,261 (94.1%) | 203 (5.9%) |
Health Insurance Coverage by Citizenship Status in Palmyra
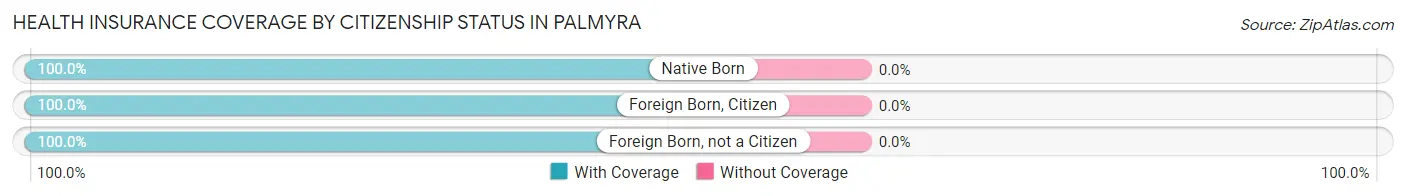
| Citizenship Status | With Coverage | Without Coverage |
| Native Born | 423 (100.0%) | 0 (0.0%) |
| Foreign Born, Citizen | 553 (100.0%) | 0 (0.0%) |
| Foreign Born, not a Citizen | 220 (100.0%) | 0 (0.0%) |
Health Insurance Coverage by Household Income in Palmyra
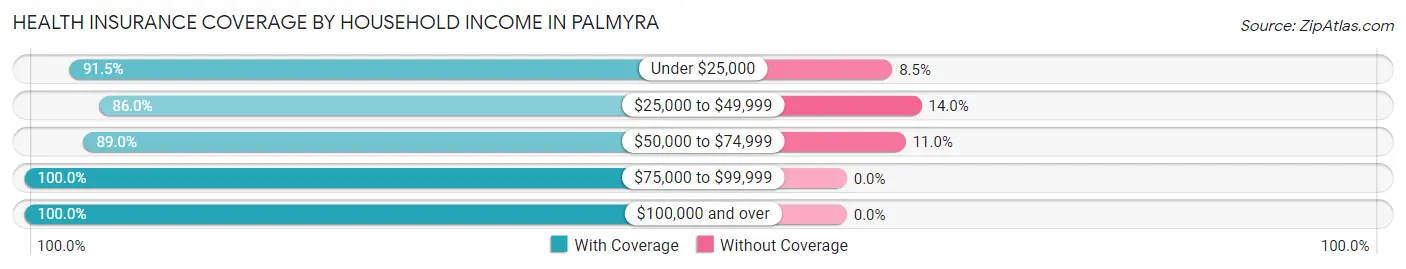
| Household Income | With Coverage | Without Coverage |
| Under $25,000 | 387 (91.5%) | 36 (8.5%) |
| $25,000 to $49,999 | 393 (86.0%) | 64 (14.0%) |
| $50,000 to $74,999 | 806 (89.0%) | 100 (11.0%) |
| $75,000 to $99,999 | 618 (100.0%) | 0 (0.0%) |
| $100,000 and over | 1,050 (100.0%) | 0 (0.0%) |
Public vs Private Health Insurance Coverage by Age in Palmyra
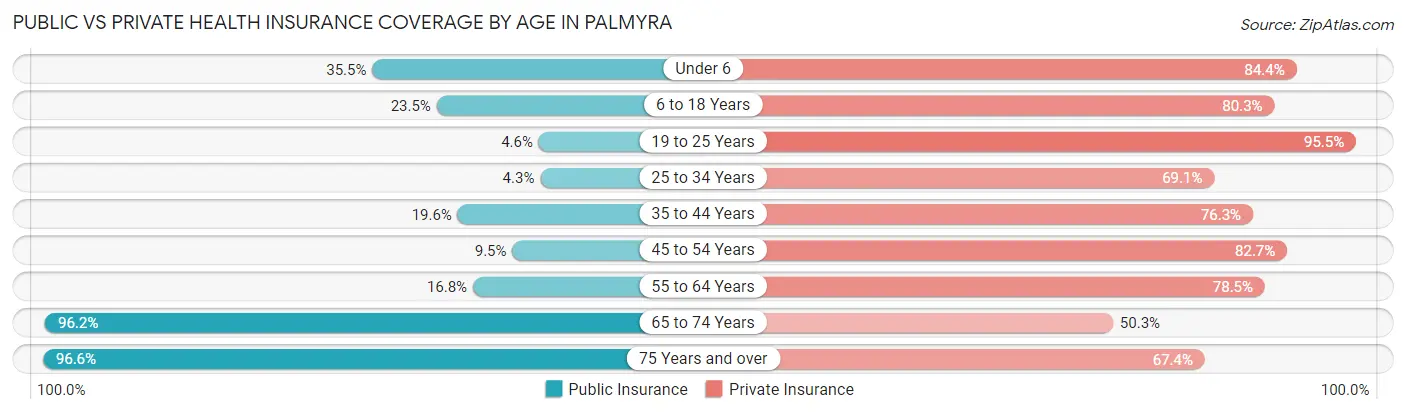
| Age Bracket | Public Insurance | Private Insurance |
| Under 6 | 150 (35.5%) | 357 (84.4%) |
| 6 to 18 Years | 130 (23.5%) | 444 (80.3%) |
| 19 to 25 Years | 10 (4.5%) | 210 (95.5%) |
| 25 to 34 Years | 21 (4.3%) | 338 (69.1%) |
| 35 to 44 Years | 120 (19.6%) | 467 (76.3%) |
| 45 to 54 Years | 30 (9.5%) | 262 (82.7%) |
| 55 to 64 Years | 50 (16.8%) | 234 (78.5%) |
| 65 to 74 Years | 304 (96.2%) | 159 (50.3%) |
| 75 Years and over | 228 (96.6%) | 159 (67.4%) |
| Total | 1,043 (30.1%) | 2,630 (75.9%) |
Disability Status by Sex by Age in Palmyra
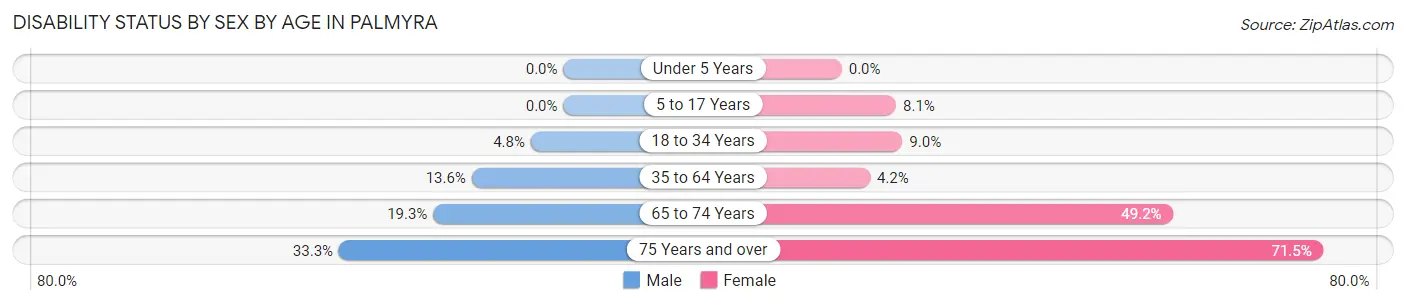
| Age Bracket | Male | Female |
| Under 5 Years | 0 (0.0%) | 0 (0.0%) |
| 5 to 17 Years | 0 (0.0%) | 32 (8.1%) |
| 18 to 34 Years | 20 (4.8%) | 27 (9.0%) |
| 35 to 64 Years | 89 (13.6%) | 24 (4.2%) |
| 65 to 74 Years | 23 (19.3%) | 97 (49.2%) |
| 75 Years and over | 33 (33.3%) | 98 (71.5%) |
Disability Class by Sex by Age in Palmyra
Disability Class: Hearing Difficulty
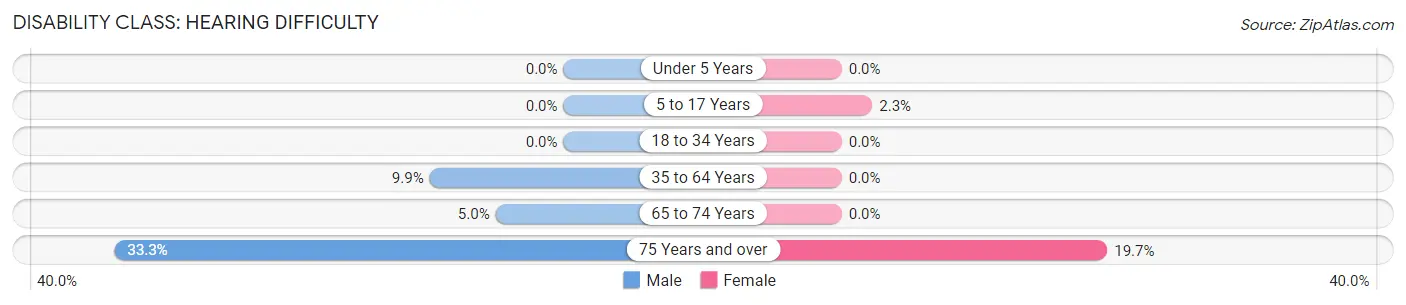
| Age Bracket | Male | Female |
| Under 5 Years | 0 (0.0%) | 0 (0.0%) |
| 5 to 17 Years | 0 (0.0%) | 9 (2.3%) |
| 18 to 34 Years | 0 (0.0%) | 0 (0.0%) |
| 35 to 64 Years | 65 (9.9%) | 0 (0.0%) |
| 65 to 74 Years | 6 (5.0%) | 0 (0.0%) |
| 75 Years and over | 33 (33.3%) | 27 (19.7%) |
Disability Class: Vision Difficulty
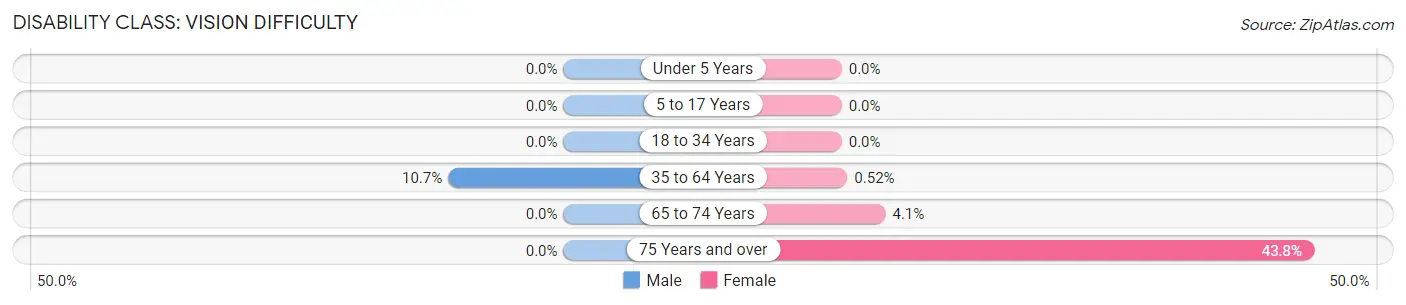
| Age Bracket | Male | Female |
| Under 5 Years | 0 (0.0%) | 0 (0.0%) |
| 5 to 17 Years | 0 (0.0%) | 0 (0.0%) |
| 18 to 34 Years | 0 (0.0%) | 0 (0.0%) |
| 35 to 64 Years | 70 (10.7%) | 3 (0.5%) |
| 65 to 74 Years | 0 (0.0%) | 8 (4.1%) |
| 75 Years and over | 0 (0.0%) | 60 (43.8%) |
Disability Class: Cognitive Difficulty
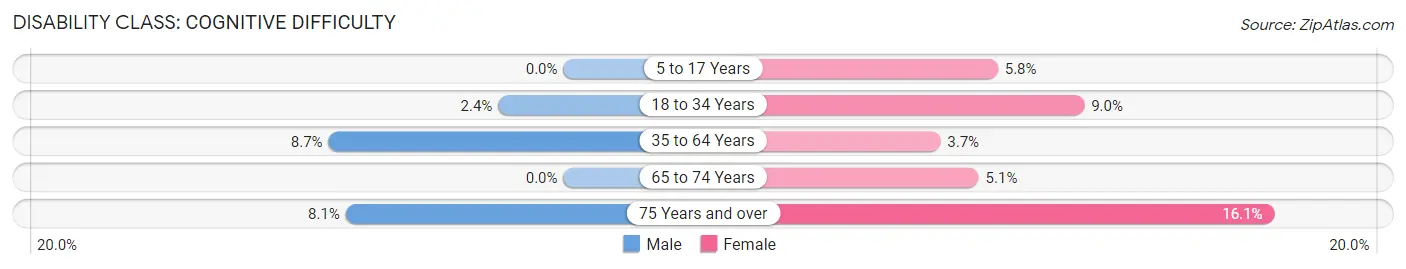
| Age Bracket | Male | Female |
| 5 to 17 Years | 0 (0.0%) | 23 (5.8%) |
| 18 to 34 Years | 10 (2.4%) | 27 (9.0%) |
| 35 to 64 Years | 57 (8.7%) | 21 (3.7%) |
| 65 to 74 Years | 0 (0.0%) | 10 (5.1%) |
| 75 Years and over | 8 (8.1%) | 22 (16.1%) |
Disability Class: Ambulatory Difficulty
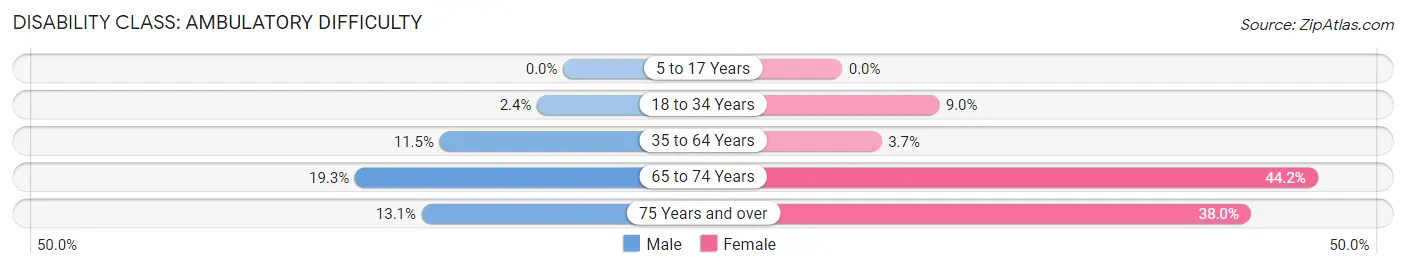
| Age Bracket | Male | Female |
| 5 to 17 Years | 0 (0.0%) | 0 (0.0%) |
| 18 to 34 Years | 10 (2.4%) | 27 (9.0%) |
| 35 to 64 Years | 75 (11.5%) | 21 (3.7%) |
| 65 to 74 Years | 23 (19.3%) | 87 (44.2%) |
| 75 Years and over | 13 (13.1%) | 52 (38.0%) |
Disability Class: Self-Care Difficulty
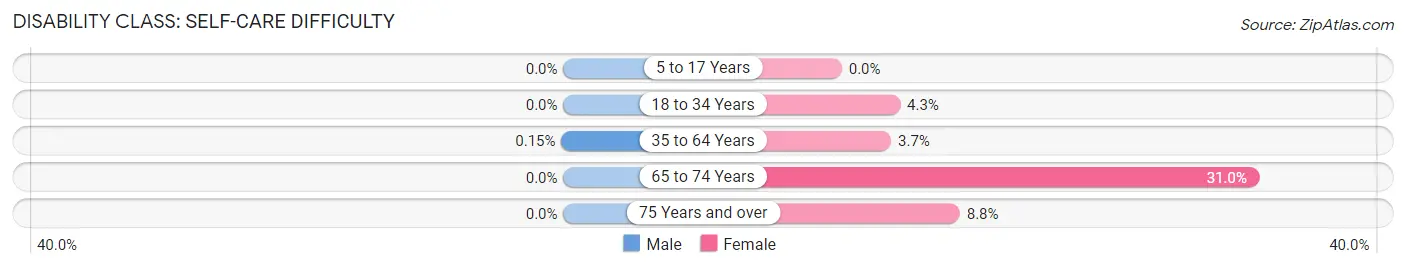
| Age Bracket | Male | Female |
| 5 to 17 Years | 0 (0.0%) | 0 (0.0%) |
| 18 to 34 Years | 0 (0.0%) | 13 (4.3%) |
| 35 to 64 Years | 1 (0.2%) | 21 (3.7%) |
| 65 to 74 Years | 0 (0.0%) | 61 (31.0%) |
| 75 Years and over | 0 (0.0%) | 12 (8.8%) |
Technology Access in Palmyra
Computing Device Access in Palmyra
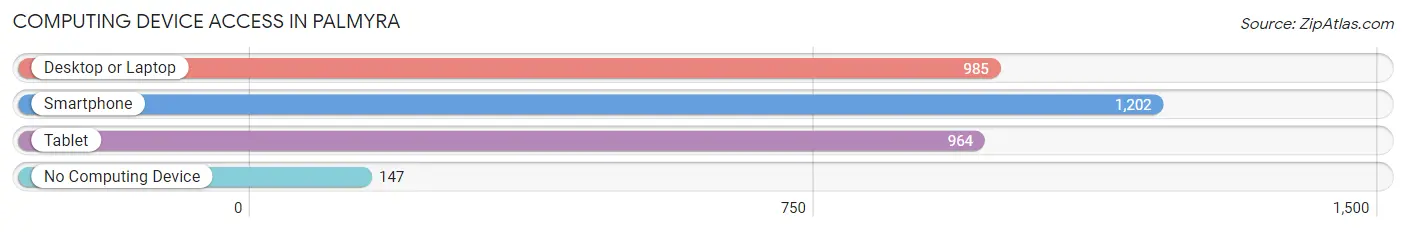
| Device Type | # Households | % Households |
| Desktop or Laptop | 985 | 68.7% |
| Smartphone | 1,202 | 83.9% |
| Tablet | 964 | 67.3% |
| No Computing Device | 147 | 10.3% |
| Total | 1,433 | 100.0% |
Internet Access in Palmyra
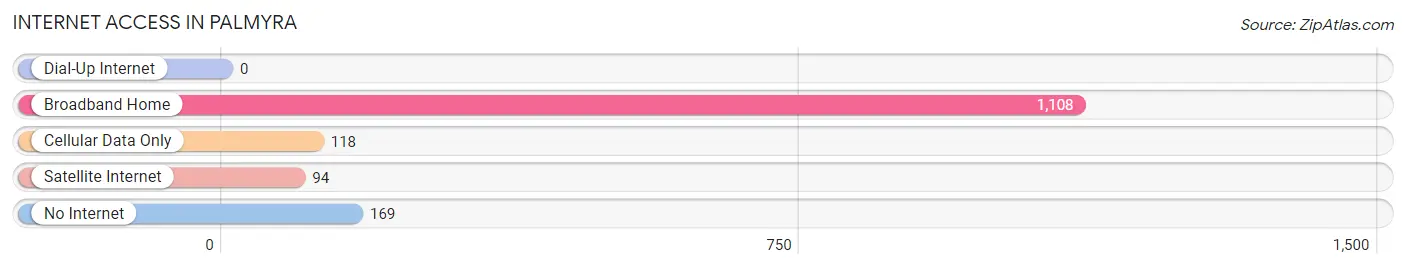
| Internet Type | # Households | % Households |
| Dial-Up Internet | 0 | 0.0% |
| Broadband Home | 1,108 | 77.3% |
| Cellular Data Only | 118 | 8.2% |
| Satellite Internet | 94 | 6.6% |
| No Internet | 169 | 11.8% |
| Total | 1,433 | 100.0% |
Palmyra Summary
Palmyra, Missouri is a small city located in Marion County, Missouri. It is situated on the banks of the North Fabius River, approximately 30 miles north of Hannibal and about 90 miles northeast of St. Louis. The city has a population of approximately 3,500 people and is the county seat of Marion County.
History
The area that is now Palmyra was first settled in 1819 by a group of settlers from Kentucky. The town was originally known as Fabius, but was later renamed Palmyra in 1821. The name was chosen to honor the ancient city of Palmyra in Syria. The town was officially incorporated in 1837.
In the early years, Palmyra was a thriving agricultural center, with a variety of crops being grown in the area. The town was also home to a number of businesses, including a flour mill, a sawmill, a brickyard, and a distillery.
In the late 19th century, Palmyra began to experience a period of growth and development. The town was connected to the Hannibal and St. Joseph Railroad in 1871, which helped to spur economic growth. The railroad also helped to bring new residents to the area, and the population of Palmyra began to grow.
In the early 20th century, Palmyra continued to experience growth and development. The town was home to a number of businesses, including a canning factory, a furniture factory, and a shoe factory. The town also had a number of churches, schools, and other civic organizations.
Geography
Palmyra is located in the northern part of Marion County, Missouri. The city is situated on the banks of the North Fabius River, approximately 30 miles north of Hannibal and about 90 miles northeast of St. Louis. The city has a total area of 2.3 square miles, all of which is land.
The climate in Palmyra is classified as humid continental, with hot, humid summers and cold, wet winters. The average temperature in the summer is around 80 degrees Fahrenheit, while the average temperature in the winter is around 30 degrees Fahrenheit.
Economy
The economy of Palmyra is largely based on agriculture and manufacturing. The city is home to a number of agricultural businesses, including a grain elevator, a feed mill, and a fertilizer plant. The city is also home to a number of manufacturing businesses, including a furniture factory, a canning factory, and a shoe factory.
The city is also home to a number of retail businesses, including a grocery store, a hardware store, and a variety of other shops. The city is also home to a number of restaurants, bars, and other entertainment venues.
Demographics
As of the 2010 census, the population of Palmyra was 3,521. The racial makeup of the city was 97.2% White, 0.7% African American, 0.2% Native American, 0.3% Asian, 0.1% Pacific Islander, 0.4% from other races, and 1.1% from two or more races. Hispanic or Latino of any race were 1.3% of the population.
The median household income in Palmyra was $37,917, and the median family income was $45,938. The per capita income for the city was $18,945. About 11.2% of families and 14.2% of the population were below the poverty line, including 19.2% of those under age 18 and 8.2% of those age 65 or over.
Common Questions
What is Per Capita Income in Palmyra?
Per Capita income in Palmyra is $27,957.
What is the Median Family Income in Palmyra?
Median Family Income in Palmyra is $71,921.
What is the Median Household income in Palmyra?
Median Household Income in Palmyra is $60,694.
What is Income or Wage Gap in Palmyra?
Income or Wage Gap in Palmyra is 28.9%.
Women in Palmyra earn 71.1 cents for every dollar earned by a man.
What is Inequality or Gini Index in Palmyra?
Inequality or Gini Index in Palmyra is 0.38.
What is the Total Population of Palmyra?
Total Population of Palmyra is 3,613.
What is the Total Male Population of Palmyra?
Total Male Population of Palmyra is 1,801.
What is the Total Female Population of Palmyra?
Total Female Population of Palmyra is 1,812.
What is the Ratio of Males per 100 Females in Palmyra?
There are 99.39 Males per 100 Females in Palmyra.
What is the Ratio of Females per 100 Males in Palmyra?
There are 100.61 Females per 100 Males in Palmyra.
What is the Median Population Age in Palmyra?
Median Population Age in Palmyra is 36.4 Years.
What is the Average Family Size in Palmyra
Average Family Size in Palmyra is 3.1 People.
What is the Average Household Size in Palmyra
Average Household Size in Palmyra is 2.4 People.
How Large is the Labor Force in Palmyra?
There are 1,723 People in the Labor Forcein in Palmyra.
What is the Percentage of People in the Labor Force in Palmyra?
63.4% of People are in the Labor Force in Palmyra.
What is the Unemployment Rate in Palmyra?
Unemployment Rate in Palmyra is 1.6%.