Shelbina, MO Map & Demographics
Shelbina Map
Shelbina Overview
$22,597
PER CAPITA INCOME
$63,654
AVG FAMILY INCOME
$52,050
AVG HOUSEHOLD INCOME
50.4%
WAGE / INCOME GAP [ % ]
49.6¢/ $1
WAGE / INCOME GAP [ $ ]
0.40
INEQUALITY / GINI INDEX
2,165
TOTAL POPULATION
1,023
MALE POPULATION
1,142
FEMALE POPULATION
89.58
MALES / 100 FEMALES
111.63
FEMALES / 100 MALES
37.6
MEDIAN AGE
3.6
AVG FAMILY SIZE
2.8
AVG HOUSEHOLD SIZE
1,000
LABOR FORCE [ PEOPLE ]
62.2%
PERCENT IN LABOR FORCE
0.9%
UNEMPLOYMENT RATE
Shelbina Zip Codes
Shelbina Area Codes
Income in Shelbina
Income Overview in Shelbina
Per Capita Income in Shelbina is $22,597, while median incomes of families and households are $63,654 and $52,050 respectively.
| Characteristic | Number | Measure |
| Per Capita Income | 2,165 | $22,597 |
| Median Family Income | 458 | $63,654 |
| Mean Family Income | 458 | $72,068 |
| Median Household Income | 749 | $52,050 |
| Mean Household Income | 749 | $61,870 |
| Income Deficit | 458 | $0 |
| Wage / Income Gap (%) | 2,165 | 50.38% |
| Wage / Income Gap ($) | 2,165 | 49.62¢ per $1 |
| Gini / Inequality Index | 2,165 | 0.40 |
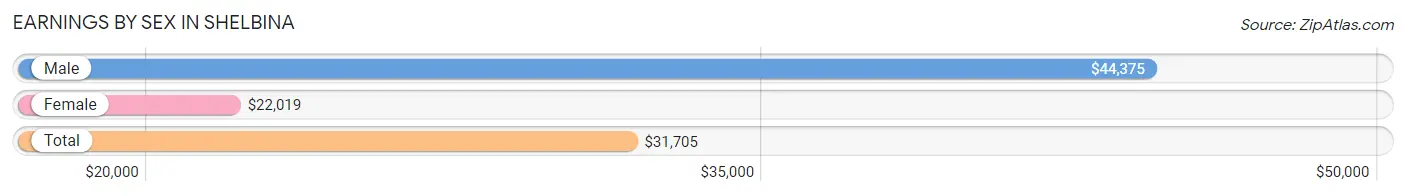
Earnings by Sex in Shelbina
Average Earnings in Shelbina are $31,705, $44,375 for men and $22,019 for women, a difference of 50.4%.
| Sex | Number | Average Earnings |
| Male | 526 (50.2%) | $44,375 |
| Female | 521 (49.8%) | $22,019 |
| Total | 1,047 (100.0%) | $31,705 |
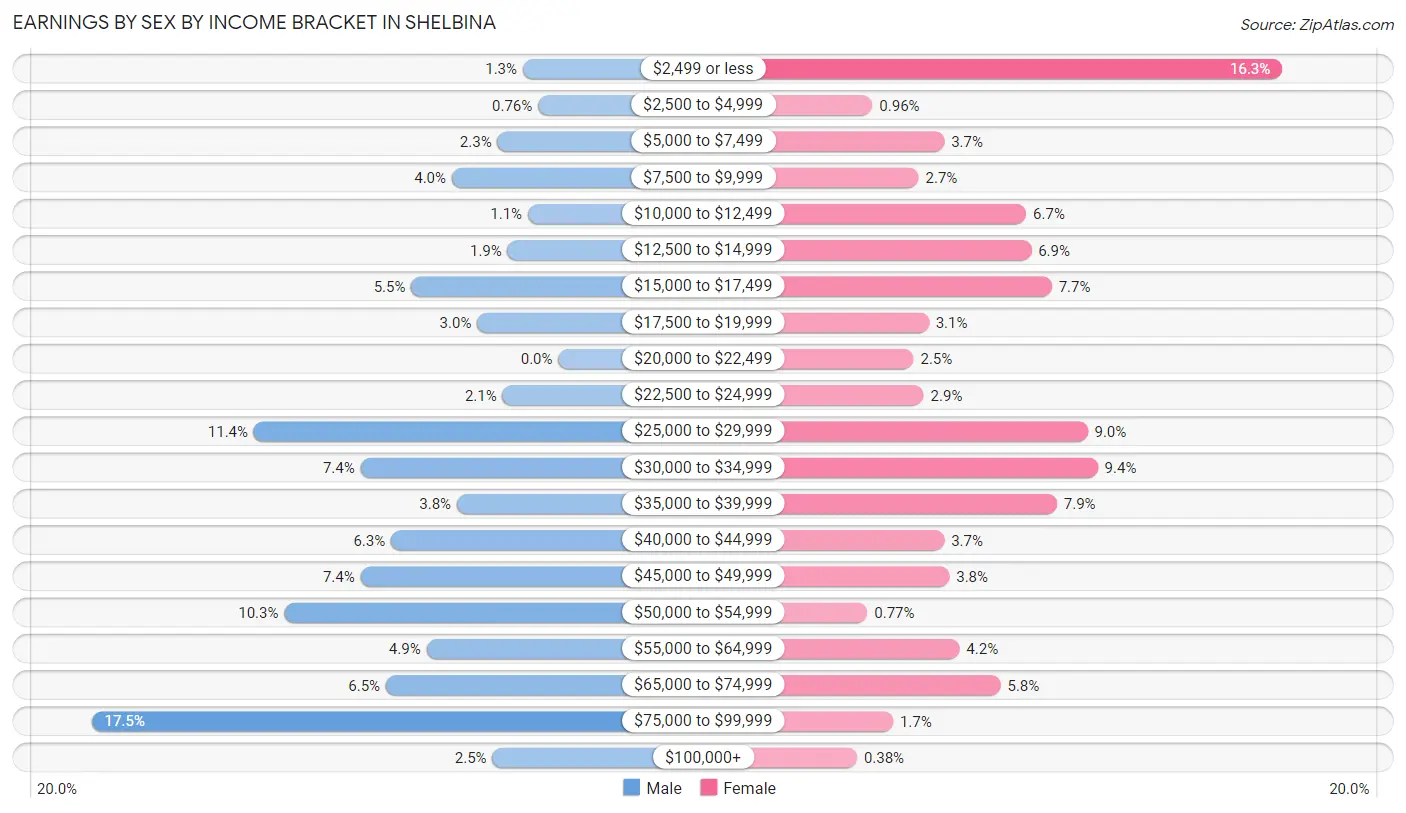
Earnings by Sex by Income Bracket in Shelbina
The most common earnings brackets in Shelbina are $75,000 to $99,999 for men (92 | 17.5%) and $2,499 or less for women (85 | 16.3%).
| Income | Male | Female |
| $2,499 or less | 7 (1.3%) | 85 (16.3%) |
| $2,500 to $4,999 | 4 (0.8%) | 5 (1.0%) |
| $5,000 to $7,499 | 12 (2.3%) | 19 (3.6%) |
| $7,500 to $9,999 | 21 (4.0%) | 14 (2.7%) |
| $10,000 to $12,499 | 6 (1.1%) | 35 (6.7%) |
| $12,500 to $14,999 | 10 (1.9%) | 36 (6.9%) |
| $15,000 to $17,499 | 29 (5.5%) | 40 (7.7%) |
| $17,500 to $19,999 | 16 (3.0%) | 16 (3.1%) |
| $20,000 to $22,499 | 0 (0.0%) | 13 (2.5%) |
| $22,500 to $24,999 | 11 (2.1%) | 15 (2.9%) |
| $25,000 to $29,999 | 60 (11.4%) | 47 (9.0%) |
| $30,000 to $34,999 | 39 (7.4%) | 49 (9.4%) |
| $35,000 to $39,999 | 20 (3.8%) | 41 (7.9%) |
| $40,000 to $44,999 | 33 (6.3%) | 19 (3.6%) |
| $45,000 to $49,999 | 39 (7.4%) | 20 (3.8%) |
| $50,000 to $54,999 | 54 (10.3%) | 4 (0.8%) |
| $55,000 to $64,999 | 26 (4.9%) | 22 (4.2%) |
| $65,000 to $74,999 | 34 (6.5%) | 30 (5.8%) |
| $75,000 to $99,999 | 92 (17.5%) | 9 (1.7%) |
| $100,000+ | 13 (2.5%) | 2 (0.4%) |
| Total | 526 (100.0%) | 521 (100.0%) |
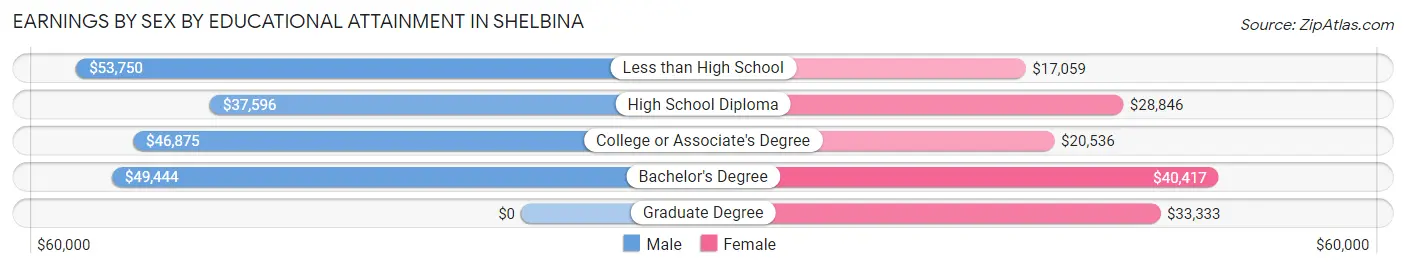
Earnings by Sex by Educational Attainment in Shelbina
Average earnings in Shelbina are $46,429 for men and $28,000 for women, a difference of 39.7%. Men with an educational attainment of less than high school enjoy the highest average annual earnings of $53,750, while those with high school diploma education earn the least with $37,596. Women with an educational attainment of bachelor's degree earn the most with the average annual earnings of $40,417, while those with less than high school education have the smallest earnings of $17,059.
| Educational Attainment | Male Income | Female Income |
| Less than High School | $53,750 | $17,059 |
| High School Diploma | $37,596 | $28,846 |
| College or Associate's Degree | $46,875 | $20,536 |
| Bachelor's Degree | $49,444 | $40,417 |
| Graduate Degree | - | - |
| Total | $46,429 | $28,000 |
Family Income in Shelbina
Family Income Brackets in Shelbina
According to the Shelbina family income data, there are 108 families falling into the $50,000 to $74,999 income range, which is the most common income bracket and makes up 23.6% of all families. Conversely, the $200,000+ income bracket is the least frequent group with only 11 families (2.4%) belonging to this category.
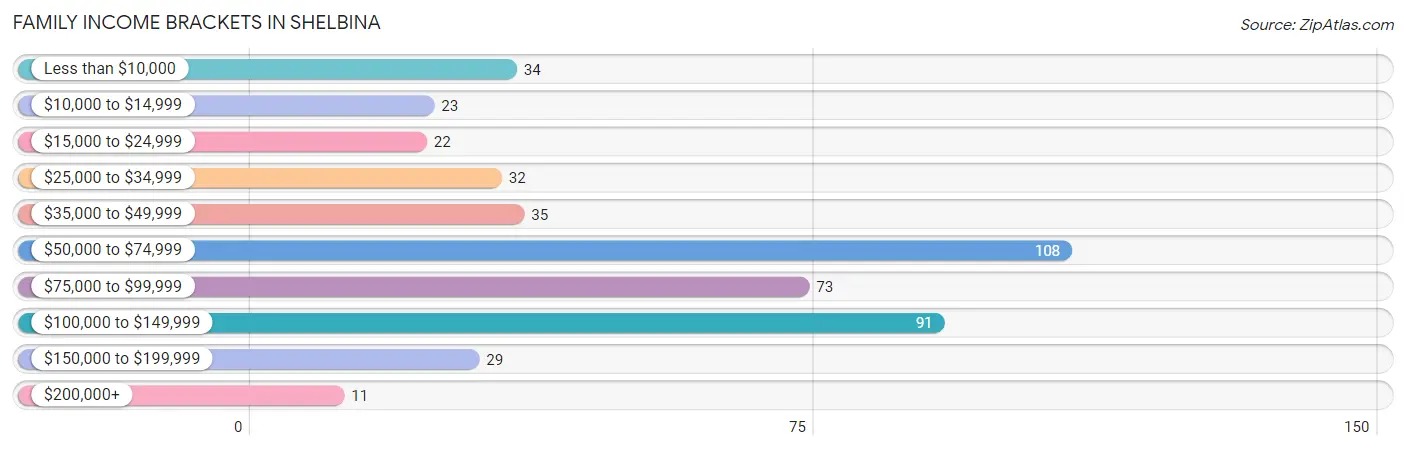
| Income Bracket | # Families | % Families |
| Less than $10,000 | 34 | 7.4% |
| $10,000 to $14,999 | 23 | 5.0% |
| $15,000 to $24,999 | 22 | 4.8% |
| $25,000 to $34,999 | 32 | 7.0% |
| $35,000 to $49,999 | 35 | 7.6% |
| $50,000 to $74,999 | 108 | 23.6% |
| $75,000 to $99,999 | 73 | 15.9% |
| $100,000 to $149,999 | 91 | 19.9% |
| $150,000 to $199,999 | 29 | 6.3% |
| $200,000+ | 11 | 2.4% |
Family Income by Famaliy Size in Shelbina
5-person families (88 | 19.2%) account for the highest median family income in Shelbina with $101,111 per family, while 3-person families (152 | 33.2%) have the highest median income of $28,750 per family member.
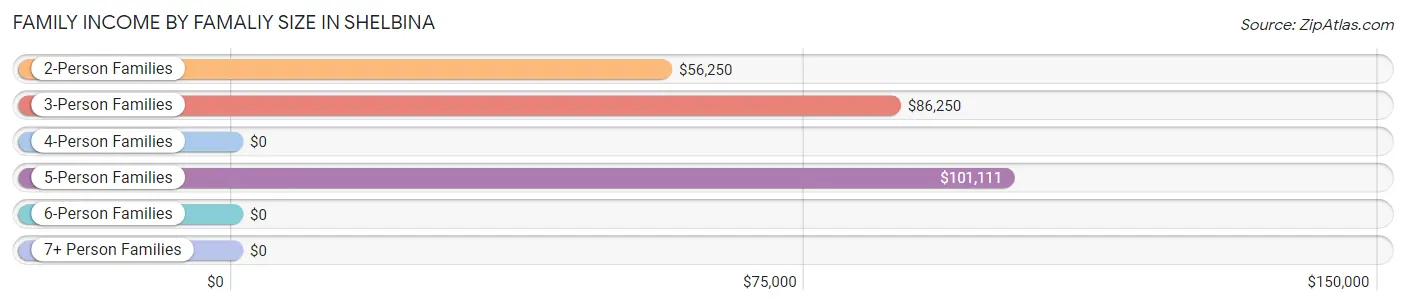
| Income Bracket | # Families | Median Income |
| 2-Person Families | 157 (34.3%) | $56,250 |
| 3-Person Families | 152 (33.2%) | $86,250 |
| 4-Person Families | 37 (8.1%) | $0 |
| 5-Person Families | 88 (19.2%) | $101,111 |
| 6-Person Families | 21 (4.6%) | $0 |
| 7+ Person Families | 3 (0.7%) | $0 |
| Total | 458 (100.0%) | $63,654 |
Family Income by Number of Earners in Shelbina
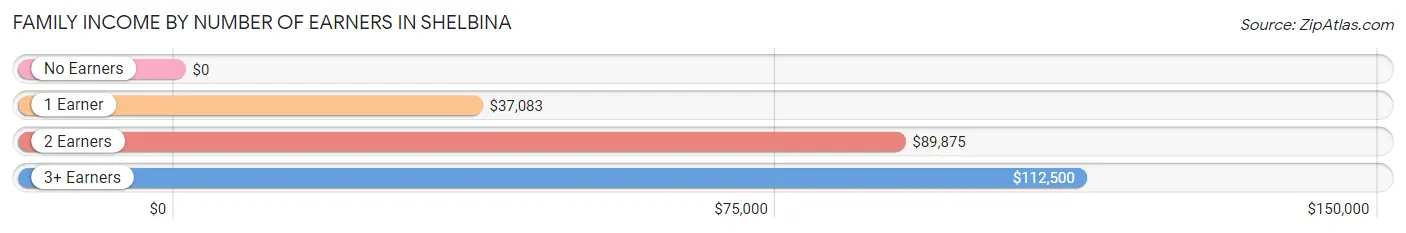
| Number of Earners | # Families | Median Income |
| No Earners | 77 (16.8%) | $0 |
| 1 Earner | 124 (27.1%) | $37,083 |
| 2 Earners | 199 (43.4%) | $89,875 |
| 3+ Earners | 58 (12.7%) | $112,500 |
| Total | 458 (100.0%) | $63,654 |
Household Income in Shelbina
Household Income Brackets in Shelbina
With 126 households falling in the category, the $50,000 to $74,999 income range is the most frequent in Shelbina, accounting for 16.8% of all households. In contrast, only 11 households (1.5%) fall into the $200,000+ income bracket, making it the least populous group.
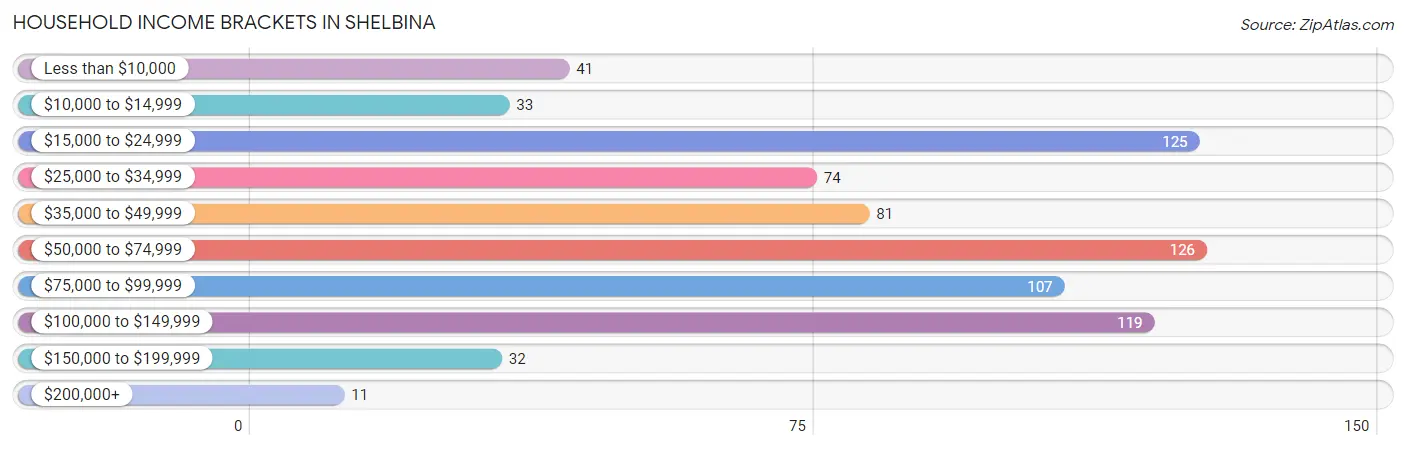
| Income Bracket | # Households | % Households |
| Less than $10,000 | 41 | 5.5% |
| $10,000 to $14,999 | 33 | 4.4% |
| $15,000 to $24,999 | 125 | 16.7% |
| $25,000 to $34,999 | 74 | 9.9% |
| $35,000 to $49,999 | 81 | 10.8% |
| $50,000 to $74,999 | 126 | 16.8% |
| $75,000 to $99,999 | 107 | 14.3% |
| $100,000 to $149,999 | 119 | 15.9% |
| $150,000 to $199,999 | 32 | 4.3% |
| $200,000+ | 11 | 1.5% |
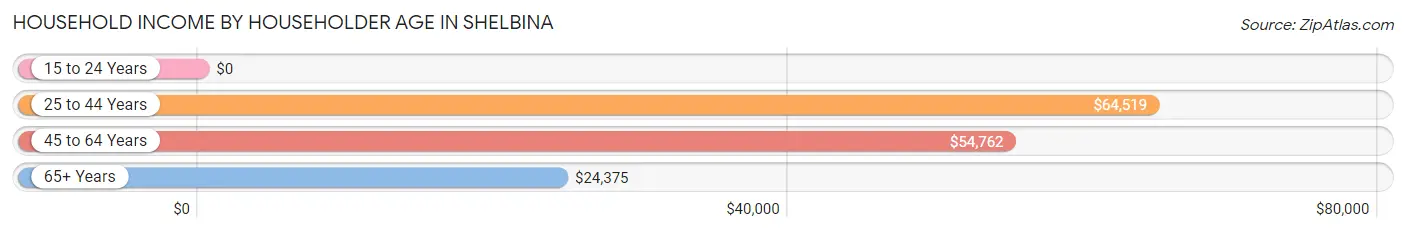
Household Income by Householder Age in Shelbina
The median household income in Shelbina is $52,050, with the highest median household income of $64,519 found in the 25 to 44 years age bracket for the primary householder. A total of 248 households (33.1%) fall into this category. Meanwhile, the 15 to 24 years age bracket for the primary householder has the lowest median household income of $0, with 22 households (2.9%) in this group.
| Income Bracket | # Households | Median Income |
| 15 to 24 Years | 22 (2.9%) | $0 |
| 25 to 44 Years | 248 (33.1%) | $64,519 |
| 45 to 64 Years | 242 (32.3%) | $54,762 |
| 65+ Years | 237 (31.6%) | $24,375 |
| Total | 749 (100.0%) | $52,050 |
Poverty in Shelbina
Income Below Poverty by Sex and Age in Shelbina
With 14.3% poverty level for males and 18.2% for females among the residents of Shelbina, 5 year old males and 12 to 14 year old females are the most vulnerable to poverty, with 6 males (46.2%) and 8 females (44.4%) in their respective age groups living below the poverty level.
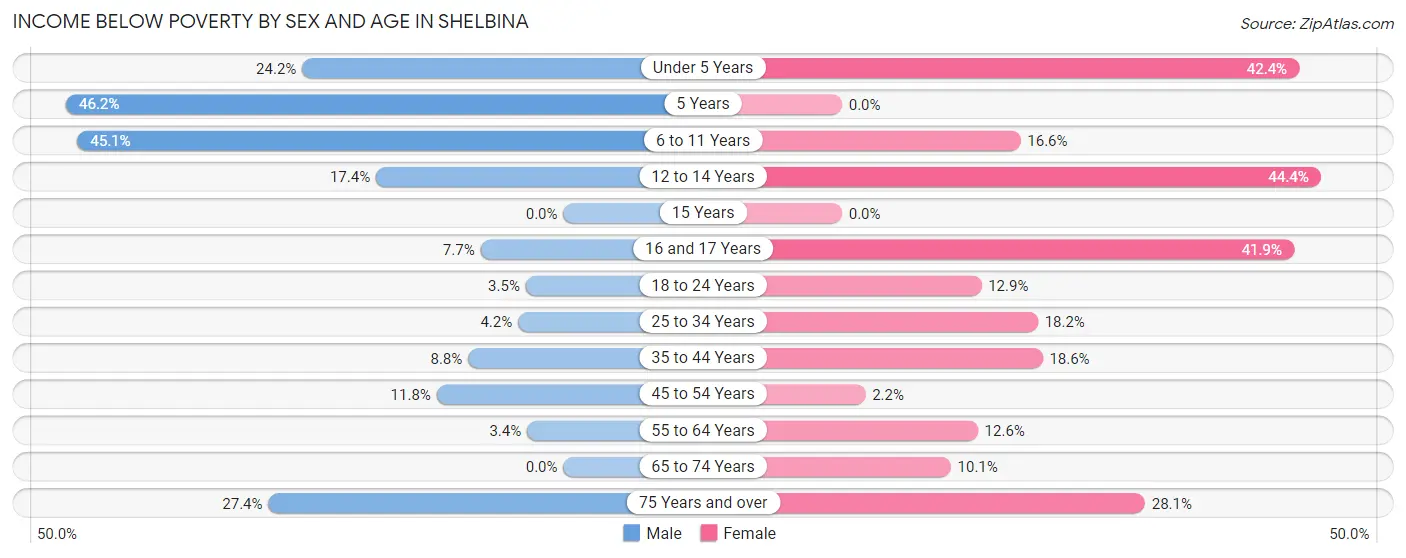
| Age Bracket | Male | Female |
| Under 5 Years | 16 (24.2%) | 28 (42.4%) |
| 5 Years | 6 (46.2%) | 0 (0.0%) |
| 6 to 11 Years | 46 (45.1%) | 30 (16.6%) |
| 12 to 14 Years | 12 (17.4%) | 8 (44.4%) |
| 15 Years | 0 (0.0%) | 0 (0.0%) |
| 16 and 17 Years | 1 (7.7%) | 13 (41.9%) |
| 18 to 24 Years | 3 (3.5%) | 11 (12.9%) |
| 25 to 34 Years | 5 (4.2%) | 22 (18.2%) |
| 35 to 44 Years | 13 (8.8%) | 27 (18.6%) |
| 45 to 54 Years | 16 (11.8%) | 2 (2.2%) |
| 55 to 64 Years | 3 (3.4%) | 14 (12.6%) |
| 65 to 74 Years | 0 (0.0%) | 10 (10.1%) |
| 75 Years and over | 23 (27.4%) | 27 (28.1%) |
| Total | 144 (14.3%) | 192 (18.2%) |
Income Above Poverty by Sex and Age in Shelbina
According to the poverty statistics in Shelbina, males aged 15 years and females aged 5 years are the age groups that are most secure financially, with 100.0% of males and 100.0% of females in these age groups living above the poverty line.
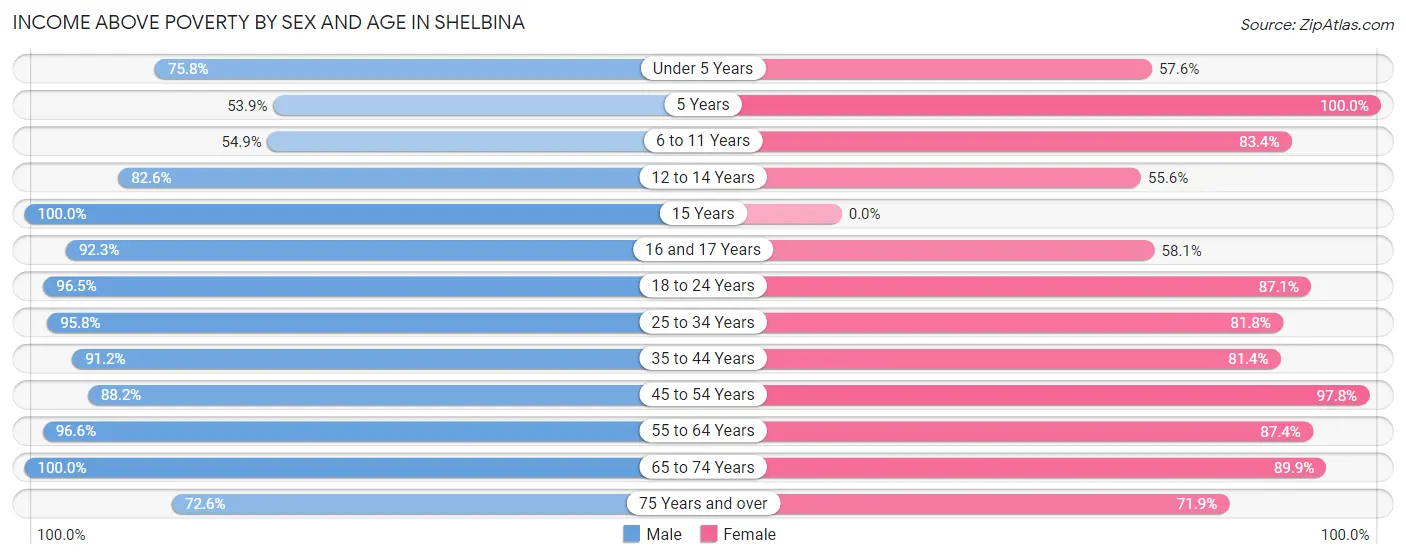
| Age Bracket | Male | Female |
| Under 5 Years | 50 (75.8%) | 38 (57.6%) |
| 5 Years | 7 (53.8%) | 10 (100.0%) |
| 6 to 11 Years | 56 (54.9%) | 151 (83.4%) |
| 12 to 14 Years | 57 (82.6%) | 10 (55.6%) |
| 15 Years | 4 (100.0%) | 0 (0.0%) |
| 16 and 17 Years | 12 (92.3%) | 18 (58.1%) |
| 18 to 24 Years | 83 (96.5%) | 74 (87.1%) |
| 25 to 34 Years | 114 (95.8%) | 99 (81.8%) |
| 35 to 44 Years | 134 (91.2%) | 118 (81.4%) |
| 45 to 54 Years | 120 (88.2%) | 90 (97.8%) |
| 55 to 64 Years | 86 (96.6%) | 97 (87.4%) |
| 65 to 74 Years | 82 (100.0%) | 89 (89.9%) |
| 75 Years and over | 61 (72.6%) | 69 (71.9%) |
| Total | 866 (85.7%) | 863 (81.8%) |
Income Below Poverty Among Married-Couple Families in Shelbina
The poverty statistics for married-couple families in Shelbina show that 7.3% or 26 of the total 355 families live below the poverty line. Families with no children have the highest poverty rate of 11.6%, comprising of 20 families. On the other hand, families with 3 or 4 children have the lowest poverty rate of 0.0%, which includes 0 families.
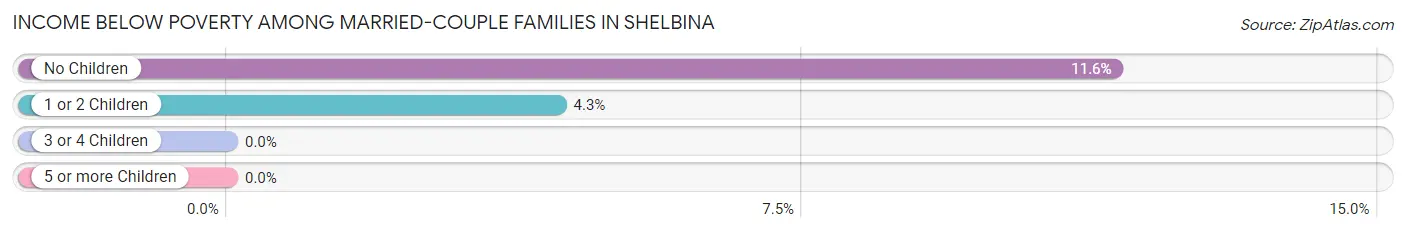
| Children | Above Poverty | Below Poverty |
| No Children | 153 (88.4%) | 20 (11.6%) |
| 1 or 2 Children | 134 (95.7%) | 6 (4.3%) |
| 3 or 4 Children | 42 (100.0%) | 0 (0.0%) |
| 5 or more Children | 0 (0.0%) | 0 (0.0%) |
| Total | 329 (92.7%) | 26 (7.3%) |
Income Below Poverty Among Single-Parent Households in Shelbina
According to the poverty data in Shelbina, 20.0% or 7 single-father households and 57.4% or 39 single-mother households are living below the poverty line. Among single-father households, those with 1 or 2 children have the highest poverty rate, with 7 households (20.0%) experiencing poverty. Likewise, among single-mother households, those with 3 or 4 children have the highest poverty rate, with 30 households (100.0%) falling below the poverty line.
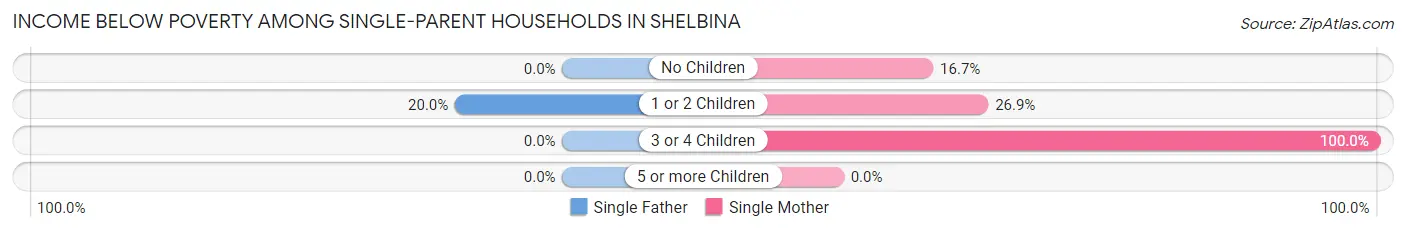
| Children | Single Father | Single Mother |
| No Children | 0 (0.0%) | 2 (16.7%) |
| 1 or 2 Children | 7 (20.0%) | 7 (26.9%) |
| 3 or 4 Children | 0 (0.0%) | 30 (100.0%) |
| 5 or more Children | 0 (0.0%) | 0 (0.0%) |
| Total | 7 (20.0%) | 39 (57.4%) |
Income Below Poverty Among Married-Couple vs Single-Parent Households in Shelbina
The poverty data for Shelbina shows that 26 of the married-couple family households (7.3%) and 46 of the single-parent households (44.7%) are living below the poverty level. Within the married-couple family households, those with no children have the highest poverty rate, with 20 households (11.6%) falling below the poverty line. Among the single-parent households, those with 3 or 4 children have the highest poverty rate, with 30 household (100.0%) living below poverty.
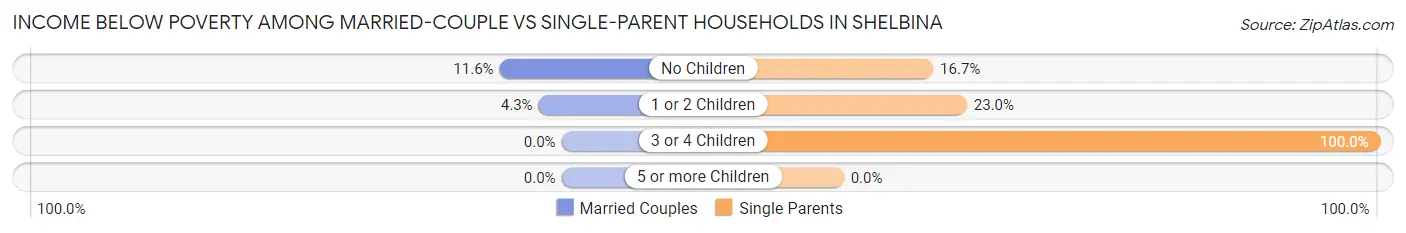
| Children | Married-Couple Families | Single-Parent Households |
| No Children | 20 (11.6%) | 2 (16.7%) |
| 1 or 2 Children | 6 (4.3%) | 14 (23.0%) |
| 3 or 4 Children | 0 (0.0%) | 30 (100.0%) |
| 5 or more Children | 0 (0.0%) | 0 (0.0%) |
| Total | 26 (7.3%) | 46 (44.7%) |
Race in Shelbina
The most populous races in Shelbina are White / Caucasian (2,039 | 94.2%), Black / African American (77 | 3.6%), and Hispanic or Latino (45 | 2.1%).
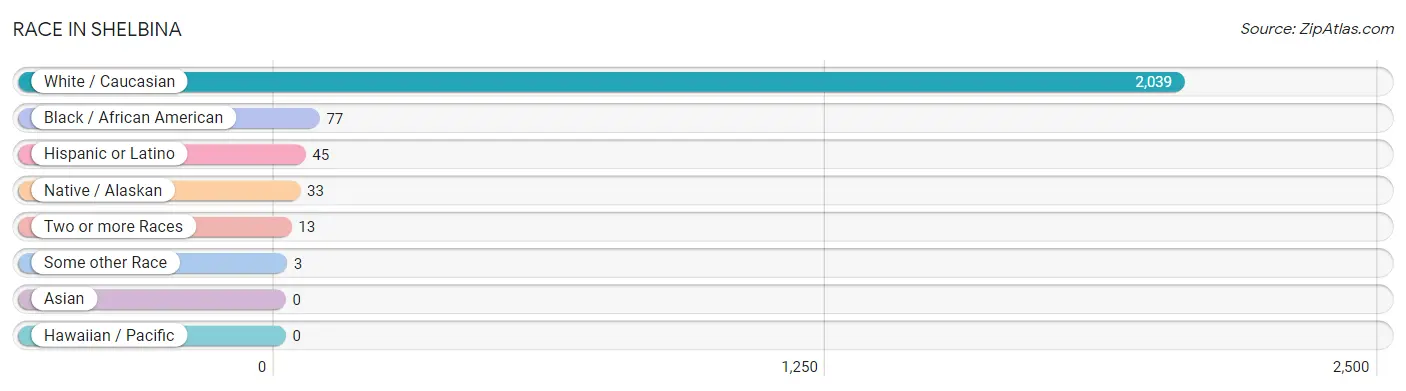
| Race | # Population | % Population |
| Asian | 0 | 0.0% |
| Black / African American | 77 | 3.6% |
| Hawaiian / Pacific | 0 | 0.0% |
| Hispanic or Latino | 45 | 2.1% |
| Native / Alaskan | 33 | 1.5% |
| White / Caucasian | 2,039 | 94.2% |
| Two or more Races | 13 | 0.6% |
| Some other Race | 3 | 0.1% |
| Total | 2,165 | 100.0% |
Ancestry in Shelbina
The most populous ancestries reported in Shelbina are German (520 | 24.0%), English (376 | 17.4%), Irish (328 | 15.1%), American (158 | 7.3%), and French (94 | 4.3%), together accounting for 68.2% of all Shelbina residents.
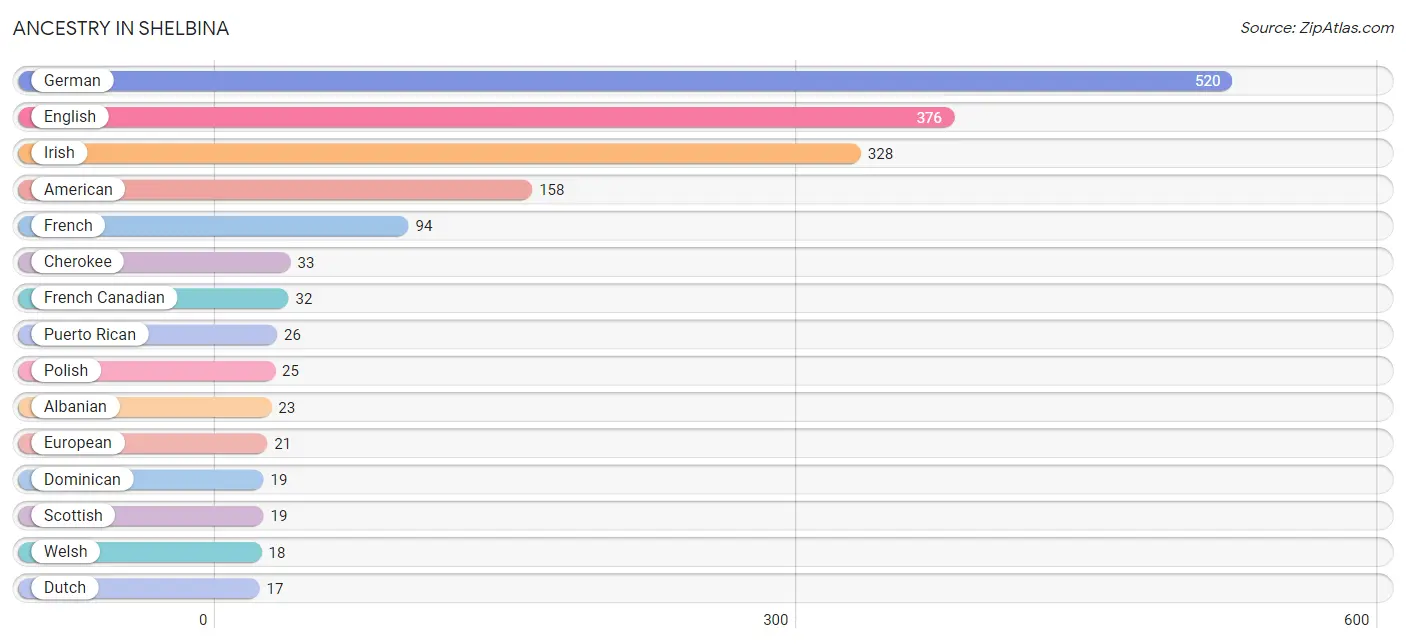
| Ancestry | # Population | % Population |
| Albanian | 23 | 1.1% |
| American | 158 | 7.3% |
| Austrian | 3 | 0.1% |
| Belgian | 14 | 0.6% |
| Blackfeet | 2 | 0.1% |
| British | 1 | 0.1% |
| Cherokee | 33 | 1.5% |
| Czech | 3 | 0.1% |
| Dominican | 19 | 0.9% |
| Dutch | 17 | 0.8% |
| English | 376 | 17.4% |
| European | 21 | 1.0% |
| French | 94 | 4.3% |
| French Canadian | 32 | 1.5% |
| German | 520 | 24.0% |
| Irish | 328 | 15.1% |
| Italian | 5 | 0.2% |
| Lithuanian | 1 | 0.1% |
| Norwegian | 10 | 0.5% |
| Polish | 25 | 1.1% |
| Puerto Rican | 26 | 1.2% |
| Scotch-Irish | 17 | 0.8% |
| Scottish | 19 | 0.9% |
| Swedish | 14 | 0.6% |
| Welsh | 18 | 0.8% | View All 25 Rows |
Immigrants in Shelbina
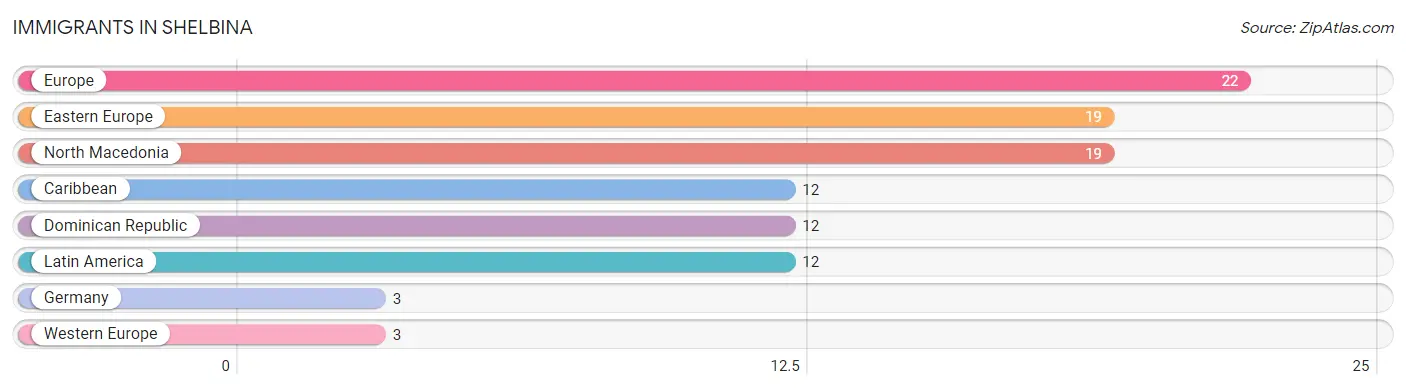
The most numerous immigrant groups reported in Shelbina came from Europe (22 | 1.0%), Eastern Europe (19 | 0.9%), North Macedonia (19 | 0.9%), Caribbean (12 | 0.5%), and Dominican Republic (12 | 0.5%), together accounting for 3.9% of all Shelbina residents.
| Immigration Origin | # Population | % Population |
| Caribbean | 12 | 0.5% |
| Dominican Republic | 12 | 0.5% |
| Eastern Europe | 19 | 0.9% |
| Europe | 22 | 1.0% |
| Germany | 3 | 0.1% |
| Latin America | 12 | 0.5% |
| North Macedonia | 19 | 0.9% |
| Western Europe | 3 | 0.1% | View All 8 Rows |
Sex and Age in Shelbina
Sex and Age in Shelbina
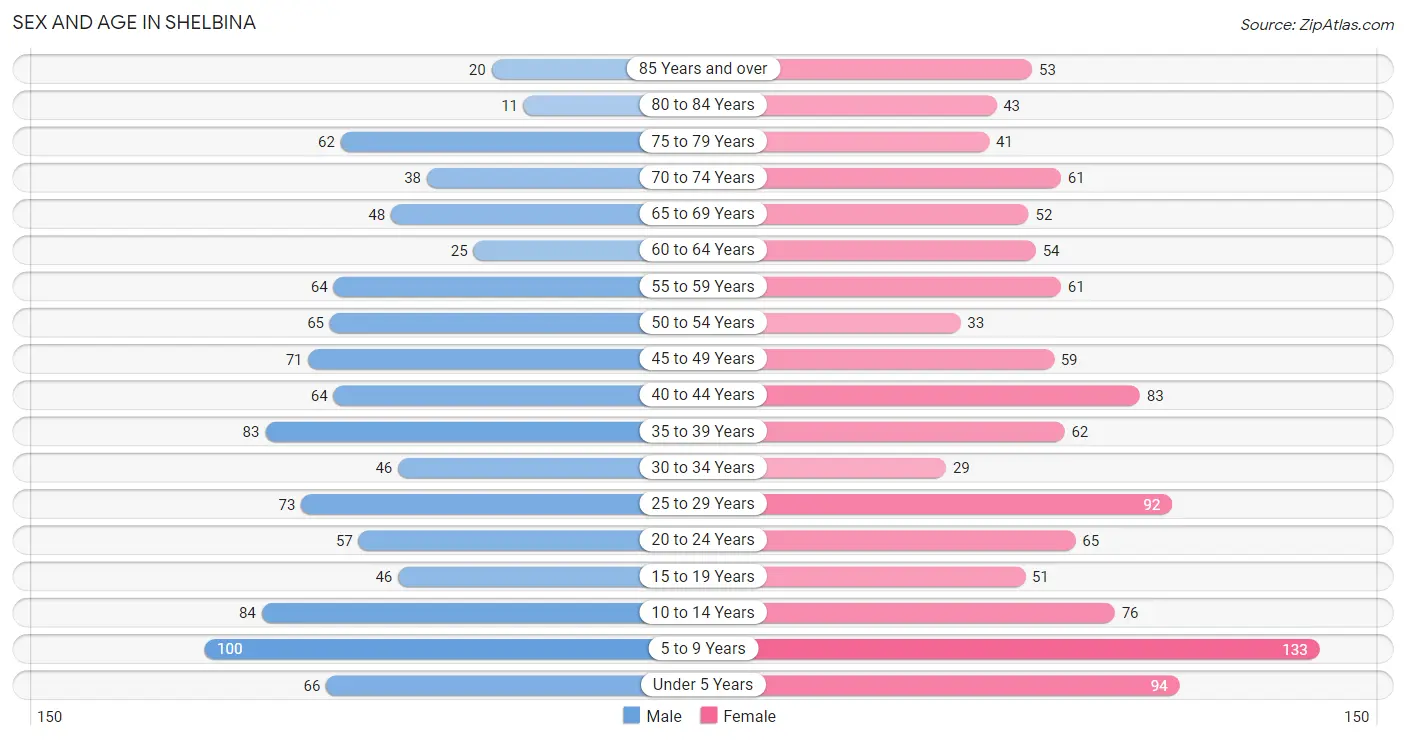
The most populous age groups in Shelbina are 5 to 9 Years (100 | 9.8%) for men and 5 to 9 Years (133 | 11.7%) for women.
| Age Bracket | Male | Female |
| Under 5 Years | 66 (6.5%) | 94 (8.2%) |
| 5 to 9 Years | 100 (9.8%) | 133 (11.7%) |
| 10 to 14 Years | 84 (8.2%) | 76 (6.7%) |
| 15 to 19 Years | 46 (4.5%) | 51 (4.5%) |
| 20 to 24 Years | 57 (5.6%) | 65 (5.7%) |
| 25 to 29 Years | 73 (7.1%) | 92 (8.1%) |
| 30 to 34 Years | 46 (4.5%) | 29 (2.5%) |
| 35 to 39 Years | 83 (8.1%) | 62 (5.4%) |
| 40 to 44 Years | 64 (6.3%) | 83 (7.3%) |
| 45 to 49 Years | 71 (6.9%) | 59 (5.2%) |
| 50 to 54 Years | 65 (6.4%) | 33 (2.9%) |
| 55 to 59 Years | 64 (6.3%) | 61 (5.3%) |
| 60 to 64 Years | 25 (2.4%) | 54 (4.7%) |
| 65 to 69 Years | 48 (4.7%) | 52 (4.5%) |
| 70 to 74 Years | 38 (3.7%) | 61 (5.3%) |
| 75 to 79 Years | 62 (6.1%) | 41 (3.6%) |
| 80 to 84 Years | 11 (1.1%) | 43 (3.8%) |
| 85 Years and over | 20 (2.0%) | 53 (4.6%) |
| Total | 1,023 (100.0%) | 1,142 (100.0%) |
Families and Households in Shelbina
Median Family Size in Shelbina
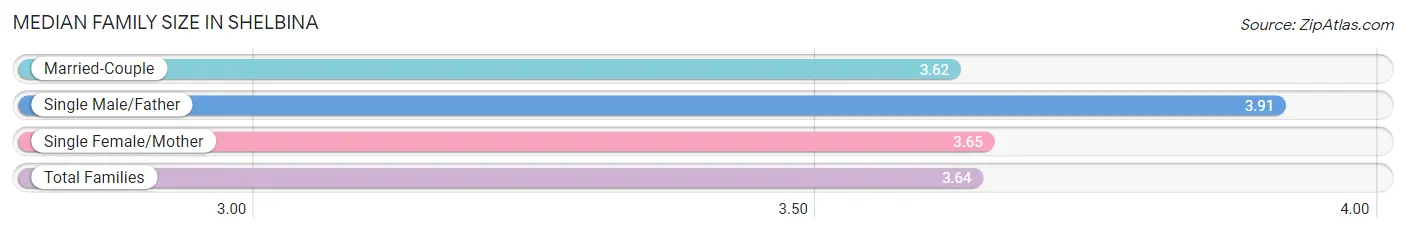
The median family size in Shelbina is 3.64 persons per family, with single male/father families (35 | 7.6%) accounting for the largest median family size of 3.91 persons per family. On the other hand, married-couple families (355 | 77.5%) represent the smallest median family size with 3.62 persons per family.
| Family Type | # Families | Family Size |
| Married-Couple | 355 (77.5%) | 3.62 |
| Single Male/Father | 35 (7.6%) | 3.91 |
| Single Female/Mother | 68 (14.8%) | 3.65 |
| Total Families | 458 (100.0%) | 3.64 |
Median Household Size in Shelbina
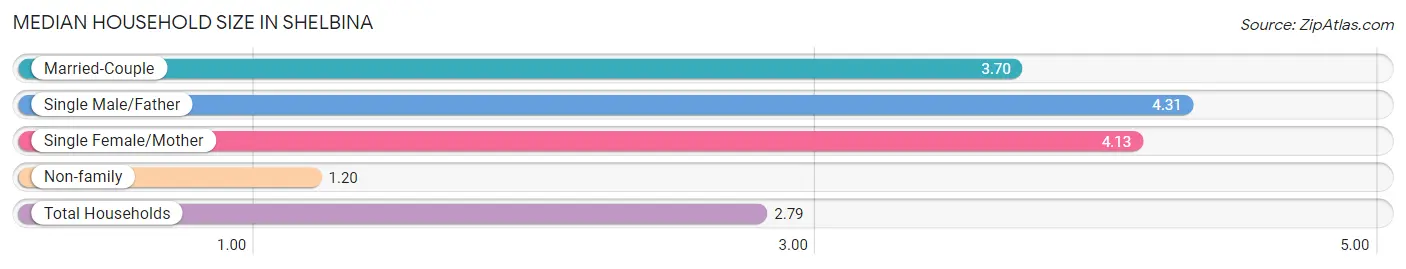
The median household size in Shelbina is 2.79 persons per household, with single male/father households (35 | 4.7%) accounting for the largest median household size of 4.31 persons per household. non-family households (291 | 38.9%) represent the smallest median household size with 1.20 persons per household.
| Household Type | # Households | Household Size |
| Married-Couple | 355 (47.4%) | 3.70 |
| Single Male/Father | 35 (4.7%) | 4.31 |
| Single Female/Mother | 68 (9.1%) | 4.13 |
| Non-family | 291 (38.9%) | 1.20 |
| Total Households | 749 (100.0%) | 2.79 |
Household Size by Marriage Status in Shelbina
Out of a total of 749 households in Shelbina, 458 (61.2%) are family households, while 291 (38.9%) are nonfamily households. The most numerous type of family households are 2-person households, comprising 154, and the most common type of nonfamily households are 1-person households, comprising 247.
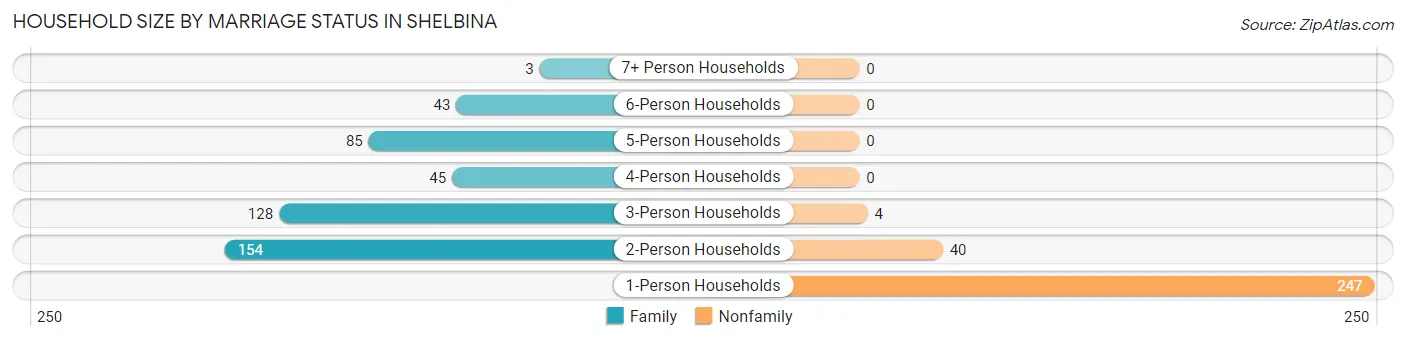
| Household Size | Family Households | Nonfamily Households |
| 1-Person Households | - | 247 (33.0%) |
| 2-Person Households | 154 (20.6%) | 40 (5.3%) |
| 3-Person Households | 128 (17.1%) | 4 (0.5%) |
| 4-Person Households | 45 (6.0%) | 0 (0.0%) |
| 5-Person Households | 85 (11.4%) | 0 (0.0%) |
| 6-Person Households | 43 (5.7%) | 0 (0.0%) |
| 7+ Person Households | 3 (0.4%) | 0 (0.0%) |
| Total | 458 (61.2%) | 291 (38.9%) |
Female Fertility in Shelbina
Fertility by Age in Shelbina
Average fertility rate in Shelbina is 122.0 births per 1,000 women. Women in the age bracket of 20 to 34 years have the highest fertility rate with 194.0 births per 1,000 women. Women in the age bracket of 20 to 34 years acount for 66.7% of all women with births.
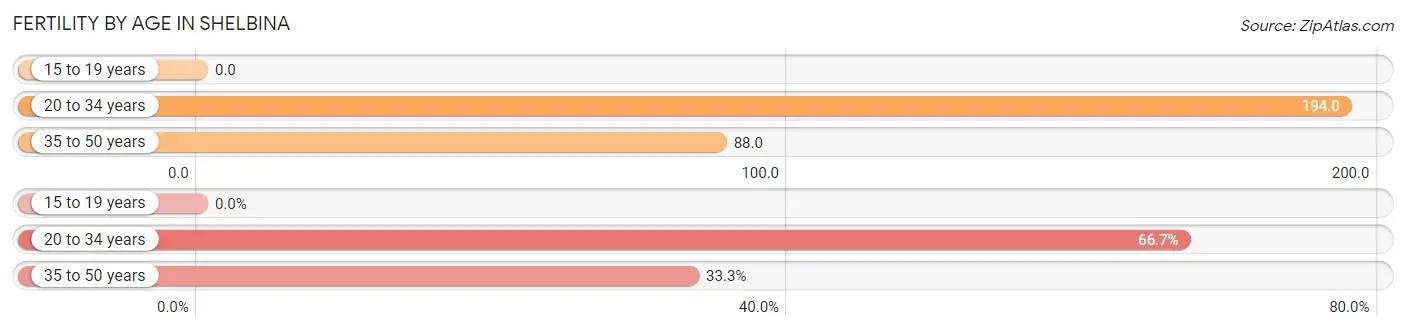
| Age Bracket | Women with Births | Births / 1,000 Women |
| 15 to 19 years | 0 (0.0%) | 0.0 |
| 20 to 34 years | 36 (66.7%) | 194.0 |
| 35 to 50 years | 18 (33.3%) | 88.0 |
| Total | 54 (100.0%) | 122.0 |
Fertility by Age by Marriage Status in Shelbina
81.5% of women with births (54) in Shelbina are married. The highest percentage of unmarried women with births falls into 35 to 50 years age bracket with 55.6% of them unmarried at the time of birth, while the lowest percentage of unmarried women with births belong to 20 to 34 years age bracket with 0.0% of them unmarried.
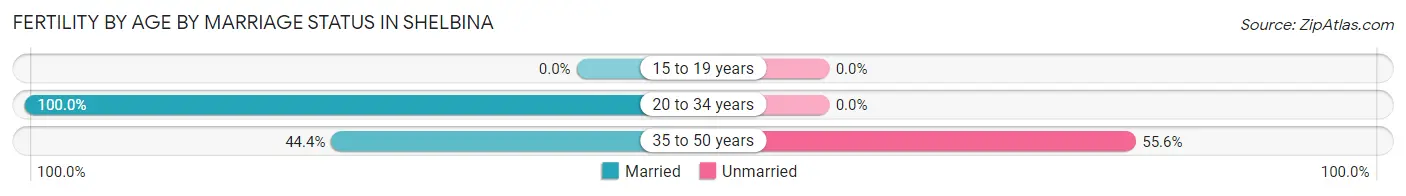
| Age Bracket | Married | Unmarried |
| 15 to 19 years | 0 (0.0%) | 0 (0.0%) |
| 20 to 34 years | 36 (100.0%) | 0 (0.0%) |
| 35 to 50 years | 8 (44.4%) | 10 (55.6%) |
| Total | 44 (81.5%) | 10 (18.5%) |
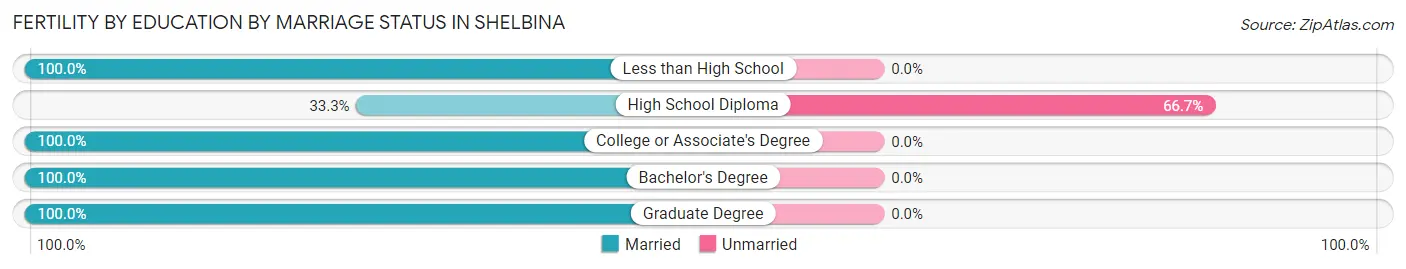
Fertility by Education in Shelbina
Average fertility rate in Shelbina is 122.0 births per 1,000 women. Women with the education attainment of bachelor's degree have the highest fertility rate of 304.0 births per 1,000 women, while women with the education attainment of college or associate's degree have the lowest fertility at 46.0 births per 1,000 women. Women with the education attainment of bachelor's degree represent 31.5% of all women with births.
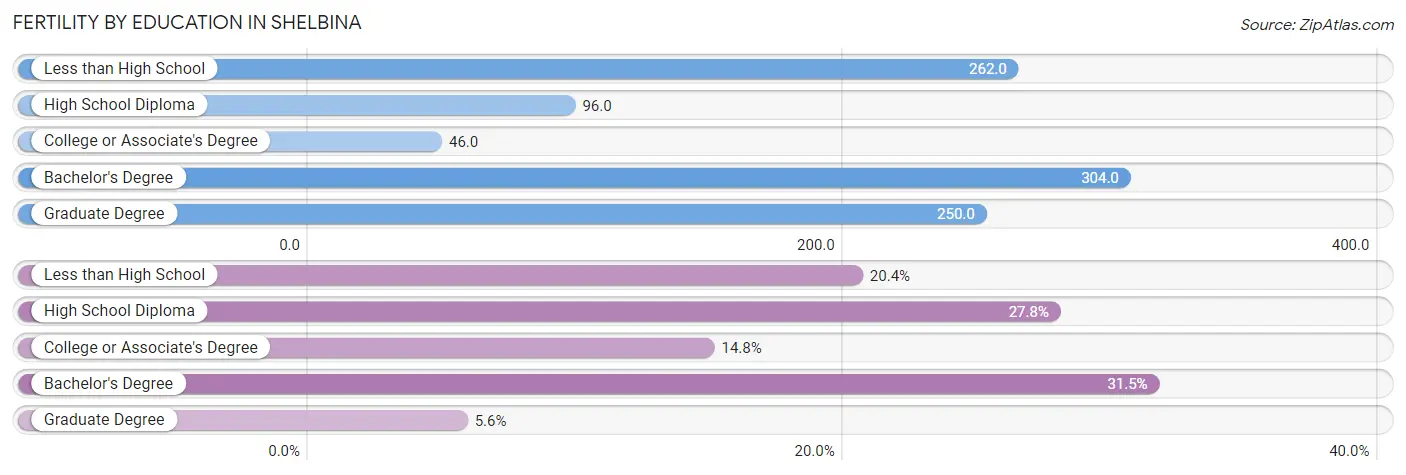
| Educational Attainment | Women with Births | Births / 1,000 Women |
| Less than High School | 11 (20.4%) | 262.0 |
| High School Diploma | 15 (27.8%) | 96.0 |
| College or Associate's Degree | 8 (14.8%) | 46.0 |
| Bachelor's Degree | 17 (31.5%) | 304.0 |
| Graduate Degree | 3 (5.6%) | 250.0 |
| Total | 54 (100.0%) | 122.0 |
Fertility by Education by Marriage Status in Shelbina
18.5% of women with births in Shelbina are unmarried. Women with the educational attainment of less than high school are most likely to be married with 100.0% of them married at childbirth, while women with the educational attainment of high school diploma are least likely to be married with 66.7% of them unmarried at childbirth.
| Educational Attainment | Married | Unmarried |
| Less than High School | 11 (100.0%) | 0 (0.0%) |
| High School Diploma | 5 (33.3%) | 10 (66.7%) |
| College or Associate's Degree | 8 (100.0%) | 0 (0.0%) |
| Bachelor's Degree | 17 (100.0%) | 0 (0.0%) |
| Graduate Degree | 3 (100.0%) | 0 (0.0%) |
| Total | 44 (81.5%) | 10 (18.5%) |
Employment Characteristics in Shelbina
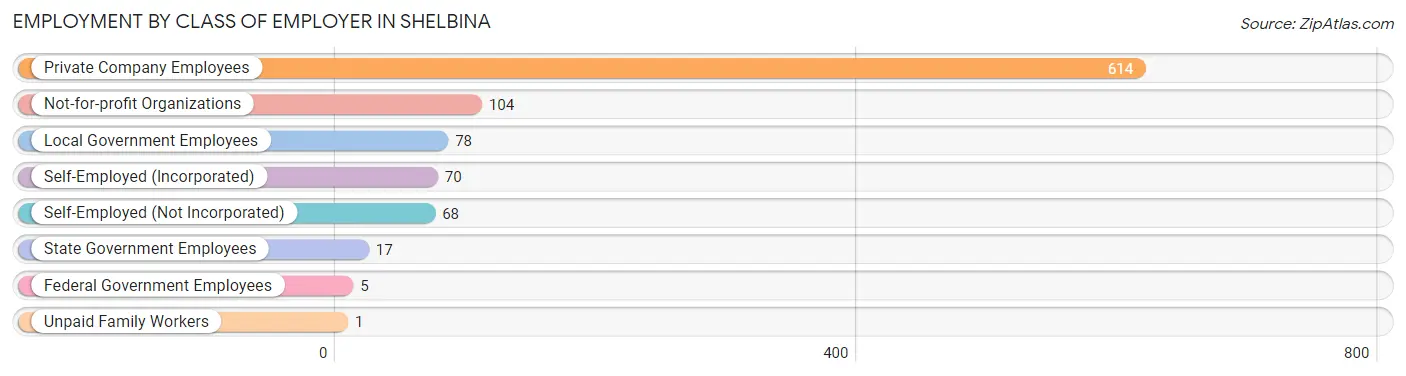
Employment by Class of Employer in Shelbina
Among the 957 employed individuals in Shelbina, private company employees (614 | 64.2%), not-for-profit organizations (104 | 10.9%), and local government employees (78 | 8.2%) make up the most common classes of employment.
| Employer Class | # Employees | % Employees |
| Private Company Employees | 614 | 64.2% |
| Self-Employed (Incorporated) | 70 | 7.3% |
| Self-Employed (Not Incorporated) | 68 | 7.1% |
| Not-for-profit Organizations | 104 | 10.9% |
| Local Government Employees | 78 | 8.2% |
| State Government Employees | 17 | 1.8% |
| Federal Government Employees | 5 | 0.5% |
| Unpaid Family Workers | 1 | 0.1% |
| Total | 957 | 100.0% |
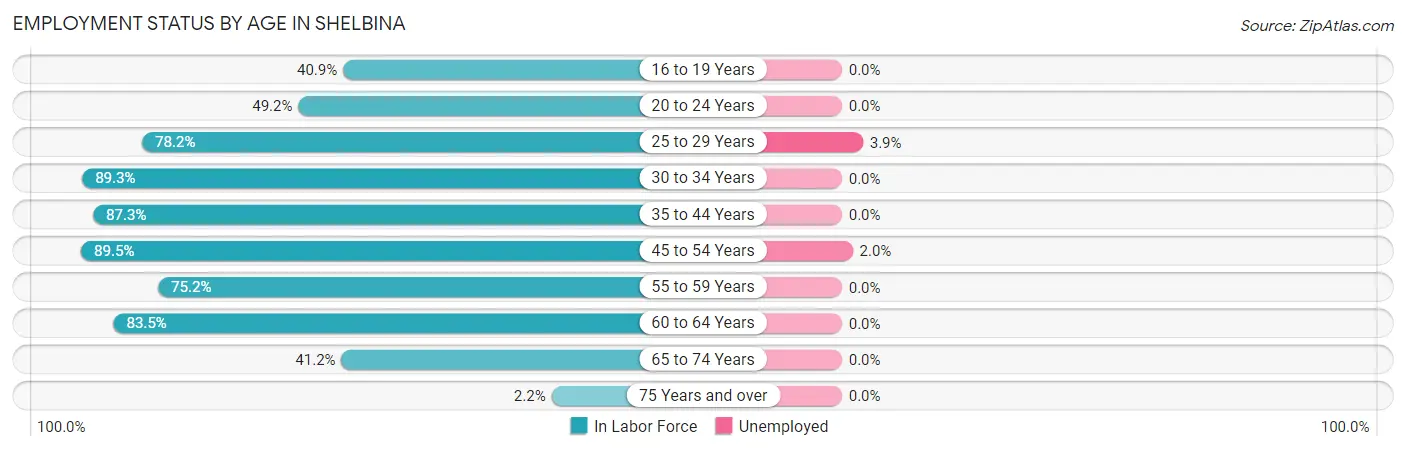
Employment Status by Age in Shelbina
According to the labor force statistics for Shelbina, out of the total population over 16 years of age (1,608), 62.2% or 1,000 individuals are in the labor force, with 0.9% or 9 of them unemployed. The age group with the highest labor force participation rate is 45 to 54 years, with 89.5% or 204 individuals in the labor force. Within the labor force, the 25 to 29 years age range has the highest percentage of unemployed individuals, with 3.9% or 5 of them being unemployed.
| Age Bracket | In Labor Force | Unemployed |
| 16 to 19 Years | 38 (40.9%) | 0 (0.0%) |
| 20 to 24 Years | 60 (49.2%) | 0 (0.0%) |
| 25 to 29 Years | 129 (78.2%) | 5 (3.9%) |
| 30 to 34 Years | 67 (89.3%) | 0 (0.0%) |
| 35 to 44 Years | 255 (87.3%) | 0 (0.0%) |
| 45 to 54 Years | 204 (89.5%) | 4 (2.0%) |
| 55 to 59 Years | 94 (75.2%) | 0 (0.0%) |
| 60 to 64 Years | 66 (83.5%) | 0 (0.0%) |
| 65 to 74 Years | 82 (41.2%) | 0 (0.0%) |
| 75 Years and over | 5 (2.2%) | 0 (0.0%) |
| Total | 1,000 (62.2%) | 9 (0.9%) |
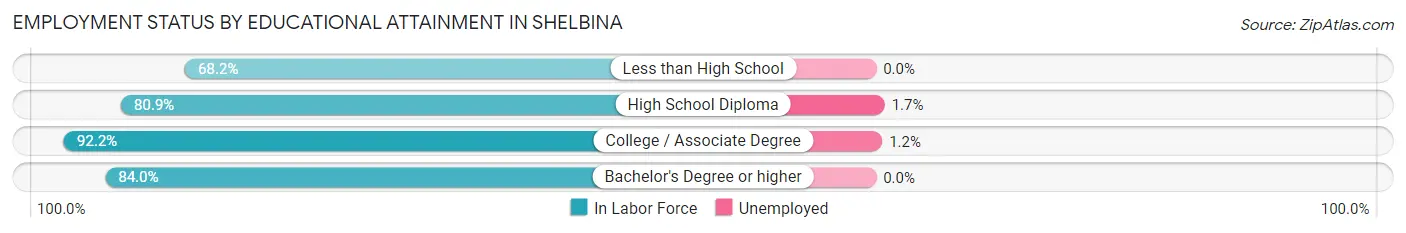
Employment Status by Educational Attainment in Shelbina
According to labor force statistics for Shelbina, 84.5% of individuals (815) out of the total population between 25 and 64 years of age (964) are in the labor force, with 1.1% or 9 of them being unemployed. The group with the highest labor force participation rate are those with the educational attainment of college / associate degree, with 92.2% or 345 individuals in the labor force. Within the labor force, individuals with high school diploma education have the highest percentage of unemployment, with 1.7% or 5 of them being unemployed.
| Educational Attainment | In Labor Force | Unemployed |
| Less than High School | 60 (68.2%) | 0 (0.0%) |
| High School Diploma | 300 (80.9%) | 6 (1.7%) |
| College / Associate Degree | 345 (92.2%) | 4 (1.2%) |
| Bachelor's Degree or higher | 110 (84.0%) | 0 (0.0%) |
| Total | 815 (84.5%) | 11 (1.1%) |
Employment Occupations by Sex in Shelbina
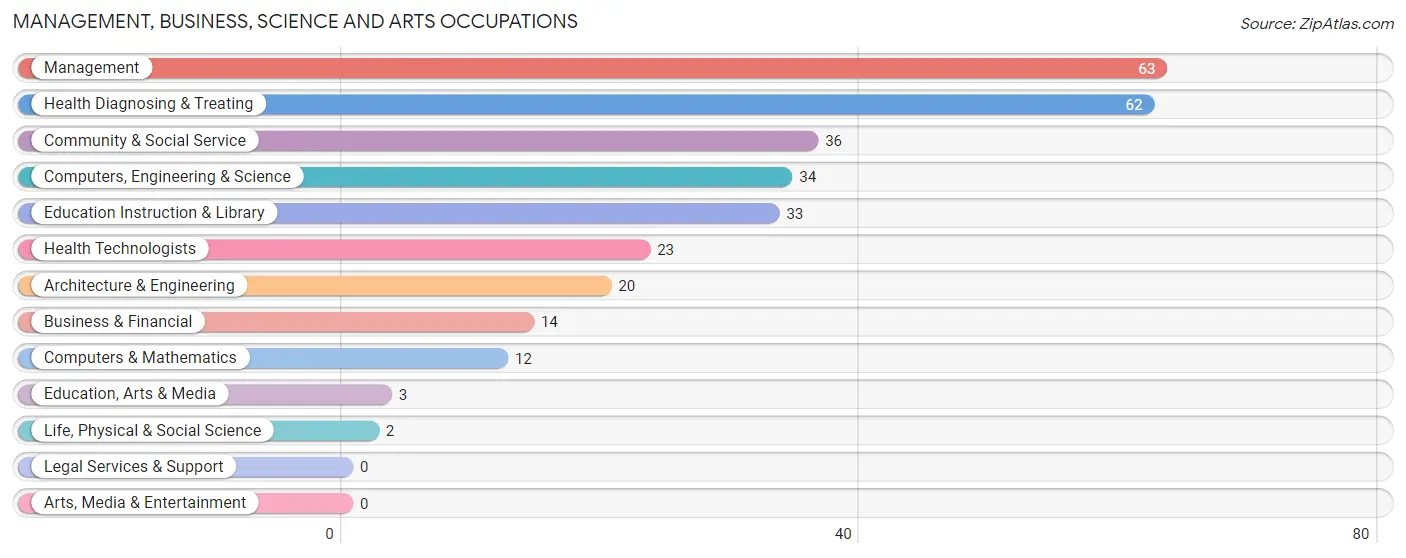
Management, Business, Science and Arts Occupations
The most common Management, Business, Science and Arts occupations in Shelbina are Management (63 | 6.4%), Health Diagnosing & Treating (62 | 6.3%), Community & Social Service (36 | 3.6%), Computers, Engineering & Science (34 | 3.4%), and Education Instruction & Library (33 | 3.3%).
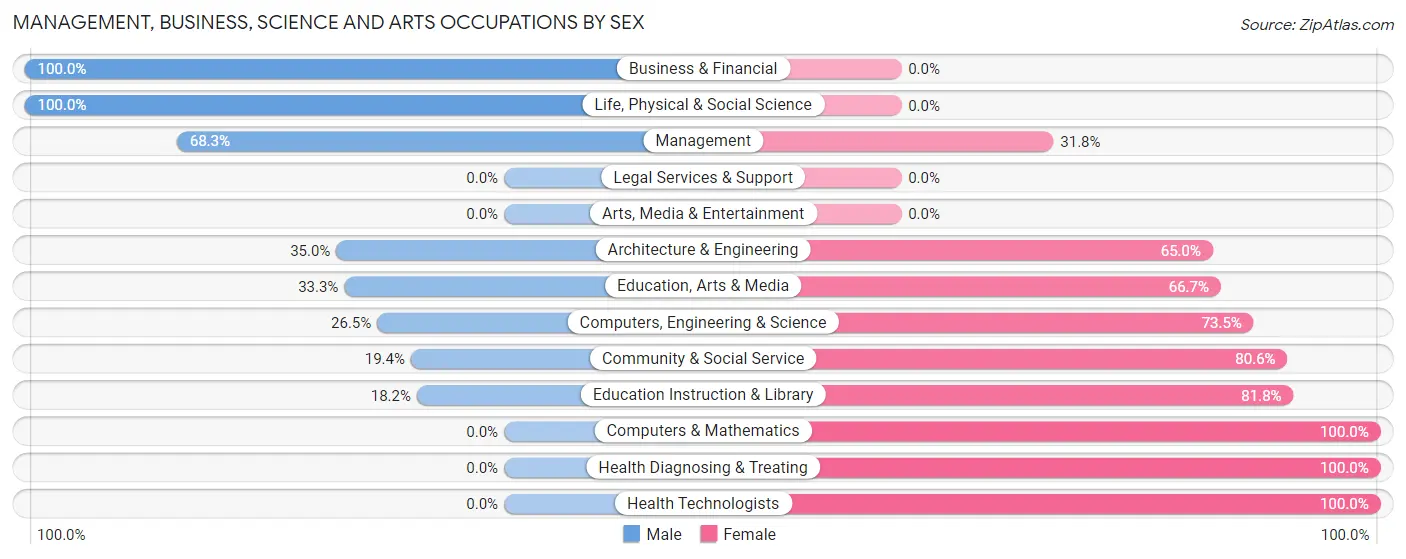
Management, Business, Science and Arts Occupations by Sex
Within the Management, Business, Science and Arts occupations in Shelbina, the most male-oriented occupations are Business & Financial (100.0%), Life, Physical & Social Science (100.0%), and Management (68.2%), while the most female-oriented occupations are Computers & Mathematics (100.0%), Health Diagnosing & Treating (100.0%), and Health Technologists (100.0%).
| Occupation | Male | Female |
| Management | 43 (68.2%) | 20 (31.8%) |
| Business & Financial | 14 (100.0%) | 0 (0.0%) |
| Computers, Engineering & Science | 9 (26.5%) | 25 (73.5%) |
| Computers & Mathematics | 0 (0.0%) | 12 (100.0%) |
| Architecture & Engineering | 7 (35.0%) | 13 (65.0%) |
| Life, Physical & Social Science | 2 (100.0%) | 0 (0.0%) |
| Community & Social Service | 7 (19.4%) | 29 (80.6%) |
| Education, Arts & Media | 1 (33.3%) | 2 (66.7%) |
| Legal Services & Support | 0 (0.0%) | 0 (0.0%) |
| Education Instruction & Library | 6 (18.2%) | 27 (81.8%) |
| Arts, Media & Entertainment | 0 (0.0%) | 0 (0.0%) |
| Health Diagnosing & Treating | 0 (0.0%) | 62 (100.0%) |
| Health Technologists | 0 (0.0%) | 23 (100.0%) |
| Total (Category) | 73 (34.9%) | 136 (65.1%) |
| Total (Overall) | 518 (52.3%) | 473 (47.7%) |
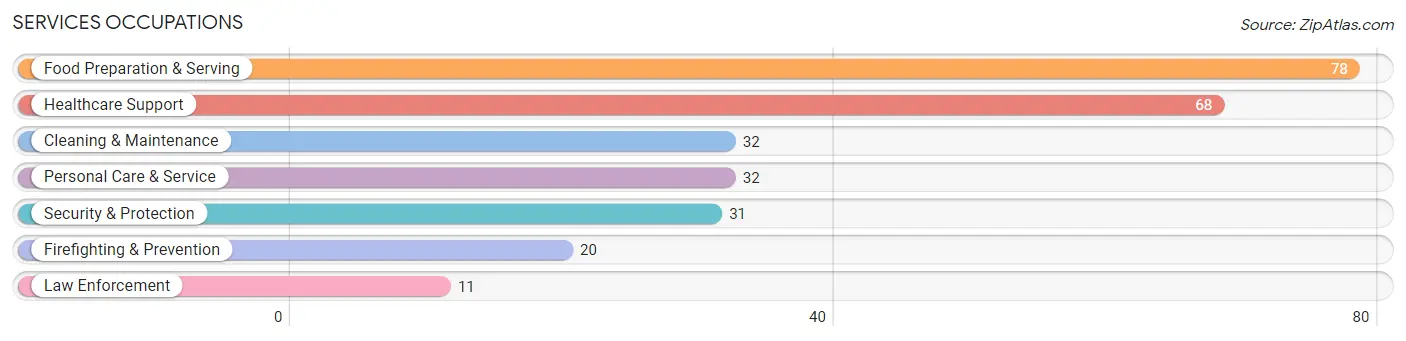
Services Occupations
The most common Services occupations in Shelbina are Food Preparation & Serving (78 | 7.9%), Healthcare Support (68 | 6.9%), Cleaning & Maintenance (32 | 3.2%), Personal Care & Service (32 | 3.2%), and Security & Protection (31 | 3.1%).
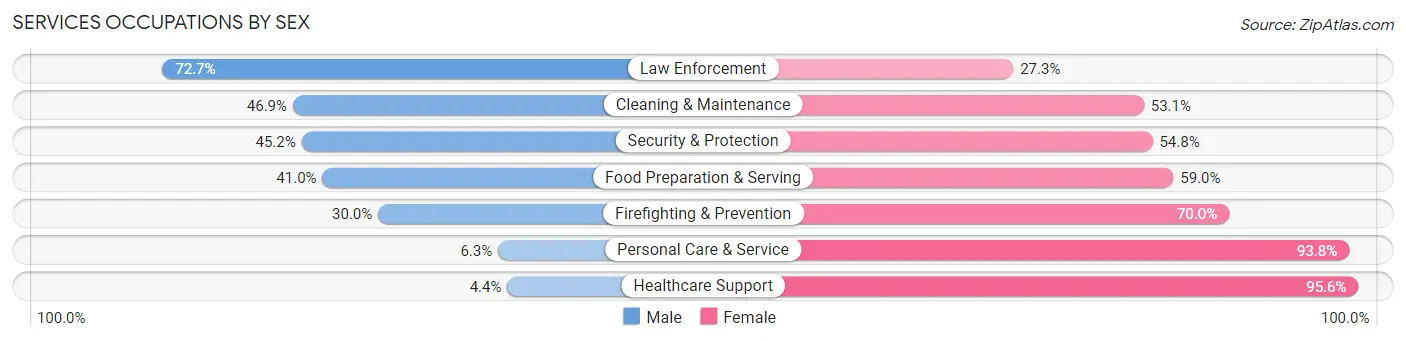
Services Occupations by Sex
Within the Services occupations in Shelbina, the most male-oriented occupations are Law Enforcement (72.7%), Cleaning & Maintenance (46.9%), and Security & Protection (45.2%), while the most female-oriented occupations are Healthcare Support (95.6%), Personal Care & Service (93.8%), and Firefighting & Prevention (70.0%).
| Occupation | Male | Female |
| Healthcare Support | 3 (4.4%) | 65 (95.6%) |
| Security & Protection | 14 (45.2%) | 17 (54.8%) |
| Firefighting & Prevention | 6 (30.0%) | 14 (70.0%) |
| Law Enforcement | 8 (72.7%) | 3 (27.3%) |
| Food Preparation & Serving | 32 (41.0%) | 46 (59.0%) |
| Cleaning & Maintenance | 15 (46.9%) | 17 (53.1%) |
| Personal Care & Service | 2 (6.2%) | 30 (93.8%) |
| Total (Category) | 66 (27.4%) | 175 (72.6%) |
| Total (Overall) | 518 (52.3%) | 473 (47.7%) |
Sales and Office Occupations
The most common Sales and Office occupations in Shelbina are Office & Administration (72 | 7.3%), and Sales & Related (67 | 6.8%).
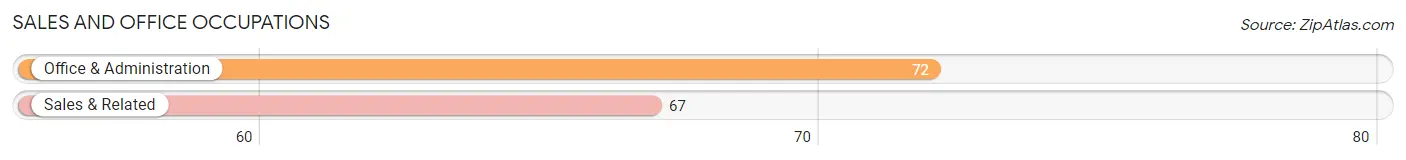
Sales and Office Occupations by Sex
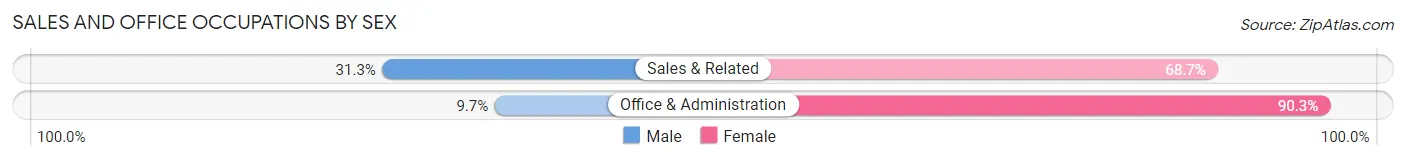
| Occupation | Male | Female |
| Sales & Related | 21 (31.3%) | 46 (68.7%) |
| Office & Administration | 7 (9.7%) | 65 (90.3%) |
| Total (Category) | 28 (20.1%) | 111 (79.9%) |
| Total (Overall) | 518 (52.3%) | 473 (47.7%) |
Natural Resources, Construction and Maintenance Occupations
The most common Natural Resources, Construction and Maintenance occupations in Shelbina are Installation, Maintenance & Repair (85 | 8.6%), Construction & Extraction (74 | 7.5%), and Farming, Fishing & Forestry (8 | 0.8%).
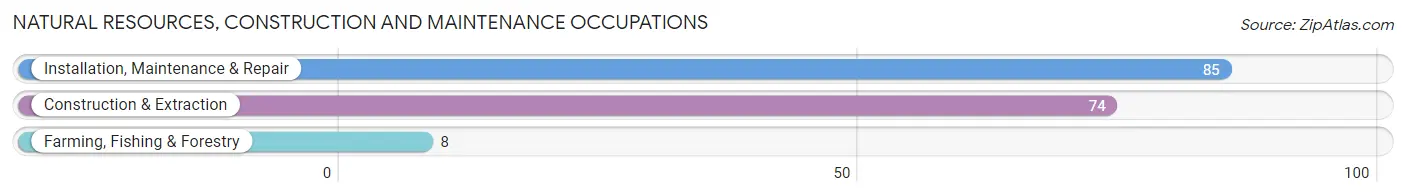
Natural Resources, Construction and Maintenance Occupations by Sex
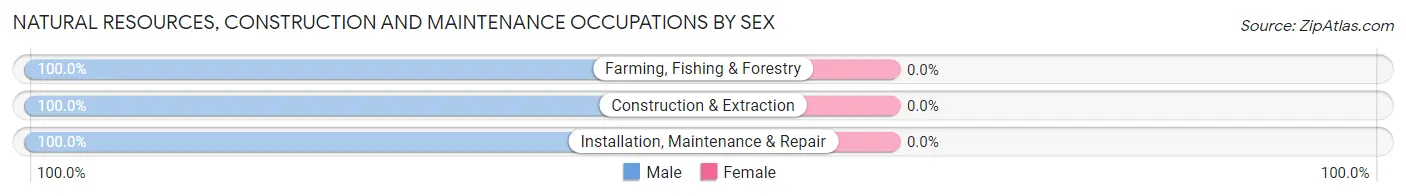
| Occupation | Male | Female |
| Farming, Fishing & Forestry | 8 (100.0%) | 0 (0.0%) |
| Construction & Extraction | 74 (100.0%) | 0 (0.0%) |
| Installation, Maintenance & Repair | 85 (100.0%) | 0 (0.0%) |
| Total (Category) | 167 (100.0%) | 0 (0.0%) |
| Total (Overall) | 518 (52.3%) | 473 (47.7%) |
Production, Transportation and Moving Occupations
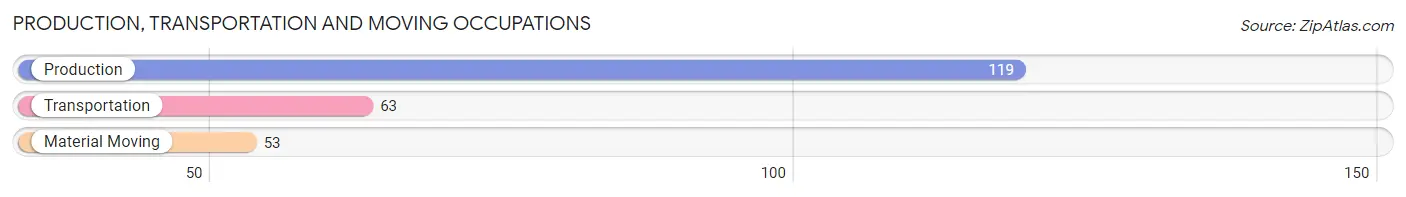
The most common Production, Transportation and Moving occupations in Shelbina are Production (119 | 12.0%), Transportation (63 | 6.4%), and Material Moving (53 | 5.3%).
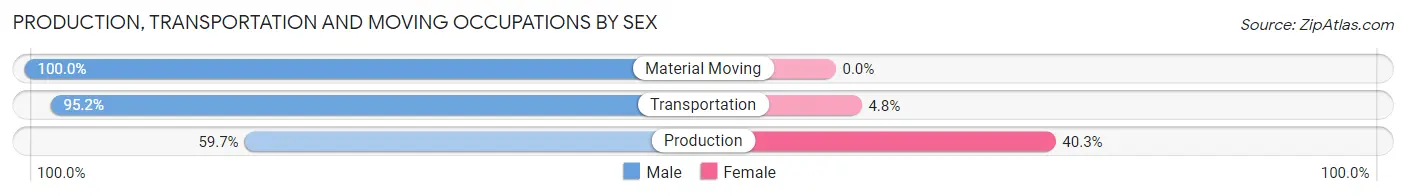
Production, Transportation and Moving Occupations by Sex
| Occupation | Male | Female |
| Production | 71 (59.7%) | 48 (40.3%) |
| Transportation | 60 (95.2%) | 3 (4.8%) |
| Material Moving | 53 (100.0%) | 0 (0.0%) |
| Total (Category) | 184 (78.3%) | 51 (21.7%) |
| Total (Overall) | 518 (52.3%) | 473 (47.7%) |
Employment Industries by Sex in Shelbina
Employment Industries in Shelbina
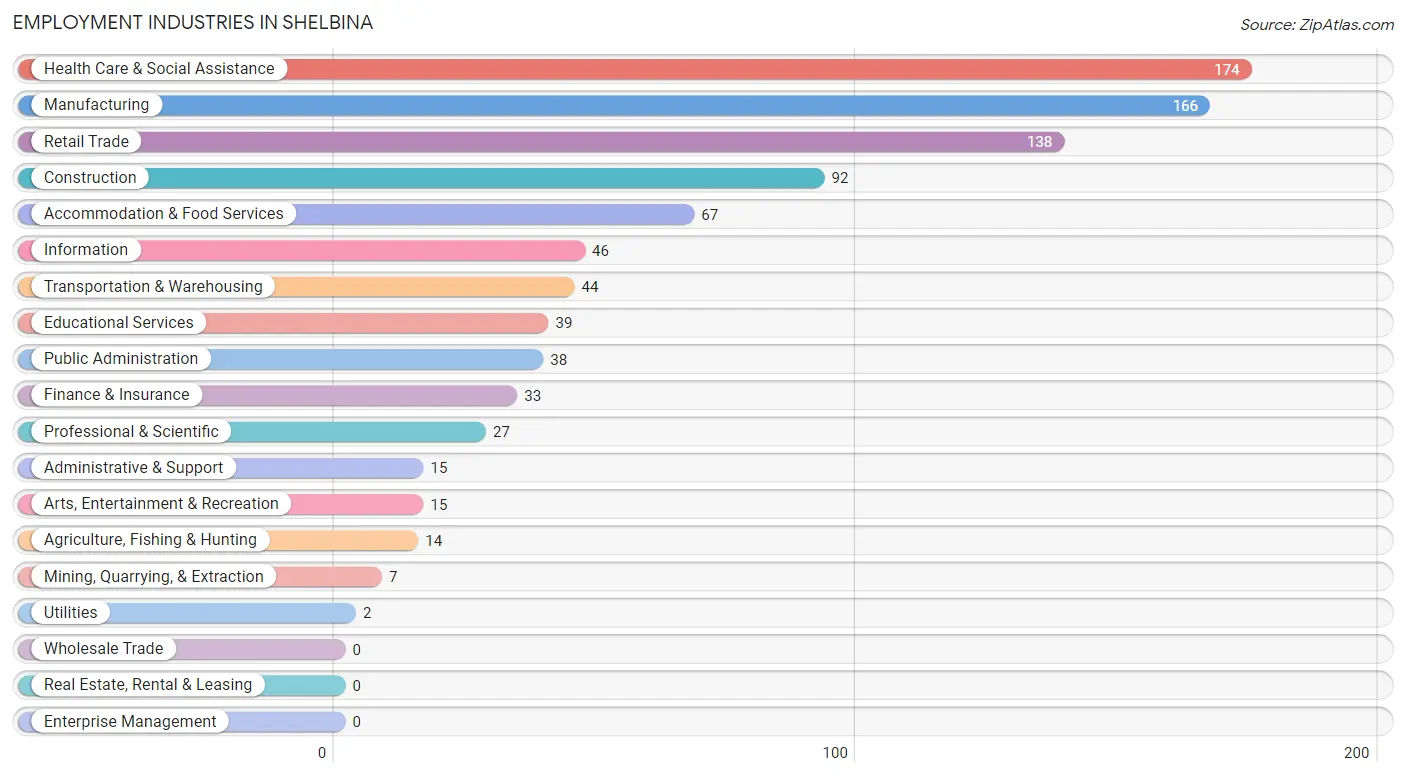
The major employment industries in Shelbina include Health Care & Social Assistance (174 | 17.6%), Manufacturing (166 | 16.8%), Retail Trade (138 | 13.9%), Construction (92 | 9.3%), and Accommodation & Food Services (67 | 6.8%).
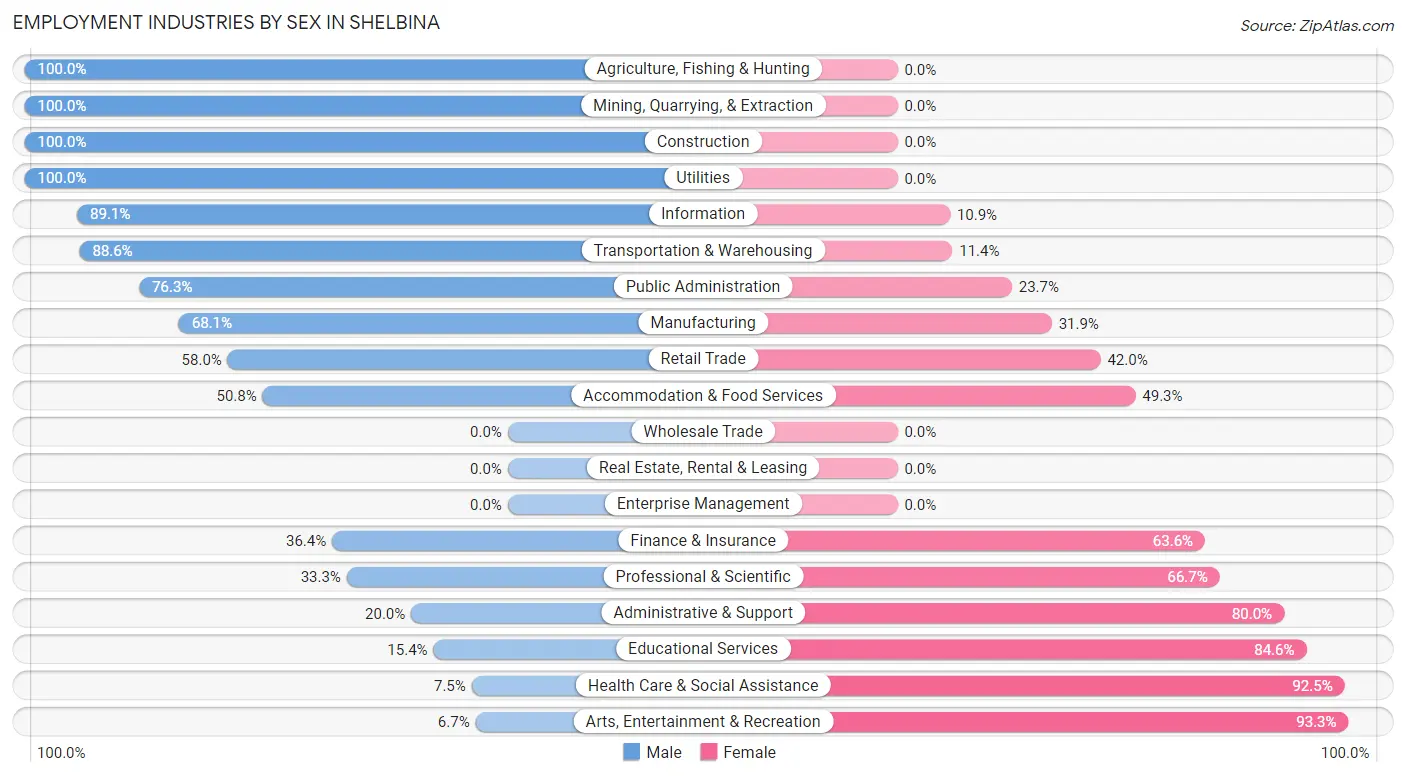
Employment Industries by Sex in Shelbina
The Shelbina industries that see more men than women are Agriculture, Fishing & Hunting (100.0%), Mining, Quarrying, & Extraction (100.0%), and Construction (100.0%), whereas the industries that tend to have a higher number of women are Arts, Entertainment & Recreation (93.3%), Health Care & Social Assistance (92.5%), and Educational Services (84.6%).
| Industry | Male | Female |
| Agriculture, Fishing & Hunting | 14 (100.0%) | 0 (0.0%) |
| Mining, Quarrying, & Extraction | 7 (100.0%) | 0 (0.0%) |
| Construction | 92 (100.0%) | 0 (0.0%) |
| Manufacturing | 113 (68.1%) | 53 (31.9%) |
| Wholesale Trade | 0 (0.0%) | 0 (0.0%) |
| Retail Trade | 80 (58.0%) | 58 (42.0%) |
| Transportation & Warehousing | 39 (88.6%) | 5 (11.4%) |
| Utilities | 2 (100.0%) | 0 (0.0%) |
| Information | 41 (89.1%) | 5 (10.9%) |
| Finance & Insurance | 12 (36.4%) | 21 (63.6%) |
| Real Estate, Rental & Leasing | 0 (0.0%) | 0 (0.0%) |
| Professional & Scientific | 9 (33.3%) | 18 (66.7%) |
| Enterprise Management | 0 (0.0%) | 0 (0.0%) |
| Administrative & Support | 3 (20.0%) | 12 (80.0%) |
| Educational Services | 6 (15.4%) | 33 (84.6%) |
| Health Care & Social Assistance | 13 (7.5%) | 161 (92.5%) |
| Arts, Entertainment & Recreation | 1 (6.7%) | 14 (93.3%) |
| Accommodation & Food Services | 34 (50.7%) | 33 (49.2%) |
| Public Administration | 29 (76.3%) | 9 (23.7%) |
| Total | 518 (52.3%) | 473 (47.7%) |
Education in Shelbina
School Enrollment in Shelbina
The most common levels of schooling among the 533 students in Shelbina are elementary school (205 | 38.5%), high school (91 | 17.1%), and middle school (77 | 14.4%).
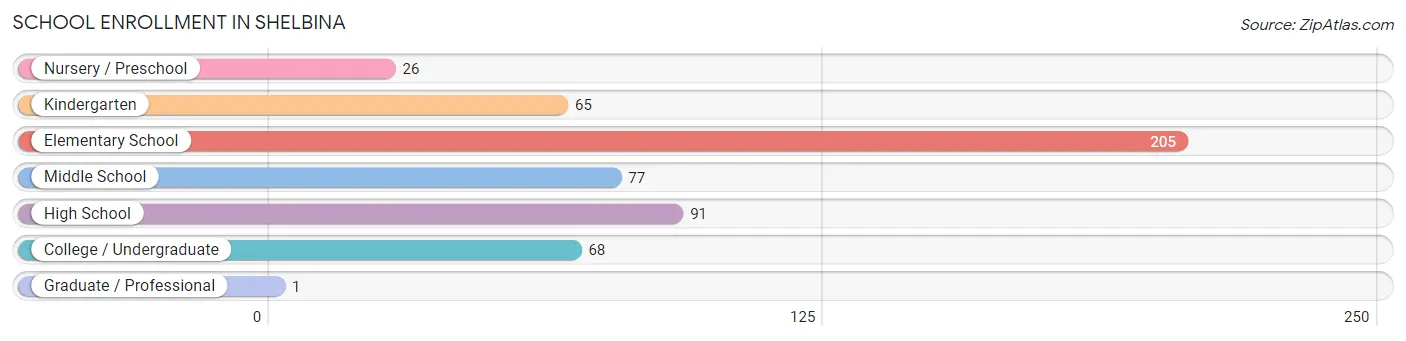
| School Level | # Students | % Students |
| Nursery / Preschool | 26 | 4.9% |
| Kindergarten | 65 | 12.2% |
| Elementary School | 205 | 38.5% |
| Middle School | 77 | 14.4% |
| High School | 91 | 17.1% |
| College / Undergraduate | 68 | 12.8% |
| Graduate / Professional | 1 | 0.2% |
| Total | 533 | 100.0% |
School Enrollment by Age by Funding Source in Shelbina
Out of a total of 533 students who are enrolled in schools in Shelbina, 143 (26.8%) attend a private institution, while the remaining 390 (73.2%) are enrolled in public schools. The age group of 5 to 9 year old has the highest likelihood of being enrolled in private schools, with 99 (43.2% in the age bracket) enrolled. Conversely, the age group of 3 to 4 year olds has the lowest likelihood of being enrolled in a private school, with 10 (100.0% in the age bracket) attending a public institution.
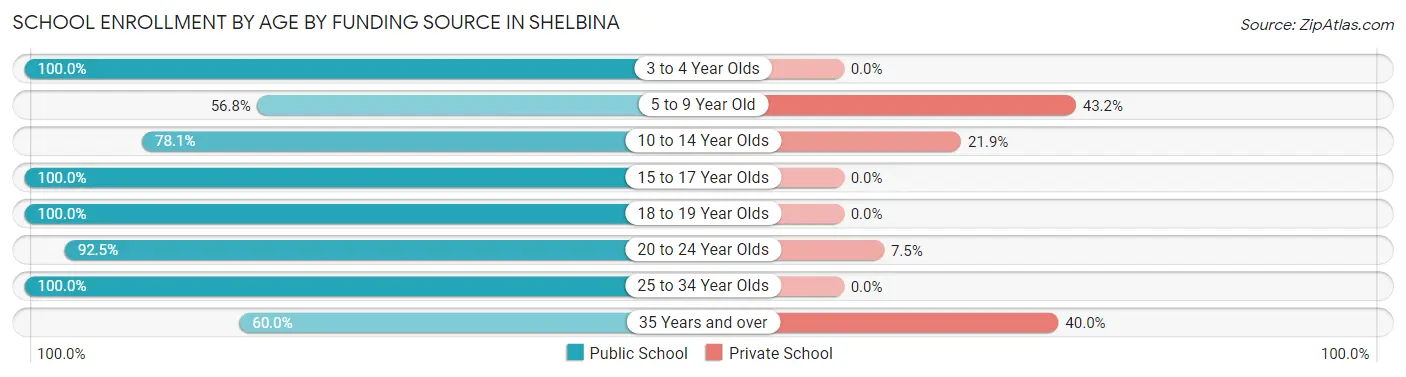
| Age Bracket | Public School | Private School |
| 3 to 4 Year Olds | 10 (100.0%) | 0 (0.0%) |
| 5 to 9 Year Old | 130 (56.8%) | 99 (43.2%) |
| 10 to 14 Year Olds | 125 (78.1%) | 35 (21.9%) |
| 15 to 17 Year Olds | 34 (100.0%) | 0 (0.0%) |
| 18 to 19 Year Olds | 39 (100.0%) | 0 (0.0%) |
| 20 to 24 Year Olds | 37 (92.5%) | 3 (7.5%) |
| 25 to 34 Year Olds | 6 (100.0%) | 0 (0.0%) |
| 35 Years and over | 9 (60.0%) | 6 (40.0%) |
| Total | 390 (73.2%) | 143 (26.8%) |
Educational Attainment by Field of Study in Shelbina
Education (111 | 43.5%), business (55 | 21.6%), science & technology (26 | 10.2%), bio, nature & agricultural (14 | 5.5%), and arts & humanities (13 | 5.1%) are the most common fields of study among 255 individuals in Shelbina who have obtained a bachelor's degree or higher.
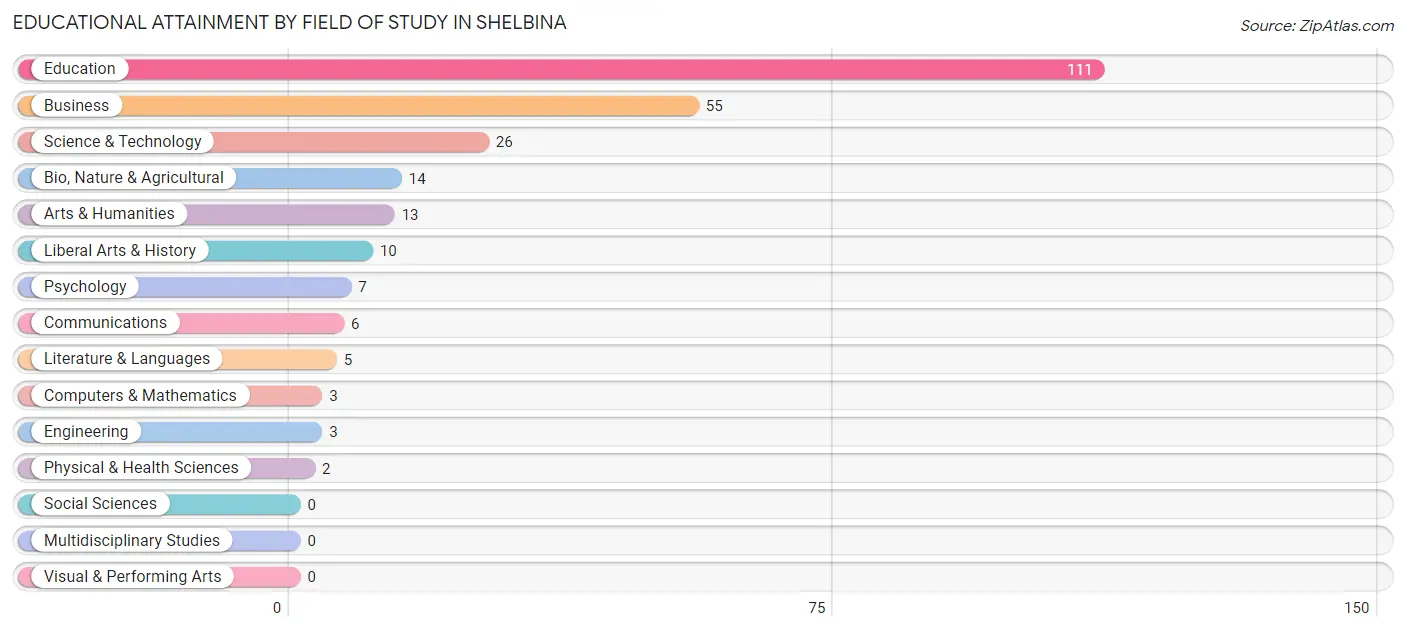
| Field of Study | # Graduates | % Graduates |
| Computers & Mathematics | 3 | 1.2% |
| Bio, Nature & Agricultural | 14 | 5.5% |
| Physical & Health Sciences | 2 | 0.8% |
| Psychology | 7 | 2.8% |
| Social Sciences | 0 | 0.0% |
| Engineering | 3 | 1.2% |
| Multidisciplinary Studies | 0 | 0.0% |
| Science & Technology | 26 | 10.2% |
| Business | 55 | 21.6% |
| Education | 111 | 43.5% |
| Literature & Languages | 5 | 2.0% |
| Liberal Arts & History | 10 | 3.9% |
| Visual & Performing Arts | 0 | 0.0% |
| Communications | 6 | 2.4% |
| Arts & Humanities | 13 | 5.1% |
| Total | 255 | 100.0% |
Transportation & Commute in Shelbina
Vehicle Availability by Sex in Shelbina
The most prevalent vehicle ownership categories in Shelbina are males with 3 vehicles (185, accounting for 36.8%) and females with 3 vehicles (153, making up 40.7%).
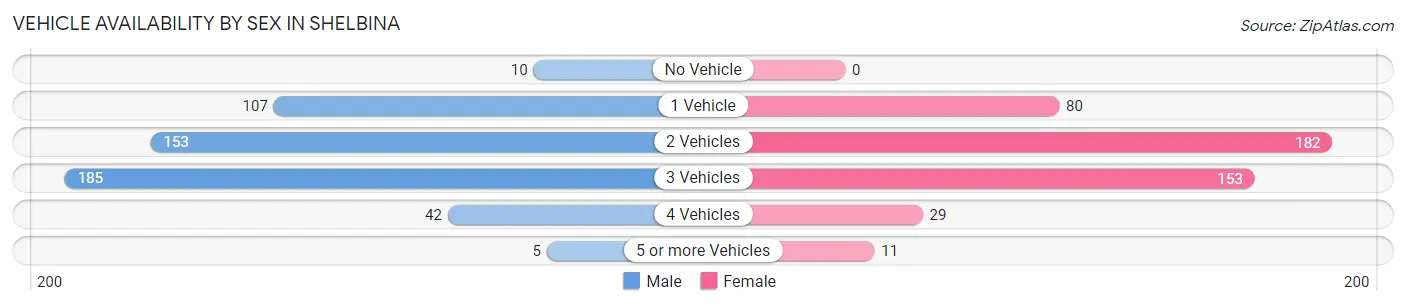
| Vehicles Available | Male | Female |
| No Vehicle | 10 (2.0%) | 0 (0.0%) |
| 1 Vehicle | 107 (21.3%) | 80 (17.6%) |
| 2 Vehicles | 153 (30.5%) | 182 (40.0%) |
| 3 Vehicles | 185 (36.8%) | 153 (33.6%) |
| 4 Vehicles | 42 (8.4%) | 29 (6.4%) |
| 5 or more Vehicles | 5 (1.0%) | 11 (2.4%) |
| Total | 502 (100.0%) | 455 (100.0%) |
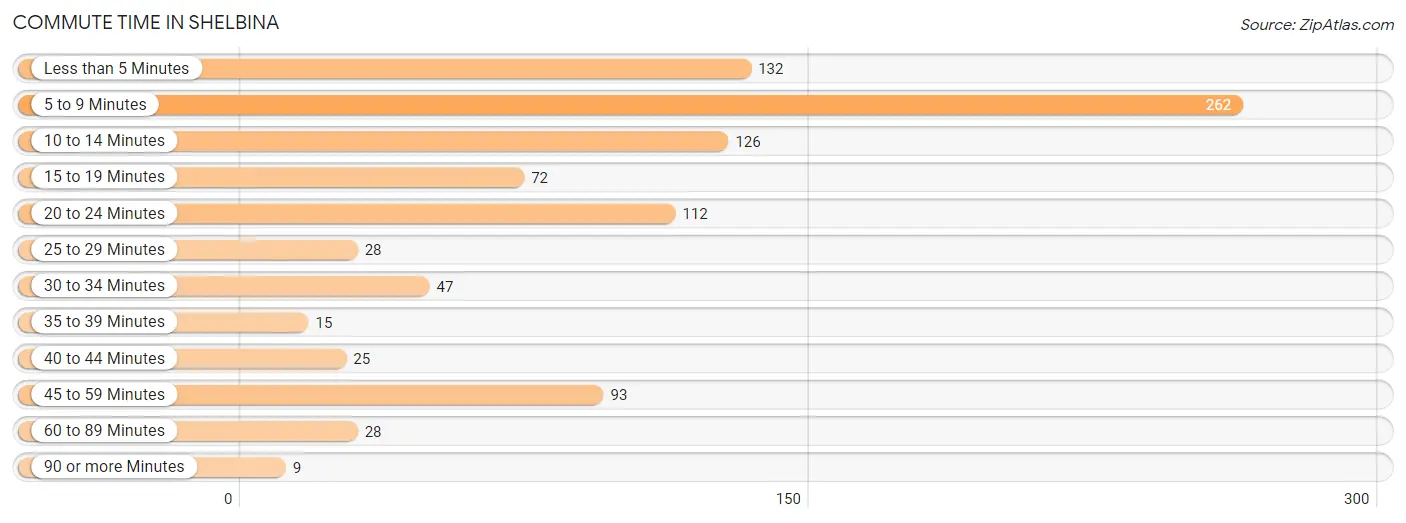
Commute Time in Shelbina
The most frequently occuring commute durations in Shelbina are 5 to 9 minutes (262 commuters, 27.6%), less than 5 minutes (132 commuters, 13.9%), and 10 to 14 minutes (126 commuters, 13.3%).
| Commute Time | # Commuters | % Commuters |
| Less than 5 Minutes | 132 | 13.9% |
| 5 to 9 Minutes | 262 | 27.6% |
| 10 to 14 Minutes | 126 | 13.3% |
| 15 to 19 Minutes | 72 | 7.6% |
| 20 to 24 Minutes | 112 | 11.8% |
| 25 to 29 Minutes | 28 | 2.9% |
| 30 to 34 Minutes | 47 | 5.0% |
| 35 to 39 Minutes | 15 | 1.6% |
| 40 to 44 Minutes | 25 | 2.6% |
| 45 to 59 Minutes | 93 | 9.8% |
| 60 to 89 Minutes | 28 | 2.9% |
| 90 or more Minutes | 9 | 0.9% |
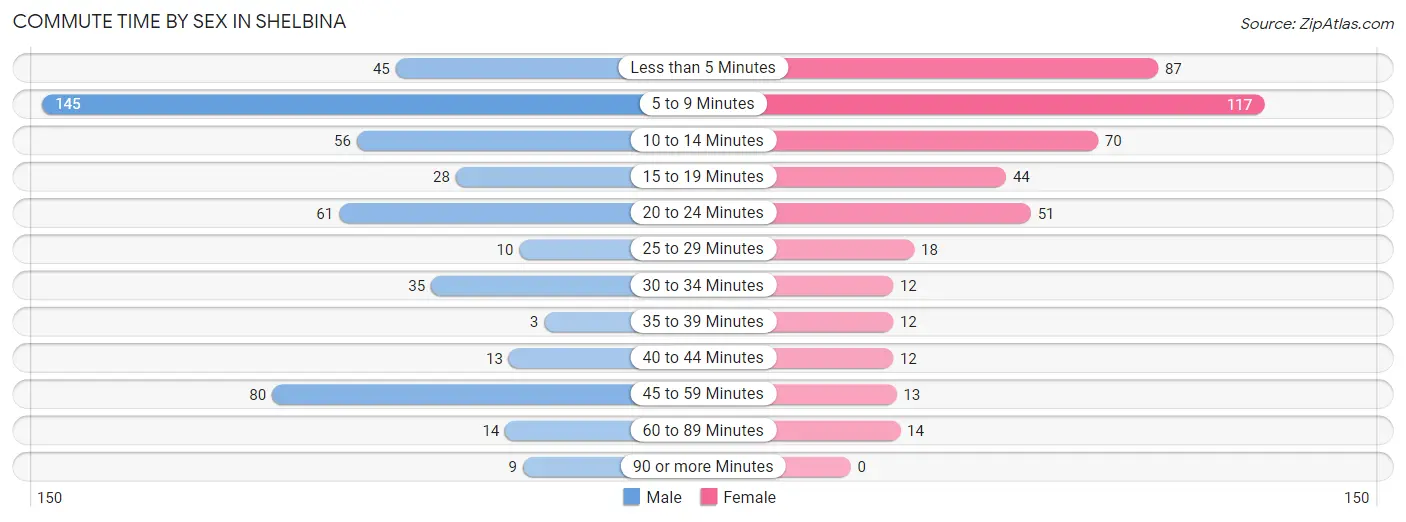
Commute Time by Sex in Shelbina
The most common commute times in Shelbina are 5 to 9 minutes (145 commuters, 29.1%) for males and 5 to 9 minutes (117 commuters, 26.0%) for females.
| Commute Time | Male | Female |
| Less than 5 Minutes | 45 (9.0%) | 87 (19.3%) |
| 5 to 9 Minutes | 145 (29.1%) | 117 (26.0%) |
| 10 to 14 Minutes | 56 (11.2%) | 70 (15.6%) |
| 15 to 19 Minutes | 28 (5.6%) | 44 (9.8%) |
| 20 to 24 Minutes | 61 (12.2%) | 51 (11.3%) |
| 25 to 29 Minutes | 10 (2.0%) | 18 (4.0%) |
| 30 to 34 Minutes | 35 (7.0%) | 12 (2.7%) |
| 35 to 39 Minutes | 3 (0.6%) | 12 (2.7%) |
| 40 to 44 Minutes | 13 (2.6%) | 12 (2.7%) |
| 45 to 59 Minutes | 80 (16.0%) | 13 (2.9%) |
| 60 to 89 Minutes | 14 (2.8%) | 14 (3.1%) |
| 90 or more Minutes | 9 (1.8%) | 0 (0.0%) |
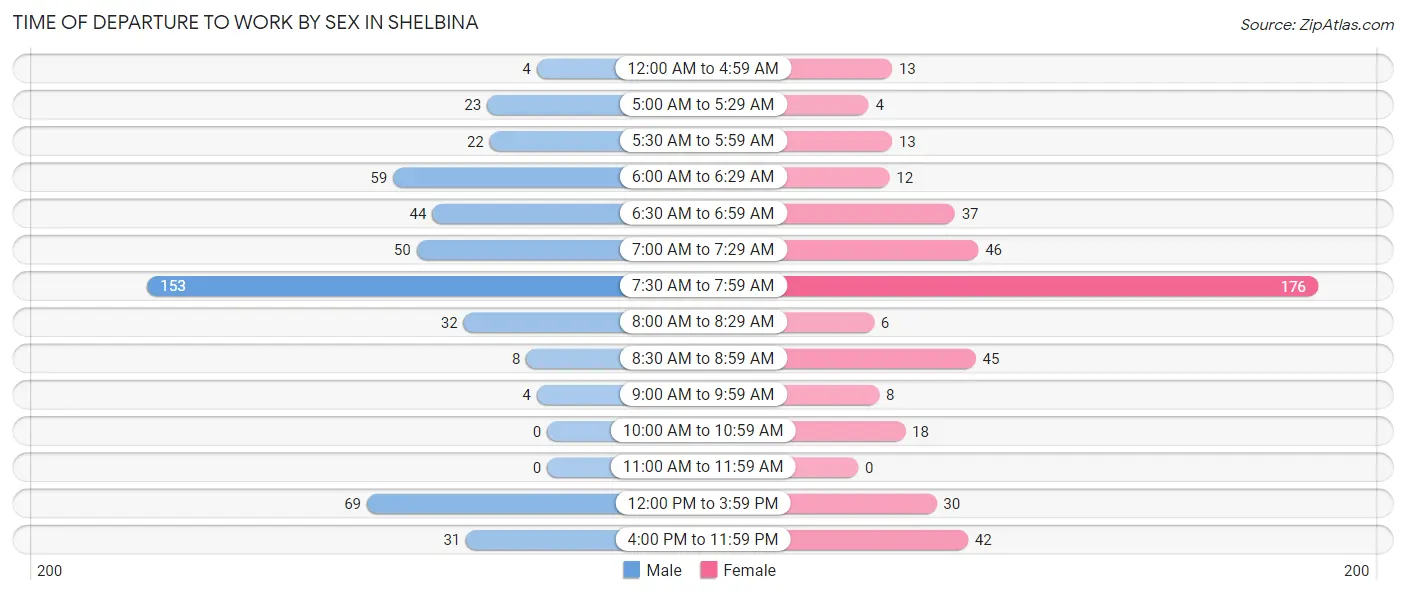
Time of Departure to Work by Sex in Shelbina
The most frequent times of departure to work in Shelbina are 7:30 AM to 7:59 AM (153, 30.7%) for males and 7:30 AM to 7:59 AM (176, 39.1%) for females.
| Time of Departure | Male | Female |
| 12:00 AM to 4:59 AM | 4 (0.8%) | 13 (2.9%) |
| 5:00 AM to 5:29 AM | 23 (4.6%) | 4 (0.9%) |
| 5:30 AM to 5:59 AM | 22 (4.4%) | 13 (2.9%) |
| 6:00 AM to 6:29 AM | 59 (11.8%) | 12 (2.7%) |
| 6:30 AM to 6:59 AM | 44 (8.8%) | 37 (8.2%) |
| 7:00 AM to 7:29 AM | 50 (10.0%) | 46 (10.2%) |
| 7:30 AM to 7:59 AM | 153 (30.7%) | 176 (39.1%) |
| 8:00 AM to 8:29 AM | 32 (6.4%) | 6 (1.3%) |
| 8:30 AM to 8:59 AM | 8 (1.6%) | 45 (10.0%) |
| 9:00 AM to 9:59 AM | 4 (0.8%) | 8 (1.8%) |
| 10:00 AM to 10:59 AM | 0 (0.0%) | 18 (4.0%) |
| 11:00 AM to 11:59 AM | 0 (0.0%) | 0 (0.0%) |
| 12:00 PM to 3:59 PM | 69 (13.8%) | 30 (6.7%) |
| 4:00 PM to 11:59 PM | 31 (6.2%) | 42 (9.3%) |
| Total | 499 (100.0%) | 450 (100.0%) |
Housing Occupancy in Shelbina
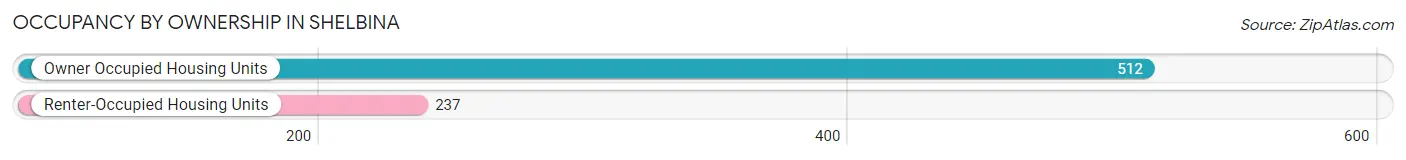
Occupancy by Ownership in Shelbina
Of the total 749 dwellings in Shelbina, owner-occupied units account for 512 (68.4%), while renter-occupied units make up 237 (31.6%).
| Occupancy | # Housing Units | % Housing Units |
| Owner Occupied Housing Units | 512 | 68.4% |
| Renter-Occupied Housing Units | 237 | 31.6% |
| Total Occupied Housing Units | 749 | 100.0% |
Occupancy by Household Size in Shelbina
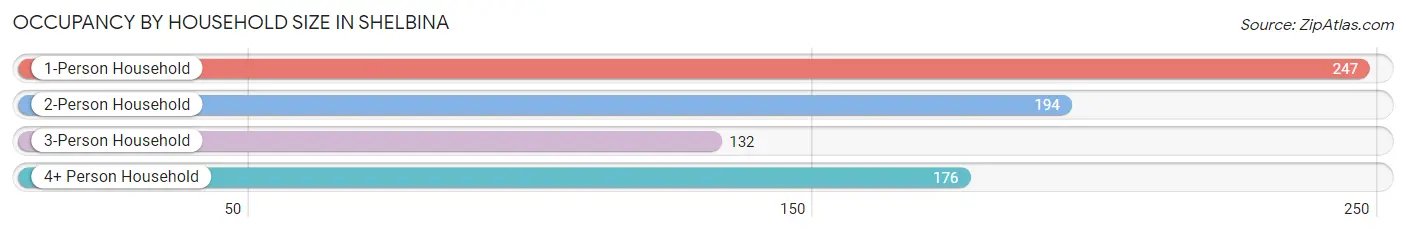
| Household Size | # Housing Units | % Housing Units |
| 1-Person Household | 247 | 33.0% |
| 2-Person Household | 194 | 25.9% |
| 3-Person Household | 132 | 17.6% |
| 4+ Person Household | 176 | 23.5% |
| Total Housing Units | 749 | 100.0% |
Occupancy by Ownership by Household Size in Shelbina
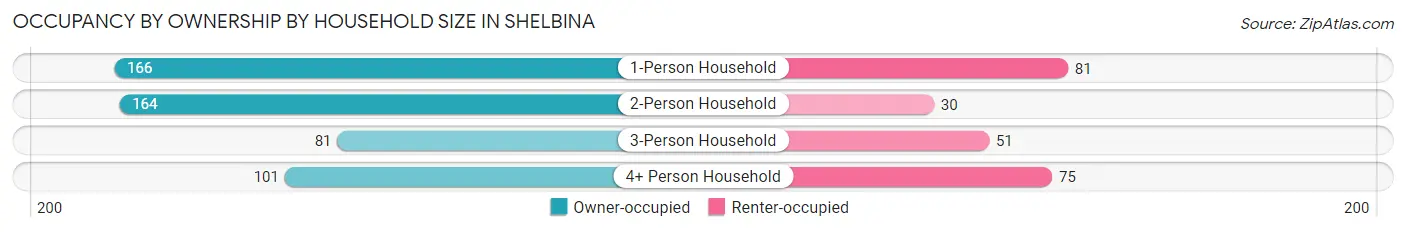
| Household Size | Owner-occupied | Renter-occupied |
| 1-Person Household | 166 (67.2%) | 81 (32.8%) |
| 2-Person Household | 164 (84.5%) | 30 (15.5%) |
| 3-Person Household | 81 (61.4%) | 51 (38.6%) |
| 4+ Person Household | 101 (57.4%) | 75 (42.6%) |
| Total Housing Units | 512 (68.4%) | 237 (31.6%) |
Occupancy by Educational Attainment in Shelbina
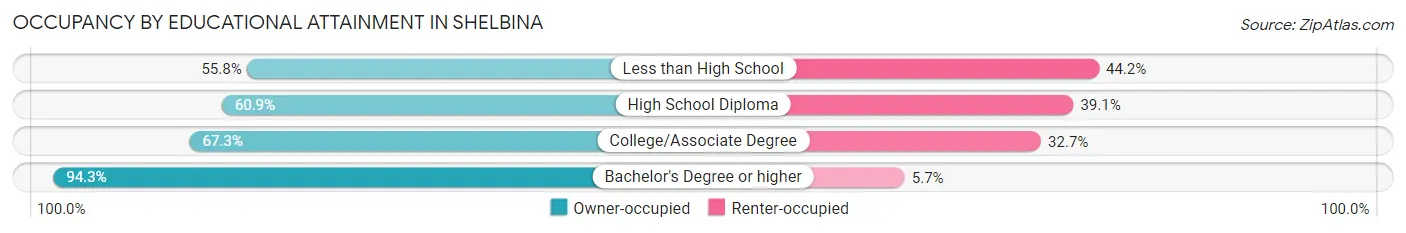
| Household Size | Owner-occupied | Renter-occupied |
| Less than High School | 24 (55.8%) | 19 (44.2%) |
| High School Diploma | 193 (60.9%) | 124 (39.1%) |
| College/Associate Degree | 179 (67.3%) | 87 (32.7%) |
| Bachelor's Degree or higher | 116 (94.3%) | 7 (5.7%) |
Occupancy by Age of Householder in Shelbina
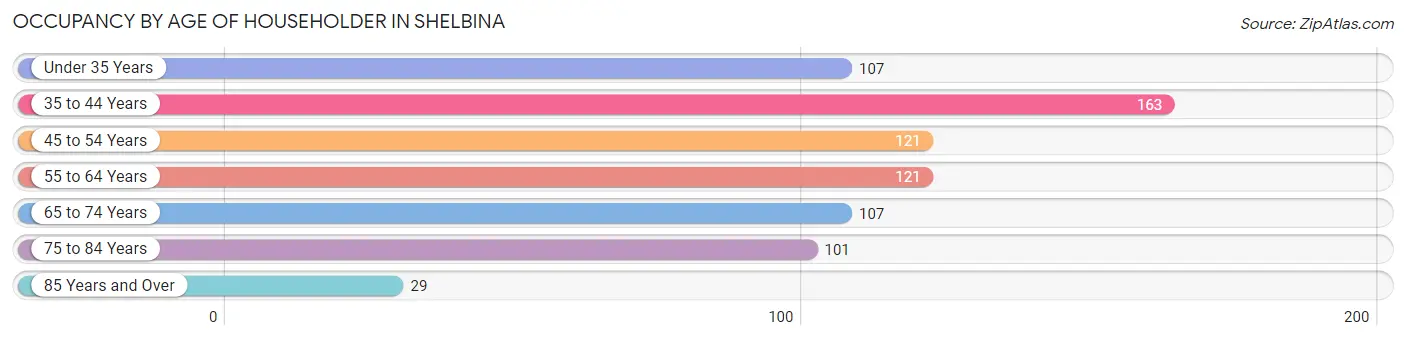
| Age Bracket | # Households | % Households |
| Under 35 Years | 107 | 14.3% |
| 35 to 44 Years | 163 | 21.8% |
| 45 to 54 Years | 121 | 16.2% |
| 55 to 64 Years | 121 | 16.2% |
| 65 to 74 Years | 107 | 14.3% |
| 75 to 84 Years | 101 | 13.5% |
| 85 Years and Over | 29 | 3.9% |
| Total | 749 | 100.0% |
Housing Finances in Shelbina
Median Income by Occupancy in Shelbina
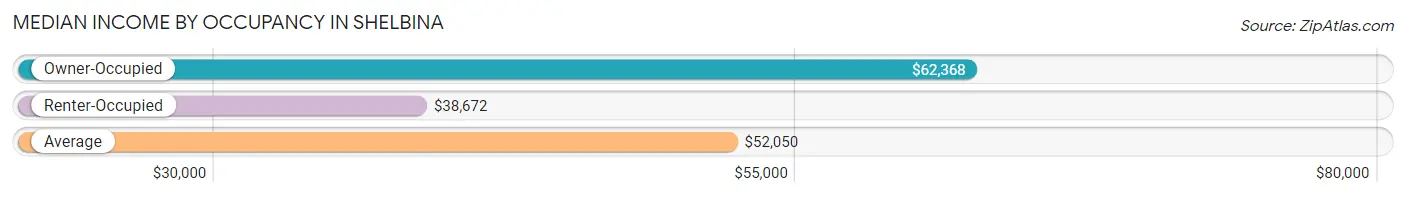
| Occupancy Type | # Households | Median Income |
| Owner-Occupied | 512 (68.4%) | $62,368 |
| Renter-Occupied | 237 (31.6%) | $38,672 |
| Average | 749 (100.0%) | $52,050 |
Occupancy by Householder Income Bracket in Shelbina
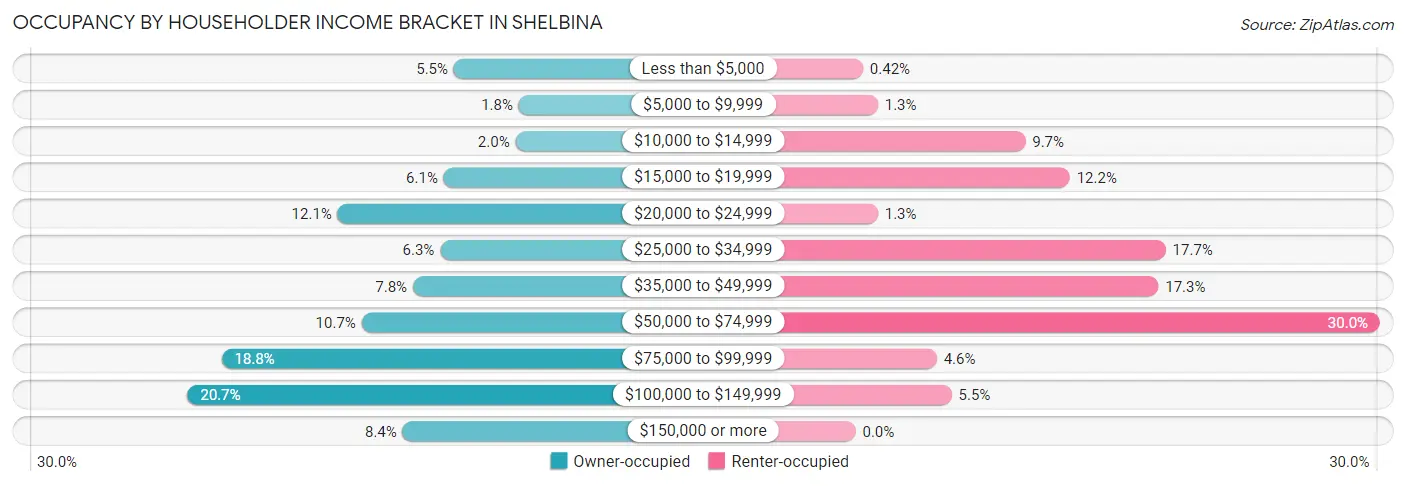
| Income Bracket | Owner-occupied | Renter-occupied |
| Less than $5,000 | 28 (5.5%) | 1 (0.4%) |
| $5,000 to $9,999 | 9 (1.8%) | 3 (1.3%) |
| $10,000 to $14,999 | 10 (1.9%) | 23 (9.7%) |
| $15,000 to $19,999 | 31 (6.0%) | 29 (12.2%) |
| $20,000 to $24,999 | 62 (12.1%) | 3 (1.3%) |
| $25,000 to $34,999 | 32 (6.2%) | 42 (17.7%) |
| $35,000 to $49,999 | 40 (7.8%) | 41 (17.3%) |
| $50,000 to $74,999 | 55 (10.7%) | 71 (30.0%) |
| $75,000 to $99,999 | 96 (18.8%) | 11 (4.6%) |
| $100,000 to $149,999 | 106 (20.7%) | 13 (5.5%) |
| $150,000 or more | 43 (8.4%) | 0 (0.0%) |
| Total | 512 (100.0%) | 237 (100.0%) |
Monthly Housing Cost Tiers in Shelbina
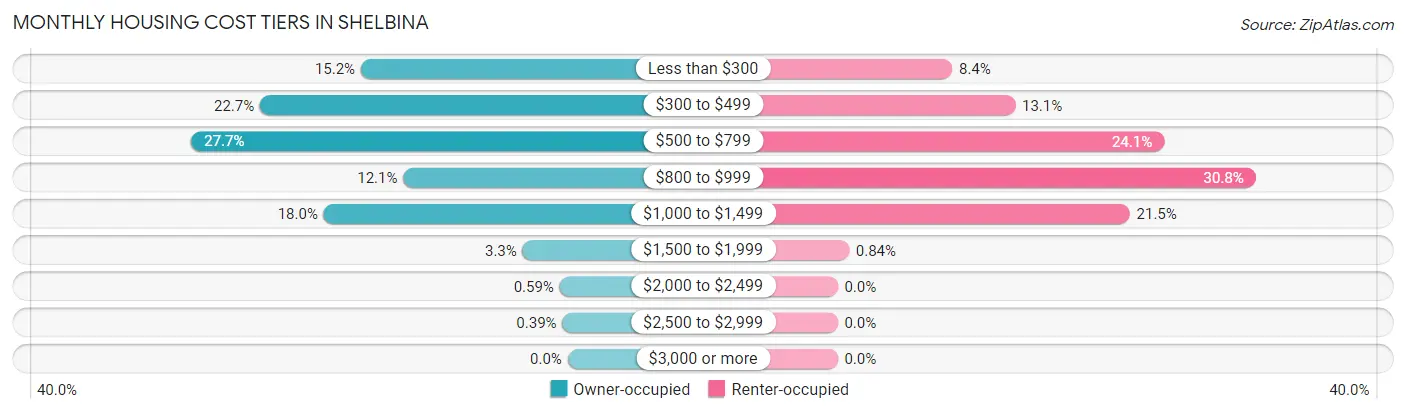
| Monthly Cost | Owner-occupied | Renter-occupied |
| Less than $300 | 78 (15.2%) | 20 (8.4%) |
| $300 to $499 | 116 (22.7%) | 31 (13.1%) |
| $500 to $799 | 142 (27.7%) | 57 (24.0%) |
| $800 to $999 | 62 (12.1%) | 73 (30.8%) |
| $1,000 to $1,499 | 92 (18.0%) | 51 (21.5%) |
| $1,500 to $1,999 | 17 (3.3%) | 2 (0.8%) |
| $2,000 to $2,499 | 3 (0.6%) | 0 (0.0%) |
| $2,500 to $2,999 | 2 (0.4%) | 0 (0.0%) |
| $3,000 or more | 0 (0.0%) | 0 (0.0%) |
| Total | 512 (100.0%) | 237 (100.0%) |
Physical Housing Characteristics in Shelbina
Housing Structures in Shelbina
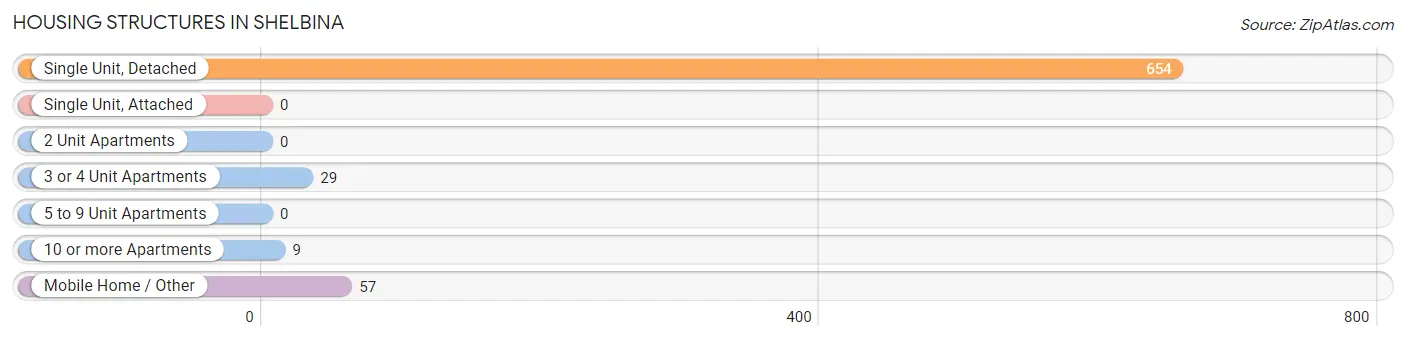
| Structure Type | # Housing Units | % Housing Units |
| Single Unit, Detached | 654 | 87.3% |
| Single Unit, Attached | 0 | 0.0% |
| 2 Unit Apartments | 0 | 0.0% |
| 3 or 4 Unit Apartments | 29 | 3.9% |
| 5 to 9 Unit Apartments | 0 | 0.0% |
| 10 or more Apartments | 9 | 1.2% |
| Mobile Home / Other | 57 | 7.6% |
| Total | 749 | 100.0% |
Housing Structures by Occupancy in Shelbina
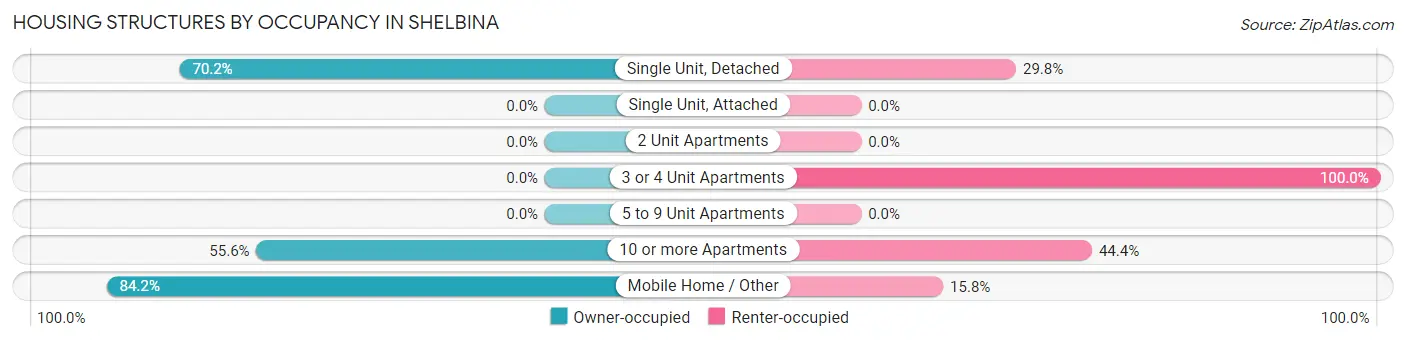
| Structure Type | Owner-occupied | Renter-occupied |
| Single Unit, Detached | 459 (70.2%) | 195 (29.8%) |
| Single Unit, Attached | 0 (0.0%) | 0 (0.0%) |
| 2 Unit Apartments | 0 (0.0%) | 0 (0.0%) |
| 3 or 4 Unit Apartments | 0 (0.0%) | 29 (100.0%) |
| 5 to 9 Unit Apartments | 0 (0.0%) | 0 (0.0%) |
| 10 or more Apartments | 5 (55.6%) | 4 (44.4%) |
| Mobile Home / Other | 48 (84.2%) | 9 (15.8%) |
| Total | 512 (68.4%) | 237 (31.6%) |
Housing Structures by Number of Rooms in Shelbina
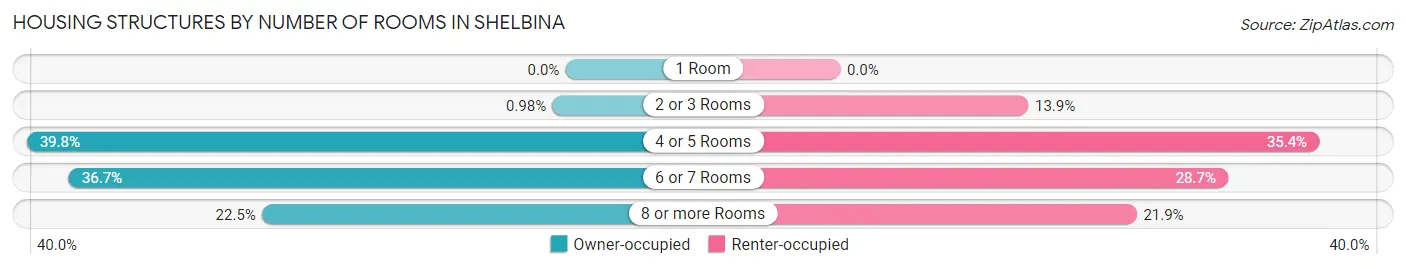
| Number of Rooms | Owner-occupied | Renter-occupied |
| 1 Room | 0 (0.0%) | 0 (0.0%) |
| 2 or 3 Rooms | 5 (1.0%) | 33 (13.9%) |
| 4 or 5 Rooms | 204 (39.8%) | 84 (35.4%) |
| 6 or 7 Rooms | 188 (36.7%) | 68 (28.7%) |
| 8 or more Rooms | 115 (22.5%) | 52 (21.9%) |
| Total | 512 (100.0%) | 237 (100.0%) |
Housing Structure by Heating Type in Shelbina
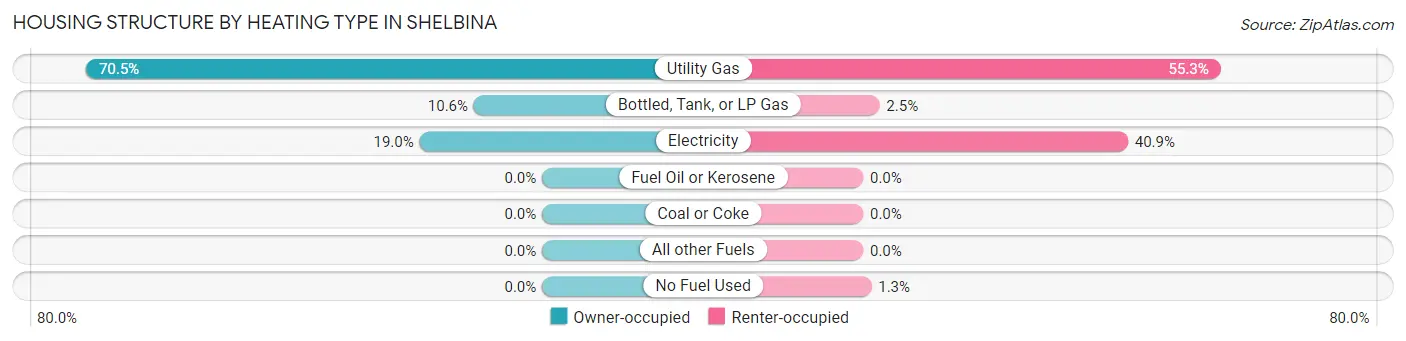
| Heating Type | Owner-occupied | Renter-occupied |
| Utility Gas | 361 (70.5%) | 131 (55.3%) |
| Bottled, Tank, or LP Gas | 54 (10.5%) | 6 (2.5%) |
| Electricity | 97 (19.0%) | 97 (40.9%) |
| Fuel Oil or Kerosene | 0 (0.0%) | 0 (0.0%) |
| Coal or Coke | 0 (0.0%) | 0 (0.0%) |
| All other Fuels | 0 (0.0%) | 0 (0.0%) |
| No Fuel Used | 0 (0.0%) | 3 (1.3%) |
| Total | 512 (100.0%) | 237 (100.0%) |
Household Vehicle Usage in Shelbina
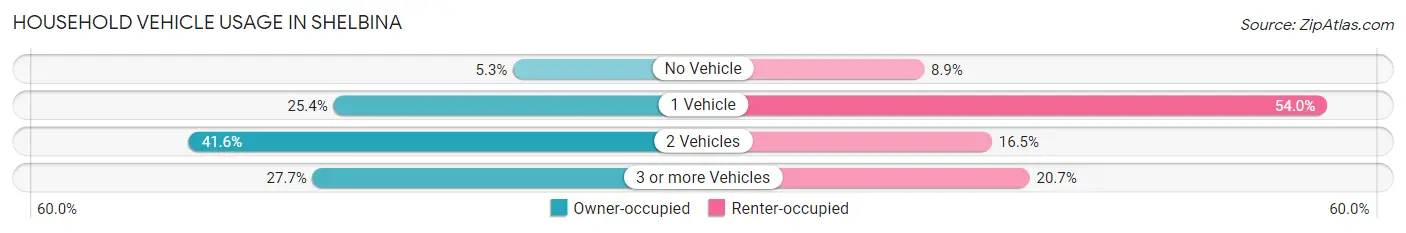
| Vehicles per Household | Owner-occupied | Renter-occupied |
| No Vehicle | 27 (5.3%) | 21 (8.9%) |
| 1 Vehicle | 130 (25.4%) | 128 (54.0%) |
| 2 Vehicles | 213 (41.6%) | 39 (16.5%) |
| 3 or more Vehicles | 142 (27.7%) | 49 (20.7%) |
| Total | 512 (100.0%) | 237 (100.0%) |
Real Estate & Mortgages in Shelbina
Real Estate and Mortgage Overview in Shelbina
| Characteristic | Without Mortgage | With Mortgage |
| Housing Units | 275 | 237 |
| Median Property Value | $72,500 | $84,700 |
| Median Household Income | $30,625 | $31 |
| Monthly Housing Costs | $406 | $0 |
| Real Estate Taxes | $784 | $0 |
Property Value by Mortgage Status in Shelbina
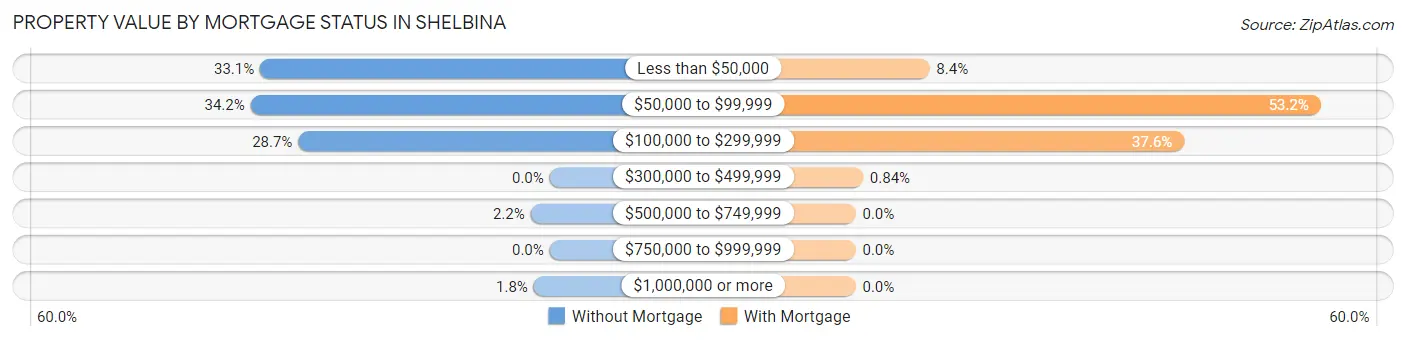
| Property Value | Without Mortgage | With Mortgage |
| Less than $50,000 | 91 (33.1%) | 20 (8.4%) |
| $50,000 to $99,999 | 94 (34.2%) | 126 (53.2%) |
| $100,000 to $299,999 | 79 (28.7%) | 89 (37.6%) |
| $300,000 to $499,999 | 0 (0.0%) | 2 (0.8%) |
| $500,000 to $749,999 | 6 (2.2%) | 0 (0.0%) |
| $750,000 to $999,999 | 0 (0.0%) | 0 (0.0%) |
| $1,000,000 or more | 5 (1.8%) | 0 (0.0%) |
| Total | 275 (100.0%) | 237 (100.0%) |
Household Income by Mortgage Status in Shelbina
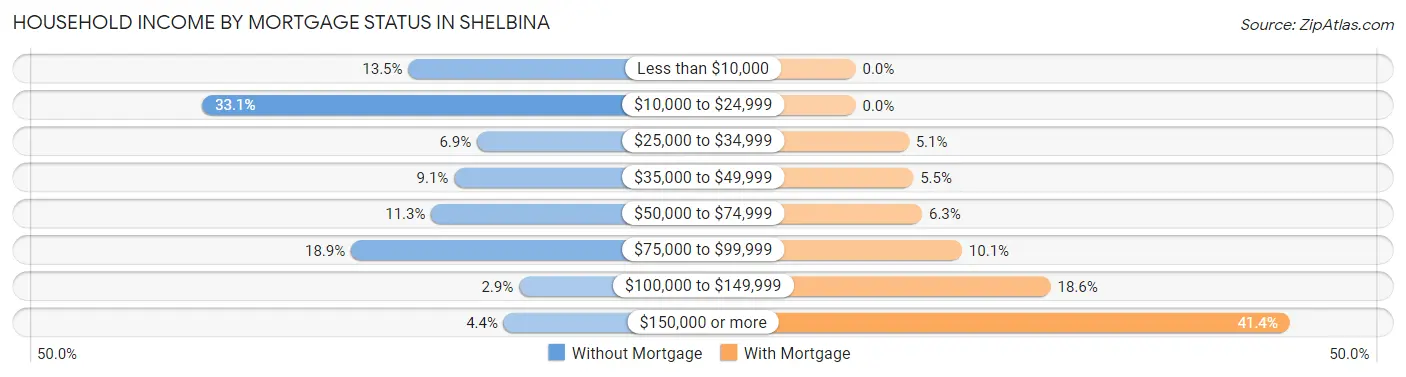
| Household Income | Without Mortgage | With Mortgage |
| Less than $10,000 | 37 (13.5%) | 0 (0.0%) |
| $10,000 to $24,999 | 91 (33.1%) | 0 (0.0%) |
| $25,000 to $34,999 | 19 (6.9%) | 12 (5.1%) |
| $35,000 to $49,999 | 25 (9.1%) | 13 (5.5%) |
| $50,000 to $74,999 | 31 (11.3%) | 15 (6.3%) |
| $75,000 to $99,999 | 52 (18.9%) | 24 (10.1%) |
| $100,000 to $149,999 | 8 (2.9%) | 44 (18.6%) |
| $150,000 or more | 12 (4.4%) | 98 (41.3%) |
| Total | 275 (100.0%) | 237 (100.0%) |
Property Value to Household Income Ratio in Shelbina
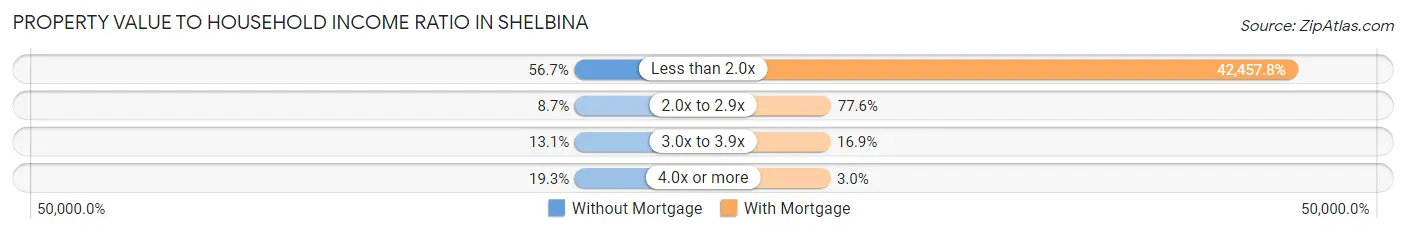
| Value-to-Income Ratio | Without Mortgage | With Mortgage |
| Less than 2.0x | 156 (56.7%) | 100,625 (42,457.8%) |
| 2.0x to 2.9x | 24 (8.7%) | 184 (77.6%) |
| 3.0x to 3.9x | 36 (13.1%) | 40 (16.9%) |
| 4.0x or more | 53 (19.3%) | 7 (2.9%) |
| Total | 275 (100.0%) | 237 (100.0%) |
Real Estate Taxes by Mortgage Status in Shelbina
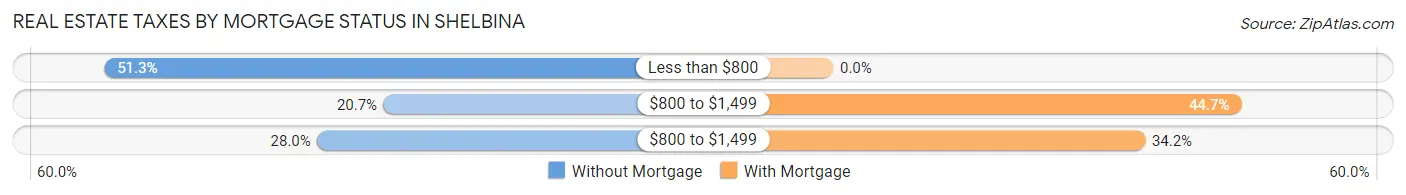
| Property Taxes | Without Mortgage | With Mortgage |
| Less than $800 | 141 (51.3%) | 0 (0.0%) |
| $800 to $1,499 | 57 (20.7%) | 106 (44.7%) |
| $800 to $1,499 | 77 (28.0%) | 81 (34.2%) |
| Total | 275 (100.0%) | 237 (100.0%) |
Health & Disability in Shelbina
Health Insurance Coverage by Age in Shelbina
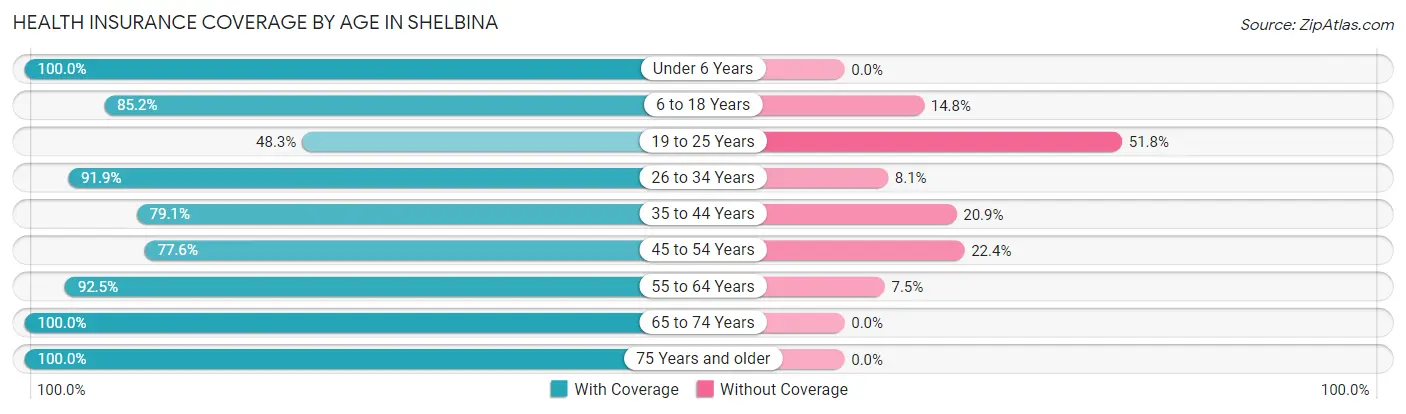
| Age Bracket | With Coverage | Without Coverage |
| Under 6 Years | 183 (100.0%) | 0 (0.0%) |
| 6 to 18 Years | 385 (85.2%) | 67 (14.8%) |
| 19 to 25 Years | 69 (48.2%) | 74 (51.7%) |
| 26 to 34 Years | 215 (91.9%) | 19 (8.1%) |
| 35 to 44 Years | 231 (79.1%) | 61 (20.9%) |
| 45 to 54 Years | 177 (77.6%) | 51 (22.4%) |
| 55 to 64 Years | 185 (92.5%) | 15 (7.5%) |
| 65 to 74 Years | 181 (100.0%) | 0 (0.0%) |
| 75 Years and older | 180 (100.0%) | 0 (0.0%) |
| Total | 1,806 (86.3%) | 287 (13.7%) |
Health Insurance Coverage by Citizenship Status in Shelbina
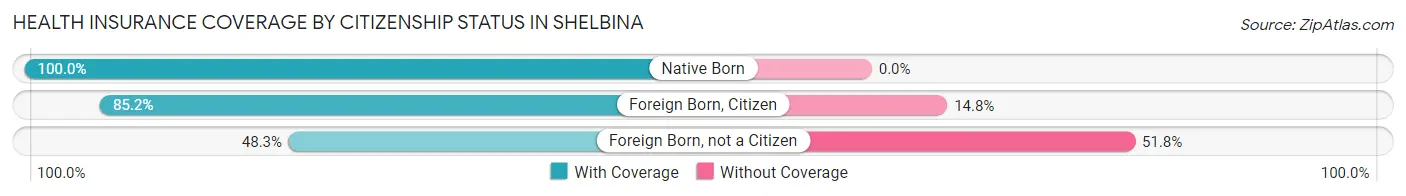
| Citizenship Status | With Coverage | Without Coverage |
| Native Born | 183 (100.0%) | 0 (0.0%) |
| Foreign Born, Citizen | 385 (85.2%) | 67 (14.8%) |
| Foreign Born, not a Citizen | 69 (48.2%) | 74 (51.7%) |
Health Insurance Coverage by Household Income in Shelbina
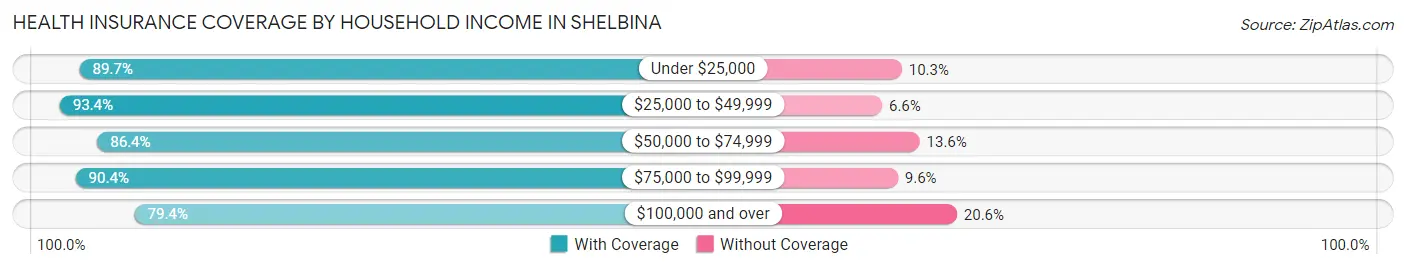
| Household Income | With Coverage | Without Coverage |
| Under $25,000 | 296 (89.7%) | 34 (10.3%) |
| $25,000 to $49,999 | 283 (93.4%) | 20 (6.6%) |
| $50,000 to $74,999 | 399 (86.4%) | 63 (13.6%) |
| $75,000 to $99,999 | 293 (90.4%) | 31 (9.6%) |
| $100,000 and over | 535 (79.4%) | 139 (20.6%) |
Public vs Private Health Insurance Coverage by Age in Shelbina
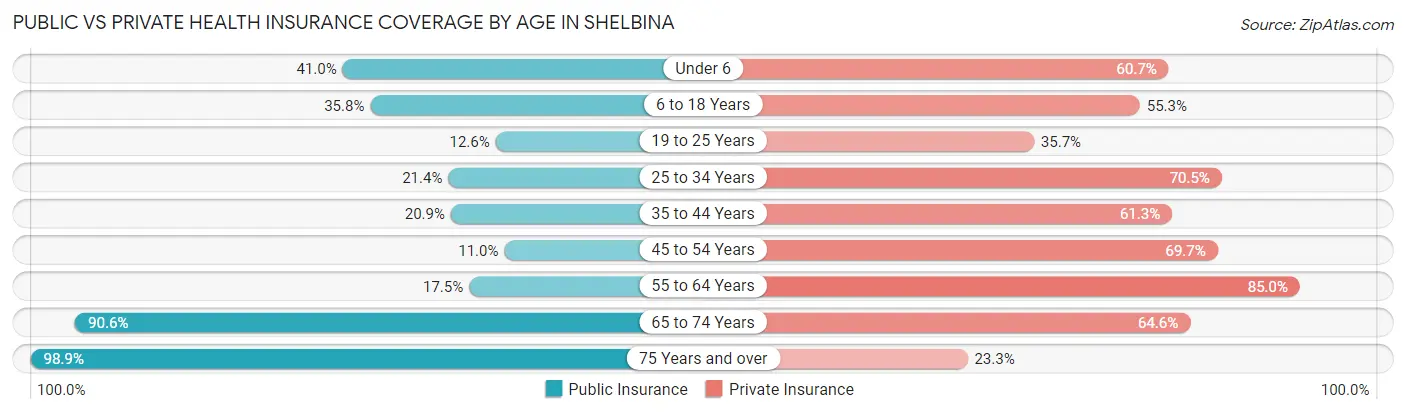
| Age Bracket | Public Insurance | Private Insurance |
| Under 6 | 75 (41.0%) | 111 (60.7%) |
| 6 to 18 Years | 162 (35.8%) | 250 (55.3%) |
| 19 to 25 Years | 18 (12.6%) | 51 (35.7%) |
| 25 to 34 Years | 50 (21.4%) | 165 (70.5%) |
| 35 to 44 Years | 61 (20.9%) | 179 (61.3%) |
| 45 to 54 Years | 25 (11.0%) | 159 (69.7%) |
| 55 to 64 Years | 35 (17.5%) | 170 (85.0%) |
| 65 to 74 Years | 164 (90.6%) | 117 (64.6%) |
| 75 Years and over | 178 (98.9%) | 42 (23.3%) |
| Total | 768 (36.7%) | 1,244 (59.4%) |
Disability Status by Sex by Age in Shelbina
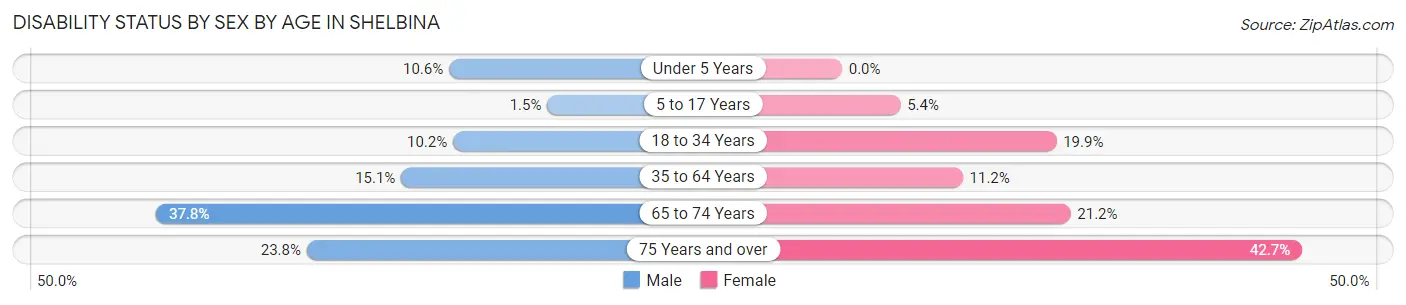
| Age Bracket | Male | Female |
| Under 5 Years | 7 (10.6%) | 0 (0.0%) |
| 5 to 17 Years | 3 (1.5%) | 13 (5.4%) |
| 18 to 34 Years | 21 (10.2%) | 41 (19.9%) |
| 35 to 64 Years | 56 (15.0%) | 39 (11.2%) |
| 65 to 74 Years | 31 (37.8%) | 21 (21.2%) |
| 75 Years and over | 20 (23.8%) | 41 (42.7%) |
Disability Class by Sex by Age in Shelbina
Disability Class: Hearing Difficulty
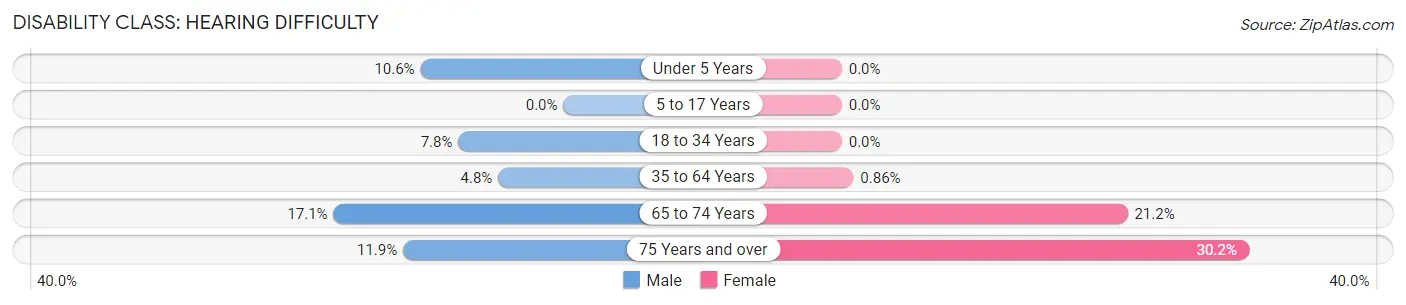
| Age Bracket | Male | Female |
| Under 5 Years | 7 (10.6%) | 0 (0.0%) |
| 5 to 17 Years | 0 (0.0%) | 0 (0.0%) |
| 18 to 34 Years | 16 (7.8%) | 0 (0.0%) |
| 35 to 64 Years | 18 (4.8%) | 3 (0.9%) |
| 65 to 74 Years | 14 (17.1%) | 21 (21.2%) |
| 75 Years and over | 10 (11.9%) | 29 (30.2%) |
Disability Class: Vision Difficulty
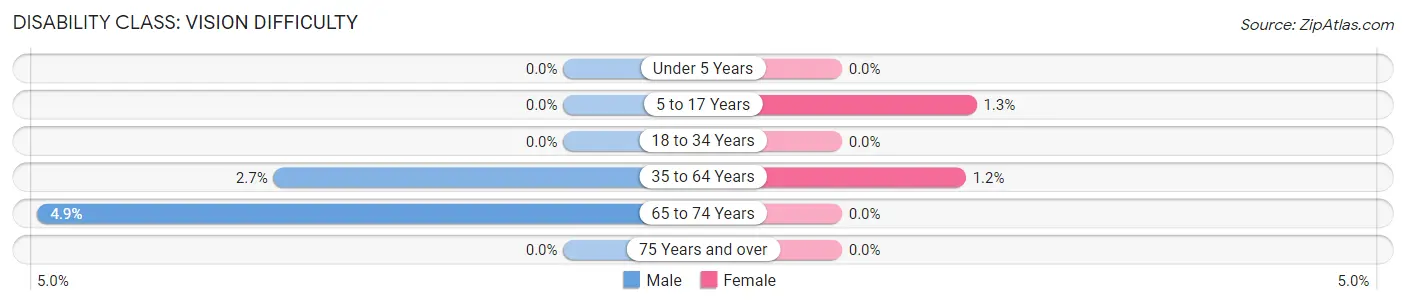
| Age Bracket | Male | Female |
| Under 5 Years | 0 (0.0%) | 0 (0.0%) |
| 5 to 17 Years | 0 (0.0%) | 3 (1.3%) |
| 18 to 34 Years | 0 (0.0%) | 0 (0.0%) |
| 35 to 64 Years | 10 (2.7%) | 4 (1.1%) |
| 65 to 74 Years | 4 (4.9%) | 0 (0.0%) |
| 75 Years and over | 0 (0.0%) | 0 (0.0%) |
Disability Class: Cognitive Difficulty
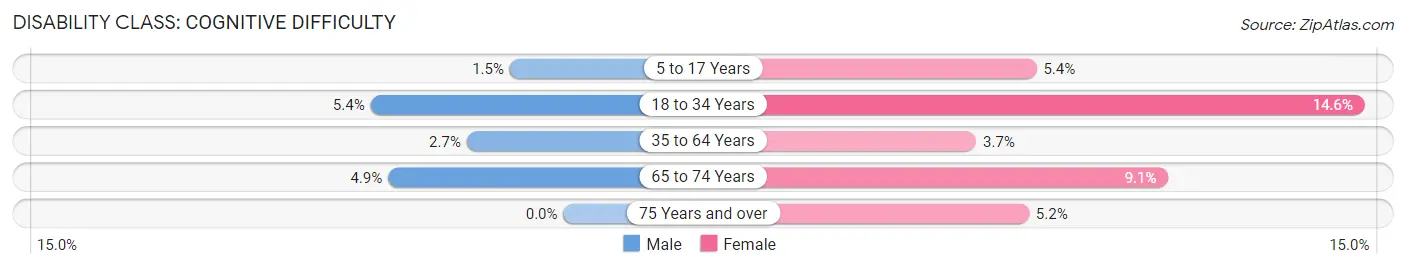
| Age Bracket | Male | Female |
| 5 to 17 Years | 3 (1.5%) | 13 (5.4%) |
| 18 to 34 Years | 11 (5.4%) | 30 (14.6%) |
| 35 to 64 Years | 10 (2.7%) | 13 (3.7%) |
| 65 to 74 Years | 4 (4.9%) | 9 (9.1%) |
| 75 Years and over | 0 (0.0%) | 5 (5.2%) |
Disability Class: Ambulatory Difficulty
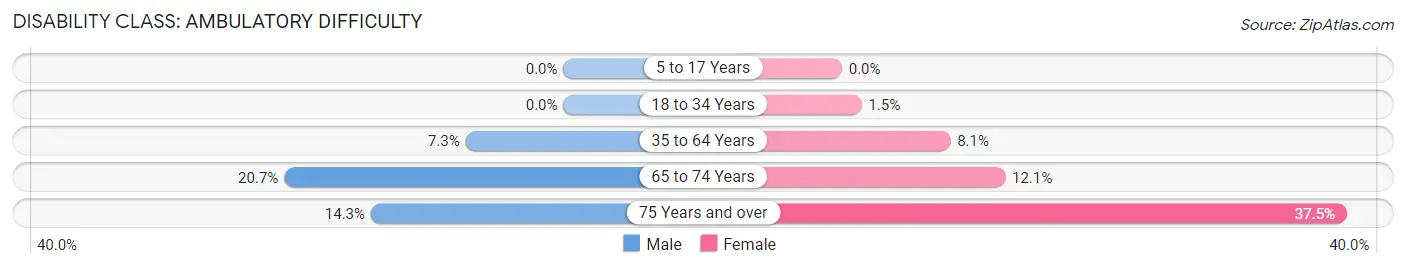
| Age Bracket | Male | Female |
| 5 to 17 Years | 0 (0.0%) | 0 (0.0%) |
| 18 to 34 Years | 0 (0.0%) | 3 (1.5%) |
| 35 to 64 Years | 27 (7.3%) | 28 (8.1%) |
| 65 to 74 Years | 17 (20.7%) | 12 (12.1%) |
| 75 Years and over | 12 (14.3%) | 36 (37.5%) |
Disability Class: Self-Care Difficulty
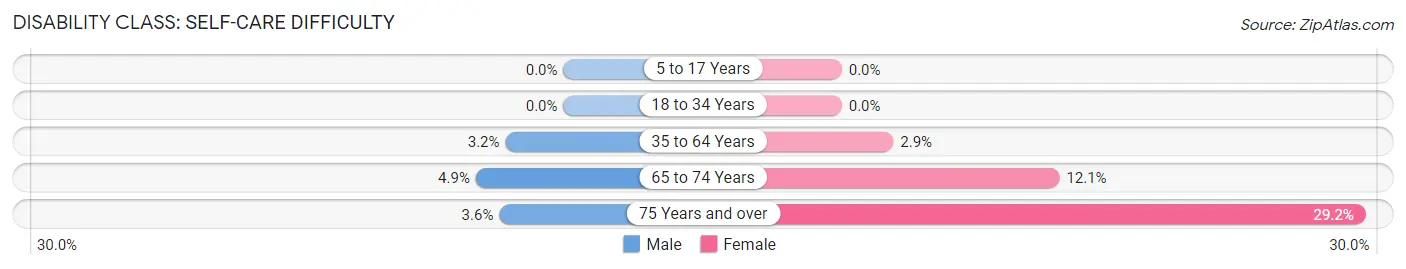
| Age Bracket | Male | Female |
| 5 to 17 Years | 0 (0.0%) | 0 (0.0%) |
| 18 to 34 Years | 0 (0.0%) | 0 (0.0%) |
| 35 to 64 Years | 12 (3.2%) | 10 (2.9%) |
| 65 to 74 Years | 4 (4.9%) | 12 (12.1%) |
| 75 Years and over | 3 (3.6%) | 28 (29.2%) |
Technology Access in Shelbina
Computing Device Access in Shelbina
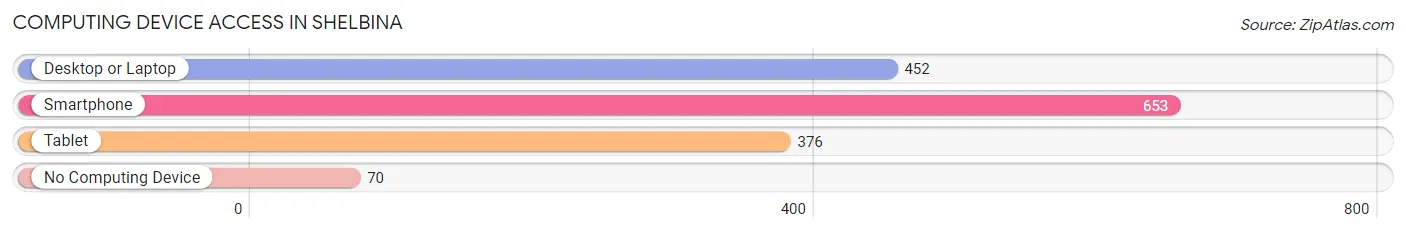
| Device Type | # Households | % Households |
| Desktop or Laptop | 452 | 60.4% |
| Smartphone | 653 | 87.2% |
| Tablet | 376 | 50.2% |
| No Computing Device | 70 | 9.3% |
| Total | 749 | 100.0% |
Internet Access in Shelbina
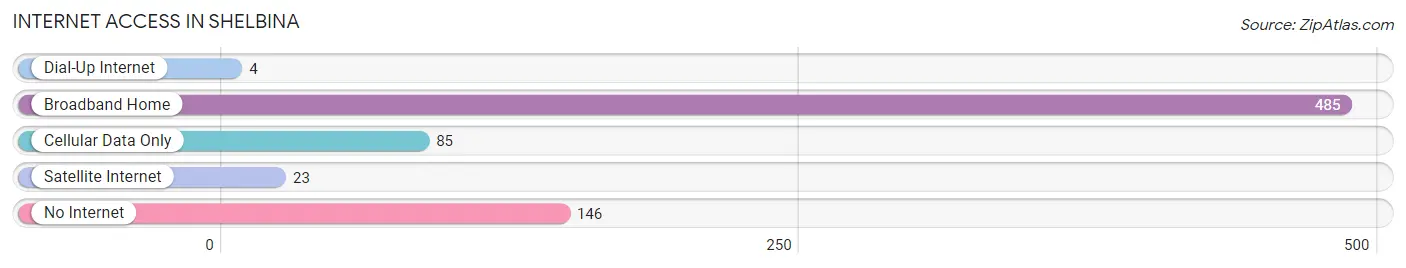
| Internet Type | # Households | % Households |
| Dial-Up Internet | 4 | 0.5% |
| Broadband Home | 485 | 64.7% |
| Cellular Data Only | 85 | 11.4% |
| Satellite Internet | 23 | 3.1% |
| No Internet | 146 | 19.5% |
| Total | 749 | 100.0% |
Shelbina Summary
Shelbina is a small city located in Shelby County, Missouri, United States. It is situated in the northeast corner of the state, approximately 50 miles northeast of the state capital, Jefferson City. The city has a population of 2,072 as of the 2010 census.
History
Shelbina was founded in 1837 by a group of settlers from Kentucky and Tennessee. The city was named after the daughter of one of the settlers, Shelbina Smith. The city was incorporated in 1867 and has since grown to become a thriving community.
The city was an important stop on the Hannibal and St. Joseph Railroad, which was the first railroad to cross the state of Missouri. The railroad was instrumental in the growth of the city, as it allowed for the transportation of goods and people to and from the city.
Geography
Shelbina is located at the intersection of U.S. Route 36 and Missouri Route 15. The city is situated in the northeast corner of the state, approximately 50 miles northeast of the state capital, Jefferson City. The city has a total area of 1.3 square miles, all of which is land.
The city is located in the Missouri River Valley, and is surrounded by rolling hills and farmland. The city is located near the Mark Twain National Forest, which provides a variety of recreational activities.
Economy
Shelbina’s economy is largely based on agriculture and manufacturing. The city is home to several large agricultural companies, including Monsanto, Cargill, and Tyson Foods. The city is also home to several manufacturing companies, including a plant that produces automotive parts.
The city is also home to several small businesses, including restaurants, retail stores, and service providers. The city is also home to a branch of the University of Missouri, which provides educational opportunities to the residents of the city.
Demographics
As of the 2010 census, the city had a population of 2,072. The racial makeup of the city was 95.3% White, 0.7% African American, 0.3% Native American, 0.3% Asian, 0.1% Pacific Islander, 1.2% from other races, and 2.3% from two or more races. Hispanic or Latino of any race were 3.2% of the population.
The median income for a household in the city was $37,917, and the median income for a family was $45,000. The per capita income for the city was $19,845. About 11.2% of families and 14.2% of the population were below the poverty line, including 19.2% of those under age 18 and 8.3% of those age 65 or over.
Shelbina is a small city with a rich history and a vibrant economy. The city is home to several large agricultural and manufacturing companies, as well as a variety of small businesses. The city is also home to a branch of the University of Missouri, which provides educational opportunities to the residents of the city. The city has a diverse population, with a median income that is slightly above the state average.
Common Questions
What is Per Capita Income in Shelbina?
Per Capita income in Shelbina is $22,597.
What is the Median Family Income in Shelbina?
Median Family Income in Shelbina is $63,654.
What is the Median Household income in Shelbina?
Median Household Income in Shelbina is $52,050.
What is Income or Wage Gap in Shelbina?
Income or Wage Gap in Shelbina is 50.4%.
Women in Shelbina earn 49.6 cents for every dollar earned by a man.
What is Inequality or Gini Index in Shelbina?
Inequality or Gini Index in Shelbina is 0.40.
What is the Total Population of Shelbina?
Total Population of Shelbina is 2,165.
What is the Total Male Population of Shelbina?
Total Male Population of Shelbina is 1,023.
What is the Total Female Population of Shelbina?
Total Female Population of Shelbina is 1,142.
What is the Ratio of Males per 100 Females in Shelbina?
There are 89.58 Males per 100 Females in Shelbina.
What is the Ratio of Females per 100 Males in Shelbina?
There are 111.63 Females per 100 Males in Shelbina.
What is the Median Population Age in Shelbina?
Median Population Age in Shelbina is 37.6 Years.
What is the Average Family Size in Shelbina
Average Family Size in Shelbina is 3.6 People.
What is the Average Household Size in Shelbina
Average Household Size in Shelbina is 2.8 People.
How Large is the Labor Force in Shelbina?
There are 1,000 People in the Labor Forcein in Shelbina.
What is the Percentage of People in the Labor Force in Shelbina?
62.2% of People are in the Labor Force in Shelbina.
What is the Unemployment Rate in Shelbina?
Unemployment Rate in Shelbina is 0.9%.