Crystal Lakes, MO Map & Demographics
Crystal Lakes Map
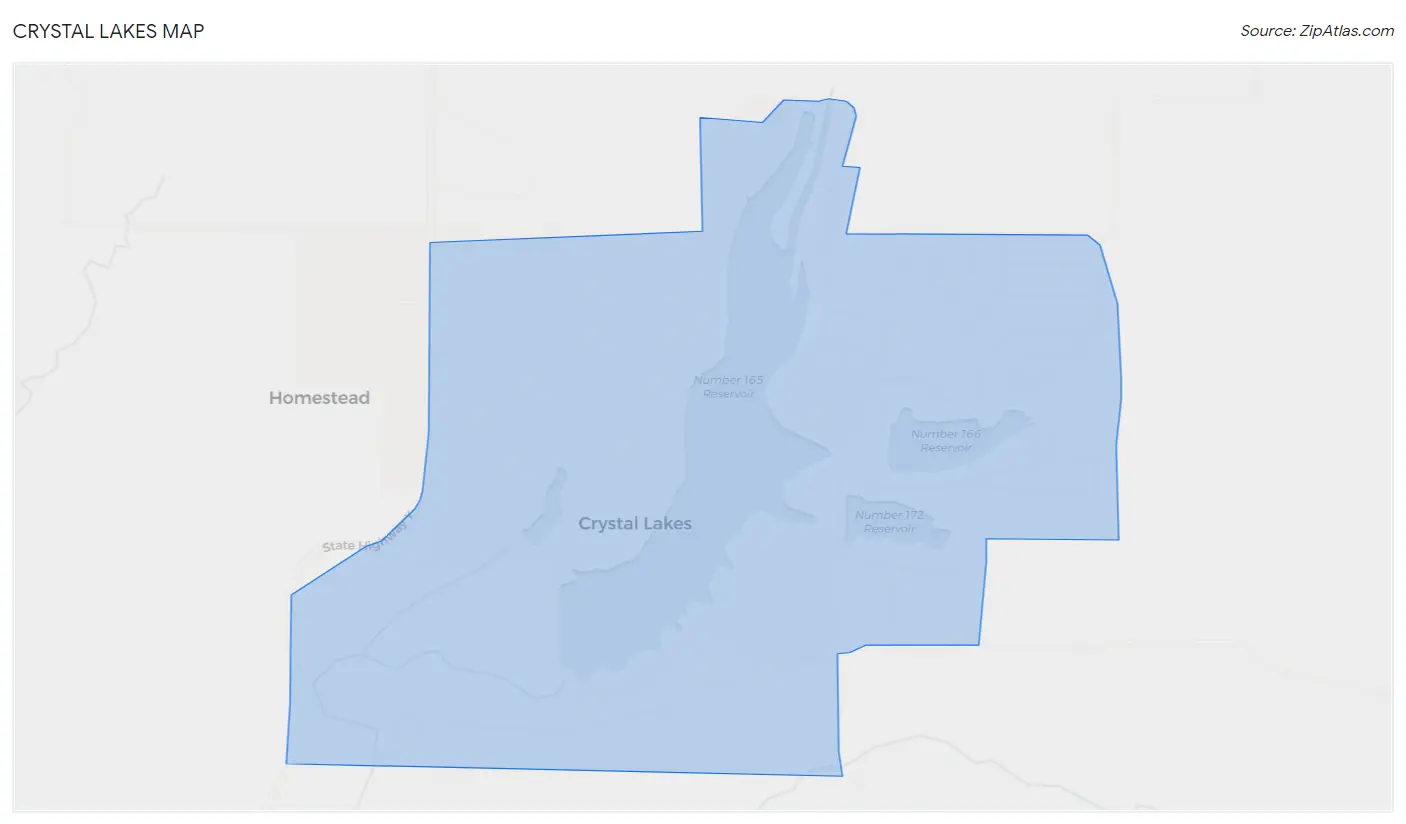
Crystal Lakes Overview
$27,705
PER CAPITA INCOME
$92,708
AVG FAMILY INCOME
$72,917
AVG HOUSEHOLD INCOME
0.8%
WAGE / INCOME GAP [ % ]
99.2¢/ $1
WAGE / INCOME GAP [ $ ]
$14,218
FAMILY INCOME DEFICIT
0.35
INEQUALITY / GINI INDEX
456
TOTAL POPULATION
253
MALE POPULATION
203
FEMALE POPULATION
124.63
MALES / 100 FEMALES
80.24
FEMALES / 100 MALES
33.5
MEDIAN AGE
3.5
AVG FAMILY SIZE
2.9
AVG HOUSEHOLD SIZE
208
LABOR FORCE [ PEOPLE ]
64.8%
PERCENT IN LABOR FORCE
1.9%
UNEMPLOYMENT RATE
Crystal Lakes Area Codes
Income in Crystal Lakes
Income Overview in Crystal Lakes
Per Capita Income in Crystal Lakes is $27,705, while median incomes of families and households are $92,708 and $72,917 respectively.
| Characteristic | Number | Measure |
| Per Capita Income | 456 | $27,705 |
| Median Family Income | 109 | $92,708 |
| Mean Family Income | 109 | $79,273 |
| Median Household Income | 157 | $72,917 |
| Mean Household Income | 157 | $71,799 |
| Income Deficit | 109 | $14,218 |
| Wage / Income Gap (%) | 456 | 0.75% |
| Wage / Income Gap ($) | 456 | 99.25¢ per $1 |
| Gini / Inequality Index | 456 | 0.35 |
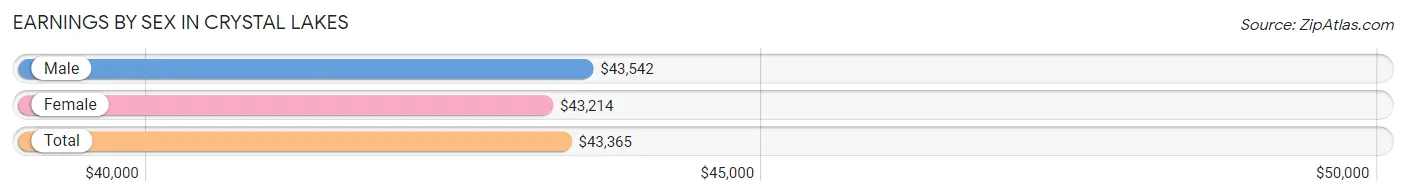
Earnings by Sex in Crystal Lakes
Average Earnings in Crystal Lakes are $43,365, $43,542 for men and $43,214 for women, a difference of 0.7%.
| Sex | Number | Average Earnings |
| Male | 109 (50.7%) | $43,542 |
| Female | 106 (49.3%) | $43,214 |
| Total | 215 (100.0%) | $43,365 |
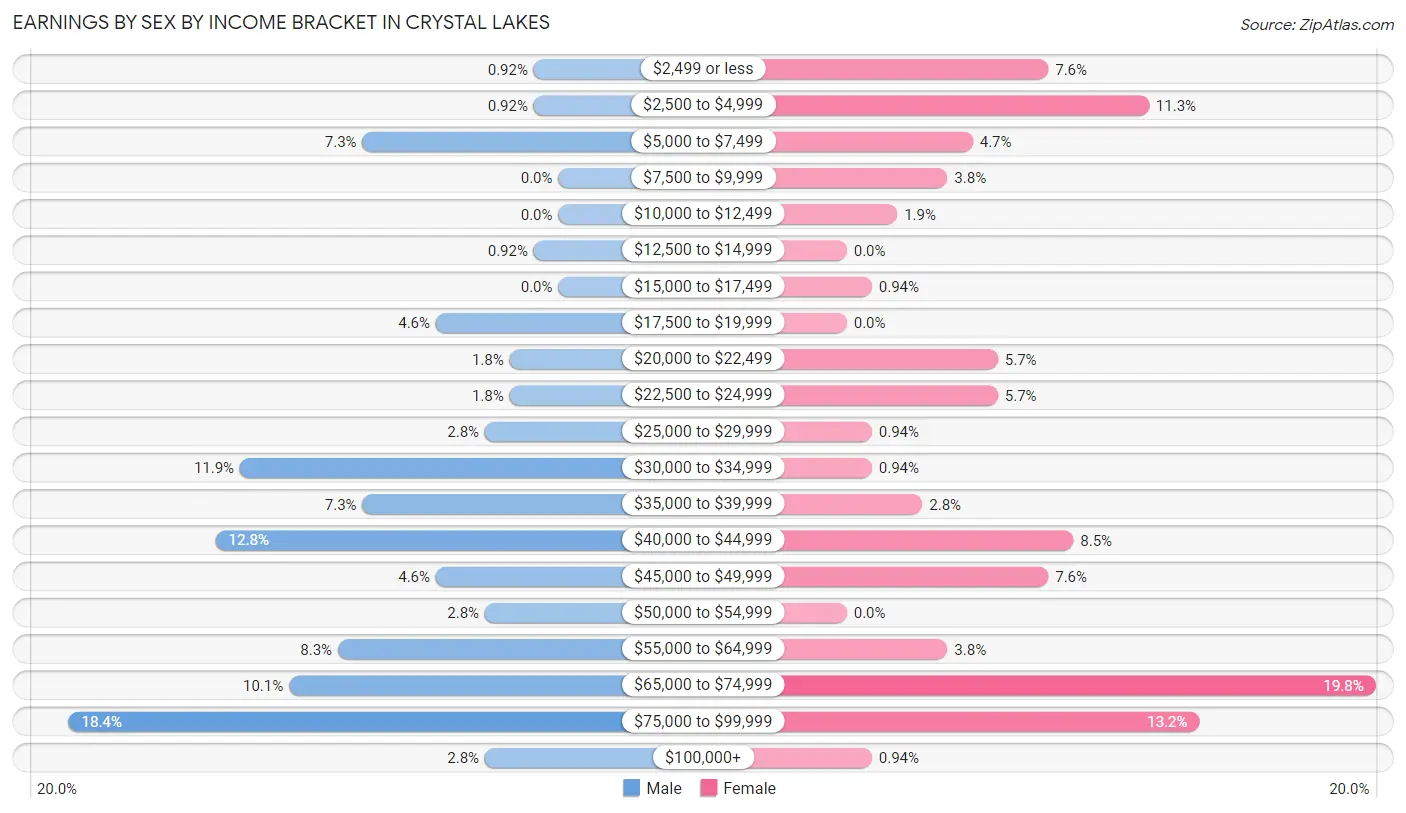
Earnings by Sex by Income Bracket in Crystal Lakes
The most common earnings brackets in Crystal Lakes are $75,000 to $99,999 for men (20 | 18.3%) and $65,000 to $74,999 for women (21 | 19.8%).
| Income | Male | Female |
| $2,499 or less | 1 (0.9%) | 8 (7.5%) |
| $2,500 to $4,999 | 1 (0.9%) | 12 (11.3%) |
| $5,000 to $7,499 | 8 (7.3%) | 5 (4.7%) |
| $7,500 to $9,999 | 0 (0.0%) | 4 (3.8%) |
| $10,000 to $12,499 | 0 (0.0%) | 2 (1.9%) |
| $12,500 to $14,999 | 1 (0.9%) | 0 (0.0%) |
| $15,000 to $17,499 | 0 (0.0%) | 1 (0.9%) |
| $17,500 to $19,999 | 5 (4.6%) | 0 (0.0%) |
| $20,000 to $22,499 | 2 (1.8%) | 6 (5.7%) |
| $22,500 to $24,999 | 2 (1.8%) | 6 (5.7%) |
| $25,000 to $29,999 | 3 (2.8%) | 1 (0.9%) |
| $30,000 to $34,999 | 13 (11.9%) | 1 (0.9%) |
| $35,000 to $39,999 | 8 (7.3%) | 3 (2.8%) |
| $40,000 to $44,999 | 14 (12.8%) | 9 (8.5%) |
| $45,000 to $49,999 | 5 (4.6%) | 8 (7.5%) |
| $50,000 to $54,999 | 3 (2.8%) | 0 (0.0%) |
| $55,000 to $64,999 | 9 (8.3%) | 4 (3.8%) |
| $65,000 to $74,999 | 11 (10.1%) | 21 (19.8%) |
| $75,000 to $99,999 | 20 (18.3%) | 14 (13.2%) |
| $100,000+ | 3 (2.8%) | 1 (0.9%) |
| Total | 109 (100.0%) | 106 (100.0%) |
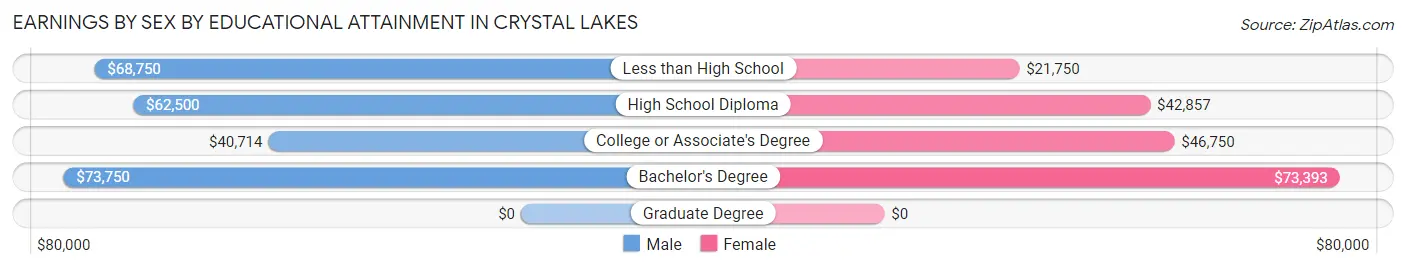
Earnings by Sex by Educational Attainment in Crystal Lakes
Average earnings in Crystal Lakes are $45,250 for men and $45,625 for women, a difference of 0.8%. Men with an educational attainment of bachelor's degree enjoy the highest average annual earnings of $73,750, while those with college or associate's degree education earn the least with $40,714. Women with an educational attainment of bachelor's degree earn the most with the average annual earnings of $73,393, while those with less than high school education have the smallest earnings of $21,750.
| Educational Attainment | Male Income | Female Income |
| Less than High School | $68,750 | $21,750 |
| High School Diploma | $62,500 | $42,857 |
| College or Associate's Degree | $40,714 | $46,750 |
| Bachelor's Degree | $73,750 | $73,393 |
| Graduate Degree | - | - |
| Total | $45,250 | $45,625 |
Family Income in Crystal Lakes
Family Income Brackets in Crystal Lakes
According to the Crystal Lakes family income data, there are 35 families falling into the $100,000 to $149,999 income range, which is the most common income bracket and makes up 32.1% of all families. Conversely, the $25,000 to $34,999 income bracket is the least frequent group with only 1 families (0.9%) belonging to this category.
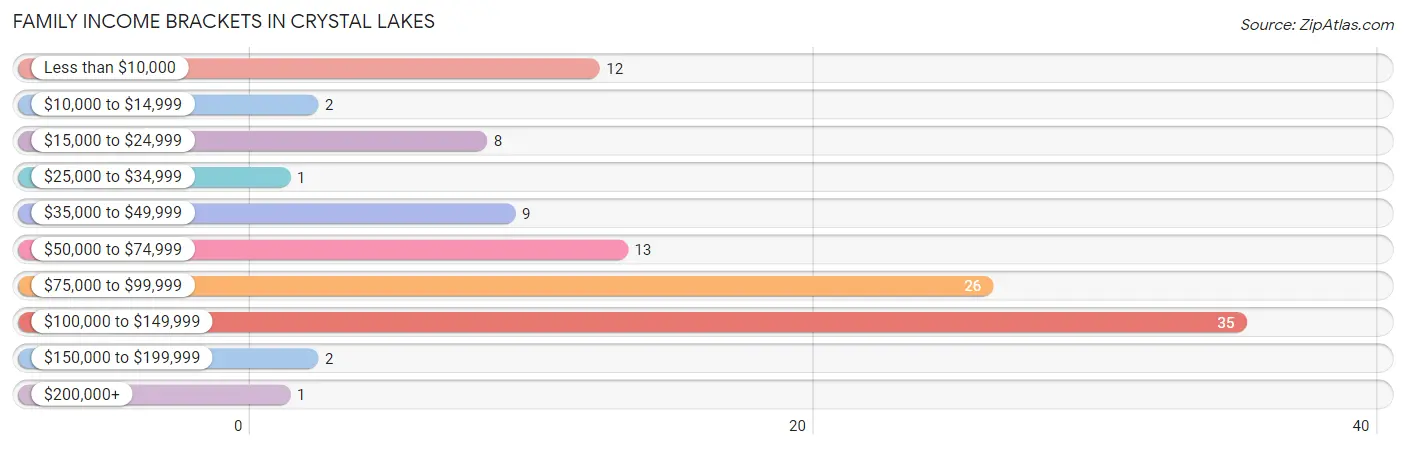
| Income Bracket | # Families | % Families |
| Less than $10,000 | 12 | 11.0% |
| $10,000 to $14,999 | 2 | 1.8% |
| $15,000 to $24,999 | 8 | 7.3% |
| $25,000 to $34,999 | 1 | 0.9% |
| $35,000 to $49,999 | 9 | 8.3% |
| $50,000 to $74,999 | 13 | 11.9% |
| $75,000 to $99,999 | 26 | 23.9% |
| $100,000 to $149,999 | 35 | 32.1% |
| $150,000 to $199,999 | 2 | 1.8% |
| $200,000+ | 1 | 0.9% |
Family Income by Famaliy Size in Crystal Lakes
4-person families (23 | 21.1%) account for the highest median family income in Crystal Lakes with $103,125 per family, while 2-person families (51 | 46.8%) have the highest median income of $47,292 per family member.
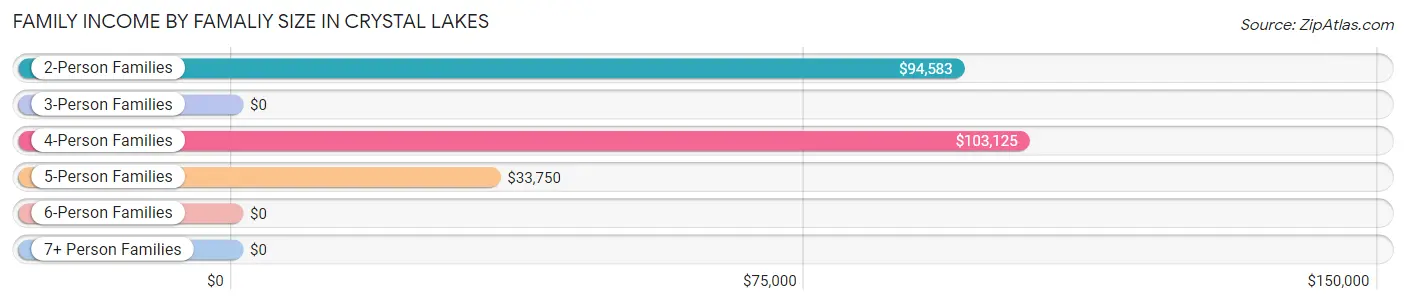
| Income Bracket | # Families | Median Income |
| 2-Person Families | 51 (46.8%) | $94,583 |
| 3-Person Families | 17 (15.6%) | $0 |
| 4-Person Families | 23 (21.1%) | $103,125 |
| 5-Person Families | 10 (9.2%) | $33,750 |
| 6-Person Families | 7 (6.4%) | $0 |
| 7+ Person Families | 1 (0.9%) | $0 |
| Total | 109 (100.0%) | $92,708 |
Family Income by Number of Earners in Crystal Lakes
The median family income in Crystal Lakes is $92,708, with families comprising 2 earners (36) having the highest median family income of $113,750, while families with no earners (14) have the lowest median family income of $53,750, accounting for 33.0% and 12.8% of families, respectively.
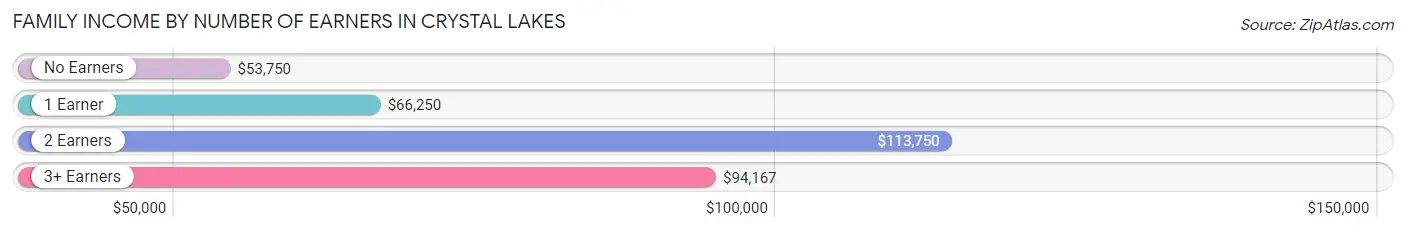
| Number of Earners | # Families | Median Income |
| No Earners | 14 (12.8%) | $53,750 |
| 1 Earner | 51 (46.8%) | $66,250 |
| 2 Earners | 36 (33.0%) | $113,750 |
| 3+ Earners | 8 (7.3%) | $94,167 |
| Total | 109 (100.0%) | $92,708 |
Household Income in Crystal Lakes
Household Income Brackets in Crystal Lakes
With 41 households falling in the category, the $100,000 to $149,999 income range is the most frequent in Crystal Lakes, accounting for 26.1% of all households. In contrast, only 1 households (0.6%) fall into the $200,000+ income bracket, making it the least populous group.
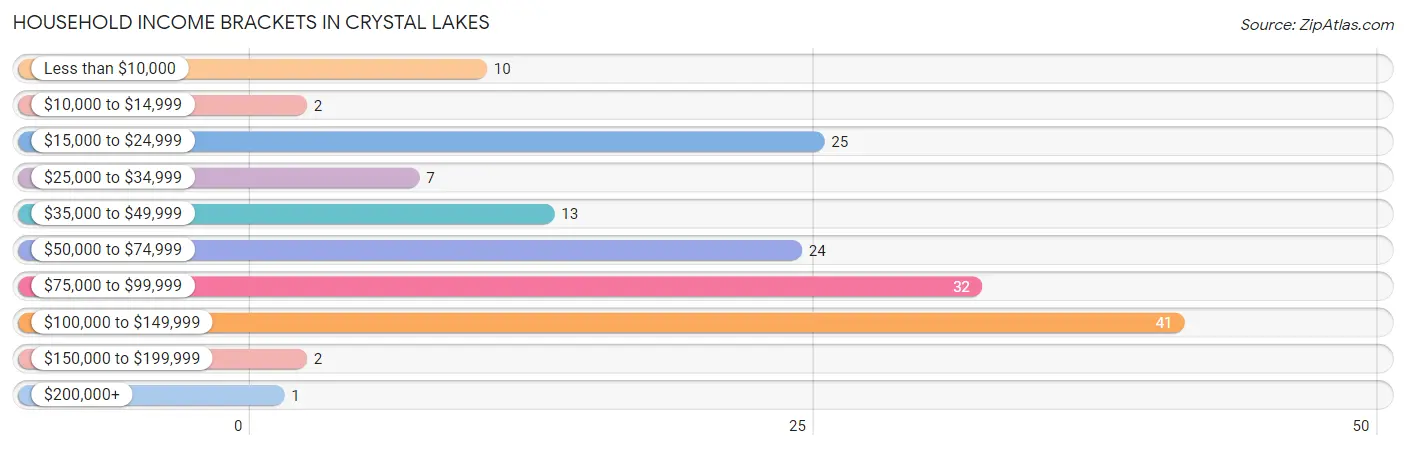
| Income Bracket | # Households | % Households |
| Less than $10,000 | 10 | 6.4% |
| $10,000 to $14,999 | 2 | 1.3% |
| $15,000 to $24,999 | 25 | 15.9% |
| $25,000 to $34,999 | 7 | 4.5% |
| $35,000 to $49,999 | 13 | 8.3% |
| $50,000 to $74,999 | 24 | 15.3% |
| $75,000 to $99,999 | 32 | 20.4% |
| $100,000 to $149,999 | 41 | 26.1% |
| $150,000 to $199,999 | 2 | 1.3% |
| $200,000+ | 1 | 0.6% |
Household Income by Householder Age in Crystal Lakes
The median household income in Crystal Lakes is $72,917, with the highest median household income of $101,000 found in the 25 to 44 years age bracket for the primary householder. A total of 52 households (33.1%) fall into this category.
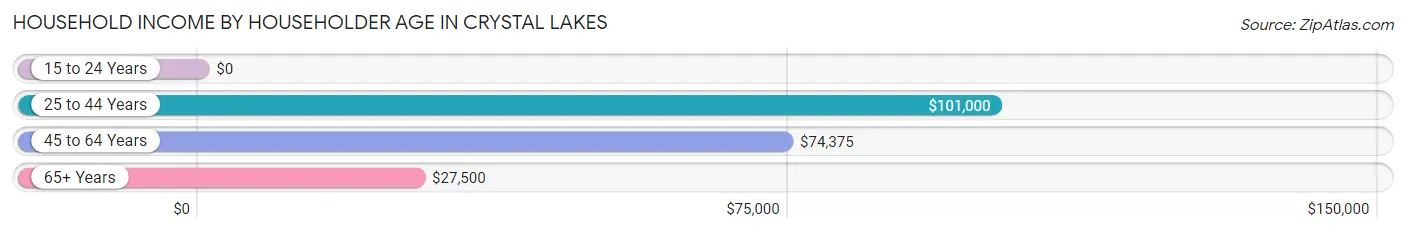
| Income Bracket | # Households | Median Income |
| 15 to 24 Years | 0 (0.0%) | $0 |
| 25 to 44 Years | 52 (33.1%) | $101,000 |
| 45 to 64 Years | 61 (38.9%) | $74,375 |
| 65+ Years | 44 (28.0%) | $27,500 |
| Total | 157 (100.0%) | $72,917 |
Poverty in Crystal Lakes
Income Below Poverty by Sex and Age in Crystal Lakes
With 17.8% poverty level for males and 21.7% for females among the residents of Crystal Lakes, 6 to 11 year old males and 18 to 24 year old females are the most vulnerable to poverty, with 26 males (63.4%) and 8 females (57.1%) in their respective age groups living below the poverty level.
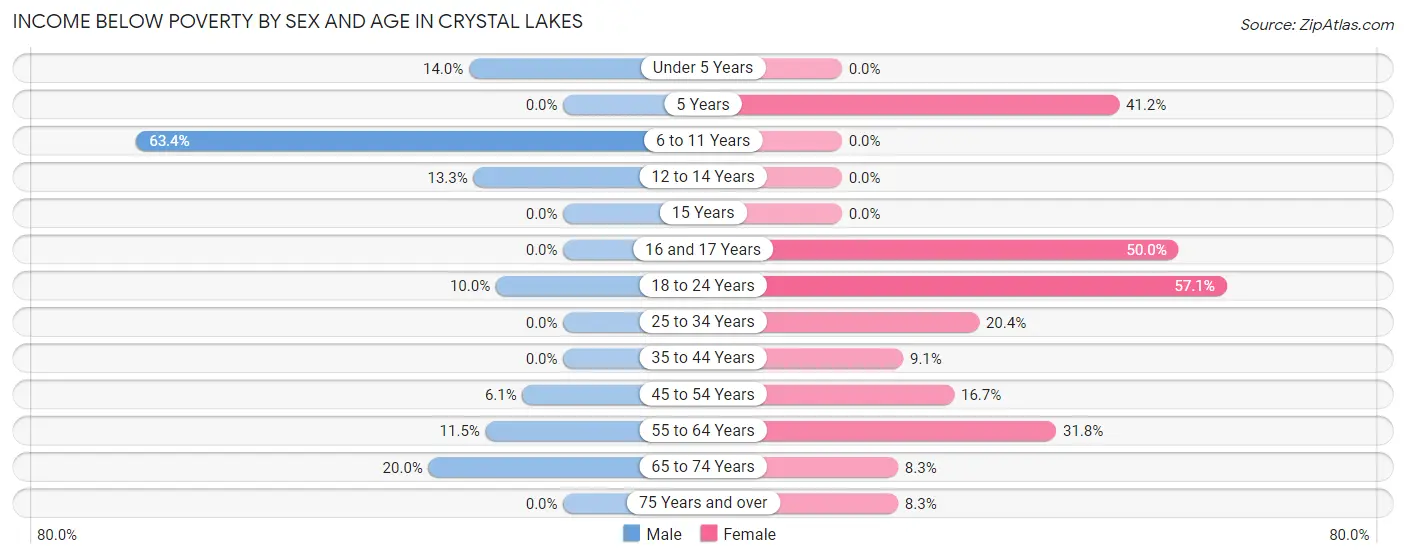
| Age Bracket | Male | Female |
| Under 5 Years | 7 (14.0%) | 0 (0.0%) |
| 5 Years | 0 (0.0%) | 7 (41.2%) |
| 6 to 11 Years | 26 (63.4%) | 0 (0.0%) |
| 12 to 14 Years | 2 (13.3%) | 0 (0.0%) |
| 15 Years | 0 (0.0%) | 0 (0.0%) |
| 16 and 17 Years | 0 (0.0%) | 1 (50.0%) |
| 18 to 24 Years | 1 (10.0%) | 8 (57.1%) |
| 25 to 34 Years | 0 (0.0%) | 11 (20.4%) |
| 35 to 44 Years | 0 (0.0%) | 1 (9.1%) |
| 45 to 54 Years | 2 (6.1%) | 6 (16.7%) |
| 55 to 64 Years | 3 (11.5%) | 7 (31.8%) |
| 65 to 74 Years | 4 (20.0%) | 1 (8.3%) |
| 75 Years and over | 0 (0.0%) | 2 (8.3%) |
| Total | 45 (17.8%) | 44 (21.7%) |
Income Above Poverty by Sex and Age in Crystal Lakes
According to the poverty statistics in Crystal Lakes, males aged 5 years and females aged 6 to 11 years are the age groups that are most secure financially, with 100.0% of males and 100.0% of females in these age groups living above the poverty line.
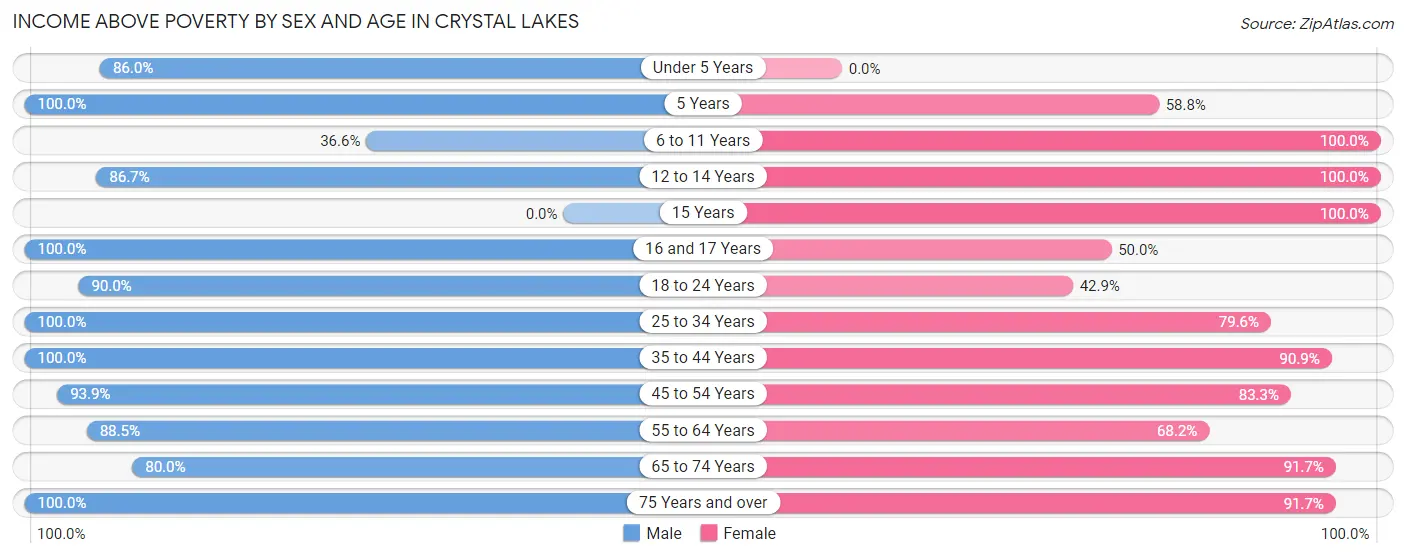
| Age Bracket | Male | Female |
| Under 5 Years | 43 (86.0%) | 0 (0.0%) |
| 5 Years | 1 (100.0%) | 10 (58.8%) |
| 6 to 11 Years | 15 (36.6%) | 7 (100.0%) |
| 12 to 14 Years | 13 (86.7%) | 2 (100.0%) |
| 15 Years | 0 (0.0%) | 2 (100.0%) |
| 16 and 17 Years | 2 (100.0%) | 1 (50.0%) |
| 18 to 24 Years | 9 (90.0%) | 6 (42.9%) |
| 25 to 34 Years | 23 (100.0%) | 43 (79.6%) |
| 35 to 44 Years | 22 (100.0%) | 10 (90.9%) |
| 45 to 54 Years | 31 (93.9%) | 30 (83.3%) |
| 55 to 64 Years | 23 (88.5%) | 15 (68.2%) |
| 65 to 74 Years | 16 (80.0%) | 11 (91.7%) |
| 75 Years and over | 10 (100.0%) | 22 (91.7%) |
| Total | 208 (82.2%) | 159 (78.3%) |
Income Below Poverty Among Married-Couple Families in Crystal Lakes
The poverty statistics for married-couple families in Crystal Lakes show that 8.4% or 7 of the total 83 families live below the poverty line. Families with no children have the highest poverty rate of 11.9%, comprising of 7 families. On the other hand, families with 1 or 2 children have the lowest poverty rate of 0.0%, which includes 0 families.
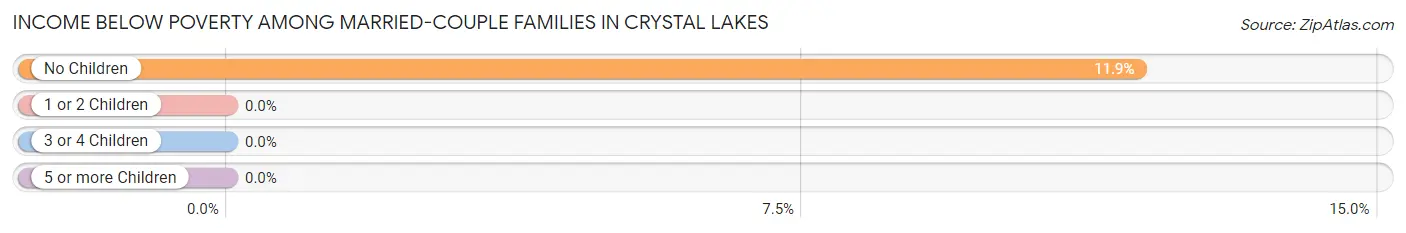
| Children | Above Poverty | Below Poverty |
| No Children | 52 (88.1%) | 7 (11.9%) |
| 1 or 2 Children | 19 (100.0%) | 0 (0.0%) |
| 3 or 4 Children | 5 (100.0%) | 0 (0.0%) |
| 5 or more Children | 0 (0.0%) | 0 (0.0%) |
| Total | 76 (91.6%) | 7 (8.4%) |
Income Below Poverty Among Single-Parent Households in Crystal Lakes
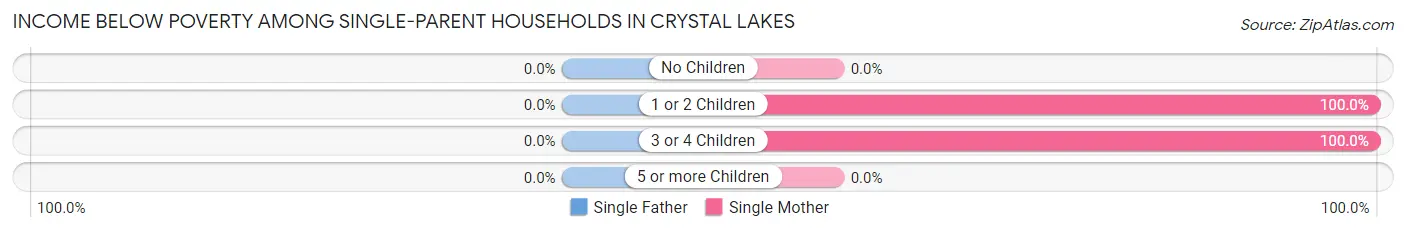
| Children | Single Father | Single Mother |
| No Children | 0 (0.0%) | 0 (0.0%) |
| 1 or 2 Children | 0 (0.0%) | 4 (100.0%) |
| 3 or 4 Children | 0 (0.0%) | 11 (100.0%) |
| 5 or more Children | 0 (0.0%) | 0 (0.0%) |
| Total | 0 (0.0%) | 15 (100.0%) |
Income Below Poverty Among Married-Couple vs Single-Parent Households in Crystal Lakes
The poverty data for Crystal Lakes shows that 7 of the married-couple family households (8.4%) and 15 of the single-parent households (57.7%) are living below the poverty level. Within the married-couple family households, those with no children have the highest poverty rate, with 7 households (11.9%) falling below the poverty line. Among the single-parent households, those with 1 or 2 children have the highest poverty rate, with 4 household (100.0%) living below poverty.
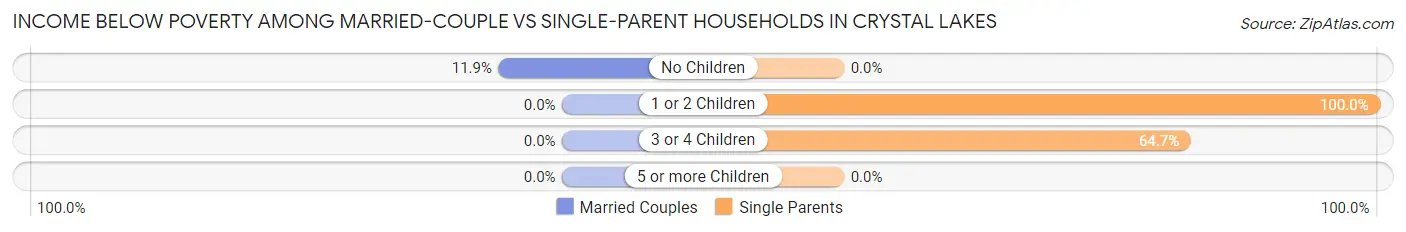
| Children | Married-Couple Families | Single-Parent Households |
| No Children | 7 (11.9%) | 0 (0.0%) |
| 1 or 2 Children | 0 (0.0%) | 4 (100.0%) |
| 3 or 4 Children | 0 (0.0%) | 11 (64.7%) |
| 5 or more Children | 0 (0.0%) | 0 (0.0%) |
| Total | 7 (8.4%) | 15 (57.7%) |
Race in Crystal Lakes
The most populous races in Crystal Lakes are White / Caucasian (369 | 80.9%), Two or more Races (75 | 16.5%), and Black / African American (11 | 2.4%).
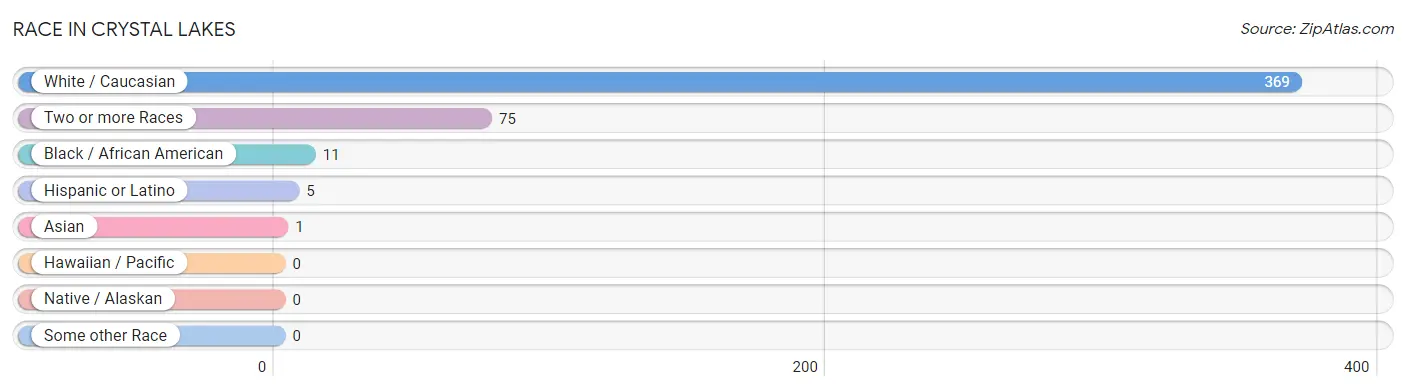
| Race | # Population | % Population |
| Asian | 1 | 0.2% |
| Black / African American | 11 | 2.4% |
| Hawaiian / Pacific | 0 | 0.0% |
| Hispanic or Latino | 5 | 1.1% |
| Native / Alaskan | 0 | 0.0% |
| White / Caucasian | 369 | 80.9% |
| Two or more Races | 75 | 16.5% |
| Some other Race | 0 | 0.0% |
| Total | 456 | 100.0% |
Ancestry in Crystal Lakes
The most populous ancestries reported in Crystal Lakes are German (104 | 22.8%), Irish (80 | 17.5%), English (74 | 16.2%), Belgian (32 | 7.0%), and American (20 | 4.4%), together accounting for 68.0% of all Crystal Lakes residents.
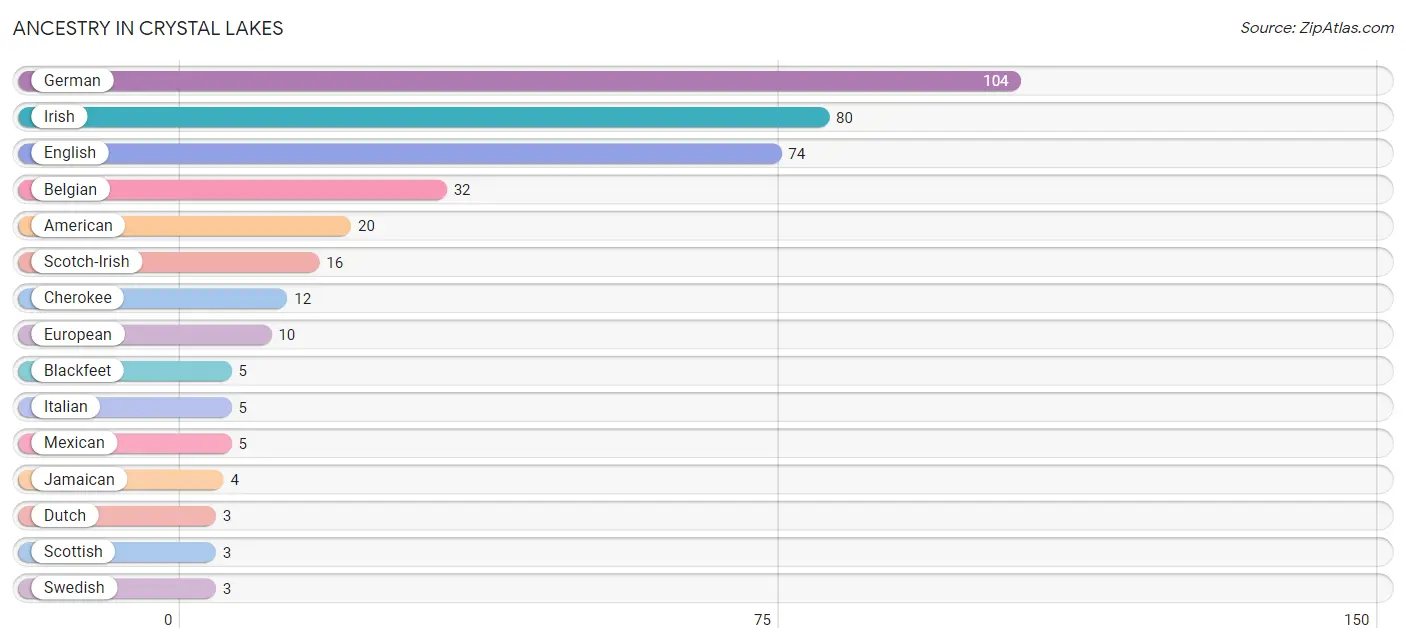
| Ancestry | # Population | % Population |
| American | 20 | 4.4% |
| Austrian | 1 | 0.2% |
| Belgian | 32 | 7.0% |
| Bhutanese | 2 | 0.4% |
| Blackfeet | 5 | 1.1% |
| Cherokee | 12 | 2.6% |
| Creek | 2 | 0.4% |
| Dutch | 3 | 0.7% |
| English | 74 | 16.2% |
| European | 10 | 2.2% |
| French Canadian | 1 | 0.2% |
| German | 104 | 22.8% |
| Irish | 80 | 17.5% |
| Iroquois | 2 | 0.4% |
| Italian | 5 | 1.1% |
| Jamaican | 4 | 0.9% |
| Mexican | 5 | 1.1% |
| Pennsylvania German | 1 | 0.2% |
| Scotch-Irish | 16 | 3.5% |
| Scottish | 3 | 0.7% |
| Swedish | 3 | 0.7% |
| Swiss | 2 | 0.4% |
| Welsh | 2 | 0.4% | View All 23 Rows |
Immigrants in Crystal Lakes

| Immigration Origin | # Population | % Population | View All 0 Rows |
Sex and Age in Crystal Lakes
Sex and Age in Crystal Lakes
The most populous age groups in Crystal Lakes are Under 5 Years (50 | 19.8%) for men and 30 to 34 Years (30 | 14.8%) for women.
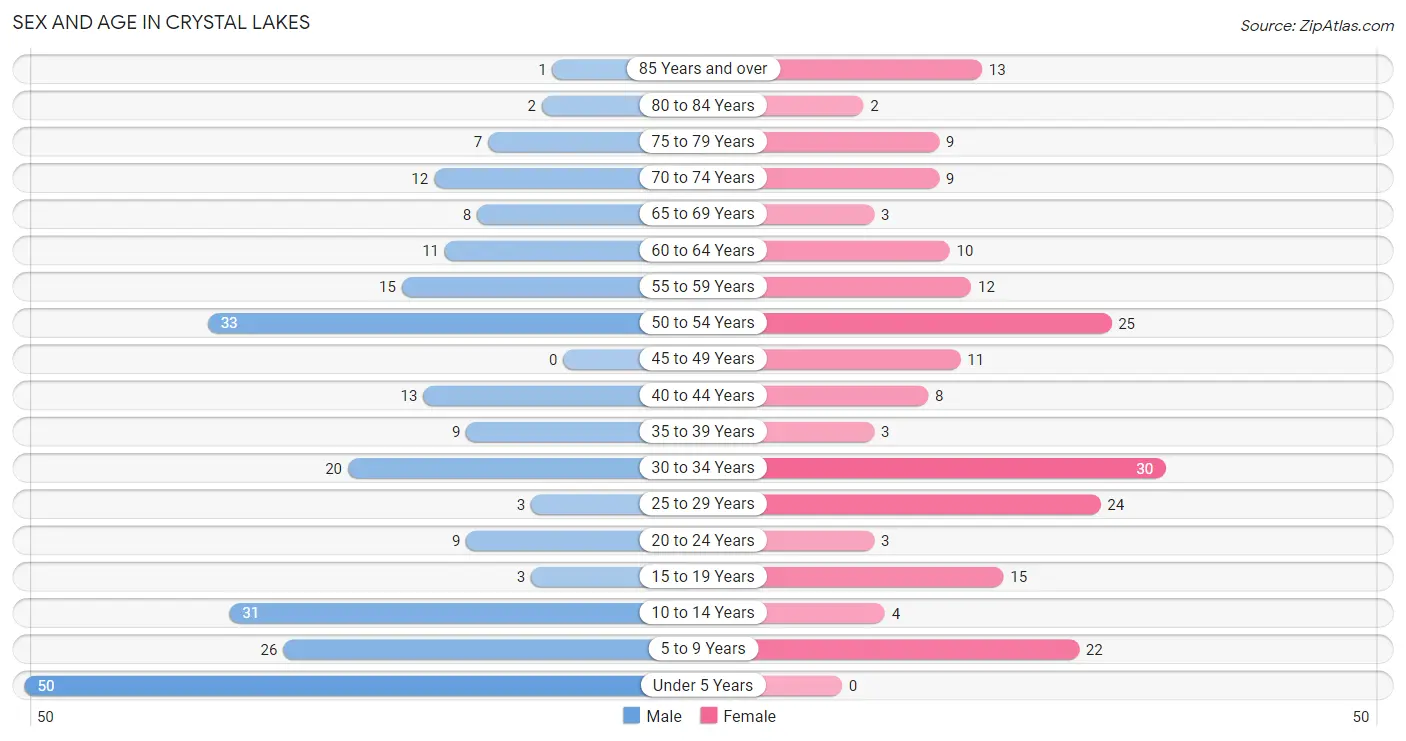
| Age Bracket | Male | Female |
| Under 5 Years | 50 (19.8%) | 0 (0.0%) |
| 5 to 9 Years | 26 (10.3%) | 22 (10.8%) |
| 10 to 14 Years | 31 (12.2%) | 4 (2.0%) |
| 15 to 19 Years | 3 (1.2%) | 15 (7.4%) |
| 20 to 24 Years | 9 (3.6%) | 3 (1.5%) |
| 25 to 29 Years | 3 (1.2%) | 24 (11.8%) |
| 30 to 34 Years | 20 (7.9%) | 30 (14.8%) |
| 35 to 39 Years | 9 (3.6%) | 3 (1.5%) |
| 40 to 44 Years | 13 (5.1%) | 8 (3.9%) |
| 45 to 49 Years | 0 (0.0%) | 11 (5.4%) |
| 50 to 54 Years | 33 (13.0%) | 25 (12.3%) |
| 55 to 59 Years | 15 (5.9%) | 12 (5.9%) |
| 60 to 64 Years | 11 (4.3%) | 10 (4.9%) |
| 65 to 69 Years | 8 (3.2%) | 3 (1.5%) |
| 70 to 74 Years | 12 (4.7%) | 9 (4.4%) |
| 75 to 79 Years | 7 (2.8%) | 9 (4.4%) |
| 80 to 84 Years | 2 (0.8%) | 2 (1.0%) |
| 85 Years and over | 1 (0.4%) | 13 (6.4%) |
| Total | 253 (100.0%) | 203 (100.0%) |
Families and Households in Crystal Lakes
Median Family Size in Crystal Lakes
The median family size in Crystal Lakes is 3.49 persons per family, with single female/mother families (15 | 13.8%) accounting for the largest median family size of 4.2 persons per family. On the other hand, married-couple families (83 | 76.1%) represent the smallest median family size with 3.30 persons per family.
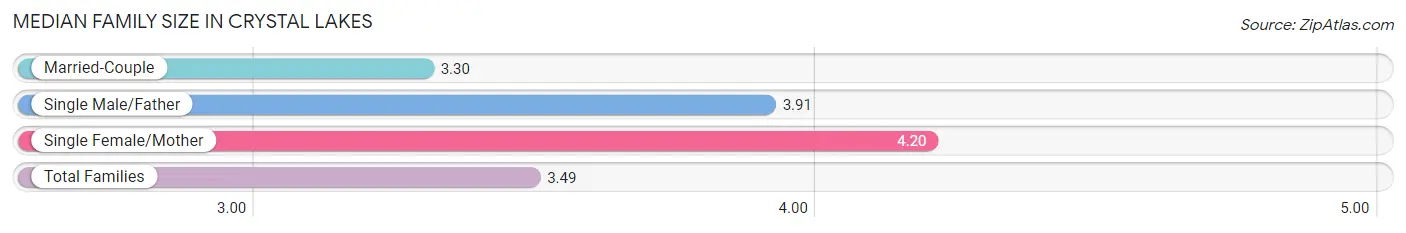
| Family Type | # Families | Family Size |
| Married-Couple | 83 (76.1%) | 3.30 |
| Single Male/Father | 11 (10.1%) | 3.91 |
| Single Female/Mother | 15 (13.8%) | 4.20 |
| Total Families | 109 (100.0%) | 3.49 |
Median Household Size in Crystal Lakes
The median household size in Crystal Lakes is 2.90 persons per household, with single male/father households (11 | 7.0%) accounting for the largest median household size of 4.55 persons per household. non-family households (48 | 30.6%) represent the smallest median household size with 1.17 persons per household.
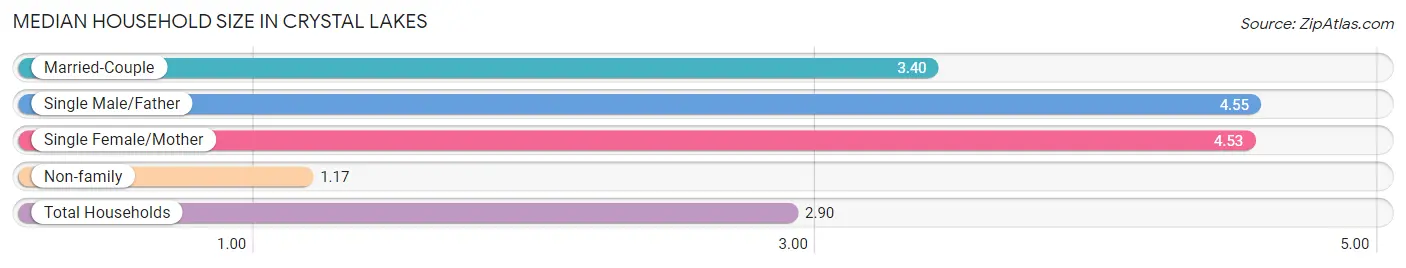
| Household Type | # Households | Household Size |
| Married-Couple | 83 (52.9%) | 3.40 |
| Single Male/Father | 11 (7.0%) | 4.55 |
| Single Female/Mother | 15 (9.6%) | 4.53 |
| Non-family | 48 (30.6%) | 1.17 |
| Total Households | 157 (100.0%) | 2.90 |
Household Size by Marriage Status in Crystal Lakes
Out of a total of 157 households in Crystal Lakes, 109 (69.4%) are family households, while 48 (30.6%) are nonfamily households. The most numerous type of family households are 2-person households, comprising 47, and the most common type of nonfamily households are 1-person households, comprising 43.
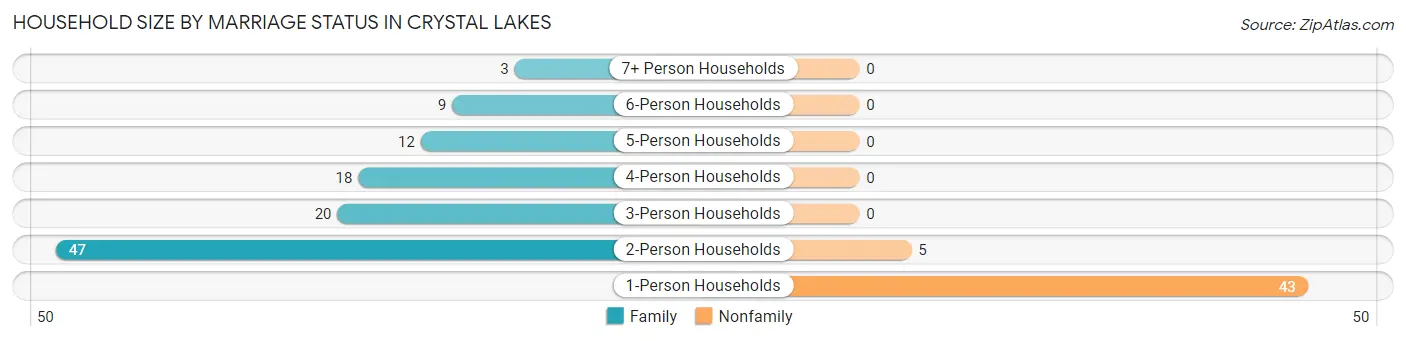
| Household Size | Family Households | Nonfamily Households |
| 1-Person Households | - | 43 (27.4%) |
| 2-Person Households | 47 (29.9%) | 5 (3.2%) |
| 3-Person Households | 20 (12.7%) | 0 (0.0%) |
| 4-Person Households | 18 (11.5%) | 0 (0.0%) |
| 5-Person Households | 12 (7.6%) | 0 (0.0%) |
| 6-Person Households | 9 (5.7%) | 0 (0.0%) |
| 7+ Person Households | 3 (1.9%) | 0 (0.0%) |
| Total | 109 (69.4%) | 48 (30.6%) |
Female Fertility in Crystal Lakes
Fertility by Age in Crystal Lakes
Average fertility rate in Crystal Lakes is 188.0 births per 1,000 women. Women in the age bracket of 20 to 34 years have the highest fertility rate with 298.0 births per 1,000 women. Women in the age bracket of 20 to 34 years acount for 89.5% of all women with births.
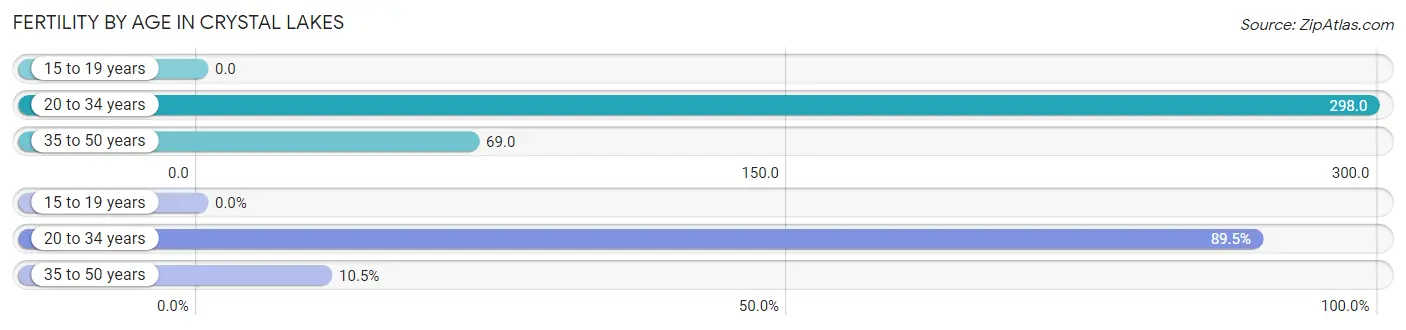
| Age Bracket | Women with Births | Births / 1,000 Women |
| 15 to 19 years | 0 (0.0%) | 0.0 |
| 20 to 34 years | 17 (89.5%) | 298.0 |
| 35 to 50 years | 2 (10.5%) | 69.0 |
| Total | 19 (100.0%) | 188.0 |
Fertility by Age by Marriage Status in Crystal Lakes
26.3% of women with births (19) in Crystal Lakes are married. The highest percentage of unmarried women with births falls into 35 to 50 years age bracket with 100.0% of them unmarried at the time of birth, while the lowest percentage of unmarried women with births belong to 20 to 34 years age bracket with 70.6% of them unmarried.
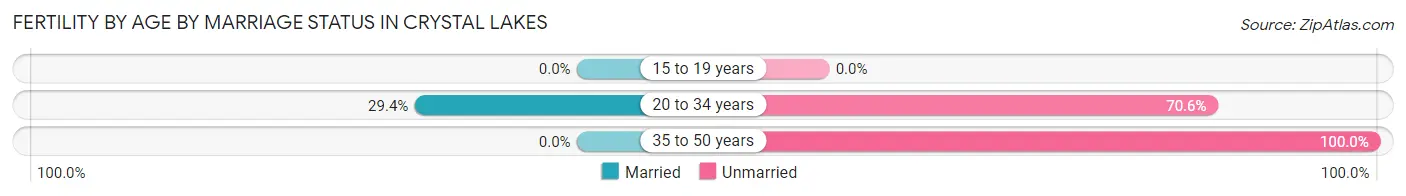
| Age Bracket | Married | Unmarried |
| 15 to 19 years | 0 (0.0%) | 0 (0.0%) |
| 20 to 34 years | 5 (29.4%) | 12 (70.6%) |
| 35 to 50 years | 0 (0.0%) | 2 (100.0%) |
| Total | 5 (26.3%) | 14 (73.7%) |
Fertility by Education in Crystal Lakes
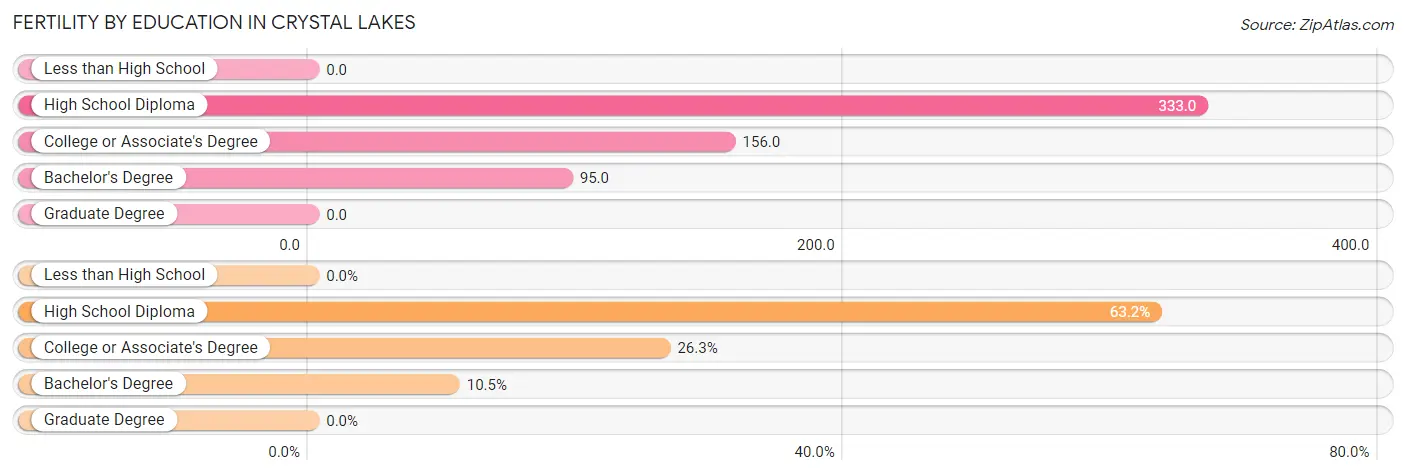
| Educational Attainment | Women with Births | Births / 1,000 Women |
| Less than High School | 0 (0.0%) | 0.0 |
| High School Diploma | 12 (63.2%) | 333.0 |
| College or Associate's Degree | 5 (26.3%) | 156.0 |
| Bachelor's Degree | 2 (10.5%) | 95.0 |
| Graduate Degree | 0 (0.0%) | 0.0 |
| Total | 19 (100.0%) | 188.0 |
Fertility by Education by Marriage Status in Crystal Lakes
73.7% of women with births in Crystal Lakes are unmarried. Women with the educational attainment of bachelor's degree are most likely to be married with 100.0% of them married at childbirth, while women with the educational attainment of high school diploma are least likely to be married with 100.0% of them unmarried at childbirth.
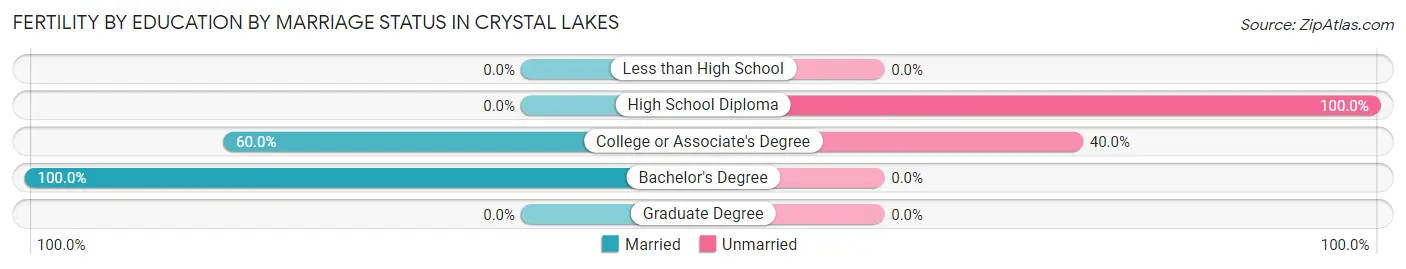
| Educational Attainment | Married | Unmarried |
| Less than High School | 0 (0.0%) | 0 (0.0%) |
| High School Diploma | 0 (0.0%) | 12 (100.0%) |
| College or Associate's Degree | 3 (60.0%) | 2 (40.0%) |
| Bachelor's Degree | 2 (100.0%) | 0 (0.0%) |
| Graduate Degree | 0 (0.0%) | 0 (0.0%) |
| Total | 5 (26.3%) | 14 (73.7%) |
Employment Characteristics in Crystal Lakes
Employment by Class of Employer in Crystal Lakes
Among the 201 employed individuals in Crystal Lakes, private company employees (162 | 80.6%), self-employed (not incorporated) (11 | 5.5%), and local government employees (9 | 4.5%) make up the most common classes of employment.
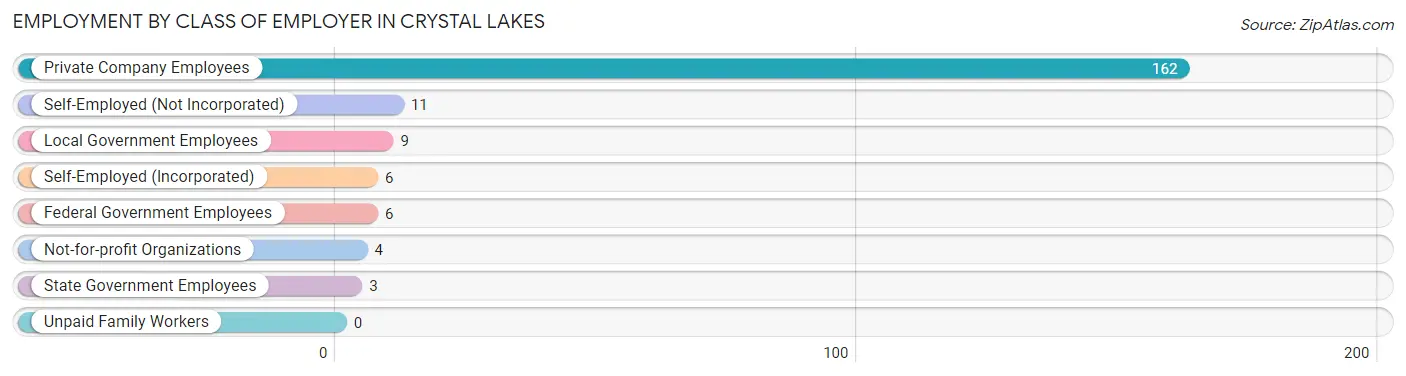
| Employer Class | # Employees | % Employees |
| Private Company Employees | 162 | 80.6% |
| Self-Employed (Incorporated) | 6 | 3.0% |
| Self-Employed (Not Incorporated) | 11 | 5.5% |
| Not-for-profit Organizations | 4 | 2.0% |
| Local Government Employees | 9 | 4.5% |
| State Government Employees | 3 | 1.5% |
| Federal Government Employees | 6 | 3.0% |
| Unpaid Family Workers | 0 | 0.0% |
| Total | 201 | 100.0% |
Employment Status by Age in Crystal Lakes
According to the labor force statistics for Crystal Lakes, out of the total population over 16 years of age (321), 64.8% or 208 individuals are in the labor force, with 1.9% or 4 of them unemployed. The age group with the highest labor force participation rate is 30 to 34 years, with 92.0% or 46 individuals in the labor force. Within the labor force, the 60 to 64 years age range has the highest percentage of unemployed individuals, with 14.3% or 1 of them being unemployed.
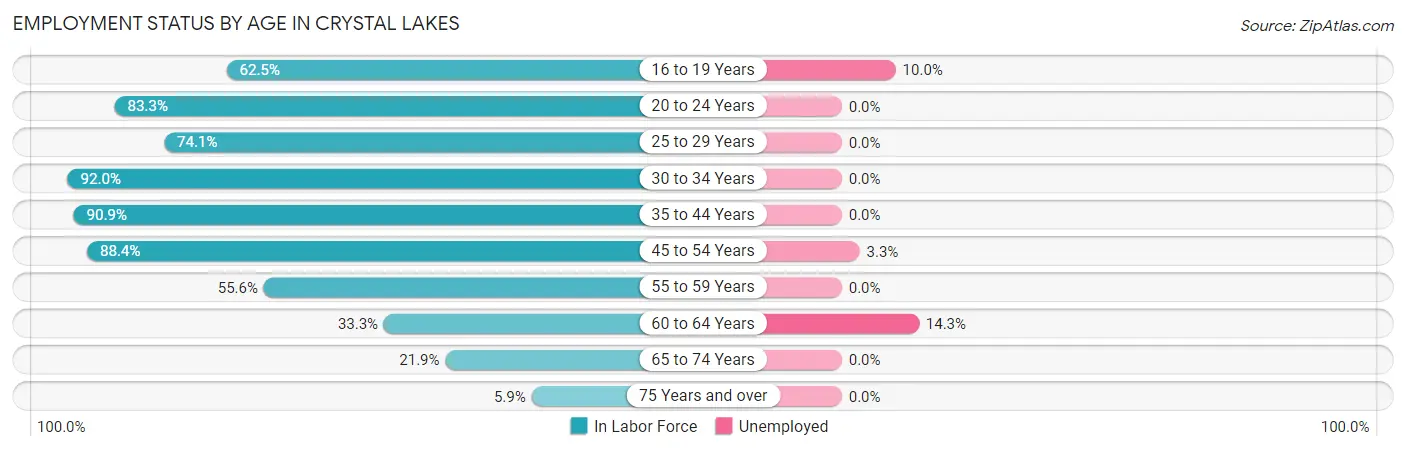
| Age Bracket | In Labor Force | Unemployed |
| 16 to 19 Years | 10 (62.5%) | 1 (10.0%) |
| 20 to 24 Years | 10 (83.3%) | 0 (0.0%) |
| 25 to 29 Years | 20 (74.1%) | 0 (0.0%) |
| 30 to 34 Years | 46 (92.0%) | 0 (0.0%) |
| 35 to 44 Years | 30 (90.9%) | 0 (0.0%) |
| 45 to 54 Years | 61 (88.4%) | 2 (3.3%) |
| 55 to 59 Years | 15 (55.6%) | 0 (0.0%) |
| 60 to 64 Years | 7 (33.3%) | 1 (14.3%) |
| 65 to 74 Years | 7 (21.9%) | 0 (0.0%) |
| 75 Years and over | 2 (5.9%) | 0 (0.0%) |
| Total | 208 (64.8%) | 4 (1.9%) |
Employment Status by Educational Attainment in Crystal Lakes
According to labor force statistics for Crystal Lakes, 78.9% of individuals (179) out of the total population between 25 and 64 years of age (227) are in the labor force, with 1.7% or 3 of them being unemployed. The group with the highest labor force participation rate are those with the educational attainment of bachelor's degree or higher, with 85.7% or 24 individuals in the labor force. Within the labor force, individuals with college / associate degree education have the highest percentage of unemployment, with 5.8% or 3 of them being unemployed.
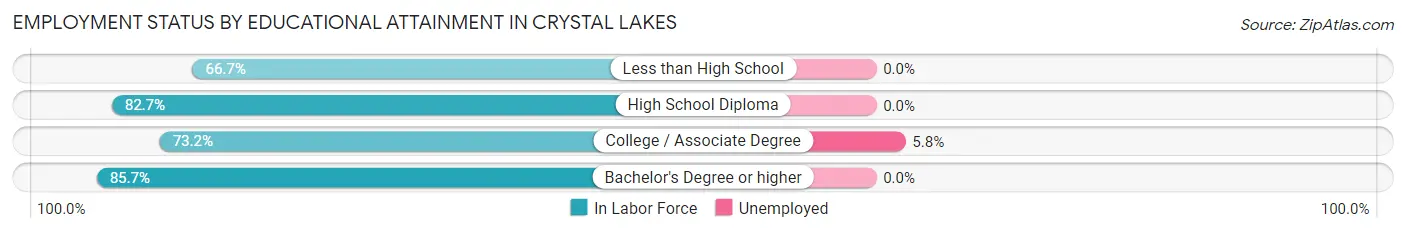
| Educational Attainment | In Labor Force | Unemployed |
| Less than High School | 12 (66.7%) | 0 (0.0%) |
| High School Diploma | 91 (82.7%) | 0 (0.0%) |
| College / Associate Degree | 52 (73.2%) | 4 (5.8%) |
| Bachelor's Degree or higher | 24 (85.7%) | 0 (0.0%) |
| Total | 179 (78.9%) | 4 (1.7%) |
Employment Occupations by Sex in Crystal Lakes
Management, Business, Science and Arts Occupations
The most common Management, Business, Science and Arts occupations in Crystal Lakes are Management (25 | 12.2%), Health Diagnosing & Treating (19 | 9.3%), Business & Financial (15 | 7.3%), Health Technologists (11 | 5.4%), and Community & Social Service (4 | 2.0%).
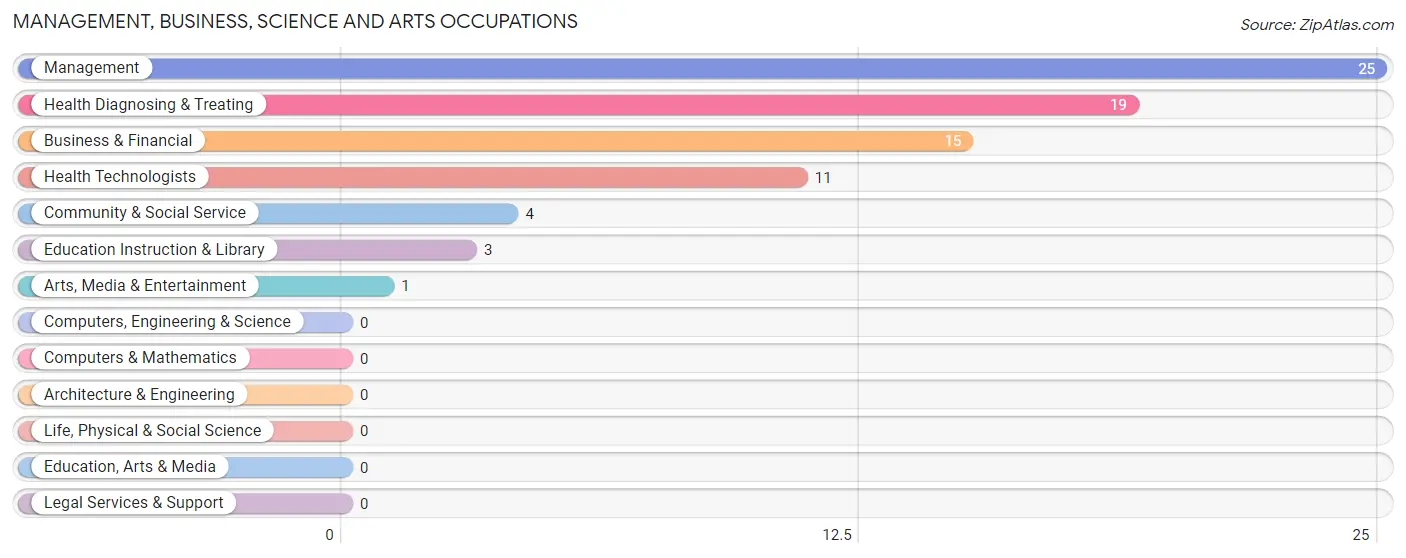
Management, Business, Science and Arts Occupations by Sex
Within the Management, Business, Science and Arts occupations in Crystal Lakes, the most male-oriented occupations are Management (68.0%), Health Technologists (36.4%), and Health Diagnosing & Treating (21.0%), while the most female-oriented occupations are Business & Financial (100.0%), Community & Social Service (100.0%), and Education Instruction & Library (100.0%).
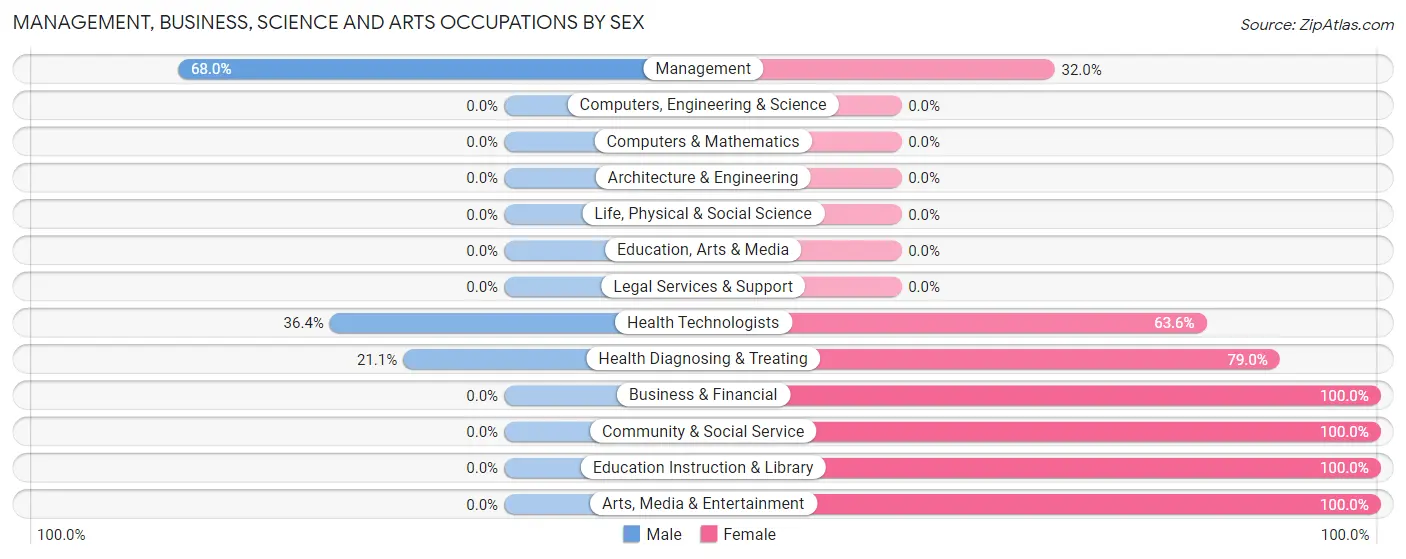
| Occupation | Male | Female |
| Management | 17 (68.0%) | 8 (32.0%) |
| Business & Financial | 0 (0.0%) | 15 (100.0%) |
| Computers, Engineering & Science | 0 (0.0%) | 0 (0.0%) |
| Computers & Mathematics | 0 (0.0%) | 0 (0.0%) |
| Architecture & Engineering | 0 (0.0%) | 0 (0.0%) |
| Life, Physical & Social Science | 0 (0.0%) | 0 (0.0%) |
| Community & Social Service | 0 (0.0%) | 4 (100.0%) |
| Education, Arts & Media | 0 (0.0%) | 0 (0.0%) |
| Legal Services & Support | 0 (0.0%) | 0 (0.0%) |
| Education Instruction & Library | 0 (0.0%) | 3 (100.0%) |
| Arts, Media & Entertainment | 0 (0.0%) | 1 (100.0%) |
| Health Diagnosing & Treating | 4 (21.0%) | 15 (78.9%) |
| Health Technologists | 4 (36.4%) | 7 (63.6%) |
| Total (Category) | 21 (33.3%) | 42 (66.7%) |
| Total (Overall) | 105 (51.5%) | 99 (48.5%) |
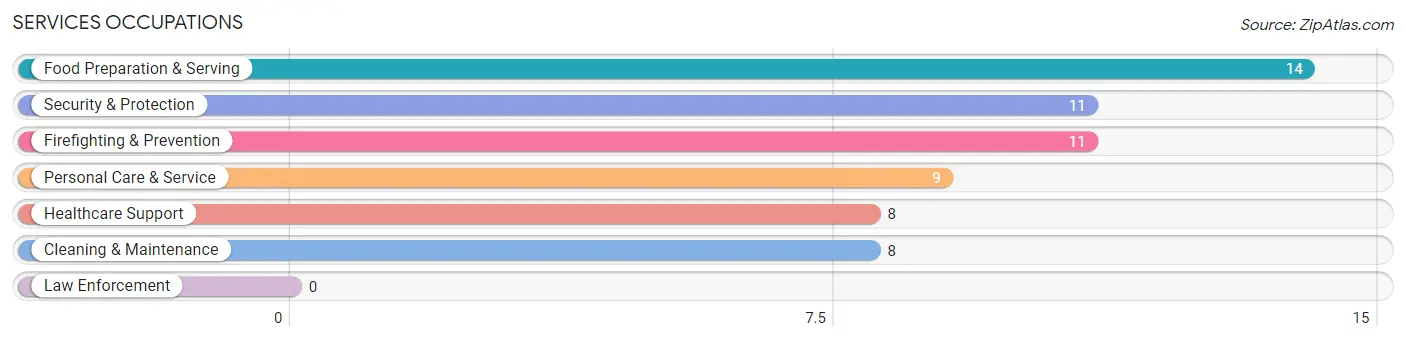
Services Occupations
The most common Services occupations in Crystal Lakes are Food Preparation & Serving (14 | 6.9%), Security & Protection (11 | 5.4%), Firefighting & Prevention (11 | 5.4%), Personal Care & Service (9 | 4.4%), and Healthcare Support (8 | 3.9%).
Services Occupations by Sex
Within the Services occupations in Crystal Lakes, the most male-oriented occupations are Security & Protection (100.0%), Firefighting & Prevention (100.0%), and Cleaning & Maintenance (75.0%), while the most female-oriented occupations are Healthcare Support (100.0%), Personal Care & Service (77.8%), and Food Preparation & Serving (57.1%).
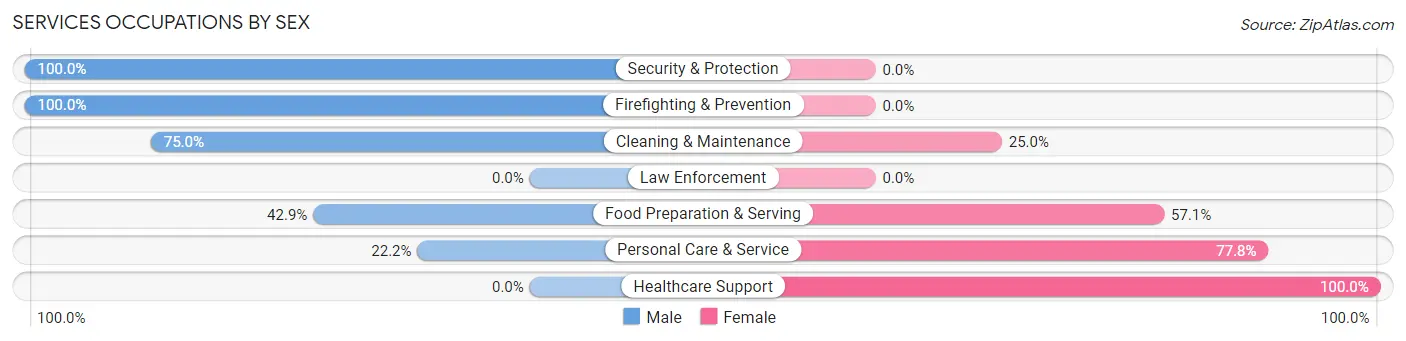
| Occupation | Male | Female |
| Healthcare Support | 0 (0.0%) | 8 (100.0%) |
| Security & Protection | 11 (100.0%) | 0 (0.0%) |
| Firefighting & Prevention | 11 (100.0%) | 0 (0.0%) |
| Law Enforcement | 0 (0.0%) | 0 (0.0%) |
| Food Preparation & Serving | 6 (42.9%) | 8 (57.1%) |
| Cleaning & Maintenance | 6 (75.0%) | 2 (25.0%) |
| Personal Care & Service | 2 (22.2%) | 7 (77.8%) |
| Total (Category) | 25 (50.0%) | 25 (50.0%) |
| Total (Overall) | 105 (51.5%) | 99 (48.5%) |
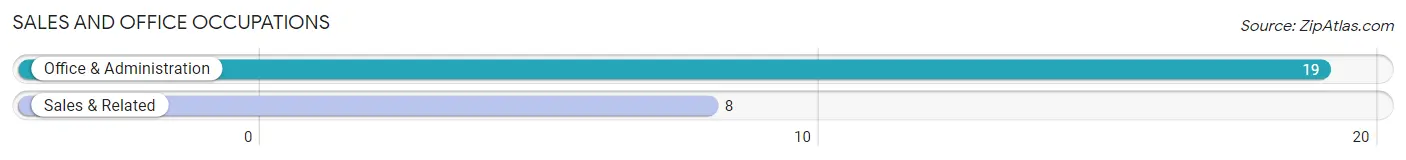
Sales and Office Occupations
The most common Sales and Office occupations in Crystal Lakes are Office & Administration (19 | 9.3%), and Sales & Related (8 | 3.9%).
Sales and Office Occupations by Sex
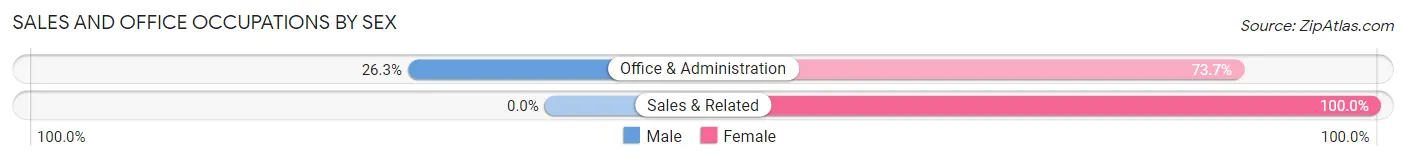
| Occupation | Male | Female |
| Sales & Related | 0 (0.0%) | 8 (100.0%) |
| Office & Administration | 5 (26.3%) | 14 (73.7%) |
| Total (Category) | 5 (18.5%) | 22 (81.5%) |
| Total (Overall) | 105 (51.5%) | 99 (48.5%) |
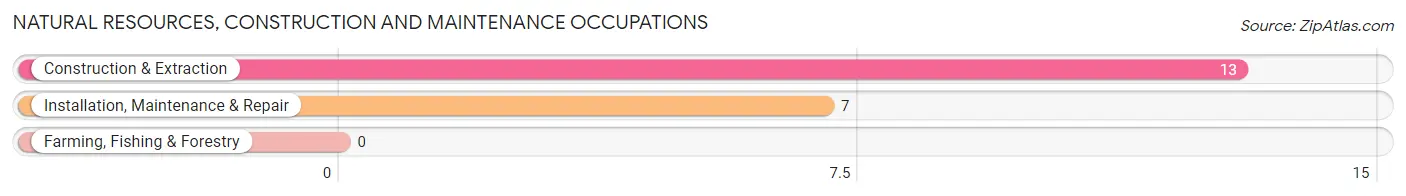
Natural Resources, Construction and Maintenance Occupations
The most common Natural Resources, Construction and Maintenance occupations in Crystal Lakes are Construction & Extraction (13 | 6.4%), and Installation, Maintenance & Repair (7 | 3.4%).
Natural Resources, Construction and Maintenance Occupations by Sex
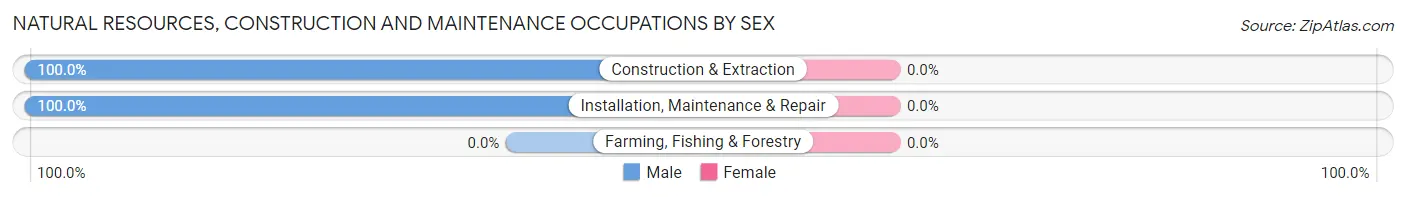
| Occupation | Male | Female |
| Farming, Fishing & Forestry | 0 (0.0%) | 0 (0.0%) |
| Construction & Extraction | 13 (100.0%) | 0 (0.0%) |
| Installation, Maintenance & Repair | 7 (100.0%) | 0 (0.0%) |
| Total (Category) | 20 (100.0%) | 0 (0.0%) |
| Total (Overall) | 105 (51.5%) | 99 (48.5%) |
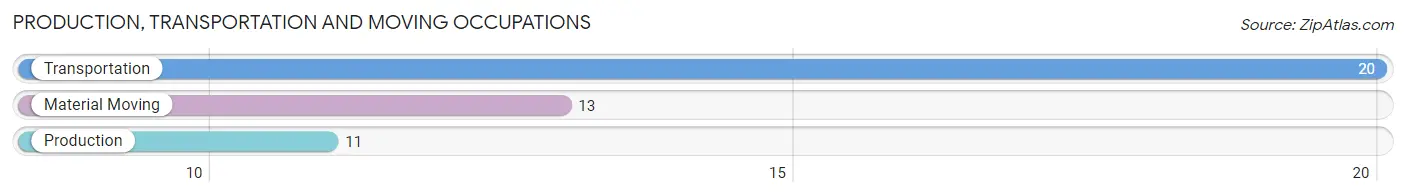
Production, Transportation and Moving Occupations
The most common Production, Transportation and Moving occupations in Crystal Lakes are Transportation (20 | 9.8%), Material Moving (13 | 6.4%), and Production (11 | 5.4%).
Production, Transportation and Moving Occupations by Sex
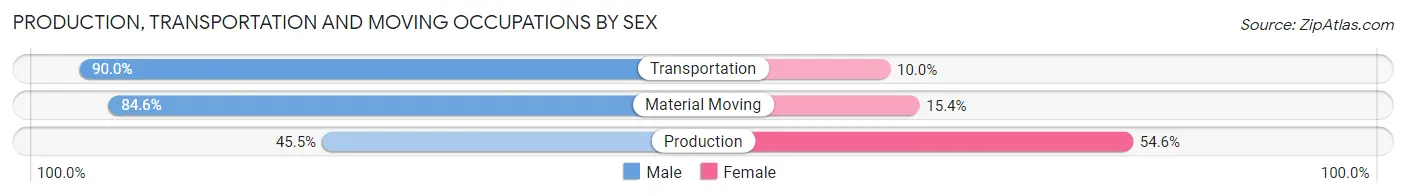
| Occupation | Male | Female |
| Production | 5 (45.5%) | 6 (54.5%) |
| Transportation | 18 (90.0%) | 2 (10.0%) |
| Material Moving | 11 (84.6%) | 2 (15.4%) |
| Total (Category) | 34 (77.3%) | 10 (22.7%) |
| Total (Overall) | 105 (51.5%) | 99 (48.5%) |
Employment Industries by Sex in Crystal Lakes
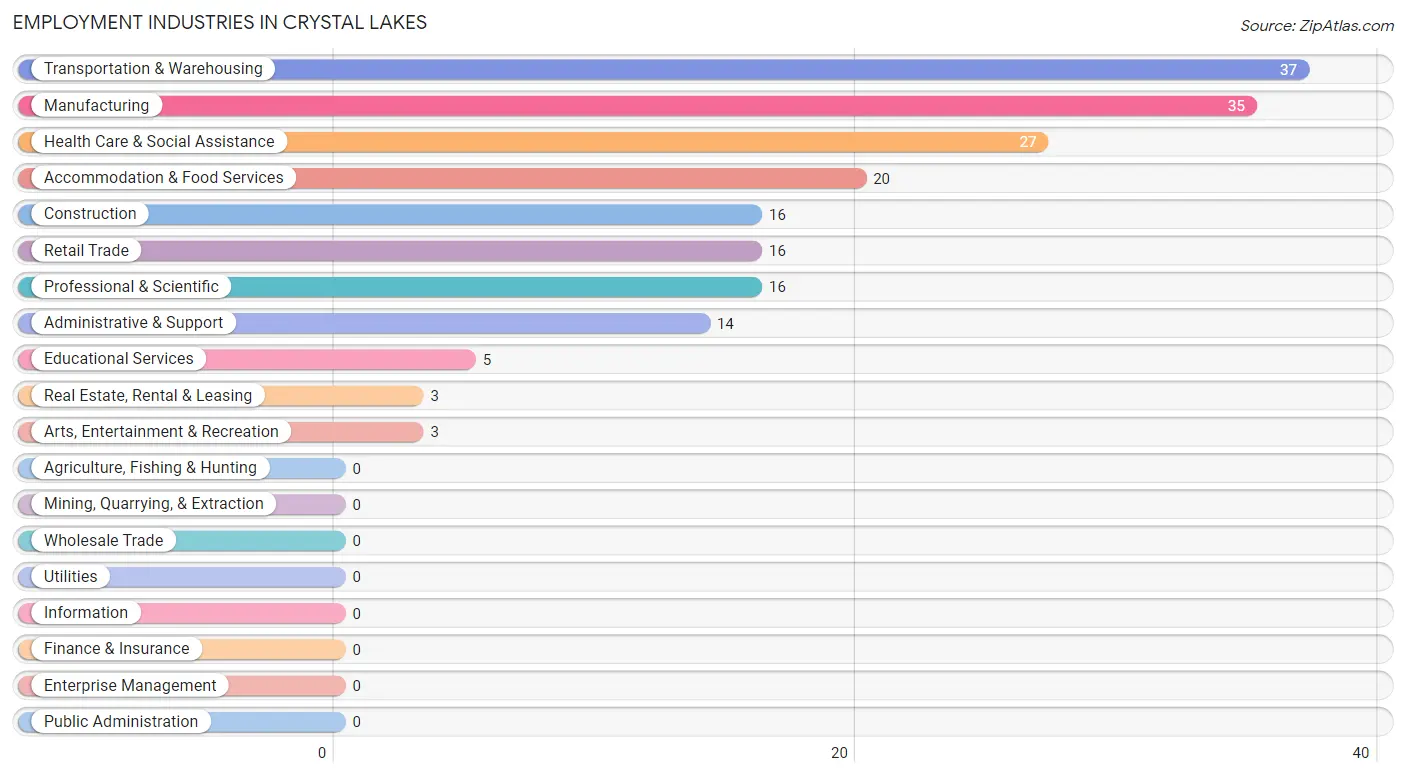
Employment Industries in Crystal Lakes
The major employment industries in Crystal Lakes include Transportation & Warehousing (37 | 18.1%), Manufacturing (35 | 17.2%), Health Care & Social Assistance (27 | 13.2%), Accommodation & Food Services (20 | 9.8%), and Construction (16 | 7.8%).
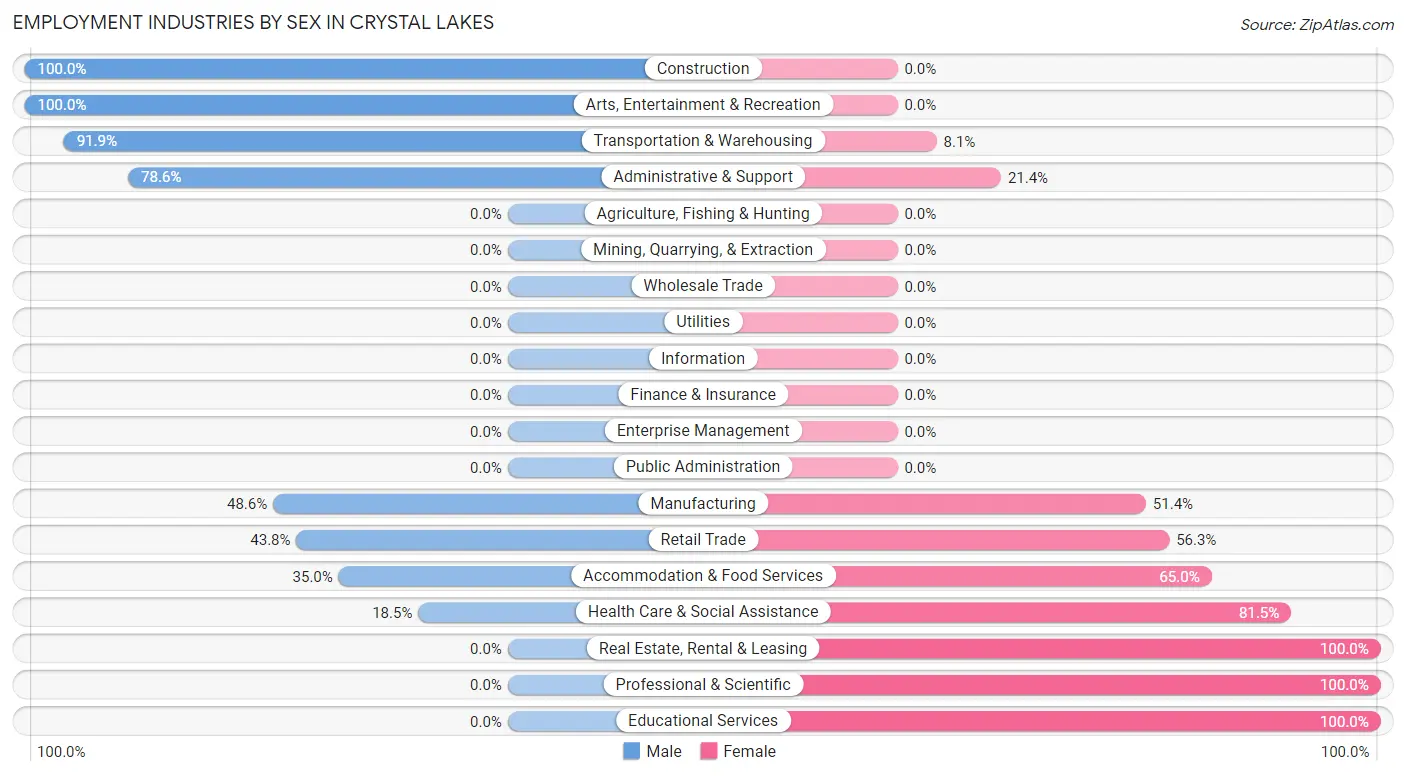
Employment Industries by Sex in Crystal Lakes
The Crystal Lakes industries that see more men than women are Construction (100.0%), Arts, Entertainment & Recreation (100.0%), and Transportation & Warehousing (91.9%), whereas the industries that tend to have a higher number of women are Real Estate, Rental & Leasing (100.0%), Professional & Scientific (100.0%), and Educational Services (100.0%).
| Industry | Male | Female |
| Agriculture, Fishing & Hunting | 0 (0.0%) | 0 (0.0%) |
| Mining, Quarrying, & Extraction | 0 (0.0%) | 0 (0.0%) |
| Construction | 16 (100.0%) | 0 (0.0%) |
| Manufacturing | 17 (48.6%) | 18 (51.4%) |
| Wholesale Trade | 0 (0.0%) | 0 (0.0%) |
| Retail Trade | 7 (43.8%) | 9 (56.2%) |
| Transportation & Warehousing | 34 (91.9%) | 3 (8.1%) |
| Utilities | 0 (0.0%) | 0 (0.0%) |
| Information | 0 (0.0%) | 0 (0.0%) |
| Finance & Insurance | 0 (0.0%) | 0 (0.0%) |
| Real Estate, Rental & Leasing | 0 (0.0%) | 3 (100.0%) |
| Professional & Scientific | 0 (0.0%) | 16 (100.0%) |
| Enterprise Management | 0 (0.0%) | 0 (0.0%) |
| Administrative & Support | 11 (78.6%) | 3 (21.4%) |
| Educational Services | 0 (0.0%) | 5 (100.0%) |
| Health Care & Social Assistance | 5 (18.5%) | 22 (81.5%) |
| Arts, Entertainment & Recreation | 3 (100.0%) | 0 (0.0%) |
| Accommodation & Food Services | 7 (35.0%) | 13 (65.0%) |
| Public Administration | 0 (0.0%) | 0 (0.0%) |
| Total | 105 (51.5%) | 99 (48.5%) |
Education in Crystal Lakes
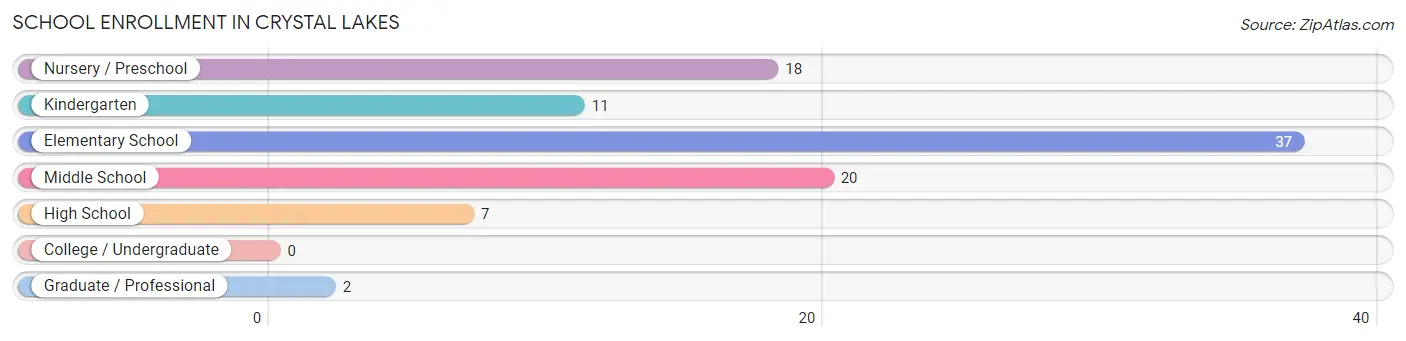
School Enrollment in Crystal Lakes
The most common levels of schooling among the 95 students in Crystal Lakes are elementary school (37 | 39.0%), middle school (20 | 21.0%), and nursery / preschool (18 | 19.0%).
| School Level | # Students | % Students |
| Nursery / Preschool | 18 | 19.0% |
| Kindergarten | 11 | 11.6% |
| Elementary School | 37 | 39.0% |
| Middle School | 20 | 21.0% |
| High School | 7 | 7.4% |
| College / Undergraduate | 0 | 0.0% |
| Graduate / Professional | 2 | 2.1% |
| Total | 95 | 100.0% |
School Enrollment by Age by Funding Source in Crystal Lakes
Out of a total of 95 students who are enrolled in schools in Crystal Lakes, 21 (22.1%) attend a private institution, while the remaining 74 (77.9%) are enrolled in public schools. The age group of 10 to 14 year olds has the highest likelihood of being enrolled in private schools, with 14 (40.0% in the age bracket) enrolled. Conversely, the age group of 3 to 4 year olds has the lowest likelihood of being enrolled in a private school, with 11 (100.0% in the age bracket) attending a public institution.
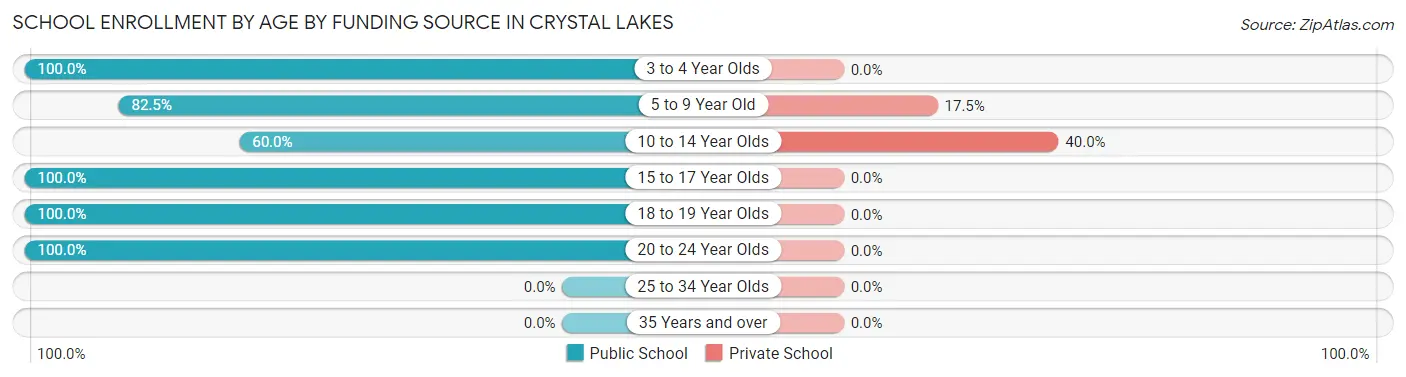
| Age Bracket | Public School | Private School |
| 3 to 4 Year Olds | 11 (100.0%) | 0 (0.0%) |
| 5 to 9 Year Old | 33 (82.5%) | 7 (17.5%) |
| 10 to 14 Year Olds | 21 (60.0%) | 14 (40.0%) |
| 15 to 17 Year Olds | 4 (100.0%) | 0 (0.0%) |
| 18 to 19 Year Olds | 3 (100.0%) | 0 (0.0%) |
| 20 to 24 Year Olds | 2 (100.0%) | 0 (0.0%) |
| 25 to 34 Year Olds | 0 (0.0%) | 0 (0.0%) |
| 35 Years and over | 0 (0.0%) | 0 (0.0%) |
| Total | 74 (77.9%) | 21 (22.1%) |
Educational Attainment by Field of Study in Crystal Lakes
Business (17 | 48.6%), science & technology (5 | 14.3%), education (5 | 14.3%), psychology (2 | 5.7%), and visual & performing arts (2 | 5.7%) are the most common fields of study among 35 individuals in Crystal Lakes who have obtained a bachelor's degree or higher.
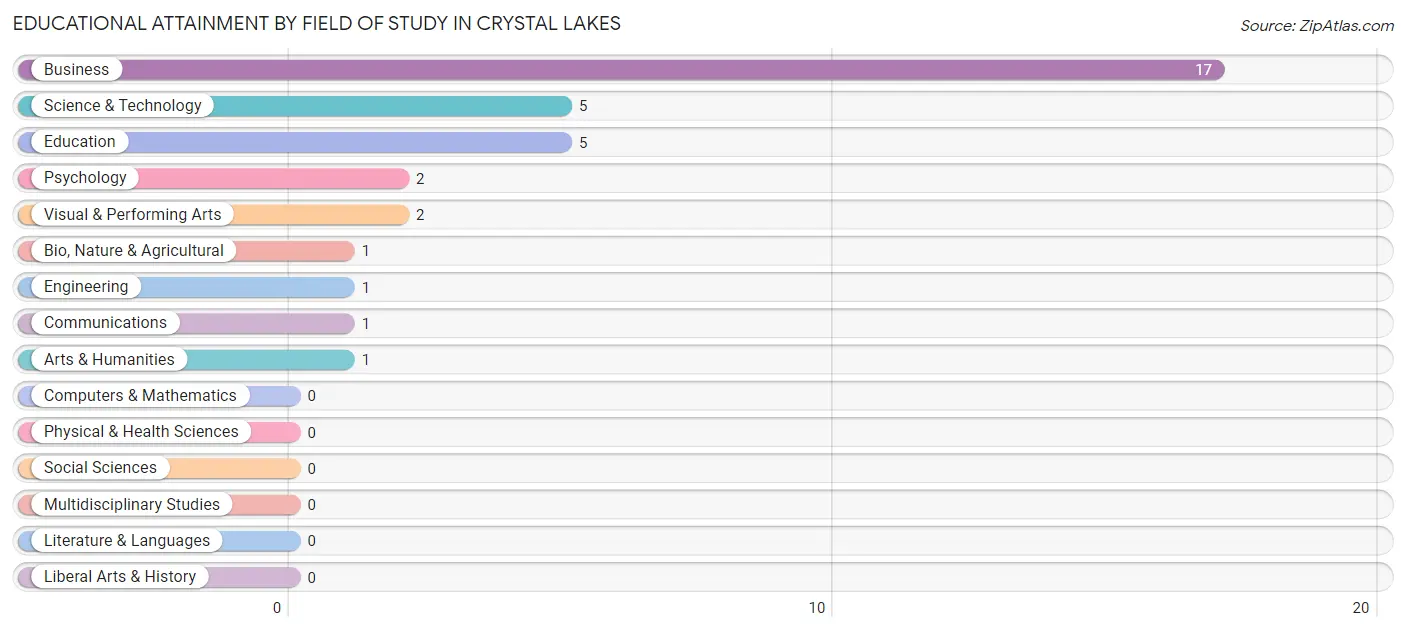
| Field of Study | # Graduates | % Graduates |
| Computers & Mathematics | 0 | 0.0% |
| Bio, Nature & Agricultural | 1 | 2.9% |
| Physical & Health Sciences | 0 | 0.0% |
| Psychology | 2 | 5.7% |
| Social Sciences | 0 | 0.0% |
| Engineering | 1 | 2.9% |
| Multidisciplinary Studies | 0 | 0.0% |
| Science & Technology | 5 | 14.3% |
| Business | 17 | 48.6% |
| Education | 5 | 14.3% |
| Literature & Languages | 0 | 0.0% |
| Liberal Arts & History | 0 | 0.0% |
| Visual & Performing Arts | 2 | 5.7% |
| Communications | 1 | 2.9% |
| Arts & Humanities | 1 | 2.9% |
| Total | 35 | 100.0% |
Transportation & Commute in Crystal Lakes
Vehicle Availability by Sex in Crystal Lakes
The most prevalent vehicle ownership categories in Crystal Lakes are males with 3 vehicles (48, accounting for 46.2%) and females with 3 vehicles (35, making up 49.5%).
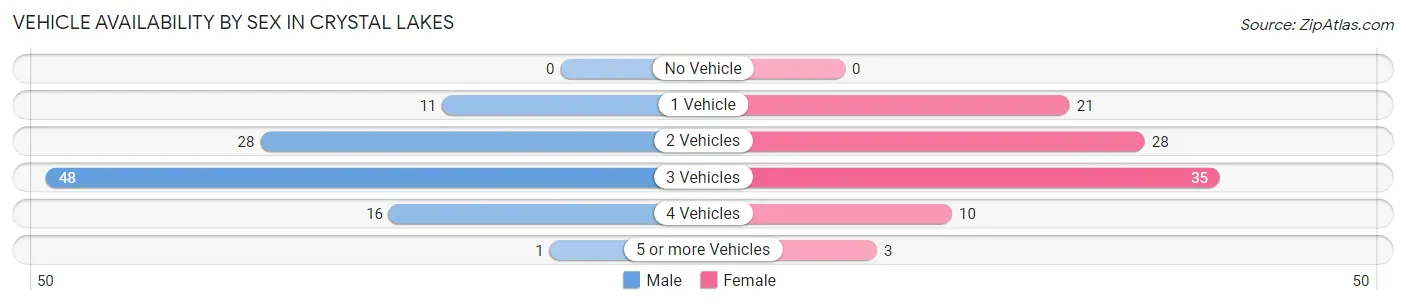
| Vehicles Available | Male | Female |
| No Vehicle | 0 (0.0%) | 0 (0.0%) |
| 1 Vehicle | 11 (10.6%) | 21 (21.6%) |
| 2 Vehicles | 28 (26.9%) | 28 (28.9%) |
| 3 Vehicles | 48 (46.2%) | 35 (36.1%) |
| 4 Vehicles | 16 (15.4%) | 10 (10.3%) |
| 5 or more Vehicles | 1 (1.0%) | 3 (3.1%) |
| Total | 104 (100.0%) | 97 (100.0%) |
Commute Time in Crystal Lakes
The most frequently occuring commute durations in Crystal Lakes are 30 to 34 minutes (39 commuters, 19.6%), 45 to 59 minutes (34 commuters, 17.1%), and 15 to 19 minutes (26 commuters, 13.1%).
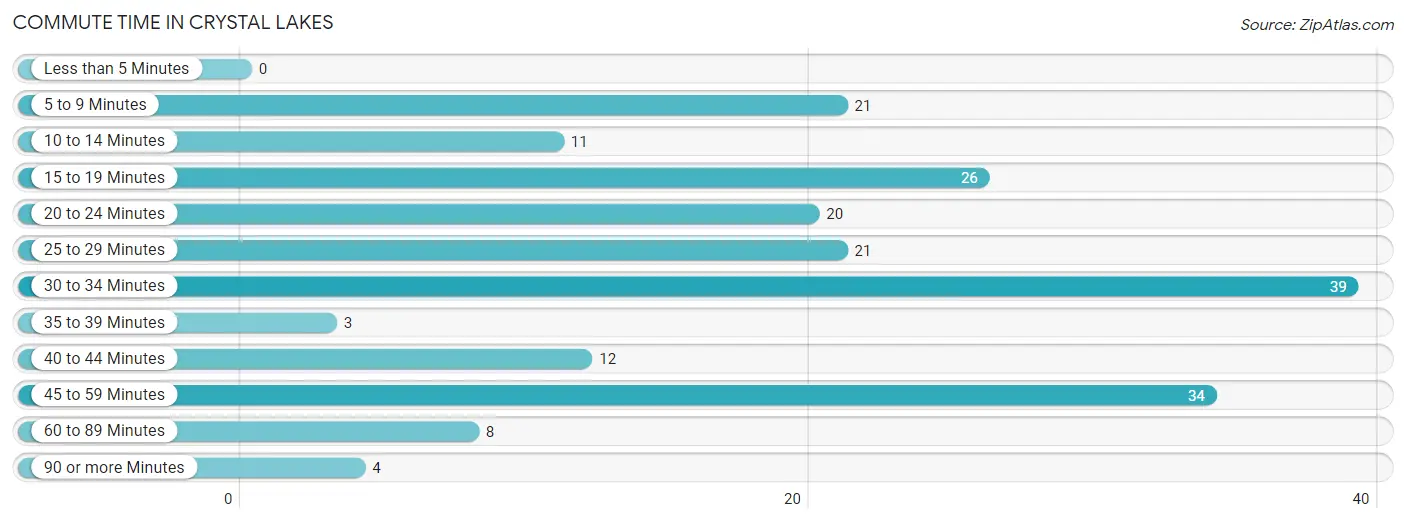
| Commute Time | # Commuters | % Commuters |
| Less than 5 Minutes | 0 | 0.0% |
| 5 to 9 Minutes | 21 | 10.5% |
| 10 to 14 Minutes | 11 | 5.5% |
| 15 to 19 Minutes | 26 | 13.1% |
| 20 to 24 Minutes | 20 | 10.1% |
| 25 to 29 Minutes | 21 | 10.5% |
| 30 to 34 Minutes | 39 | 19.6% |
| 35 to 39 Minutes | 3 | 1.5% |
| 40 to 44 Minutes | 12 | 6.0% |
| 45 to 59 Minutes | 34 | 17.1% |
| 60 to 89 Minutes | 8 | 4.0% |
| 90 or more Minutes | 4 | 2.0% |
Commute Time by Sex in Crystal Lakes
The most common commute times in Crystal Lakes are 45 to 59 minutes (31 commuters, 29.8%) for males and 15 to 19 minutes (24 commuters, 25.3%) for females.
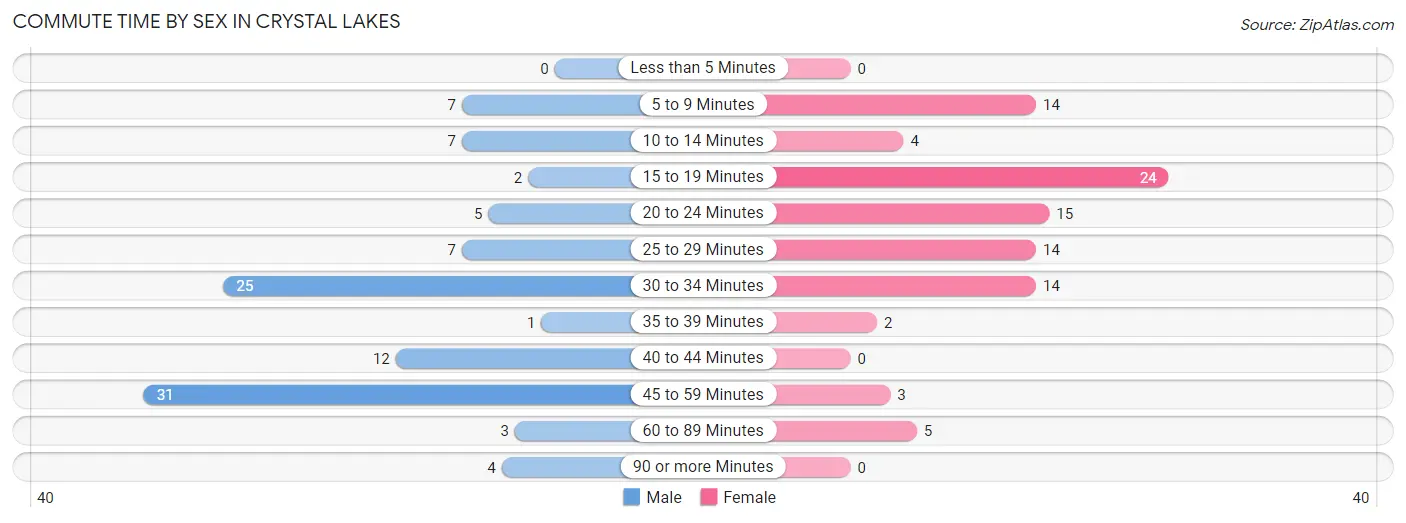
| Commute Time | Male | Female |
| Less than 5 Minutes | 0 (0.0%) | 0 (0.0%) |
| 5 to 9 Minutes | 7 (6.7%) | 14 (14.7%) |
| 10 to 14 Minutes | 7 (6.7%) | 4 (4.2%) |
| 15 to 19 Minutes | 2 (1.9%) | 24 (25.3%) |
| 20 to 24 Minutes | 5 (4.8%) | 15 (15.8%) |
| 25 to 29 Minutes | 7 (6.7%) | 14 (14.7%) |
| 30 to 34 Minutes | 25 (24.0%) | 14 (14.7%) |
| 35 to 39 Minutes | 1 (1.0%) | 2 (2.1%) |
| 40 to 44 Minutes | 12 (11.5%) | 0 (0.0%) |
| 45 to 59 Minutes | 31 (29.8%) | 3 (3.2%) |
| 60 to 89 Minutes | 3 (2.9%) | 5 (5.3%) |
| 90 or more Minutes | 4 (3.8%) | 0 (0.0%) |
Time of Departure to Work by Sex in Crystal Lakes
The most frequent times of departure to work in Crystal Lakes are 7:00 AM to 7:29 AM (33, 31.7%) for males and 7:30 AM to 7:59 AM (23, 24.2%) for females.
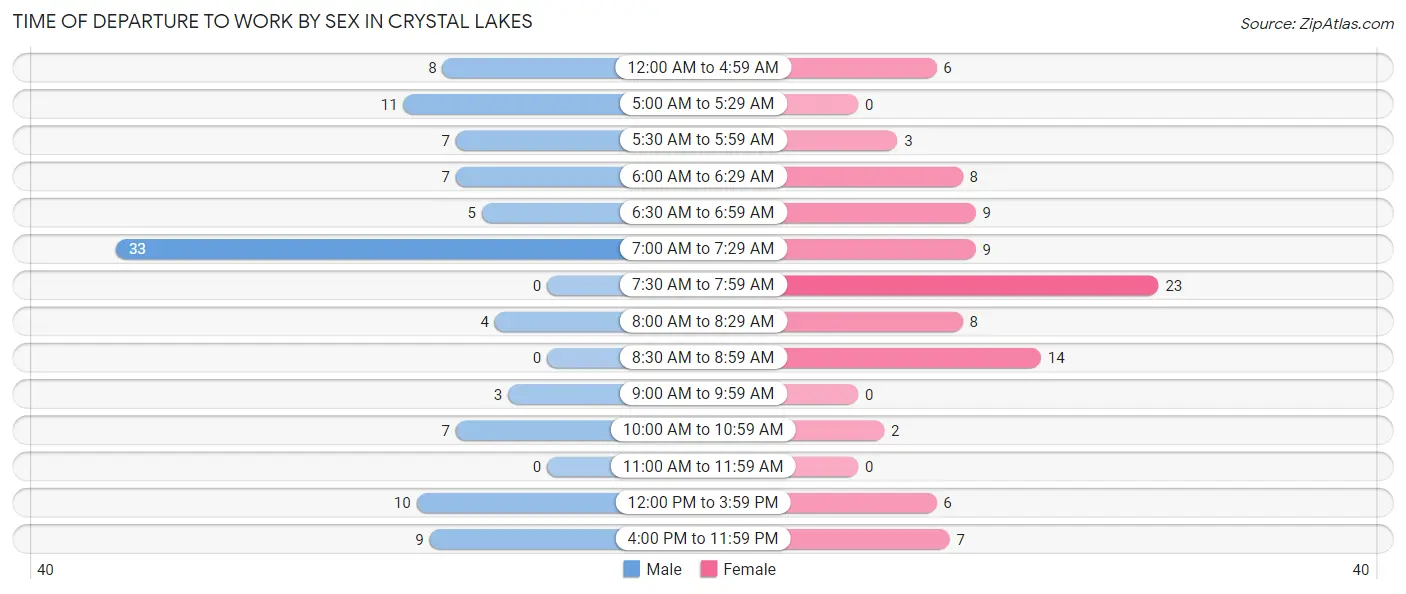
| Time of Departure | Male | Female |
| 12:00 AM to 4:59 AM | 8 (7.7%) | 6 (6.3%) |
| 5:00 AM to 5:29 AM | 11 (10.6%) | 0 (0.0%) |
| 5:30 AM to 5:59 AM | 7 (6.7%) | 3 (3.2%) |
| 6:00 AM to 6:29 AM | 7 (6.7%) | 8 (8.4%) |
| 6:30 AM to 6:59 AM | 5 (4.8%) | 9 (9.5%) |
| 7:00 AM to 7:29 AM | 33 (31.7%) | 9 (9.5%) |
| 7:30 AM to 7:59 AM | 0 (0.0%) | 23 (24.2%) |
| 8:00 AM to 8:29 AM | 4 (3.8%) | 8 (8.4%) |
| 8:30 AM to 8:59 AM | 0 (0.0%) | 14 (14.7%) |
| 9:00 AM to 9:59 AM | 3 (2.9%) | 0 (0.0%) |
| 10:00 AM to 10:59 AM | 7 (6.7%) | 2 (2.1%) |
| 11:00 AM to 11:59 AM | 0 (0.0%) | 0 (0.0%) |
| 12:00 PM to 3:59 PM | 10 (9.6%) | 6 (6.3%) |
| 4:00 PM to 11:59 PM | 9 (8.6%) | 7 (7.4%) |
| Total | 104 (100.0%) | 95 (100.0%) |
Housing Occupancy in Crystal Lakes
Occupancy by Ownership in Crystal Lakes
Of the total 157 dwellings in Crystal Lakes, owner-occupied units account for 143 (91.1%), while renter-occupied units make up 14 (8.9%).
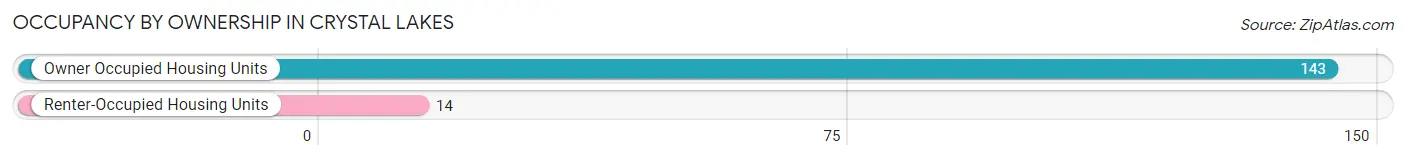
| Occupancy | # Housing Units | % Housing Units |
| Owner Occupied Housing Units | 143 | 91.1% |
| Renter-Occupied Housing Units | 14 | 8.9% |
| Total Occupied Housing Units | 157 | 100.0% |
Occupancy by Household Size in Crystal Lakes
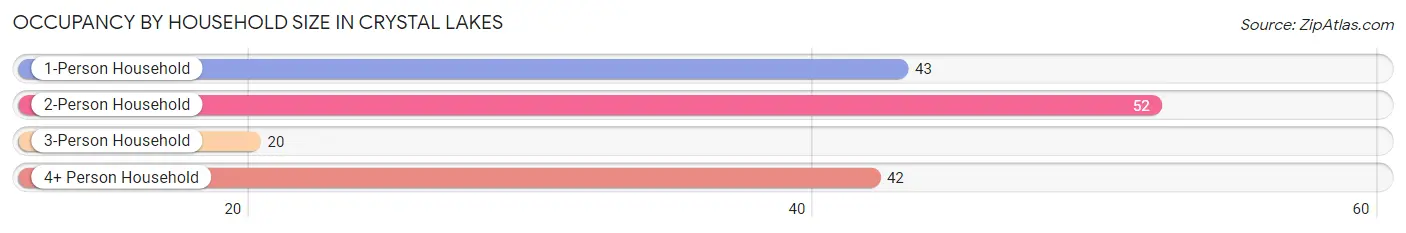
| Household Size | # Housing Units | % Housing Units |
| 1-Person Household | 43 | 27.4% |
| 2-Person Household | 52 | 33.1% |
| 3-Person Household | 20 | 12.7% |
| 4+ Person Household | 42 | 26.8% |
| Total Housing Units | 157 | 100.0% |
Occupancy by Ownership by Household Size in Crystal Lakes
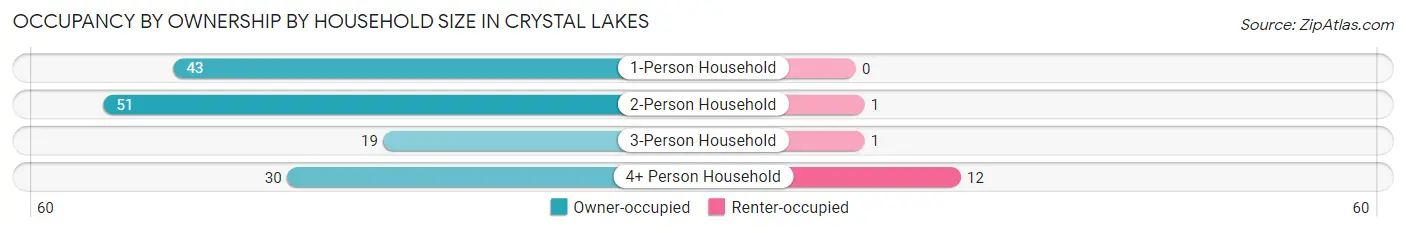
| Household Size | Owner-occupied | Renter-occupied |
| 1-Person Household | 43 (100.0%) | 0 (0.0%) |
| 2-Person Household | 51 (98.1%) | 1 (1.9%) |
| 3-Person Household | 19 (95.0%) | 1 (5.0%) |
| 4+ Person Household | 30 (71.4%) | 12 (28.6%) |
| Total Housing Units | 143 (91.1%) | 14 (8.9%) |
Occupancy by Educational Attainment in Crystal Lakes
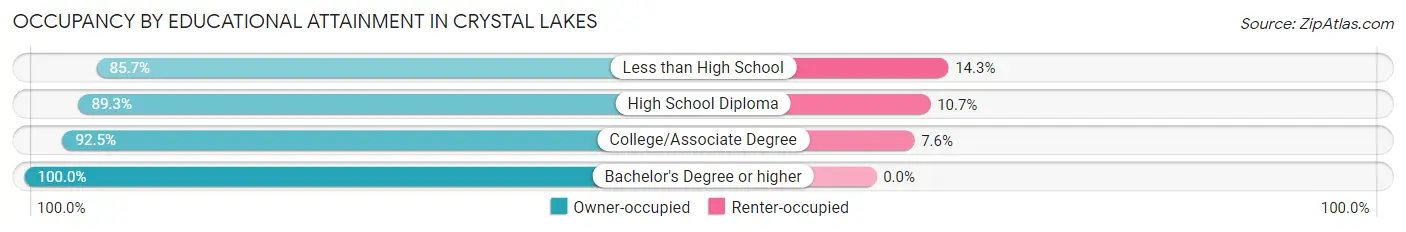
| Household Size | Owner-occupied | Renter-occupied |
| Less than High School | 6 (85.7%) | 1 (14.3%) |
| High School Diploma | 75 (89.3%) | 9 (10.7%) |
| College/Associate Degree | 49 (92.4%) | 4 (7.5%) |
| Bachelor's Degree or higher | 13 (100.0%) | 0 (0.0%) |
Occupancy by Age of Householder in Crystal Lakes
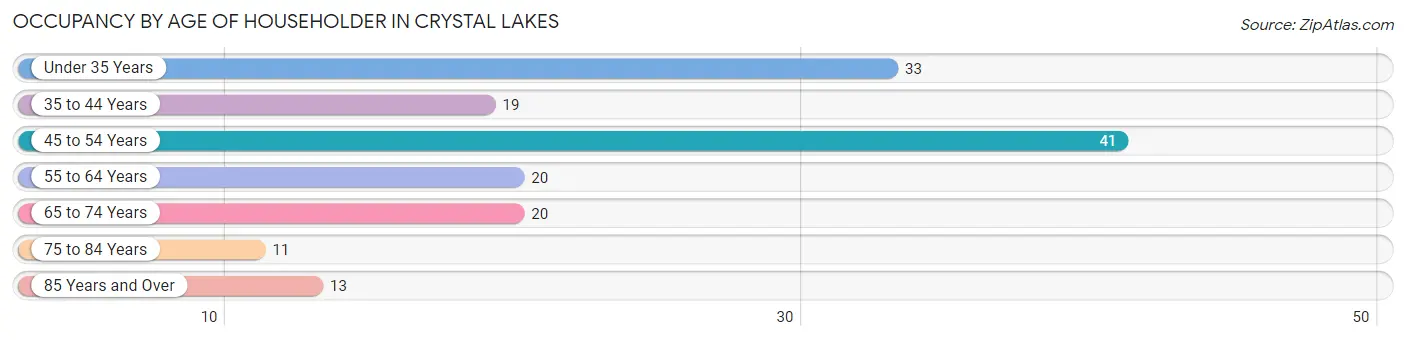
| Age Bracket | # Households | % Households |
| Under 35 Years | 33 | 21.0% |
| 35 to 44 Years | 19 | 12.1% |
| 45 to 54 Years | 41 | 26.1% |
| 55 to 64 Years | 20 | 12.7% |
| 65 to 74 Years | 20 | 12.7% |
| 75 to 84 Years | 11 | 7.0% |
| 85 Years and Over | 13 | 8.3% |
| Total | 157 | 100.0% |
Housing Finances in Crystal Lakes
Median Income by Occupancy in Crystal Lakes
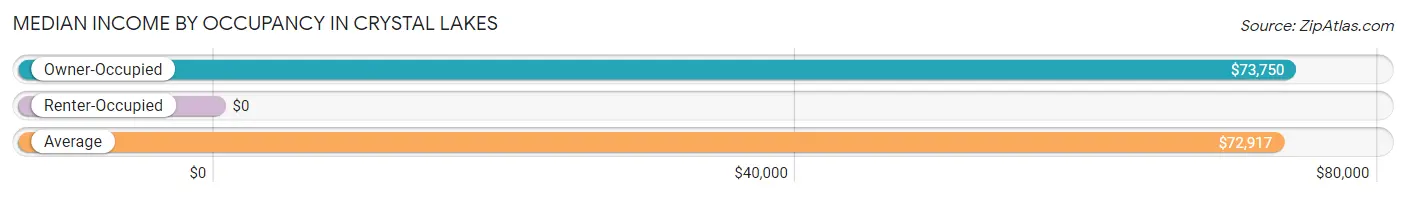
| Occupancy Type | # Households | Median Income |
| Owner-Occupied | 143 (91.1%) | $73,750 |
| Renter-Occupied | 14 (8.9%) | $0 |
| Average | 157 (100.0%) | $72,917 |
Occupancy by Householder Income Bracket in Crystal Lakes
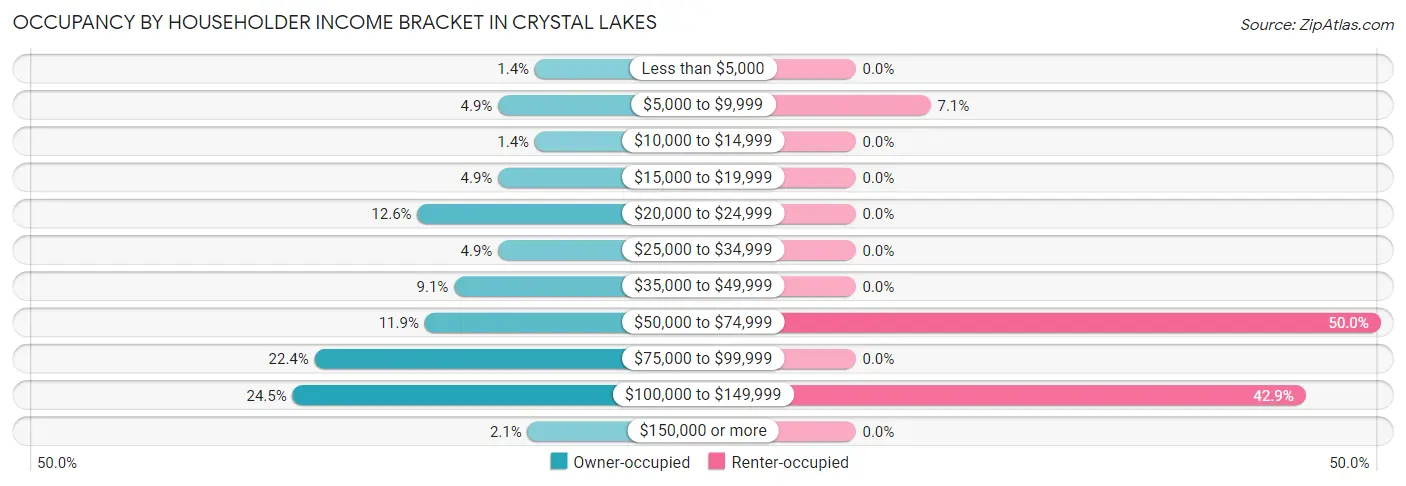
| Income Bracket | Owner-occupied | Renter-occupied |
| Less than $5,000 | 2 (1.4%) | 0 (0.0%) |
| $5,000 to $9,999 | 7 (4.9%) | 1 (7.1%) |
| $10,000 to $14,999 | 2 (1.4%) | 0 (0.0%) |
| $15,000 to $19,999 | 7 (4.9%) | 0 (0.0%) |
| $20,000 to $24,999 | 18 (12.6%) | 0 (0.0%) |
| $25,000 to $34,999 | 7 (4.9%) | 0 (0.0%) |
| $35,000 to $49,999 | 13 (9.1%) | 0 (0.0%) |
| $50,000 to $74,999 | 17 (11.9%) | 7 (50.0%) |
| $75,000 to $99,999 | 32 (22.4%) | 0 (0.0%) |
| $100,000 to $149,999 | 35 (24.5%) | 6 (42.9%) |
| $150,000 or more | 3 (2.1%) | 0 (0.0%) |
| Total | 143 (100.0%) | 14 (100.0%) |
Monthly Housing Cost Tiers in Crystal Lakes
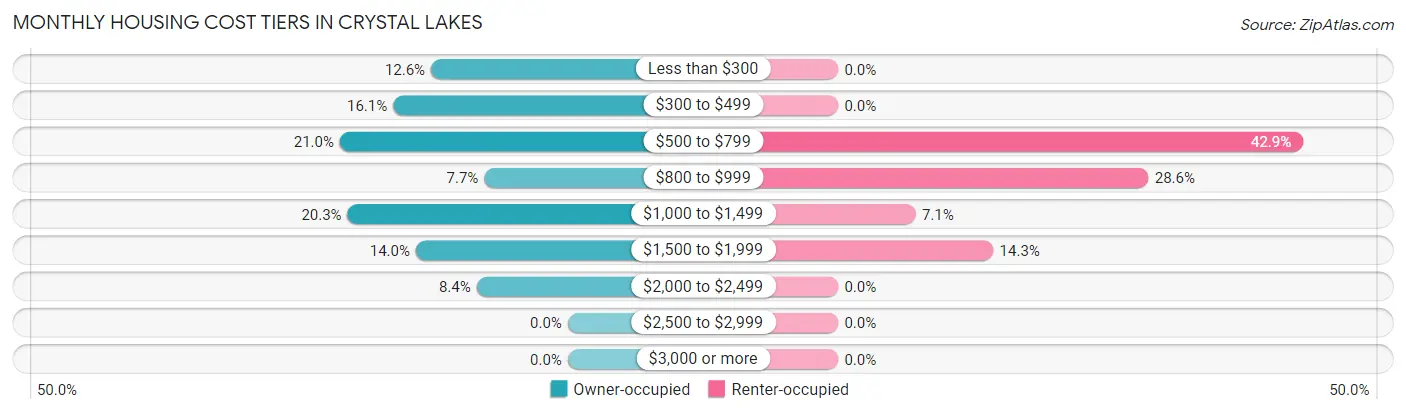
| Monthly Cost | Owner-occupied | Renter-occupied |
| Less than $300 | 18 (12.6%) | 0 (0.0%) |
| $300 to $499 | 23 (16.1%) | 0 (0.0%) |
| $500 to $799 | 30 (21.0%) | 6 (42.9%) |
| $800 to $999 | 11 (7.7%) | 4 (28.6%) |
| $1,000 to $1,499 | 29 (20.3%) | 1 (7.1%) |
| $1,500 to $1,999 | 20 (14.0%) | 2 (14.3%) |
| $2,000 to $2,499 | 12 (8.4%) | 0 (0.0%) |
| $2,500 to $2,999 | 0 (0.0%) | 0 (0.0%) |
| $3,000 or more | 0 (0.0%) | 0 (0.0%) |
| Total | 143 (100.0%) | 14 (100.0%) |
Physical Housing Characteristics in Crystal Lakes
Housing Structures in Crystal Lakes
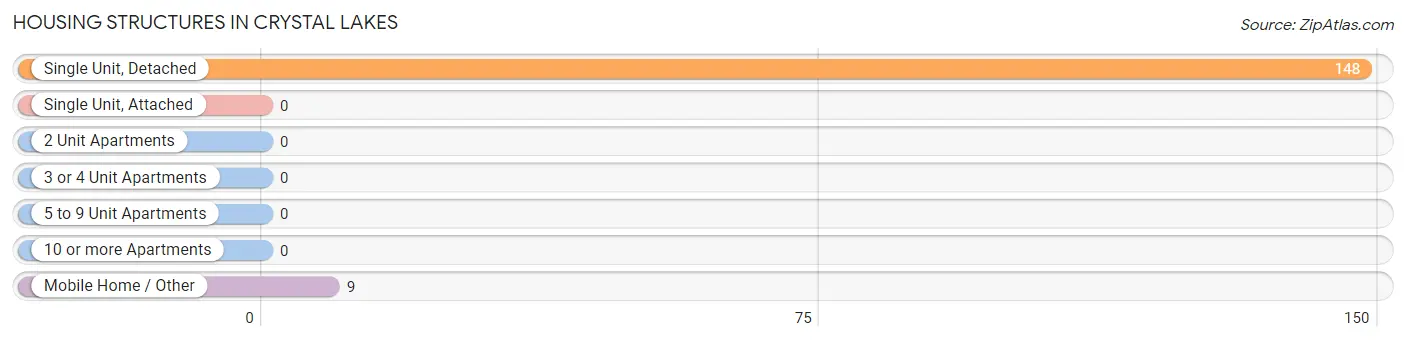
| Structure Type | # Housing Units | % Housing Units |
| Single Unit, Detached | 148 | 94.3% |
| Single Unit, Attached | 0 | 0.0% |
| 2 Unit Apartments | 0 | 0.0% |
| 3 or 4 Unit Apartments | 0 | 0.0% |
| 5 to 9 Unit Apartments | 0 | 0.0% |
| 10 or more Apartments | 0 | 0.0% |
| Mobile Home / Other | 9 | 5.7% |
| Total | 157 | 100.0% |
Housing Structures by Occupancy in Crystal Lakes
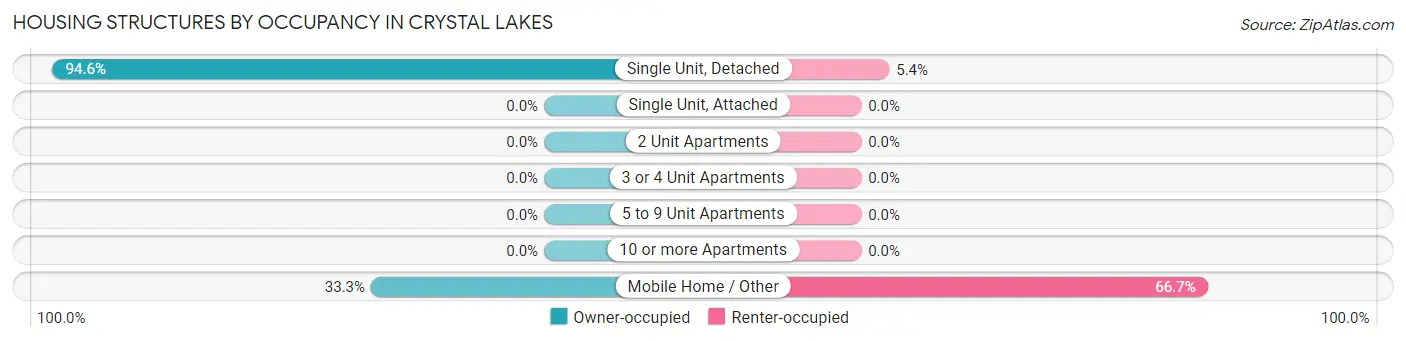
| Structure Type | Owner-occupied | Renter-occupied |
| Single Unit, Detached | 140 (94.6%) | 8 (5.4%) |
| Single Unit, Attached | 0 (0.0%) | 0 (0.0%) |
| 2 Unit Apartments | 0 (0.0%) | 0 (0.0%) |
| 3 or 4 Unit Apartments | 0 (0.0%) | 0 (0.0%) |
| 5 to 9 Unit Apartments | 0 (0.0%) | 0 (0.0%) |
| 10 or more Apartments | 0 (0.0%) | 0 (0.0%) |
| Mobile Home / Other | 3 (33.3%) | 6 (66.7%) |
| Total | 143 (91.1%) | 14 (8.9%) |
Housing Structures by Number of Rooms in Crystal Lakes
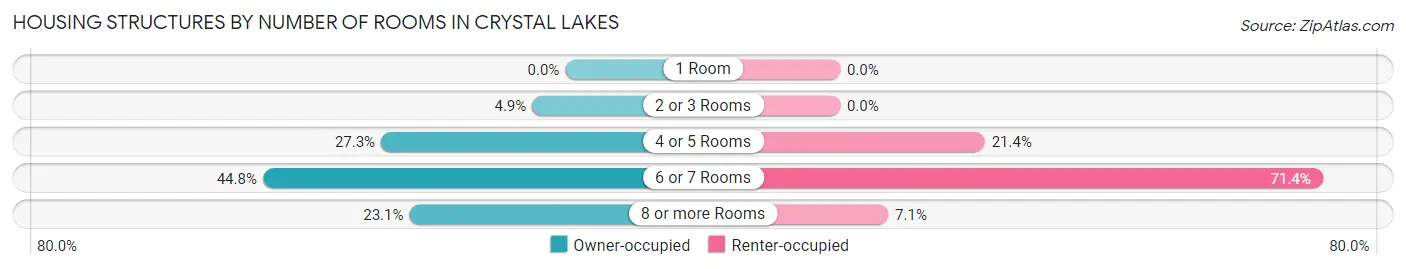
| Number of Rooms | Owner-occupied | Renter-occupied |
| 1 Room | 0 (0.0%) | 0 (0.0%) |
| 2 or 3 Rooms | 7 (4.9%) | 0 (0.0%) |
| 4 or 5 Rooms | 39 (27.3%) | 3 (21.4%) |
| 6 or 7 Rooms | 64 (44.8%) | 10 (71.4%) |
| 8 or more Rooms | 33 (23.1%) | 1 (7.1%) |
| Total | 143 (100.0%) | 14 (100.0%) |
Housing Structure by Heating Type in Crystal Lakes
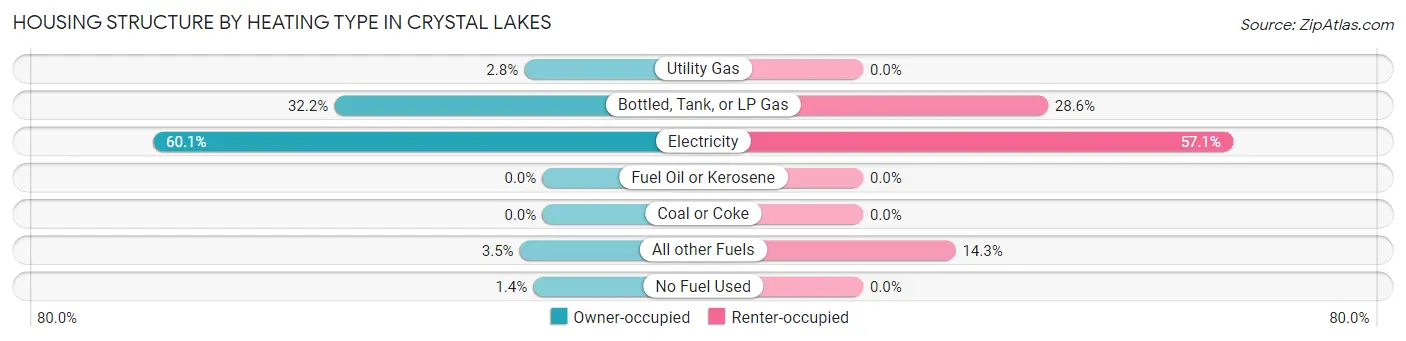
| Heating Type | Owner-occupied | Renter-occupied |
| Utility Gas | 4 (2.8%) | 0 (0.0%) |
| Bottled, Tank, or LP Gas | 46 (32.2%) | 4 (28.6%) |
| Electricity | 86 (60.1%) | 8 (57.1%) |
| Fuel Oil or Kerosene | 0 (0.0%) | 0 (0.0%) |
| Coal or Coke | 0 (0.0%) | 0 (0.0%) |
| All other Fuels | 5 (3.5%) | 2 (14.3%) |
| No Fuel Used | 2 (1.4%) | 0 (0.0%) |
| Total | 143 (100.0%) | 14 (100.0%) |
Household Vehicle Usage in Crystal Lakes
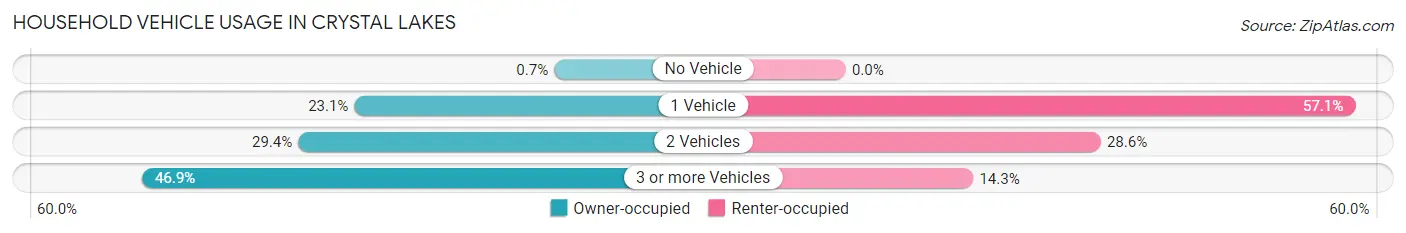
| Vehicles per Household | Owner-occupied | Renter-occupied |
| No Vehicle | 1 (0.7%) | 0 (0.0%) |
| 1 Vehicle | 33 (23.1%) | 8 (57.1%) |
| 2 Vehicles | 42 (29.4%) | 4 (28.6%) |
| 3 or more Vehicles | 67 (46.9%) | 2 (14.3%) |
| Total | 143 (100.0%) | 14 (100.0%) |
Real Estate & Mortgages in Crystal Lakes
Real Estate and Mortgage Overview in Crystal Lakes
| Characteristic | Without Mortgage | With Mortgage |
| Housing Units | 73 | 70 |
| Median Property Value | $137,500 | $150,000 |
| Median Household Income | $44,063 | $3 |
| Monthly Housing Costs | $463 | $0 |
| Real Estate Taxes | $1,467 | $0 |
Property Value by Mortgage Status in Crystal Lakes
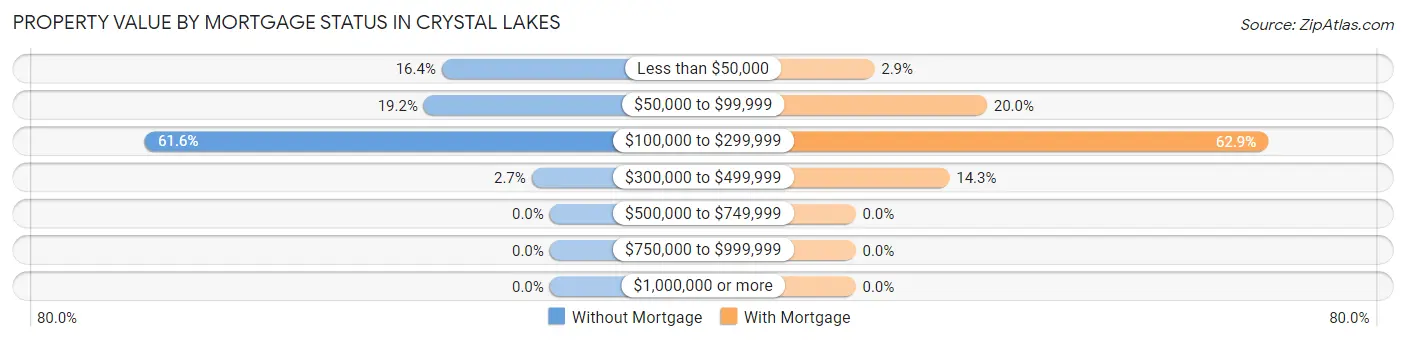
| Property Value | Without Mortgage | With Mortgage |
| Less than $50,000 | 12 (16.4%) | 2 (2.9%) |
| $50,000 to $99,999 | 14 (19.2%) | 14 (20.0%) |
| $100,000 to $299,999 | 45 (61.6%) | 44 (62.9%) |
| $300,000 to $499,999 | 2 (2.7%) | 10 (14.3%) |
| $500,000 to $749,999 | 0 (0.0%) | 0 (0.0%) |
| $750,000 to $999,999 | 0 (0.0%) | 0 (0.0%) |
| $1,000,000 or more | 0 (0.0%) | 0 (0.0%) |
| Total | 73 (100.0%) | 70 (100.0%) |
Household Income by Mortgage Status in Crystal Lakes
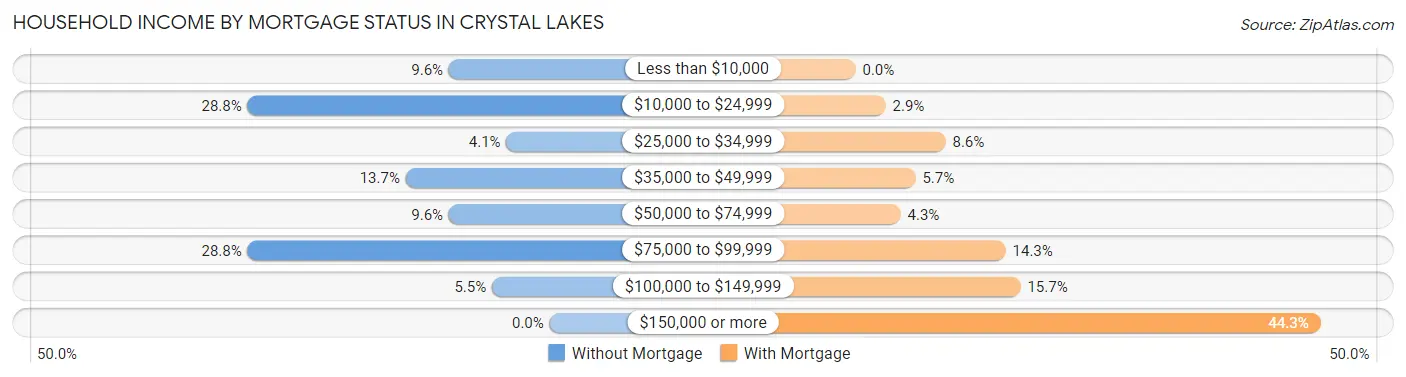
| Household Income | Without Mortgage | With Mortgage |
| Less than $10,000 | 7 (9.6%) | 0 (0.0%) |
| $10,000 to $24,999 | 21 (28.8%) | 2 (2.9%) |
| $25,000 to $34,999 | 3 (4.1%) | 6 (8.6%) |
| $35,000 to $49,999 | 10 (13.7%) | 4 (5.7%) |
| $50,000 to $74,999 | 7 (9.6%) | 3 (4.3%) |
| $75,000 to $99,999 | 21 (28.8%) | 10 (14.3%) |
| $100,000 to $149,999 | 4 (5.5%) | 11 (15.7%) |
| $150,000 or more | 0 (0.0%) | 31 (44.3%) |
| Total | 73 (100.0%) | 70 (100.0%) |
Property Value to Household Income Ratio in Crystal Lakes
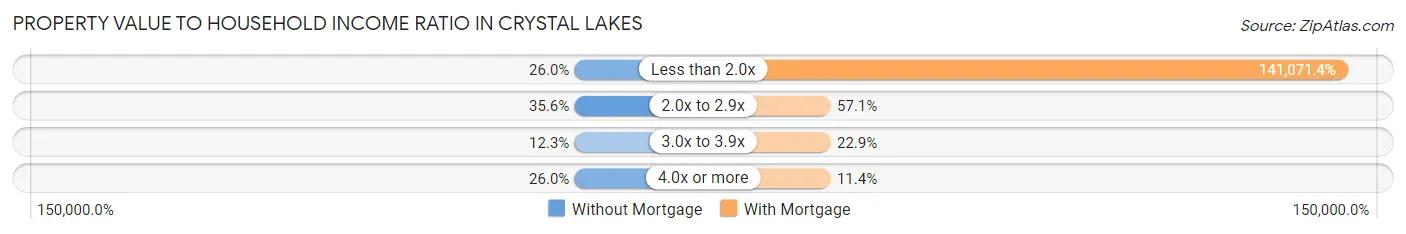
| Value-to-Income Ratio | Without Mortgage | With Mortgage |
| Less than 2.0x | 19 (26.0%) | 98,750 (141,071.4%) |
| 2.0x to 2.9x | 26 (35.6%) | 40 (57.1%) |
| 3.0x to 3.9x | 9 (12.3%) | 16 (22.9%) |
| 4.0x or more | 19 (26.0%) | 8 (11.4%) |
| Total | 73 (100.0%) | 70 (100.0%) |
Real Estate Taxes by Mortgage Status in Crystal Lakes
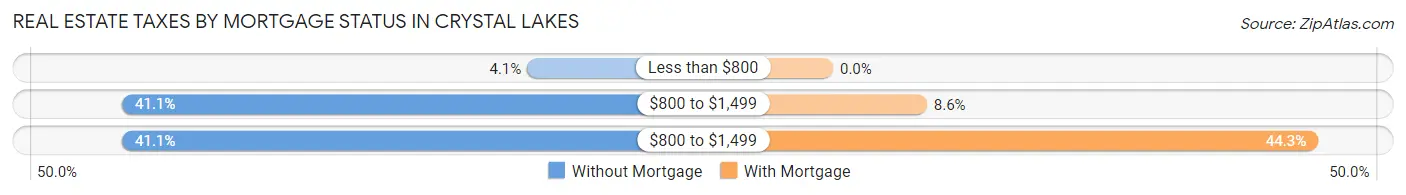
| Property Taxes | Without Mortgage | With Mortgage |
| Less than $800 | 3 (4.1%) | 0 (0.0%) |
| $800 to $1,499 | 30 (41.1%) | 6 (8.6%) |
| $800 to $1,499 | 30 (41.1%) | 31 (44.3%) |
| Total | 73 (100.0%) | 70 (100.0%) |
Health & Disability in Crystal Lakes
Health Insurance Coverage by Age in Crystal Lakes
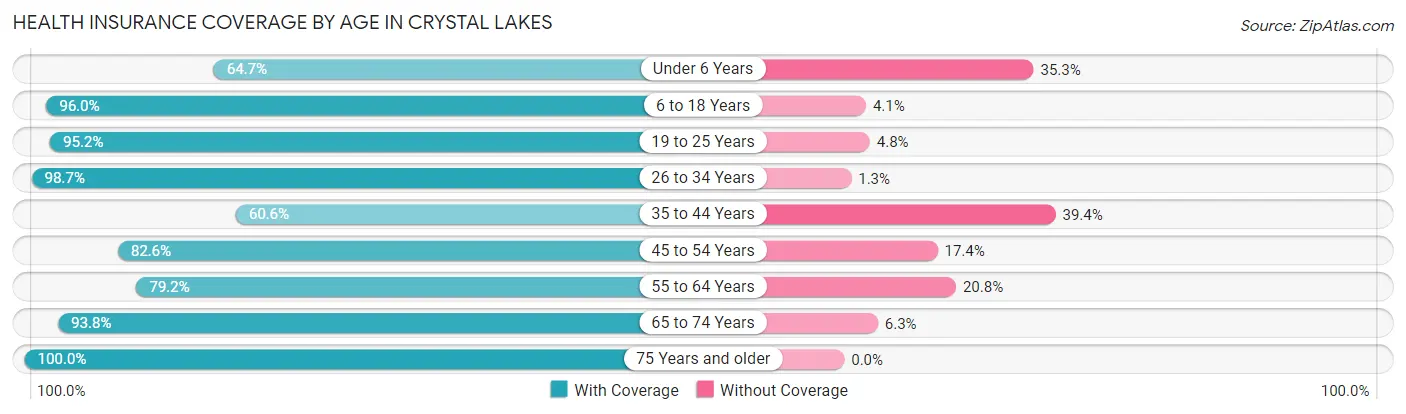
| Age Bracket | With Coverage | Without Coverage |
| Under 6 Years | 44 (64.7%) | 24 (35.3%) |
| 6 to 18 Years | 71 (96.0%) | 3 (4.1%) |
| 19 to 25 Years | 20 (95.2%) | 1 (4.8%) |
| 26 to 34 Years | 76 (98.7%) | 1 (1.3%) |
| 35 to 44 Years | 20 (60.6%) | 13 (39.4%) |
| 45 to 54 Years | 57 (82.6%) | 12 (17.4%) |
| 55 to 64 Years | 38 (79.2%) | 10 (20.8%) |
| 65 to 74 Years | 30 (93.8%) | 2 (6.2%) |
| 75 Years and older | 34 (100.0%) | 0 (0.0%) |
| Total | 390 (85.5%) | 66 (14.5%) |
Health Insurance Coverage by Citizenship Status in Crystal Lakes
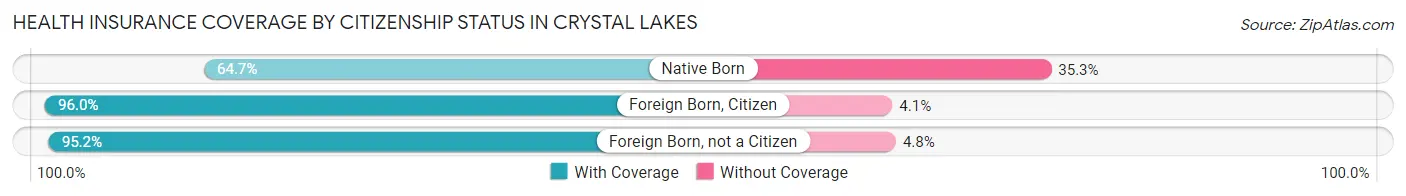
| Citizenship Status | With Coverage | Without Coverage |
| Native Born | 44 (64.7%) | 24 (35.3%) |
| Foreign Born, Citizen | 71 (96.0%) | 3 (4.1%) |
| Foreign Born, not a Citizen | 20 (95.2%) | 1 (4.8%) |
Health Insurance Coverage by Household Income in Crystal Lakes
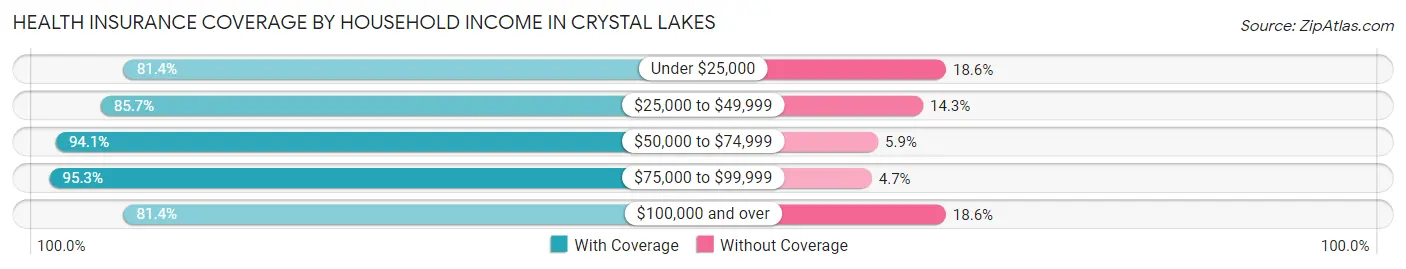
| Household Income | With Coverage | Without Coverage |
| Under $25,000 | 70 (81.4%) | 16 (18.6%) |
| $25,000 to $49,999 | 24 (85.7%) | 4 (14.3%) |
| $50,000 to $74,999 | 64 (94.1%) | 4 (5.9%) |
| $75,000 to $99,999 | 61 (95.3%) | 3 (4.7%) |
| $100,000 and over | 171 (81.4%) | 39 (18.6%) |
Public vs Private Health Insurance Coverage by Age in Crystal Lakes
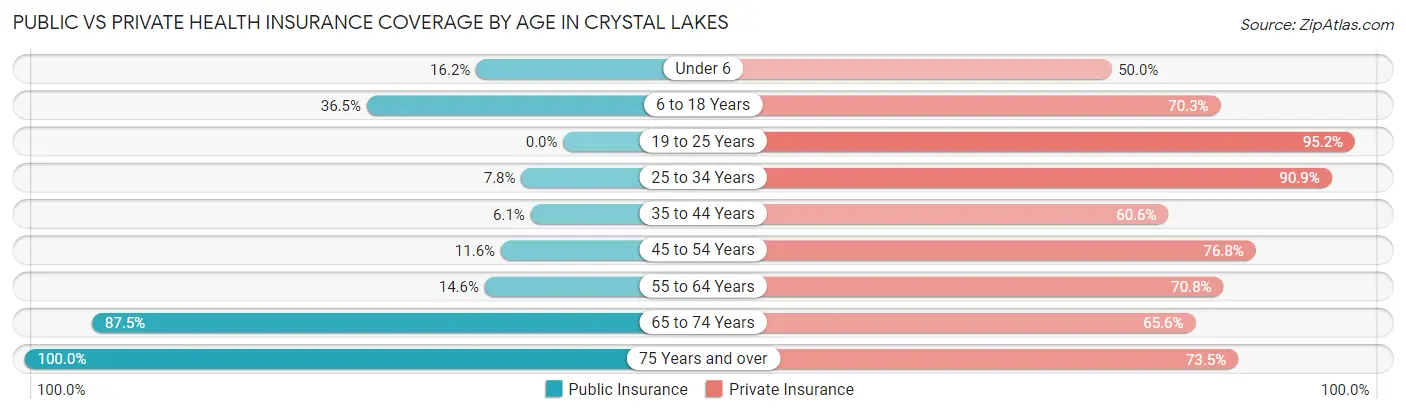
| Age Bracket | Public Insurance | Private Insurance |
| Under 6 | 11 (16.2%) | 34 (50.0%) |
| 6 to 18 Years | 27 (36.5%) | 52 (70.3%) |
| 19 to 25 Years | 0 (0.0%) | 20 (95.2%) |
| 25 to 34 Years | 6 (7.8%) | 70 (90.9%) |
| 35 to 44 Years | 2 (6.1%) | 20 (60.6%) |
| 45 to 54 Years | 8 (11.6%) | 53 (76.8%) |
| 55 to 64 Years | 7 (14.6%) | 34 (70.8%) |
| 65 to 74 Years | 28 (87.5%) | 21 (65.6%) |
| 75 Years and over | 34 (100.0%) | 25 (73.5%) |
| Total | 123 (27.0%) | 329 (72.2%) |
Disability Status by Sex by Age in Crystal Lakes
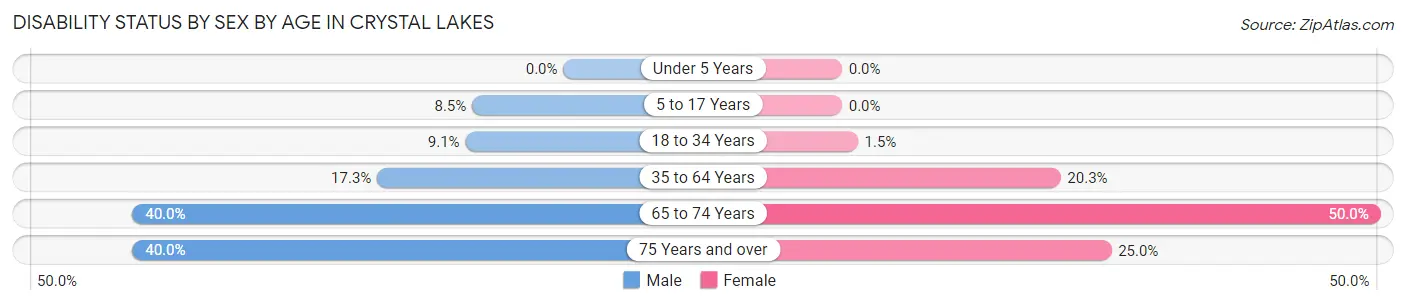
| Age Bracket | Male | Female |
| Under 5 Years | 0 (0.0%) | 0 (0.0%) |
| 5 to 17 Years | 5 (8.5%) | 0 (0.0%) |
| 18 to 34 Years | 3 (9.1%) | 1 (1.5%) |
| 35 to 64 Years | 14 (17.3%) | 14 (20.3%) |
| 65 to 74 Years | 8 (40.0%) | 6 (50.0%) |
| 75 Years and over | 4 (40.0%) | 6 (25.0%) |
Disability Class by Sex by Age in Crystal Lakes
Disability Class: Hearing Difficulty
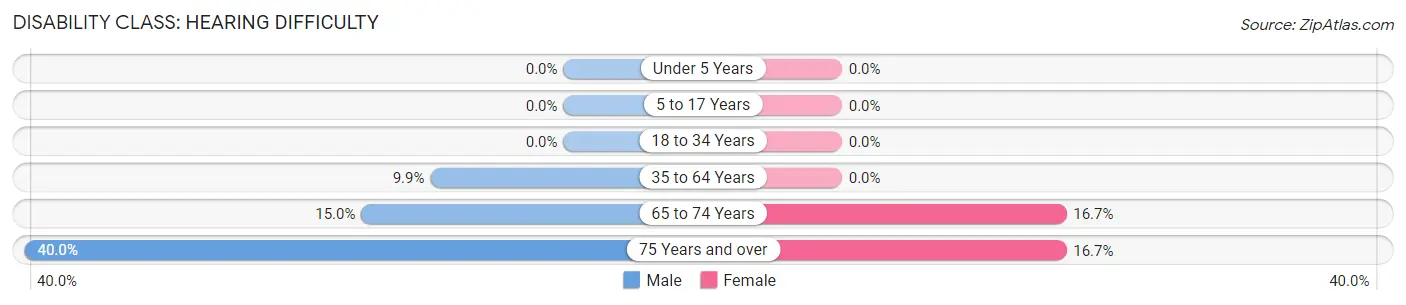
| Age Bracket | Male | Female |
| Under 5 Years | 0 (0.0%) | 0 (0.0%) |
| 5 to 17 Years | 0 (0.0%) | 0 (0.0%) |
| 18 to 34 Years | 0 (0.0%) | 0 (0.0%) |
| 35 to 64 Years | 8 (9.9%) | 0 (0.0%) |
| 65 to 74 Years | 3 (15.0%) | 2 (16.7%) |
| 75 Years and over | 4 (40.0%) | 4 (16.7%) |
Disability Class: Vision Difficulty
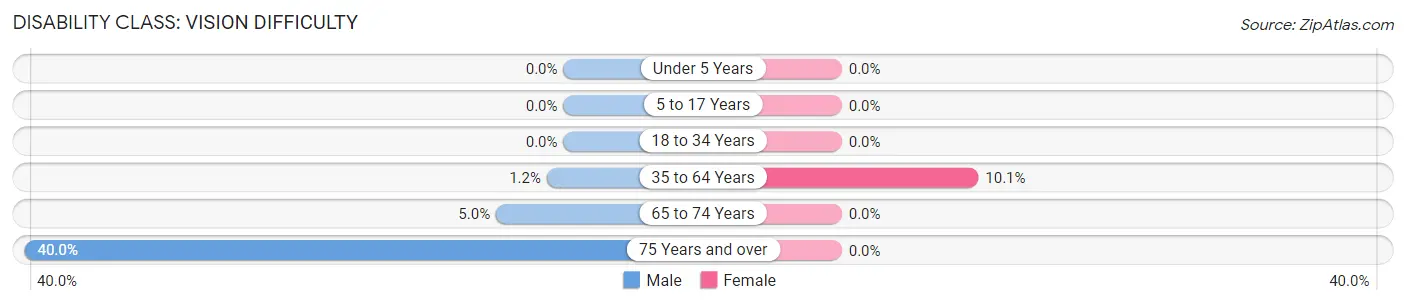
| Age Bracket | Male | Female |
| Under 5 Years | 0 (0.0%) | 0 (0.0%) |
| 5 to 17 Years | 0 (0.0%) | 0 (0.0%) |
| 18 to 34 Years | 0 (0.0%) | 0 (0.0%) |
| 35 to 64 Years | 1 (1.2%) | 7 (10.1%) |
| 65 to 74 Years | 1 (5.0%) | 0 (0.0%) |
| 75 Years and over | 4 (40.0%) | 0 (0.0%) |
Disability Class: Cognitive Difficulty
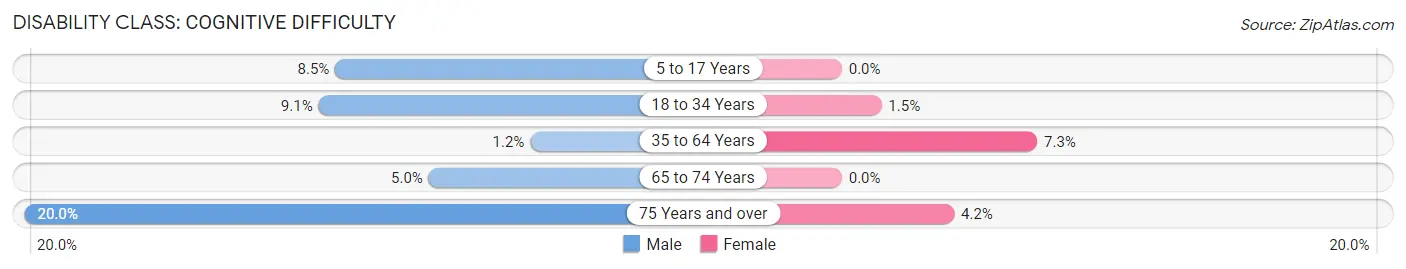
| Age Bracket | Male | Female |
| 5 to 17 Years | 5 (8.5%) | 0 (0.0%) |
| 18 to 34 Years | 3 (9.1%) | 1 (1.5%) |
| 35 to 64 Years | 1 (1.2%) | 5 (7.2%) |
| 65 to 74 Years | 1 (5.0%) | 0 (0.0%) |
| 75 Years and over | 2 (20.0%) | 1 (4.2%) |
Disability Class: Ambulatory Difficulty
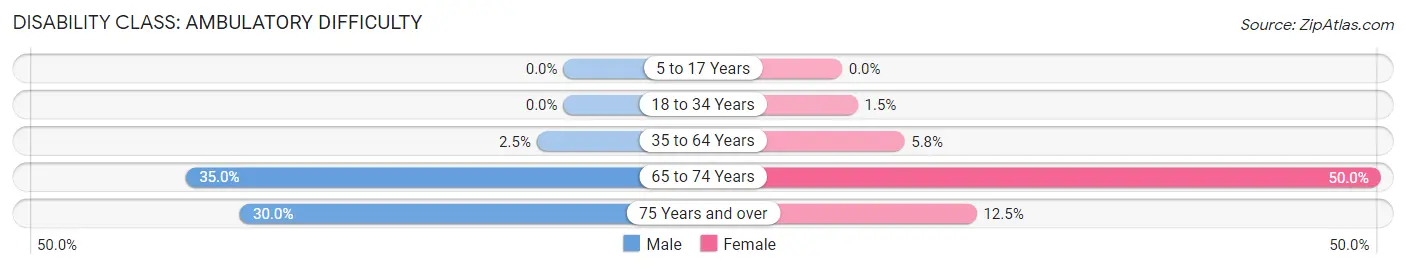
| Age Bracket | Male | Female |
| 5 to 17 Years | 0 (0.0%) | 0 (0.0%) |
| 18 to 34 Years | 0 (0.0%) | 1 (1.5%) |
| 35 to 64 Years | 2 (2.5%) | 4 (5.8%) |
| 65 to 74 Years | 7 (35.0%) | 6 (50.0%) |
| 75 Years and over | 3 (30.0%) | 3 (12.5%) |
Disability Class: Self-Care Difficulty
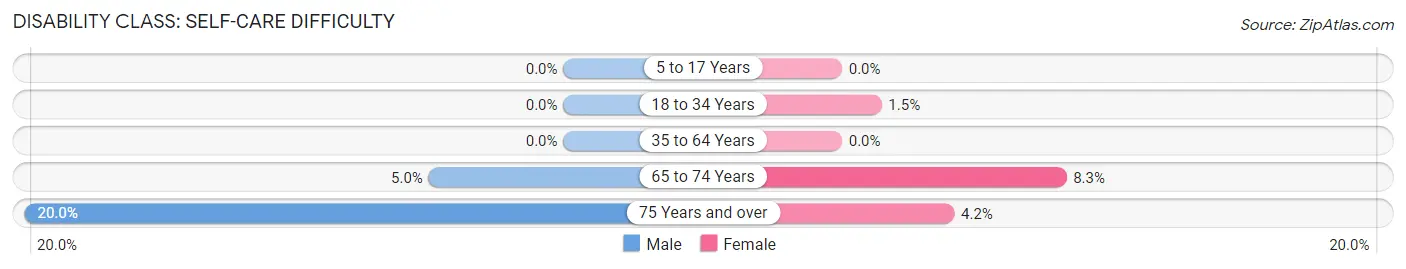
| Age Bracket | Male | Female |
| 5 to 17 Years | 0 (0.0%) | 0 (0.0%) |
| 18 to 34 Years | 0 (0.0%) | 1 (1.5%) |
| 35 to 64 Years | 0 (0.0%) | 0 (0.0%) |
| 65 to 74 Years | 1 (5.0%) | 1 (8.3%) |
| 75 Years and over | 2 (20.0%) | 1 (4.2%) |
Technology Access in Crystal Lakes
Computing Device Access in Crystal Lakes
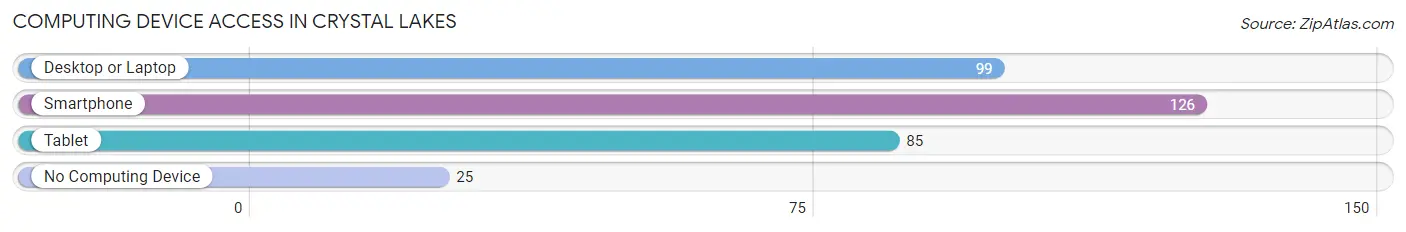
| Device Type | # Households | % Households |
| Desktop or Laptop | 99 | 63.1% |
| Smartphone | 126 | 80.2% |
| Tablet | 85 | 54.1% |
| No Computing Device | 25 | 15.9% |
| Total | 157 | 100.0% |
Internet Access in Crystal Lakes
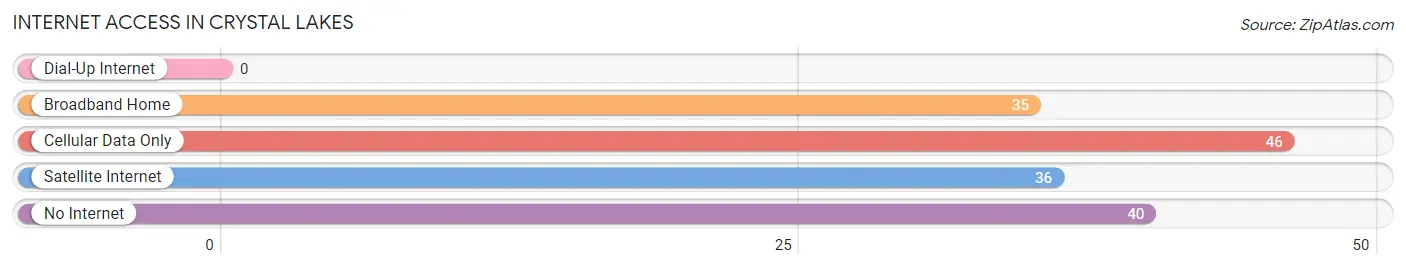
| Internet Type | # Households | % Households |
| Dial-Up Internet | 0 | 0.0% |
| Broadband Home | 35 | 22.3% |
| Cellular Data Only | 46 | 29.3% |
| Satellite Internet | 36 | 22.9% |
| No Internet | 40 | 25.5% |
| Total | 157 | 100.0% |
Crystal Lakes Summary
Lakes, Missouri is a small town located in the Ozark Mountains of Missouri. It is situated in the southeastern corner of the state, near the Arkansas border. The town is home to a population of just over 1,000 people, and is known for its beautiful lakes and outdoor recreation opportunities.
History
The area that is now Crystal Lakes was first settled in the early 1800s by settlers from the Ozark region of Missouri. The town was originally known as “Crystal Springs”, and was named after the crystal-clear springs that were found in the area. The town was officially incorporated in 1883, and the name was changed to Crystal Lakes in 1891.
Geography
Crystal Lakes is located in the Ozark Mountains of Missouri, in the southeastern corner of the state. The town is situated on the banks of the White River, and is surrounded by rolling hills and lush forests. The town is located about 30 miles from the Arkansas border, and is about an hour and a half drive from the state capital of Jefferson City.
Economy
The economy of Crystal Lakes is largely based on tourism and outdoor recreation. The town is home to several lakes, including Crystal Lake, which is the largest lake in the area. The lake is a popular destination for fishing, boating, and swimming. The town also has several campgrounds, hiking trails, and other outdoor activities.
In addition to tourism, the town is also home to several small businesses, including a grocery store, a hardware store, and a few restaurants. The town also has a small manufacturing sector, which produces a variety of products, including furniture and clothing.
Demographics
As of the 2010 census, the population of Crystal Lakes was 1,072. The racial makeup of the town was 97.3% White, 0.7% African American, 0.3% Native American, 0.2% Asian, and 1.5% from other races. The median household income in the town was $37,917, and the median age was 41.
Conclusion
Crystal Lakes, Missouri is a small town located in the Ozark Mountains of Missouri. It is home to a population of just over 1,000 people, and is known for its beautiful lakes and outdoor recreation opportunities. The town’s economy is largely based on tourism and outdoor recreation, and it also has a small manufacturing sector. The town has a diverse population, with a median household income of $37,917 and a median age of 41.
Common Questions
What is Per Capita Income in Crystal Lakes?
Per Capita income in Crystal Lakes is $27,705.
What is the Median Family Income in Crystal Lakes?
Median Family Income in Crystal Lakes is $92,708.
What is the Median Household income in Crystal Lakes?
Median Household Income in Crystal Lakes is $72,917.
What is Income or Wage Gap in Crystal Lakes?
Income or Wage Gap in Crystal Lakes is 0.8%.
Women in Crystal Lakes earn 99.2 cents for every dollar earned by a man.
What is Family Income Deficit in Crystal Lakes?
Family Income Deficit in Crystal Lakes is $14,218.
Families that are below poverty line in Crystal Lakes earn $14,218 less on average than the poverty threshold level.
What is Inequality or Gini Index in Crystal Lakes?
Inequality or Gini Index in Crystal Lakes is 0.35.
What is the Total Population of Crystal Lakes?
Total Population of Crystal Lakes is 456.
What is the Total Male Population of Crystal Lakes?
Total Male Population of Crystal Lakes is 253.
What is the Total Female Population of Crystal Lakes?
Total Female Population of Crystal Lakes is 203.
What is the Ratio of Males per 100 Females in Crystal Lakes?
There are 124.63 Males per 100 Females in Crystal Lakes.
What is the Ratio of Females per 100 Males in Crystal Lakes?
There are 80.24 Females per 100 Males in Crystal Lakes.
What is the Median Population Age in Crystal Lakes?
Median Population Age in Crystal Lakes is 33.5 Years.
What is the Average Family Size in Crystal Lakes
Average Family Size in Crystal Lakes is 3.5 People.
What is the Average Household Size in Crystal Lakes
Average Household Size in Crystal Lakes is 2.9 People.
How Large is the Labor Force in Crystal Lakes?
There are 208 People in the Labor Forcein in Crystal Lakes.
What is the Percentage of People in the Labor Force in Crystal Lakes?
64.8% of People are in the Labor Force in Crystal Lakes.
What is the Unemployment Rate in Crystal Lakes?
Unemployment Rate in Crystal Lakes is 1.9%.