Green Isle, MN Map & Demographics
Green Isle Map
Green Isle Overview
$31,909
PER CAPITA INCOME
$89,375
AVG FAMILY INCOME
$81,250
AVG HOUSEHOLD INCOME
3.8%
WAGE / INCOME GAP [ % ]
96.2¢/ $1
WAGE / INCOME GAP [ $ ]
0.29
INEQUALITY / GINI INDEX
479
TOTAL POPULATION
261
MALE POPULATION
218
FEMALE POPULATION
119.72
MALES / 100 FEMALES
83.52
FEMALES / 100 MALES
36.6
MEDIAN AGE
3.4
AVG FAMILY SIZE
2.5
AVG HOUSEHOLD SIZE
283
LABOR FORCE [ PEOPLE ]
76.1%
PERCENT IN LABOR FORCE
1.1%
UNEMPLOYMENT RATE
Green Isle Zip Codes
Green Isle Area Codes
Income in Green Isle
Income Overview in Green Isle
Per Capita Income in Green Isle is $31,909, while median incomes of families and households are $89,375 and $81,250 respectively.
| Characteristic | Number | Measure |
| Per Capita Income | 479 | $31,909 |
| Median Family Income | 113 | $89,375 |
| Mean Family Income | 113 | $90,865 |
| Median Household Income | 188 | $81,250 |
| Mean Household Income | 188 | $81,086 |
| Income Deficit | 113 | $0 |
| Wage / Income Gap (%) | 479 | 3.83% |
| Wage / Income Gap ($) | 479 | 96.17¢ per $1 |
| Gini / Inequality Index | 479 | 0.29 |
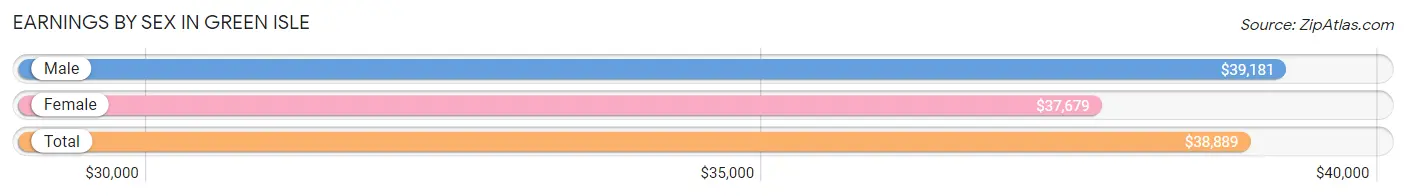
Earnings by Sex in Green Isle
Average Earnings in Green Isle are $38,889, $39,181 for men and $37,679 for women, a difference of 3.8%.
| Sex | Number | Average Earnings |
| Male | 187 (62.7%) | $39,181 |
| Female | 111 (37.2%) | $37,679 |
| Total | 298 (100.0%) | $38,889 |
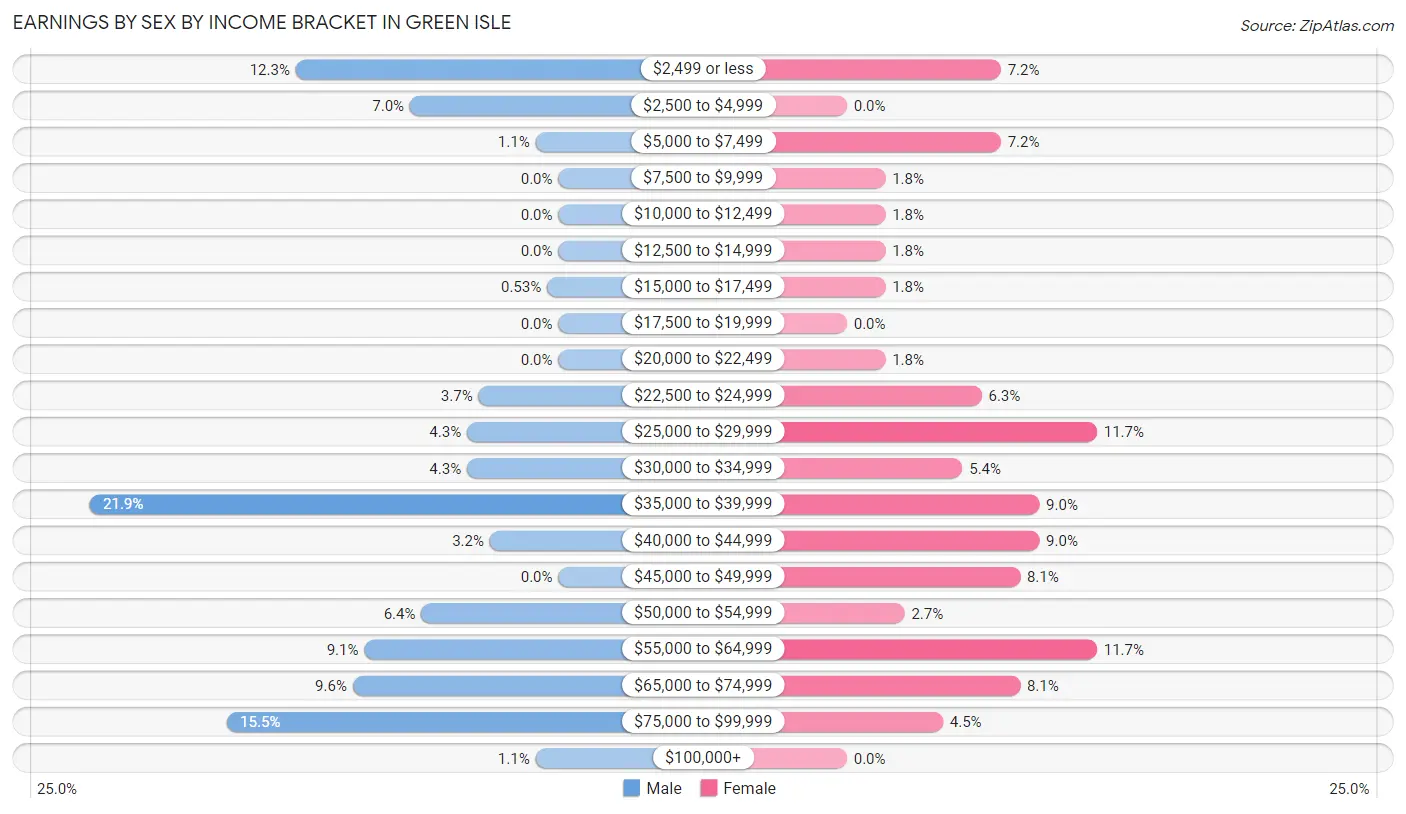
Earnings by Sex by Income Bracket in Green Isle
The most common earnings brackets in Green Isle are $35,000 to $39,999 for men (41 | 21.9%) and $25,000 to $29,999 for women (13 | 11.7%).
| Income | Male | Female |
| $2,499 or less | 23 (12.3%) | 8 (7.2%) |
| $2,500 to $4,999 | 13 (7.0%) | 0 (0.0%) |
| $5,000 to $7,499 | 2 (1.1%) | 8 (7.2%) |
| $7,500 to $9,999 | 0 (0.0%) | 2 (1.8%) |
| $10,000 to $12,499 | 0 (0.0%) | 2 (1.8%) |
| $12,500 to $14,999 | 0 (0.0%) | 2 (1.8%) |
| $15,000 to $17,499 | 1 (0.5%) | 2 (1.8%) |
| $17,500 to $19,999 | 0 (0.0%) | 0 (0.0%) |
| $20,000 to $22,499 | 0 (0.0%) | 2 (1.8%) |
| $22,500 to $24,999 | 7 (3.7%) | 7 (6.3%) |
| $25,000 to $29,999 | 8 (4.3%) | 13 (11.7%) |
| $30,000 to $34,999 | 8 (4.3%) | 6 (5.4%) |
| $35,000 to $39,999 | 41 (21.9%) | 10 (9.0%) |
| $40,000 to $44,999 | 6 (3.2%) | 10 (9.0%) |
| $45,000 to $49,999 | 0 (0.0%) | 9 (8.1%) |
| $50,000 to $54,999 | 12 (6.4%) | 3 (2.7%) |
| $55,000 to $64,999 | 17 (9.1%) | 13 (11.7%) |
| $65,000 to $74,999 | 18 (9.6%) | 9 (8.1%) |
| $75,000 to $99,999 | 29 (15.5%) | 5 (4.5%) |
| $100,000+ | 2 (1.1%) | 0 (0.0%) |
| Total | 187 (100.0%) | 111 (100.0%) |
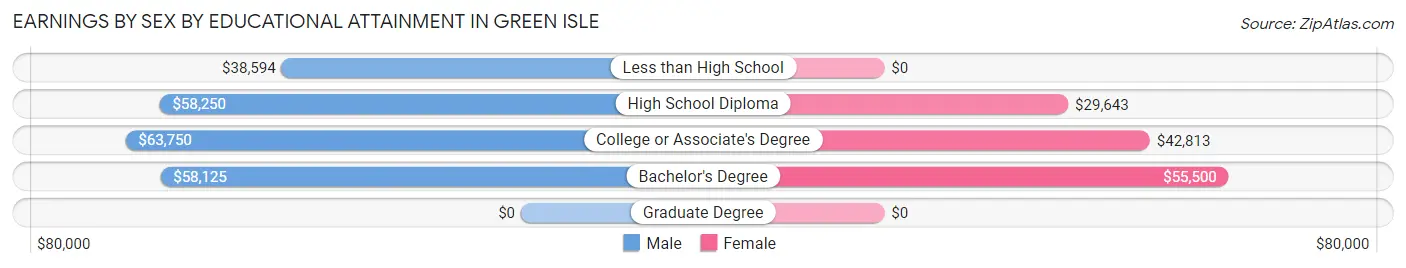
Earnings by Sex by Educational Attainment in Green Isle
Average earnings in Green Isle are $51,111 for men and $40,417 for women, a difference of 20.9%. Men with an educational attainment of college or associate's degree enjoy the highest average annual earnings of $63,750, while those with less than high school education earn the least with $38,594. Women with an educational attainment of bachelor's degree earn the most with the average annual earnings of $55,500, while those with high school diploma education have the smallest earnings of $29,643.
| Educational Attainment | Male Income | Female Income |
| Less than High School | $38,594 | $0 |
| High School Diploma | $58,250 | $29,643 |
| College or Associate's Degree | $63,750 | $42,813 |
| Bachelor's Degree | $58,125 | $55,500 |
| Graduate Degree | - | - |
| Total | $51,111 | $40,417 |
Family Income in Green Isle
Family Income Brackets in Green Isle
According to the Green Isle family income data, there are 30 families falling into the $75,000 to $99,999 income range, which is the most common income bracket and makes up 26.6% of all families.
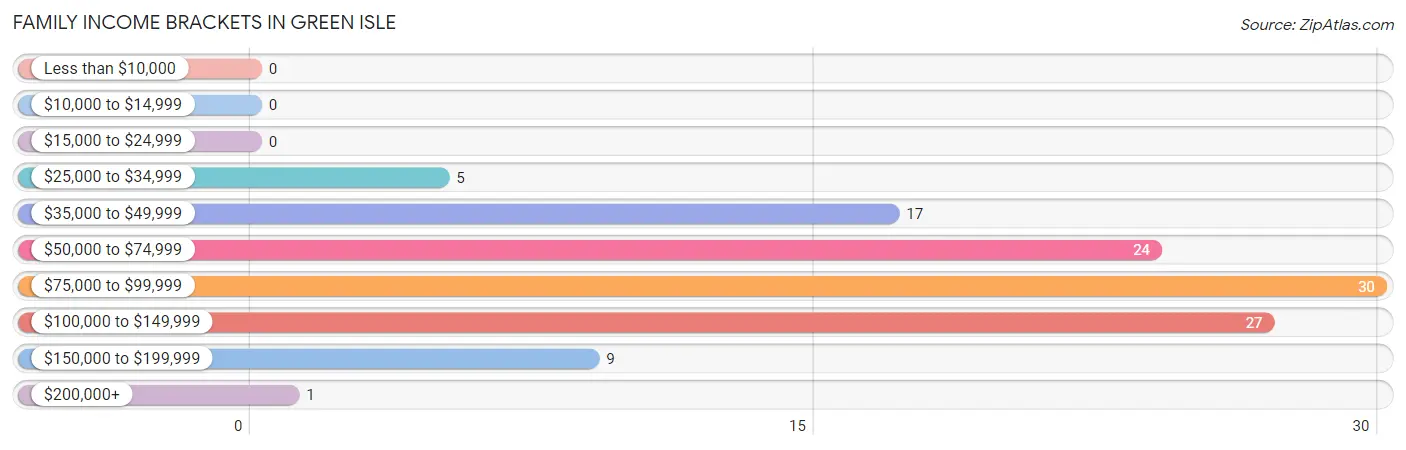
| Income Bracket | # Families | % Families |
| Less than $10,000 | 0 | 0.0% |
| $10,000 to $14,999 | 0 | 0.0% |
| $15,000 to $24,999 | 0 | 0.0% |
| $25,000 to $34,999 | 5 | 4.4% |
| $35,000 to $49,999 | 17 | 15.0% |
| $50,000 to $74,999 | 24 | 21.2% |
| $75,000 to $99,999 | 30 | 26.5% |
| $100,000 to $149,999 | 27 | 23.9% |
| $150,000 to $199,999 | 9 | 8.0% |
| $200,000+ | 1 | 0.9% |
Family Income by Famaliy Size in Green Isle
4-person families (26 | 23.0%) account for the highest median family income in Green Isle with $137,500 per family, while 2-person families (55 | 48.7%) have the highest median income of $40,521 per family member.
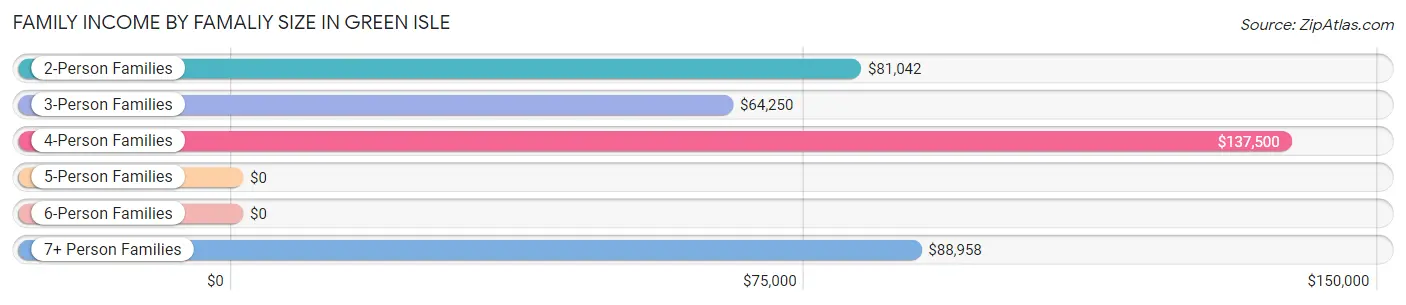
| Income Bracket | # Families | Median Income |
| 2-Person Families | 55 (48.7%) | $81,042 |
| 3-Person Families | 17 (15.0%) | $64,250 |
| 4-Person Families | 26 (23.0%) | $137,500 |
| 5-Person Families | 2 (1.8%) | $0 |
| 6-Person Families | 2 (1.8%) | $0 |
| 7+ Person Families | 11 (9.7%) | $88,958 |
| Total | 113 (100.0%) | $89,375 |
Family Income by Number of Earners in Green Isle
The median family income in Green Isle is $89,375, with families comprising 3+ earners (18) having the highest median family income of $140,625, while families with no earners (11) have the lowest median family income of $41,750, accounting for 15.9% and 9.7% of families, respectively.
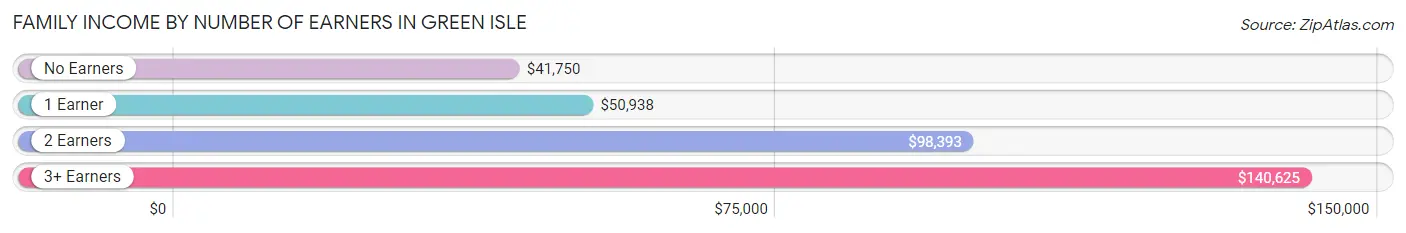
| Number of Earners | # Families | Median Income |
| No Earners | 11 (9.7%) | $41,750 |
| 1 Earner | 33 (29.2%) | $50,938 |
| 2 Earners | 51 (45.1%) | $98,393 |
| 3+ Earners | 18 (15.9%) | $140,625 |
| Total | 113 (100.0%) | $89,375 |
Household Income in Green Isle
Household Income Brackets in Green Isle
With 51 households falling in the category, the $75,000 to $99,999 income range is the most frequent in Green Isle, accounting for 27.1% of all households.
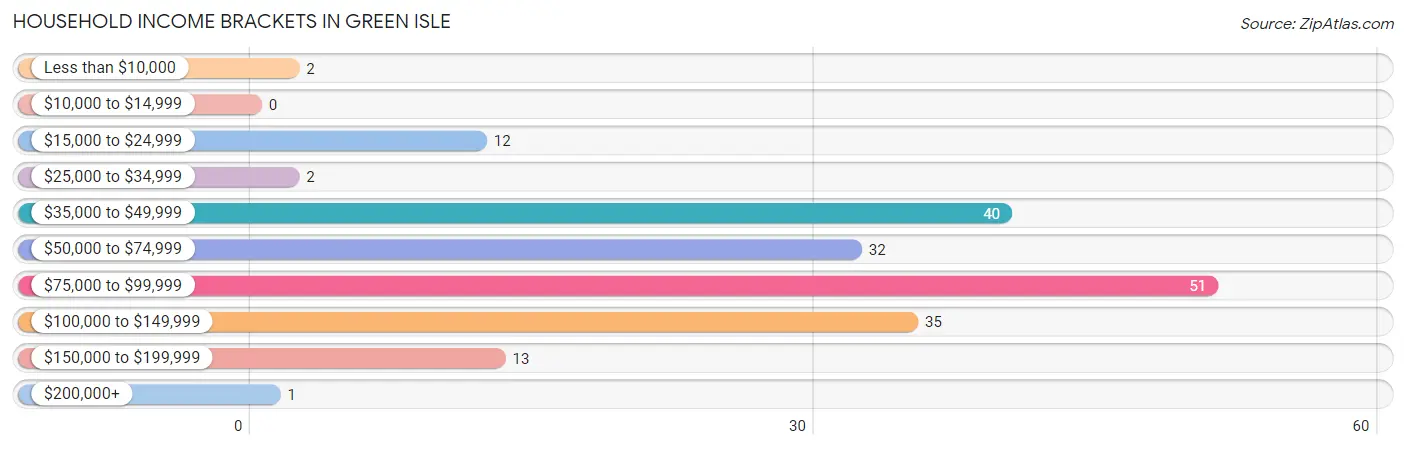
| Income Bracket | # Households | % Households |
| Less than $10,000 | 2 | 1.1% |
| $10,000 to $14,999 | 0 | 0.0% |
| $15,000 to $24,999 | 12 | 6.4% |
| $25,000 to $34,999 | 2 | 1.1% |
| $35,000 to $49,999 | 40 | 21.3% |
| $50,000 to $74,999 | 32 | 17.0% |
| $75,000 to $99,999 | 51 | 27.1% |
| $100,000 to $149,999 | 35 | 18.6% |
| $150,000 to $199,999 | 13 | 6.9% |
| $200,000+ | 1 | 0.5% |
Household Income by Householder Age in Green Isle
The median household income in Green Isle is $81,250, with the highest median household income of $103,750 found in the 45 to 64 years age bracket for the primary householder. A total of 42 households (22.3%) fall into this category. Meanwhile, the 15 to 24 years age bracket for the primary householder has the lowest median household income of $0, with 2 households (1.1%) in this group.
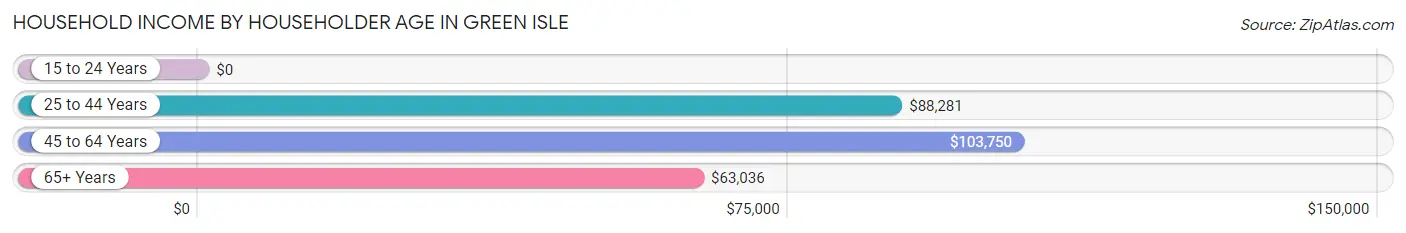
| Income Bracket | # Households | Median Income |
| 15 to 24 Years | 2 (1.1%) | $0 |
| 25 to 44 Years | 91 (48.4%) | $88,281 |
| 45 to 64 Years | 42 (22.3%) | $103,750 |
| 65+ Years | 53 (28.2%) | $63,036 |
| Total | 188 (100.0%) | $81,250 |
Poverty in Green Isle
Income Below Poverty by Sex and Age in Green Isle
With 1.1% poverty level for males and 0.5% for females among the residents of Green Isle, 45 to 54 year old males and 45 to 54 year old females are the most vulnerable to poverty, with 2 males (8.7%) and 1 females (5.9%) in their respective age groups living below the poverty level.
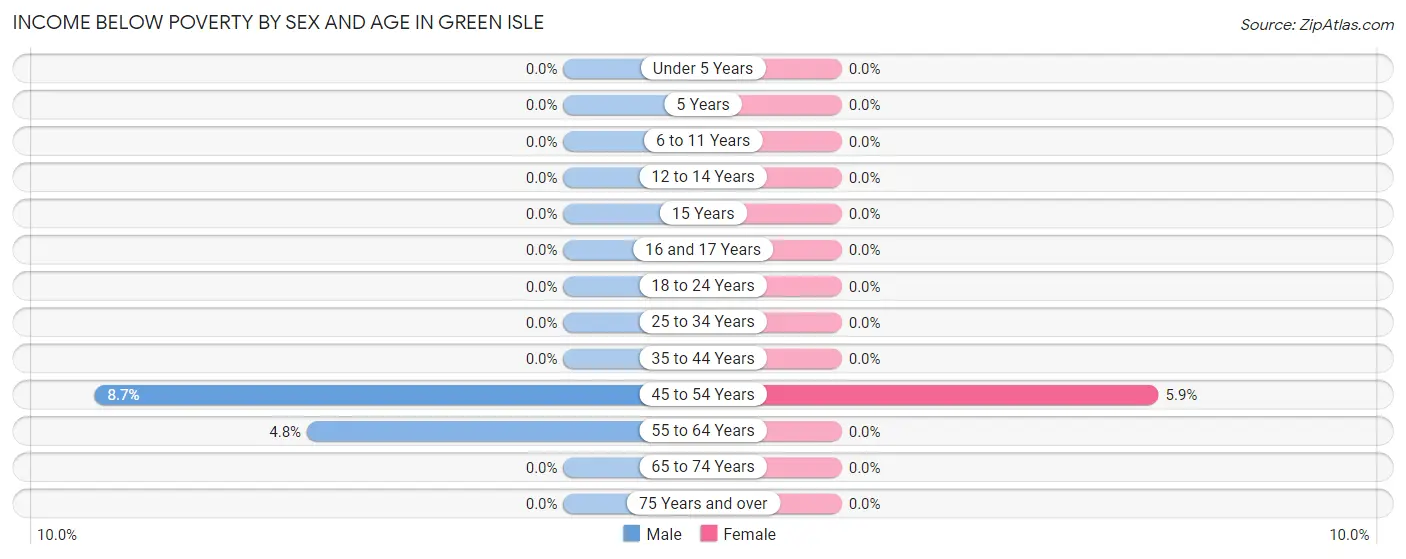
| Age Bracket | Male | Female |
| Under 5 Years | 0 (0.0%) | 0 (0.0%) |
| 5 Years | 0 (0.0%) | 0 (0.0%) |
| 6 to 11 Years | 0 (0.0%) | 0 (0.0%) |
| 12 to 14 Years | 0 (0.0%) | 0 (0.0%) |
| 15 Years | 0 (0.0%) | 0 (0.0%) |
| 16 and 17 Years | 0 (0.0%) | 0 (0.0%) |
| 18 to 24 Years | 0 (0.0%) | 0 (0.0%) |
| 25 to 34 Years | 0 (0.0%) | 0 (0.0%) |
| 35 to 44 Years | 0 (0.0%) | 0 (0.0%) |
| 45 to 54 Years | 2 (8.7%) | 1 (5.9%) |
| 55 to 64 Years | 1 (4.8%) | 0 (0.0%) |
| 65 to 74 Years | 0 (0.0%) | 0 (0.0%) |
| 75 Years and over | 0 (0.0%) | 0 (0.0%) |
| Total | 3 (1.1%) | 1 (0.5%) |
Income Above Poverty by Sex and Age in Green Isle
According to the poverty statistics in Green Isle, males aged under 5 years and females aged under 5 years are the age groups that are most secure financially, with 100.0% of males and 100.0% of females in these age groups living above the poverty line.
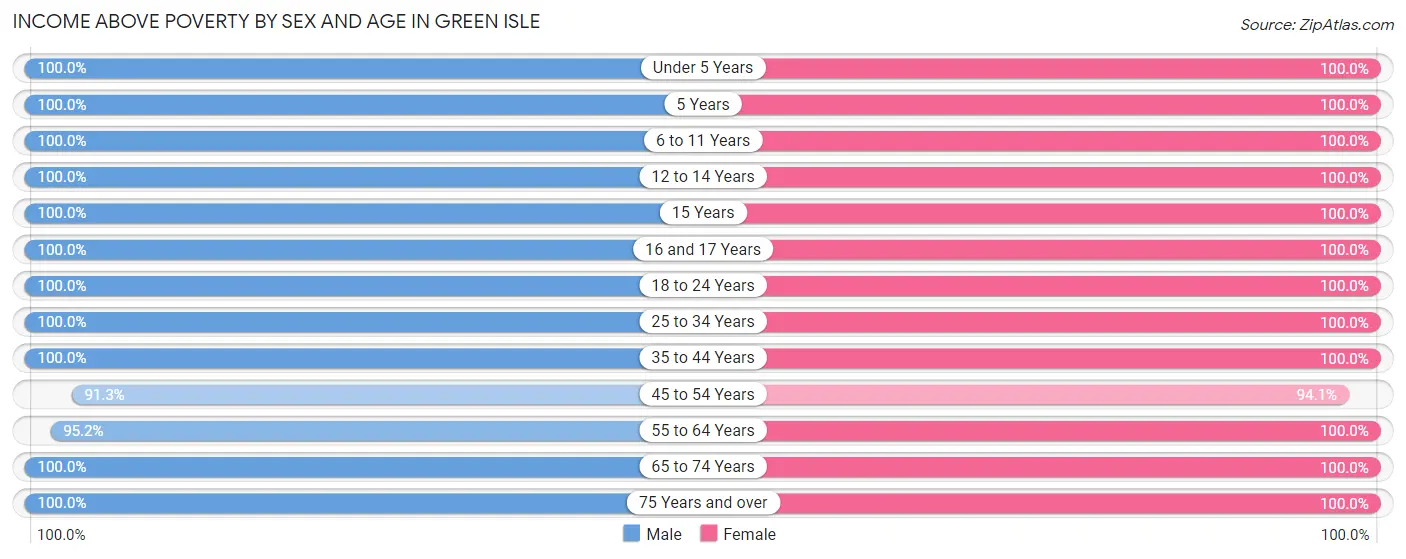
| Age Bracket | Male | Female |
| Under 5 Years | 13 (100.0%) | 24 (100.0%) |
| 5 Years | 4 (100.0%) | 2 (100.0%) |
| 6 to 11 Years | 28 (100.0%) | 16 (100.0%) |
| 12 to 14 Years | 4 (100.0%) | 9 (100.0%) |
| 15 Years | 6 (100.0%) | 1 (100.0%) |
| 16 and 17 Years | 6 (100.0%) | 5 (100.0%) |
| 18 to 24 Years | 33 (100.0%) | 11 (100.0%) |
| 25 to 34 Years | 24 (100.0%) | 34 (100.0%) |
| 35 to 44 Years | 62 (100.0%) | 39 (100.0%) |
| 45 to 54 Years | 21 (91.3%) | 16 (94.1%) |
| 55 to 64 Years | 20 (95.2%) | 15 (100.0%) |
| 65 to 74 Years | 17 (100.0%) | 13 (100.0%) |
| 75 Years and over | 20 (100.0%) | 32 (100.0%) |
| Total | 258 (98.9%) | 217 (99.5%) |
Income Below Poverty Among Married-Couple Families in Green Isle
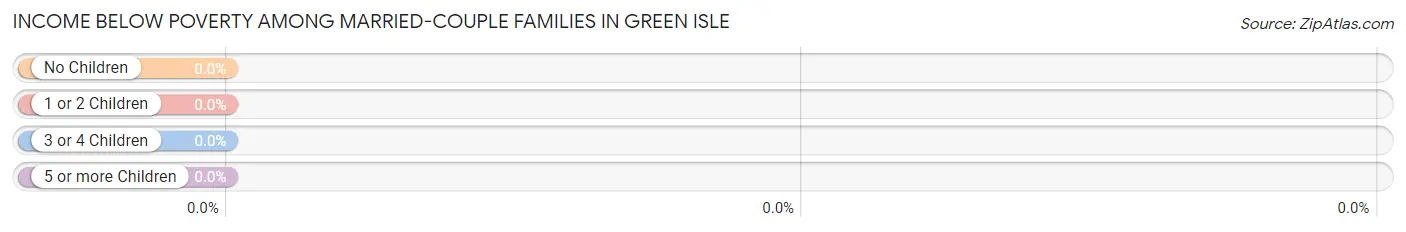
| Children | Above Poverty | Below Poverty |
| No Children | 60 (100.0%) | 0 (0.0%) |
| 1 or 2 Children | 22 (100.0%) | 0 (0.0%) |
| 3 or 4 Children | 10 (100.0%) | 0 (0.0%) |
| 5 or more Children | 5 (100.0%) | 0 (0.0%) |
| Total | 97 (100.0%) | 0 (0.0%) |
Income Below Poverty Among Single-Parent Households in Green Isle
| Children | Single Father | Single Mother |
| No Children | 0 (0.0%) | 0 (0.0%) |
| 1 or 2 Children | 0 (0.0%) | 0 (0.0%) |
| 3 or 4 Children | 0 (0.0%) | 0 (0.0%) |
| 5 or more Children | 0 (0.0%) | 0 (0.0%) |
| Total | 0 (0.0%) | 0 (0.0%) |
Income Below Poverty Among Married-Couple vs Single-Parent Households in Green Isle
| Children | Married-Couple Families | Single-Parent Households |
| No Children | 0 (0.0%) | 0 (0.0%) |
| 1 or 2 Children | 0 (0.0%) | 0 (0.0%) |
| 3 or 4 Children | 0 (0.0%) | 0 (0.0%) |
| 5 or more Children | 0 (0.0%) | 0 (0.0%) |
| Total | 0 (0.0%) | 0 (0.0%) |
Race in Green Isle
The most populous races in Green Isle are White / Caucasian (418 | 87.3%), Hispanic or Latino (32 | 6.7%), and Some other Race (32 | 6.7%).
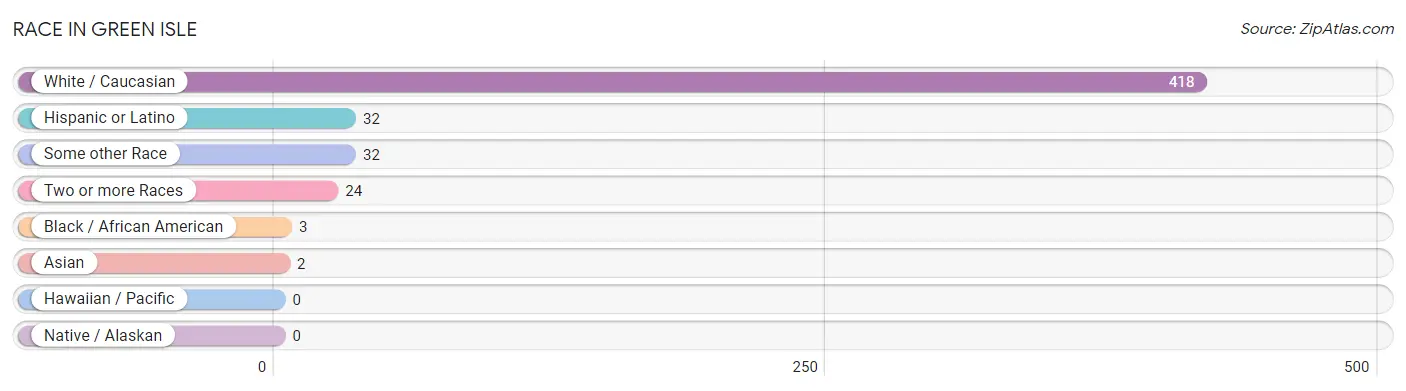
| Race | # Population | % Population |
| Asian | 2 | 0.4% |
| Black / African American | 3 | 0.6% |
| Hawaiian / Pacific | 0 | 0.0% |
| Hispanic or Latino | 32 | 6.7% |
| Native / Alaskan | 0 | 0.0% |
| White / Caucasian | 418 | 87.3% |
| Two or more Races | 24 | 5.0% |
| Some other Race | 32 | 6.7% |
| Total | 479 | 100.0% |
Ancestry in Green Isle
The most populous ancestries reported in Green Isle are German (260 | 54.3%), Irish (45 | 9.4%), Mexican (32 | 6.7%), Norwegian (28 | 5.9%), and Czech (23 | 4.8%), together accounting for 81.0% of all Green Isle residents.
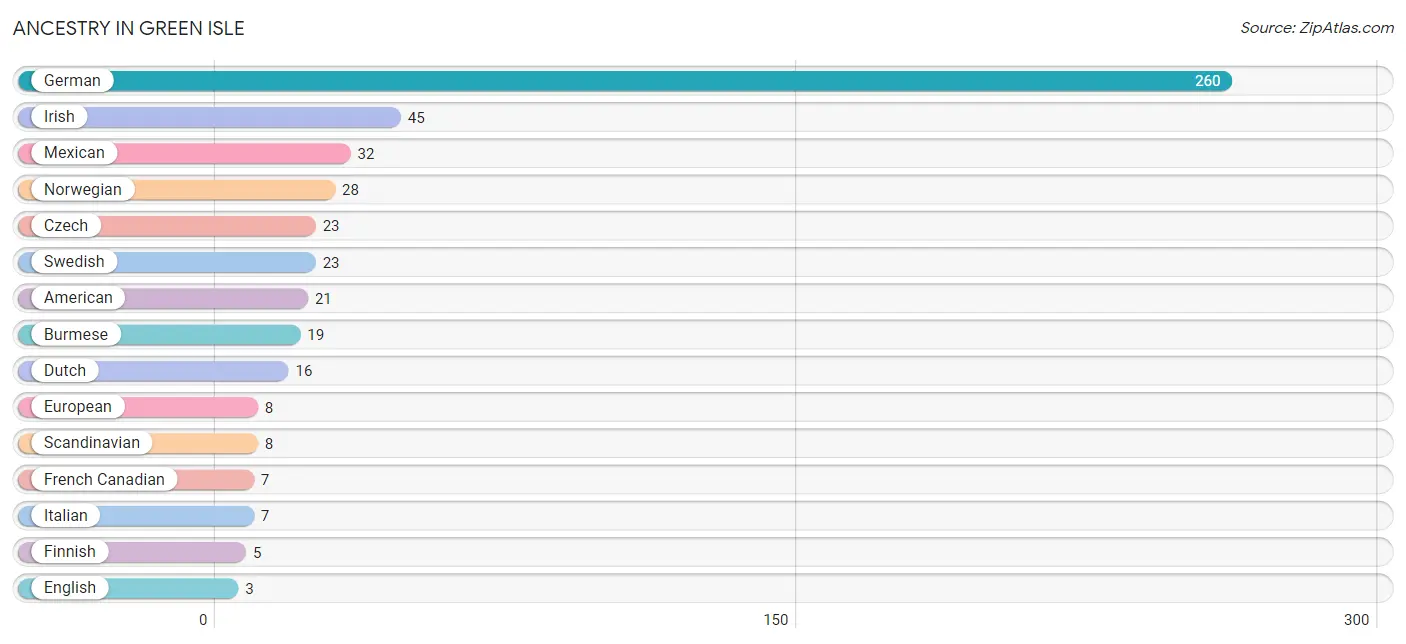
| Ancestry | # Population | % Population |
| American | 21 | 4.4% |
| Belgian | 1 | 0.2% |
| Burmese | 19 | 4.0% |
| Canadian | 2 | 0.4% |
| Czech | 23 | 4.8% |
| Dutch | 16 | 3.3% |
| Eastern European | 2 | 0.4% |
| English | 3 | 0.6% |
| European | 8 | 1.7% |
| Finnish | 5 | 1.0% |
| French | 2 | 0.4% |
| French Canadian | 7 | 1.5% |
| German | 260 | 54.3% |
| Hungarian | 2 | 0.4% |
| Irish | 45 | 9.4% |
| Italian | 7 | 1.5% |
| Mexican | 32 | 6.7% |
| Norwegian | 28 | 5.9% |
| Polish | 3 | 0.6% |
| Scandinavian | 8 | 1.7% |
| Scottish | 3 | 0.6% |
| Somali | 3 | 0.6% |
| Subsaharan African | 3 | 0.6% |
| Swedish | 23 | 4.8% | View All 24 Rows |
Immigrants in Green Isle
The most numerous immigrant groups reported in Green Isle came from Central America (24 | 5.0%), Latin America (24 | 5.0%), Mexico (24 | 5.0%), Africa (3 | 0.6%), and Eastern Africa (3 | 0.6%), together accounting for 16.3% of all Green Isle residents.
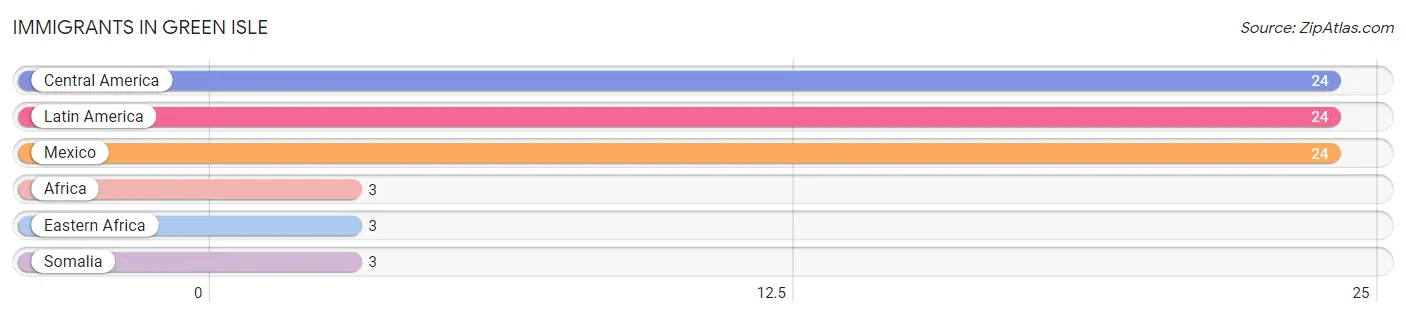
| Immigration Origin | # Population | % Population |
| Africa | 3 | 0.6% |
| Central America | 24 | 5.0% |
| Eastern Africa | 3 | 0.6% |
| Latin America | 24 | 5.0% |
| Mexico | 24 | 5.0% |
| Somalia | 3 | 0.6% | View All 6 Rows |
Sex and Age in Green Isle
Sex and Age in Green Isle
The most populous age groups in Green Isle are 40 to 44 Years (39 | 14.9%) for men and 35 to 39 Years (29 | 13.3%) for women.
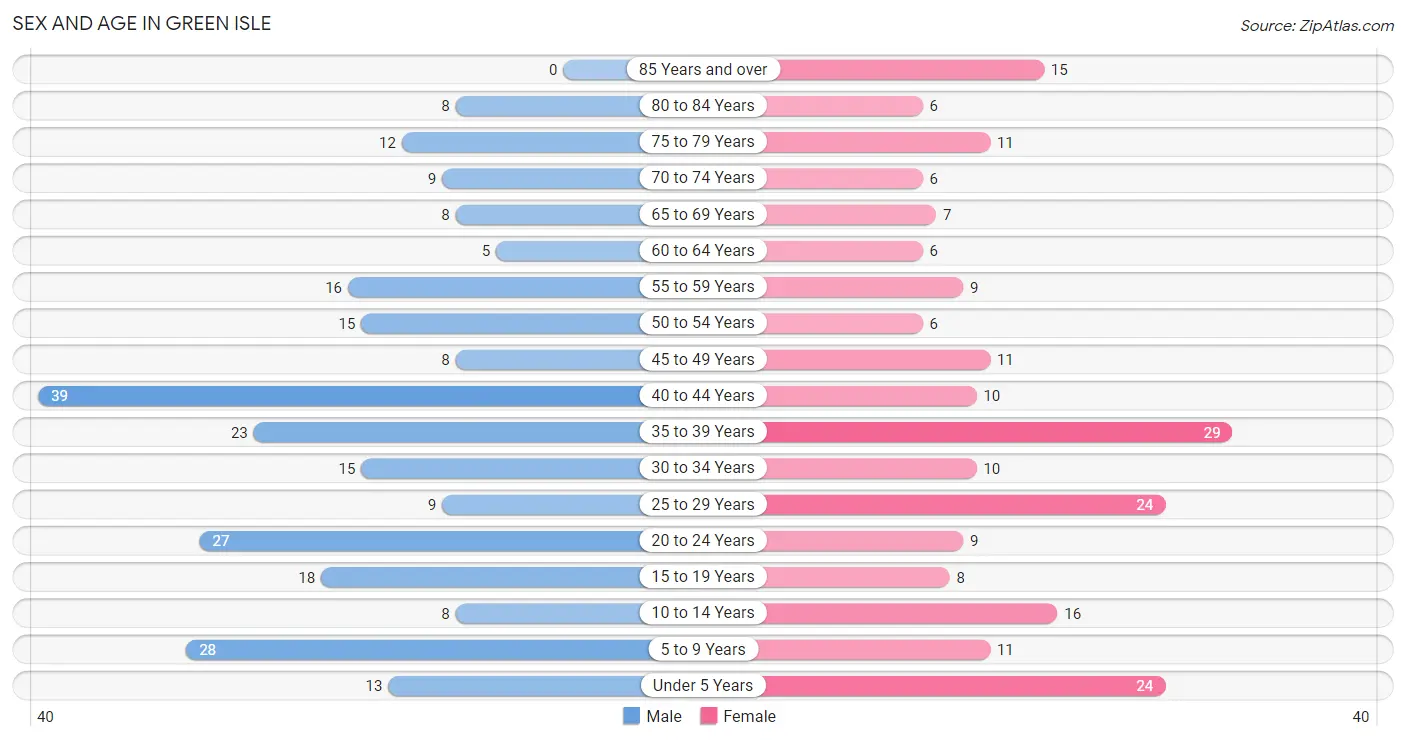
| Age Bracket | Male | Female |
| Under 5 Years | 13 (5.0%) | 24 (11.0%) |
| 5 to 9 Years | 28 (10.7%) | 11 (5.1%) |
| 10 to 14 Years | 8 (3.1%) | 16 (7.3%) |
| 15 to 19 Years | 18 (6.9%) | 8 (3.7%) |
| 20 to 24 Years | 27 (10.3%) | 9 (4.1%) |
| 25 to 29 Years | 9 (3.5%) | 24 (11.0%) |
| 30 to 34 Years | 15 (5.8%) | 10 (4.6%) |
| 35 to 39 Years | 23 (8.8%) | 29 (13.3%) |
| 40 to 44 Years | 39 (14.9%) | 10 (4.6%) |
| 45 to 49 Years | 8 (3.1%) | 11 (5.1%) |
| 50 to 54 Years | 15 (5.8%) | 6 (2.8%) |
| 55 to 59 Years | 16 (6.1%) | 9 (4.1%) |
| 60 to 64 Years | 5 (1.9%) | 6 (2.8%) |
| 65 to 69 Years | 8 (3.1%) | 7 (3.2%) |
| 70 to 74 Years | 9 (3.5%) | 6 (2.8%) |
| 75 to 79 Years | 12 (4.6%) | 11 (5.1%) |
| 80 to 84 Years | 8 (3.1%) | 6 (2.8%) |
| 85 Years and over | 0 (0.0%) | 15 (6.9%) |
| Total | 261 (100.0%) | 218 (100.0%) |
Families and Households in Green Isle
Median Family Size in Green Isle
The median family size in Green Isle is 3.36 persons per family, with married-couple families (97 | 85.8%) accounting for the largest median family size of 3.4 persons per family. On the other hand, single female/mother families (11 | 9.7%) represent the smallest median family size with 3.09 persons per family.
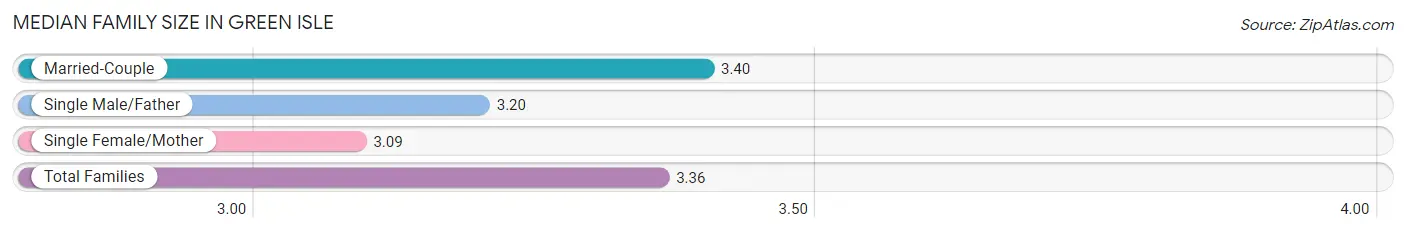
| Family Type | # Families | Family Size |
| Married-Couple | 97 (85.8%) | 3.40 |
| Single Male/Father | 5 (4.4%) | 3.20 |
| Single Female/Mother | 11 (9.7%) | 3.09 |
| Total Families | 113 (100.0%) | 3.36 |
Median Household Size in Green Isle
The median household size in Green Isle is 2.55 persons per household, with single male/father households (5 | 2.7%) accounting for the largest median household size of 4.2 persons per household. non-family households (75 | 39.9%) represent the smallest median household size with 1.13 persons per household.
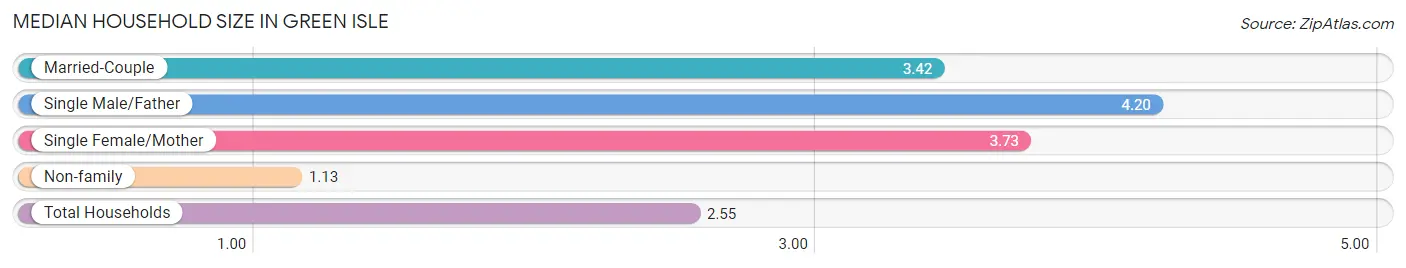
| Household Type | # Households | Household Size |
| Married-Couple | 97 (51.6%) | 3.42 |
| Single Male/Father | 5 (2.7%) | 4.20 |
| Single Female/Mother | 11 (5.9%) | 3.73 |
| Non-family | 75 (39.9%) | 1.13 |
| Total Households | 188 (100.0%) | 2.55 |
Household Size by Marriage Status in Green Isle
Out of a total of 188 households in Green Isle, 113 (60.1%) are family households, while 75 (39.9%) are nonfamily households. The most numerous type of family households are 2-person households, comprising 49, and the most common type of nonfamily households are 1-person households, comprising 63.
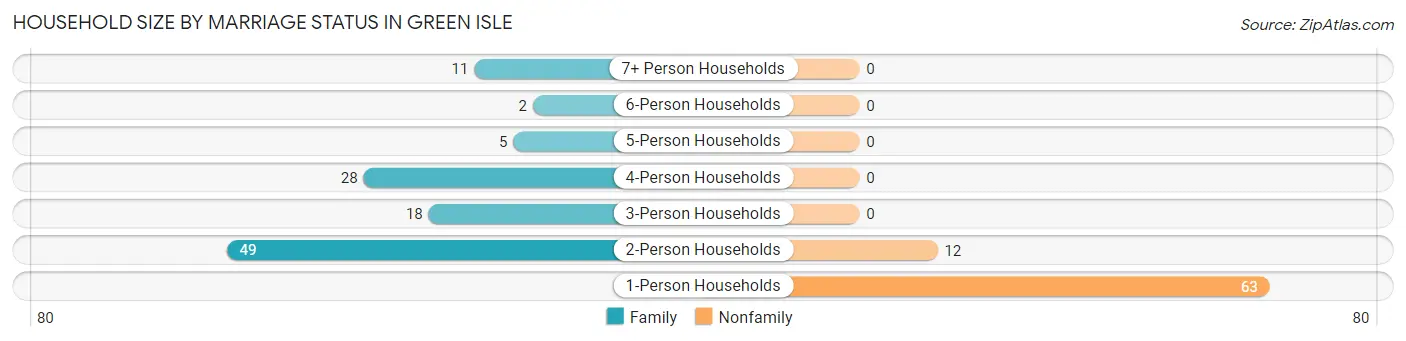
| Household Size | Family Households | Nonfamily Households |
| 1-Person Households | - | 63 (33.5%) |
| 2-Person Households | 49 (26.1%) | 12 (6.4%) |
| 3-Person Households | 18 (9.6%) | 0 (0.0%) |
| 4-Person Households | 28 (14.9%) | 0 (0.0%) |
| 5-Person Households | 5 (2.7%) | 0 (0.0%) |
| 6-Person Households | 2 (1.1%) | 0 (0.0%) |
| 7+ Person Households | 11 (5.9%) | 0 (0.0%) |
| Total | 113 (60.1%) | 75 (39.9%) |
Female Fertility in Green Isle
Fertility by Age in Green Isle
Average fertility rate in Green Isle is 69.0 births per 1,000 women. Women in the age bracket of 20 to 34 years have the highest fertility rate with 163.0 births per 1,000 women. Women in the age bracket of 20 to 34 years acount for 100.0% of all women with births.
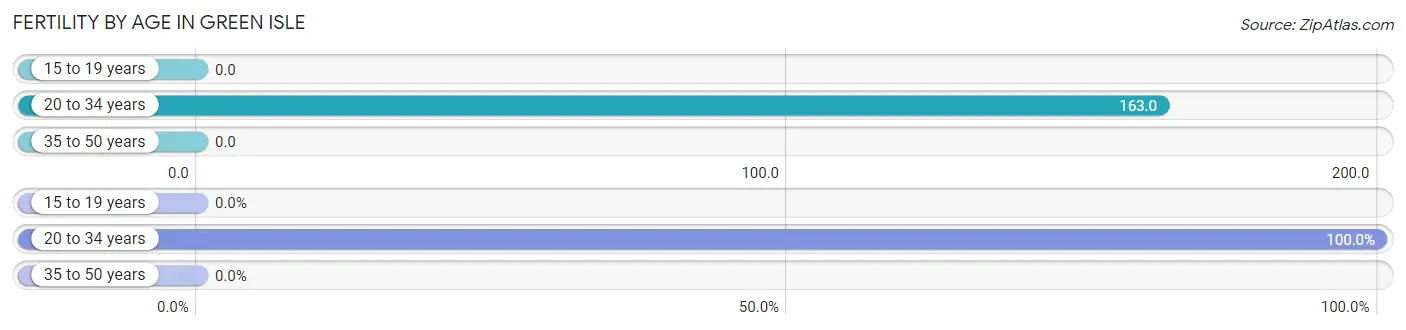
| Age Bracket | Women with Births | Births / 1,000 Women |
| 15 to 19 years | 0 (0.0%) | 0.0 |
| 20 to 34 years | 7 (100.0%) | 163.0 |
| 35 to 50 years | 0 (0.0%) | 0.0 |
| Total | 7 (100.0%) | 69.0 |
Fertility by Age by Marriage Status in Green Isle
71.4% of women with births (7) in Green Isle are married. The highest percentage of unmarried women with births falls into 20 to 34 years age bracket with 28.6% of them unmarried at the time of birth, while the lowest percentage of unmarried women with births belong to 20 to 34 years age bracket with 28.6% of them unmarried.
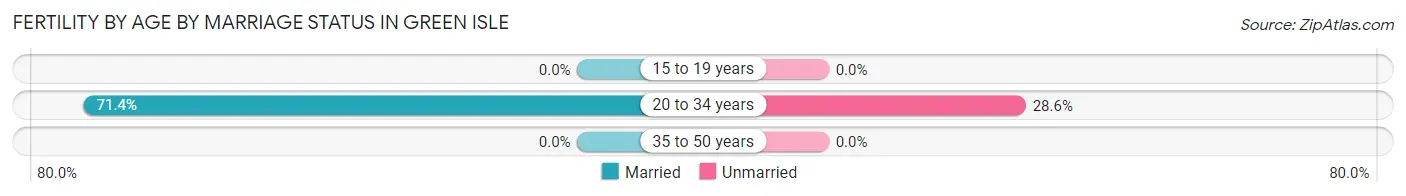
| Age Bracket | Married | Unmarried |
| 15 to 19 years | 0 (0.0%) | 0 (0.0%) |
| 20 to 34 years | 5 (71.4%) | 2 (28.6%) |
| 35 to 50 years | 0 (0.0%) | 0 (0.0%) |
| Total | 5 (71.4%) | 2 (28.6%) |
Fertility by Education in Green Isle
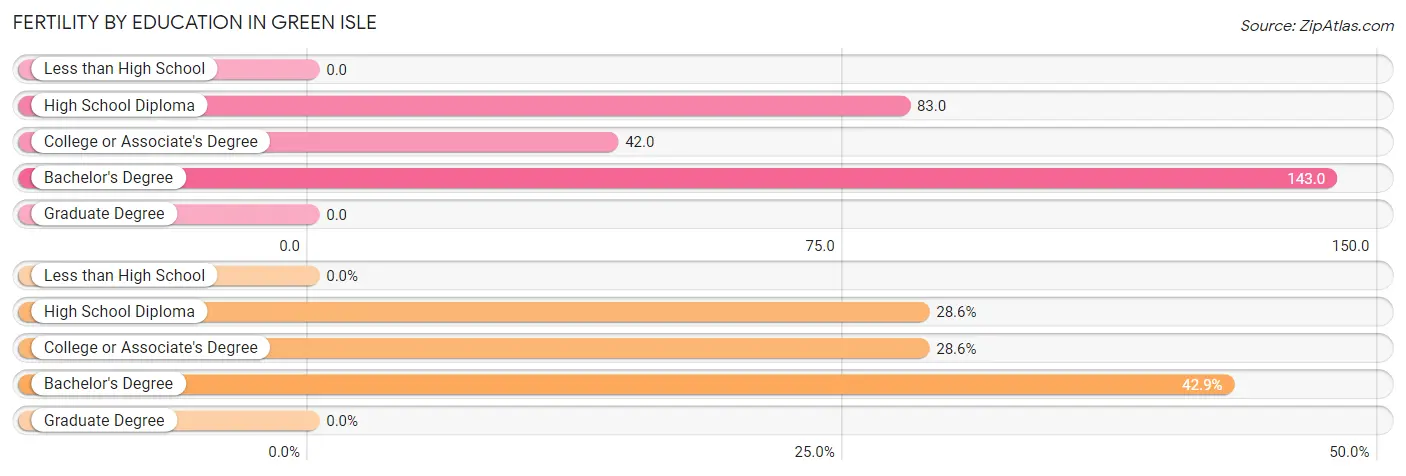
| Educational Attainment | Women with Births | Births / 1,000 Women |
| Less than High School | 0 (0.0%) | 0.0 |
| High School Diploma | 2 (28.6%) | 83.0 |
| College or Associate's Degree | 2 (28.6%) | 42.0 |
| Bachelor's Degree | 3 (42.9%) | 143.0 |
| Graduate Degree | 0 (0.0%) | 0.0 |
| Total | 7 (100.0%) | 69.0 |
Fertility by Education by Marriage Status in Green Isle
28.6% of women with births in Green Isle are unmarried. Women with the educational attainment of high school diploma are most likely to be married with 100.0% of them married at childbirth, while women with the educational attainment of college or associate's degree are least likely to be married with 100.0% of them unmarried at childbirth.
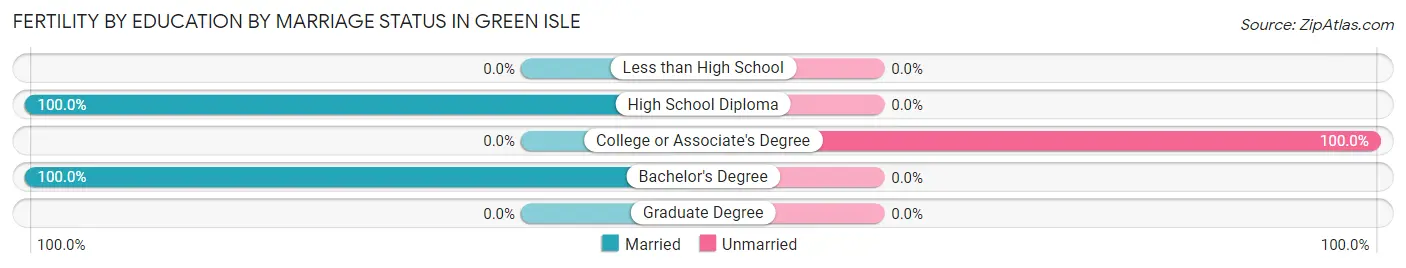
| Educational Attainment | Married | Unmarried |
| Less than High School | 0 (0.0%) | 0 (0.0%) |
| High School Diploma | 2 (100.0%) | 0 (0.0%) |
| College or Associate's Degree | 0 (0.0%) | 2 (100.0%) |
| Bachelor's Degree | 3 (100.0%) | 0 (0.0%) |
| Graduate Degree | 0 (0.0%) | 0 (0.0%) |
| Total | 5 (71.4%) | 2 (28.6%) |
Employment Characteristics in Green Isle
Employment by Class of Employer in Green Isle
Among the 280 employed individuals in Green Isle, private company employees (215 | 76.8%), not-for-profit organizations (16 | 5.7%), and self-employed (not incorporated) (15 | 5.4%) make up the most common classes of employment.
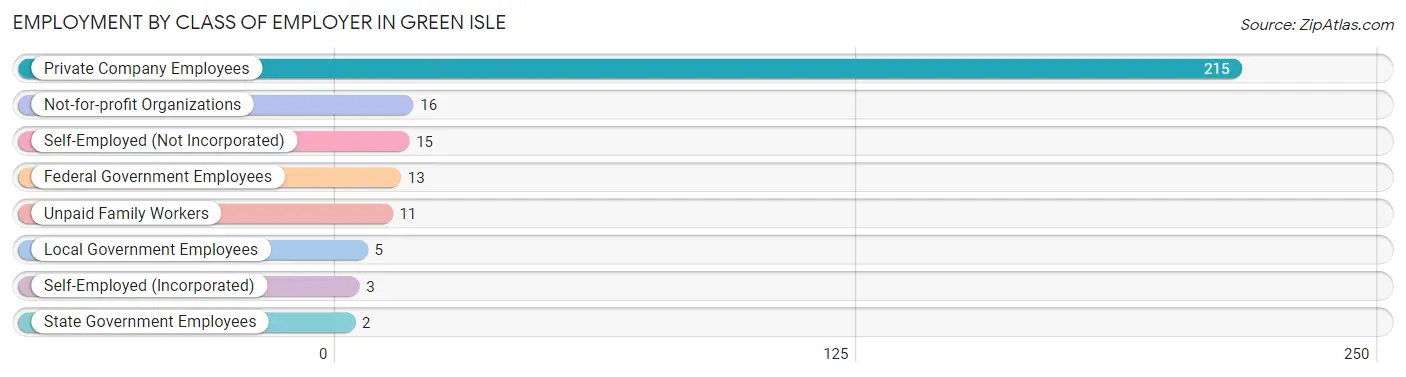
| Employer Class | # Employees | % Employees |
| Private Company Employees | 215 | 76.8% |
| Self-Employed (Incorporated) | 3 | 1.1% |
| Self-Employed (Not Incorporated) | 15 | 5.4% |
| Not-for-profit Organizations | 16 | 5.7% |
| Local Government Employees | 5 | 1.8% |
| State Government Employees | 2 | 0.7% |
| Federal Government Employees | 13 | 4.6% |
| Unpaid Family Workers | 11 | 3.9% |
| Total | 280 | 100.0% |
Employment Status by Age in Green Isle
According to the labor force statistics for Green Isle, out of the total population over 16 years of age (372), 76.1% or 283 individuals are in the labor force, with 1.1% or 3 of them unemployed. The age group with the highest labor force participation rate is 20 to 24 years, with 100.0% or 36 individuals in the labor force. Within the labor force, the 30 to 34 years age range has the highest percentage of unemployed individuals, with 8.3% or 2 of them being unemployed.
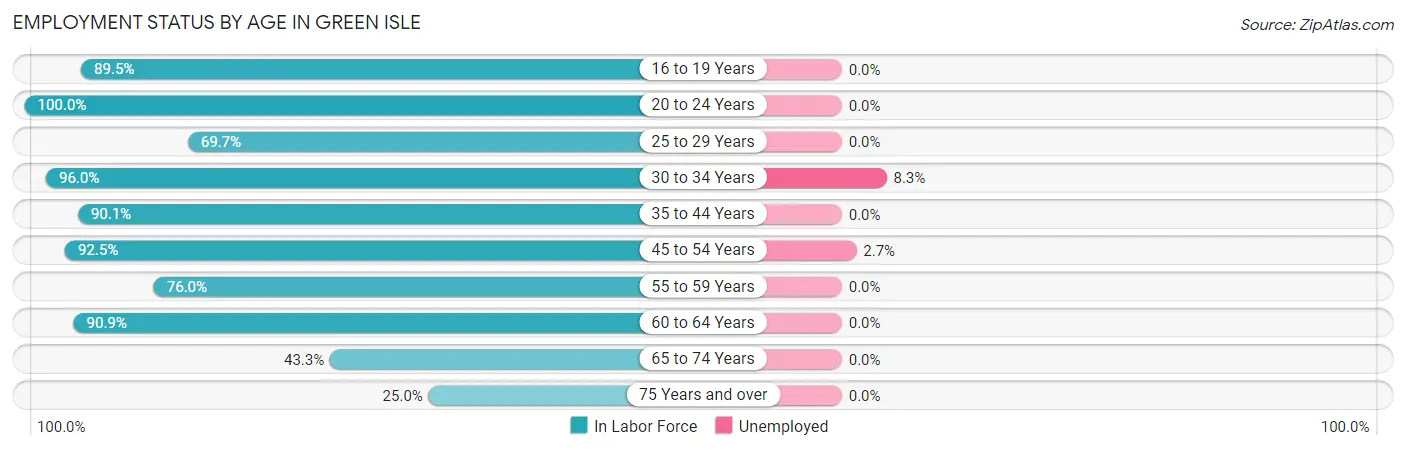
| Age Bracket | In Labor Force | Unemployed |
| 16 to 19 Years | 17 (89.5%) | 0 (0.0%) |
| 20 to 24 Years | 36 (100.0%) | 0 (0.0%) |
| 25 to 29 Years | 23 (69.7%) | 0 (0.0%) |
| 30 to 34 Years | 24 (96.0%) | 2 (8.3%) |
| 35 to 44 Years | 91 (90.1%) | 0 (0.0%) |
| 45 to 54 Years | 37 (92.5%) | 1 (2.7%) |
| 55 to 59 Years | 19 (76.0%) | 0 (0.0%) |
| 60 to 64 Years | 10 (90.9%) | 0 (0.0%) |
| 65 to 74 Years | 13 (43.3%) | 0 (0.0%) |
| 75 Years and over | 13 (25.0%) | 0 (0.0%) |
| Total | 283 (76.1%) | 3 (1.1%) |
Employment Status by Educational Attainment in Green Isle
According to labor force statistics for Green Isle, 86.8% of individuals (204) out of the total population between 25 and 64 years of age (235) are in the labor force, with 1.5% or 3 of them being unemployed. The group with the highest labor force participation rate are those with the educational attainment of bachelor's degree or higher, with 97.7% or 42 individuals in the labor force. Within the labor force, individuals with college / associate degree education have the highest percentage of unemployment, with 2.9% or 2 of them being unemployed.
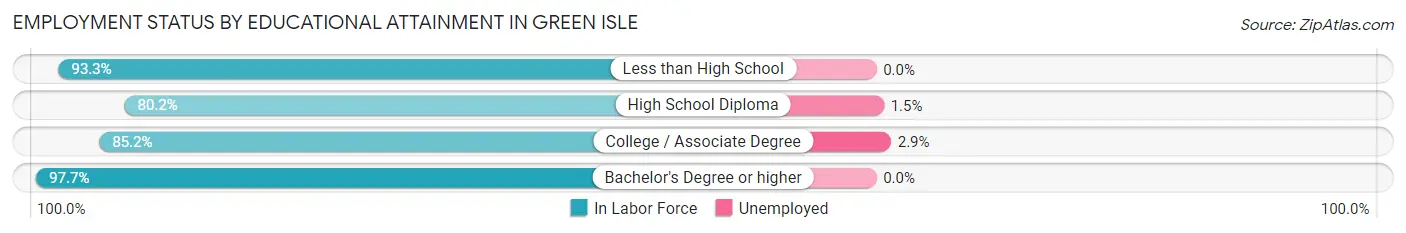
| Educational Attainment | In Labor Force | Unemployed |
| Less than High School | 28 (93.3%) | 0 (0.0%) |
| High School Diploma | 65 (80.2%) | 1 (1.5%) |
| College / Associate Degree | 69 (85.2%) | 2 (2.9%) |
| Bachelor's Degree or higher | 42 (97.7%) | 0 (0.0%) |
| Total | 204 (86.8%) | 4 (1.5%) |
Employment Occupations by Sex in Green Isle
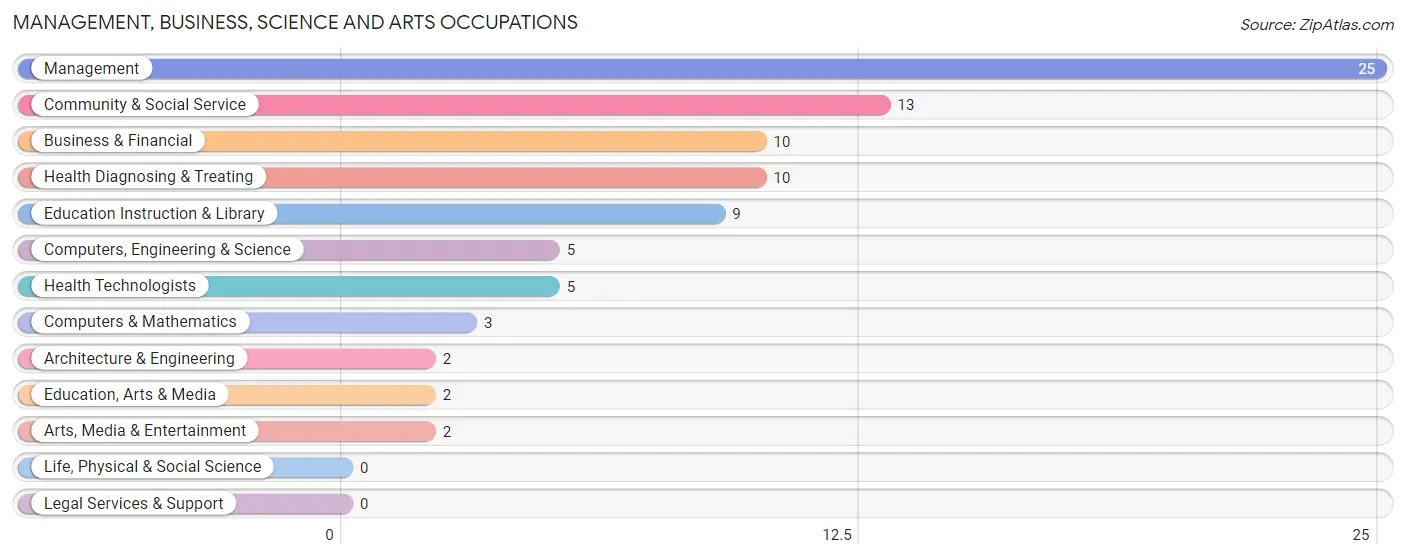
Management, Business, Science and Arts Occupations
The most common Management, Business, Science and Arts occupations in Green Isle are Management (25 | 8.9%), Community & Social Service (13 | 4.6%), Business & Financial (10 | 3.6%), Health Diagnosing & Treating (10 | 3.6%), and Education Instruction & Library (9 | 3.2%).
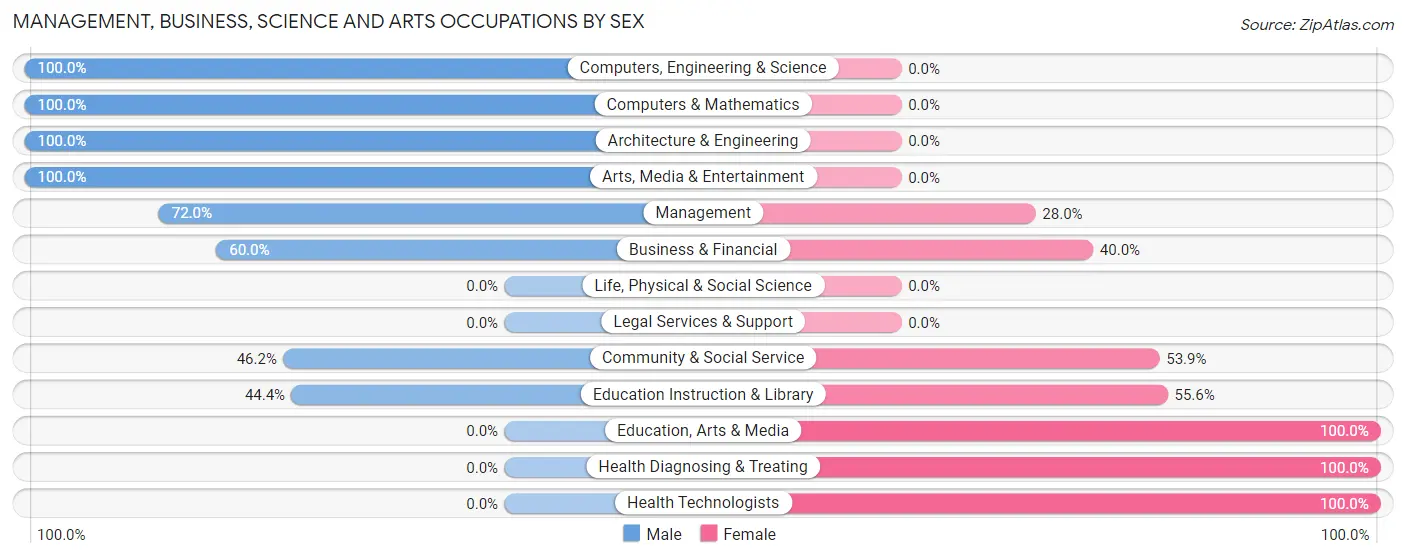
Management, Business, Science and Arts Occupations by Sex
Within the Management, Business, Science and Arts occupations in Green Isle, the most male-oriented occupations are Computers, Engineering & Science (100.0%), Computers & Mathematics (100.0%), and Architecture & Engineering (100.0%), while the most female-oriented occupations are Education, Arts & Media (100.0%), Health Diagnosing & Treating (100.0%), and Health Technologists (100.0%).
| Occupation | Male | Female |
| Management | 18 (72.0%) | 7 (28.0%) |
| Business & Financial | 6 (60.0%) | 4 (40.0%) |
| Computers, Engineering & Science | 5 (100.0%) | 0 (0.0%) |
| Computers & Mathematics | 3 (100.0%) | 0 (0.0%) |
| Architecture & Engineering | 2 (100.0%) | 0 (0.0%) |
| Life, Physical & Social Science | 0 (0.0%) | 0 (0.0%) |
| Community & Social Service | 6 (46.2%) | 7 (53.8%) |
| Education, Arts & Media | 0 (0.0%) | 2 (100.0%) |
| Legal Services & Support | 0 (0.0%) | 0 (0.0%) |
| Education Instruction & Library | 4 (44.4%) | 5 (55.6%) |
| Arts, Media & Entertainment | 2 (100.0%) | 0 (0.0%) |
| Health Diagnosing & Treating | 0 (0.0%) | 10 (100.0%) |
| Health Technologists | 0 (0.0%) | 5 (100.0%) |
| Total (Category) | 35 (55.6%) | 28 (44.4%) |
| Total (Overall) | 171 (61.1%) | 109 (38.9%) |
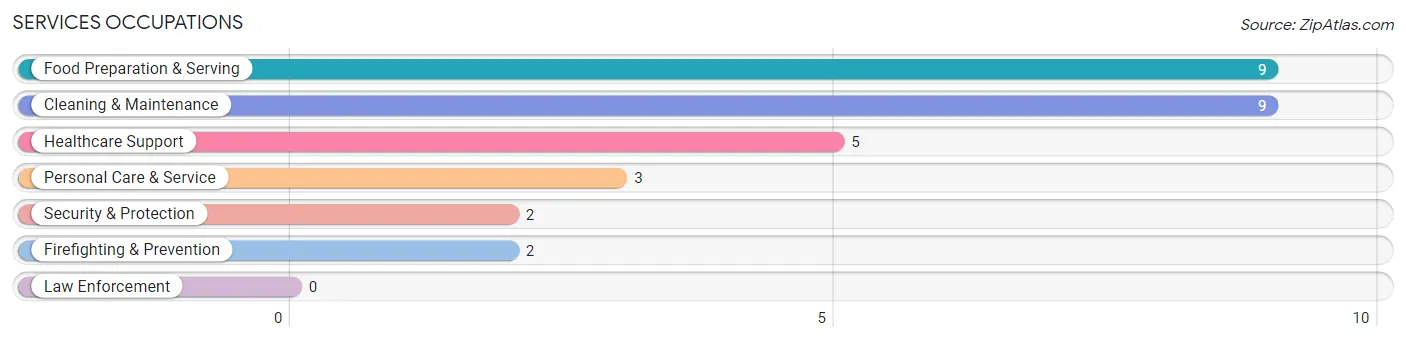
Services Occupations
The most common Services occupations in Green Isle are Food Preparation & Serving (9 | 3.2%), Cleaning & Maintenance (9 | 3.2%), Healthcare Support (5 | 1.8%), Personal Care & Service (3 | 1.1%), and Security & Protection (2 | 0.7%).
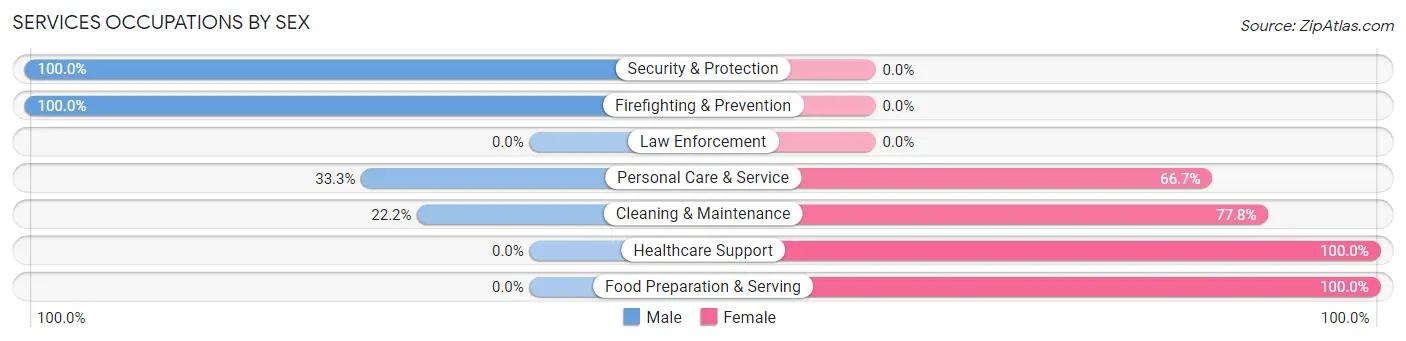
Services Occupations by Sex
Within the Services occupations in Green Isle, the most male-oriented occupations are Security & Protection (100.0%), Firefighting & Prevention (100.0%), and Personal Care & Service (33.3%), while the most female-oriented occupations are Healthcare Support (100.0%), Food Preparation & Serving (100.0%), and Cleaning & Maintenance (77.8%).
| Occupation | Male | Female |
| Healthcare Support | 0 (0.0%) | 5 (100.0%) |
| Security & Protection | 2 (100.0%) | 0 (0.0%) |
| Firefighting & Prevention | 2 (100.0%) | 0 (0.0%) |
| Law Enforcement | 0 (0.0%) | 0 (0.0%) |
| Food Preparation & Serving | 0 (0.0%) | 9 (100.0%) |
| Cleaning & Maintenance | 2 (22.2%) | 7 (77.8%) |
| Personal Care & Service | 1 (33.3%) | 2 (66.7%) |
| Total (Category) | 5 (17.9%) | 23 (82.1%) |
| Total (Overall) | 171 (61.1%) | 109 (38.9%) |
Sales and Office Occupations
The most common Sales and Office occupations in Green Isle are Office & Administration (52 | 18.6%), and Sales & Related (22 | 7.9%).

Sales and Office Occupations by Sex
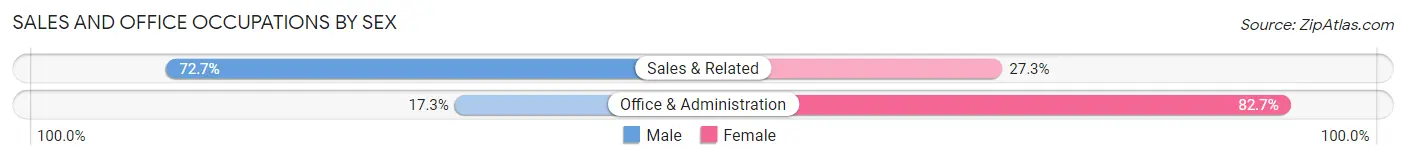
| Occupation | Male | Female |
| Sales & Related | 16 (72.7%) | 6 (27.3%) |
| Office & Administration | 9 (17.3%) | 43 (82.7%) |
| Total (Category) | 25 (33.8%) | 49 (66.2%) |
| Total (Overall) | 171 (61.1%) | 109 (38.9%) |
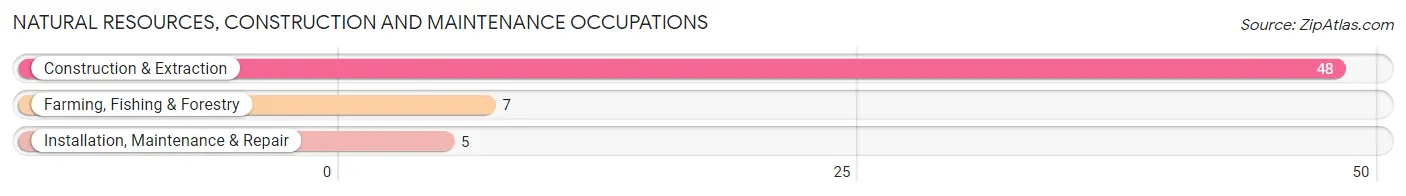
Natural Resources, Construction and Maintenance Occupations
The most common Natural Resources, Construction and Maintenance occupations in Green Isle are Construction & Extraction (48 | 17.1%), Farming, Fishing & Forestry (7 | 2.5%), and Installation, Maintenance & Repair (5 | 1.8%).
Natural Resources, Construction and Maintenance Occupations by Sex
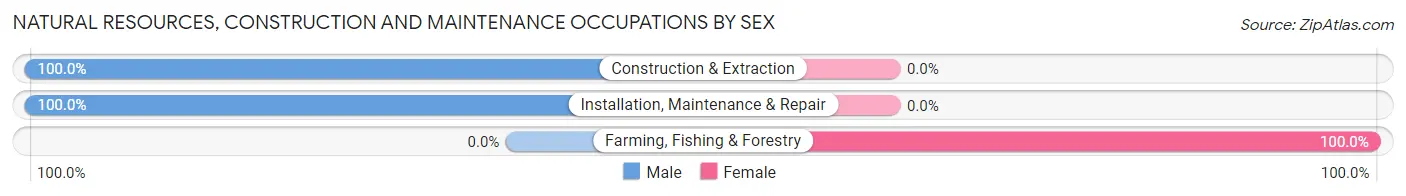
| Occupation | Male | Female |
| Farming, Fishing & Forestry | 0 (0.0%) | 7 (100.0%) |
| Construction & Extraction | 48 (100.0%) | 0 (0.0%) |
| Installation, Maintenance & Repair | 5 (100.0%) | 0 (0.0%) |
| Total (Category) | 53 (88.3%) | 7 (11.7%) |
| Total (Overall) | 171 (61.1%) | 109 (38.9%) |
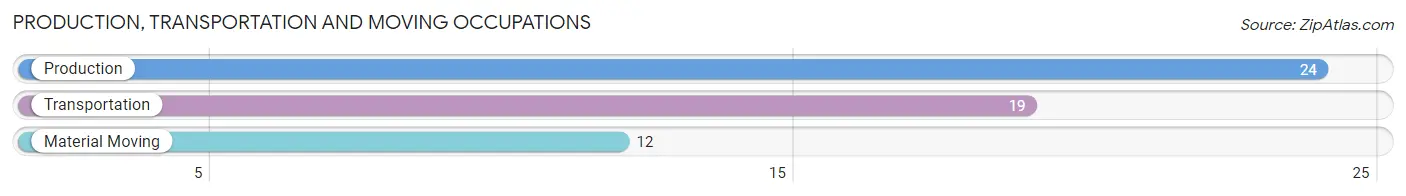
Production, Transportation and Moving Occupations
The most common Production, Transportation and Moving occupations in Green Isle are Production (24 | 8.6%), Transportation (19 | 6.8%), and Material Moving (12 | 4.3%).
Production, Transportation and Moving Occupations by Sex
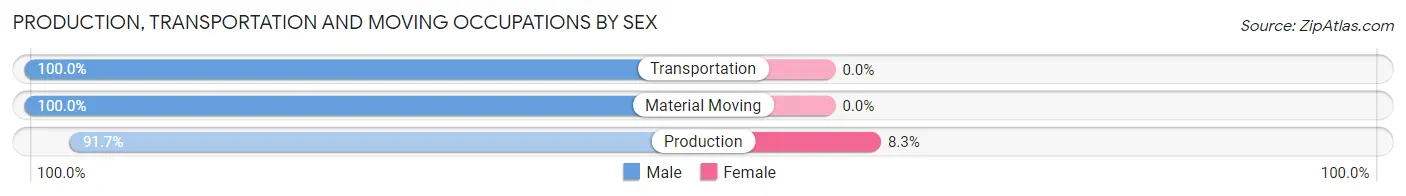
| Occupation | Male | Female |
| Production | 22 (91.7%) | 2 (8.3%) |
| Transportation | 19 (100.0%) | 0 (0.0%) |
| Material Moving | 12 (100.0%) | 0 (0.0%) |
| Total (Category) | 53 (96.4%) | 2 (3.6%) |
| Total (Overall) | 171 (61.1%) | 109 (38.9%) |
Employment Industries by Sex in Green Isle
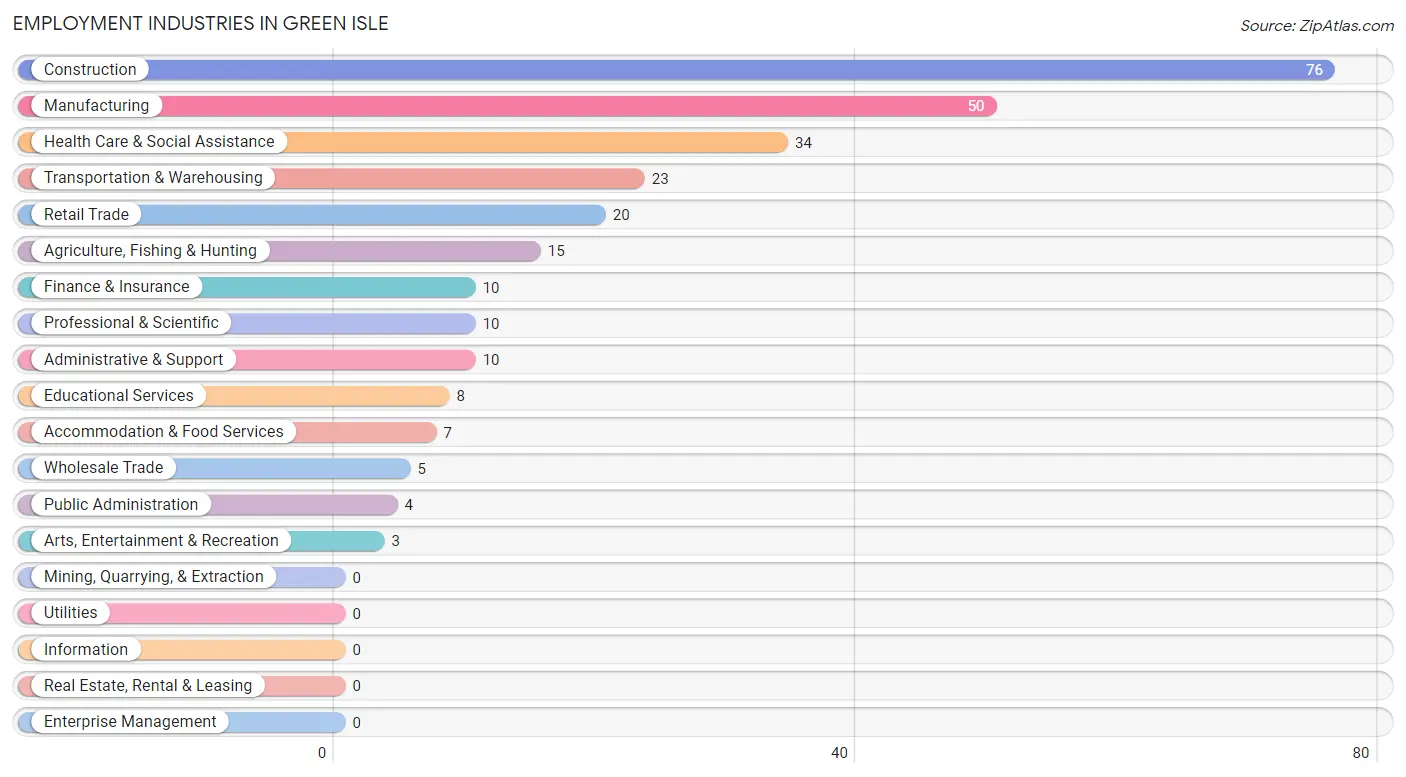
Employment Industries in Green Isle
The major employment industries in Green Isle include Construction (76 | 27.1%), Manufacturing (50 | 17.9%), Health Care & Social Assistance (34 | 12.1%), Transportation & Warehousing (23 | 8.2%), and Retail Trade (20 | 7.1%).
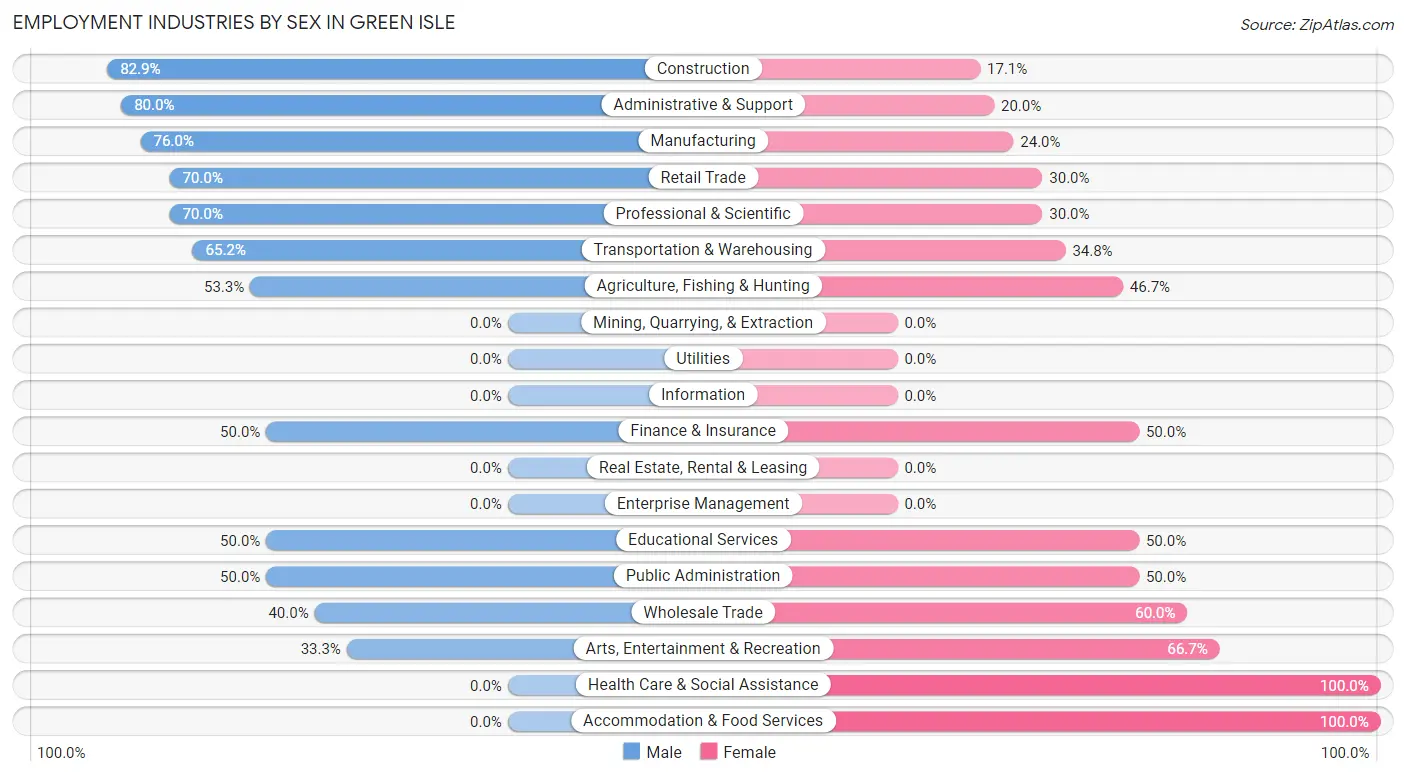
Employment Industries by Sex in Green Isle
The Green Isle industries that see more men than women are Construction (82.9%), Administrative & Support (80.0%), and Manufacturing (76.0%), whereas the industries that tend to have a higher number of women are Health Care & Social Assistance (100.0%), Accommodation & Food Services (100.0%), and Arts, Entertainment & Recreation (66.7%).
| Industry | Male | Female |
| Agriculture, Fishing & Hunting | 8 (53.3%) | 7 (46.7%) |
| Mining, Quarrying, & Extraction | 0 (0.0%) | 0 (0.0%) |
| Construction | 63 (82.9%) | 13 (17.1%) |
| Manufacturing | 38 (76.0%) | 12 (24.0%) |
| Wholesale Trade | 2 (40.0%) | 3 (60.0%) |
| Retail Trade | 14 (70.0%) | 6 (30.0%) |
| Transportation & Warehousing | 15 (65.2%) | 8 (34.8%) |
| Utilities | 0 (0.0%) | 0 (0.0%) |
| Information | 0 (0.0%) | 0 (0.0%) |
| Finance & Insurance | 5 (50.0%) | 5 (50.0%) |
| Real Estate, Rental & Leasing | 0 (0.0%) | 0 (0.0%) |
| Professional & Scientific | 7 (70.0%) | 3 (30.0%) |
| Enterprise Management | 0 (0.0%) | 0 (0.0%) |
| Administrative & Support | 8 (80.0%) | 2 (20.0%) |
| Educational Services | 4 (50.0%) | 4 (50.0%) |
| Health Care & Social Assistance | 0 (0.0%) | 34 (100.0%) |
| Arts, Entertainment & Recreation | 1 (33.3%) | 2 (66.7%) |
| Accommodation & Food Services | 0 (0.0%) | 7 (100.0%) |
| Public Administration | 2 (50.0%) | 2 (50.0%) |
| Total | 171 (61.1%) | 109 (38.9%) |
Education in Green Isle
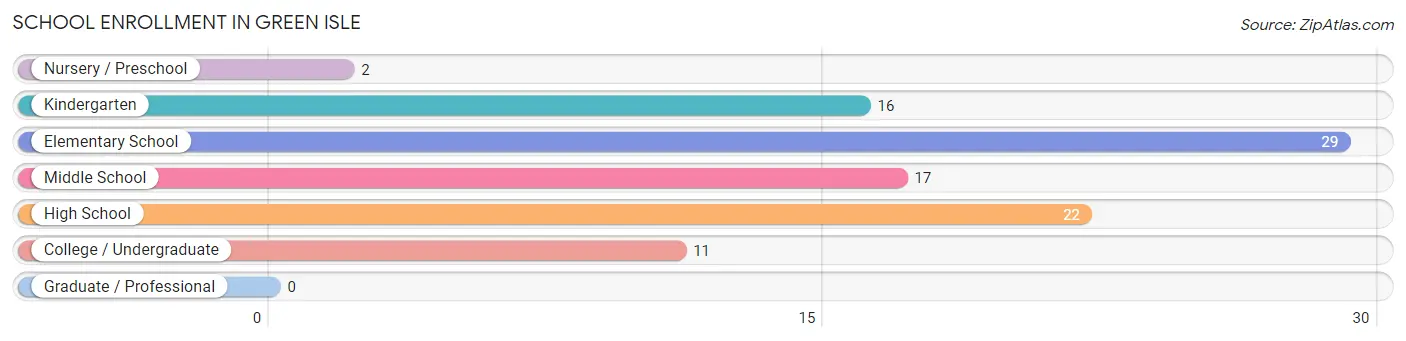
School Enrollment in Green Isle
The most common levels of schooling among the 97 students in Green Isle are elementary school (29 | 29.9%), high school (22 | 22.7%), and middle school (17 | 17.5%).
| School Level | # Students | % Students |
| Nursery / Preschool | 2 | 2.1% |
| Kindergarten | 16 | 16.5% |
| Elementary School | 29 | 29.9% |
| Middle School | 17 | 17.5% |
| High School | 22 | 22.7% |
| College / Undergraduate | 11 | 11.3% |
| Graduate / Professional | 0 | 0.0% |
| Total | 97 | 100.0% |
School Enrollment by Age by Funding Source in Green Isle
Out of a total of 97 students who are enrolled in schools in Green Isle, 13 (13.4%) attend a private institution, while the remaining 84 (86.6%) are enrolled in public schools. The age group of 15 to 17 year olds has the highest likelihood of being enrolled in private schools, with 6 (33.3% in the age bracket) enrolled. Conversely, the age group of 3 to 4 year olds has the lowest likelihood of being enrolled in a private school, with 5 (100.0% in the age bracket) attending a public institution.
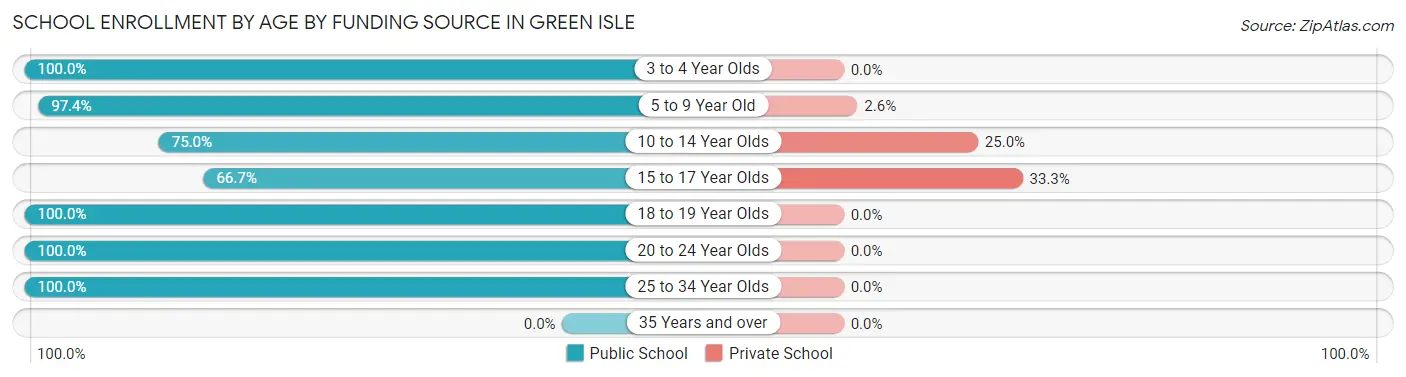
| Age Bracket | Public School | Private School |
| 3 to 4 Year Olds | 5 (100.0%) | 0 (0.0%) |
| 5 to 9 Year Old | 38 (97.4%) | 1 (2.6%) |
| 10 to 14 Year Olds | 18 (75.0%) | 6 (25.0%) |
| 15 to 17 Year Olds | 12 (66.7%) | 6 (33.3%) |
| 18 to 19 Year Olds | 2 (100.0%) | 0 (0.0%) |
| 20 to 24 Year Olds | 7 (100.0%) | 0 (0.0%) |
| 25 to 34 Year Olds | 2 (100.0%) | 0 (0.0%) |
| 35 Years and over | 0 (0.0%) | 0 (0.0%) |
| Total | 84 (86.6%) | 13 (13.4%) |
Educational Attainment by Field of Study in Green Isle
Business (16 | 29.6%), communications (11 | 20.4%), arts & humanities (6 | 11.1%), psychology (4 | 7.4%), and education (4 | 7.4%) are the most common fields of study among 54 individuals in Green Isle who have obtained a bachelor's degree or higher.
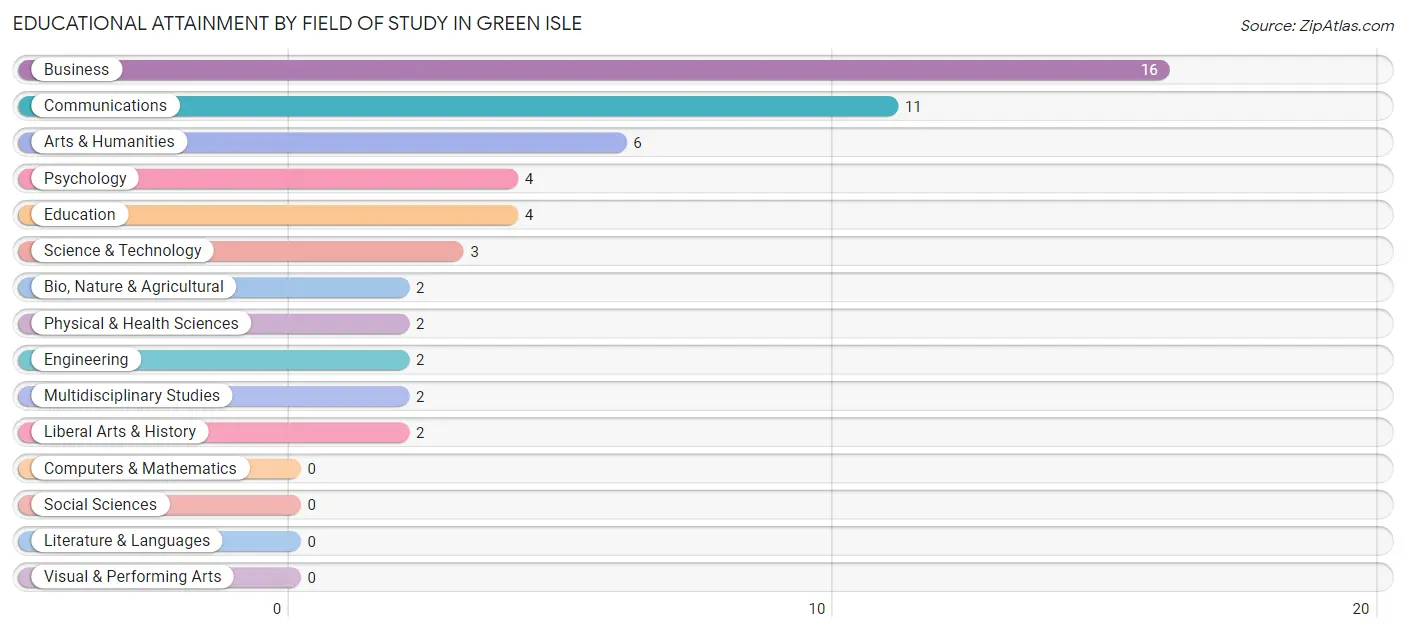
| Field of Study | # Graduates | % Graduates |
| Computers & Mathematics | 0 | 0.0% |
| Bio, Nature & Agricultural | 2 | 3.7% |
| Physical & Health Sciences | 2 | 3.7% |
| Psychology | 4 | 7.4% |
| Social Sciences | 0 | 0.0% |
| Engineering | 2 | 3.7% |
| Multidisciplinary Studies | 2 | 3.7% |
| Science & Technology | 3 | 5.6% |
| Business | 16 | 29.6% |
| Education | 4 | 7.4% |
| Literature & Languages | 0 | 0.0% |
| Liberal Arts & History | 2 | 3.7% |
| Visual & Performing Arts | 0 | 0.0% |
| Communications | 11 | 20.4% |
| Arts & Humanities | 6 | 11.1% |
| Total | 54 | 100.0% |
Transportation & Commute in Green Isle
Vehicle Availability by Sex in Green Isle
The most prevalent vehicle ownership categories in Green Isle are males with 3 vehicles (53, accounting for 31.0%) and females with 3 vehicles (35, making up 48.6%).
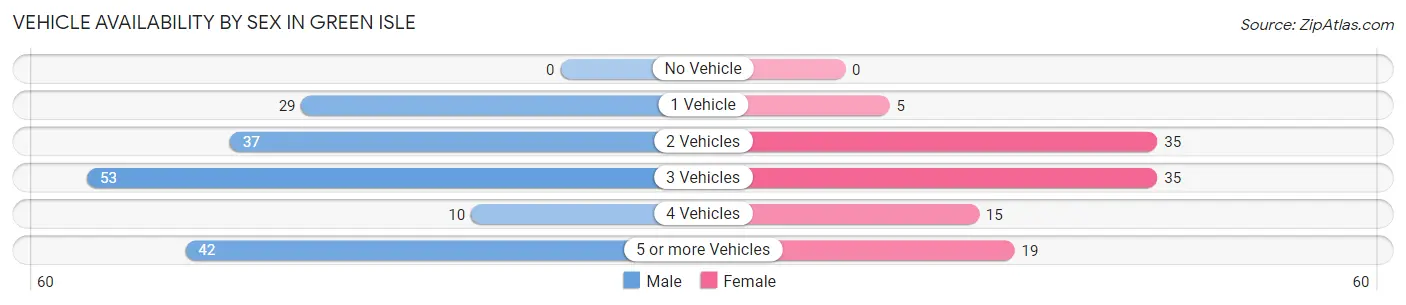
| Vehicles Available | Male | Female |
| No Vehicle | 0 (0.0%) | 0 (0.0%) |
| 1 Vehicle | 29 (17.0%) | 5 (4.6%) |
| 2 Vehicles | 37 (21.6%) | 35 (32.1%) |
| 3 Vehicles | 53 (31.0%) | 35 (32.1%) |
| 4 Vehicles | 10 (5.9%) | 15 (13.8%) |
| 5 or more Vehicles | 42 (24.6%) | 19 (17.4%) |
| Total | 171 (100.0%) | 109 (100.0%) |
Commute Time in Green Isle
The most frequently occuring commute durations in Green Isle are 45 to 59 minutes (47 commuters, 18.0%), 5 to 9 minutes (36 commuters, 13.8%), and 35 to 39 minutes (35 commuters, 13.4%).
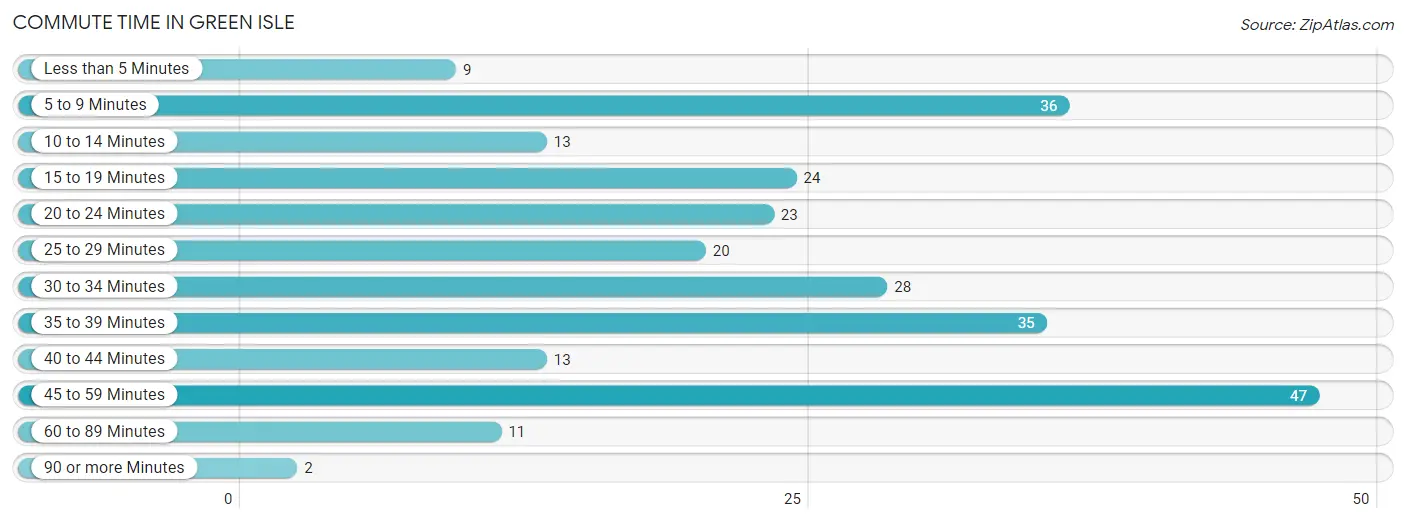
| Commute Time | # Commuters | % Commuters |
| Less than 5 Minutes | 9 | 3.5% |
| 5 to 9 Minutes | 36 | 13.8% |
| 10 to 14 Minutes | 13 | 5.0% |
| 15 to 19 Minutes | 24 | 9.2% |
| 20 to 24 Minutes | 23 | 8.8% |
| 25 to 29 Minutes | 20 | 7.7% |
| 30 to 34 Minutes | 28 | 10.7% |
| 35 to 39 Minutes | 35 | 13.4% |
| 40 to 44 Minutes | 13 | 5.0% |
| 45 to 59 Minutes | 47 | 18.0% |
| 60 to 89 Minutes | 11 | 4.2% |
| 90 or more Minutes | 2 | 0.8% |
Commute Time by Sex in Green Isle
The most common commute times in Green Isle are 5 to 9 minutes (36 commuters, 22.0%) for males and 35 to 39 minutes (22 commuters, 22.7%) for females.
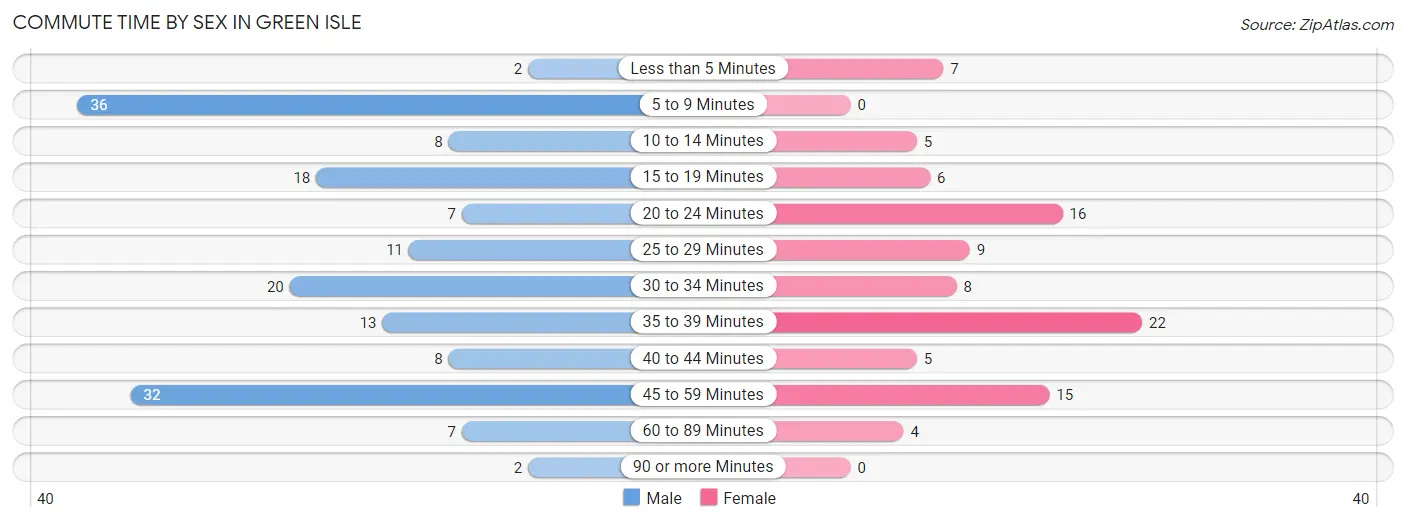
| Commute Time | Male | Female |
| Less than 5 Minutes | 2 (1.2%) | 7 (7.2%) |
| 5 to 9 Minutes | 36 (22.0%) | 0 (0.0%) |
| 10 to 14 Minutes | 8 (4.9%) | 5 (5.1%) |
| 15 to 19 Minutes | 18 (11.0%) | 6 (6.2%) |
| 20 to 24 Minutes | 7 (4.3%) | 16 (16.5%) |
| 25 to 29 Minutes | 11 (6.7%) | 9 (9.3%) |
| 30 to 34 Minutes | 20 (12.2%) | 8 (8.3%) |
| 35 to 39 Minutes | 13 (7.9%) | 22 (22.7%) |
| 40 to 44 Minutes | 8 (4.9%) | 5 (5.1%) |
| 45 to 59 Minutes | 32 (19.5%) | 15 (15.5%) |
| 60 to 89 Minutes | 7 (4.3%) | 4 (4.1%) |
| 90 or more Minutes | 2 (1.2%) | 0 (0.0%) |
Time of Departure to Work by Sex in Green Isle
The most frequent times of departure to work in Green Isle are 12:00 AM to 4:59 AM (38, 23.2%) for males and 7:30 AM to 7:59 AM (27, 27.8%) for females.
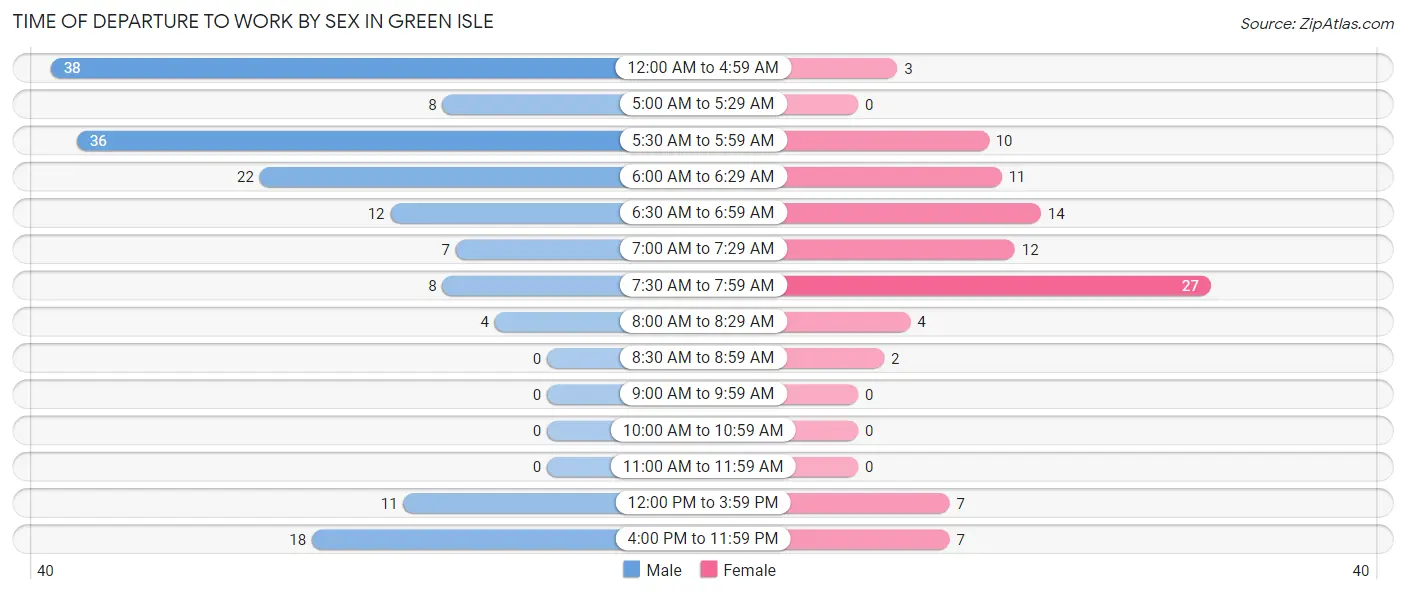
| Time of Departure | Male | Female |
| 12:00 AM to 4:59 AM | 38 (23.2%) | 3 (3.1%) |
| 5:00 AM to 5:29 AM | 8 (4.9%) | 0 (0.0%) |
| 5:30 AM to 5:59 AM | 36 (22.0%) | 10 (10.3%) |
| 6:00 AM to 6:29 AM | 22 (13.4%) | 11 (11.3%) |
| 6:30 AM to 6:59 AM | 12 (7.3%) | 14 (14.4%) |
| 7:00 AM to 7:29 AM | 7 (4.3%) | 12 (12.4%) |
| 7:30 AM to 7:59 AM | 8 (4.9%) | 27 (27.8%) |
| 8:00 AM to 8:29 AM | 4 (2.4%) | 4 (4.1%) |
| 8:30 AM to 8:59 AM | 0 (0.0%) | 2 (2.1%) |
| 9:00 AM to 9:59 AM | 0 (0.0%) | 0 (0.0%) |
| 10:00 AM to 10:59 AM | 0 (0.0%) | 0 (0.0%) |
| 11:00 AM to 11:59 AM | 0 (0.0%) | 0 (0.0%) |
| 12:00 PM to 3:59 PM | 11 (6.7%) | 7 (7.2%) |
| 4:00 PM to 11:59 PM | 18 (11.0%) | 7 (7.2%) |
| Total | 164 (100.0%) | 97 (100.0%) |
Housing Occupancy in Green Isle
Occupancy by Ownership in Green Isle
Of the total 188 dwellings in Green Isle, owner-occupied units account for 183 (97.3%), while renter-occupied units make up 5 (2.7%).
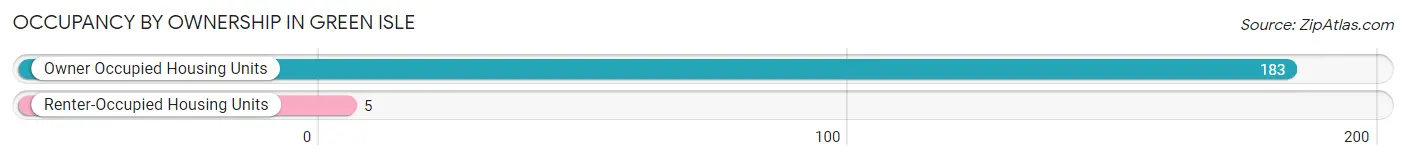
| Occupancy | # Housing Units | % Housing Units |
| Owner Occupied Housing Units | 183 | 97.3% |
| Renter-Occupied Housing Units | 5 | 2.7% |
| Total Occupied Housing Units | 188 | 100.0% |
Occupancy by Household Size in Green Isle
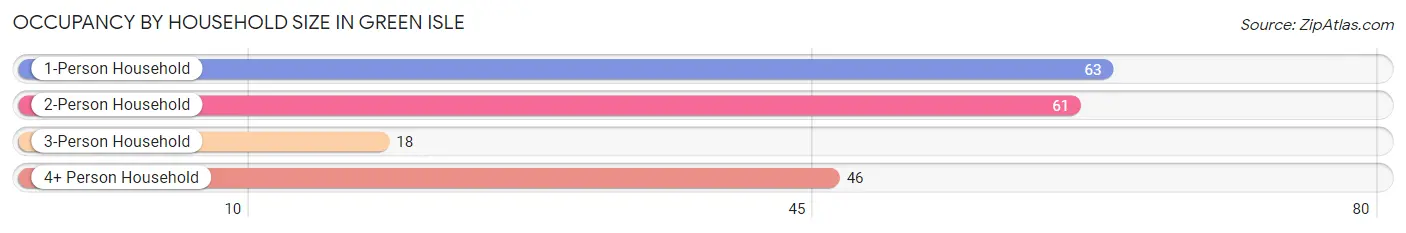
| Household Size | # Housing Units | % Housing Units |
| 1-Person Household | 63 | 33.5% |
| 2-Person Household | 61 | 32.5% |
| 3-Person Household | 18 | 9.6% |
| 4+ Person Household | 46 | 24.5% |
| Total Housing Units | 188 | 100.0% |
Occupancy by Ownership by Household Size in Green Isle
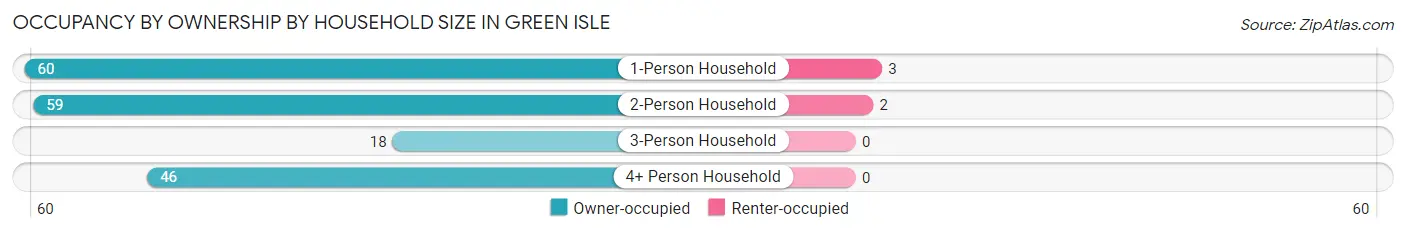
| Household Size | Owner-occupied | Renter-occupied |
| 1-Person Household | 60 (95.2%) | 3 (4.8%) |
| 2-Person Household | 59 (96.7%) | 2 (3.3%) |
| 3-Person Household | 18 (100.0%) | 0 (0.0%) |
| 4+ Person Household | 46 (100.0%) | 0 (0.0%) |
| Total Housing Units | 183 (97.3%) | 5 (2.7%) |
Occupancy by Educational Attainment in Green Isle
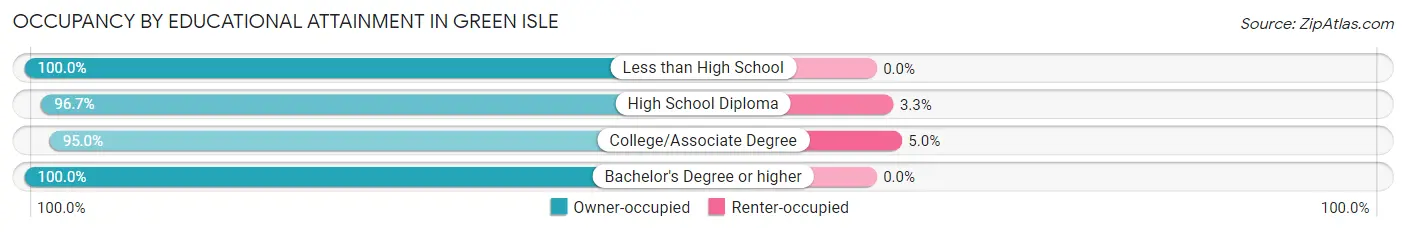
| Household Size | Owner-occupied | Renter-occupied |
| Less than High School | 38 (100.0%) | 0 (0.0%) |
| High School Diploma | 58 (96.7%) | 2 (3.3%) |
| College/Associate Degree | 57 (95.0%) | 3 (5.0%) |
| Bachelor's Degree or higher | 30 (100.0%) | 0 (0.0%) |
Occupancy by Age of Householder in Green Isle
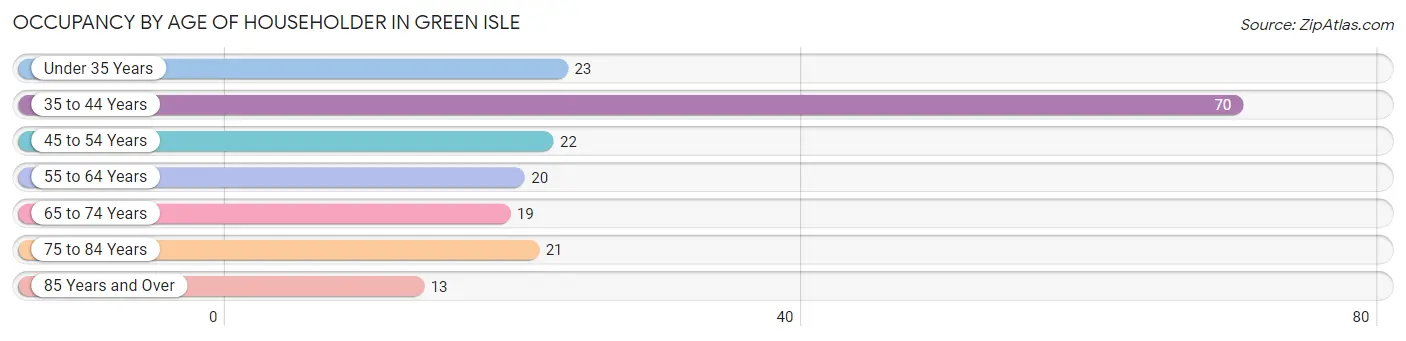
| Age Bracket | # Households | % Households |
| Under 35 Years | 23 | 12.2% |
| 35 to 44 Years | 70 | 37.2% |
| 45 to 54 Years | 22 | 11.7% |
| 55 to 64 Years | 20 | 10.6% |
| 65 to 74 Years | 19 | 10.1% |
| 75 to 84 Years | 21 | 11.2% |
| 85 Years and Over | 13 | 6.9% |
| Total | 188 | 100.0% |
Housing Finances in Green Isle
Median Income by Occupancy in Green Isle
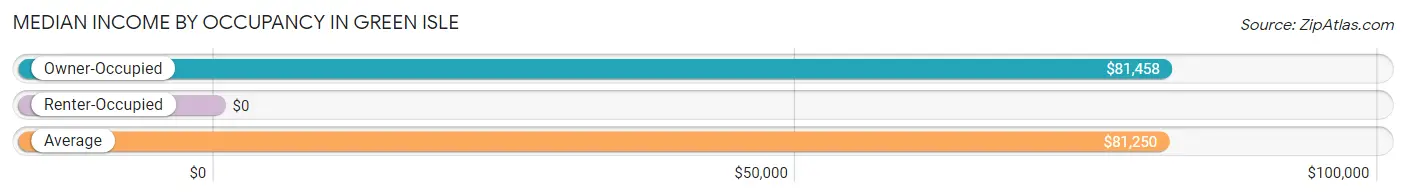
| Occupancy Type | # Households | Median Income |
| Owner-Occupied | 183 (97.3%) | $81,458 |
| Renter-Occupied | 5 (2.7%) | $0 |
| Average | 188 (100.0%) | $81,250 |
Occupancy by Householder Income Bracket in Green Isle
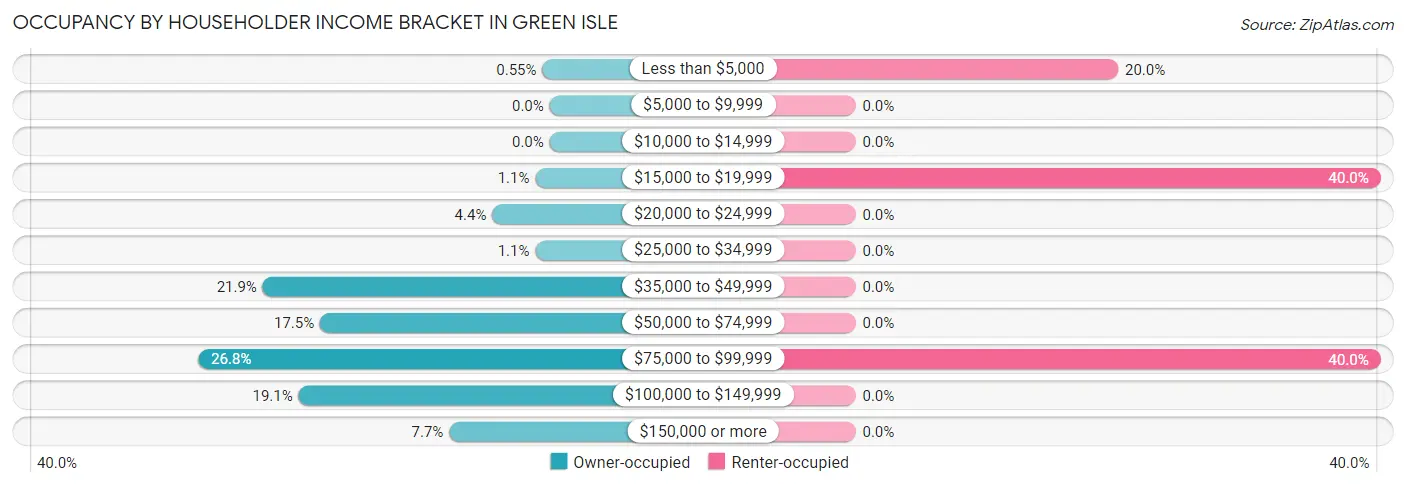
| Income Bracket | Owner-occupied | Renter-occupied |
| Less than $5,000 | 1 (0.5%) | 1 (20.0%) |
| $5,000 to $9,999 | 0 (0.0%) | 0 (0.0%) |
| $10,000 to $14,999 | 0 (0.0%) | 0 (0.0%) |
| $15,000 to $19,999 | 2 (1.1%) | 2 (40.0%) |
| $20,000 to $24,999 | 8 (4.4%) | 0 (0.0%) |
| $25,000 to $34,999 | 2 (1.1%) | 0 (0.0%) |
| $35,000 to $49,999 | 40 (21.9%) | 0 (0.0%) |
| $50,000 to $74,999 | 32 (17.5%) | 0 (0.0%) |
| $75,000 to $99,999 | 49 (26.8%) | 2 (40.0%) |
| $100,000 to $149,999 | 35 (19.1%) | 0 (0.0%) |
| $150,000 or more | 14 (7.6%) | 0 (0.0%) |
| Total | 183 (100.0%) | 5 (100.0%) |
Monthly Housing Cost Tiers in Green Isle
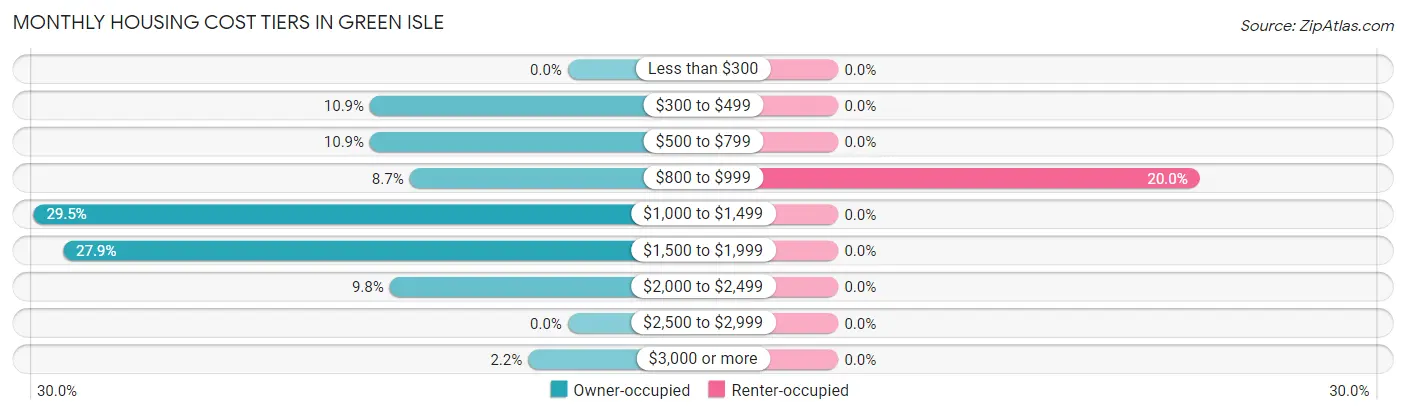
| Monthly Cost | Owner-occupied | Renter-occupied |
| Less than $300 | 0 (0.0%) | 0 (0.0%) |
| $300 to $499 | 20 (10.9%) | 0 (0.0%) |
| $500 to $799 | 20 (10.9%) | 0 (0.0%) |
| $800 to $999 | 16 (8.7%) | 1 (20.0%) |
| $1,000 to $1,499 | 54 (29.5%) | 0 (0.0%) |
| $1,500 to $1,999 | 51 (27.9%) | 0 (0.0%) |
| $2,000 to $2,499 | 18 (9.8%) | 0 (0.0%) |
| $2,500 to $2,999 | 0 (0.0%) | 0 (0.0%) |
| $3,000 or more | 4 (2.2%) | 0 (0.0%) |
| Total | 183 (100.0%) | 5 (100.0%) |
Physical Housing Characteristics in Green Isle
Housing Structures in Green Isle
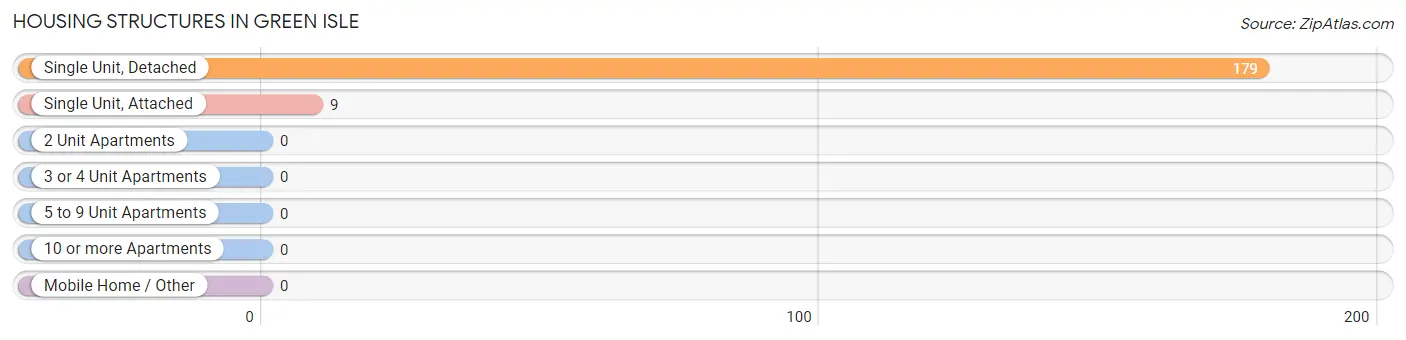
| Structure Type | # Housing Units | % Housing Units |
| Single Unit, Detached | 179 | 95.2% |
| Single Unit, Attached | 9 | 4.8% |
| 2 Unit Apartments | 0 | 0.0% |
| 3 or 4 Unit Apartments | 0 | 0.0% |
| 5 to 9 Unit Apartments | 0 | 0.0% |
| 10 or more Apartments | 0 | 0.0% |
| Mobile Home / Other | 0 | 0.0% |
| Total | 188 | 100.0% |
Housing Structures by Occupancy in Green Isle
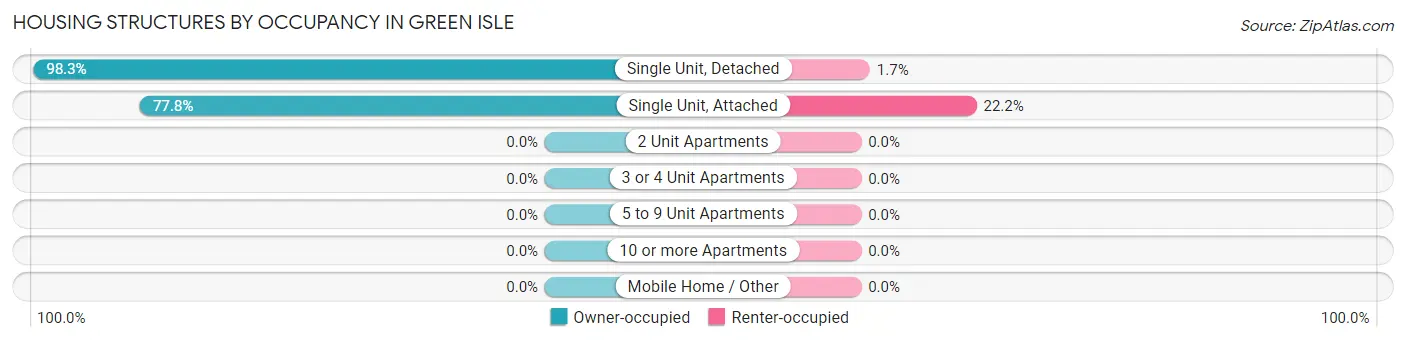
| Structure Type | Owner-occupied | Renter-occupied |
| Single Unit, Detached | 176 (98.3%) | 3 (1.7%) |
| Single Unit, Attached | 7 (77.8%) | 2 (22.2%) |
| 2 Unit Apartments | 0 (0.0%) | 0 (0.0%) |
| 3 or 4 Unit Apartments | 0 (0.0%) | 0 (0.0%) |
| 5 to 9 Unit Apartments | 0 (0.0%) | 0 (0.0%) |
| 10 or more Apartments | 0 (0.0%) | 0 (0.0%) |
| Mobile Home / Other | 0 (0.0%) | 0 (0.0%) |
| Total | 183 (97.3%) | 5 (2.7%) |
Housing Structures by Number of Rooms in Green Isle
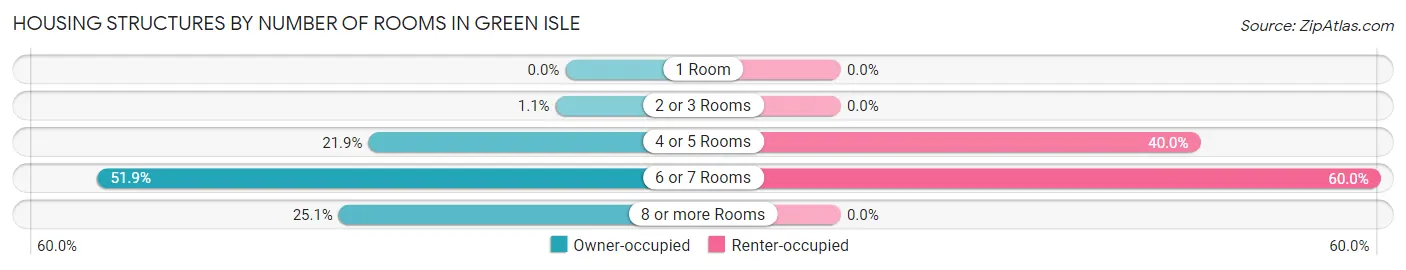
| Number of Rooms | Owner-occupied | Renter-occupied |
| 1 Room | 0 (0.0%) | 0 (0.0%) |
| 2 or 3 Rooms | 2 (1.1%) | 0 (0.0%) |
| 4 or 5 Rooms | 40 (21.9%) | 2 (40.0%) |
| 6 or 7 Rooms | 95 (51.9%) | 3 (60.0%) |
| 8 or more Rooms | 46 (25.1%) | 0 (0.0%) |
| Total | 183 (100.0%) | 5 (100.0%) |
Housing Structure by Heating Type in Green Isle
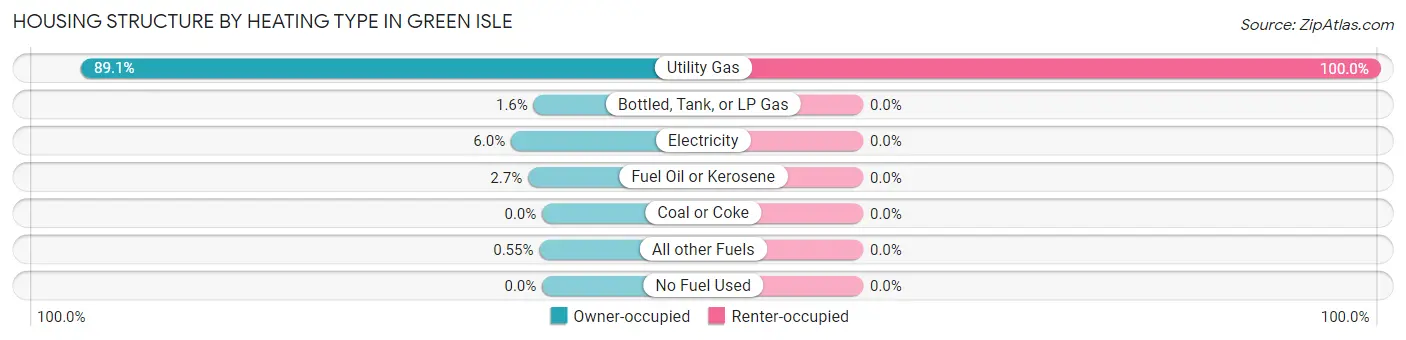
| Heating Type | Owner-occupied | Renter-occupied |
| Utility Gas | 163 (89.1%) | 5 (100.0%) |
| Bottled, Tank, or LP Gas | 3 (1.6%) | 0 (0.0%) |
| Electricity | 11 (6.0%) | 0 (0.0%) |
| Fuel Oil or Kerosene | 5 (2.7%) | 0 (0.0%) |
| Coal or Coke | 0 (0.0%) | 0 (0.0%) |
| All other Fuels | 1 (0.5%) | 0 (0.0%) |
| No Fuel Used | 0 (0.0%) | 0 (0.0%) |
| Total | 183 (100.0%) | 5 (100.0%) |
Household Vehicle Usage in Green Isle
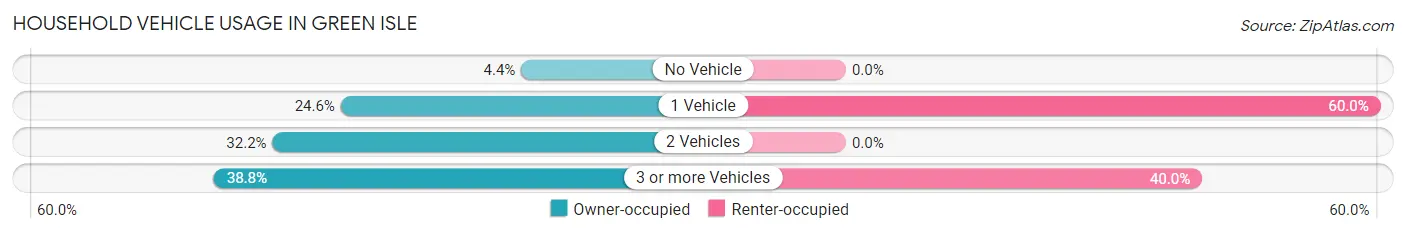
| Vehicles per Household | Owner-occupied | Renter-occupied |
| No Vehicle | 8 (4.4%) | 0 (0.0%) |
| 1 Vehicle | 45 (24.6%) | 3 (60.0%) |
| 2 Vehicles | 59 (32.2%) | 0 (0.0%) |
| 3 or more Vehicles | 71 (38.8%) | 2 (40.0%) |
| Total | 183 (100.0%) | 5 (100.0%) |
Real Estate & Mortgages in Green Isle
Real Estate and Mortgage Overview in Green Isle
| Characteristic | Without Mortgage | With Mortgage |
| Housing Units | 51 | 132 |
| Median Property Value | $154,200 | $186,000 |
| Median Household Income | $63,036 | $14 |
| Monthly Housing Costs | $629 | $4 |
| Real Estate Taxes | $2,468 | $0 |
Property Value by Mortgage Status in Green Isle
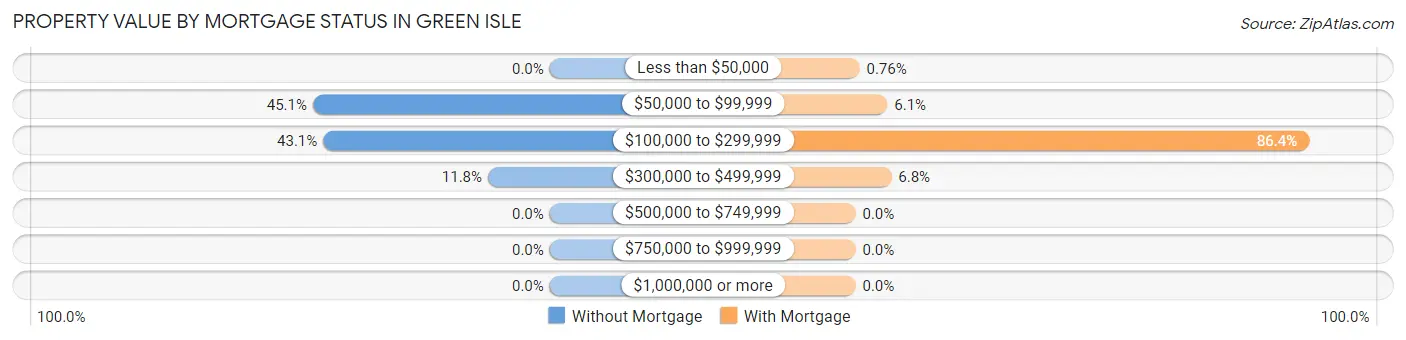
| Property Value | Without Mortgage | With Mortgage |
| Less than $50,000 | 0 (0.0%) | 1 (0.8%) |
| $50,000 to $99,999 | 23 (45.1%) | 8 (6.1%) |
| $100,000 to $299,999 | 22 (43.1%) | 114 (86.4%) |
| $300,000 to $499,999 | 6 (11.8%) | 9 (6.8%) |
| $500,000 to $749,999 | 0 (0.0%) | 0 (0.0%) |
| $750,000 to $999,999 | 0 (0.0%) | 0 (0.0%) |
| $1,000,000 or more | 0 (0.0%) | 0 (0.0%) |
| Total | 51 (100.0%) | 132 (100.0%) |
Household Income by Mortgage Status in Green Isle
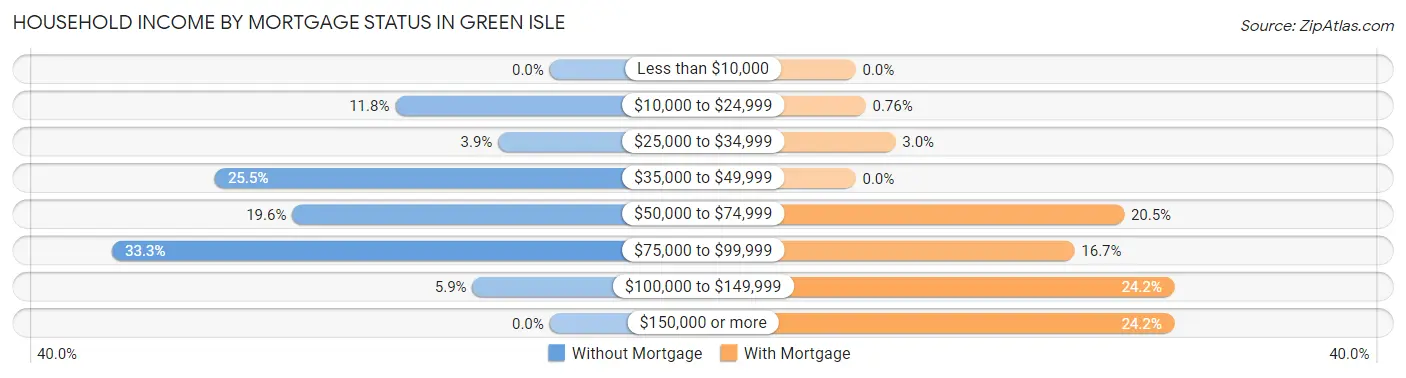
| Household Income | Without Mortgage | With Mortgage |
| Less than $10,000 | 0 (0.0%) | 0 (0.0%) |
| $10,000 to $24,999 | 6 (11.8%) | 1 (0.8%) |
| $25,000 to $34,999 | 2 (3.9%) | 4 (3.0%) |
| $35,000 to $49,999 | 13 (25.5%) | 0 (0.0%) |
| $50,000 to $74,999 | 10 (19.6%) | 27 (20.4%) |
| $75,000 to $99,999 | 17 (33.3%) | 22 (16.7%) |
| $100,000 to $149,999 | 3 (5.9%) | 32 (24.2%) |
| $150,000 or more | 0 (0.0%) | 32 (24.2%) |
| Total | 51 (100.0%) | 132 (100.0%) |
Property Value to Household Income Ratio in Green Isle
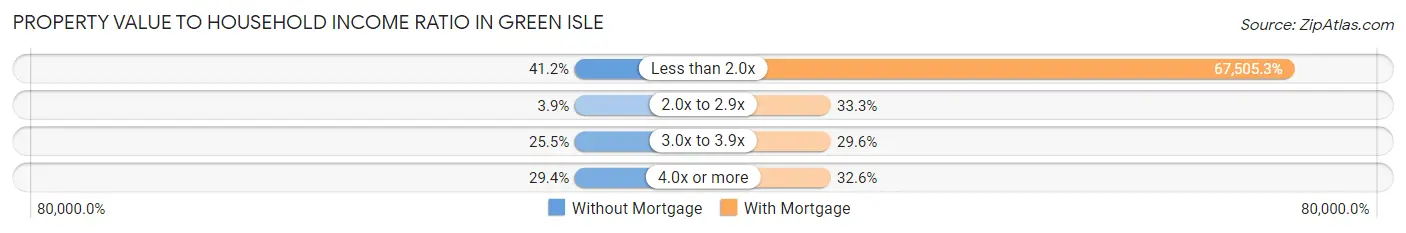
| Value-to-Income Ratio | Without Mortgage | With Mortgage |
| Less than 2.0x | 21 (41.2%) | 89,107 (67,505.3%) |
| 2.0x to 2.9x | 2 (3.9%) | 44 (33.3%) |
| 3.0x to 3.9x | 13 (25.5%) | 39 (29.5%) |
| 4.0x or more | 15 (29.4%) | 43 (32.6%) |
| Total | 51 (100.0%) | 132 (100.0%) |
Real Estate Taxes by Mortgage Status in Green Isle
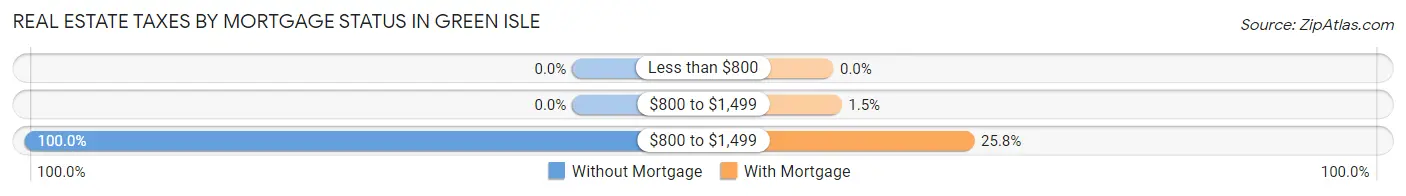
| Property Taxes | Without Mortgage | With Mortgage |
| Less than $800 | 0 (0.0%) | 0 (0.0%) |
| $800 to $1,499 | 0 (0.0%) | 2 (1.5%) |
| $800 to $1,499 | 51 (100.0%) | 34 (25.8%) |
| Total | 51 (100.0%) | 132 (100.0%) |
Health & Disability in Green Isle
Health Insurance Coverage by Age in Green Isle
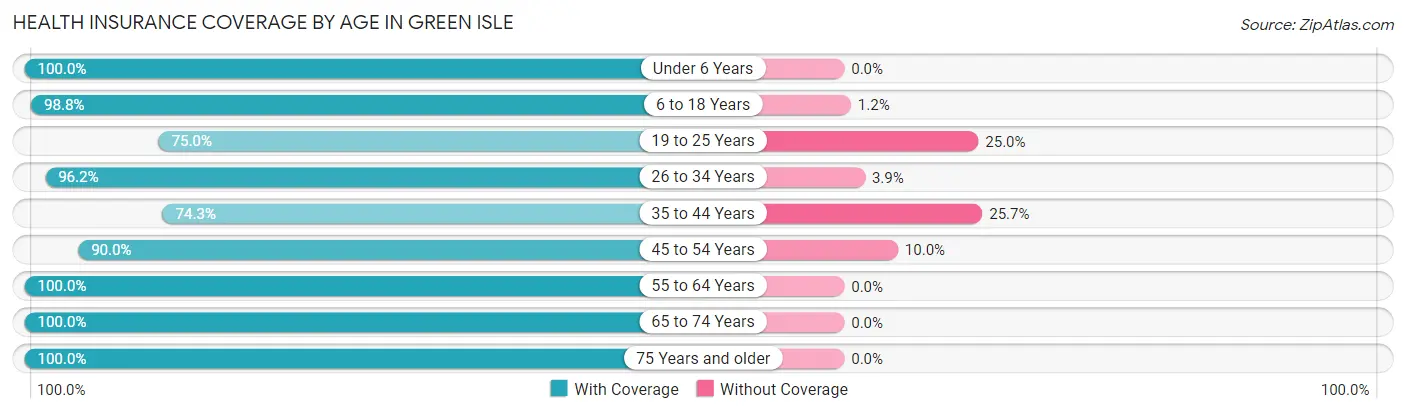
| Age Bracket | With Coverage | Without Coverage |
| Under 6 Years | 43 (100.0%) | 0 (0.0%) |
| 6 to 18 Years | 80 (98.8%) | 1 (1.2%) |
| 19 to 25 Years | 33 (75.0%) | 11 (25.0%) |
| 26 to 34 Years | 50 (96.2%) | 2 (3.8%) |
| 35 to 44 Years | 75 (74.3%) | 26 (25.7%) |
| 45 to 54 Years | 36 (90.0%) | 4 (10.0%) |
| 55 to 64 Years | 36 (100.0%) | 0 (0.0%) |
| 65 to 74 Years | 30 (100.0%) | 0 (0.0%) |
| 75 Years and older | 52 (100.0%) | 0 (0.0%) |
| Total | 435 (90.8%) | 44 (9.2%) |
Health Insurance Coverage by Citizenship Status in Green Isle
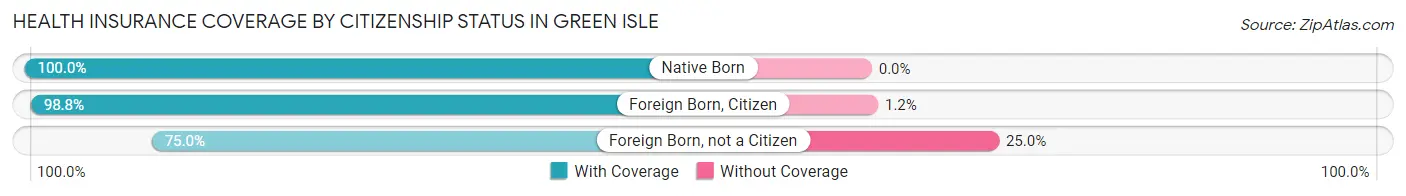
| Citizenship Status | With Coverage | Without Coverage |
| Native Born | 43 (100.0%) | 0 (0.0%) |
| Foreign Born, Citizen | 80 (98.8%) | 1 (1.2%) |
| Foreign Born, not a Citizen | 33 (75.0%) | 11 (25.0%) |
Health Insurance Coverage by Household Income in Green Isle
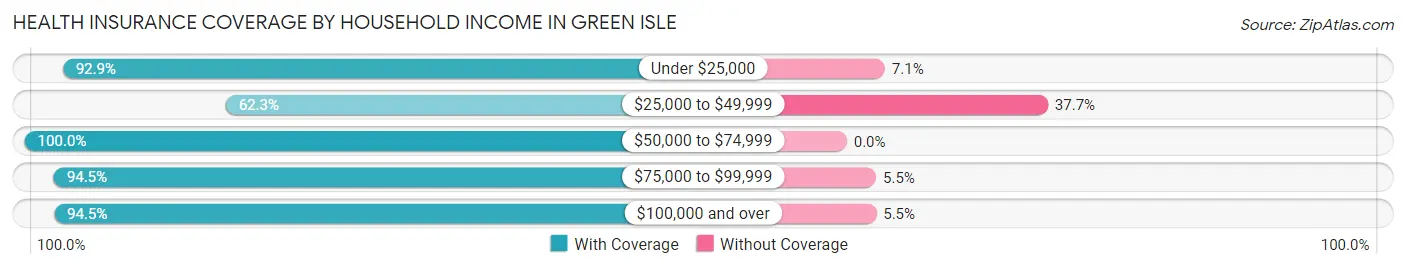
| Household Income | With Coverage | Without Coverage |
| Under $25,000 | 13 (92.9%) | 1 (7.1%) |
| $25,000 to $49,999 | 43 (62.3%) | 26 (37.7%) |
| $50,000 to $74,999 | 87 (100.0%) | 0 (0.0%) |
| $75,000 to $99,999 | 155 (94.5%) | 9 (5.5%) |
| $100,000 and over | 137 (94.5%) | 8 (5.5%) |
Public vs Private Health Insurance Coverage by Age in Green Isle
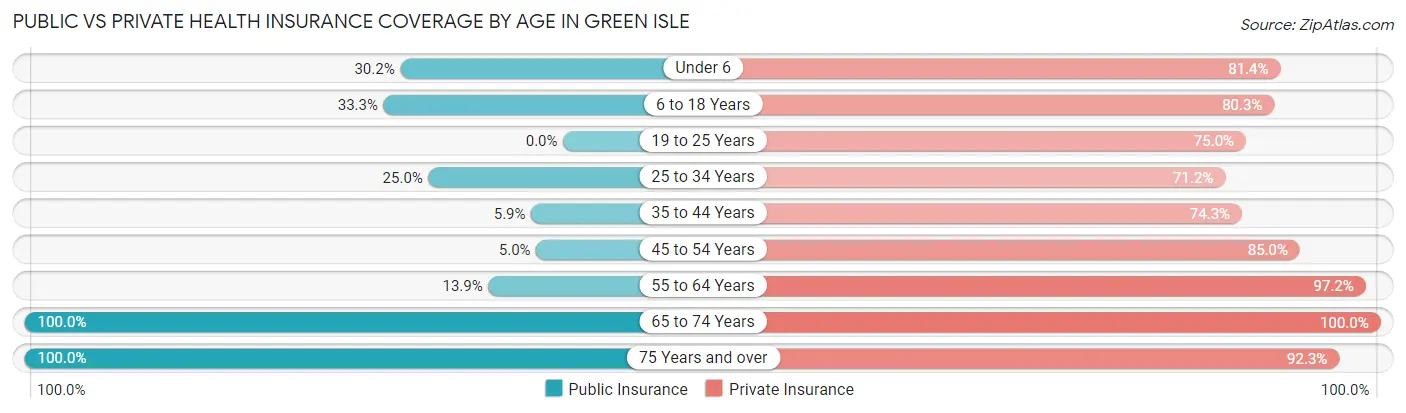
| Age Bracket | Public Insurance | Private Insurance |
| Under 6 | 13 (30.2%) | 35 (81.4%) |
| 6 to 18 Years | 27 (33.3%) | 65 (80.2%) |
| 19 to 25 Years | 0 (0.0%) | 33 (75.0%) |
| 25 to 34 Years | 13 (25.0%) | 37 (71.2%) |
| 35 to 44 Years | 6 (5.9%) | 75 (74.3%) |
| 45 to 54 Years | 2 (5.0%) | 34 (85.0%) |
| 55 to 64 Years | 5 (13.9%) | 35 (97.2%) |
| 65 to 74 Years | 30 (100.0%) | 30 (100.0%) |
| 75 Years and over | 52 (100.0%) | 48 (92.3%) |
| Total | 148 (30.9%) | 392 (81.8%) |
Disability Status by Sex by Age in Green Isle
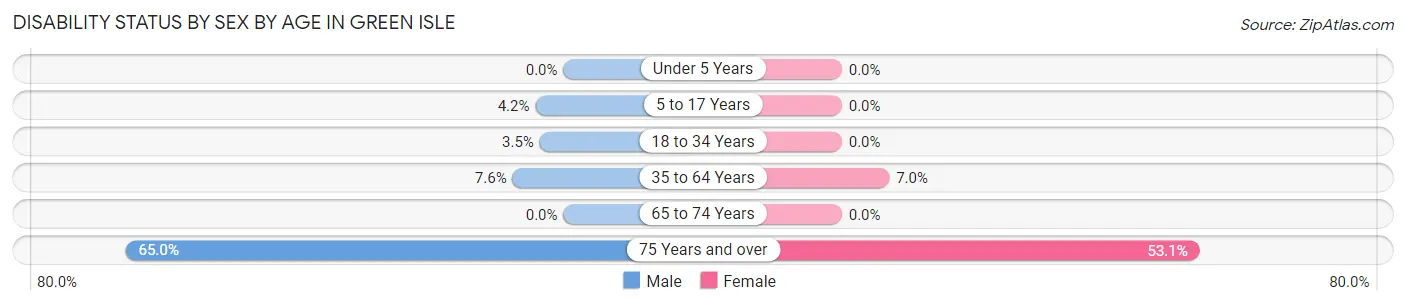
| Age Bracket | Male | Female |
| Under 5 Years | 0 (0.0%) | 0 (0.0%) |
| 5 to 17 Years | 2 (4.2%) | 0 (0.0%) |
| 18 to 34 Years | 2 (3.5%) | 0 (0.0%) |
| 35 to 64 Years | 8 (7.5%) | 5 (7.0%) |
| 65 to 74 Years | 0 (0.0%) | 0 (0.0%) |
| 75 Years and over | 13 (65.0%) | 17 (53.1%) |
Disability Class by Sex by Age in Green Isle
Disability Class: Hearing Difficulty
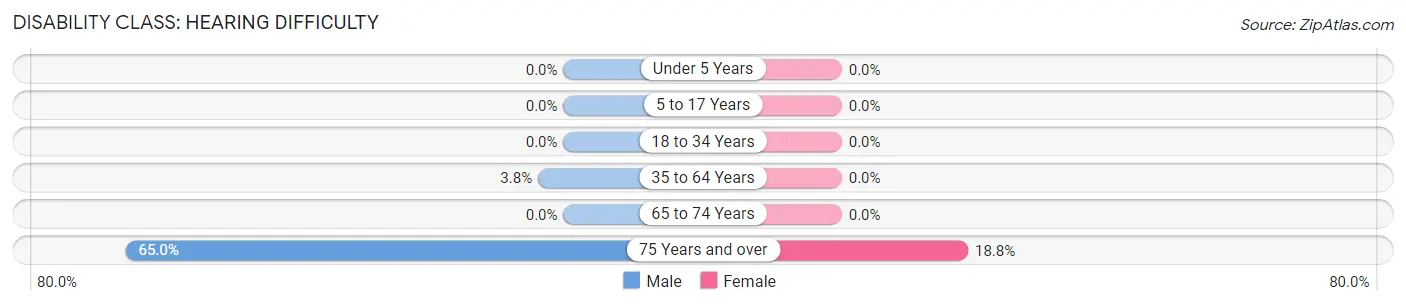
| Age Bracket | Male | Female |
| Under 5 Years | 0 (0.0%) | 0 (0.0%) |
| 5 to 17 Years | 0 (0.0%) | 0 (0.0%) |
| 18 to 34 Years | 0 (0.0%) | 0 (0.0%) |
| 35 to 64 Years | 4 (3.8%) | 0 (0.0%) |
| 65 to 74 Years | 0 (0.0%) | 0 (0.0%) |
| 75 Years and over | 13 (65.0%) | 6 (18.8%) |
Disability Class: Vision Difficulty
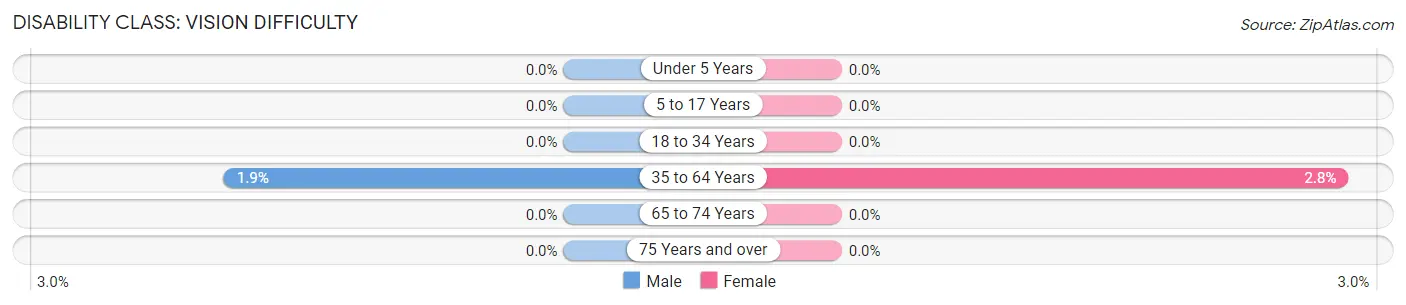
| Age Bracket | Male | Female |
| Under 5 Years | 0 (0.0%) | 0 (0.0%) |
| 5 to 17 Years | 0 (0.0%) | 0 (0.0%) |
| 18 to 34 Years | 0 (0.0%) | 0 (0.0%) |
| 35 to 64 Years | 2 (1.9%) | 2 (2.8%) |
| 65 to 74 Years | 0 (0.0%) | 0 (0.0%) |
| 75 Years and over | 0 (0.0%) | 0 (0.0%) |
Disability Class: Cognitive Difficulty
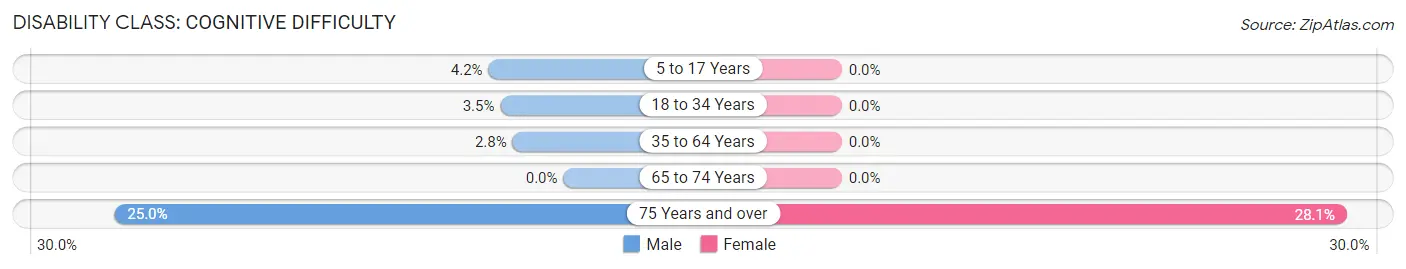
| Age Bracket | Male | Female |
| 5 to 17 Years | 2 (4.2%) | 0 (0.0%) |
| 18 to 34 Years | 2 (3.5%) | 0 (0.0%) |
| 35 to 64 Years | 3 (2.8%) | 0 (0.0%) |
| 65 to 74 Years | 0 (0.0%) | 0 (0.0%) |
| 75 Years and over | 5 (25.0%) | 9 (28.1%) |
Disability Class: Ambulatory Difficulty
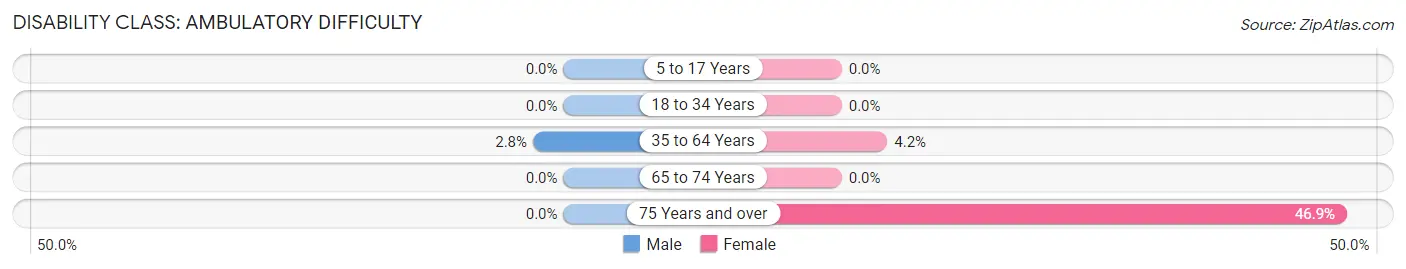
| Age Bracket | Male | Female |
| 5 to 17 Years | 0 (0.0%) | 0 (0.0%) |
| 18 to 34 Years | 0 (0.0%) | 0 (0.0%) |
| 35 to 64 Years | 3 (2.8%) | 3 (4.2%) |
| 65 to 74 Years | 0 (0.0%) | 0 (0.0%) |
| 75 Years and over | 0 (0.0%) | 15 (46.9%) |
Disability Class: Self-Care Difficulty
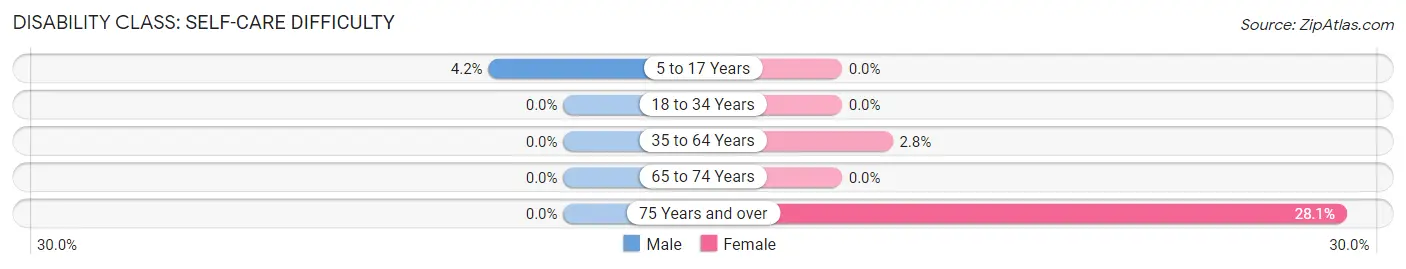
| Age Bracket | Male | Female |
| 5 to 17 Years | 2 (4.2%) | 0 (0.0%) |
| 18 to 34 Years | 0 (0.0%) | 0 (0.0%) |
| 35 to 64 Years | 0 (0.0%) | 2 (2.8%) |
| 65 to 74 Years | 0 (0.0%) | 0 (0.0%) |
| 75 Years and over | 0 (0.0%) | 9 (28.1%) |
Technology Access in Green Isle
Computing Device Access in Green Isle
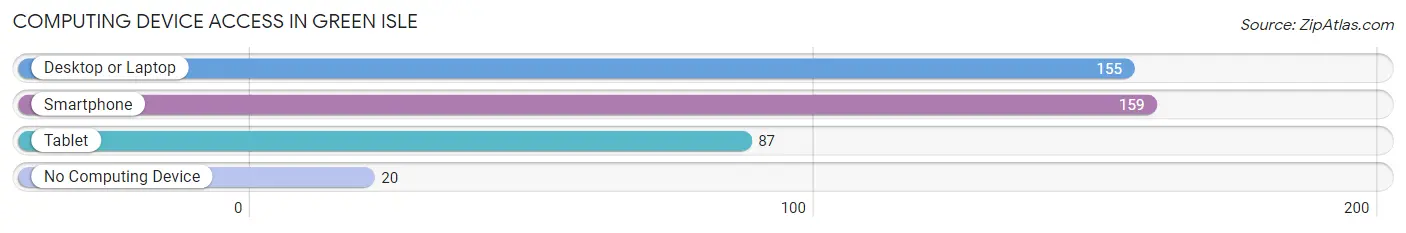
| Device Type | # Households | % Households |
| Desktop or Laptop | 155 | 82.5% |
| Smartphone | 159 | 84.6% |
| Tablet | 87 | 46.3% |
| No Computing Device | 20 | 10.6% |
| Total | 188 | 100.0% |
Internet Access in Green Isle
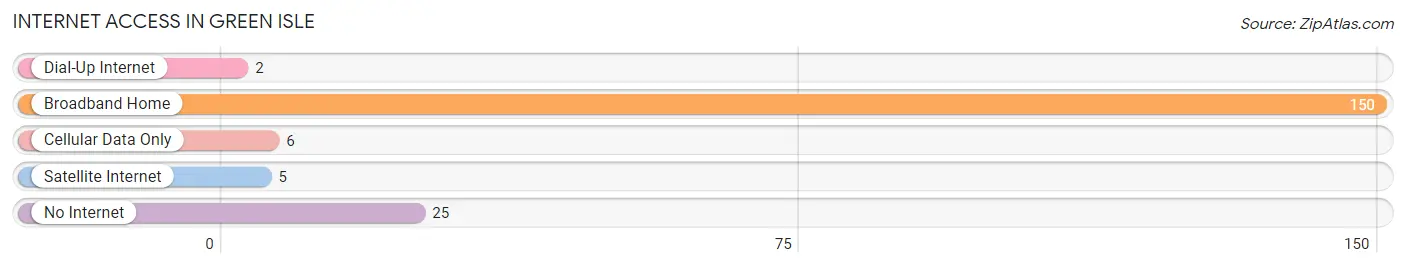
| Internet Type | # Households | % Households |
| Dial-Up Internet | 2 | 1.1% |
| Broadband Home | 150 | 79.8% |
| Cellular Data Only | 6 | 3.2% |
| Satellite Internet | 5 | 2.7% |
| No Internet | 25 | 13.3% |
| Total | 188 | 100.0% |
Green Isle Summary
Geography
Green Isle is a small city located in Sibley County, Minnesota. It is situated on the south shore of Lake Washington, approximately 40 miles southwest of Minneapolis. The city is surrounded by rolling hills and farmland, and is home to a variety of wildlife, including deer, foxes, and coyotes. The city is also home to a number of small lakes, including Lake Washington, which is the largest lake in the area.
The city of Green Isle is located in the Central Hardwood Forest ecoregion, which is characterized by a mix of deciduous and coniferous trees. The area is also home to a variety of grasslands, wetlands, and prairies. The city is located in the Minnesota River Valley, which is a major tributary of the Mississippi River.
History
Green Isle was first settled in 1856 by a group of German immigrants. The city was originally named “Gruenfeld”, which means “green field” in German. The city was renamed “Green Isle” in 1872, and was incorporated in 1876.
The city was initially a farming community, and the local economy was largely based on agriculture. In the late 19th century, the city began to develop a manufacturing industry, and by the early 20th century, the city was home to a number of factories, including a flour mill, a creamery, and a canning factory.
In the mid-20th century, the city began to experience a decline in its manufacturing industry, and the local economy shifted to focus on tourism and recreation. The city is now home to a number of recreational activities, including fishing, boating, and camping.
Economy
The economy of Green Isle is largely based on tourism and recreation. The city is home to a number of recreational activities, including fishing, boating, and camping. The city is also home to a number of small businesses, including restaurants, retail stores, and service providers.
The city is also home to a number of manufacturing companies, including a flour mill, a creamery, and a canning factory. The city is also home to a number of agricultural businesses, including dairy farms, grain farms, and vegetable farms.
Demographics
As of the 2010 census, the population of Green Isle was 1,845. The racial makeup of the city was 97.3% White, 0.7% African American, 0.2% Native American, 0.2% Asian, 0.1% Pacific Islander, 0.7% from other races, and 0.9% from two or more races. Hispanic or Latino of any race were 1.7% of the population.
The median household income in Green Isle was $50,938, and the median family income was $58,906. The per capita income for the city was $22,845. About 8.2% of families and 10.2% of the population were below the poverty line, including 14.2% of those under age 18 and 8.3% of those age 65 or over.
Conclusion
Green Isle is a small city located in Sibley County, Minnesota. It is situated on the south shore of Lake Washington, and is home to a variety of wildlife, including deer, foxes, and coyotes. The city is also home to a number of small lakes, and is located in the Central Hardwood Forest ecoregion. The city was first settled in 1856 by a group of German immigrants, and was initially a farming community. In the late 19th century, the city began to develop a manufacturing industry, and by the early 20th century, the city was home to a number of factories. In the mid-20th century, the city began to experience a decline in its manufacturing industry, and the local economy shifted to focus on tourism and recreation. The economy of Green Isle is largely based on tourism and recreation, and the city is also home to a number of small businesses, manufacturing companies, and agricultural businesses. As of the 2010 census, the population of Green Isle was 1,845. The median household income in Green Isle was $50,938, and the median family income was $58,906.
Common Questions
What is Per Capita Income in Green Isle?
Per Capita income in Green Isle is $31,909.
What is the Median Family Income in Green Isle?
Median Family Income in Green Isle is $89,375.
What is the Median Household income in Green Isle?
Median Household Income in Green Isle is $81,250.
What is Income or Wage Gap in Green Isle?
Income or Wage Gap in Green Isle is 3.8%.
Women in Green Isle earn 96.2 cents for every dollar earned by a man.
What is Inequality or Gini Index in Green Isle?
Inequality or Gini Index in Green Isle is 0.29.
What is the Total Population of Green Isle?
Total Population of Green Isle is 479.
What is the Total Male Population of Green Isle?
Total Male Population of Green Isle is 261.
What is the Total Female Population of Green Isle?
Total Female Population of Green Isle is 218.
What is the Ratio of Males per 100 Females in Green Isle?
There are 119.72 Males per 100 Females in Green Isle.
What is the Ratio of Females per 100 Males in Green Isle?
There are 83.52 Females per 100 Males in Green Isle.
What is the Median Population Age in Green Isle?
Median Population Age in Green Isle is 36.6 Years.
What is the Average Family Size in Green Isle
Average Family Size in Green Isle is 3.4 People.
What is the Average Household Size in Green Isle
Average Household Size in Green Isle is 2.5 People.
How Large is the Labor Force in Green Isle?
There are 283 People in the Labor Forcein in Green Isle.
What is the Percentage of People in the Labor Force in Green Isle?
76.1% of People are in the Labor Force in Green Isle.
What is the Unemployment Rate in Green Isle?
Unemployment Rate in Green Isle is 1.1%.