Zip Codes with the Highest Percentage of Families with Income Below $10,000 in Iowa
RELATED REPORTS & OPTIONS
Family Income | $0-10k
Iowa
Compare Zip Codes
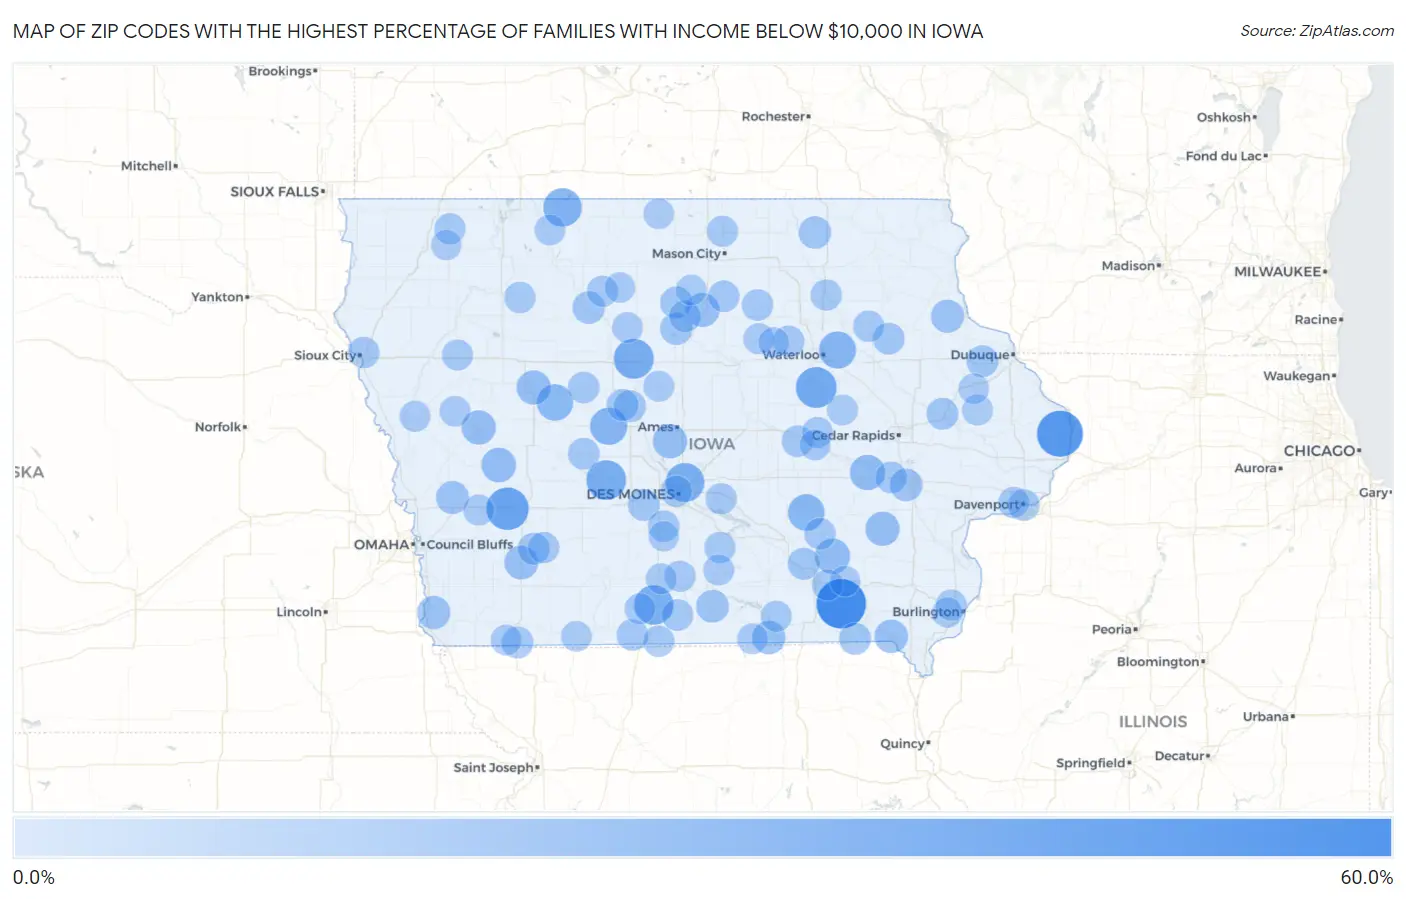
Map of Zip Codes with the Highest Percentage of Families with Income Below $10,000 in Iowa
0.0%
60.0%
Zip Codes with the Highest Percentage of Families with Income Below $10,000 in Iowa
| Zip Code | Families with Income < $10k | vs State | vs National | |
| 1. | 52588 | 52.4% | 2.4%(+50.0)#1 | 3.1%(+49.3)#57 |
| 2. | 52701 | 43.5% | 2.4%(+41.1)#2 | 3.1%(+40.4)#91 |
| 3. | 51552 | 34.5% | 2.4%(+32.1)#3 | 3.1%(+31.4)#151 |
| 4. | 50612 | 30.8% | 2.4%(+28.4)#4 | 3.1%(+27.7)#184 |
| 5. | 50532 | 28.5% | 2.4%(+26.1)#5 | 3.1%(+25.4)#220 |
| 6. | 50146 | 27.8% | 2.4%(+25.4)#6 | 3.1%(+24.7)#231 |
| 7. | 50262 | 27.3% | 2.4%(+24.9)#7 | 3.1%(+24.2)#243 |
| 8. | 50032 | 25.8% | 2.4%(+23.4)#8 | 3.1%(+22.7)#285 |
| 9. | 50531 | 24.7% | 2.4%(+22.3)#9 | 3.1%(+21.6)#313 |
| 10. | 50107 | 21.8% | 2.4%(+19.4)#10 | 3.1%(+18.7)#410 |
| 11. | 50623 | 21.7% | 2.4%(+19.3)#11 | 3.1%(+18.6)#414 |
| 12. | 50027 | 20.2% | 2.4%(+17.8)#12 | 3.1%(+17.1)#469 |
| 13. | 51451 | 20.0% | 2.4%(+17.6)#13 | 3.1%(+16.9)#484 |
| 14. | 52334 | 17.2% | 2.4%(+14.8)#14 | 3.1%(+14.1)#653 |
| 15. | 52568 | 17.2% | 2.4%(+14.8)#15 | 3.1%(+14.1)#654 |
| 16. | 51446 | 15.7% | 2.4%(+13.3)#16 | 3.1%(+12.6)#784 |
| 17. | 51442 | 14.8% | 2.4%(+12.4)#17 | 3.1%(+11.7)#882 |
| 18. | 50134 | 14.8% | 2.4%(+12.4)#18 | 3.1%(+11.7)#887 |
| 19. | 51433 | 14.8% | 2.4%(+12.4)#19 | 3.1%(+11.7)#890 |
| 20. | 52359 | 14.7% | 2.4%(+12.3)#20 | 3.1%(+11.6)#900 |
| 21. | 50452 | 14.3% | 2.4%(+11.9)#21 | 3.1%(+11.2)#940 |
| 22. | 50847 | 13.6% | 2.4%(+11.2)#22 | 3.1%(+10.5)#1,041 |
| 23. | 52626 | 12.8% | 2.4%(+10.4)#23 | 3.1%(+9.70)#1,168 |
| 24. | 52555 | 12.8% | 2.4%(+10.4)#24 | 3.1%(+9.70)#1,178 |
| 25. | 51654 | 12.4% | 2.4%(+10.00)#25 | 3.1%(+9.30)#1,254 |
| 26. | 52048 | 12.0% | 2.4%(+9.60)#26 | 3.1%(+8.90)#1,336 |
| 27. | 51563 | 11.7% | 2.4%(+9.30)#27 | 3.1%(+8.60)#1,410 |
| 28. | 50165 | 11.1% | 2.4%(+8.70)#28 | 3.1%(+8.00)#1,582 |
| 29. | 52246 | 10.9% | 2.4%(+8.50)#29 | 3.1%(+7.80)#1,611 |
| 30. | 50628 | 10.7% | 2.4%(+8.30)#30 | 3.1%(+7.60)#1,688 |
| 31. | 50520 | 10.7% | 2.4%(+8.30)#31 | 3.1%(+7.60)#1,698 |
| 32. | 50101 | 10.0% | 2.4%(+7.60)#32 | 3.1%(+6.90)#1,943 |
| 33. | 52566 | 9.7% | 2.4%(+7.30)#33 | 3.1%(+6.60)#2,065 |
| 34. | 50421 | 9.6% | 2.4%(+7.20)#34 | 3.1%(+6.50)#2,085 |
| 35. | 52542 | 9.4% | 2.4%(+7.00)#35 | 3.1%(+6.30)#2,185 |
| 36. | 50843 | 9.3% | 2.4%(+6.90)#36 | 3.1%(+6.20)#2,231 |
| 37. | 50223 | 9.3% | 2.4%(+6.90)#37 | 3.1%(+6.20)#2,233 |
| 38. | 52045 | 9.1% | 2.4%(+6.70)#38 | 3.1%(+6.00)#2,318 |
| 39. | 52205 | 8.9% | 2.4%(+6.50)#39 | 3.1%(+5.80)#2,412 |
| 40. | 50607 | 8.9% | 2.4%(+6.50)#40 | 3.1%(+5.80)#2,443 |
| 41. | 50038 | 8.9% | 2.4%(+6.50)#41 | 3.1%(+5.80)#2,447 |
| 42. | 52322 | 8.8% | 2.4%(+6.40)#42 | 3.1%(+5.70)#2,477 |
| 43. | 51631 | 8.8% | 2.4%(+6.40)#43 | 3.1%(+5.70)#2,495 |
| 44. | 50040 | 8.8% | 2.4%(+6.40)#44 | 3.1%(+5.70)#2,501 |
| 45. | 50470 | 8.7% | 2.4%(+6.30)#45 | 3.1%(+5.60)#2,552 |
| 46. | 52801 | 8.6% | 2.4%(+6.20)#46 | 3.1%(+5.50)#2,601 |
| 47. | 50026 | 8.6% | 2.4%(+6.20)#47 | 3.1%(+5.50)#2,617 |
| 48. | 50140 | 8.5% | 2.4%(+6.10)#48 | 3.1%(+5.40)#2,663 |
| 49. | 52339 | 8.4% | 2.4%(+6.00)#49 | 3.1%(+5.30)#2,735 |
| 50. | 50160 | 8.4% | 2.4%(+6.00)#50 | 3.1%(+5.30)#2,759 |
| 51. | 50538 | 8.4% | 2.4%(+6.00)#51 | 3.1%(+5.30)#2,760 |
| 52. | 50103 | 8.3% | 2.4%(+5.90)#52 | 3.1%(+5.20)#2,818 |
| 53. | 50475 | 8.2% | 2.4%(+5.80)#53 | 3.1%(+5.10)#2,878 |
| 54. | 50611 | 8.1% | 2.4%(+5.70)#54 | 3.1%(+5.00)#2,942 |
| 55. | 51105 | 8.0% | 2.4%(+5.60)#55 | 3.1%(+4.90)#2,962 |
| 56. | 52550 | 8.0% | 2.4%(+5.60)#56 | 3.1%(+4.90)#3,001 |
| 57. | 50314 | 7.9% | 2.4%(+5.50)#57 | 3.1%(+4.80)#3,034 |
| 58. | 50853 | 7.9% | 2.4%(+5.50)#58 | 3.1%(+4.80)#3,065 |
| 59. | 50662 | 7.8% | 2.4%(+5.40)#59 | 3.1%(+4.70)#3,093 |
| 60. | 50660 | 7.8% | 2.4%(+5.40)#60 | 3.1%(+4.70)#3,108 |
| 61. | 50062 | 7.7% | 2.4%(+5.30)#61 | 3.1%(+4.60)#3,169 |
| 62. | 50065 | 7.7% | 2.4%(+5.30)#62 | 3.1%(+4.60)#3,174 |
| 63. | 50565 | 7.7% | 2.4%(+5.30)#63 | 3.1%(+4.60)#3,177 |
| 64. | 50631 | 7.7% | 2.4%(+5.30)#64 | 3.1%(+4.60)#3,183 |
| 65. | 52804 | 7.4% | 2.4%(+5.00)#65 | 3.1%(+4.30)#3,339 |
| 66. | 50519 | 7.4% | 2.4%(+5.00)#66 | 3.1%(+4.30)#3,381 |
| 67. | 50228 | 7.2% | 2.4%(+4.80)#67 | 3.1%(+4.10)#3,504 |
| 68. | 50456 | 7.2% | 2.4%(+4.80)#68 | 3.1%(+4.10)#3,513 |
| 69. | 52655 | 7.1% | 2.4%(+4.70)#69 | 3.1%(+4.00)#3,578 |
| 70. | 51025 | 7.1% | 2.4%(+4.70)#70 | 3.1%(+4.00)#3,588 |
| 71. | 52530 | 7.1% | 2.4%(+4.70)#71 | 3.1%(+4.00)#3,600 |
| 72. | 50275 | 7.1% | 2.4%(+4.70)#72 | 3.1%(+4.00)#3,608 |
| 73. | 51350 | 7.1% | 2.4%(+4.70)#73 | 3.1%(+4.00)#3,609 |
| 74. | 52593 | 7.1% | 2.4%(+4.70)#74 | 3.1%(+4.00)#3,616 |
| 75. | 52348 | 7.1% | 2.4%(+4.70)#75 | 3.1%(+4.00)#3,619 |
| 76. | 51010 | 7.0% | 2.4%(+4.60)#76 | 3.1%(+3.90)#3,681 |
| 77. | 52321 | 6.9% | 2.4%(+4.50)#77 | 3.1%(+3.80)#3,776 |
| 78. | 51521 | 6.8% | 2.4%(+4.40)#78 | 3.1%(+3.70)#3,851 |
| 79. | 50604 | 6.8% | 2.4%(+4.40)#79 | 3.1%(+3.70)#3,854 |
| 80. | 50213 | 6.7% | 2.4%(+4.30)#80 | 3.1%(+3.60)#3,921 |
| 81. | 50246 | 6.7% | 2.4%(+4.30)#81 | 3.1%(+3.60)#3,965 |
| 82. | 50272 | 6.7% | 2.4%(+4.30)#82 | 3.1%(+3.60)#3,981 |
| 83. | 52549 | 6.6% | 2.4%(+4.20)#83 | 3.1%(+3.50)#4,073 |
| 84. | 50108 | 6.5% | 2.4%(+4.10)#84 | 3.1%(+3.40)#4,187 |
| 85. | 51637 | 6.5% | 2.4%(+4.10)#85 | 3.1%(+3.40)#4,190 |
| 86. | 52229 | 6.4% | 2.4%(+4.00)#86 | 3.1%(+3.30)#4,271 |
| 87. | 52215 | 6.3% | 2.4%(+3.90)#87 | 3.1%(+3.20)#4,385 |
| 88. | 50591 | 6.3% | 2.4%(+3.90)#88 | 3.1%(+3.20)#4,406 |
| 89. | 51460 | 6.3% | 2.4%(+3.90)#89 | 3.1%(+3.20)#4,414 |
| 90. | 50665 | 6.2% | 2.4%(+3.80)#90 | 3.1%(+3.10)#4,481 |
| 91. | 52533 | 6.2% | 2.4%(+3.80)#91 | 3.1%(+3.10)#4,502 |
| 92. | 50457 | 6.2% | 2.4%(+3.80)#92 | 3.1%(+3.10)#4,510 |
| 93. | 50836 | 6.2% | 2.4%(+3.80)#93 | 3.1%(+3.10)#4,512 |
| 94. | 50560 | 6.1% | 2.4%(+3.70)#94 | 3.1%(+3.00)#4,618 |
| 95. | 51365 | 6.1% | 2.4%(+3.70)#95 | 3.1%(+3.00)#4,623 |
| 96. | 52033 | 6.0% | 2.4%(+3.60)#96 | 3.1%(+2.90)#4,709 |
| 97. | 50478 | 6.0% | 2.4%(+3.60)#97 | 3.1%(+2.90)#4,741 |
| 98. | 51248 | 5.9% | 2.4%(+3.50)#98 | 3.1%(+2.80)#4,854 |
| 99. | 52638 | 5.6% | 2.4%(+3.20)#99 | 3.1%(+2.50)#5,274 |
| 100. | 50241 | 5.6% | 2.4%(+3.20)#100 | 3.1%(+2.50)#5,288 |
Common Questions
What are the Top 10 Zip Codes with the Highest Percentage of Families with Income Below $10,000 in Iowa?
Top 10 Zip Codes with the Highest Percentage of Families with Income Below $10,000 in Iowa are:
What zip code has the Highest Percentage of Families with Income Below $10,000 in Iowa?
52588 has the Highest Percentage of Families with Income Below $10,000 in Iowa with 52.4%.
What is the Percentage of Families with Income Below $10,000 in the State of Iowa?
Percentage of Families with Income Below $10,000 in Iowa is 2.4%.
What is the Percentage of Families with Income Below $10,000 in the United States?
Percentage of Families with Income Below $10,000 in the United States is 3.1%.