Clutier, IA Map & Demographics
Clutier Map
Clutier Overview
$23,531
PER CAPITA INCOME
$69,167
AVG FAMILY INCOME
$48,750
AVG HOUSEHOLD INCOME
16.1%
WAGE / INCOME GAP [ % ]
83.9¢/ $1
WAGE / INCOME GAP [ $ ]
0.35
INEQUALITY / GINI INDEX
272
TOTAL POPULATION
168
MALE POPULATION
104
FEMALE POPULATION
161.54
MALES / 100 FEMALES
61.90
FEMALES / 100 MALES
31.8
MEDIAN AGE
3.7
AVG FAMILY SIZE
2.5
AVG HOUSEHOLD SIZE
137
LABOR FORCE [ PEOPLE ]
72.9%
PERCENT IN LABOR FORCE
8.3%
UNEMPLOYMENT RATE
Clutier Zip Codes
Clutier Area Codes
Income in Clutier
Income Overview in Clutier
Per Capita Income in Clutier is $23,531, while median incomes of families and households are $69,167 and $48,750 respectively.
| Characteristic | Number | Measure |
| Per Capita Income | 272 | $23,531 |
| Median Family Income | 54 | $69,167 |
| Mean Family Income | 54 | $72,154 |
| Median Household Income | 108 | $48,750 |
| Mean Household Income | 108 | $56,356 |
| Income Deficit | 54 | $0 |
| Wage / Income Gap (%) | 272 | 16.06% |
| Wage / Income Gap ($) | 272 | 83.94¢ per $1 |
| Gini / Inequality Index | 272 | 0.35 |
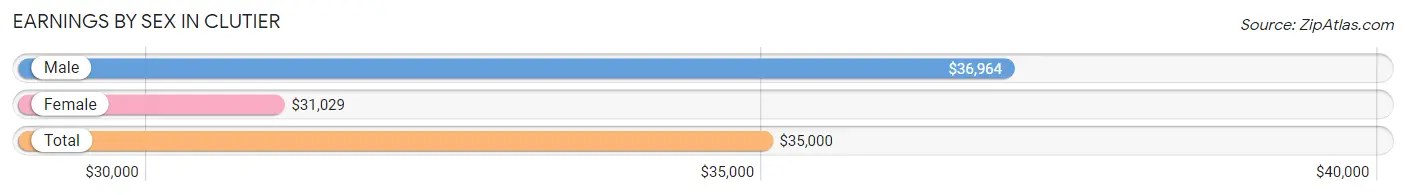
Earnings by Sex in Clutier
Average Earnings in Clutier are $35,000, $36,964 for men and $31,029 for women, a difference of 16.1%.
| Sex | Number | Average Earnings |
| Male | 76 (55.1%) | $36,964 |
| Female | 62 (44.9%) | $31,029 |
| Total | 138 (100.0%) | $35,000 |
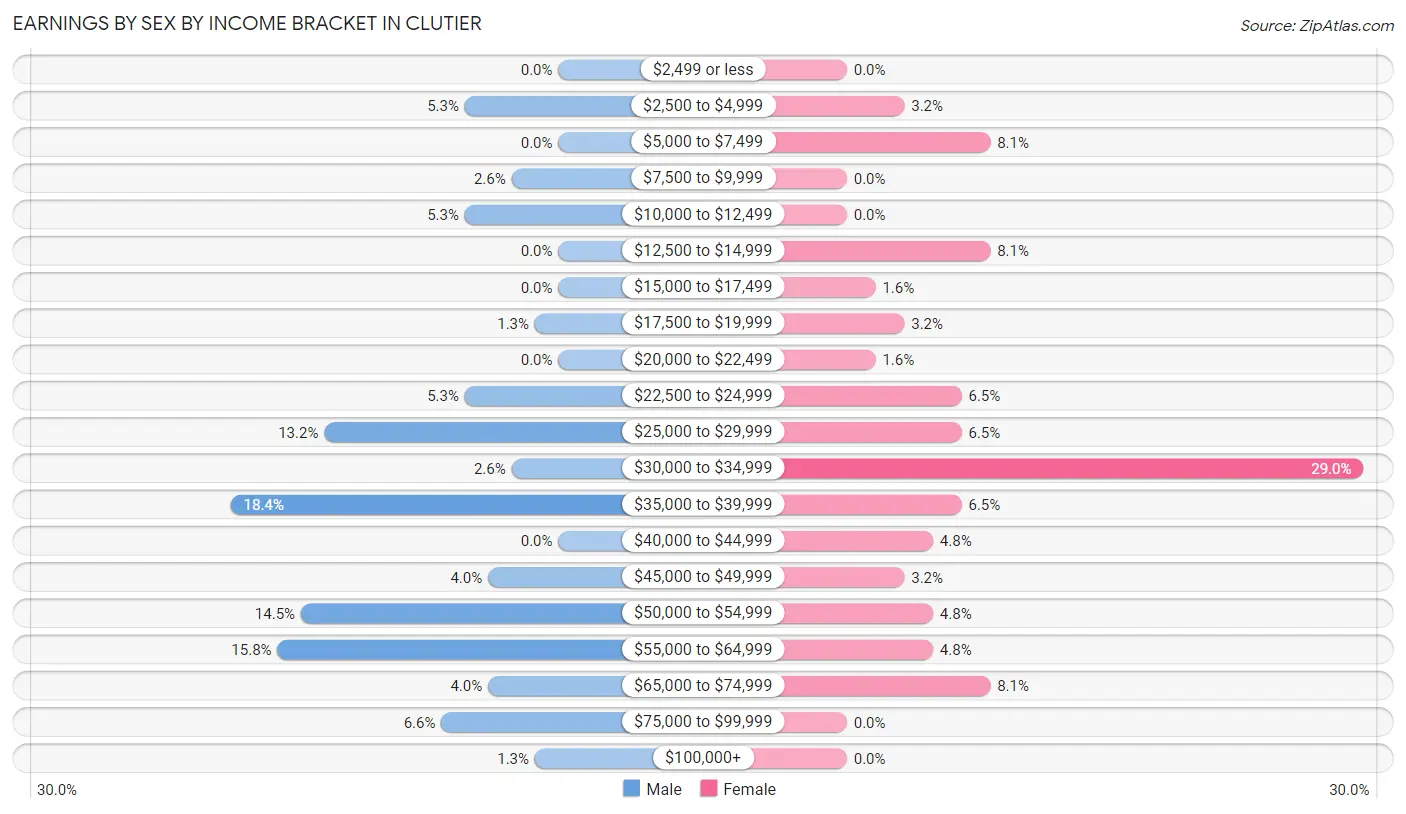
Earnings by Sex by Income Bracket in Clutier
The most common earnings brackets in Clutier are $35,000 to $39,999 for men (14 | 18.4%) and $30,000 to $34,999 for women (18 | 29.0%).
| Income | Male | Female |
| $2,499 or less | 0 (0.0%) | 0 (0.0%) |
| $2,500 to $4,999 | 4 (5.3%) | 2 (3.2%) |
| $5,000 to $7,499 | 0 (0.0%) | 5 (8.1%) |
| $7,500 to $9,999 | 2 (2.6%) | 0 (0.0%) |
| $10,000 to $12,499 | 4 (5.3%) | 0 (0.0%) |
| $12,500 to $14,999 | 0 (0.0%) | 5 (8.1%) |
| $15,000 to $17,499 | 0 (0.0%) | 1 (1.6%) |
| $17,500 to $19,999 | 1 (1.3%) | 2 (3.2%) |
| $20,000 to $22,499 | 0 (0.0%) | 1 (1.6%) |
| $22,500 to $24,999 | 4 (5.3%) | 4 (6.5%) |
| $25,000 to $29,999 | 10 (13.2%) | 4 (6.5%) |
| $30,000 to $34,999 | 2 (2.6%) | 18 (29.0%) |
| $35,000 to $39,999 | 14 (18.4%) | 4 (6.5%) |
| $40,000 to $44,999 | 0 (0.0%) | 3 (4.8%) |
| $45,000 to $49,999 | 3 (4.0%) | 2 (3.2%) |
| $50,000 to $54,999 | 11 (14.5%) | 3 (4.8%) |
| $55,000 to $64,999 | 12 (15.8%) | 3 (4.8%) |
| $65,000 to $74,999 | 3 (4.0%) | 5 (8.1%) |
| $75,000 to $99,999 | 5 (6.6%) | 0 (0.0%) |
| $100,000+ | 1 (1.3%) | 0 (0.0%) |
| Total | 76 (100.0%) | 62 (100.0%) |
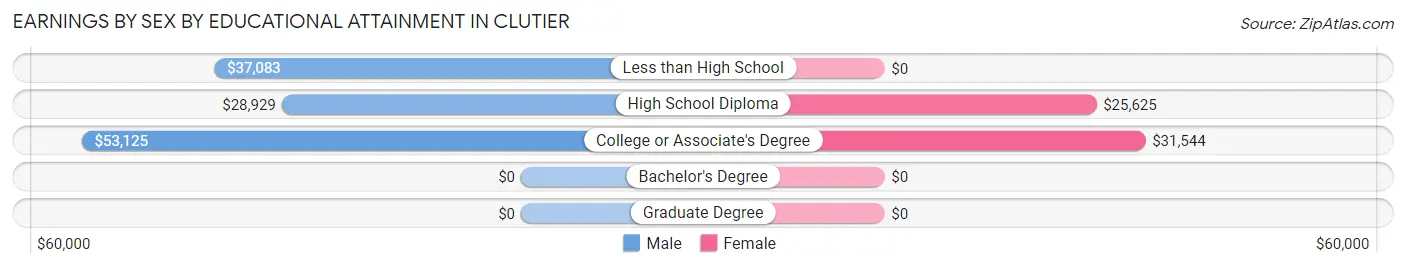
Earnings by Sex by Educational Attainment in Clutier
Average earnings in Clutier are $41,250 for men and $31,324 for women, a difference of 24.1%. Men with an educational attainment of college or associate's degree enjoy the highest average annual earnings of $53,125, while those with high school diploma education earn the least with $28,929. Women with an educational attainment of college or associate's degree earn the most with the average annual earnings of $31,544, while those with high school diploma education have the smallest earnings of $25,625.
| Educational Attainment | Male Income | Female Income |
| Less than High School | $37,083 | $0 |
| High School Diploma | $28,929 | $25,625 |
| College or Associate's Degree | $53,125 | $31,544 |
| Bachelor's Degree | - | - |
| Graduate Degree | - | - |
| Total | $41,250 | $31,324 |
Family Income in Clutier
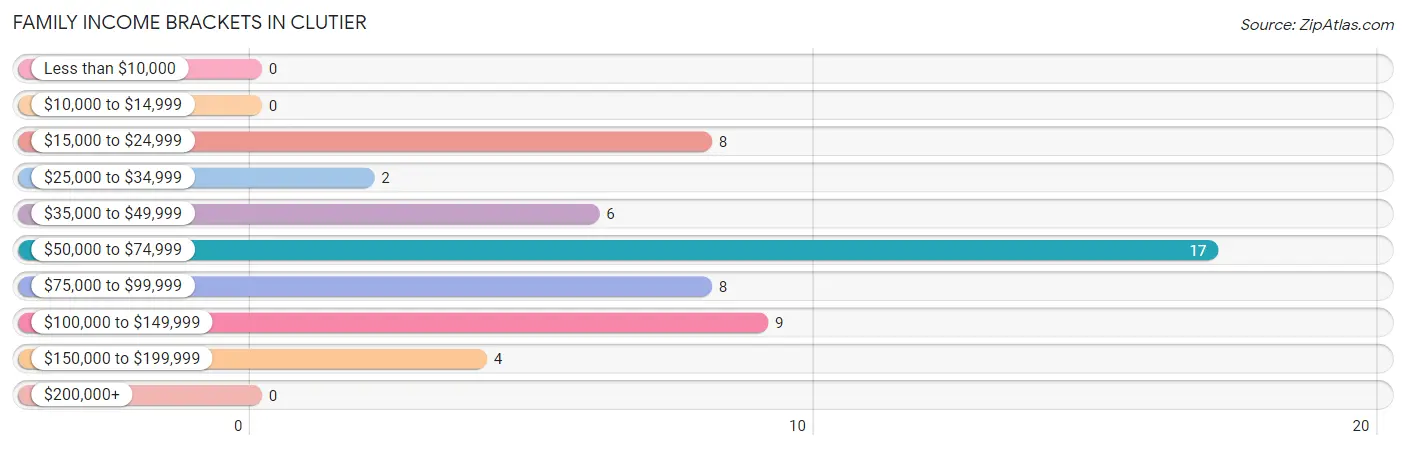
Family Income Brackets in Clutier
According to the Clutier family income data, there are 17 families falling into the $50,000 to $74,999 income range, which is the most common income bracket and makes up 31.5% of all families.
| Income Bracket | # Families | % Families |
| Less than $10,000 | 0 | 0.0% |
| $10,000 to $14,999 | 0 | 0.0% |
| $15,000 to $24,999 | 8 | 14.8% |
| $25,000 to $34,999 | 2 | 3.7% |
| $35,000 to $49,999 | 6 | 11.1% |
| $50,000 to $74,999 | 17 | 31.5% |
| $75,000 to $99,999 | 8 | 14.8% |
| $100,000 to $149,999 | 9 | 16.7% |
| $150,000 to $199,999 | 4 | 7.4% |
| $200,000+ | 0 | 0.0% |
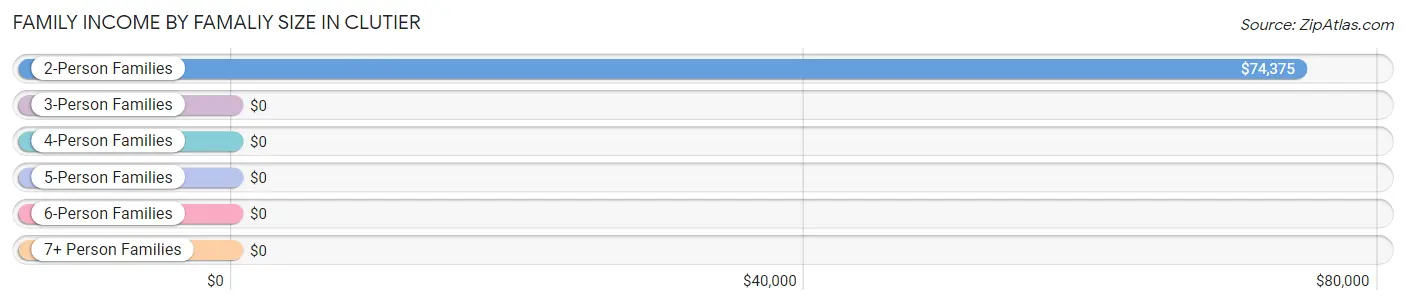
Family Income by Famaliy Size in Clutier
2-person families (25 | 46.3%) account for the highest median family income in Clutier with $74,375 per family, while 2-person families (25 | 46.3%) have the highest median income of $37,188 per family member.
| Income Bracket | # Families | Median Income |
| 2-Person Families | 25 (46.3%) | $74,375 |
| 3-Person Families | 11 (20.4%) | $0 |
| 4-Person Families | 7 (13.0%) | $0 |
| 5-Person Families | 7 (13.0%) | $0 |
| 6-Person Families | 4 (7.4%) | $0 |
| 7+ Person Families | 0 (0.0%) | $0 |
| Total | 54 (100.0%) | $69,167 |
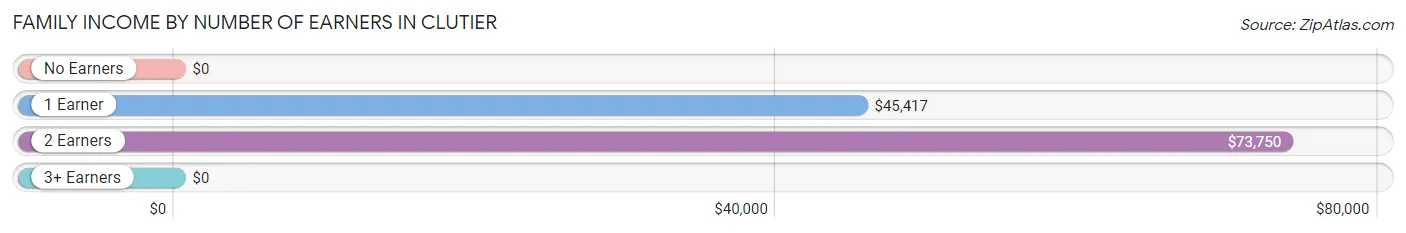
Family Income by Number of Earners in Clutier
| Number of Earners | # Families | Median Income |
| No Earners | 4 (7.4%) | $0 |
| 1 Earner | 17 (31.5%) | $45,417 |
| 2 Earners | 30 (55.6%) | $73,750 |
| 3+ Earners | 3 (5.6%) | $0 |
| Total | 54 (100.0%) | $69,167 |
Household Income in Clutier
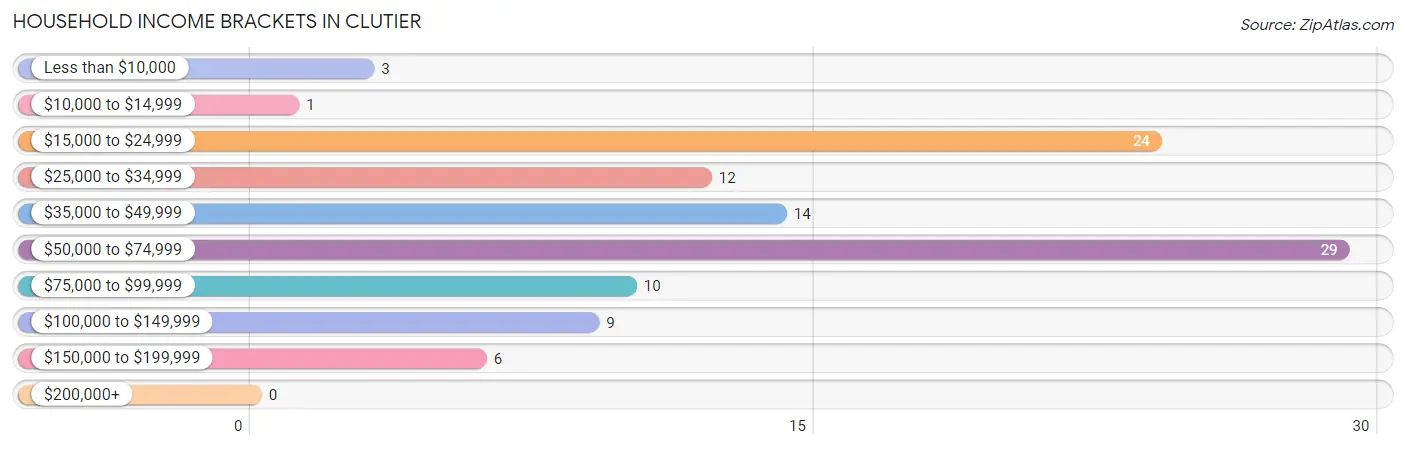
Household Income Brackets in Clutier
With 29 households falling in the category, the $50,000 to $74,999 income range is the most frequent in Clutier, accounting for 26.9% of all households.
| Income Bracket | # Households | % Households |
| Less than $10,000 | 3 | 2.8% |
| $10,000 to $14,999 | 1 | 0.9% |
| $15,000 to $24,999 | 24 | 22.2% |
| $25,000 to $34,999 | 12 | 11.1% |
| $35,000 to $49,999 | 14 | 13.0% |
| $50,000 to $74,999 | 29 | 26.9% |
| $75,000 to $99,999 | 10 | 9.3% |
| $100,000 to $149,999 | 9 | 8.3% |
| $150,000 to $199,999 | 6 | 5.6% |
| $200,000+ | 0 | 0.0% |
Household Income by Householder Age in Clutier
The median household income in Clutier is $48,750, with the highest median household income of $64,250 found in the 25 to 44 years age bracket for the primary householder. A total of 45 households (41.7%) fall into this category. Meanwhile, the 15 to 24 years age bracket for the primary householder has the lowest median household income of $0, with 2 households (1.8%) in this group.
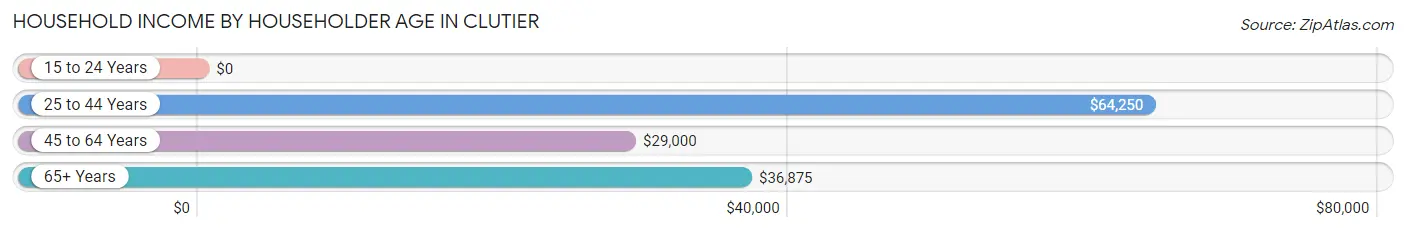
| Income Bracket | # Households | Median Income |
| 15 to 24 Years | 2 (1.8%) | $0 |
| 25 to 44 Years | 45 (41.7%) | $64,250 |
| 45 to 64 Years | 30 (27.8%) | $29,000 |
| 65+ Years | 31 (28.7%) | $36,875 |
| Total | 108 (100.0%) | $48,750 |
Poverty in Clutier
Income Below Poverty by Sex and Age in Clutier
With 10.7% poverty level for males and 16.4% for females among the residents of Clutier, 6 to 11 year old males and 18 to 24 year old females are the most vulnerable to poverty, with 8 males (66.7%) and 2 females (50.0%) in their respective age groups living below the poverty level.
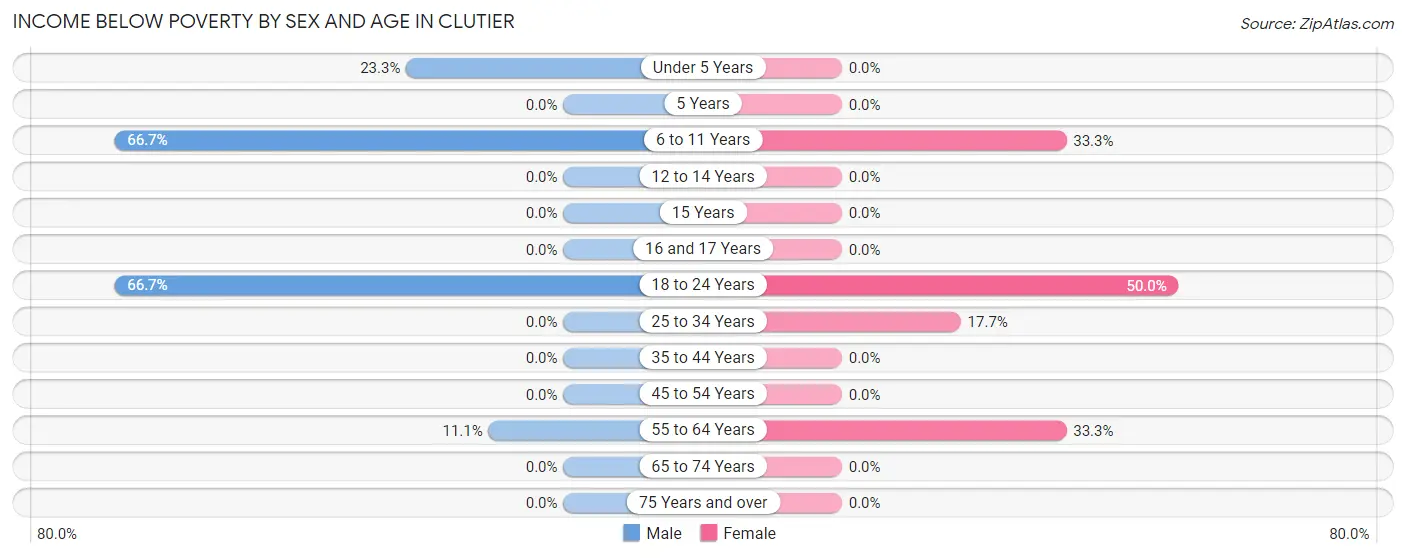
| Age Bracket | Male | Female |
| Under 5 Years | 7 (23.3%) | 0 (0.0%) |
| 5 Years | 0 (0.0%) | 0 (0.0%) |
| 6 to 11 Years | 8 (66.7%) | 2 (33.3%) |
| 12 to 14 Years | 0 (0.0%) | 0 (0.0%) |
| 15 Years | 0 (0.0%) | 0 (0.0%) |
| 16 and 17 Years | 0 (0.0%) | 0 (0.0%) |
| 18 to 24 Years | 2 (66.7%) | 2 (50.0%) |
| 25 to 34 Years | 0 (0.0%) | 6 (17.6%) |
| 35 to 44 Years | 0 (0.0%) | 0 (0.0%) |
| 45 to 54 Years | 0 (0.0%) | 0 (0.0%) |
| 55 to 64 Years | 1 (11.1%) | 7 (33.3%) |
| 65 to 74 Years | 0 (0.0%) | 0 (0.0%) |
| 75 Years and over | 0 (0.0%) | 0 (0.0%) |
| Total | 18 (10.7%) | 17 (16.4%) |
Income Above Poverty by Sex and Age in Clutier
According to the poverty statistics in Clutier, males aged 5 years and females aged under 5 years are the age groups that are most secure financially, with 100.0% of males and 100.0% of females in these age groups living above the poverty line.
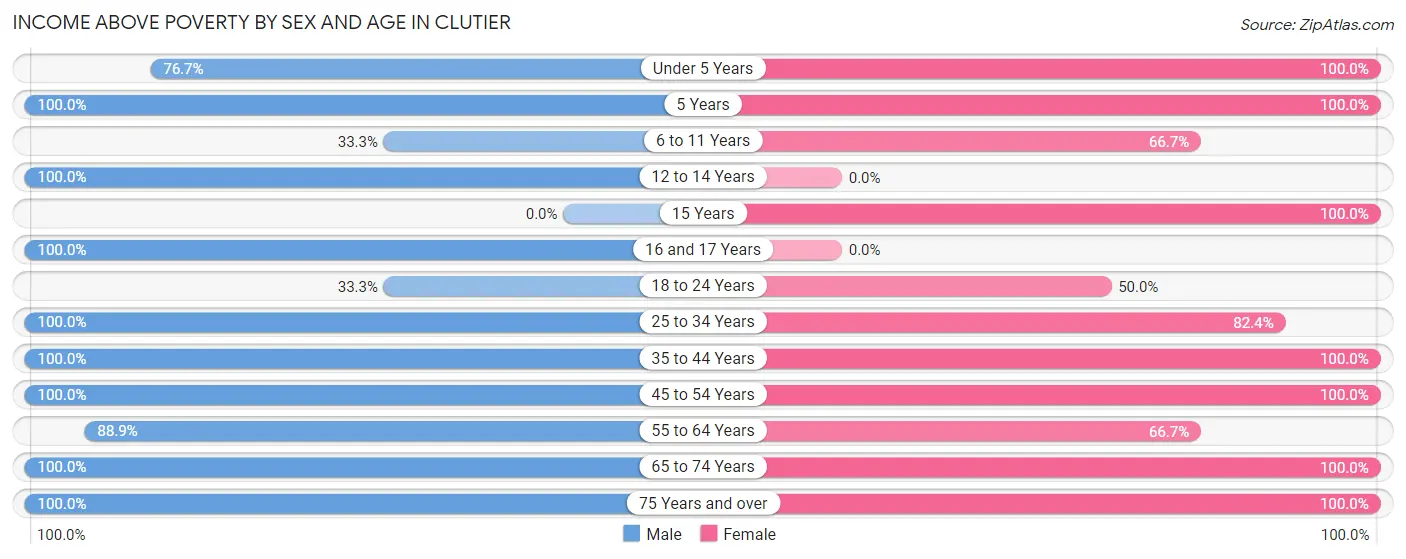
| Age Bracket | Male | Female |
| Under 5 Years | 23 (76.7%) | 1 (100.0%) |
| 5 Years | 16 (100.0%) | 5 (100.0%) |
| 6 to 11 Years | 4 (33.3%) | 4 (66.7%) |
| 12 to 14 Years | 9 (100.0%) | 0 (0.0%) |
| 15 Years | 0 (0.0%) | 5 (100.0%) |
| 16 and 17 Years | 4 (100.0%) | 0 (0.0%) |
| 18 to 24 Years | 1 (33.3%) | 2 (50.0%) |
| 25 to 34 Years | 22 (100.0%) | 28 (82.4%) |
| 35 to 44 Years | 20 (100.0%) | 6 (100.0%) |
| 45 to 54 Years | 18 (100.0%) | 7 (100.0%) |
| 55 to 64 Years | 8 (88.9%) | 14 (66.7%) |
| 65 to 74 Years | 16 (100.0%) | 6 (100.0%) |
| 75 Years and over | 9 (100.0%) | 9 (100.0%) |
| Total | 150 (89.3%) | 87 (83.7%) |
Income Below Poverty Among Married-Couple Families in Clutier
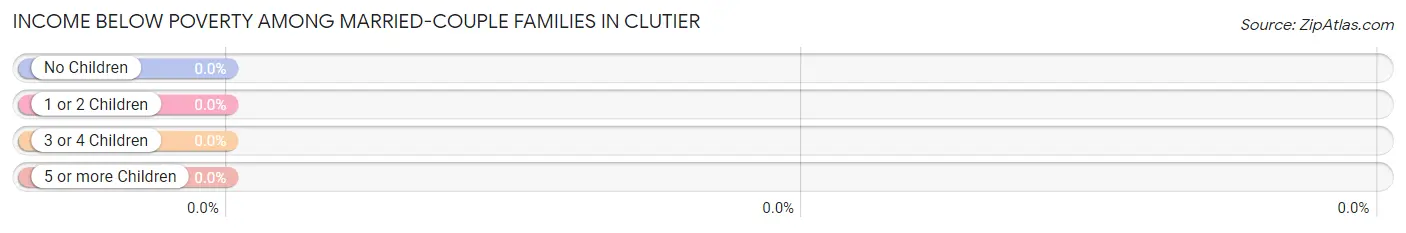
| Children | Above Poverty | Below Poverty |
| No Children | 20 (100.0%) | 0 (0.0%) |
| 1 or 2 Children | 10 (100.0%) | 0 (0.0%) |
| 3 or 4 Children | 11 (100.0%) | 0 (0.0%) |
| 5 or more Children | 0 (0.0%) | 0 (0.0%) |
| Total | 41 (100.0%) | 0 (0.0%) |
Income Below Poverty Among Single-Parent Households in Clutier
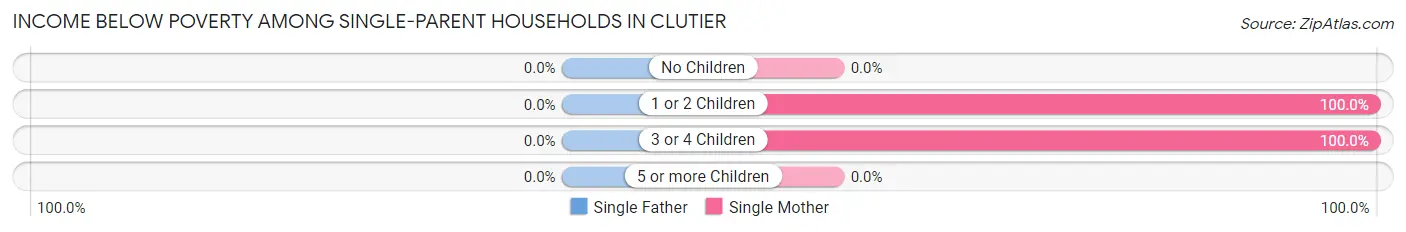
| Children | Single Father | Single Mother |
| No Children | 0 (0.0%) | 0 (0.0%) |
| 1 or 2 Children | 0 (0.0%) | 5 (100.0%) |
| 3 or 4 Children | 0 (0.0%) | 1 (100.0%) |
| 5 or more Children | 0 (0.0%) | 0 (0.0%) |
| Total | 0 (0.0%) | 6 (54.5%) |
Income Below Poverty Among Married-Couple vs Single-Parent Households in Clutier
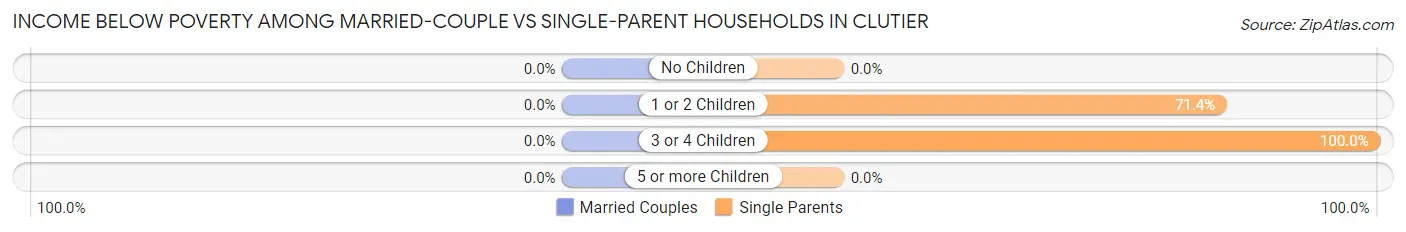
| Children | Married-Couple Families | Single-Parent Households |
| No Children | 0 (0.0%) | 0 (0.0%) |
| 1 or 2 Children | 0 (0.0%) | 5 (71.4%) |
| 3 or 4 Children | 0 (0.0%) | 1 (100.0%) |
| 5 or more Children | 0 (0.0%) | 0 (0.0%) |
| Total | 0 (0.0%) | 6 (46.2%) |
Race in Clutier
The most populous races in Clutier are White / Caucasian (239 | 87.9%), Two or more Races (24 | 8.8%), and Native / Alaskan (6 | 2.2%).
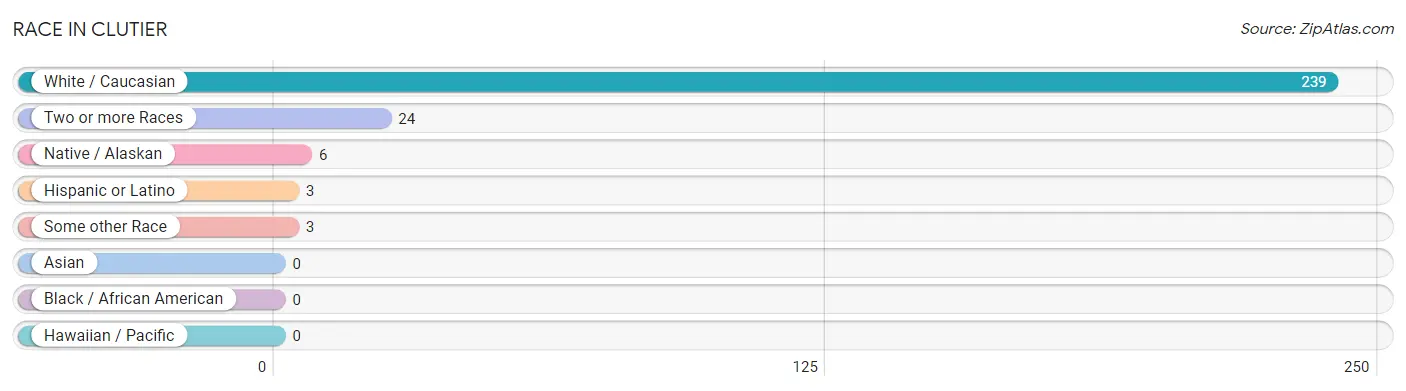
| Race | # Population | % Population |
| Asian | 0 | 0.0% |
| Black / African American | 0 | 0.0% |
| Hawaiian / Pacific | 0 | 0.0% |
| Hispanic or Latino | 3 | 1.1% |
| Native / Alaskan | 6 | 2.2% |
| White / Caucasian | 239 | 87.9% |
| Two or more Races | 24 | 8.8% |
| Some other Race | 3 | 1.1% |
| Total | 272 | 100.0% |
Ancestry in Clutier
The most populous ancestries reported in Clutier are German (135 | 49.6%), Czech (42 | 15.4%), Irish (42 | 15.4%), Cherokee (22 | 8.1%), and English (15 | 5.5%), together accounting for 94.1% of all Clutier residents.
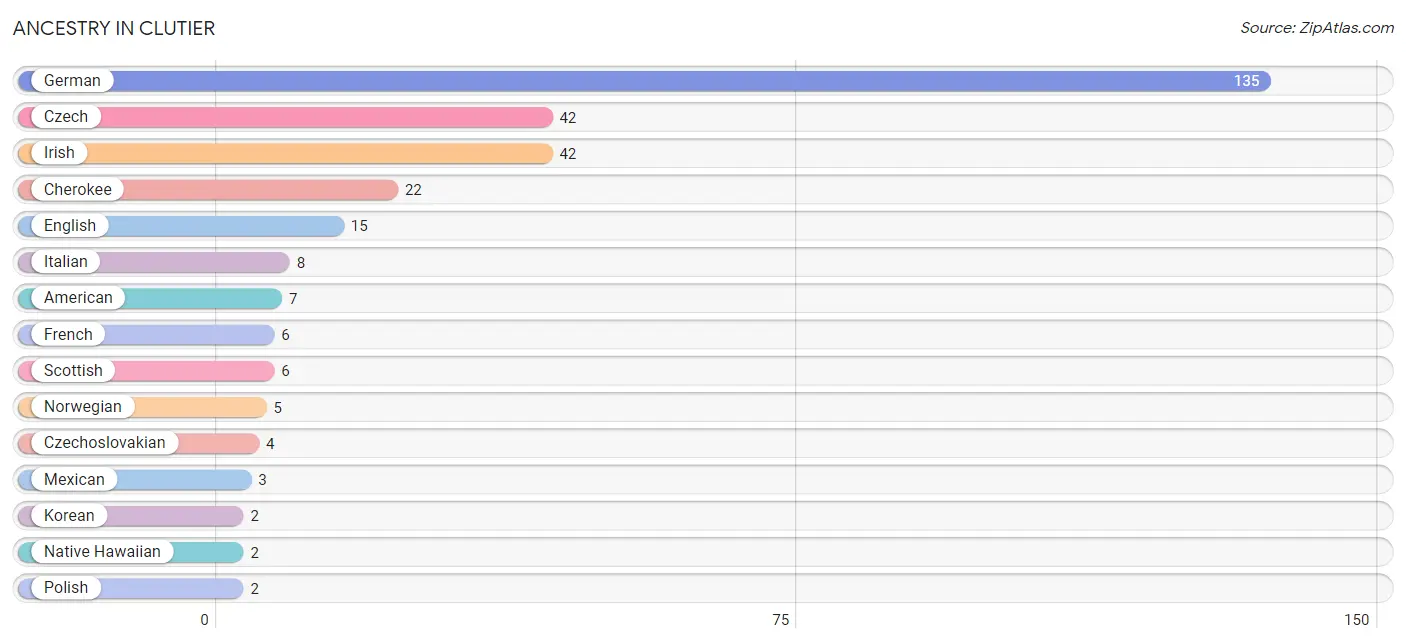
| Ancestry | # Population | % Population |
| American | 7 | 2.6% |
| Cherokee | 22 | 8.1% |
| Czech | 42 | 15.4% |
| Czechoslovakian | 4 | 1.5% |
| Dutch | 1 | 0.4% |
| English | 15 | 5.5% |
| European | 1 | 0.4% |
| French | 6 | 2.2% |
| German | 135 | 49.6% |
| Irish | 42 | 15.4% |
| Italian | 8 | 2.9% |
| Korean | 2 | 0.7% |
| Mexican | 3 | 1.1% |
| Native Hawaiian | 2 | 0.7% |
| Norwegian | 5 | 1.8% |
| Polish | 2 | 0.7% |
| Russian | 1 | 0.4% |
| Scottish | 6 | 2.2% |
| Swedish | 2 | 0.7% | View All 19 Rows |
Immigrants in Clutier
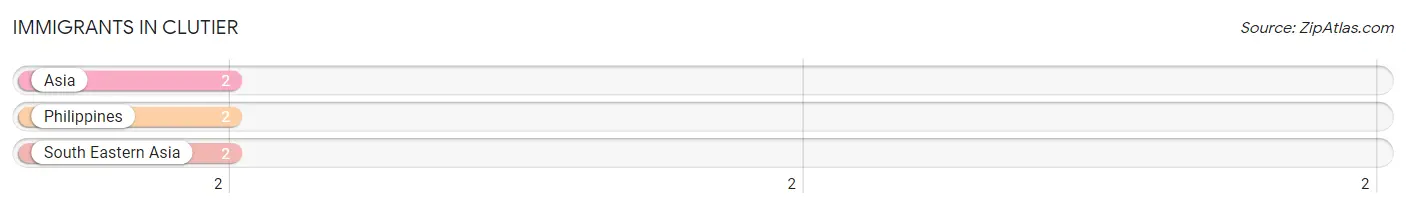
The most numerous immigrant groups reported in Clutier came from Asia (2 | 0.7%), Philippines (2 | 0.7%), and South Eastern Asia (2 | 0.7%), together accounting for 2.2% of all Clutier residents.
| Immigration Origin | # Population | % Population |
| Asia | 2 | 0.7% |
| Philippines | 2 | 0.7% |
| South Eastern Asia | 2 | 0.7% | View All 3 Rows |
Sex and Age in Clutier
Sex and Age in Clutier
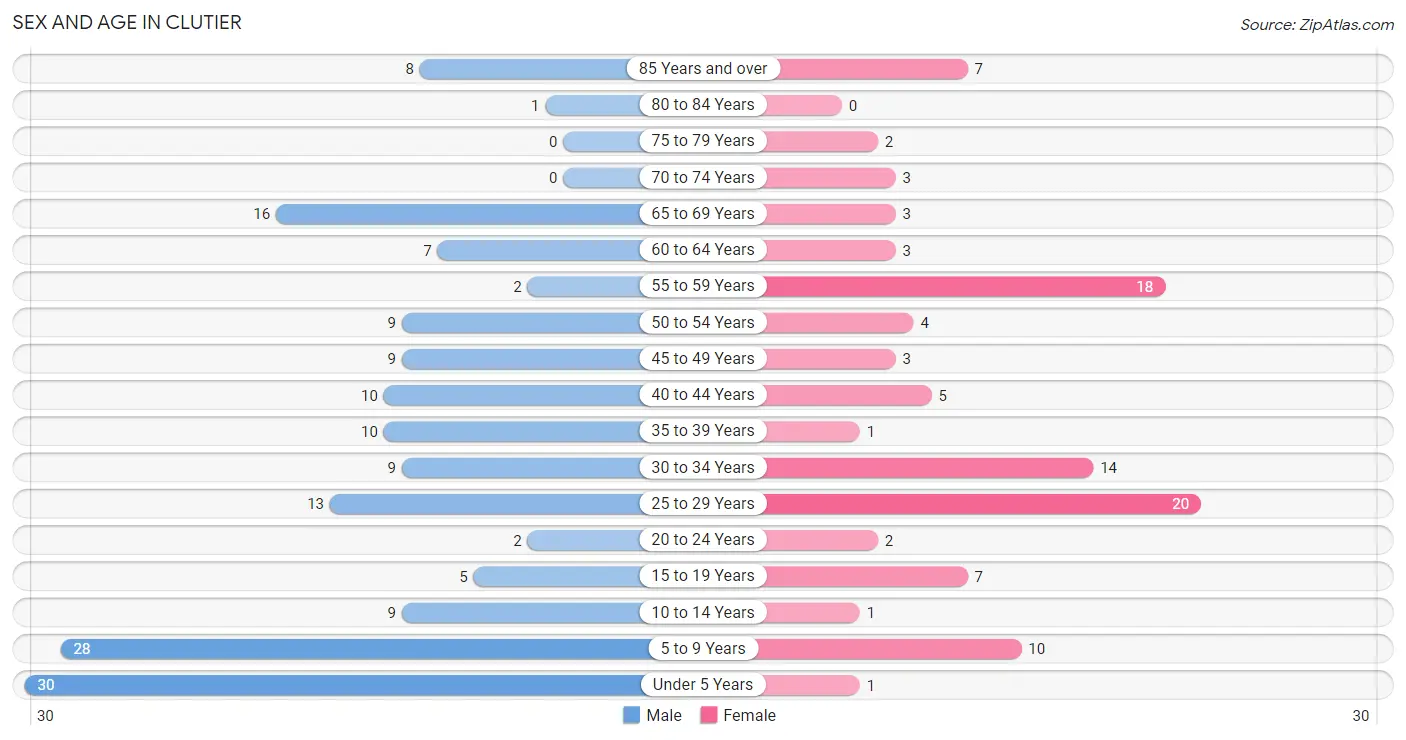
The most populous age groups in Clutier are Under 5 Years (30 | 17.9%) for men and 25 to 29 Years (20 | 19.2%) for women.
| Age Bracket | Male | Female |
| Under 5 Years | 30 (17.9%) | 1 (1.0%) |
| 5 to 9 Years | 28 (16.7%) | 10 (9.6%) |
| 10 to 14 Years | 9 (5.4%) | 1 (1.0%) |
| 15 to 19 Years | 5 (3.0%) | 7 (6.7%) |
| 20 to 24 Years | 2 (1.2%) | 2 (1.9%) |
| 25 to 29 Years | 13 (7.7%) | 20 (19.2%) |
| 30 to 34 Years | 9 (5.4%) | 14 (13.5%) |
| 35 to 39 Years | 10 (5.9%) | 1 (1.0%) |
| 40 to 44 Years | 10 (5.9%) | 5 (4.8%) |
| 45 to 49 Years | 9 (5.4%) | 3 (2.9%) |
| 50 to 54 Years | 9 (5.4%) | 4 (3.8%) |
| 55 to 59 Years | 2 (1.2%) | 18 (17.3%) |
| 60 to 64 Years | 7 (4.2%) | 3 (2.9%) |
| 65 to 69 Years | 16 (9.5%) | 3 (2.9%) |
| 70 to 74 Years | 0 (0.0%) | 3 (2.9%) |
| 75 to 79 Years | 0 (0.0%) | 2 (1.9%) |
| 80 to 84 Years | 1 (0.6%) | 0 (0.0%) |
| 85 Years and over | 8 (4.8%) | 7 (6.7%) |
| Total | 168 (100.0%) | 104 (100.0%) |
Families and Households in Clutier
Median Family Size in Clutier
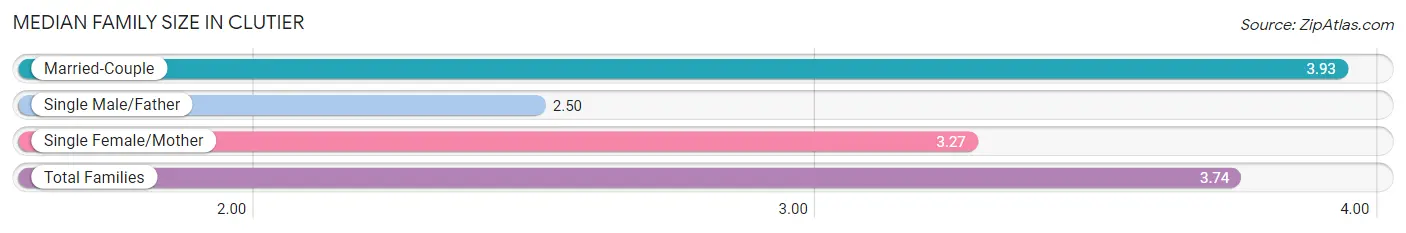
The median family size in Clutier is 3.74 persons per family, with married-couple families (41 | 75.9%) accounting for the largest median family size of 3.93 persons per family. On the other hand, single male/father families (2 | 3.7%) represent the smallest median family size with 2.50 persons per family.
| Family Type | # Families | Family Size |
| Married-Couple | 41 (75.9%) | 3.93 |
| Single Male/Father | 2 (3.7%) | 2.50 |
| Single Female/Mother | 11 (20.4%) | 3.27 |
| Total Families | 54 (100.0%) | 3.74 |
Median Household Size in Clutier
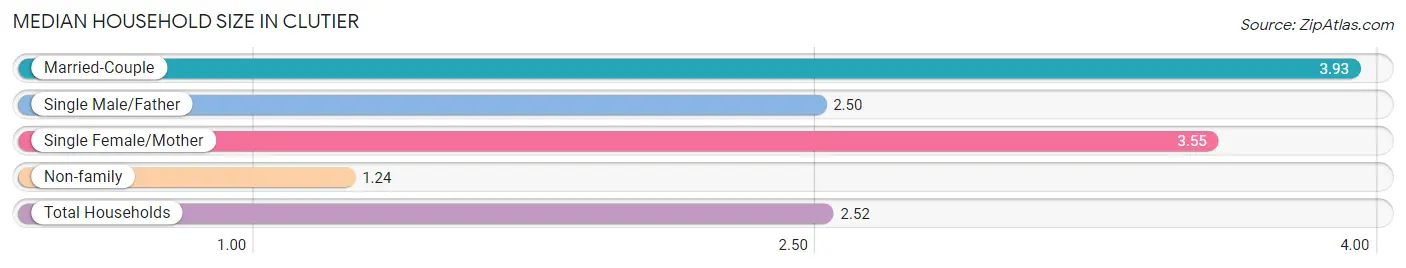
The median household size in Clutier is 2.52 persons per household, with married-couple households (41 | 38.0%) accounting for the largest median household size of 3.93 persons per household. non-family households (54 | 50.0%) represent the smallest median household size with 1.24 persons per household.
| Household Type | # Households | Household Size |
| Married-Couple | 41 (38.0%) | 3.93 |
| Single Male/Father | 2 (1.8%) | 2.50 |
| Single Female/Mother | 11 (10.2%) | 3.55 |
| Non-family | 54 (50.0%) | 1.24 |
| Total Households | 108 (100.0%) | 2.52 |
Household Size by Marriage Status in Clutier
Out of a total of 108 households in Clutier, 54 (50.0%) are family households, while 54 (50.0%) are nonfamily households. The most numerous type of family households are 2-person households, comprising 25, and the most common type of nonfamily households are 1-person households, comprising 41.
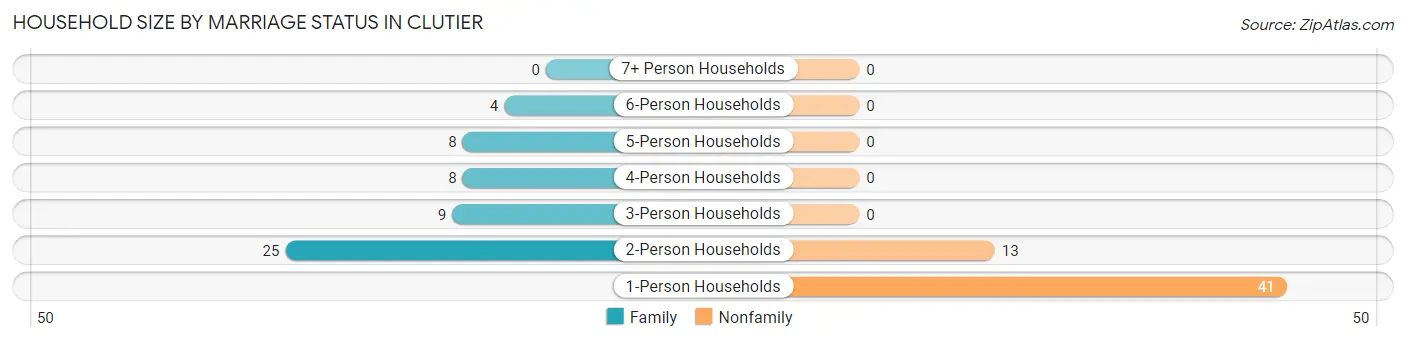
| Household Size | Family Households | Nonfamily Households |
| 1-Person Households | - | 41 (38.0%) |
| 2-Person Households | 25 (23.2%) | 13 (12.0%) |
| 3-Person Households | 9 (8.3%) | 0 (0.0%) |
| 4-Person Households | 8 (7.4%) | 0 (0.0%) |
| 5-Person Households | 8 (7.4%) | 0 (0.0%) |
| 6-Person Households | 4 (3.7%) | 0 (0.0%) |
| 7+ Person Households | 0 (0.0%) | 0 (0.0%) |
| Total | 54 (50.0%) | 54 (50.0%) |
Female Fertility in Clutier
Fertility by Age in Clutier
Average fertility rate in Clutier is 19.0 births per 1,000 women. Women in the age bracket of 20 to 34 years have the highest fertility rate with 28.0 births per 1,000 women. Women in the age bracket of 20 to 34 years acount for 100.0% of all women with births.
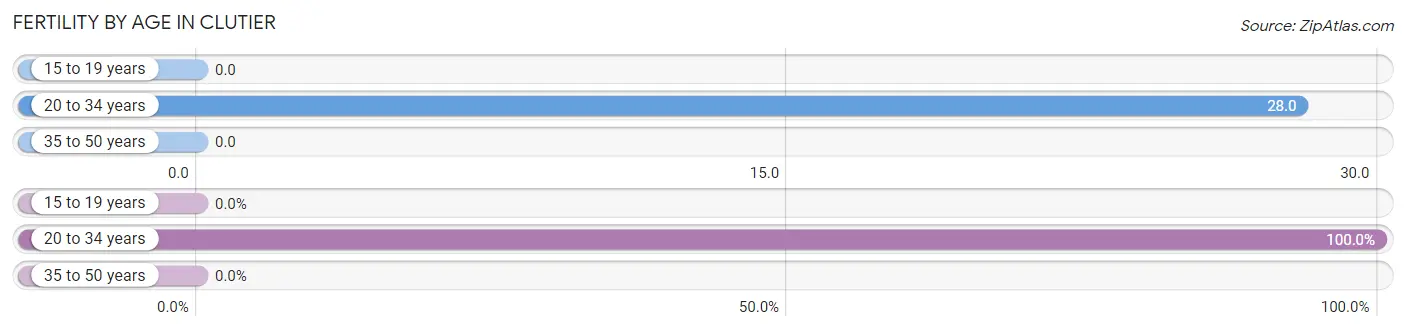
| Age Bracket | Women with Births | Births / 1,000 Women |
| 15 to 19 years | 0 (0.0%) | 0.0 |
| 20 to 34 years | 1 (100.0%) | 28.0 |
| 35 to 50 years | 0 (0.0%) | 0.0 |
| Total | 1 (100.0%) | 19.0 |
Fertility by Age by Marriage Status in Clutier
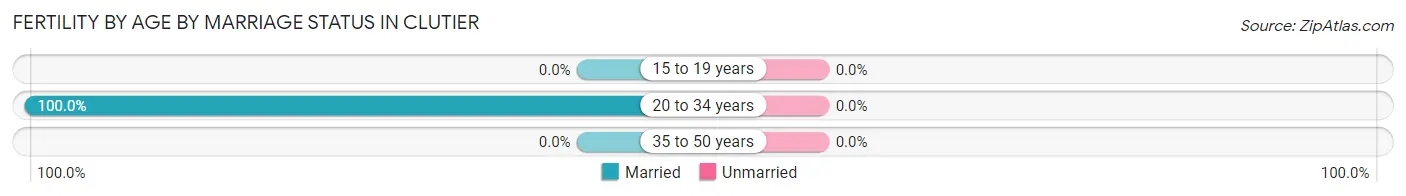
| Age Bracket | Married | Unmarried |
| 15 to 19 years | 0 (0.0%) | 0 (0.0%) |
| 20 to 34 years | 1 (100.0%) | 0 (0.0%) |
| 35 to 50 years | 0 (0.0%) | 0 (0.0%) |
| Total | 1 (100.0%) | 0 (0.0%) |
Fertility by Education in Clutier
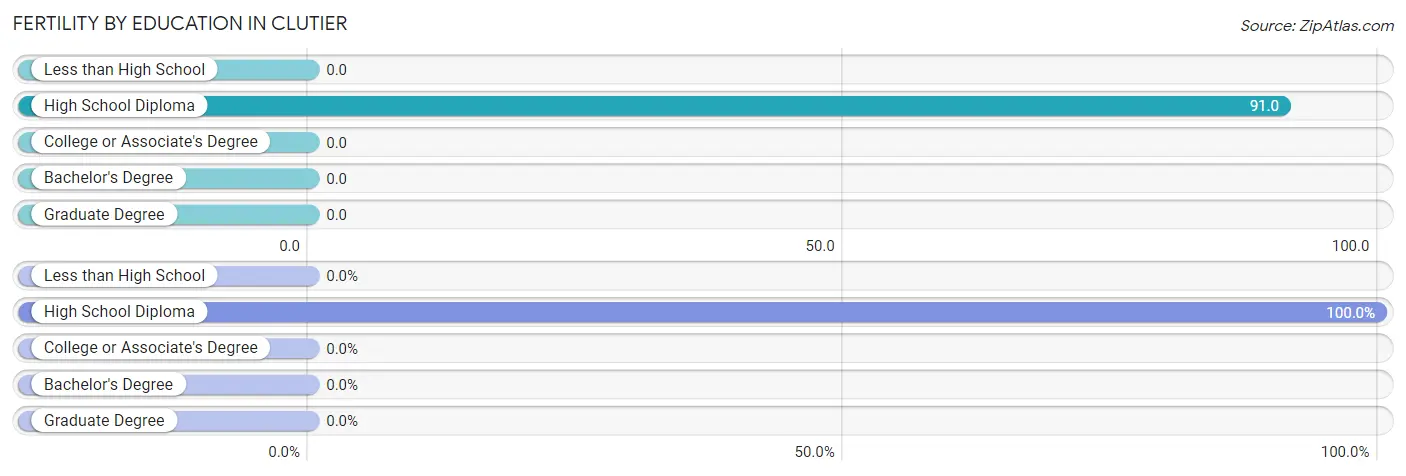
| Educational Attainment | Women with Births | Births / 1,000 Women |
| Less than High School | 0 (0.0%) | 0.0 |
| High School Diploma | 1 (100.0%) | 91.0 |
| College or Associate's Degree | 0 (0.0%) | 0.0 |
| Bachelor's Degree | 0 (0.0%) | 0.0 |
| Graduate Degree | 0 (0.0%) | 0.0 |
| Total | 1 (100.0%) | 19.0 |
Fertility by Education by Marriage Status in Clutier
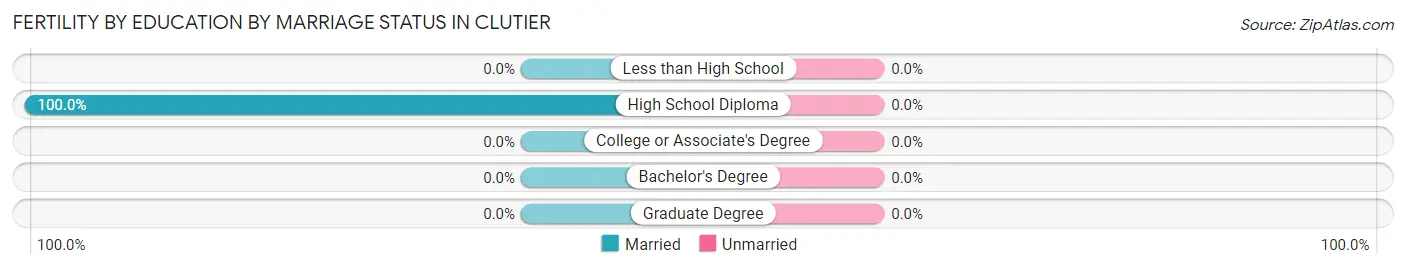
| Educational Attainment | Married | Unmarried |
| Less than High School | 0 (0.0%) | 0 (0.0%) |
| High School Diploma | 1 (100.0%) | 0 (0.0%) |
| College or Associate's Degree | 0 (0.0%) | 0 (0.0%) |
| Bachelor's Degree | 0 (0.0%) | 0 (0.0%) |
| Graduate Degree | 0 (0.0%) | 0 (0.0%) |
| Total | 1 (100.0%) | 0 (0.0%) |
Employment Characteristics in Clutier
Employment by Class of Employer in Clutier
Among the 126 employed individuals in Clutier, private company employees (95 | 75.4%), local government employees (12 | 9.5%), and self-employed (incorporated) (8 | 6.4%) make up the most common classes of employment.
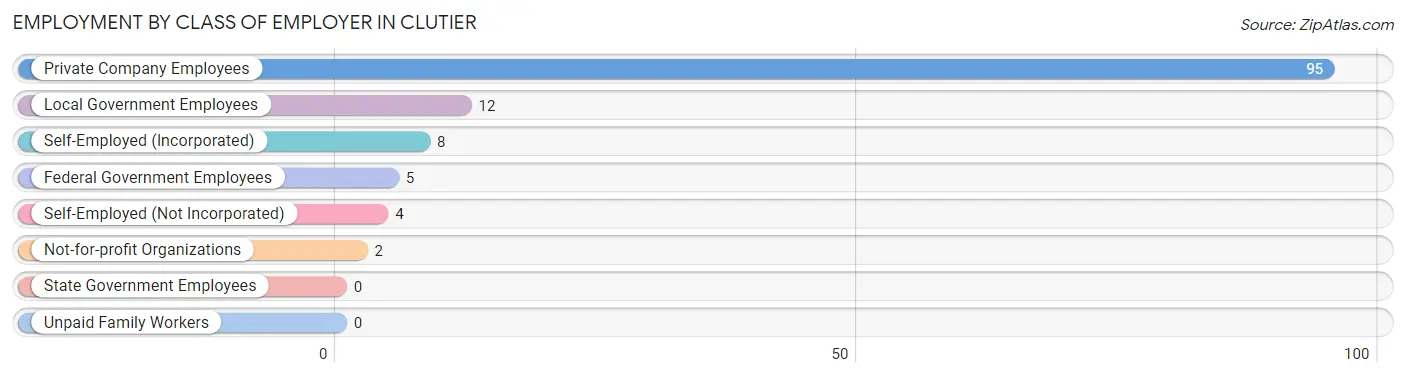
| Employer Class | # Employees | % Employees |
| Private Company Employees | 95 | 75.4% |
| Self-Employed (Incorporated) | 8 | 6.4% |
| Self-Employed (Not Incorporated) | 4 | 3.2% |
| Not-for-profit Organizations | 2 | 1.6% |
| Local Government Employees | 12 | 9.5% |
| State Government Employees | 0 | 0.0% |
| Federal Government Employees | 5 | 4.0% |
| Unpaid Family Workers | 0 | 0.0% |
| Total | 126 | 100.0% |
Employment Status by Age in Clutier
According to the labor force statistics for Clutier, out of the total population over 16 years of age (188), 72.9% or 137 individuals are in the labor force, with 8.3% or 11 of them unemployed. The age group with the highest labor force participation rate is 20 to 24 years, with 100.0% or 4 individuals in the labor force. Within the labor force, the 55 to 59 years age range has the highest percentage of unemployed individuals, with 35.3% or 6 of them being unemployed.
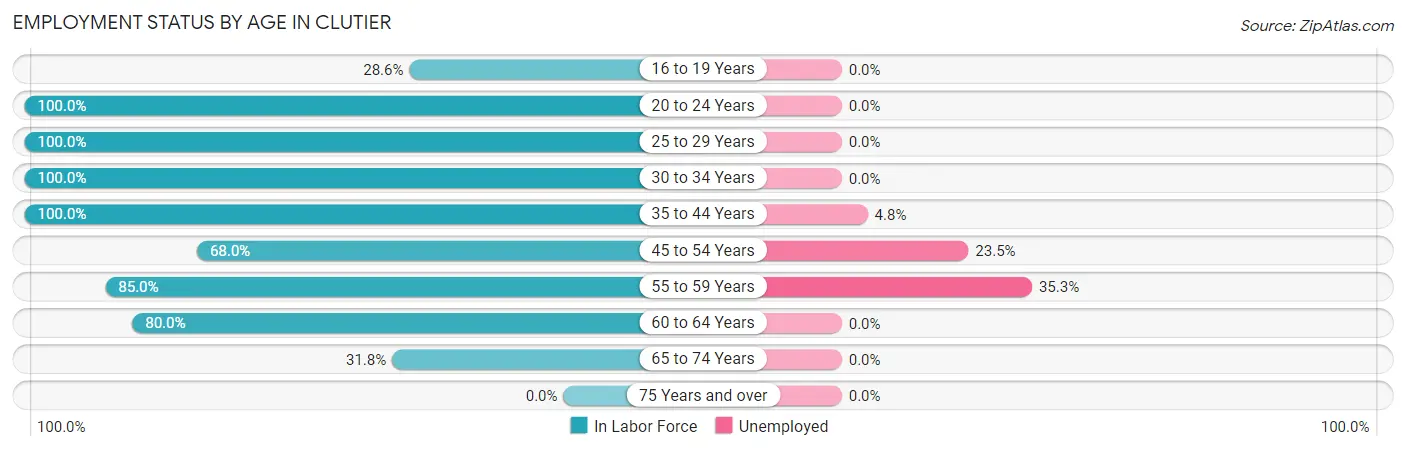
| Age Bracket | In Labor Force | Unemployed |
| 16 to 19 Years | 2 (28.6%) | 0 (0.0%) |
| 20 to 24 Years | 4 (100.0%) | 0 (0.0%) |
| 25 to 29 Years | 33 (100.0%) | 0 (0.0%) |
| 30 to 34 Years | 23 (100.0%) | 0 (0.0%) |
| 35 to 44 Years | 26 (100.0%) | 1 (4.8%) |
| 45 to 54 Years | 17 (68.0%) | 4 (23.5%) |
| 55 to 59 Years | 17 (85.0%) | 6 (35.3%) |
| 60 to 64 Years | 8 (80.0%) | 0 (0.0%) |
| 65 to 74 Years | 7 (31.8%) | 0 (0.0%) |
| 75 Years and over | 0 (0.0%) | 0 (0.0%) |
| Total | 137 (72.9%) | 11 (8.3%) |
Employment Status by Educational Attainment in Clutier
According to labor force statistics for Clutier, 90.5% of individuals (124) out of the total population between 25 and 64 years of age (137) are in the labor force, with 9.2% or 11 of them being unemployed. The group with the highest labor force participation rate are those with the educational attainment of bachelor's degree or higher, with 100.0% or 9 individuals in the labor force. Within the labor force, individuals with high school diploma education have the highest percentage of unemployment, with 12.5% or 6 of them being unemployed.
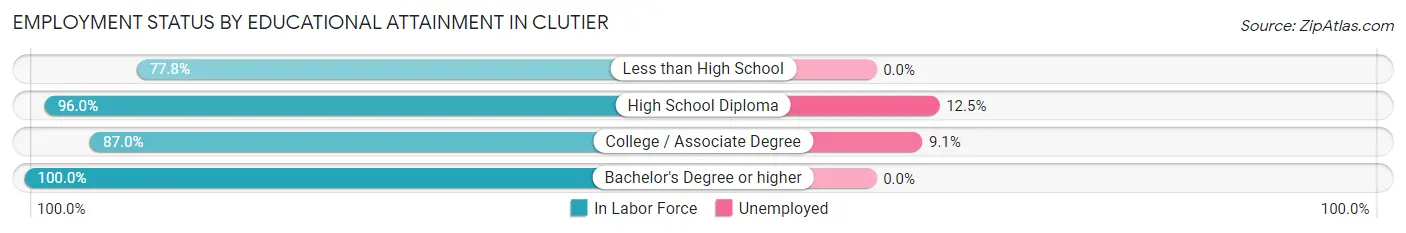
| Educational Attainment | In Labor Force | Unemployed |
| Less than High School | 7 (77.8%) | 0 (0.0%) |
| High School Diploma | 48 (96.0%) | 6 (12.5%) |
| College / Associate Degree | 60 (87.0%) | 6 (9.1%) |
| Bachelor's Degree or higher | 9 (100.0%) | 0 (0.0%) |
| Total | 124 (90.5%) | 13 (9.2%) |
Employment Occupations by Sex in Clutier
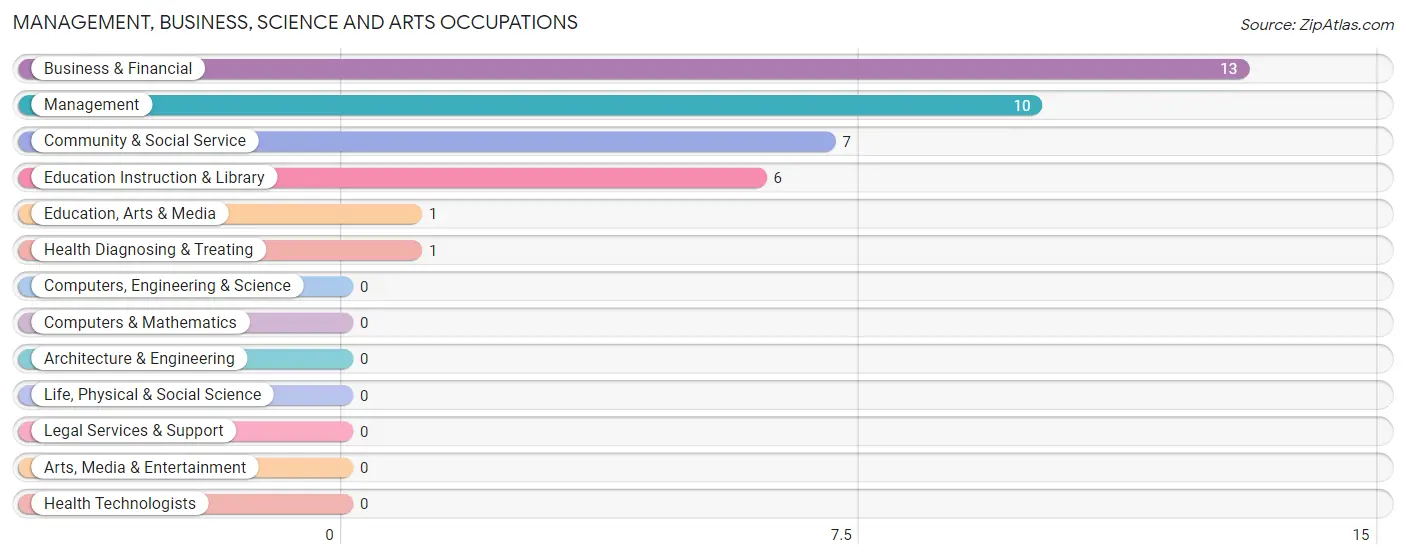
Management, Business, Science and Arts Occupations
The most common Management, Business, Science and Arts occupations in Clutier are Business & Financial (13 | 10.7%), Management (10 | 8.3%), Community & Social Service (7 | 5.8%), Education Instruction & Library (6 | 5.0%), and Education, Arts & Media (1 | 0.8%).
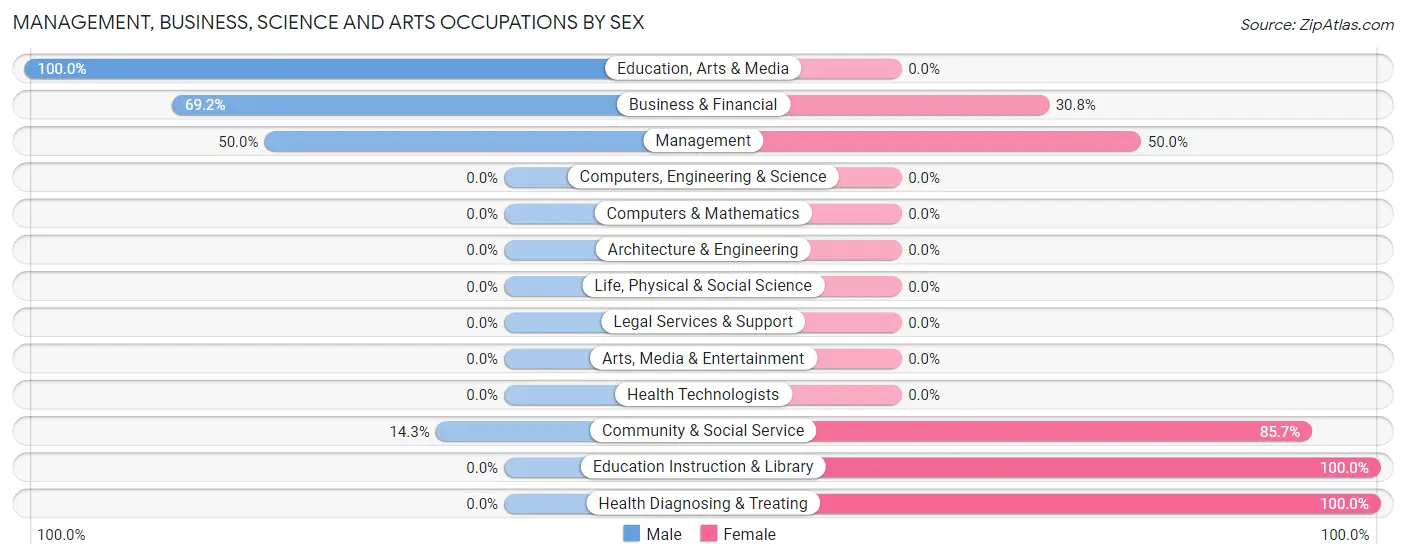
Management, Business, Science and Arts Occupations by Sex
Within the Management, Business, Science and Arts occupations in Clutier, the most male-oriented occupations are Education, Arts & Media (100.0%), Business & Financial (69.2%), and Management (50.0%), while the most female-oriented occupations are Education Instruction & Library (100.0%), Health Diagnosing & Treating (100.0%), and Community & Social Service (85.7%).
| Occupation | Male | Female |
| Management | 5 (50.0%) | 5 (50.0%) |
| Business & Financial | 9 (69.2%) | 4 (30.8%) |
| Computers, Engineering & Science | 0 (0.0%) | 0 (0.0%) |
| Computers & Mathematics | 0 (0.0%) | 0 (0.0%) |
| Architecture & Engineering | 0 (0.0%) | 0 (0.0%) |
| Life, Physical & Social Science | 0 (0.0%) | 0 (0.0%) |
| Community & Social Service | 1 (14.3%) | 6 (85.7%) |
| Education, Arts & Media | 1 (100.0%) | 0 (0.0%) |
| Legal Services & Support | 0 (0.0%) | 0 (0.0%) |
| Education Instruction & Library | 0 (0.0%) | 6 (100.0%) |
| Arts, Media & Entertainment | 0 (0.0%) | 0 (0.0%) |
| Health Diagnosing & Treating | 0 (0.0%) | 1 (100.0%) |
| Health Technologists | 0 (0.0%) | 0 (0.0%) |
| Total (Category) | 15 (48.4%) | 16 (51.6%) |
| Total (Overall) | 60 (49.6%) | 61 (50.4%) |
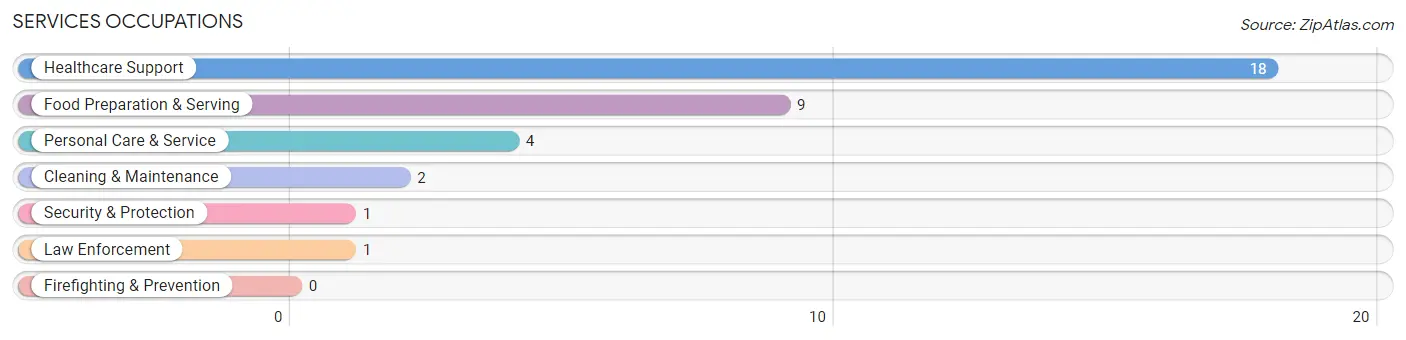
Services Occupations
The most common Services occupations in Clutier are Healthcare Support (18 | 14.9%), Food Preparation & Serving (9 | 7.4%), Personal Care & Service (4 | 3.3%), Cleaning & Maintenance (2 | 1.7%), and Security & Protection (1 | 0.8%).
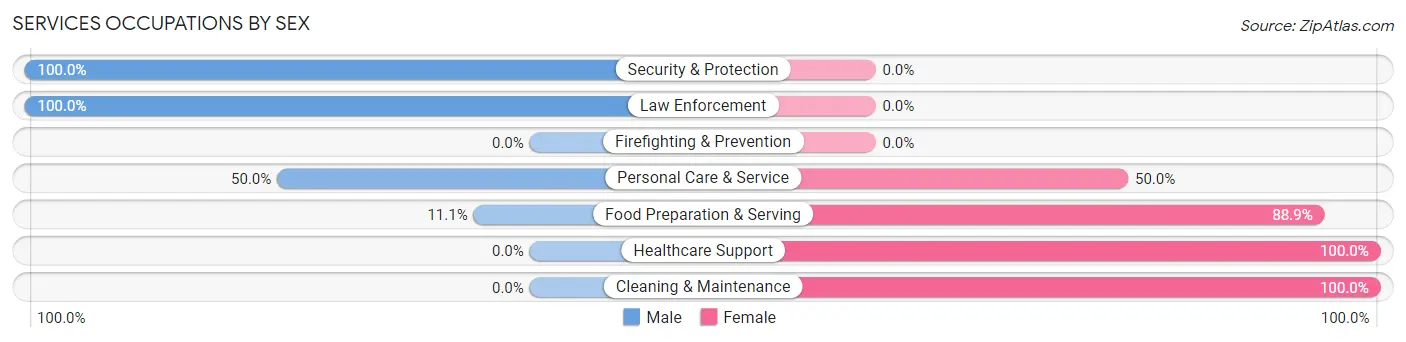
Services Occupations by Sex
Within the Services occupations in Clutier, the most male-oriented occupations are Security & Protection (100.0%), Law Enforcement (100.0%), and Personal Care & Service (50.0%), while the most female-oriented occupations are Healthcare Support (100.0%), Cleaning & Maintenance (100.0%), and Food Preparation & Serving (88.9%).
| Occupation | Male | Female |
| Healthcare Support | 0 (0.0%) | 18 (100.0%) |
| Security & Protection | 1 (100.0%) | 0 (0.0%) |
| Firefighting & Prevention | 0 (0.0%) | 0 (0.0%) |
| Law Enforcement | 1 (100.0%) | 0 (0.0%) |
| Food Preparation & Serving | 1 (11.1%) | 8 (88.9%) |
| Cleaning & Maintenance | 0 (0.0%) | 2 (100.0%) |
| Personal Care & Service | 2 (50.0%) | 2 (50.0%) |
| Total (Category) | 4 (11.8%) | 30 (88.2%) |
| Total (Overall) | 60 (49.6%) | 61 (50.4%) |
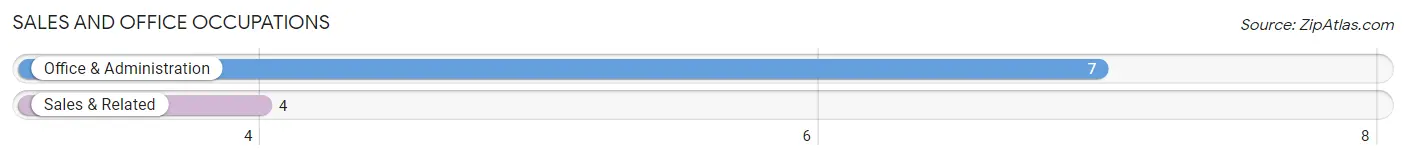
Sales and Office Occupations
The most common Sales and Office occupations in Clutier are Office & Administration (7 | 5.8%), and Sales & Related (4 | 3.3%).
Sales and Office Occupations by Sex
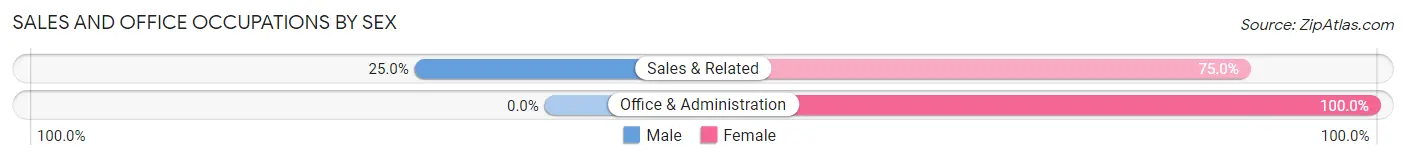
| Occupation | Male | Female |
| Sales & Related | 1 (25.0%) | 3 (75.0%) |
| Office & Administration | 0 (0.0%) | 7 (100.0%) |
| Total (Category) | 1 (9.1%) | 10 (90.9%) |
| Total (Overall) | 60 (49.6%) | 61 (50.4%) |
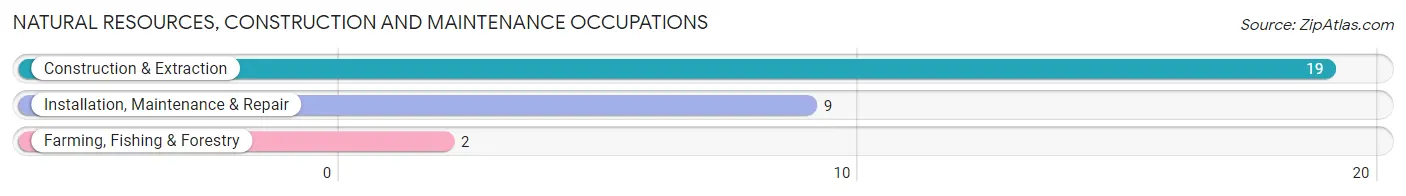
Natural Resources, Construction and Maintenance Occupations
The most common Natural Resources, Construction and Maintenance occupations in Clutier are Construction & Extraction (19 | 15.7%), Installation, Maintenance & Repair (9 | 7.4%), and Farming, Fishing & Forestry (2 | 1.7%).
Natural Resources, Construction and Maintenance Occupations by Sex
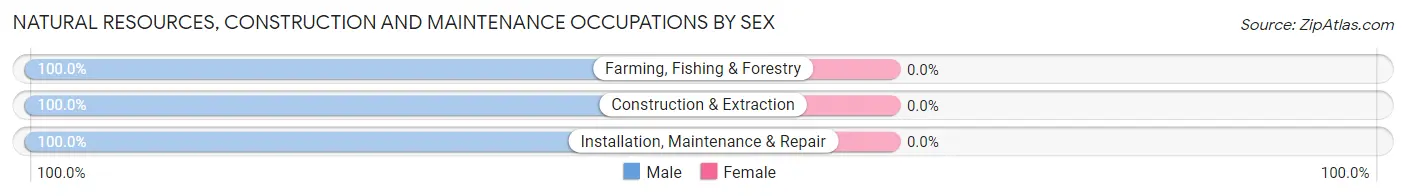
| Occupation | Male | Female |
| Farming, Fishing & Forestry | 2 (100.0%) | 0 (0.0%) |
| Construction & Extraction | 19 (100.0%) | 0 (0.0%) |
| Installation, Maintenance & Repair | 9 (100.0%) | 0 (0.0%) |
| Total (Category) | 30 (100.0%) | 0 (0.0%) |
| Total (Overall) | 60 (49.6%) | 61 (50.4%) |
Production, Transportation and Moving Occupations
The most common Production, Transportation and Moving occupations in Clutier are Material Moving (8 | 6.6%), and Production (7 | 5.8%).
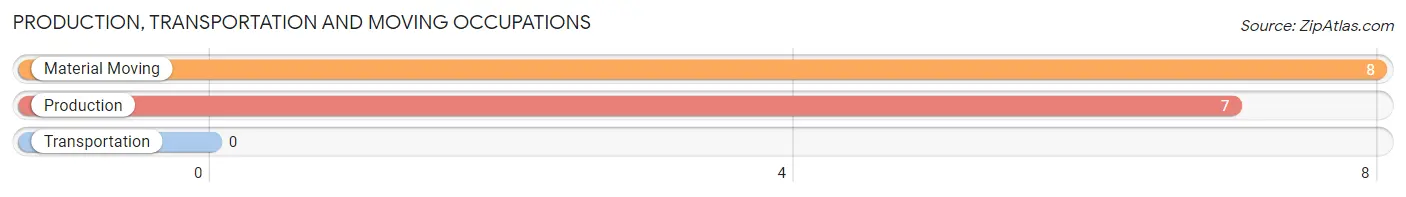
Production, Transportation and Moving Occupations by Sex
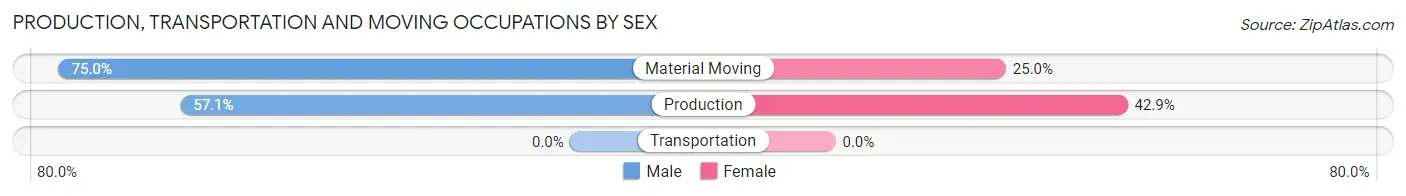
| Occupation | Male | Female |
| Production | 4 (57.1%) | 3 (42.9%) |
| Transportation | 0 (0.0%) | 0 (0.0%) |
| Material Moving | 6 (75.0%) | 2 (25.0%) |
| Total (Category) | 10 (66.7%) | 5 (33.3%) |
| Total (Overall) | 60 (49.6%) | 61 (50.4%) |
Employment Industries by Sex in Clutier
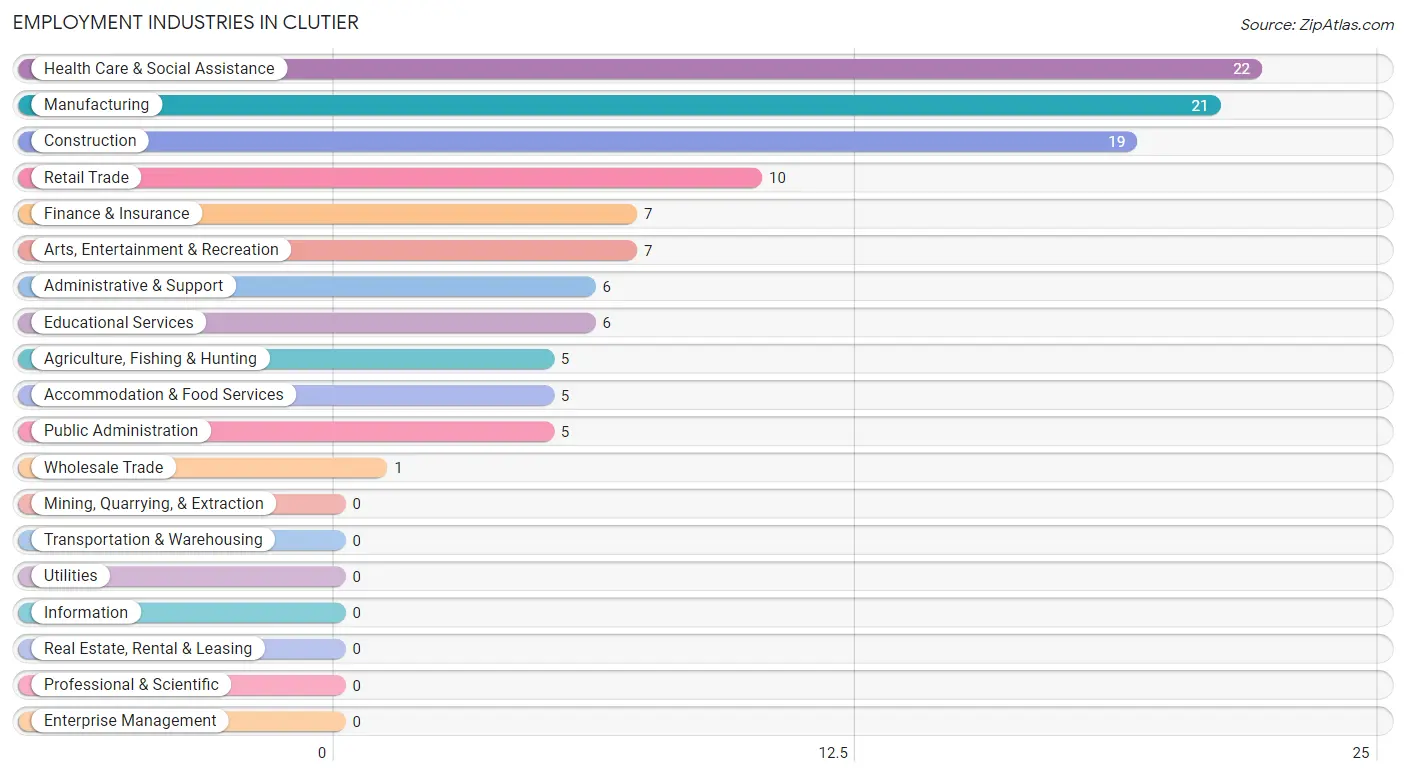
Employment Industries in Clutier
The major employment industries in Clutier include Health Care & Social Assistance (22 | 18.2%), Manufacturing (21 | 17.4%), Construction (19 | 15.7%), Retail Trade (10 | 8.3%), and Finance & Insurance (7 | 5.8%).
Employment Industries by Sex in Clutier
The Clutier industries that see more men than women are Agriculture, Fishing & Hunting (100.0%), Construction (100.0%), and Wholesale Trade (100.0%), whereas the industries that tend to have a higher number of women are Educational Services (100.0%), Health Care & Social Assistance (100.0%), and Accommodation & Food Services (100.0%).
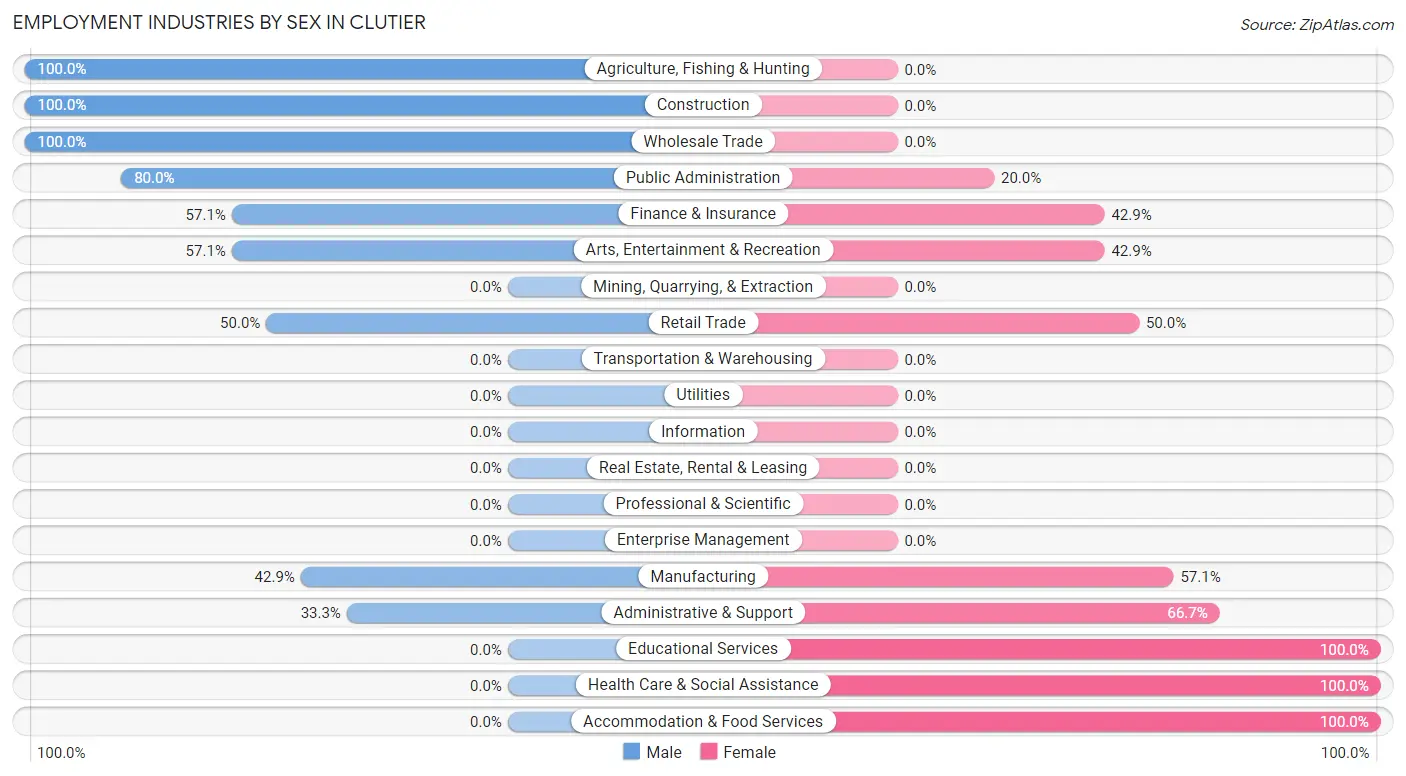
| Industry | Male | Female |
| Agriculture, Fishing & Hunting | 5 (100.0%) | 0 (0.0%) |
| Mining, Quarrying, & Extraction | 0 (0.0%) | 0 (0.0%) |
| Construction | 19 (100.0%) | 0 (0.0%) |
| Manufacturing | 9 (42.9%) | 12 (57.1%) |
| Wholesale Trade | 1 (100.0%) | 0 (0.0%) |
| Retail Trade | 5 (50.0%) | 5 (50.0%) |
| Transportation & Warehousing | 0 (0.0%) | 0 (0.0%) |
| Utilities | 0 (0.0%) | 0 (0.0%) |
| Information | 0 (0.0%) | 0 (0.0%) |
| Finance & Insurance | 4 (57.1%) | 3 (42.9%) |
| Real Estate, Rental & Leasing | 0 (0.0%) | 0 (0.0%) |
| Professional & Scientific | 0 (0.0%) | 0 (0.0%) |
| Enterprise Management | 0 (0.0%) | 0 (0.0%) |
| Administrative & Support | 2 (33.3%) | 4 (66.7%) |
| Educational Services | 0 (0.0%) | 6 (100.0%) |
| Health Care & Social Assistance | 0 (0.0%) | 22 (100.0%) |
| Arts, Entertainment & Recreation | 4 (57.1%) | 3 (42.9%) |
| Accommodation & Food Services | 0 (0.0%) | 5 (100.0%) |
| Public Administration | 4 (80.0%) | 1 (20.0%) |
| Total | 60 (49.6%) | 61 (50.4%) |
Education in Clutier
School Enrollment in Clutier
The most common levels of schooling among the 69 students in Clutier are elementary school (34 | 49.3%), high school (10 | 14.5%), and middle school (9 | 13.0%).
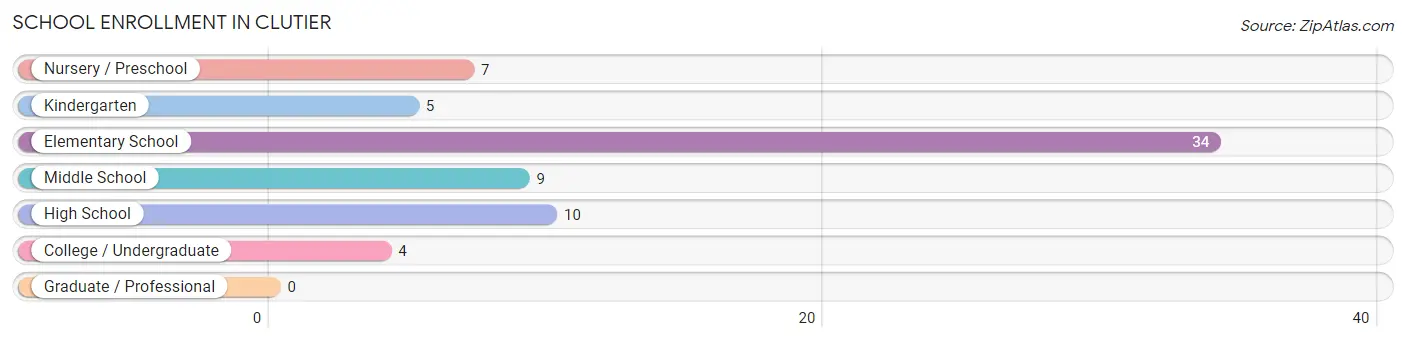
| School Level | # Students | % Students |
| Nursery / Preschool | 7 | 10.1% |
| Kindergarten | 5 | 7.2% |
| Elementary School | 34 | 49.3% |
| Middle School | 9 | 13.0% |
| High School | 10 | 14.5% |
| College / Undergraduate | 4 | 5.8% |
| Graduate / Professional | 0 | 0.0% |
| Total | 69 | 100.0% |
School Enrollment by Age by Funding Source in Clutier
Out of a total of 69 students who are enrolled in schools in Clutier, 1 (1.4%) attend a private institution, while the remaining 68 (98.6%) are enrolled in public schools. The age group of 25 to 34 year olds has the highest likelihood of being enrolled in private schools, with 1 (50.0% in the age bracket) enrolled. Conversely, the age group of 3 to 4 year olds has the lowest likelihood of being enrolled in a private school, with 7 (100.0% in the age bracket) attending a public institution.
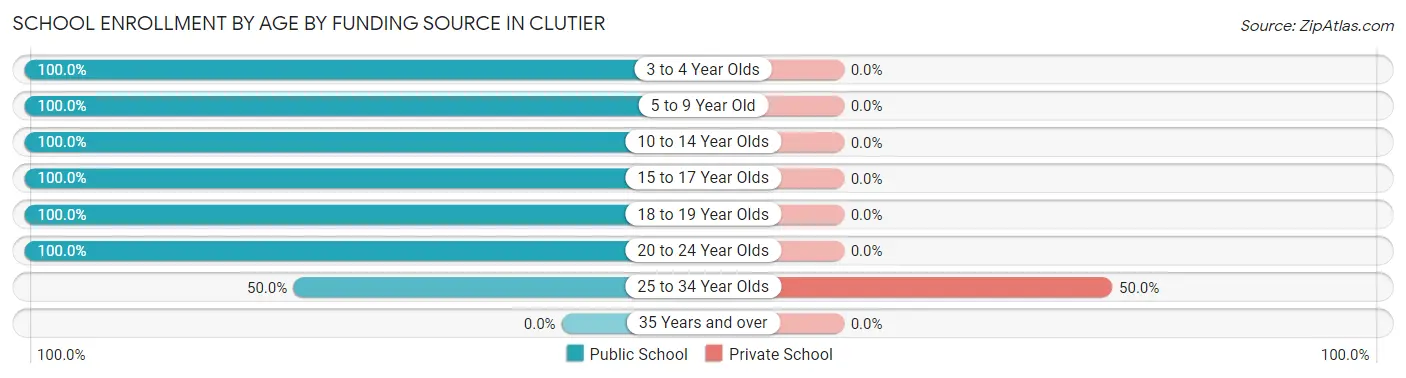
| Age Bracket | Public School | Private School |
| 3 to 4 Year Olds | 7 (100.0%) | 0 (0.0%) |
| 5 to 9 Year Old | 38 (100.0%) | 0 (0.0%) |
| 10 to 14 Year Olds | 10 (100.0%) | 0 (0.0%) |
| 15 to 17 Year Olds | 9 (100.0%) | 0 (0.0%) |
| 18 to 19 Year Olds | 1 (100.0%) | 0 (0.0%) |
| 20 to 24 Year Olds | 2 (100.0%) | 0 (0.0%) |
| 25 to 34 Year Olds | 1 (50.0%) | 1 (50.0%) |
| 35 Years and over | 0 (0.0%) | 0 (0.0%) |
| Total | 68 (98.6%) | 1 (1.4%) |
Educational Attainment by Field of Study in Clutier
Arts & humanities (6 | 40.0%), computers & mathematics (4 | 26.7%), education (3 | 20.0%), science & technology (1 | 6.7%), and business (1 | 6.7%) are the most common fields of study among 15 individuals in Clutier who have obtained a bachelor's degree or higher.
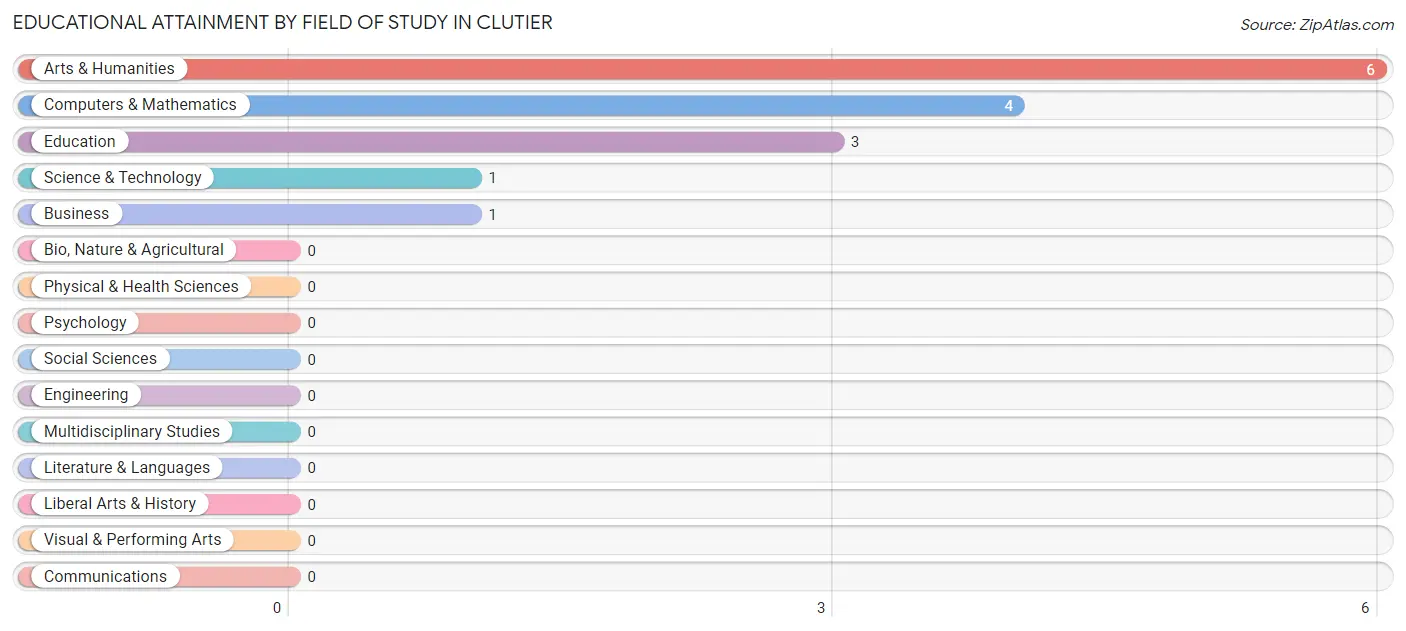
| Field of Study | # Graduates | % Graduates |
| Computers & Mathematics | 4 | 26.7% |
| Bio, Nature & Agricultural | 0 | 0.0% |
| Physical & Health Sciences | 0 | 0.0% |
| Psychology | 0 | 0.0% |
| Social Sciences | 0 | 0.0% |
| Engineering | 0 | 0.0% |
| Multidisciplinary Studies | 0 | 0.0% |
| Science & Technology | 1 | 6.7% |
| Business | 1 | 6.7% |
| Education | 3 | 20.0% |
| Literature & Languages | 0 | 0.0% |
| Liberal Arts & History | 0 | 0.0% |
| Visual & Performing Arts | 0 | 0.0% |
| Communications | 0 | 0.0% |
| Arts & Humanities | 6 | 40.0% |
| Total | 15 | 100.0% |
Transportation & Commute in Clutier
Vehicle Availability by Sex in Clutier
The most prevalent vehicle ownership categories in Clutier are males with 2 vehicles (38, accounting for 58.5%) and females with 2 vehicles (37, making up 62.3%).
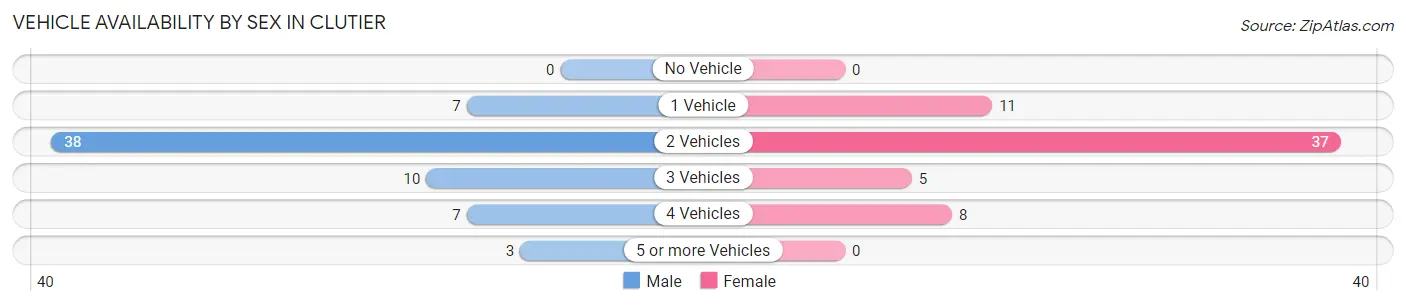
| Vehicles Available | Male | Female |
| No Vehicle | 0 (0.0%) | 0 (0.0%) |
| 1 Vehicle | 7 (10.8%) | 11 (18.0%) |
| 2 Vehicles | 38 (58.5%) | 37 (60.7%) |
| 3 Vehicles | 10 (15.4%) | 5 (8.2%) |
| 4 Vehicles | 7 (10.8%) | 8 (13.1%) |
| 5 or more Vehicles | 3 (4.6%) | 0 (0.0%) |
| Total | 65 (100.0%) | 61 (100.0%) |
Commute Time in Clutier
The most frequently occuring commute durations in Clutier are 60 to 89 minutes (24 commuters, 23.5%), 20 to 24 minutes (16 commuters, 15.7%), and 30 to 34 minutes (14 commuters, 13.7%).
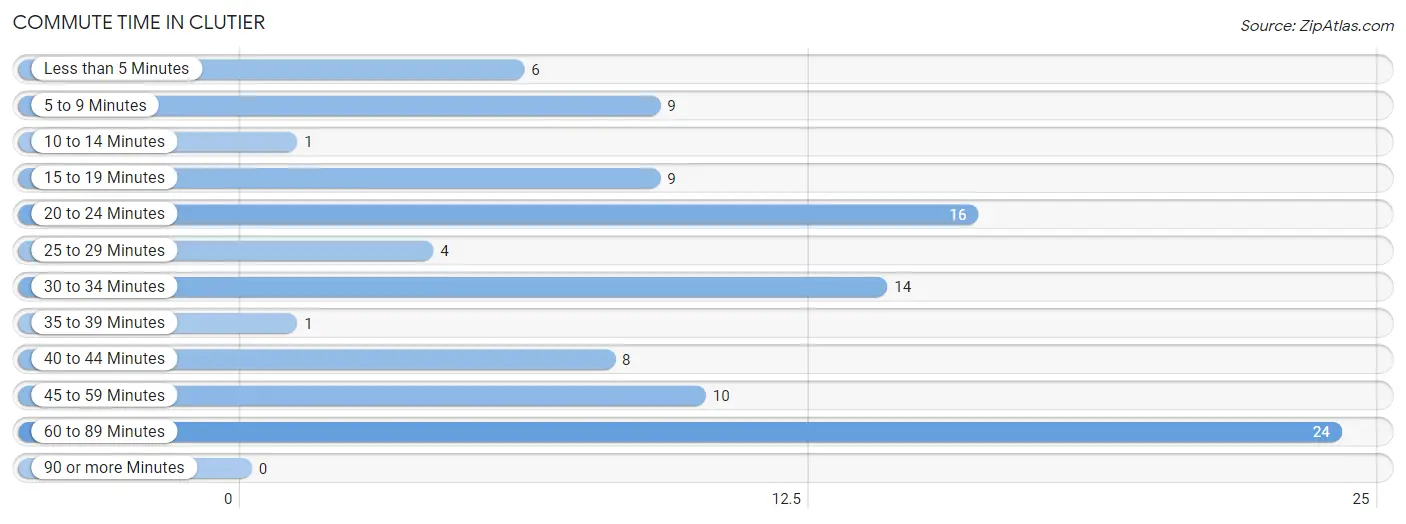
| Commute Time | # Commuters | % Commuters |
| Less than 5 Minutes | 6 | 5.9% |
| 5 to 9 Minutes | 9 | 8.8% |
| 10 to 14 Minutes | 1 | 1.0% |
| 15 to 19 Minutes | 9 | 8.8% |
| 20 to 24 Minutes | 16 | 15.7% |
| 25 to 29 Minutes | 4 | 3.9% |
| 30 to 34 Minutes | 14 | 13.7% |
| 35 to 39 Minutes | 1 | 1.0% |
| 40 to 44 Minutes | 8 | 7.8% |
| 45 to 59 Minutes | 10 | 9.8% |
| 60 to 89 Minutes | 24 | 23.5% |
| 90 or more Minutes | 0 | 0.0% |
Commute Time by Sex in Clutier
The most common commute times in Clutier are 60 to 89 minutes (21 commuters, 35.6%) for males and 20 to 24 minutes (15 commuters, 34.9%) for females.
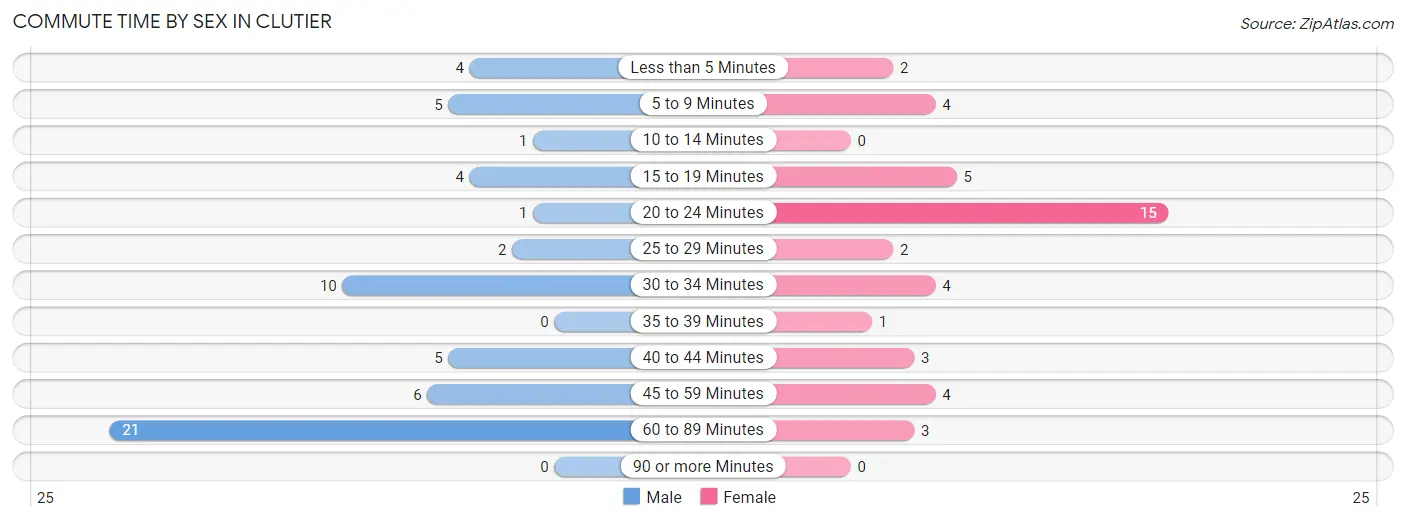
| Commute Time | Male | Female |
| Less than 5 Minutes | 4 (6.8%) | 2 (4.6%) |
| 5 to 9 Minutes | 5 (8.5%) | 4 (9.3%) |
| 10 to 14 Minutes | 1 (1.7%) | 0 (0.0%) |
| 15 to 19 Minutes | 4 (6.8%) | 5 (11.6%) |
| 20 to 24 Minutes | 1 (1.7%) | 15 (34.9%) |
| 25 to 29 Minutes | 2 (3.4%) | 2 (4.6%) |
| 30 to 34 Minutes | 10 (17.0%) | 4 (9.3%) |
| 35 to 39 Minutes | 0 (0.0%) | 1 (2.3%) |
| 40 to 44 Minutes | 5 (8.5%) | 3 (7.0%) |
| 45 to 59 Minutes | 6 (10.2%) | 4 (9.3%) |
| 60 to 89 Minutes | 21 (35.6%) | 3 (7.0%) |
| 90 or more Minutes | 0 (0.0%) | 0 (0.0%) |
Time of Departure to Work by Sex in Clutier
The most frequent times of departure to work in Clutier are 12:00 PM to 3:59 PM (14, 23.7%) for males and 7:00 AM to 7:29 AM (11, 25.6%) for females.
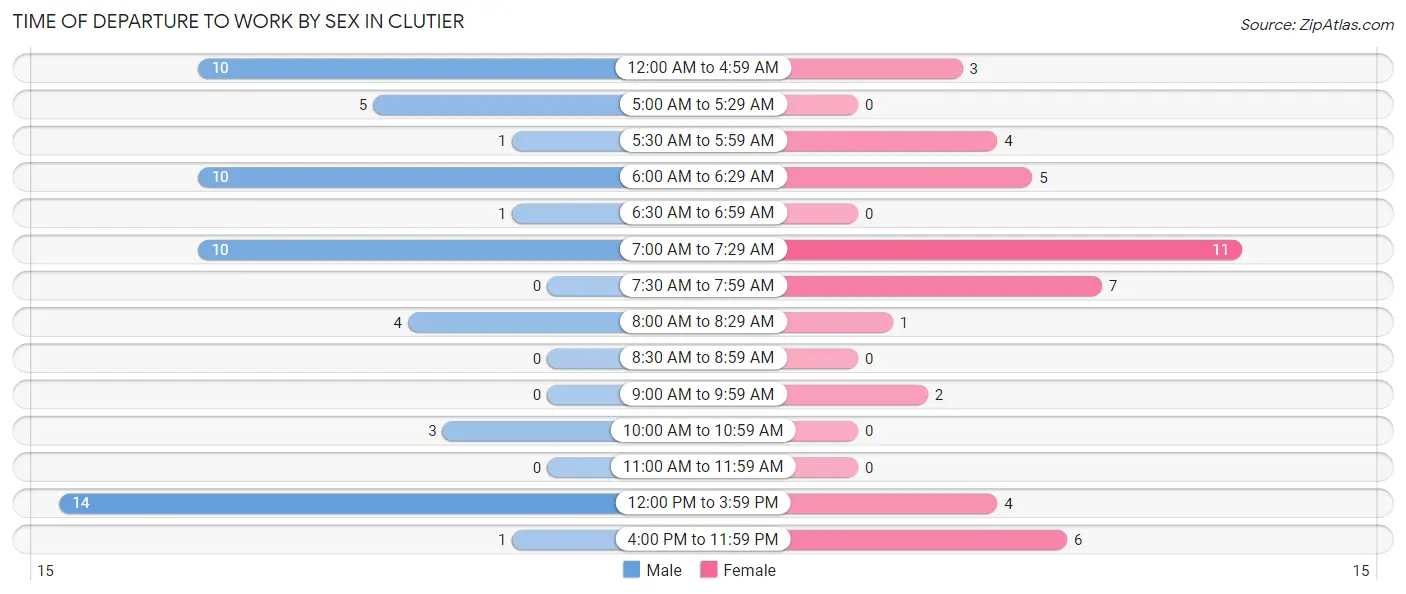
| Time of Departure | Male | Female |
| 12:00 AM to 4:59 AM | 10 (17.0%) | 3 (7.0%) |
| 5:00 AM to 5:29 AM | 5 (8.5%) | 0 (0.0%) |
| 5:30 AM to 5:59 AM | 1 (1.7%) | 4 (9.3%) |
| 6:00 AM to 6:29 AM | 10 (17.0%) | 5 (11.6%) |
| 6:30 AM to 6:59 AM | 1 (1.7%) | 0 (0.0%) |
| 7:00 AM to 7:29 AM | 10 (17.0%) | 11 (25.6%) |
| 7:30 AM to 7:59 AM | 0 (0.0%) | 7 (16.3%) |
| 8:00 AM to 8:29 AM | 4 (6.8%) | 1 (2.3%) |
| 8:30 AM to 8:59 AM | 0 (0.0%) | 0 (0.0%) |
| 9:00 AM to 9:59 AM | 0 (0.0%) | 2 (4.6%) |
| 10:00 AM to 10:59 AM | 3 (5.1%) | 0 (0.0%) |
| 11:00 AM to 11:59 AM | 0 (0.0%) | 0 (0.0%) |
| 12:00 PM to 3:59 PM | 14 (23.7%) | 4 (9.3%) |
| 4:00 PM to 11:59 PM | 1 (1.7%) | 6 (14.0%) |
| Total | 59 (100.0%) | 43 (100.0%) |
Housing Occupancy in Clutier
Occupancy by Ownership in Clutier
Of the total 108 dwellings in Clutier, owner-occupied units account for 87 (80.6%), while renter-occupied units make up 21 (19.4%).
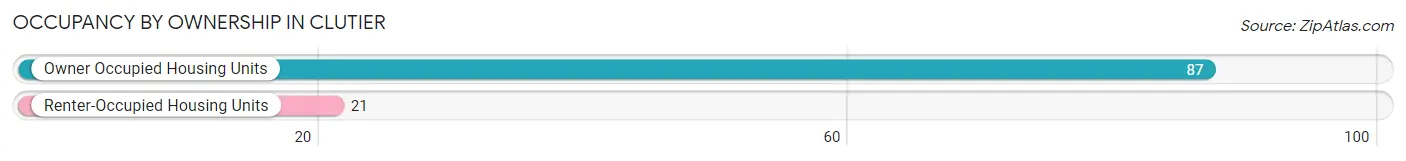
| Occupancy | # Housing Units | % Housing Units |
| Owner Occupied Housing Units | 87 | 80.6% |
| Renter-Occupied Housing Units | 21 | 19.4% |
| Total Occupied Housing Units | 108 | 100.0% |
Occupancy by Household Size in Clutier
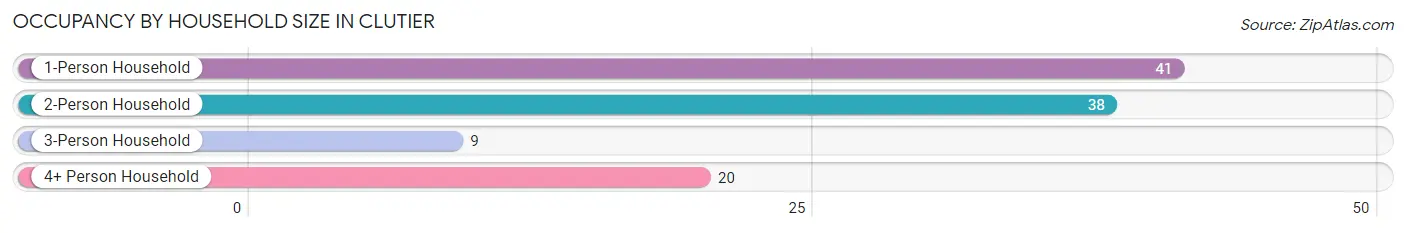
| Household Size | # Housing Units | % Housing Units |
| 1-Person Household | 41 | 38.0% |
| 2-Person Household | 38 | 35.2% |
| 3-Person Household | 9 | 8.3% |
| 4+ Person Household | 20 | 18.5% |
| Total Housing Units | 108 | 100.0% |
Occupancy by Ownership by Household Size in Clutier
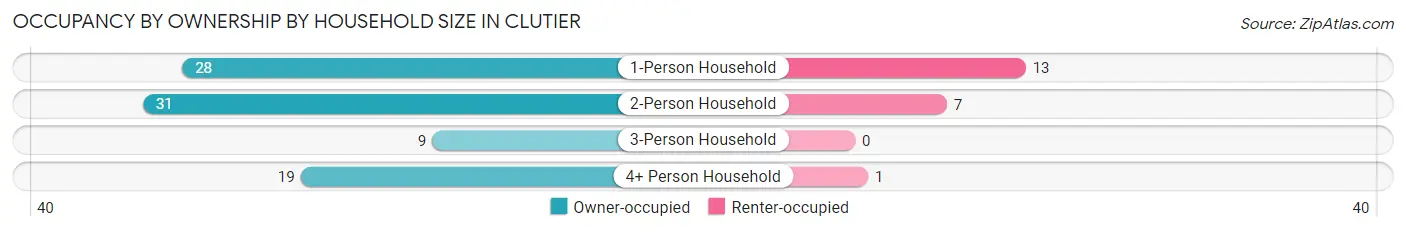
| Household Size | Owner-occupied | Renter-occupied |
| 1-Person Household | 28 (68.3%) | 13 (31.7%) |
| 2-Person Household | 31 (81.6%) | 7 (18.4%) |
| 3-Person Household | 9 (100.0%) | 0 (0.0%) |
| 4+ Person Household | 19 (95.0%) | 1 (5.0%) |
| Total Housing Units | 87 (80.6%) | 21 (19.4%) |
Occupancy by Educational Attainment in Clutier
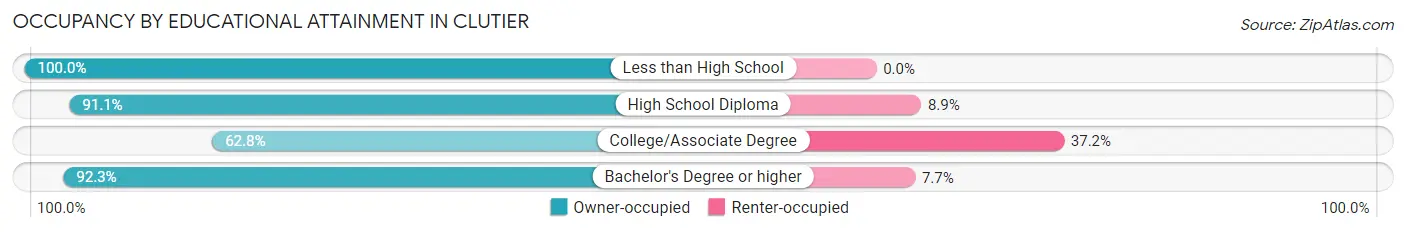
| Household Size | Owner-occupied | Renter-occupied |
| Less than High School | 7 (100.0%) | 0 (0.0%) |
| High School Diploma | 41 (91.1%) | 4 (8.9%) |
| College/Associate Degree | 27 (62.8%) | 16 (37.2%) |
| Bachelor's Degree or higher | 12 (92.3%) | 1 (7.7%) |
Occupancy by Age of Householder in Clutier
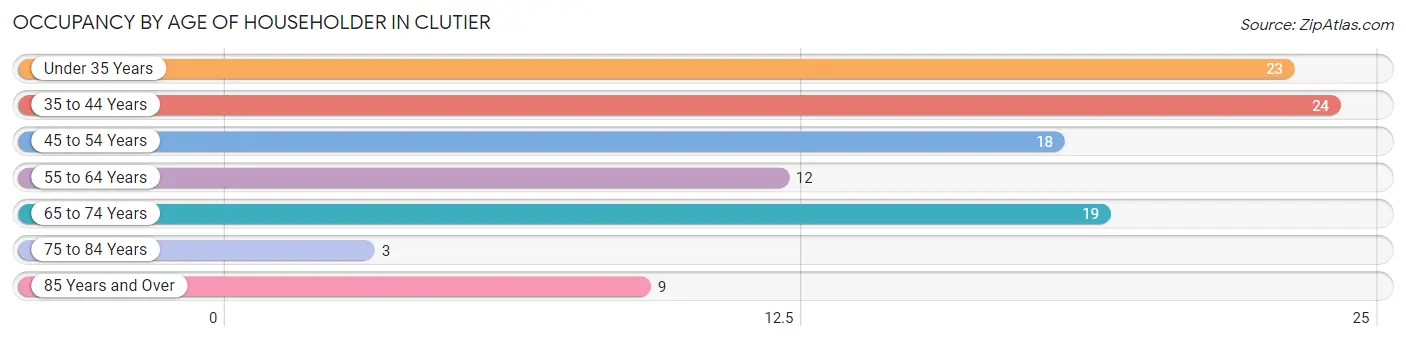
| Age Bracket | # Households | % Households |
| Under 35 Years | 23 | 21.3% |
| 35 to 44 Years | 24 | 22.2% |
| 45 to 54 Years | 18 | 16.7% |
| 55 to 64 Years | 12 | 11.1% |
| 65 to 74 Years | 19 | 17.6% |
| 75 to 84 Years | 3 | 2.8% |
| 85 Years and Over | 9 | 8.3% |
| Total | 108 | 100.0% |
Housing Finances in Clutier
Median Income by Occupancy in Clutier
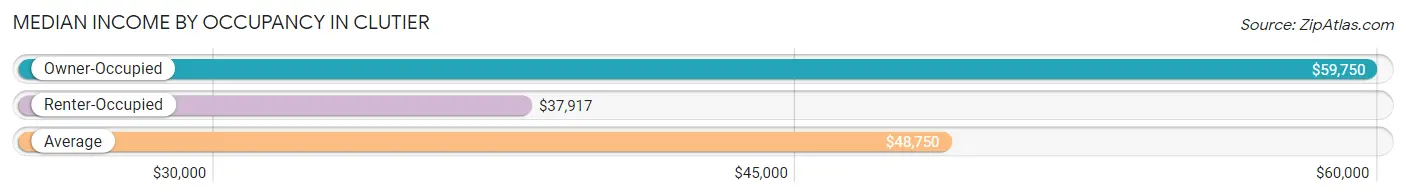
| Occupancy Type | # Households | Median Income |
| Owner-Occupied | 87 (80.6%) | $59,750 |
| Renter-Occupied | 21 (19.4%) | $37,917 |
| Average | 108 (100.0%) | $48,750 |
Occupancy by Householder Income Bracket in Clutier
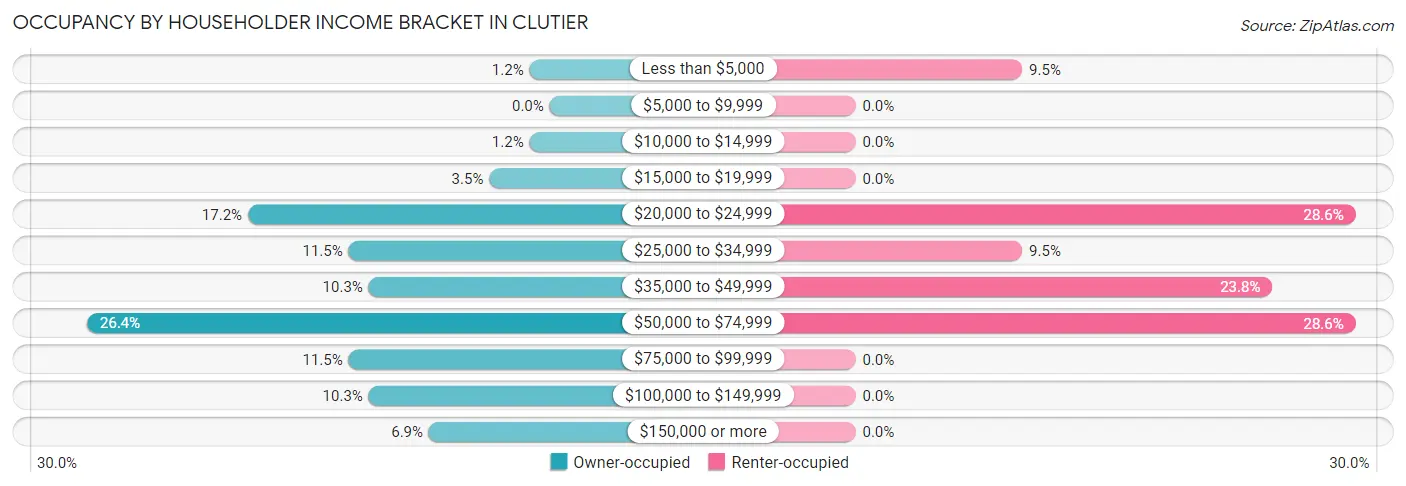
| Income Bracket | Owner-occupied | Renter-occupied |
| Less than $5,000 | 1 (1.1%) | 2 (9.5%) |
| $5,000 to $9,999 | 0 (0.0%) | 0 (0.0%) |
| $10,000 to $14,999 | 1 (1.1%) | 0 (0.0%) |
| $15,000 to $19,999 | 3 (3.5%) | 0 (0.0%) |
| $20,000 to $24,999 | 15 (17.2%) | 6 (28.6%) |
| $25,000 to $34,999 | 10 (11.5%) | 2 (9.5%) |
| $35,000 to $49,999 | 9 (10.3%) | 5 (23.8%) |
| $50,000 to $74,999 | 23 (26.4%) | 6 (28.6%) |
| $75,000 to $99,999 | 10 (11.5%) | 0 (0.0%) |
| $100,000 to $149,999 | 9 (10.3%) | 0 (0.0%) |
| $150,000 or more | 6 (6.9%) | 0 (0.0%) |
| Total | 87 (100.0%) | 21 (100.0%) |
Monthly Housing Cost Tiers in Clutier
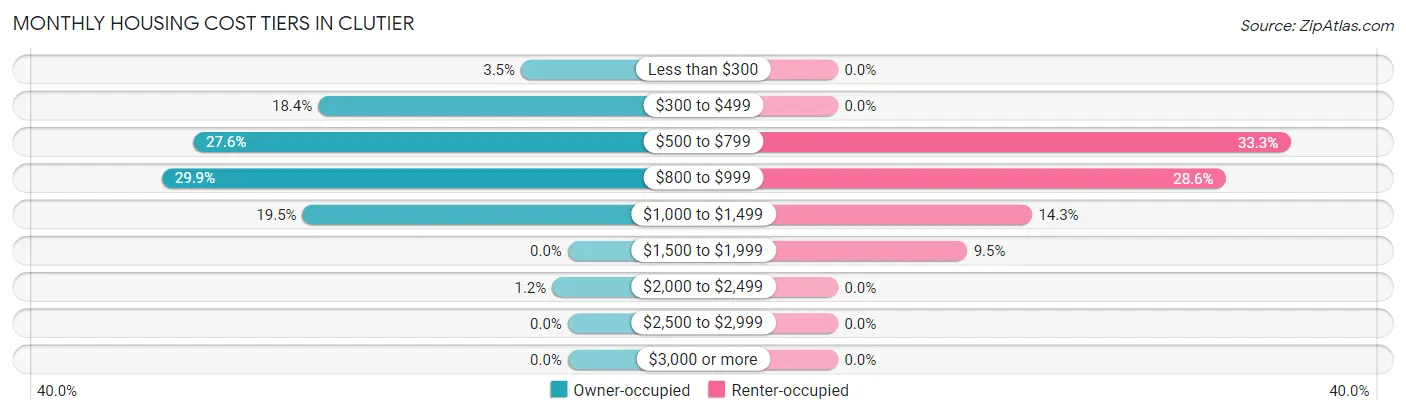
| Monthly Cost | Owner-occupied | Renter-occupied |
| Less than $300 | 3 (3.5%) | 0 (0.0%) |
| $300 to $499 | 16 (18.4%) | 0 (0.0%) |
| $500 to $799 | 24 (27.6%) | 7 (33.3%) |
| $800 to $999 | 26 (29.9%) | 6 (28.6%) |
| $1,000 to $1,499 | 17 (19.5%) | 3 (14.3%) |
| $1,500 to $1,999 | 0 (0.0%) | 2 (9.5%) |
| $2,000 to $2,499 | 1 (1.1%) | 0 (0.0%) |
| $2,500 to $2,999 | 0 (0.0%) | 0 (0.0%) |
| $3,000 or more | 0 (0.0%) | 0 (0.0%) |
| Total | 87 (100.0%) | 21 (100.0%) |
Physical Housing Characteristics in Clutier
Housing Structures in Clutier
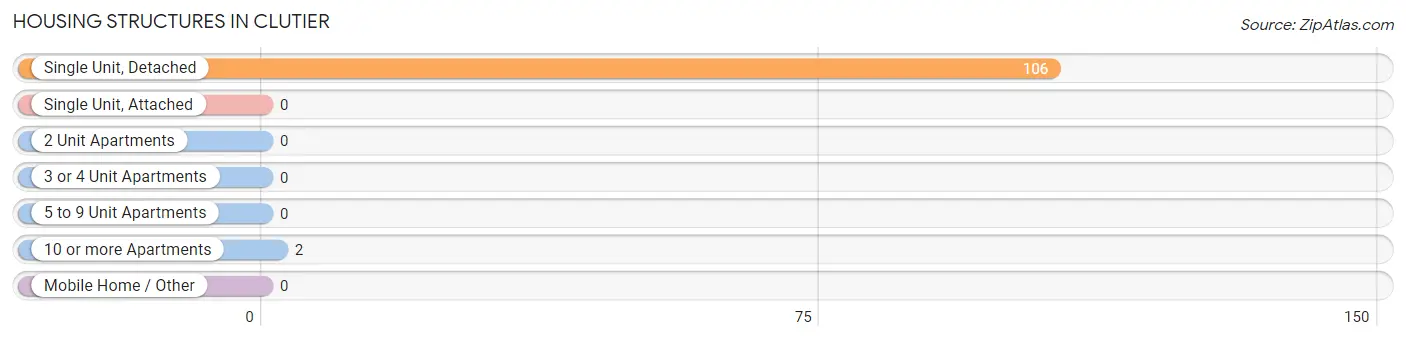
| Structure Type | # Housing Units | % Housing Units |
| Single Unit, Detached | 106 | 98.2% |
| Single Unit, Attached | 0 | 0.0% |
| 2 Unit Apartments | 0 | 0.0% |
| 3 or 4 Unit Apartments | 0 | 0.0% |
| 5 to 9 Unit Apartments | 0 | 0.0% |
| 10 or more Apartments | 2 | 1.8% |
| Mobile Home / Other | 0 | 0.0% |
| Total | 108 | 100.0% |
Housing Structures by Occupancy in Clutier
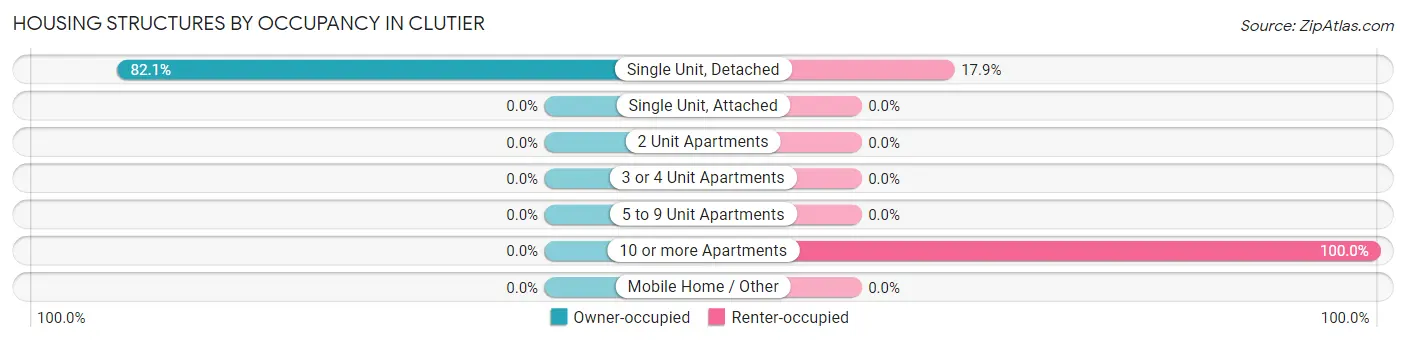
| Structure Type | Owner-occupied | Renter-occupied |
| Single Unit, Detached | 87 (82.1%) | 19 (17.9%) |
| Single Unit, Attached | 0 (0.0%) | 0 (0.0%) |
| 2 Unit Apartments | 0 (0.0%) | 0 (0.0%) |
| 3 or 4 Unit Apartments | 0 (0.0%) | 0 (0.0%) |
| 5 to 9 Unit Apartments | 0 (0.0%) | 0 (0.0%) |
| 10 or more Apartments | 0 (0.0%) | 2 (100.0%) |
| Mobile Home / Other | 0 (0.0%) | 0 (0.0%) |
| Total | 87 (80.6%) | 21 (19.4%) |
Housing Structures by Number of Rooms in Clutier
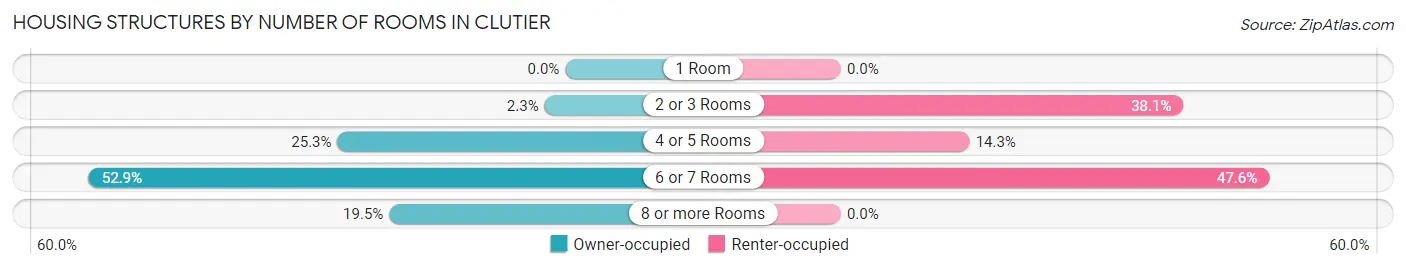
| Number of Rooms | Owner-occupied | Renter-occupied |
| 1 Room | 0 (0.0%) | 0 (0.0%) |
| 2 or 3 Rooms | 2 (2.3%) | 8 (38.1%) |
| 4 or 5 Rooms | 22 (25.3%) | 3 (14.3%) |
| 6 or 7 Rooms | 46 (52.9%) | 10 (47.6%) |
| 8 or more Rooms | 17 (19.5%) | 0 (0.0%) |
| Total | 87 (100.0%) | 21 (100.0%) |
Housing Structure by Heating Type in Clutier
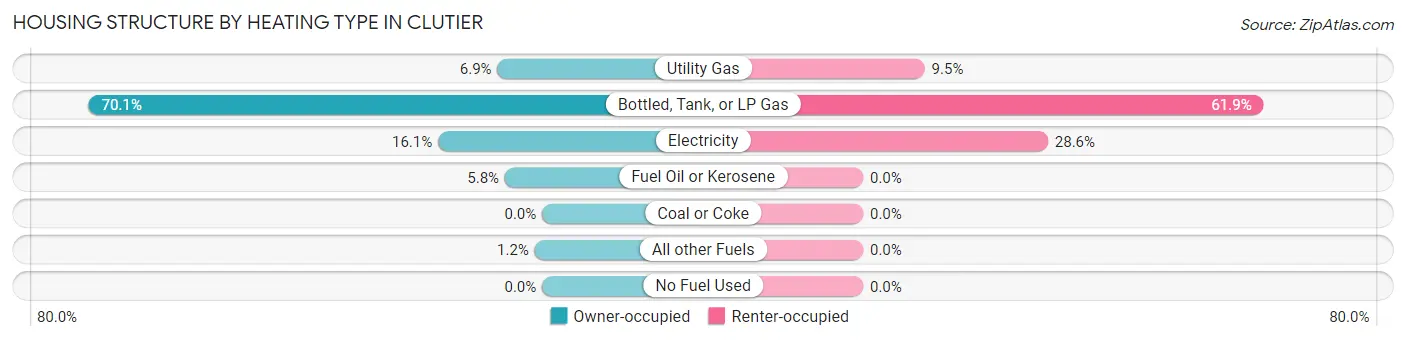
| Heating Type | Owner-occupied | Renter-occupied |
| Utility Gas | 6 (6.9%) | 2 (9.5%) |
| Bottled, Tank, or LP Gas | 61 (70.1%) | 13 (61.9%) |
| Electricity | 14 (16.1%) | 6 (28.6%) |
| Fuel Oil or Kerosene | 5 (5.8%) | 0 (0.0%) |
| Coal or Coke | 0 (0.0%) | 0 (0.0%) |
| All other Fuels | 1 (1.1%) | 0 (0.0%) |
| No Fuel Used | 0 (0.0%) | 0 (0.0%) |
| Total | 87 (100.0%) | 21 (100.0%) |
Household Vehicle Usage in Clutier
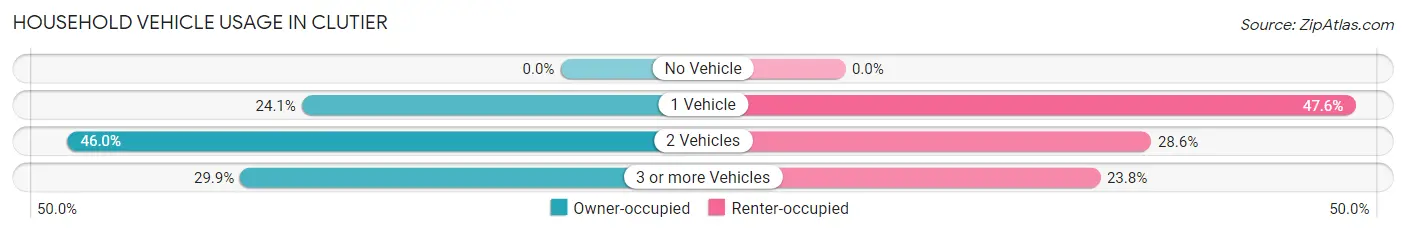
| Vehicles per Household | Owner-occupied | Renter-occupied |
| No Vehicle | 0 (0.0%) | 0 (0.0%) |
| 1 Vehicle | 21 (24.1%) | 10 (47.6%) |
| 2 Vehicles | 40 (46.0%) | 6 (28.6%) |
| 3 or more Vehicles | 26 (29.9%) | 5 (23.8%) |
| Total | 87 (100.0%) | 21 (100.0%) |
Real Estate & Mortgages in Clutier
Real Estate and Mortgage Overview in Clutier
| Characteristic | Without Mortgage | With Mortgage |
| Housing Units | 36 | 51 |
| Median Property Value | $60,000 | $55,000 |
| Median Household Income | $29,000 | $6 |
| Monthly Housing Costs | $493 | $0 |
| Real Estate Taxes | $877 | $4 |
Property Value by Mortgage Status in Clutier
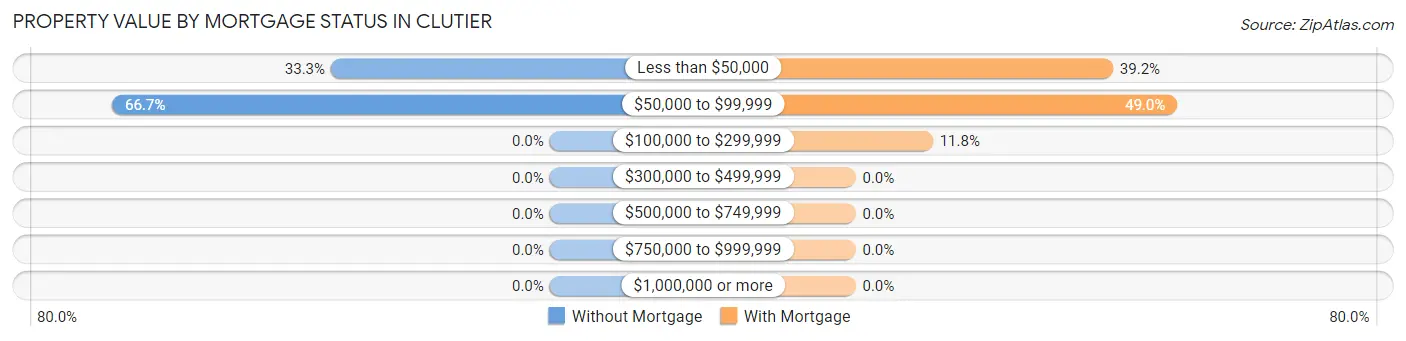
| Property Value | Without Mortgage | With Mortgage |
| Less than $50,000 | 12 (33.3%) | 20 (39.2%) |
| $50,000 to $99,999 | 24 (66.7%) | 25 (49.0%) |
| $100,000 to $299,999 | 0 (0.0%) | 6 (11.8%) |
| $300,000 to $499,999 | 0 (0.0%) | 0 (0.0%) |
| $500,000 to $749,999 | 0 (0.0%) | 0 (0.0%) |
| $750,000 to $999,999 | 0 (0.0%) | 0 (0.0%) |
| $1,000,000 or more | 0 (0.0%) | 0 (0.0%) |
| Total | 36 (100.0%) | 51 (100.0%) |
Household Income by Mortgage Status in Clutier
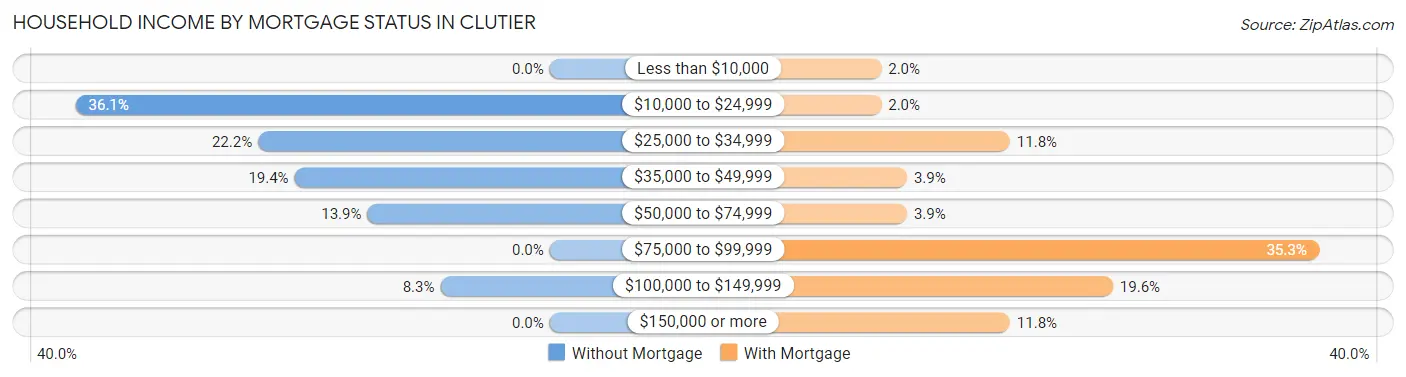
| Household Income | Without Mortgage | With Mortgage |
| Less than $10,000 | 0 (0.0%) | 1 (2.0%) |
| $10,000 to $24,999 | 13 (36.1%) | 1 (2.0%) |
| $25,000 to $34,999 | 8 (22.2%) | 6 (11.8%) |
| $35,000 to $49,999 | 7 (19.4%) | 2 (3.9%) |
| $50,000 to $74,999 | 5 (13.9%) | 2 (3.9%) |
| $75,000 to $99,999 | 0 (0.0%) | 18 (35.3%) |
| $100,000 to $149,999 | 3 (8.3%) | 10 (19.6%) |
| $150,000 or more | 0 (0.0%) | 6 (11.8%) |
| Total | 36 (100.0%) | 51 (100.0%) |
Property Value to Household Income Ratio in Clutier
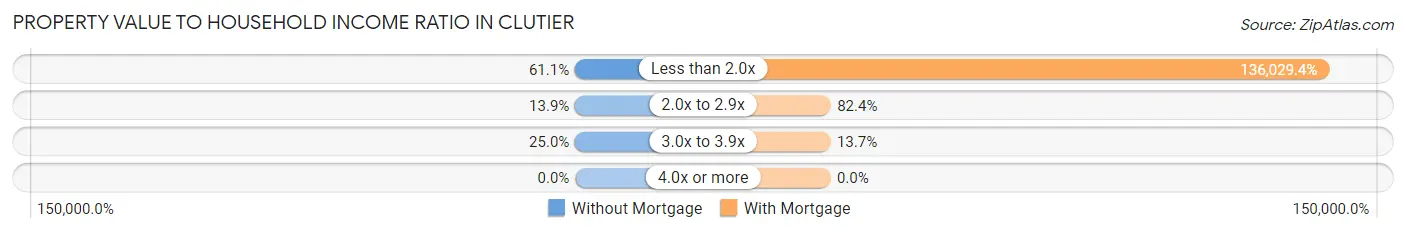
| Value-to-Income Ratio | Without Mortgage | With Mortgage |
| Less than 2.0x | 22 (61.1%) | 69,375 (136,029.4%) |
| 2.0x to 2.9x | 5 (13.9%) | 42 (82.4%) |
| 3.0x to 3.9x | 9 (25.0%) | 7 (13.7%) |
| 4.0x or more | 0 (0.0%) | 0 (0.0%) |
| Total | 36 (100.0%) | 51 (100.0%) |
Real Estate Taxes by Mortgage Status in Clutier
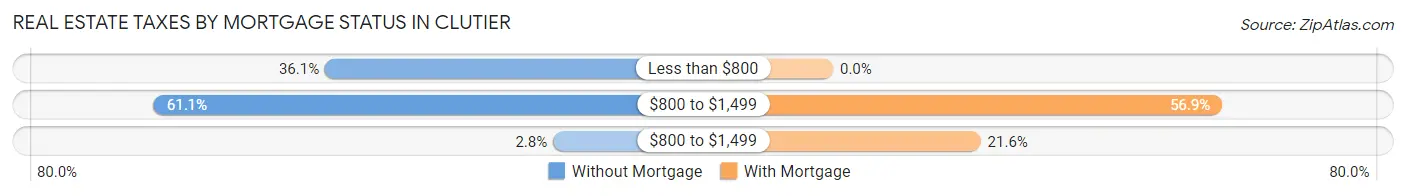
| Property Taxes | Without Mortgage | With Mortgage |
| Less than $800 | 13 (36.1%) | 0 (0.0%) |
| $800 to $1,499 | 22 (61.1%) | 29 (56.9%) |
| $800 to $1,499 | 1 (2.8%) | 11 (21.6%) |
| Total | 36 (100.0%) | 51 (100.0%) |
Health & Disability in Clutier
Health Insurance Coverage by Age in Clutier
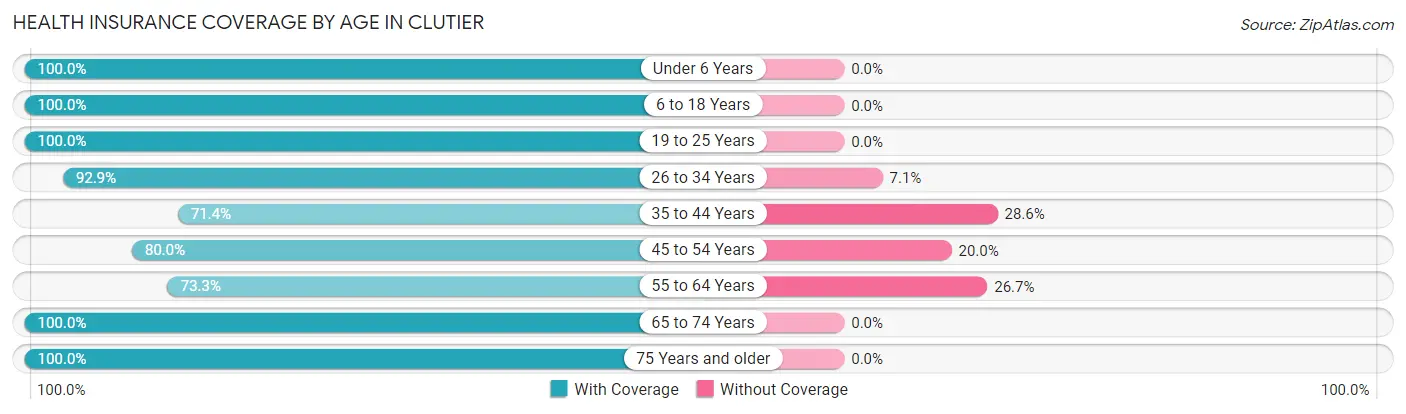
| Age Bracket | With Coverage | Without Coverage |
| Under 6 Years | 52 (100.0%) | 0 (0.0%) |
| 6 to 18 Years | 37 (100.0%) | 0 (0.0%) |
| 19 to 25 Years | 6 (100.0%) | 0 (0.0%) |
| 26 to 34 Years | 52 (92.9%) | 4 (7.1%) |
| 35 to 44 Years | 15 (71.4%) | 6 (28.6%) |
| 45 to 54 Years | 20 (80.0%) | 5 (20.0%) |
| 55 to 64 Years | 22 (73.3%) | 8 (26.7%) |
| 65 to 74 Years | 22 (100.0%) | 0 (0.0%) |
| 75 Years and older | 18 (100.0%) | 0 (0.0%) |
| Total | 244 (91.4%) | 23 (8.6%) |
Health Insurance Coverage by Citizenship Status in Clutier
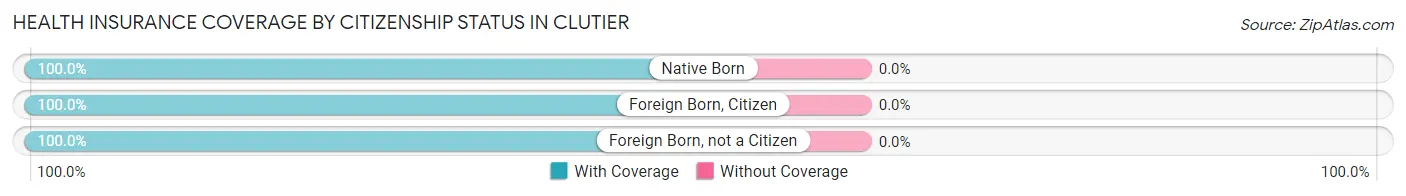
| Citizenship Status | With Coverage | Without Coverage |
| Native Born | 52 (100.0%) | 0 (0.0%) |
| Foreign Born, Citizen | 37 (100.0%) | 0 (0.0%) |
| Foreign Born, not a Citizen | 6 (100.0%) | 0 (0.0%) |
Health Insurance Coverage by Household Income in Clutier
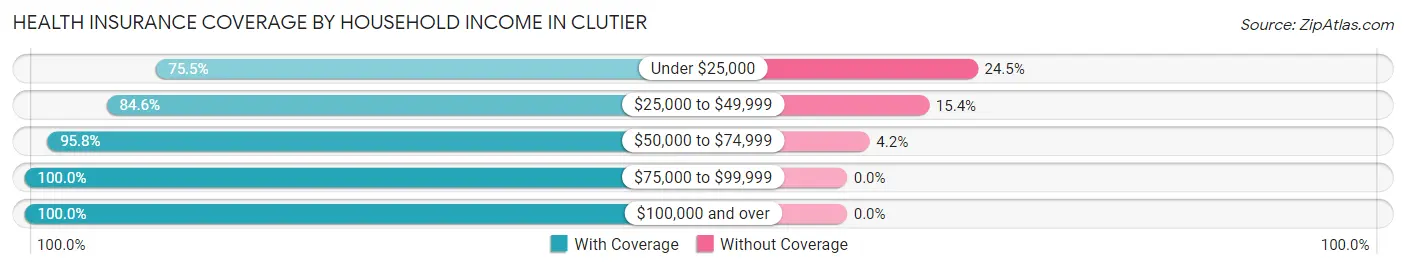
| Household Income | With Coverage | Without Coverage |
| Under $25,000 | 37 (75.5%) | 12 (24.5%) |
| $25,000 to $49,999 | 33 (84.6%) | 6 (15.4%) |
| $50,000 to $74,999 | 113 (95.8%) | 5 (4.2%) |
| $75,000 to $99,999 | 21 (100.0%) | 0 (0.0%) |
| $100,000 and over | 40 (100.0%) | 0 (0.0%) |
Public vs Private Health Insurance Coverage by Age in Clutier
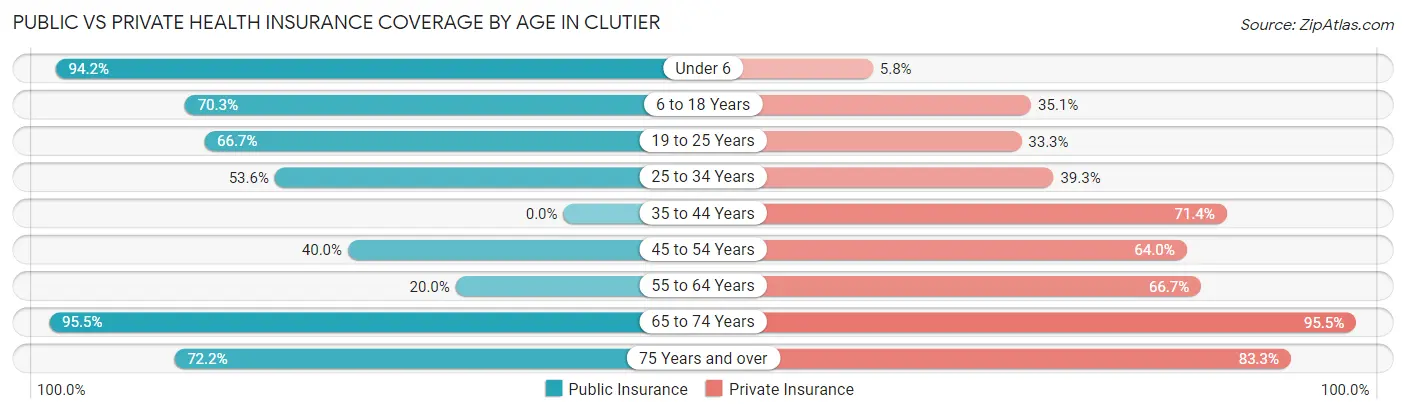
| Age Bracket | Public Insurance | Private Insurance |
| Under 6 | 49 (94.2%) | 3 (5.8%) |
| 6 to 18 Years | 26 (70.3%) | 13 (35.1%) |
| 19 to 25 Years | 4 (66.7%) | 2 (33.3%) |
| 25 to 34 Years | 30 (53.6%) | 22 (39.3%) |
| 35 to 44 Years | 0 (0.0%) | 15 (71.4%) |
| 45 to 54 Years | 10 (40.0%) | 16 (64.0%) |
| 55 to 64 Years | 6 (20.0%) | 20 (66.7%) |
| 65 to 74 Years | 21 (95.5%) | 21 (95.5%) |
| 75 Years and over | 13 (72.2%) | 15 (83.3%) |
| Total | 159 (59.6%) | 127 (47.6%) |
Disability Status by Sex by Age in Clutier
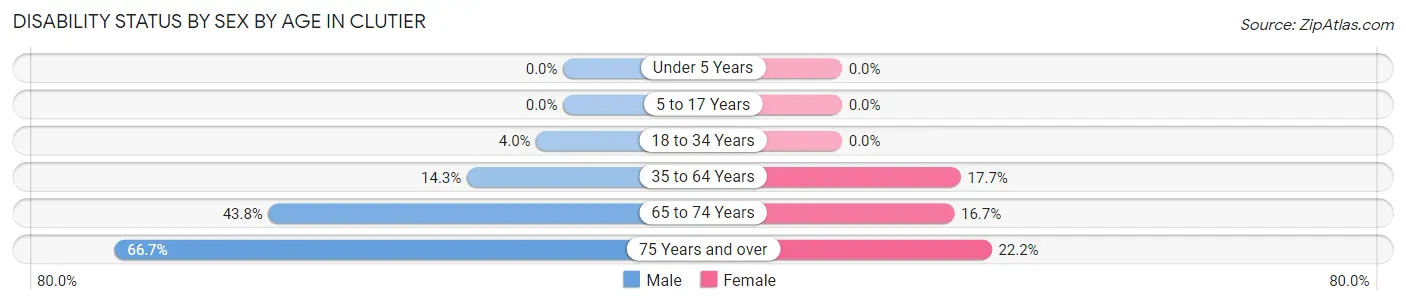
| Age Bracket | Male | Female |
| Under 5 Years | 0 (0.0%) | 0 (0.0%) |
| 5 to 17 Years | 0 (0.0%) | 0 (0.0%) |
| 18 to 34 Years | 1 (4.0%) | 0 (0.0%) |
| 35 to 64 Years | 6 (14.3%) | 6 (17.6%) |
| 65 to 74 Years | 7 (43.8%) | 1 (16.7%) |
| 75 Years and over | 6 (66.7%) | 2 (22.2%) |
Disability Class by Sex by Age in Clutier
Disability Class: Hearing Difficulty
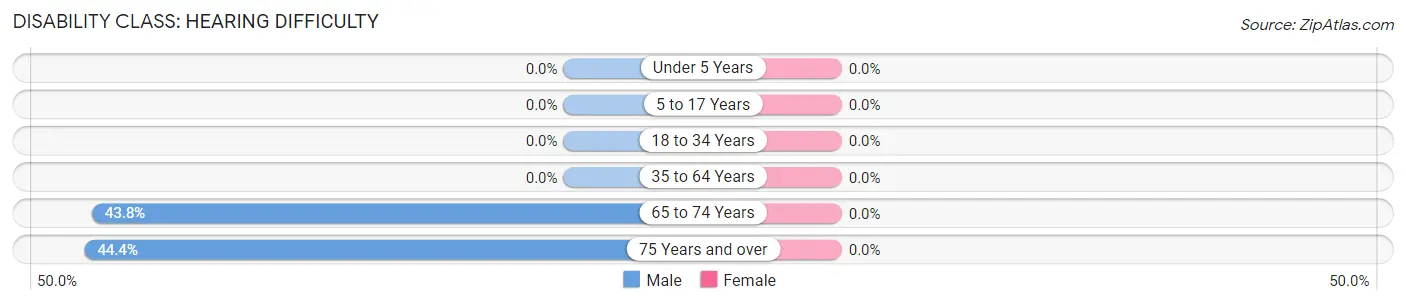
| Age Bracket | Male | Female |
| Under 5 Years | 0 (0.0%) | 0 (0.0%) |
| 5 to 17 Years | 0 (0.0%) | 0 (0.0%) |
| 18 to 34 Years | 0 (0.0%) | 0 (0.0%) |
| 35 to 64 Years | 0 (0.0%) | 0 (0.0%) |
| 65 to 74 Years | 7 (43.8%) | 0 (0.0%) |
| 75 Years and over | 4 (44.4%) | 0 (0.0%) |
Disability Class: Vision Difficulty
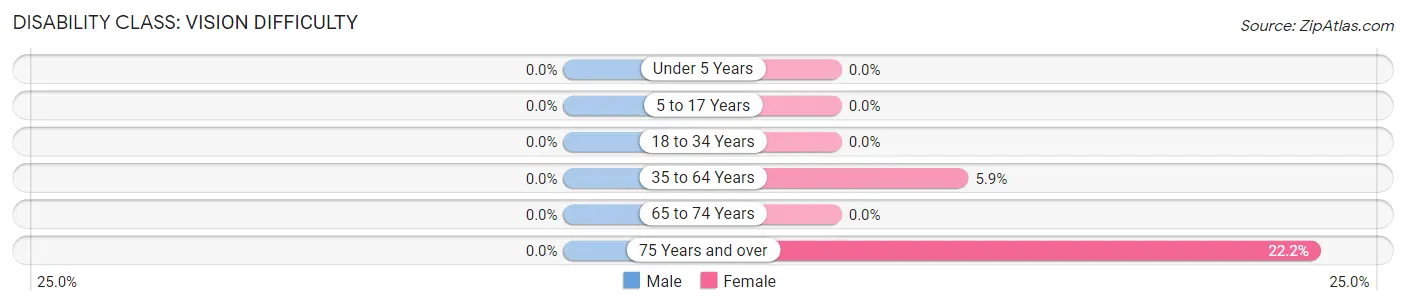
| Age Bracket | Male | Female |
| Under 5 Years | 0 (0.0%) | 0 (0.0%) |
| 5 to 17 Years | 0 (0.0%) | 0 (0.0%) |
| 18 to 34 Years | 0 (0.0%) | 0 (0.0%) |
| 35 to 64 Years | 0 (0.0%) | 2 (5.9%) |
| 65 to 74 Years | 0 (0.0%) | 0 (0.0%) |
| 75 Years and over | 0 (0.0%) | 2 (22.2%) |
Disability Class: Cognitive Difficulty
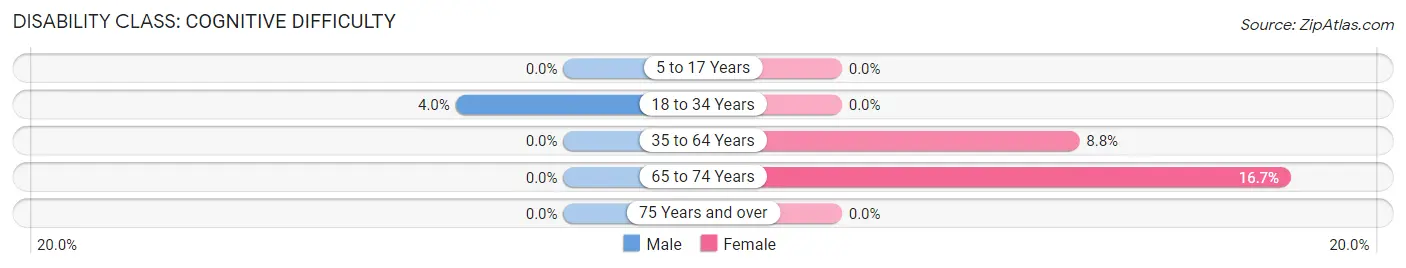
| Age Bracket | Male | Female |
| 5 to 17 Years | 0 (0.0%) | 0 (0.0%) |
| 18 to 34 Years | 1 (4.0%) | 0 (0.0%) |
| 35 to 64 Years | 0 (0.0%) | 3 (8.8%) |
| 65 to 74 Years | 0 (0.0%) | 1 (16.7%) |
| 75 Years and over | 0 (0.0%) | 0 (0.0%) |
Disability Class: Ambulatory Difficulty
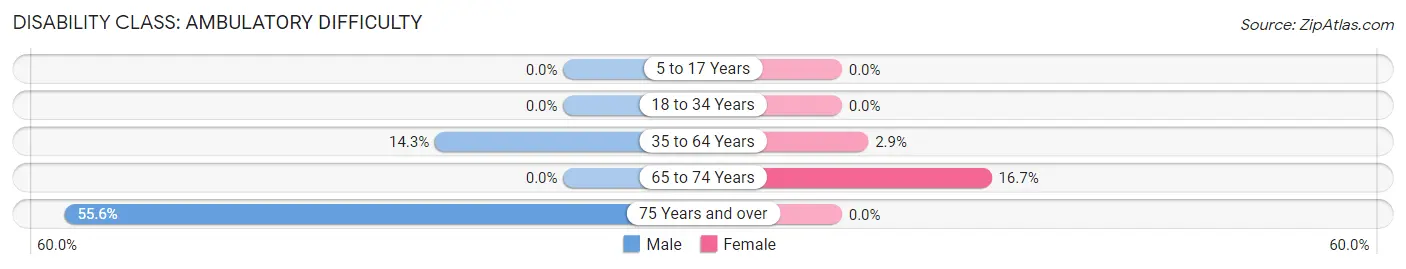
| Age Bracket | Male | Female |
| 5 to 17 Years | 0 (0.0%) | 0 (0.0%) |
| 18 to 34 Years | 0 (0.0%) | 0 (0.0%) |
| 35 to 64 Years | 6 (14.3%) | 1 (2.9%) |
| 65 to 74 Years | 0 (0.0%) | 1 (16.7%) |
| 75 Years and over | 5 (55.6%) | 0 (0.0%) |
Disability Class: Self-Care Difficulty
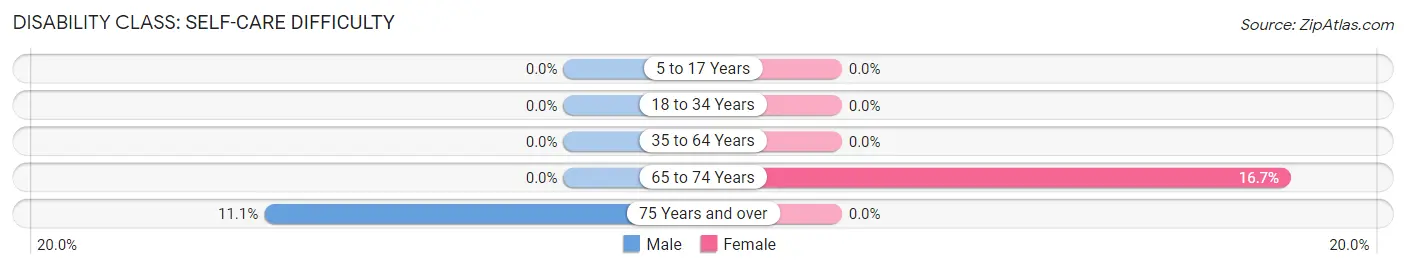
| Age Bracket | Male | Female |
| 5 to 17 Years | 0 (0.0%) | 0 (0.0%) |
| 18 to 34 Years | 0 (0.0%) | 0 (0.0%) |
| 35 to 64 Years | 0 (0.0%) | 0 (0.0%) |
| 65 to 74 Years | 0 (0.0%) | 1 (16.7%) |
| 75 Years and over | 1 (11.1%) | 0 (0.0%) |
Technology Access in Clutier
Computing Device Access in Clutier
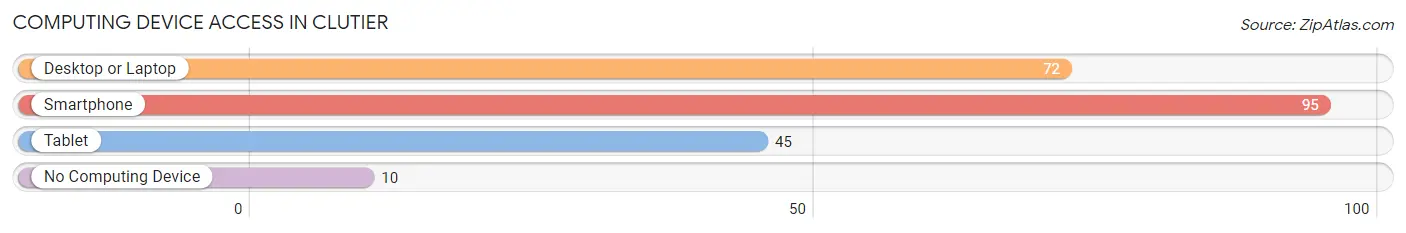
| Device Type | # Households | % Households |
| Desktop or Laptop | 72 | 66.7% |
| Smartphone | 95 | 88.0% |
| Tablet | 45 | 41.7% |
| No Computing Device | 10 | 9.3% |
| Total | 108 | 100.0% |
Internet Access in Clutier
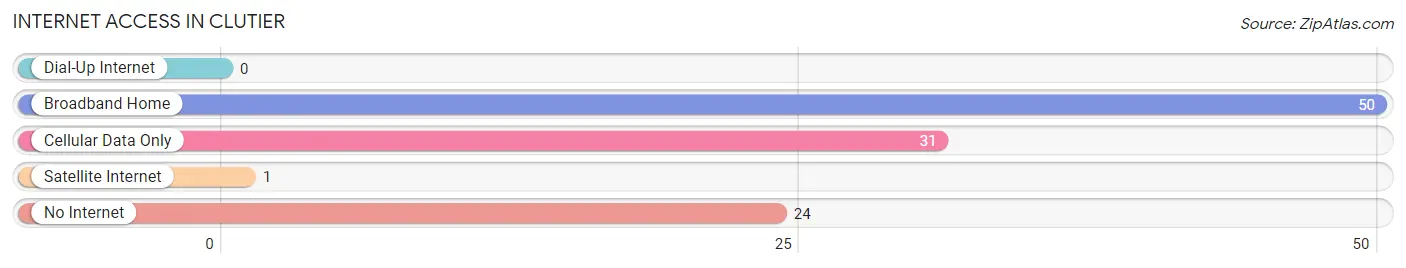
| Internet Type | # Households | % Households |
| Dial-Up Internet | 0 | 0.0% |
| Broadband Home | 50 | 46.3% |
| Cellular Data Only | 31 | 28.7% |
| Satellite Internet | 1 | 0.9% |
| No Internet | 24 | 22.2% |
| Total | 108 | 100.0% |
Clutier Summary
Clutier is a small town located in Tama County, Iowa, United States. The population was estimated to be around 200 people in 2020. Clutier is located in the heart of Iowa, approximately 30 miles east of Cedar Rapids and 40 miles west of Iowa City.
History
Clutier was founded in 1872 by a group of settlers from Germany. The town was named after a German immigrant, John Clutier, who was the first settler in the area. The town was originally known as Clutier Station, as it was a stop on the Chicago, Rock Island and Pacific Railroad.
In the early 1900s, Clutier was a thriving agricultural community. The town had a general store, a blacksmith shop, a hotel, a bank, a post office, and a school. The town also had a large population of German immigrants, who brought their culture and traditions to the area.
In the 1950s, the town began to decline as the railroad stopped running and the population began to move away. The town was nearly abandoned by the 1970s, but in the 1980s, the town began to experience a resurgence. The town was revitalized by the opening of a new school and the construction of a new library.
Geography
Clutier is located in the rolling hills of eastern Iowa. The town is situated on the banks of the Cedar River, which flows through the town. The town is surrounded by farmland and is located near the towns of Traer, Dysart, and Toledo.
The climate in Clutier is typical of the Midwest, with hot summers and cold winters. The average temperature in the summer is around 75 degrees Fahrenheit, and the average temperature in the winter is around 25 degrees Fahrenheit.
Economy
The economy of Clutier is largely based on agriculture. The town is home to several farms, which produce corn, soybeans, and other crops. The town also has a few small businesses, including a grocery store, a hardware store, and a restaurant.
Demographics
The population of Clutier is estimated to be around 200 people. The town is predominantly white, with a small Hispanic population. The median household income in Clutier is around $45,000, and the median home value is around $90,000.
Conclusion
Clutier is a small town located in Tama County, Iowa. The town was founded in 1872 by a group of German settlers and was once a thriving agricultural community. The town has experienced a resurgence in recent years, with the opening of a new school and the construction of a new library. The economy of Clutier is largely based on agriculture, and the population is estimated to be around 200 people.
Common Questions
What is Per Capita Income in Clutier?
Per Capita income in Clutier is $23,531.
What is the Median Family Income in Clutier?
Median Family Income in Clutier is $69,167.
What is the Median Household income in Clutier?
Median Household Income in Clutier is $48,750.
What is Income or Wage Gap in Clutier?
Income or Wage Gap in Clutier is 16.1%.
Women in Clutier earn 83.9 cents for every dollar earned by a man.
What is Inequality or Gini Index in Clutier?
Inequality or Gini Index in Clutier is 0.35.
What is the Total Population of Clutier?
Total Population of Clutier is 272.
What is the Total Male Population of Clutier?
Total Male Population of Clutier is 168.
What is the Total Female Population of Clutier?
Total Female Population of Clutier is 104.
What is the Ratio of Males per 100 Females in Clutier?
There are 161.54 Males per 100 Females in Clutier.
What is the Ratio of Females per 100 Males in Clutier?
There are 61.90 Females per 100 Males in Clutier.
What is the Median Population Age in Clutier?
Median Population Age in Clutier is 31.8 Years.
What is the Average Family Size in Clutier
Average Family Size in Clutier is 3.7 People.
What is the Average Household Size in Clutier
Average Household Size in Clutier is 2.5 People.
How Large is the Labor Force in Clutier?
There are 137 People in the Labor Forcein in Clutier.
What is the Percentage of People in the Labor Force in Clutier?
72.9% of People are in the Labor Force in Clutier.
What is the Unemployment Rate in Clutier?
Unemployment Rate in Clutier is 8.3%.