Gresham Park, GA Map & Demographics
Gresham Park Map
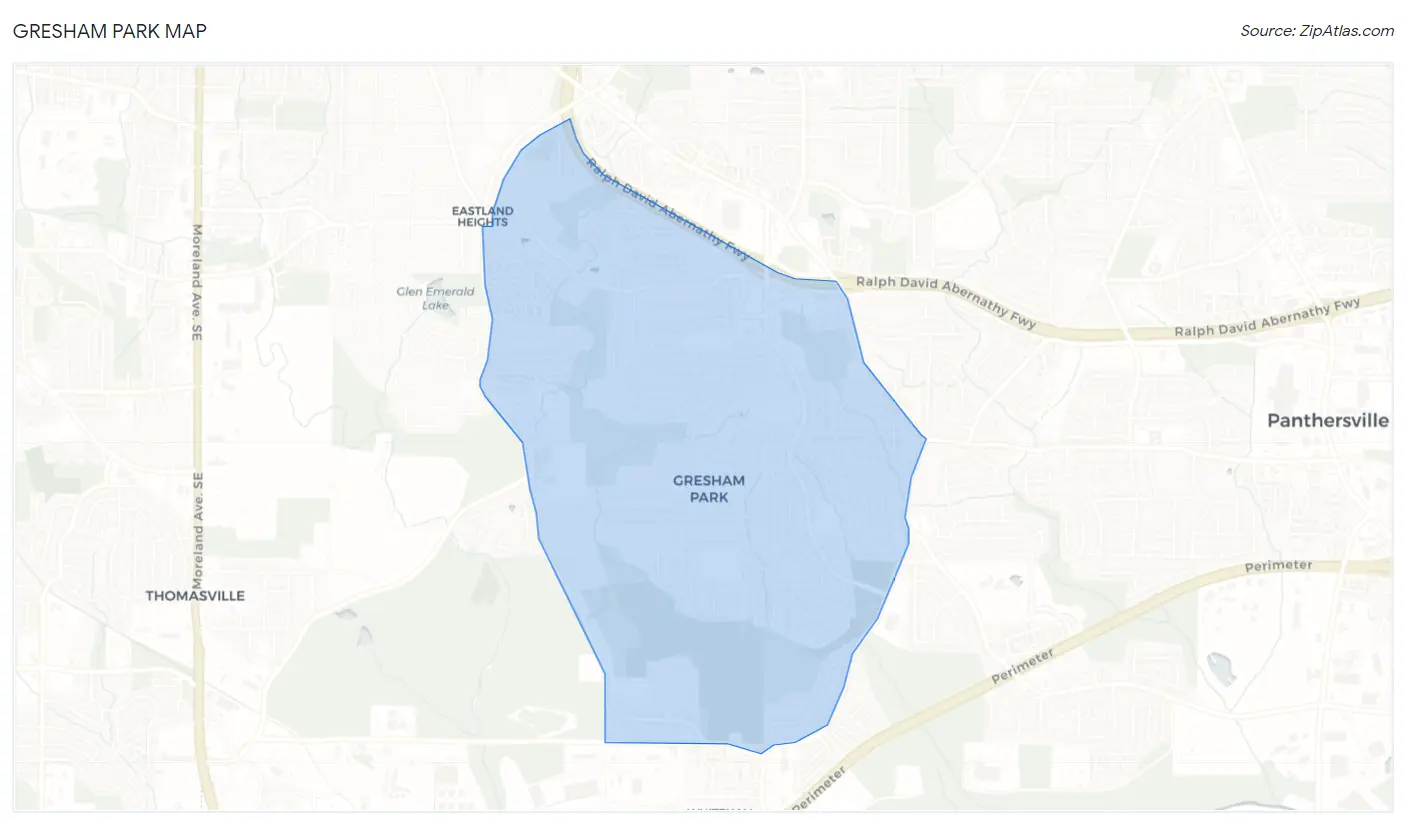
Gresham Park Overview
$39,189
PER CAPITA INCOME
$74,883
AVG FAMILY INCOME
$66,071
AVG HOUSEHOLD INCOME
7.9%
WAGE / INCOME GAP [ % ]
92.1¢/ $1
WAGE / INCOME GAP [ $ ]
0.47
INEQUALITY / GINI INDEX
7,816
TOTAL POPULATION
4,264
MALE POPULATION
3,552
FEMALE POPULATION
120.05
MALES / 100 FEMALES
83.30
FEMALES / 100 MALES
40.1
MEDIAN AGE
3.2
AVG FAMILY SIZE
2.5
AVG HOUSEHOLD SIZE
4,159
LABOR FORCE [ PEOPLE ]
62.6%
PERCENT IN LABOR FORCE
4.5%
UNEMPLOYMENT RATE
Income in Gresham Park
Income Overview in Gresham Park
Per Capita Income in Gresham Park is $39,189, while median incomes of families and households are $74,883 and $66,071 respectively.
| Characteristic | Number | Measure |
| Per Capita Income | 7,816 | $39,189 |
| Median Family Income | 1,731 | $74,883 |
| Mean Family Income | 1,731 | $94,415 |
| Median Household Income | 3,106 | $66,071 |
| Mean Household Income | 3,106 | $92,216 |
| Income Deficit | 1,731 | $0 |
| Wage / Income Gap (%) | 7,816 | 7.91% |
| Wage / Income Gap ($) | 7,816 | 92.09¢ per $1 |
| Gini / Inequality Index | 7,816 | 0.47 |
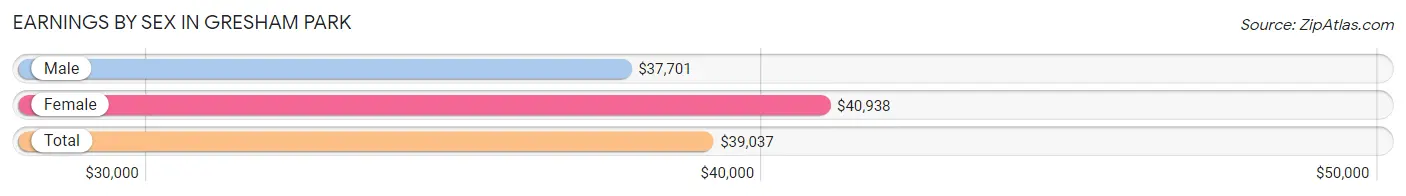
Earnings by Sex in Gresham Park
Average Earnings in Gresham Park are $39,037, $37,701 for men and $40,938 for women, a difference of 7.9%.
| Sex | Number | Average Earnings |
| Male | 2,492 (56.8%) | $37,701 |
| Female | 1,899 (43.2%) | $40,938 |
| Total | 4,391 (100.0%) | $39,037 |
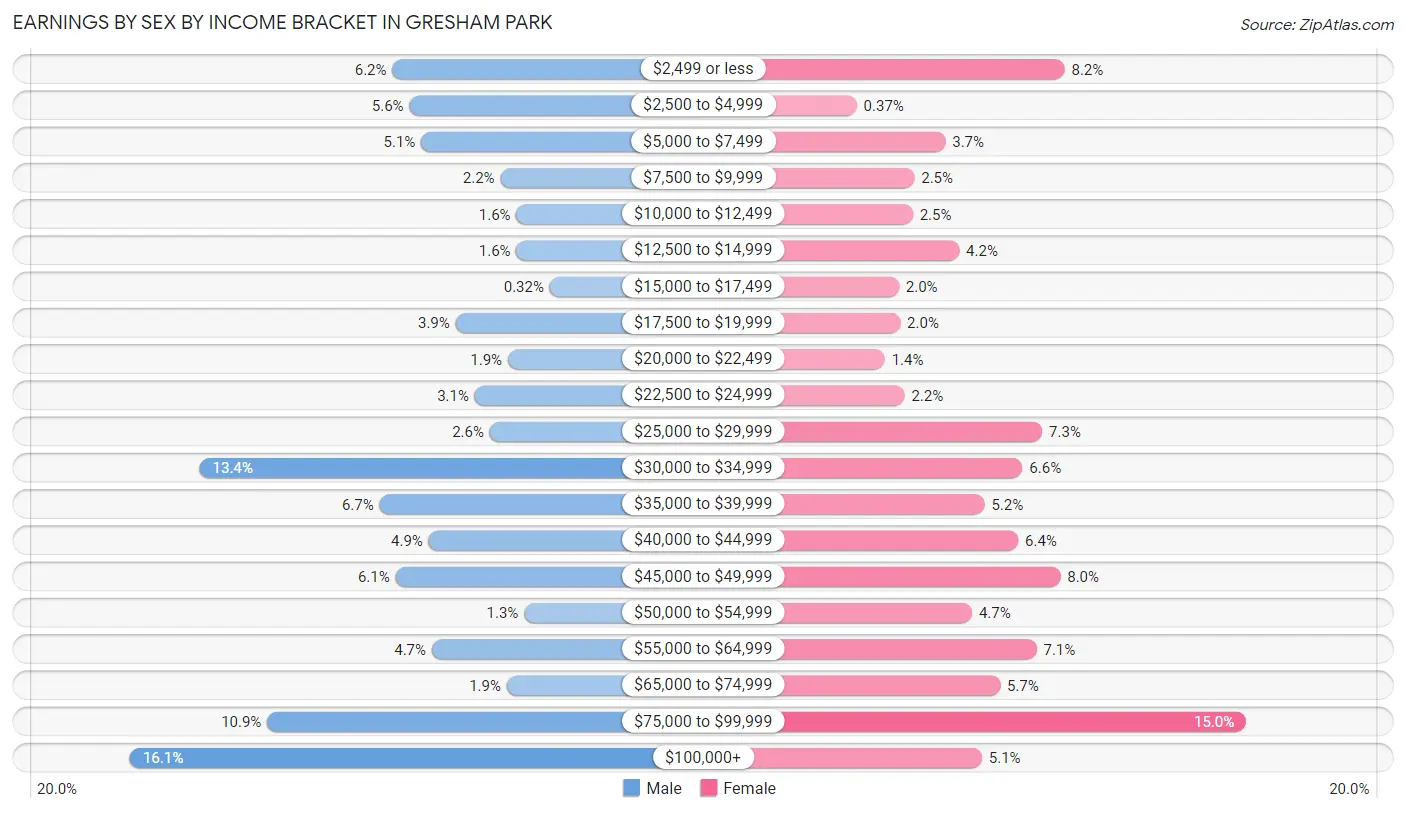
Earnings by Sex by Income Bracket in Gresham Park
The most common earnings brackets in Gresham Park are $100,000+ for men (400 | 16.1%) and $75,000 to $99,999 for women (284 | 15.0%).
| Income | Male | Female |
| $2,499 or less | 155 (6.2%) | 155 (8.2%) |
| $2,500 to $4,999 | 139 (5.6%) | 7 (0.4%) |
| $5,000 to $7,499 | 128 (5.1%) | 70 (3.7%) |
| $7,500 to $9,999 | 54 (2.2%) | 48 (2.5%) |
| $10,000 to $12,499 | 39 (1.6%) | 47 (2.5%) |
| $12,500 to $14,999 | 39 (1.6%) | 80 (4.2%) |
| $15,000 to $17,499 | 8 (0.3%) | 37 (1.9%) |
| $17,500 to $19,999 | 96 (3.8%) | 38 (2.0%) |
| $20,000 to $22,499 | 47 (1.9%) | 27 (1.4%) |
| $22,500 to $24,999 | 78 (3.1%) | 41 (2.2%) |
| $25,000 to $29,999 | 64 (2.6%) | 139 (7.3%) |
| $30,000 to $34,999 | 335 (13.4%) | 125 (6.6%) |
| $35,000 to $39,999 | 167 (6.7%) | 98 (5.2%) |
| $40,000 to $44,999 | 121 (4.9%) | 122 (6.4%) |
| $45,000 to $49,999 | 152 (6.1%) | 152 (8.0%) |
| $50,000 to $54,999 | 32 (1.3%) | 89 (4.7%) |
| $55,000 to $64,999 | 118 (4.7%) | 135 (7.1%) |
| $65,000 to $74,999 | 48 (1.9%) | 109 (5.7%) |
| $75,000 to $99,999 | 272 (10.9%) | 284 (15.0%) |
| $100,000+ | 400 (16.1%) | 96 (5.1%) |
| Total | 2,492 (100.0%) | 1,899 (100.0%) |
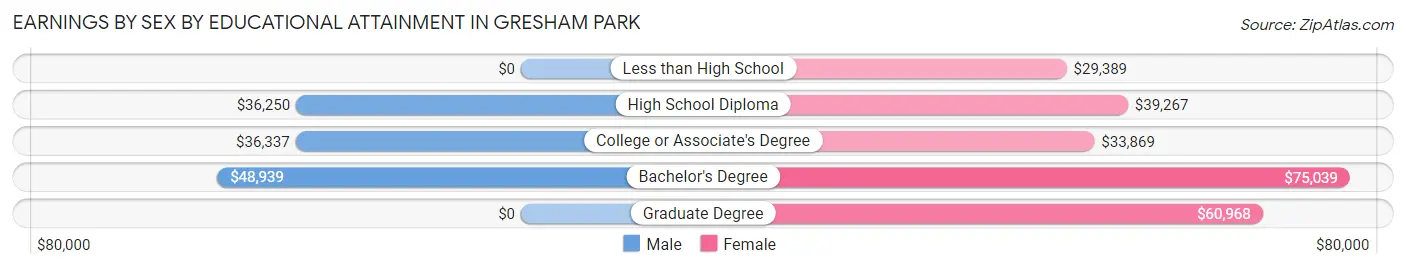
Earnings by Sex by Educational Attainment in Gresham Park
Average earnings in Gresham Park are $39,118 for men and $44,318 for women, a difference of 11.7%. Men with an educational attainment of bachelor's degree enjoy the highest average annual earnings of $48,939, while those with high school diploma education earn the least with $36,250. Women with an educational attainment of bachelor's degree earn the most with the average annual earnings of $75,039, while those with less than high school education have the smallest earnings of $29,389.
| Educational Attainment | Male Income | Female Income |
| Less than High School | - | - |
| High School Diploma | $36,250 | $39,267 |
| College or Associate's Degree | $36,337 | $33,869 |
| Bachelor's Degree | $48,939 | $75,039 |
| Graduate Degree | - | - |
| Total | $39,118 | $44,318 |
Family Income in Gresham Park
Family Income Brackets in Gresham Park
According to the Gresham Park family income data, there are 336 families falling into the $50,000 to $74,999 income range, which is the most common income bracket and makes up 19.4% of all families. Conversely, the $10,000 to $14,999 income bracket is the least frequent group with only 24 families (1.4%) belonging to this category.
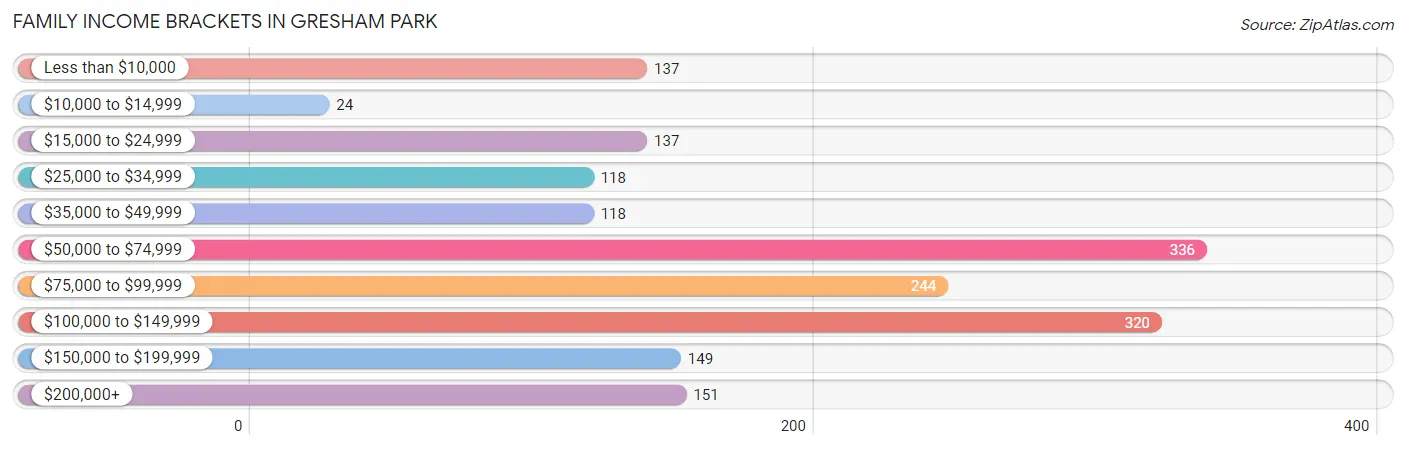
| Income Bracket | # Families | % Families |
| Less than $10,000 | 137 | 7.9% |
| $10,000 to $14,999 | 24 | 1.4% |
| $15,000 to $24,999 | 137 | 7.9% |
| $25,000 to $34,999 | 118 | 6.8% |
| $35,000 to $49,999 | 118 | 6.8% |
| $50,000 to $74,999 | 336 | 19.4% |
| $75,000 to $99,999 | 244 | 14.1% |
| $100,000 to $149,999 | 320 | 18.5% |
| $150,000 to $199,999 | 149 | 8.6% |
| $200,000+ | 151 | 8.7% |
Family Income by Famaliy Size in Gresham Park
2-person families (1,073 | 62.0%) account for the highest median family income in Gresham Park with $79,250 per family, while 2-person families (1,073 | 62.0%) have the highest median income of $39,625 per family member.
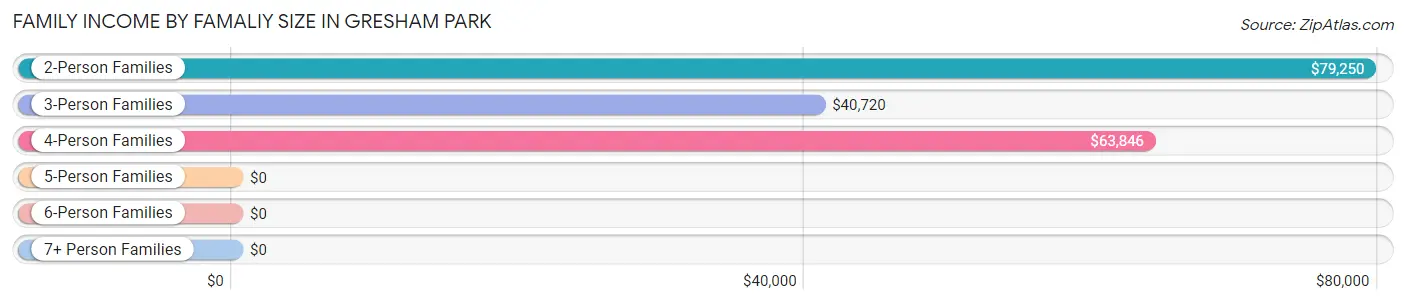
| Income Bracket | # Families | Median Income |
| 2-Person Families | 1,073 (62.0%) | $79,250 |
| 3-Person Families | 284 (16.4%) | $40,720 |
| 4-Person Families | 220 (12.7%) | $63,846 |
| 5-Person Families | 59 (3.4%) | $0 |
| 6-Person Families | 84 (4.9%) | $0 |
| 7+ Person Families | 11 (0.6%) | $0 |
| Total | 1,731 (100.0%) | $74,883 |
Family Income by Number of Earners in Gresham Park
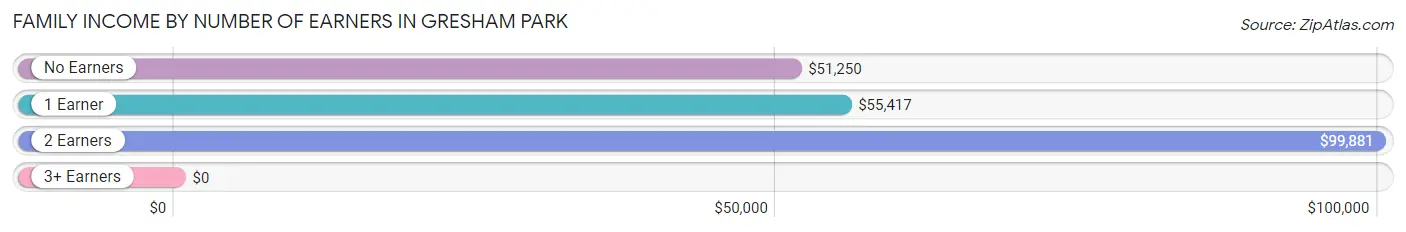
| Number of Earners | # Families | Median Income |
| No Earners | 298 (17.2%) | $51,250 |
| 1 Earner | 739 (42.7%) | $55,417 |
| 2 Earners | 606 (35.0%) | $99,881 |
| 3+ Earners | 88 (5.1%) | $0 |
| Total | 1,731 (100.0%) | $74,883 |
Household Income in Gresham Park
Household Income Brackets in Gresham Park
With 491 households falling in the category, the $35,000 to $49,999 income range is the most frequent in Gresham Park, accounting for 15.8% of all households. In contrast, only 102 households (3.3%) fall into the $10,000 to $14,999 income bracket, making it the least populous group.
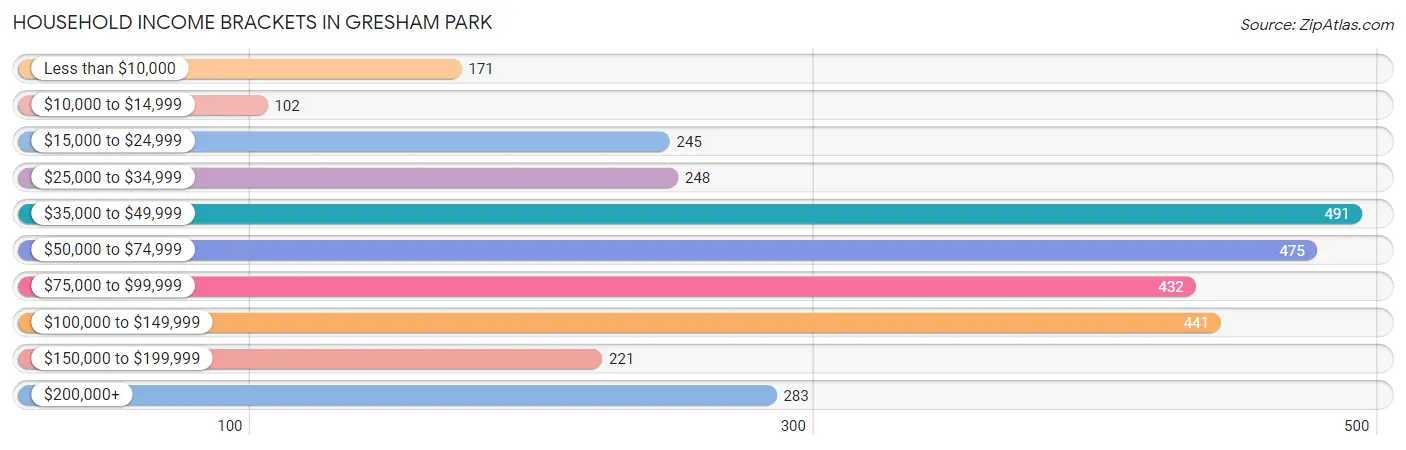
| Income Bracket | # Households | % Households |
| Less than $10,000 | 171 | 5.5% |
| $10,000 to $14,999 | 102 | 3.3% |
| $15,000 to $24,999 | 245 | 7.9% |
| $25,000 to $34,999 | 248 | 8.0% |
| $35,000 to $49,999 | 491 | 15.8% |
| $50,000 to $74,999 | 475 | 15.3% |
| $75,000 to $99,999 | 432 | 13.9% |
| $100,000 to $149,999 | 441 | 14.2% |
| $150,000 to $199,999 | 221 | 7.1% |
| $200,000+ | 283 | 9.1% |
Household Income by Householder Age in Gresham Park
The median household income in Gresham Park is $66,071, with the highest median household income of $80,962 found in the 45 to 64 years age bracket for the primary householder. A total of 984 households (31.7%) fall into this category. Meanwhile, the 15 to 24 years age bracket for the primary householder has the lowest median household income of $0, with 14 households (0.4%) in this group.
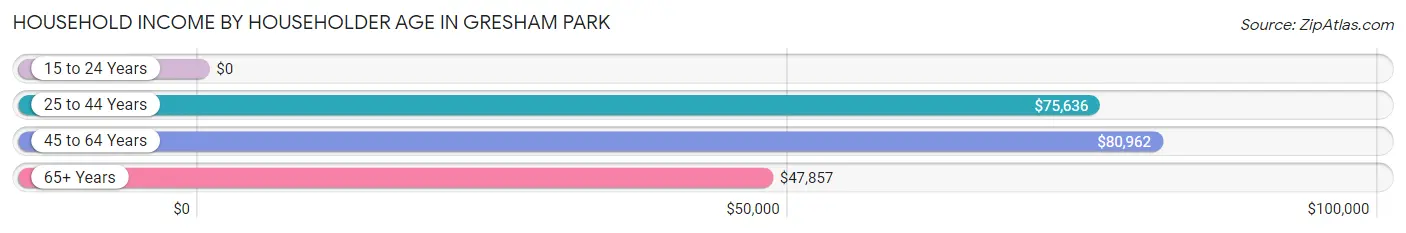
| Income Bracket | # Households | Median Income |
| 15 to 24 Years | 14 (0.4%) | $0 |
| 25 to 44 Years | 1,014 (32.7%) | $75,636 |
| 45 to 64 Years | 984 (31.7%) | $80,962 |
| 65+ Years | 1,094 (35.2%) | $47,857 |
| Total | 3,106 (100.0%) | $66,071 |
Poverty in Gresham Park
Income Below Poverty by Sex and Age in Gresham Park
With 18.4% poverty level for males and 14.7% for females among the residents of Gresham Park, 16 and 17 year old males and 6 to 11 year old females are the most vulnerable to poverty, with 65 males (100.0%) and 71 females (48.6%) in their respective age groups living below the poverty level.
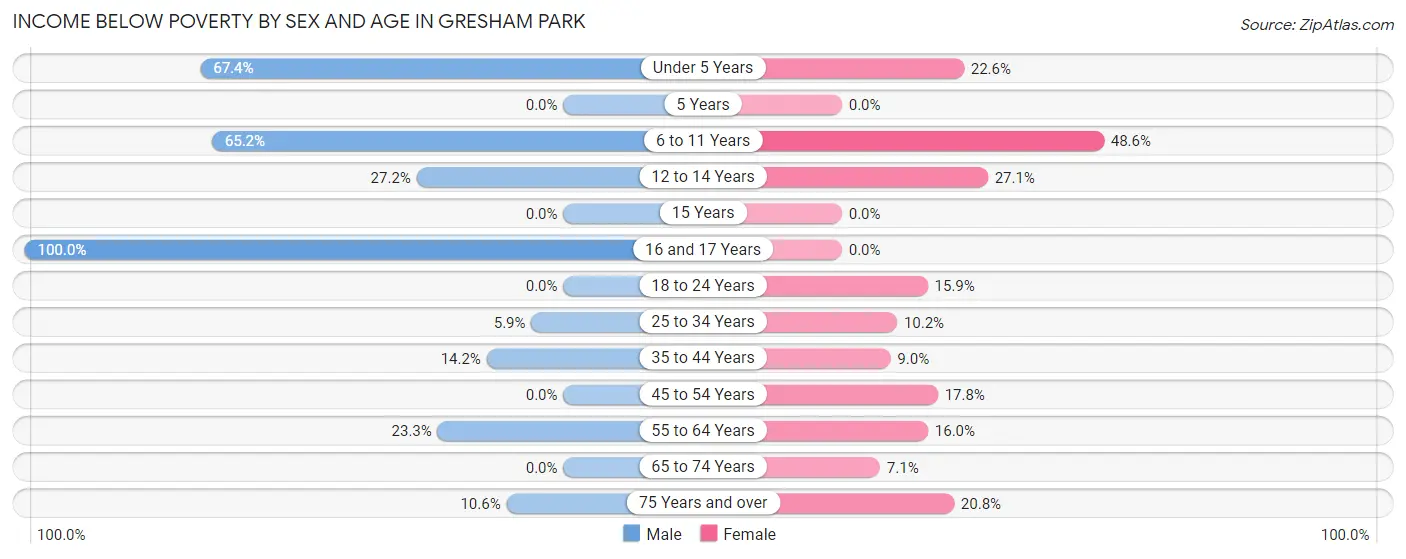
| Age Bracket | Male | Female |
| Under 5 Years | 188 (67.4%) | 36 (22.6%) |
| 5 Years | 0 (0.0%) | 0 (0.0%) |
| 6 to 11 Years | 152 (65.2%) | 71 (48.6%) |
| 12 to 14 Years | 55 (27.2%) | 26 (27.1%) |
| 15 Years | 0 (0.0%) | 0 (0.0%) |
| 16 and 17 Years | 65 (100.0%) | 0 (0.0%) |
| 18 to 24 Years | 0 (0.0%) | 43 (15.9%) |
| 25 to 34 Years | 52 (5.9%) | 59 (10.2%) |
| 35 to 44 Years | 107 (14.2%) | 48 (9.0%) |
| 45 to 54 Years | 0 (0.0%) | 60 (17.8%) |
| 55 to 64 Years | 116 (23.3%) | 96 (16.0%) |
| 65 to 74 Years | 0 (0.0%) | 44 (7.1%) |
| 75 Years and over | 49 (10.6%) | 41 (20.8%) |
| Total | 784 (18.4%) | 524 (14.7%) |
Income Above Poverty by Sex and Age in Gresham Park
According to the poverty statistics in Gresham Park, males aged 5 years and females aged 5 years are the age groups that are most secure financially, with 100.0% of males and 100.0% of females in these age groups living above the poverty line.
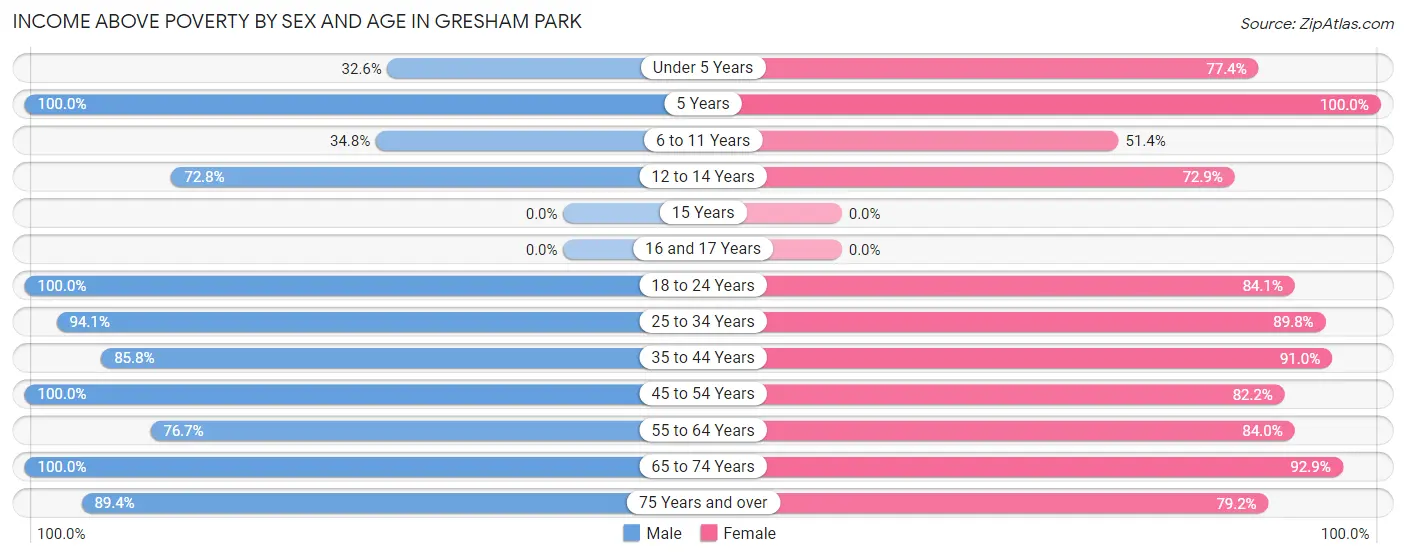
| Age Bracket | Male | Female |
| Under 5 Years | 91 (32.6%) | 123 (77.4%) |
| 5 Years | 42 (100.0%) | 16 (100.0%) |
| 6 to 11 Years | 81 (34.8%) | 75 (51.4%) |
| 12 to 14 Years | 147 (72.8%) | 70 (72.9%) |
| 15 Years | 0 (0.0%) | 0 (0.0%) |
| 16 and 17 Years | 0 (0.0%) | 0 (0.0%) |
| 18 to 24 Years | 166 (100.0%) | 227 (84.1%) |
| 25 to 34 Years | 824 (94.1%) | 517 (89.8%) |
| 35 to 44 Years | 645 (85.8%) | 484 (91.0%) |
| 45 to 54 Years | 306 (100.0%) | 277 (82.2%) |
| 55 to 64 Years | 381 (76.7%) | 505 (84.0%) |
| 65 to 74 Years | 382 (100.0%) | 578 (92.9%) |
| 75 Years and over | 415 (89.4%) | 156 (79.2%) |
| Total | 3,480 (81.6%) | 3,028 (85.3%) |
Income Below Poverty Among Married-Couple Families in Gresham Park
The poverty statistics for married-couple families in Gresham Park show that 6.2% or 60 of the total 963 families live below the poverty line. Families with 3 or 4 children have the highest poverty rate of 54.9%, comprising of 28 families. On the other hand, families with no children have the lowest poverty rate of 1.3%, which includes 9 families.
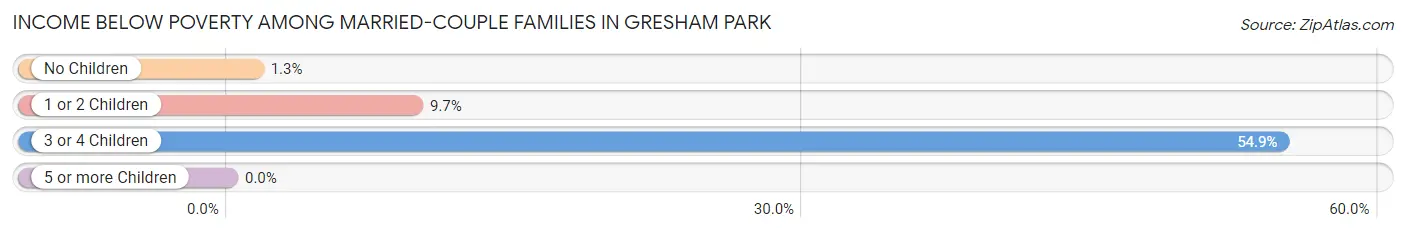
| Children | Above Poverty | Below Poverty |
| No Children | 665 (98.7%) | 9 (1.3%) |
| 1 or 2 Children | 215 (90.3%) | 23 (9.7%) |
| 3 or 4 Children | 23 (45.1%) | 28 (54.9%) |
| 5 or more Children | 0 (0.0%) | 0 (0.0%) |
| Total | 903 (93.8%) | 60 (6.2%) |
Income Below Poverty Among Single-Parent Households in Gresham Park
According to the poverty data in Gresham Park, 25.7% or 95 single-father households and 18.1% or 72 single-mother households are living below the poverty line. Among single-father households, those with 1 or 2 children have the highest poverty rate, with 95 households (49.0%) experiencing poverty. Likewise, among single-mother households, those with 3 or 4 children have the highest poverty rate, with 25 households (100.0%) falling below the poverty line.
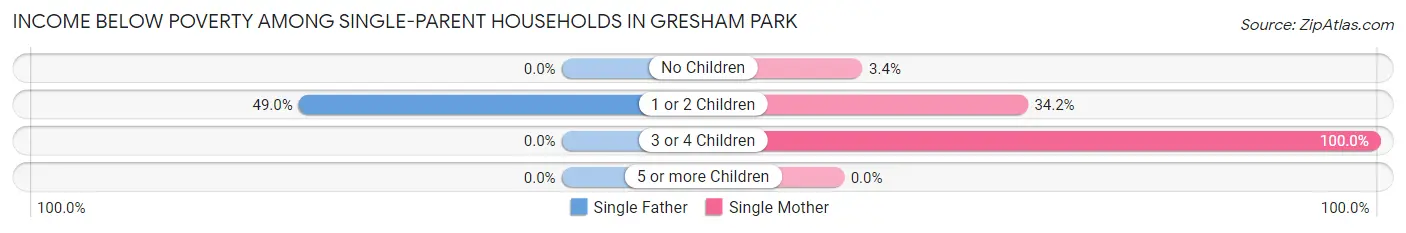
| Children | Single Father | Single Mother |
| No Children | 0 (0.0%) | 9 (3.4%) |
| 1 or 2 Children | 95 (49.0%) | 38 (34.2%) |
| 3 or 4 Children | 0 (0.0%) | 25 (100.0%) |
| 5 or more Children | 0 (0.0%) | 0 (0.0%) |
| Total | 95 (25.7%) | 72 (18.1%) |
Income Below Poverty Among Married-Couple vs Single-Parent Households in Gresham Park
The poverty data for Gresham Park shows that 60 of the married-couple family households (6.2%) and 167 of the single-parent households (21.7%) are living below the poverty level. Within the married-couple family households, those with 3 or 4 children have the highest poverty rate, with 28 households (54.9%) falling below the poverty line. Among the single-parent households, those with 3 or 4 children have the highest poverty rate, with 25 household (100.0%) living below poverty.
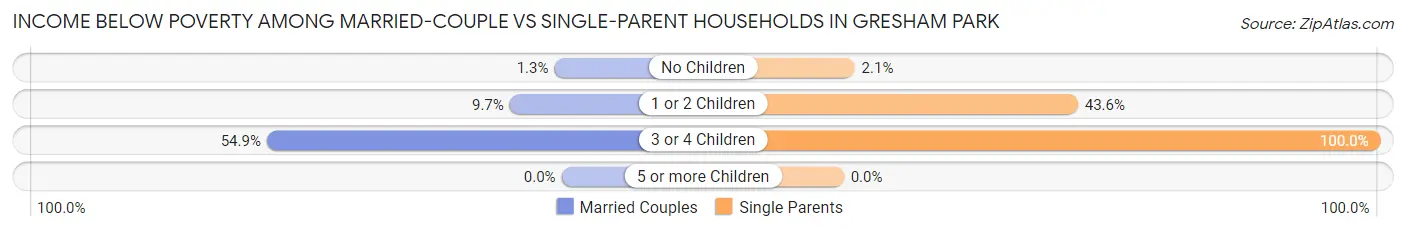
| Children | Married-Couple Families | Single-Parent Households |
| No Children | 9 (1.3%) | 9 (2.1%) |
| 1 or 2 Children | 23 (9.7%) | 133 (43.6%) |
| 3 or 4 Children | 28 (54.9%) | 25 (100.0%) |
| 5 or more Children | 0 (0.0%) | 0 (0.0%) |
| Total | 60 (6.2%) | 167 (21.7%) |
Race in Gresham Park
The most populous races in Gresham Park are Black / African American (5,842 | 74.7%), White / Caucasian (1,128 | 14.4%), and Two or more Races (630 | 8.1%).
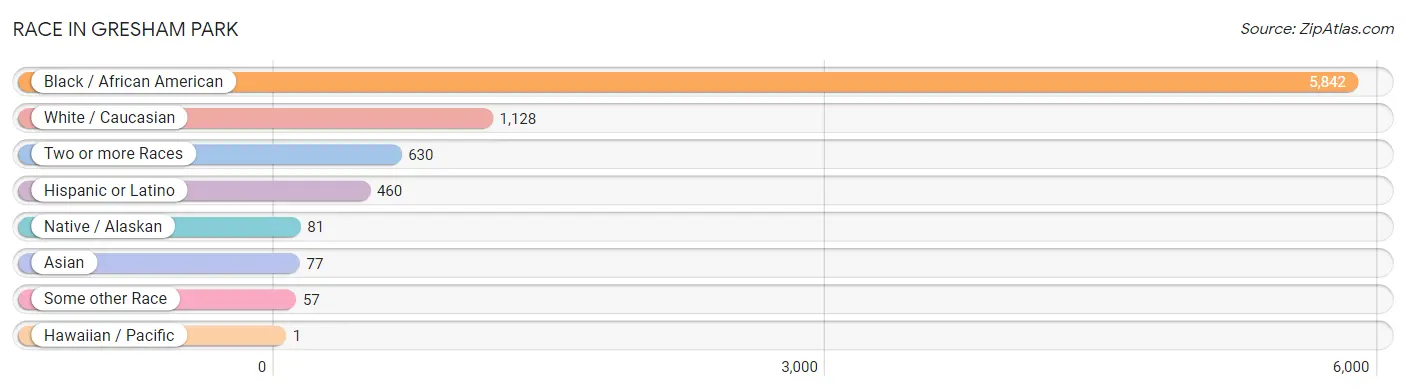
| Race | # Population | % Population |
| Asian | 77 | 1.0% |
| Black / African American | 5,842 | 74.7% |
| Hawaiian / Pacific | 1 | 0.0% |
| Hispanic or Latino | 460 | 5.9% |
| Native / Alaskan | 81 | 1.0% |
| White / Caucasian | 1,128 | 14.4% |
| Two or more Races | 630 | 8.1% |
| Some other Race | 57 | 0.7% |
| Total | 7,816 | 100.0% |
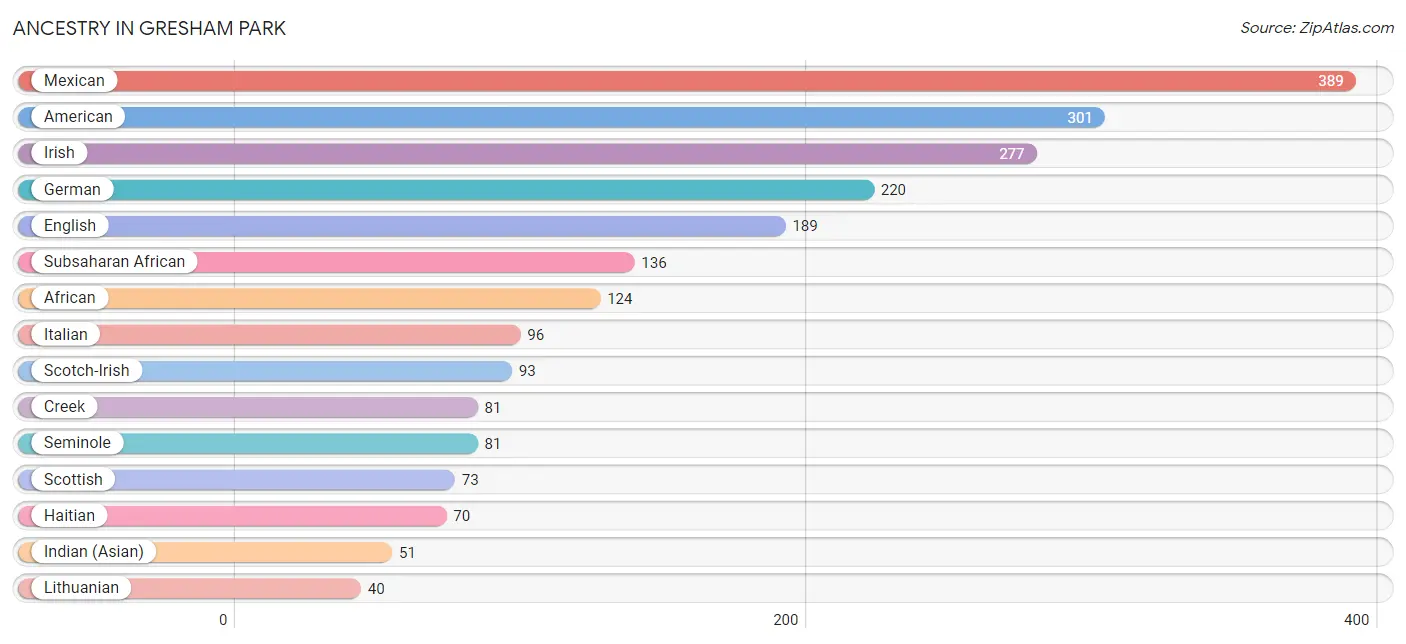
Ancestry in Gresham Park
The most populous ancestries reported in Gresham Park are Mexican (389 | 5.0%), American (301 | 3.8%), Irish (277 | 3.5%), German (220 | 2.8%), and English (189 | 2.4%), together accounting for 17.6% of all Gresham Park residents.
| Ancestry | # Population | % Population |
| African | 124 | 1.6% |
| American | 301 | 3.8% |
| Arab | 9 | 0.1% |
| Bhutanese | 28 | 0.4% |
| British | 30 | 0.4% |
| Burmese | 26 | 0.3% |
| Central American | 15 | 0.2% |
| Creek | 81 | 1.0% |
| Cuban | 4 | 0.1% |
| Dominican | 11 | 0.1% |
| Dutch | 18 | 0.2% |
| Eastern European | 8 | 0.1% |
| English | 189 | 2.4% |
| European | 33 | 0.4% |
| Finnish | 11 | 0.1% |
| French | 21 | 0.3% |
| French Canadian | 27 | 0.4% |
| German | 220 | 2.8% |
| Guamanian / Chamorro | 1 | 0.0% |
| Haitian | 70 | 0.9% |
| Indian (Asian) | 51 | 0.6% |
| Irish | 277 | 3.5% |
| Italian | 96 | 1.2% |
| Korean | 8 | 0.1% |
| Laotian | 28 | 0.4% |
| Lithuanian | 40 | 0.5% |
| Mexican | 389 | 5.0% |
| Nigerian | 12 | 0.2% |
| Norwegian | 17 | 0.2% |
| Palestinian | 9 | 0.1% |
| Pennsylvania German | 10 | 0.1% |
| Portuguese | 7 | 0.1% |
| Salvadoran | 15 | 0.2% |
| Scandinavian | 9 | 0.1% |
| Scotch-Irish | 93 | 1.2% |
| Scottish | 73 | 0.9% |
| Seminole | 81 | 1.0% |
| Spaniard | 27 | 0.4% |
| Spanish | 14 | 0.2% |
| Subsaharan African | 136 | 1.7% |
| Swedish | 10 | 0.1% |
| Swiss | 10 | 0.1% |
| Welsh | 35 | 0.4% | View All 43 Rows |
Immigrants in Gresham Park
The most numerous immigrant groups reported in Gresham Park came from Central America (86 | 1.1%), Latin America (86 | 1.1%), Mexico (86 | 1.1%), Europe (25 | 0.3%), and Northern Europe (25 | 0.3%), together accounting for 3.9% of all Gresham Park residents.
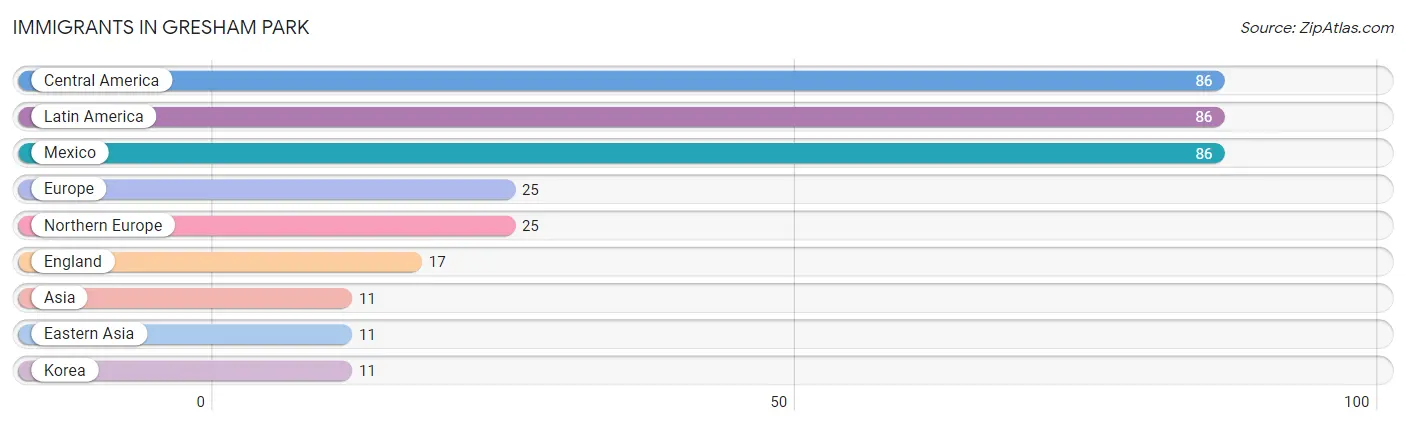
| Immigration Origin | # Population | % Population |
| Asia | 11 | 0.1% |
| Central America | 86 | 1.1% |
| Eastern Asia | 11 | 0.1% |
| England | 17 | 0.2% |
| Europe | 25 | 0.3% |
| Korea | 11 | 0.1% |
| Latin America | 86 | 1.1% |
| Mexico | 86 | 1.1% |
| Northern Europe | 25 | 0.3% | View All 9 Rows |
Sex and Age in Gresham Park
Sex and Age in Gresham Park
The most populous age groups in Gresham Park are 30 to 34 Years (475 | 11.1%) for men and 25 to 29 Years (379 | 10.7%) for women.
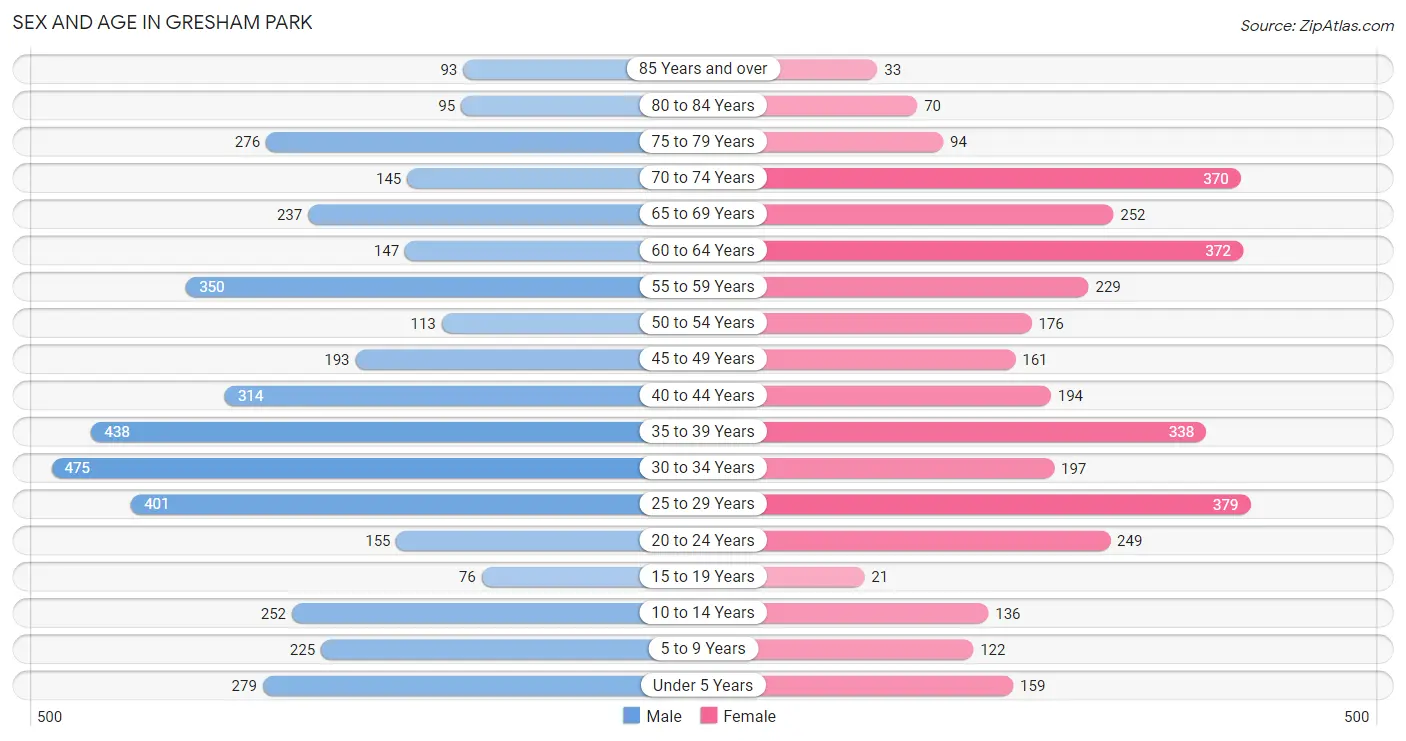
| Age Bracket | Male | Female |
| Under 5 Years | 279 (6.5%) | 159 (4.5%) |
| 5 to 9 Years | 225 (5.3%) | 122 (3.4%) |
| 10 to 14 Years | 252 (5.9%) | 136 (3.8%) |
| 15 to 19 Years | 76 (1.8%) | 21 (0.6%) |
| 20 to 24 Years | 155 (3.6%) | 249 (7.0%) |
| 25 to 29 Years | 401 (9.4%) | 379 (10.7%) |
| 30 to 34 Years | 475 (11.1%) | 197 (5.6%) |
| 35 to 39 Years | 438 (10.3%) | 338 (9.5%) |
| 40 to 44 Years | 314 (7.4%) | 194 (5.5%) |
| 45 to 49 Years | 193 (4.5%) | 161 (4.5%) |
| 50 to 54 Years | 113 (2.6%) | 176 (5.0%) |
| 55 to 59 Years | 350 (8.2%) | 229 (6.5%) |
| 60 to 64 Years | 147 (3.5%) | 372 (10.5%) |
| 65 to 69 Years | 237 (5.6%) | 252 (7.1%) |
| 70 to 74 Years | 145 (3.4%) | 370 (10.4%) |
| 75 to 79 Years | 276 (6.5%) | 94 (2.6%) |
| 80 to 84 Years | 95 (2.2%) | 70 (2.0%) |
| 85 Years and over | 93 (2.2%) | 33 (0.9%) |
| Total | 4,264 (100.0%) | 3,552 (100.0%) |
Families and Households in Gresham Park
Median Family Size in Gresham Park
The median family size in Gresham Park is 3.24 persons per family, with single female/mother families (398 | 23.0%) accounting for the largest median family size of 4.02 persons per family. On the other hand, single male/father families (370 | 21.4%) represent the smallest median family size with 2.76 persons per family.
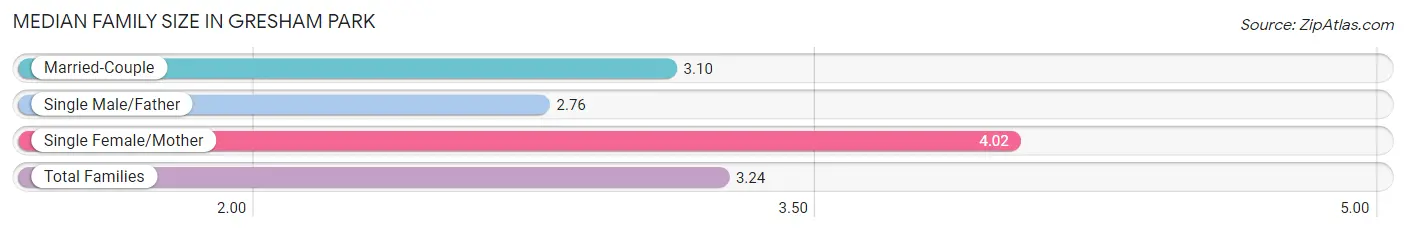
| Family Type | # Families | Family Size |
| Married-Couple | 963 (55.6%) | 3.10 |
| Single Male/Father | 370 (21.4%) | 2.76 |
| Single Female/Mother | 398 (23.0%) | 4.02 |
| Total Families | 1,731 (100.0%) | 3.24 |
Median Household Size in Gresham Park
The median household size in Gresham Park is 2.51 persons per household, with single female/mother households (398 | 12.8%) accounting for the largest median household size of 4.21 persons per household. non-family households (1,375 | 44.3%) represent the smallest median household size with 1.39 persons per household.
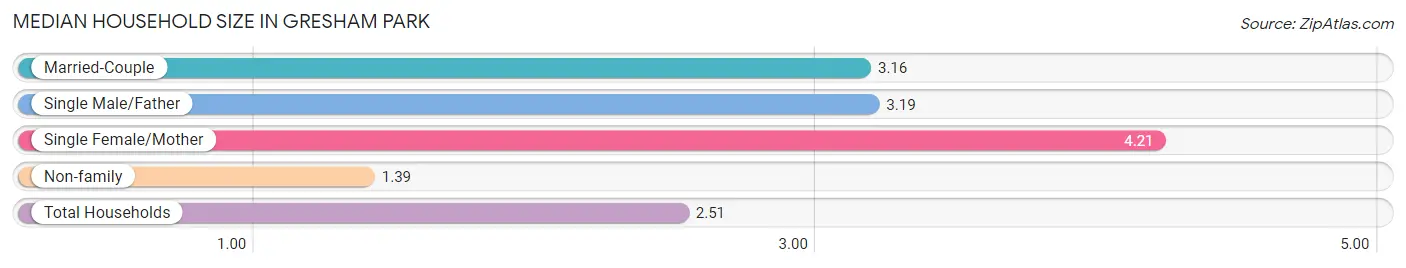
| Household Type | # Households | Household Size |
| Married-Couple | 963 (31.0%) | 3.16 |
| Single Male/Father | 370 (11.9%) | 3.19 |
| Single Female/Mother | 398 (12.8%) | 4.21 |
| Non-family | 1,375 (44.3%) | 1.39 |
| Total Households | 3,106 (100.0%) | 2.51 |
Household Size by Marriage Status in Gresham Park
Out of a total of 3,106 households in Gresham Park, 1,731 (55.7%) are family households, while 1,375 (44.3%) are nonfamily households. The most numerous type of family households are 2-person households, comprising 983, and the most common type of nonfamily households are 1-person households, comprising 976.
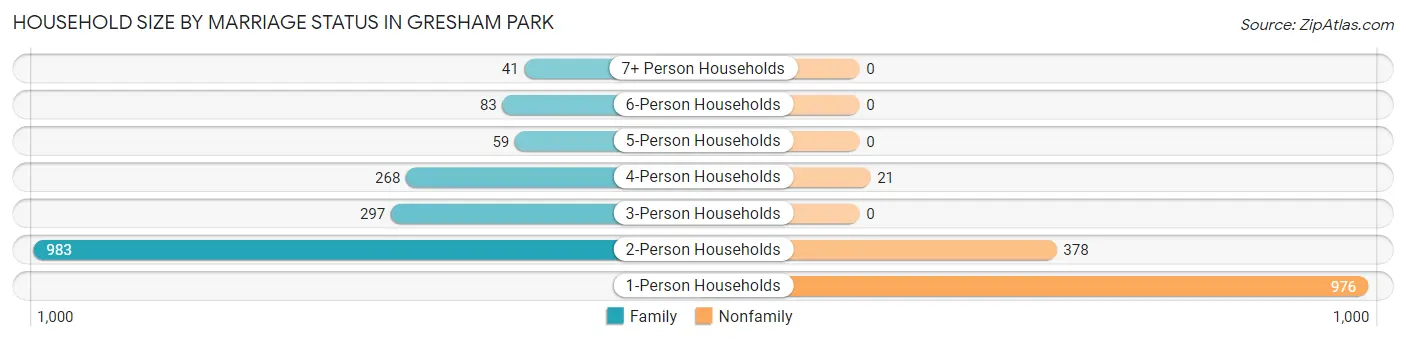
| Household Size | Family Households | Nonfamily Households |
| 1-Person Households | - | 976 (31.4%) |
| 2-Person Households | 983 (31.7%) | 378 (12.2%) |
| 3-Person Households | 297 (9.6%) | 0 (0.0%) |
| 4-Person Households | 268 (8.6%) | 21 (0.7%) |
| 5-Person Households | 59 (1.9%) | 0 (0.0%) |
| 6-Person Households | 83 (2.7%) | 0 (0.0%) |
| 7+ Person Households | 41 (1.3%) | 0 (0.0%) |
| Total | 1,731 (55.7%) | 1,375 (44.3%) |
Female Fertility in Gresham Park
Fertility by Age in Gresham Park
Average fertility rate in Gresham Park is 33.0 births per 1,000 women. Women in the age bracket of 20 to 34 years have the highest fertility rate with 62.0 births per 1,000 women. Women in the age bracket of 20 to 34 years acount for 100.0% of all women with births.
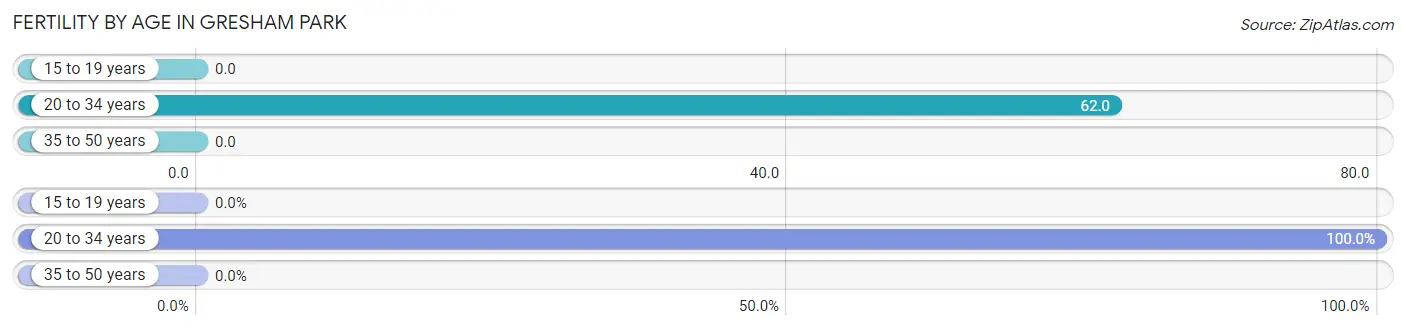
| Age Bracket | Women with Births | Births / 1,000 Women |
| 15 to 19 years | 0 (0.0%) | 0.0 |
| 20 to 34 years | 51 (100.0%) | 62.0 |
| 35 to 50 years | 0 (0.0%) | 0.0 |
| Total | 51 (100.0%) | 33.0 |
Fertility by Age by Marriage Status in Gresham Park
21.6% of women with births (51) in Gresham Park are married. The highest percentage of unmarried women with births falls into 20 to 34 years age bracket with 78.4% of them unmarried at the time of birth, while the lowest percentage of unmarried women with births belong to 20 to 34 years age bracket with 78.4% of them unmarried.
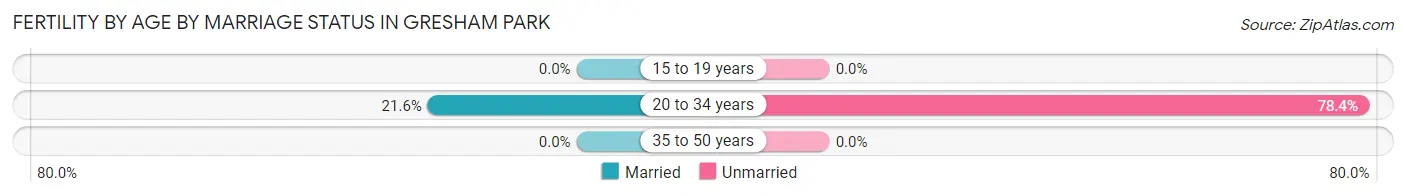
| Age Bracket | Married | Unmarried |
| 15 to 19 years | 0 (0.0%) | 0 (0.0%) |
| 20 to 34 years | 11 (21.6%) | 40 (78.4%) |
| 35 to 50 years | 0 (0.0%) | 0 (0.0%) |
| Total | 11 (21.6%) | 40 (78.4%) |
Fertility by Education in Gresham Park
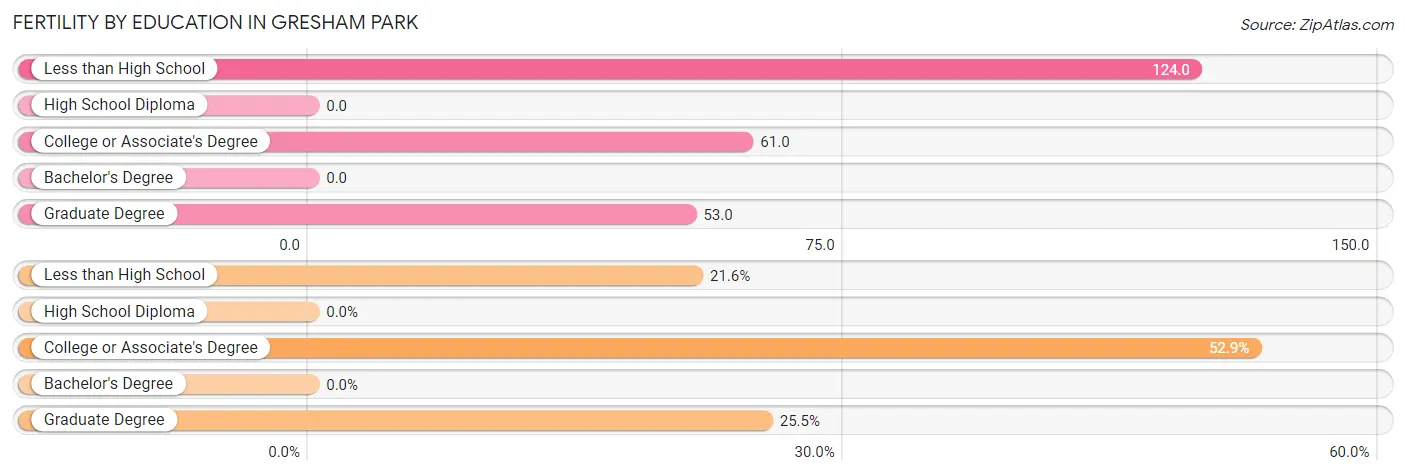
| Educational Attainment | Women with Births | Births / 1,000 Women |
| Less than High School | 11 (21.6%) | 124.0 |
| High School Diploma | 0 (0.0%) | 0.0 |
| College or Associate's Degree | 27 (52.9%) | 61.0 |
| Bachelor's Degree | 0 (0.0%) | 0.0 |
| Graduate Degree | 13 (25.5%) | 53.0 |
| Total | 51 (100.0%) | 33.0 |
Fertility by Education by Marriage Status in Gresham Park
78.4% of women with births in Gresham Park are unmarried. Women with the educational attainment of less than high school are most likely to be married with 100.0% of them married at childbirth, while women with the educational attainment of college or associate's degree are least likely to be married with 100.0% of them unmarried at childbirth.
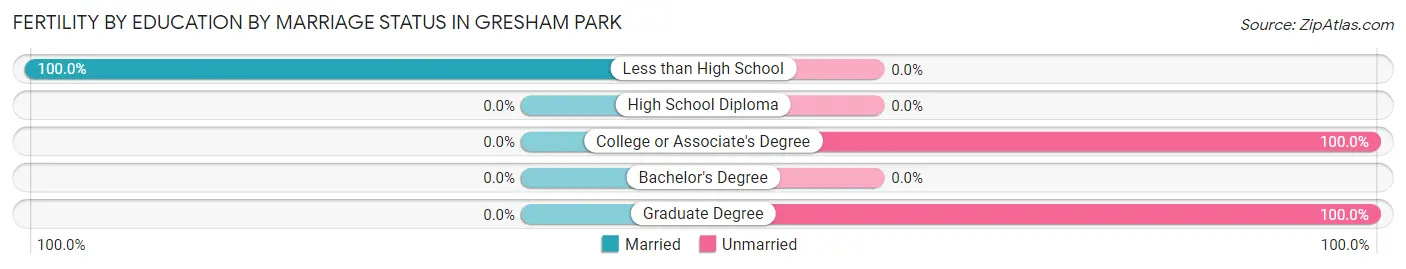
| Educational Attainment | Married | Unmarried |
| Less than High School | 11 (100.0%) | 0 (0.0%) |
| High School Diploma | 0 (0.0%) | 0 (0.0%) |
| College or Associate's Degree | 0 (0.0%) | 27 (100.0%) |
| Bachelor's Degree | 0 (0.0%) | 0 (0.0%) |
| Graduate Degree | 0 (0.0%) | 13 (100.0%) |
| Total | 11 (21.6%) | 40 (78.4%) |
Employment Characteristics in Gresham Park
Employment by Class of Employer in Gresham Park
Among the 3,815 employed individuals in Gresham Park, private company employees (2,302 | 60.3%), state government employees (329 | 8.6%), and not-for-profit organizations (307 | 8.1%) make up the most common classes of employment.
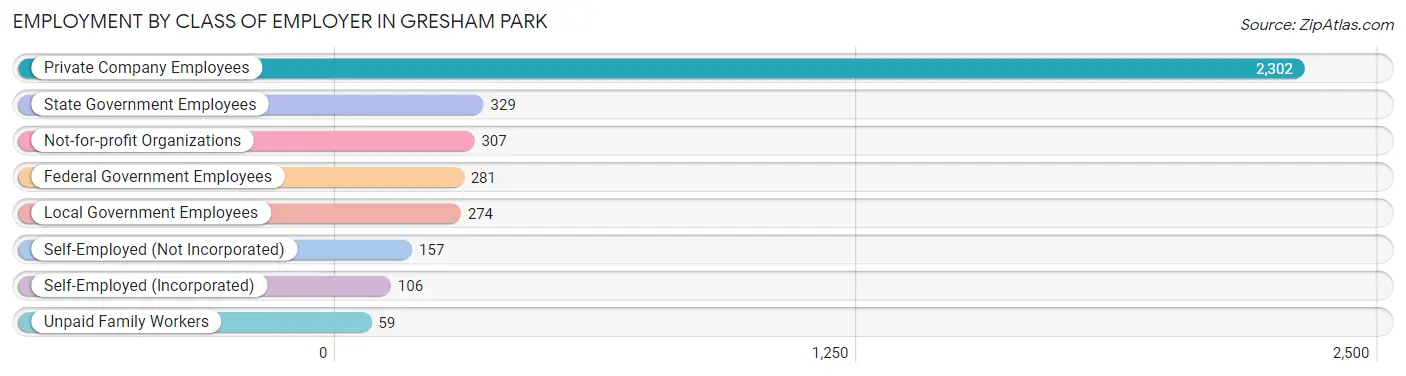
| Employer Class | # Employees | % Employees |
| Private Company Employees | 2,302 | 60.3% |
| Self-Employed (Incorporated) | 106 | 2.8% |
| Self-Employed (Not Incorporated) | 157 | 4.1% |
| Not-for-profit Organizations | 307 | 8.1% |
| Local Government Employees | 274 | 7.2% |
| State Government Employees | 329 | 8.6% |
| Federal Government Employees | 281 | 7.4% |
| Unpaid Family Workers | 59 | 1.5% |
| Total | 3,815 | 100.0% |
Employment Status by Age in Gresham Park
According to the labor force statistics for Gresham Park, out of the total population over 16 years of age (6,643), 62.6% or 4,159 individuals are in the labor force, with 4.5% or 187 of them unemployed. The age group with the highest labor force participation rate is 25 to 29 years, with 89.4% or 697 individuals in the labor force. Within the labor force, the 30 to 34 years age range has the highest percentage of unemployed individuals, with 10.3% or 50 of them being unemployed.
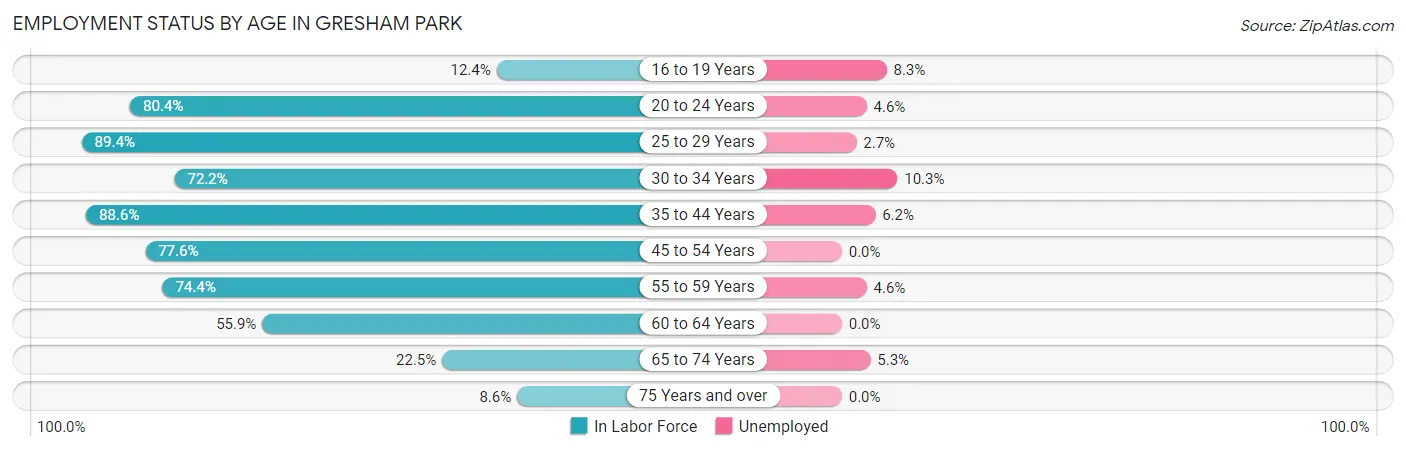
| Age Bracket | In Labor Force | Unemployed |
| 16 to 19 Years | 12 (12.4%) | 1 (8.3%) |
| 20 to 24 Years | 325 (80.4%) | 15 (4.6%) |
| 25 to 29 Years | 697 (89.4%) | 19 (2.7%) |
| 30 to 34 Years | 485 (72.2%) | 50 (10.3%) |
| 35 to 44 Years | 1,138 (88.6%) | 71 (6.2%) |
| 45 to 54 Years | 499 (77.6%) | 0 (0.0%) |
| 55 to 59 Years | 431 (74.4%) | 20 (4.6%) |
| 60 to 64 Years | 290 (55.9%) | 0 (0.0%) |
| 65 to 74 Years | 226 (22.5%) | 12 (5.3%) |
| 75 Years and over | 57 (8.6%) | 0 (0.0%) |
| Total | 4,159 (62.6%) | 187 (4.5%) |
Employment Status by Educational Attainment in Gresham Park
According to labor force statistics for Gresham Park, 79.0% of individuals (3,537) out of the total population between 25 and 64 years of age (4,477) are in the labor force, with 4.5% or 159 of them being unemployed. The group with the highest labor force participation rate are those with the educational attainment of bachelor's degree or higher, with 94.6% or 1,569 individuals in the labor force. Within the labor force, individuals with high school diploma education have the highest percentage of unemployment, with 16.2% or 111 of them being unemployed.
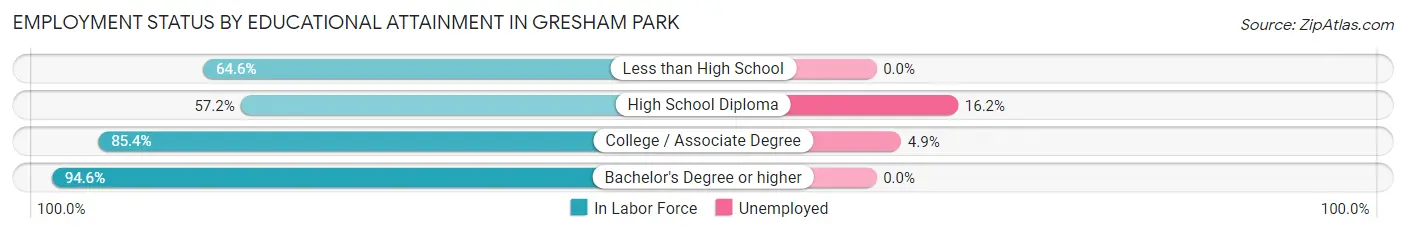
| Educational Attainment | In Labor Force | Unemployed |
| Less than High School | 307 (64.6%) | 0 (0.0%) |
| High School Diploma | 687 (57.2%) | 195 (16.2%) |
| College / Associate Degree | 975 (85.4%) | 56 (4.9%) |
| Bachelor's Degree or higher | 1,569 (94.6%) | 0 (0.0%) |
| Total | 3,537 (79.0%) | 201 (4.5%) |
Employment Occupations by Sex in Gresham Park
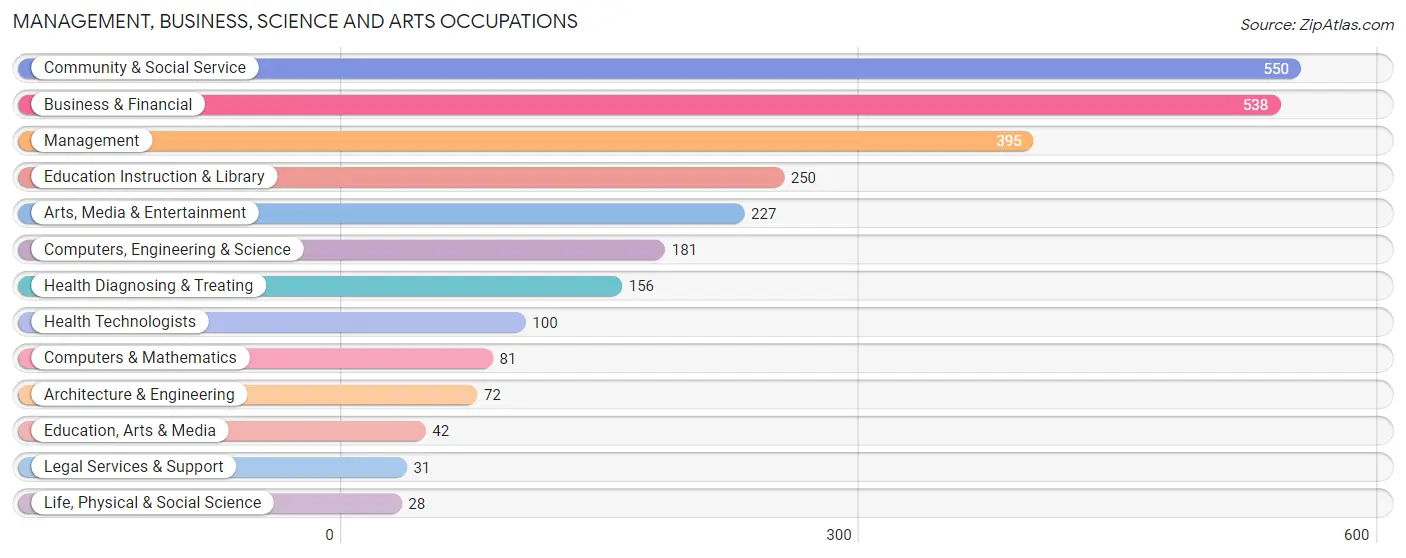
Management, Business, Science and Arts Occupations
The most common Management, Business, Science and Arts occupations in Gresham Park are Community & Social Service (550 | 13.9%), Business & Financial (538 | 13.5%), Management (395 | 9.9%), Education Instruction & Library (250 | 6.3%), and Arts, Media & Entertainment (227 | 5.7%).
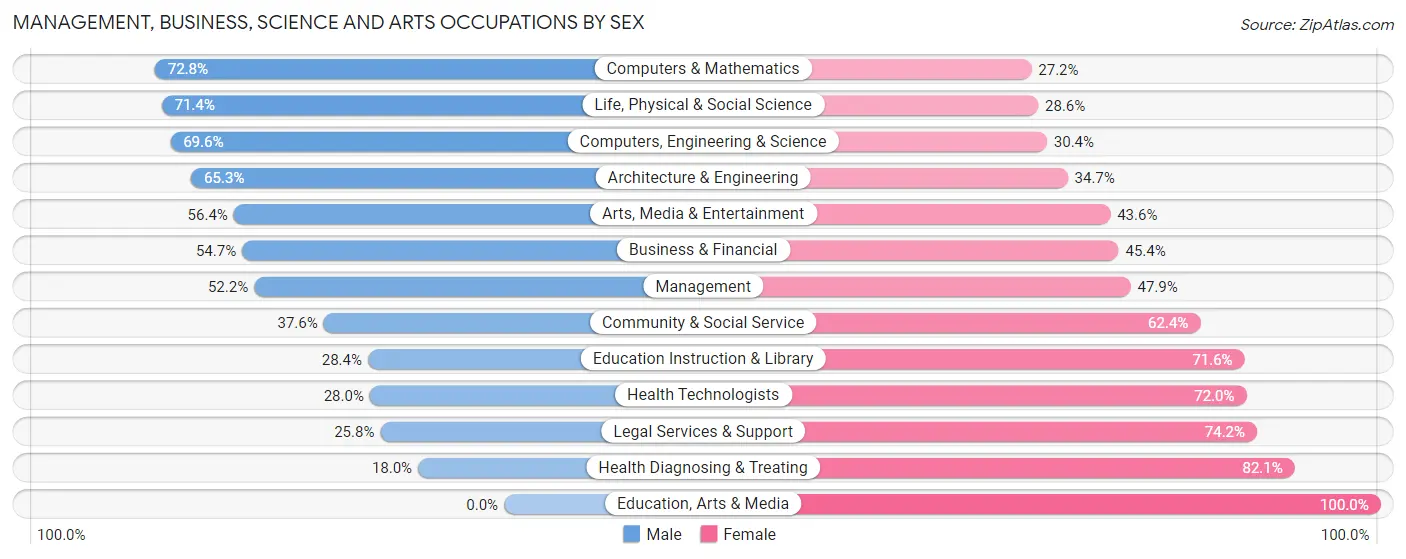
Management, Business, Science and Arts Occupations by Sex
Within the Management, Business, Science and Arts occupations in Gresham Park, the most male-oriented occupations are Computers & Mathematics (72.8%), Life, Physical & Social Science (71.4%), and Computers, Engineering & Science (69.6%), while the most female-oriented occupations are Education, Arts & Media (100.0%), Health Diagnosing & Treating (82.1%), and Legal Services & Support (74.2%).
| Occupation | Male | Female |
| Management | 206 (52.1%) | 189 (47.8%) |
| Business & Financial | 294 (54.6%) | 244 (45.4%) |
| Computers, Engineering & Science | 126 (69.6%) | 55 (30.4%) |
| Computers & Mathematics | 59 (72.8%) | 22 (27.2%) |
| Architecture & Engineering | 47 (65.3%) | 25 (34.7%) |
| Life, Physical & Social Science | 20 (71.4%) | 8 (28.6%) |
| Community & Social Service | 207 (37.6%) | 343 (62.4%) |
| Education, Arts & Media | 0 (0.0%) | 42 (100.0%) |
| Legal Services & Support | 8 (25.8%) | 23 (74.2%) |
| Education Instruction & Library | 71 (28.4%) | 179 (71.6%) |
| Arts, Media & Entertainment | 128 (56.4%) | 99 (43.6%) |
| Health Diagnosing & Treating | 28 (17.9%) | 128 (82.1%) |
| Health Technologists | 28 (28.0%) | 72 (72.0%) |
| Total (Category) | 861 (47.3%) | 959 (52.7%) |
| Total (Overall) | 2,156 (54.3%) | 1,816 (45.7%) |
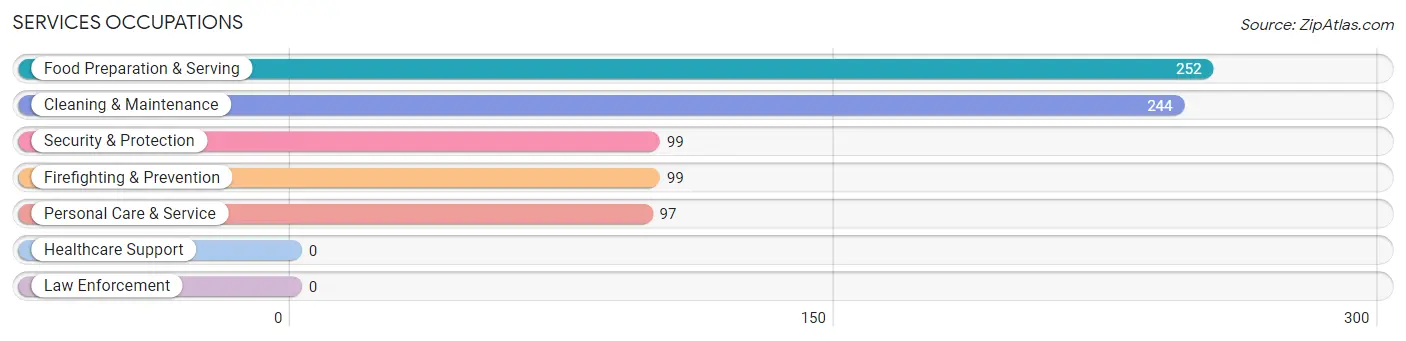
Services Occupations
The most common Services occupations in Gresham Park are Food Preparation & Serving (252 | 6.3%), Cleaning & Maintenance (244 | 6.1%), Security & Protection (99 | 2.5%), Firefighting & Prevention (99 | 2.5%), and Personal Care & Service (97 | 2.4%).
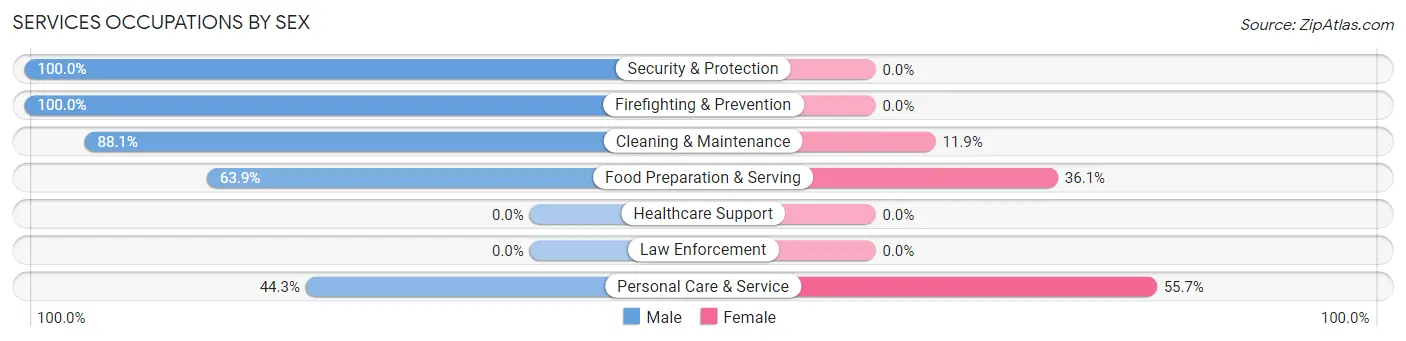
Services Occupations by Sex
Within the Services occupations in Gresham Park, the most male-oriented occupations are Security & Protection (100.0%), Firefighting & Prevention (100.0%), and Cleaning & Maintenance (88.1%), while the most female-oriented occupations are Personal Care & Service (55.7%), Food Preparation & Serving (36.1%), and Cleaning & Maintenance (11.9%).
| Occupation | Male | Female |
| Healthcare Support | 0 (0.0%) | 0 (0.0%) |
| Security & Protection | 99 (100.0%) | 0 (0.0%) |
| Firefighting & Prevention | 99 (100.0%) | 0 (0.0%) |
| Law Enforcement | 0 (0.0%) | 0 (0.0%) |
| Food Preparation & Serving | 161 (63.9%) | 91 (36.1%) |
| Cleaning & Maintenance | 215 (88.1%) | 29 (11.9%) |
| Personal Care & Service | 43 (44.3%) | 54 (55.7%) |
| Total (Category) | 518 (74.9%) | 174 (25.1%) |
| Total (Overall) | 2,156 (54.3%) | 1,816 (45.7%) |
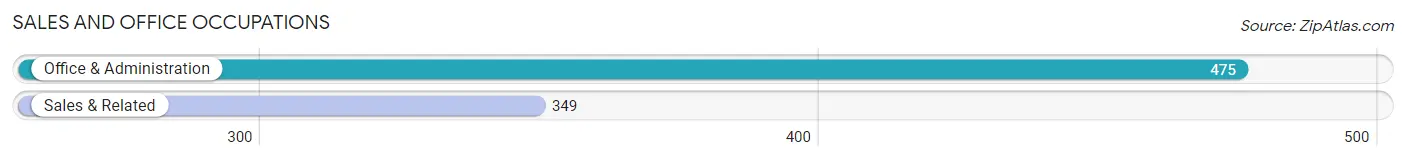
Sales and Office Occupations
The most common Sales and Office occupations in Gresham Park are Office & Administration (475 | 12.0%), and Sales & Related (349 | 8.8%).
Sales and Office Occupations by Sex
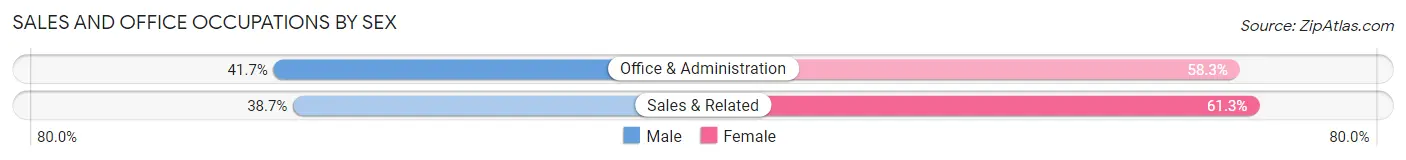
| Occupation | Male | Female |
| Sales & Related | 135 (38.7%) | 214 (61.3%) |
| Office & Administration | 198 (41.7%) | 277 (58.3%) |
| Total (Category) | 333 (40.4%) | 491 (59.6%) |
| Total (Overall) | 2,156 (54.3%) | 1,816 (45.7%) |
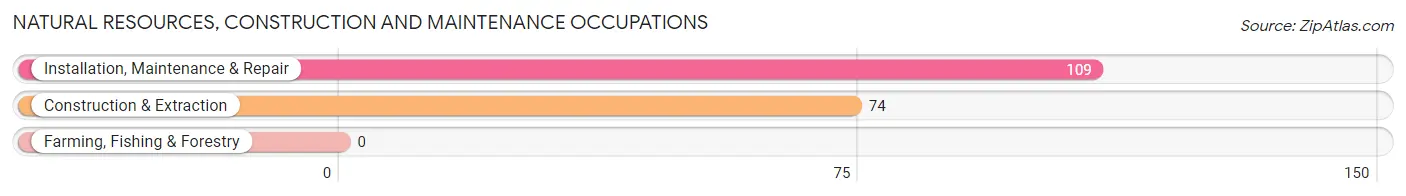
Natural Resources, Construction and Maintenance Occupations
The most common Natural Resources, Construction and Maintenance occupations in Gresham Park are Installation, Maintenance & Repair (109 | 2.7%), and Construction & Extraction (74 | 1.9%).
Natural Resources, Construction and Maintenance Occupations by Sex
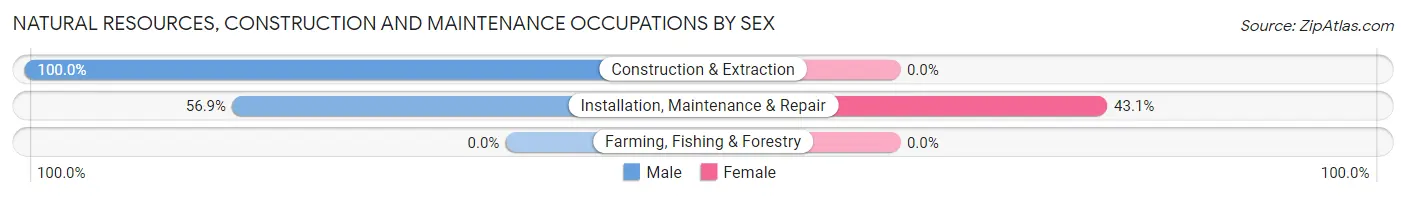
| Occupation | Male | Female |
| Farming, Fishing & Forestry | 0 (0.0%) | 0 (0.0%) |
| Construction & Extraction | 74 (100.0%) | 0 (0.0%) |
| Installation, Maintenance & Repair | 62 (56.9%) | 47 (43.1%) |
| Total (Category) | 136 (74.3%) | 47 (25.7%) |
| Total (Overall) | 2,156 (54.3%) | 1,816 (45.7%) |
Production, Transportation and Moving Occupations
The most common Production, Transportation and Moving occupations in Gresham Park are Transportation (160 | 4.0%), Production (158 | 4.0%), and Material Moving (135 | 3.4%).
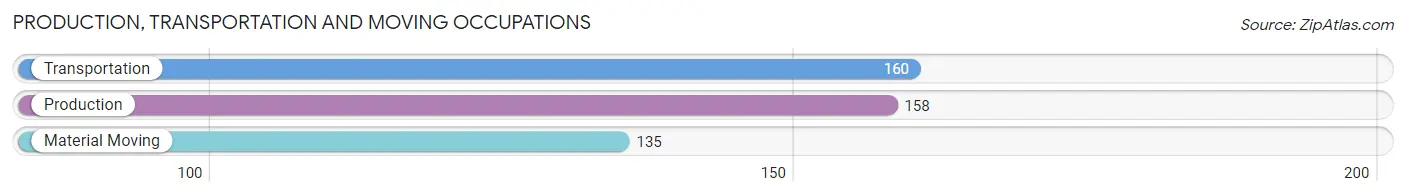
Production, Transportation and Moving Occupations by Sex
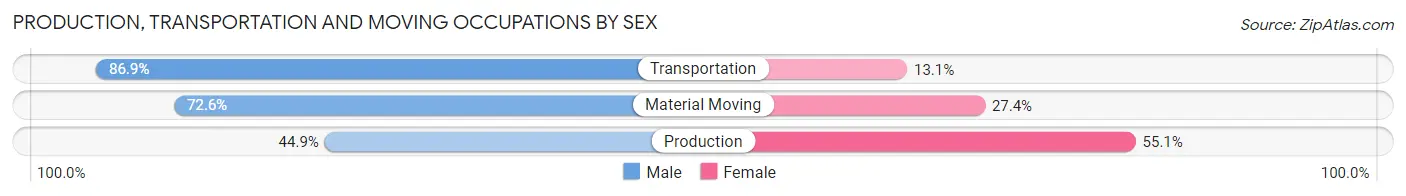
| Occupation | Male | Female |
| Production | 71 (44.9%) | 87 (55.1%) |
| Transportation | 139 (86.9%) | 21 (13.1%) |
| Material Moving | 98 (72.6%) | 37 (27.4%) |
| Total (Category) | 308 (68.0%) | 145 (32.0%) |
| Total (Overall) | 2,156 (54.3%) | 1,816 (45.7%) |
Employment Industries by Sex in Gresham Park
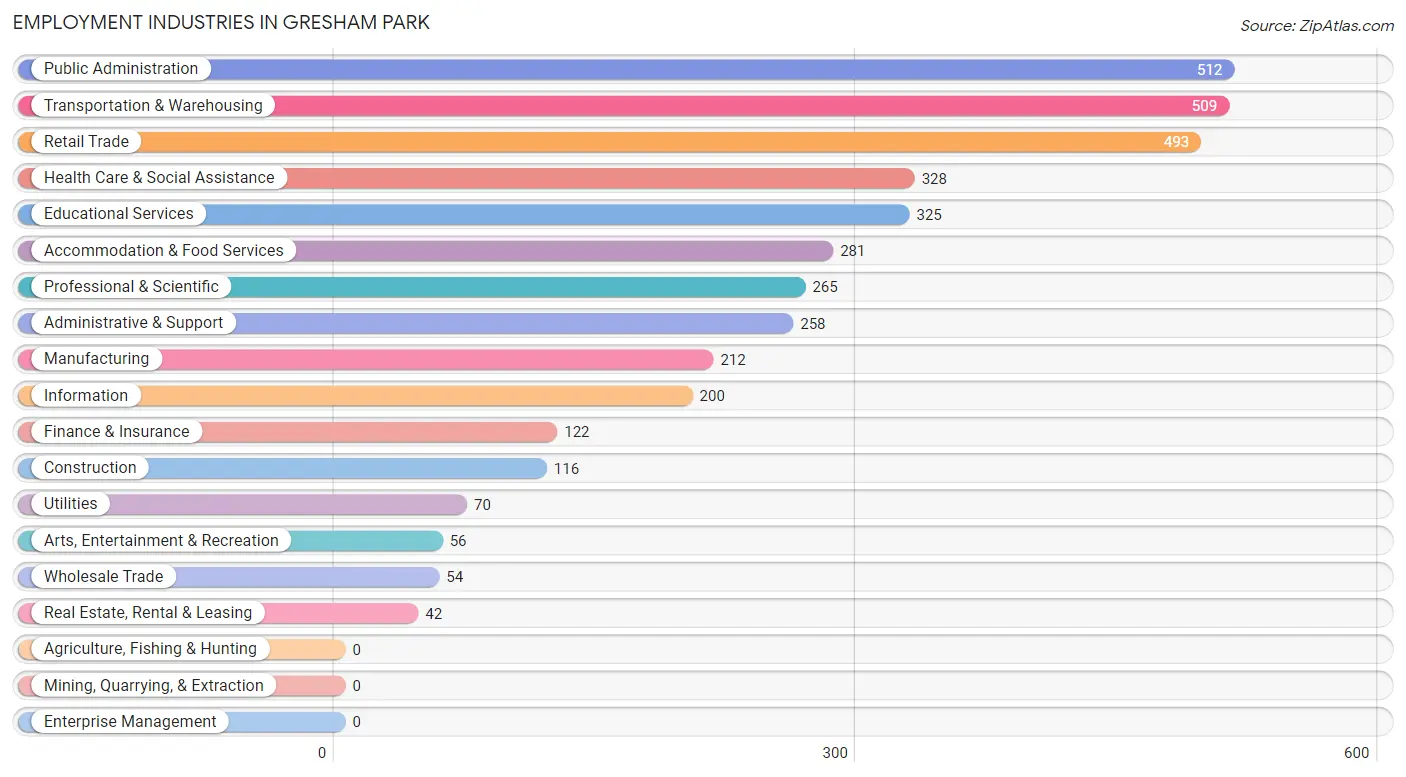
Employment Industries in Gresham Park
The major employment industries in Gresham Park include Public Administration (512 | 12.9%), Transportation & Warehousing (509 | 12.8%), Retail Trade (493 | 12.4%), Health Care & Social Assistance (328 | 8.3%), and Educational Services (325 | 8.2%).
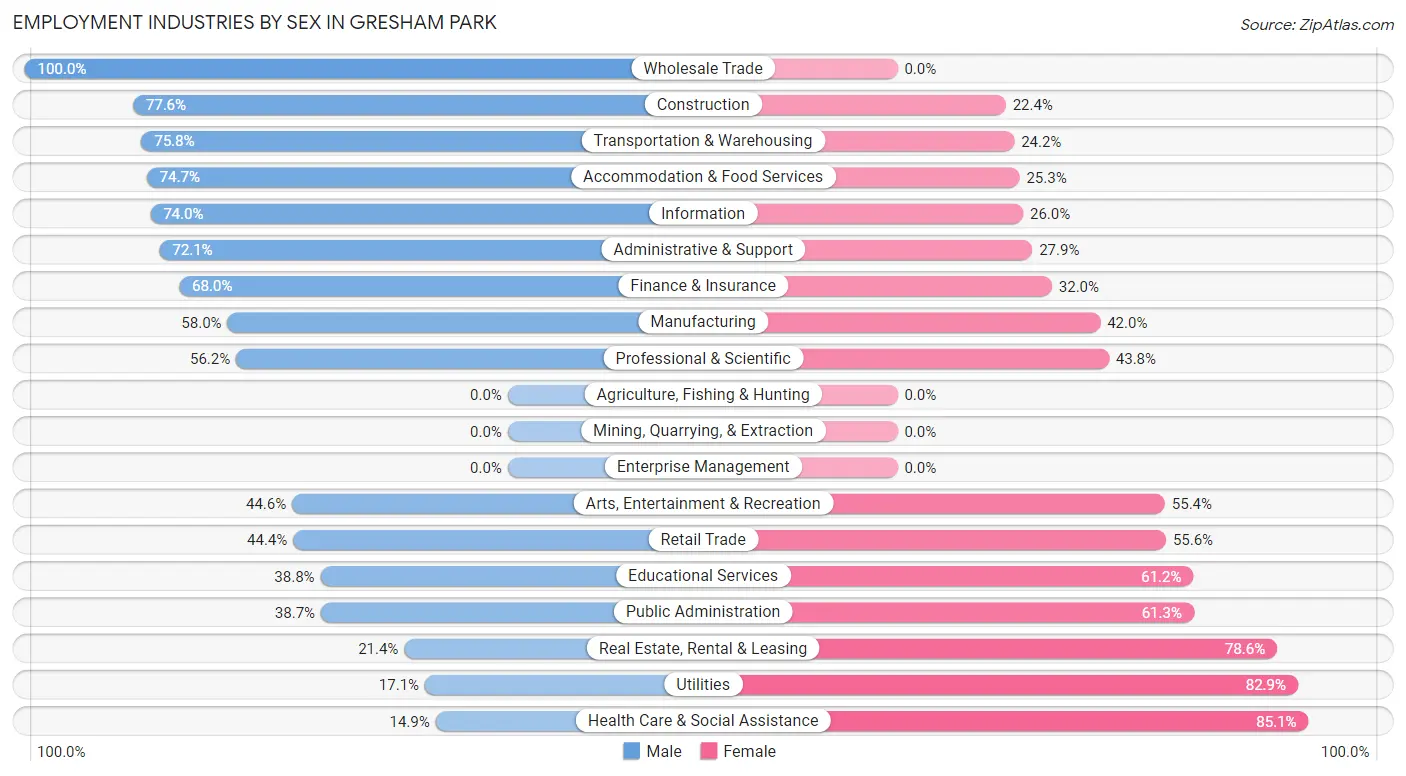
Employment Industries by Sex in Gresham Park
The Gresham Park industries that see more men than women are Wholesale Trade (100.0%), Construction (77.6%), and Transportation & Warehousing (75.8%), whereas the industries that tend to have a higher number of women are Health Care & Social Assistance (85.1%), Utilities (82.9%), and Real Estate, Rental & Leasing (78.6%).
| Industry | Male | Female |
| Agriculture, Fishing & Hunting | 0 (0.0%) | 0 (0.0%) |
| Mining, Quarrying, & Extraction | 0 (0.0%) | 0 (0.0%) |
| Construction | 90 (77.6%) | 26 (22.4%) |
| Manufacturing | 123 (58.0%) | 89 (42.0%) |
| Wholesale Trade | 54 (100.0%) | 0 (0.0%) |
| Retail Trade | 219 (44.4%) | 274 (55.6%) |
| Transportation & Warehousing | 386 (75.8%) | 123 (24.2%) |
| Utilities | 12 (17.1%) | 58 (82.9%) |
| Information | 148 (74.0%) | 52 (26.0%) |
| Finance & Insurance | 83 (68.0%) | 39 (32.0%) |
| Real Estate, Rental & Leasing | 9 (21.4%) | 33 (78.6%) |
| Professional & Scientific | 149 (56.2%) | 116 (43.8%) |
| Enterprise Management | 0 (0.0%) | 0 (0.0%) |
| Administrative & Support | 186 (72.1%) | 72 (27.9%) |
| Educational Services | 126 (38.8%) | 199 (61.2%) |
| Health Care & Social Assistance | 49 (14.9%) | 279 (85.1%) |
| Arts, Entertainment & Recreation | 25 (44.6%) | 31 (55.4%) |
| Accommodation & Food Services | 210 (74.7%) | 71 (25.3%) |
| Public Administration | 198 (38.7%) | 314 (61.3%) |
| Total | 2,156 (54.3%) | 1,816 (45.7%) |
Education in Gresham Park
School Enrollment in Gresham Park
The most common levels of schooling among the 1,253 students in Gresham Park are middle school (342 | 27.3%), college / undergraduate (273 | 21.8%), and graduate / professional (197 | 15.7%).
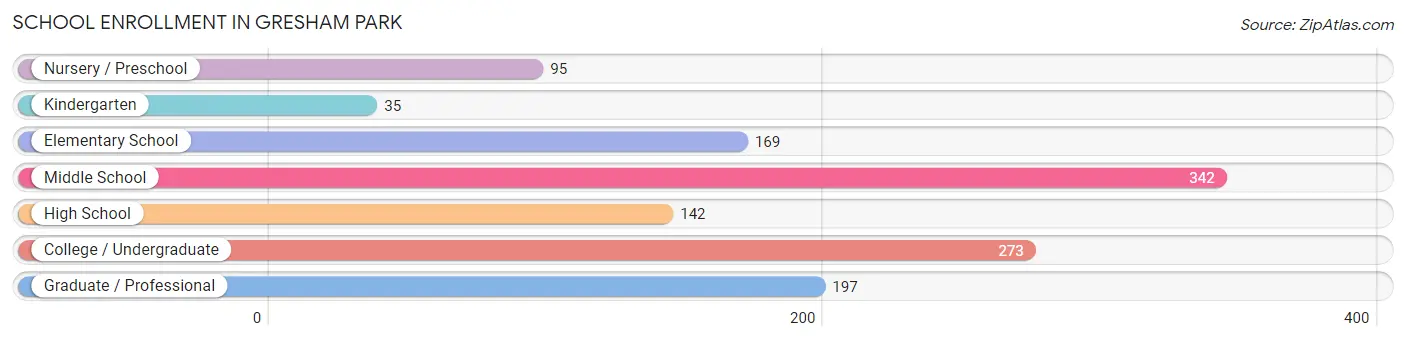
| School Level | # Students | % Students |
| Nursery / Preschool | 95 | 7.6% |
| Kindergarten | 35 | 2.8% |
| Elementary School | 169 | 13.5% |
| Middle School | 342 | 27.3% |
| High School | 142 | 11.3% |
| College / Undergraduate | 273 | 21.8% |
| Graduate / Professional | 197 | 15.7% |
| Total | 1,253 | 100.0% |
School Enrollment by Age by Funding Source in Gresham Park
Out of a total of 1,253 students who are enrolled in schools in Gresham Park, 297 (23.7%) attend a private institution, while the remaining 956 (76.3%) are enrolled in public schools. The age group of 3 to 4 year olds has the highest likelihood of being enrolled in private schools, with 61 (100.0% in the age bracket) enrolled. Conversely, the age group of 15 to 17 year olds has the lowest likelihood of being enrolled in a private school, with 65 (100.0% in the age bracket) attending a public institution.
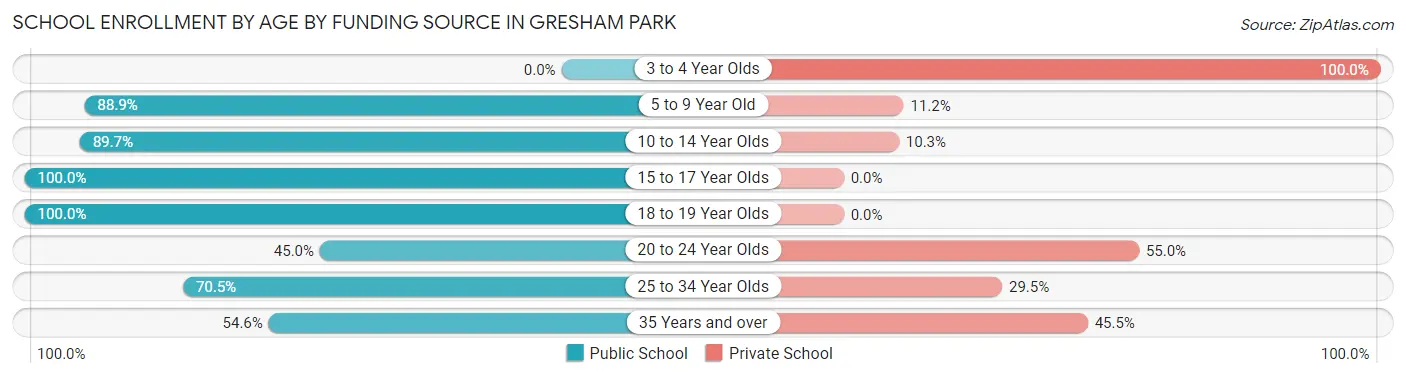
| Age Bracket | Public School | Private School |
| 3 to 4 Year Olds | 0 (0.0%) | 61 (100.0%) |
| 5 to 9 Year Old | 239 (88.8%) | 30 (11.2%) |
| 10 to 14 Year Olds | 323 (89.7%) | 37 (10.3%) |
| 15 to 17 Year Olds | 65 (100.0%) | 0 (0.0%) |
| 18 to 19 Year Olds | 30 (100.0%) | 0 (0.0%) |
| 20 to 24 Year Olds | 36 (45.0%) | 44 (55.0%) |
| 25 to 34 Year Olds | 227 (70.5%) | 95 (29.5%) |
| 35 Years and over | 36 (54.5%) | 30 (45.5%) |
| Total | 956 (76.3%) | 297 (23.7%) |
Educational Attainment by Field of Study in Gresham Park
Business (366 | 17.3%), science & technology (218 | 10.3%), communications (191 | 9.0%), visual & performing arts (164 | 7.7%), and multidisciplinary studies (156 | 7.4%) are the most common fields of study among 2,116 individuals in Gresham Park who have obtained a bachelor's degree or higher.
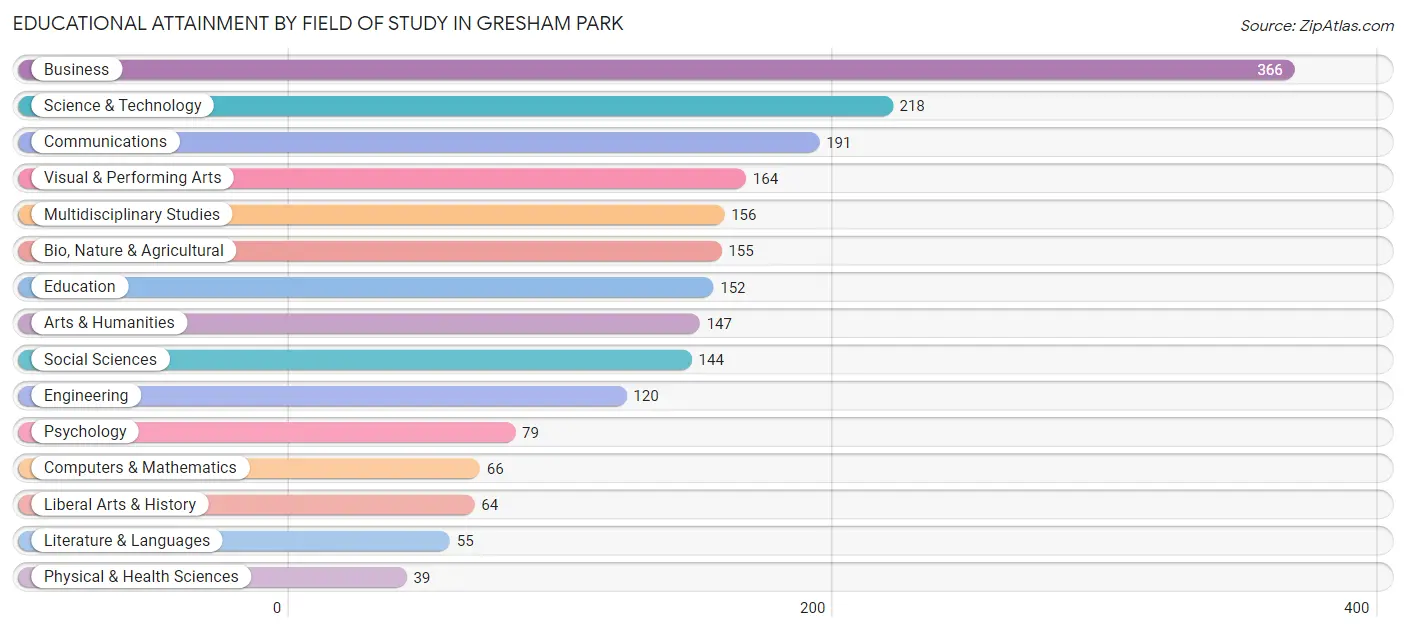
| Field of Study | # Graduates | % Graduates |
| Computers & Mathematics | 66 | 3.1% |
| Bio, Nature & Agricultural | 155 | 7.3% |
| Physical & Health Sciences | 39 | 1.8% |
| Psychology | 79 | 3.7% |
| Social Sciences | 144 | 6.8% |
| Engineering | 120 | 5.7% |
| Multidisciplinary Studies | 156 | 7.4% |
| Science & Technology | 218 | 10.3% |
| Business | 366 | 17.3% |
| Education | 152 | 7.2% |
| Literature & Languages | 55 | 2.6% |
| Liberal Arts & History | 64 | 3.0% |
| Visual & Performing Arts | 164 | 7.7% |
| Communications | 191 | 9.0% |
| Arts & Humanities | 147 | 7.0% |
| Total | 2,116 | 100.0% |
Transportation & Commute in Gresham Park
Vehicle Availability by Sex in Gresham Park
The most prevalent vehicle ownership categories in Gresham Park are males with 2 vehicles (896, accounting for 43.6%) and females with 2 vehicles (834, making up 51.0%).
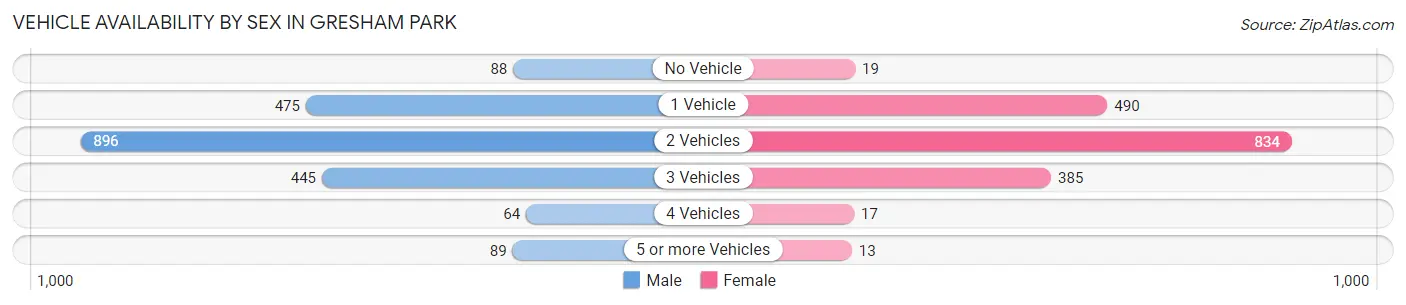
| Vehicles Available | Male | Female |
| No Vehicle | 88 (4.3%) | 19 (1.1%) |
| 1 Vehicle | 475 (23.1%) | 490 (27.9%) |
| 2 Vehicles | 896 (43.6%) | 834 (47.4%) |
| 3 Vehicles | 445 (21.6%) | 385 (21.9%) |
| 4 Vehicles | 64 (3.1%) | 17 (1.0%) |
| 5 or more Vehicles | 89 (4.3%) | 13 (0.7%) |
| Total | 2,057 (100.0%) | 1,758 (100.0%) |
Commute Time in Gresham Park
The most frequently occuring commute durations in Gresham Park are 30 to 34 minutes (614 commuters, 19.9%), 20 to 24 minutes (534 commuters, 17.3%), and 45 to 59 minutes (425 commuters, 13.8%).
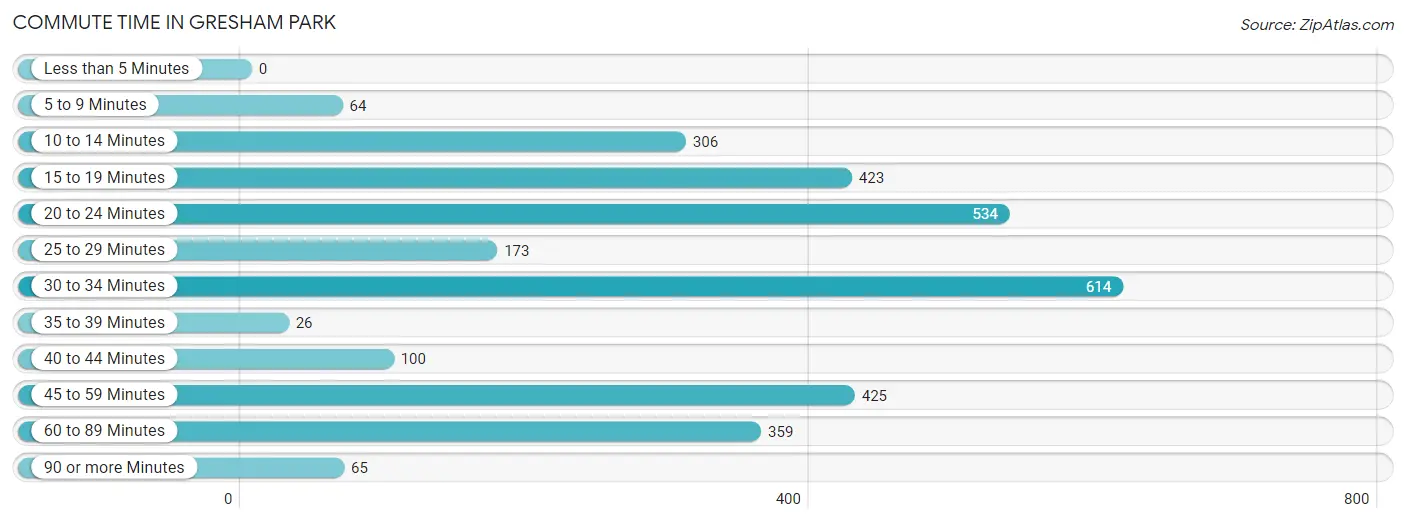
| Commute Time | # Commuters | % Commuters |
| Less than 5 Minutes | 0 | 0.0% |
| 5 to 9 Minutes | 64 | 2.1% |
| 10 to 14 Minutes | 306 | 9.9% |
| 15 to 19 Minutes | 423 | 13.7% |
| 20 to 24 Minutes | 534 | 17.3% |
| 25 to 29 Minutes | 173 | 5.6% |
| 30 to 34 Minutes | 614 | 19.9% |
| 35 to 39 Minutes | 26 | 0.8% |
| 40 to 44 Minutes | 100 | 3.2% |
| 45 to 59 Minutes | 425 | 13.8% |
| 60 to 89 Minutes | 359 | 11.6% |
| 90 or more Minutes | 65 | 2.1% |
Commute Time by Sex in Gresham Park
The most common commute times in Gresham Park are 30 to 34 minutes (426 commuters, 25.5%) for males and 20 to 24 minutes (265 commuters, 18.7%) for females.
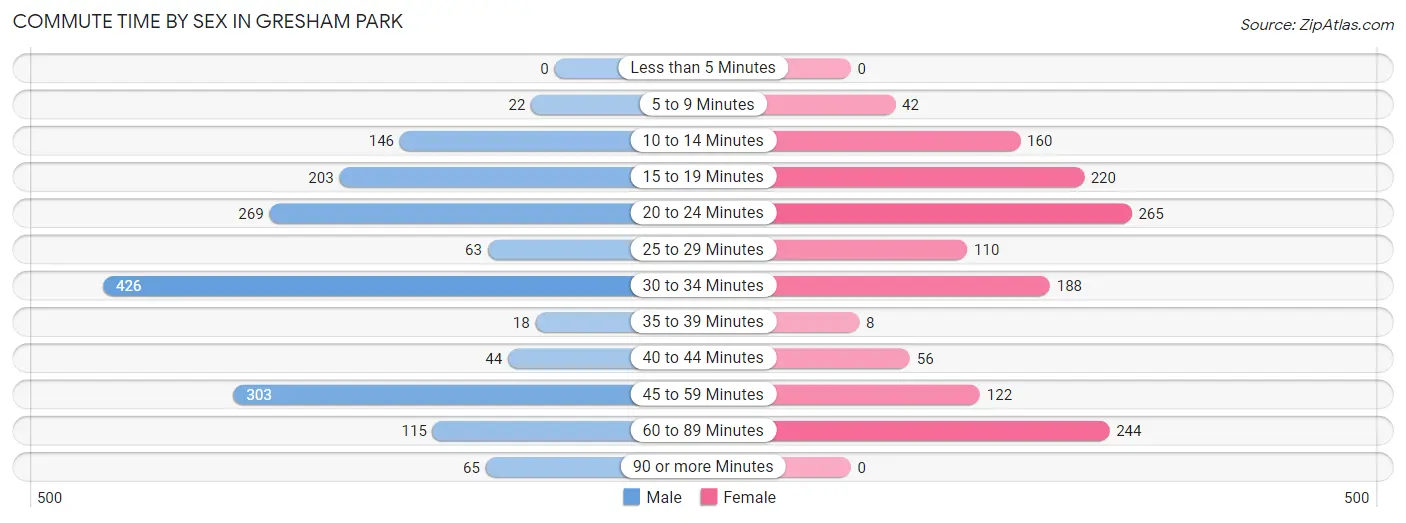
| Commute Time | Male | Female |
| Less than 5 Minutes | 0 (0.0%) | 0 (0.0%) |
| 5 to 9 Minutes | 22 (1.3%) | 42 (3.0%) |
| 10 to 14 Minutes | 146 (8.7%) | 160 (11.3%) |
| 15 to 19 Minutes | 203 (12.1%) | 220 (15.5%) |
| 20 to 24 Minutes | 269 (16.1%) | 265 (18.7%) |
| 25 to 29 Minutes | 63 (3.8%) | 110 (7.8%) |
| 30 to 34 Minutes | 426 (25.5%) | 188 (13.3%) |
| 35 to 39 Minutes | 18 (1.1%) | 8 (0.6%) |
| 40 to 44 Minutes | 44 (2.6%) | 56 (4.0%) |
| 45 to 59 Minutes | 303 (18.1%) | 122 (8.6%) |
| 60 to 89 Minutes | 115 (6.9%) | 244 (17.2%) |
| 90 or more Minutes | 65 (3.9%) | 0 (0.0%) |
Time of Departure to Work by Sex in Gresham Park
The most frequent times of departure to work in Gresham Park are 6:00 AM to 6:29 AM (229, 13.7%) for males and 12:00 PM to 3:59 PM (285, 20.1%) for females.
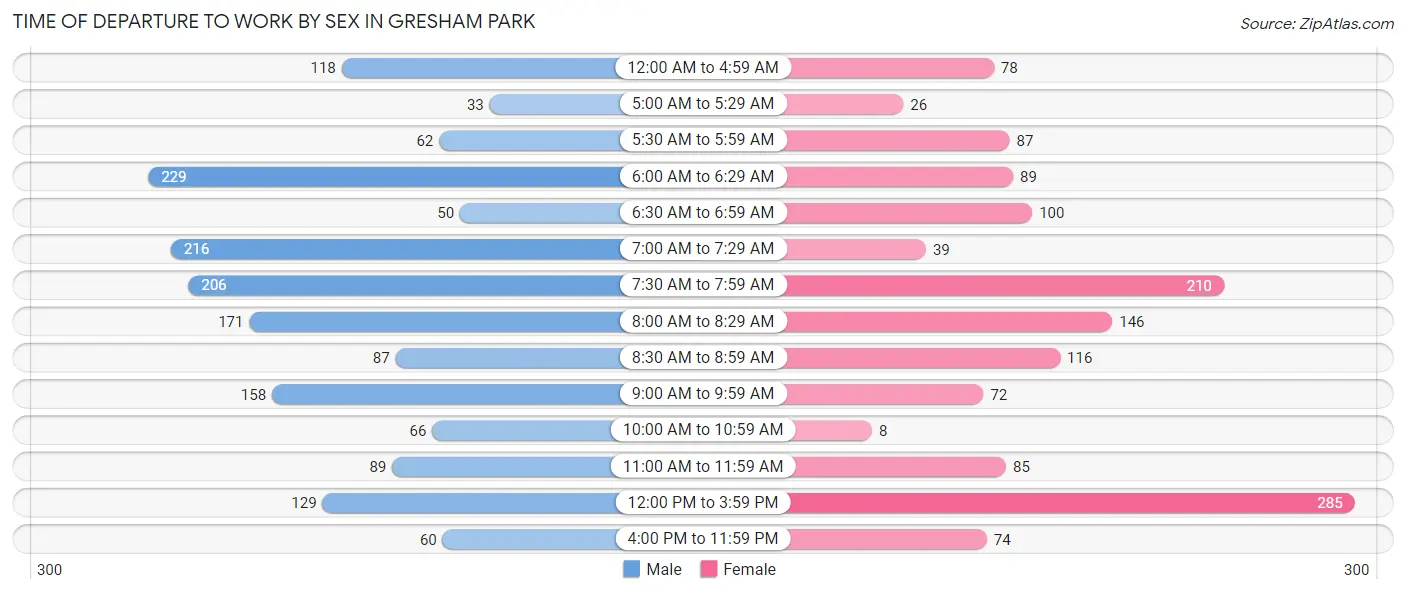
| Time of Departure | Male | Female |
| 12:00 AM to 4:59 AM | 118 (7.0%) | 78 (5.5%) |
| 5:00 AM to 5:29 AM | 33 (2.0%) | 26 (1.8%) |
| 5:30 AM to 5:59 AM | 62 (3.7%) | 87 (6.1%) |
| 6:00 AM to 6:29 AM | 229 (13.7%) | 89 (6.3%) |
| 6:30 AM to 6:59 AM | 50 (3.0%) | 100 (7.1%) |
| 7:00 AM to 7:29 AM | 216 (12.9%) | 39 (2.8%) |
| 7:30 AM to 7:59 AM | 206 (12.3%) | 210 (14.8%) |
| 8:00 AM to 8:29 AM | 171 (10.2%) | 146 (10.3%) |
| 8:30 AM to 8:59 AM | 87 (5.2%) | 116 (8.2%) |
| 9:00 AM to 9:59 AM | 158 (9.4%) | 72 (5.1%) |
| 10:00 AM to 10:59 AM | 66 (3.9%) | 8 (0.6%) |
| 11:00 AM to 11:59 AM | 89 (5.3%) | 85 (6.0%) |
| 12:00 PM to 3:59 PM | 129 (7.7%) | 285 (20.1%) |
| 4:00 PM to 11:59 PM | 60 (3.6%) | 74 (5.2%) |
| Total | 1,674 (100.0%) | 1,415 (100.0%) |
Housing Occupancy in Gresham Park
Occupancy by Ownership in Gresham Park
Of the total 3,106 dwellings in Gresham Park, owner-occupied units account for 2,018 (65.0%), while renter-occupied units make up 1,088 (35.0%).
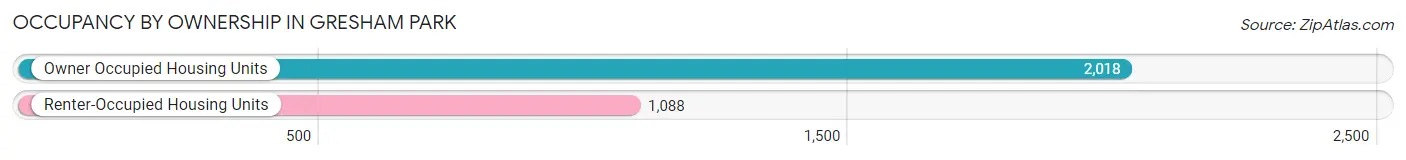
| Occupancy | # Housing Units | % Housing Units |
| Owner Occupied Housing Units | 2,018 | 65.0% |
| Renter-Occupied Housing Units | 1,088 | 35.0% |
| Total Occupied Housing Units | 3,106 | 100.0% |
Occupancy by Household Size in Gresham Park
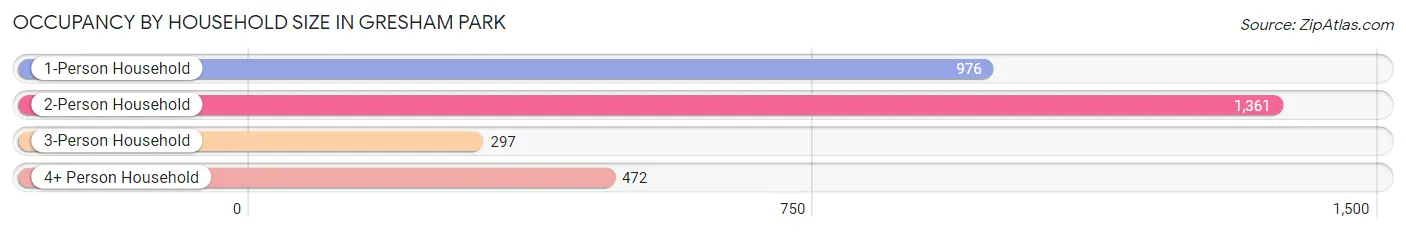
| Household Size | # Housing Units | % Housing Units |
| 1-Person Household | 976 | 31.4% |
| 2-Person Household | 1,361 | 43.8% |
| 3-Person Household | 297 | 9.6% |
| 4+ Person Household | 472 | 15.2% |
| Total Housing Units | 3,106 | 100.0% |
Occupancy by Ownership by Household Size in Gresham Park
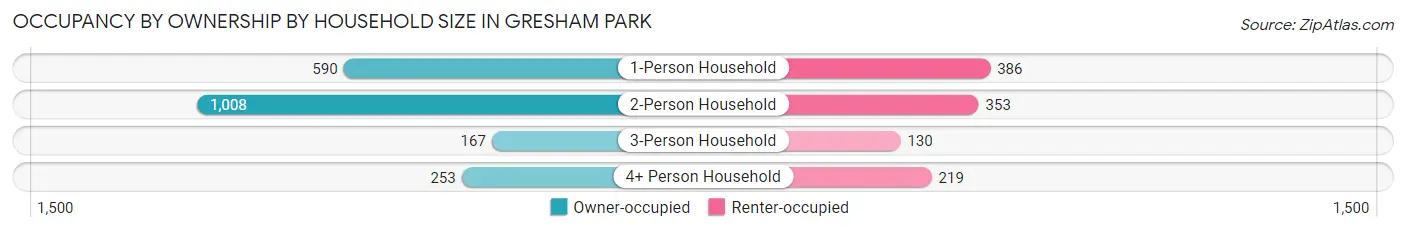
| Household Size | Owner-occupied | Renter-occupied |
| 1-Person Household | 590 (60.5%) | 386 (39.6%) |
| 2-Person Household | 1,008 (74.1%) | 353 (25.9%) |
| 3-Person Household | 167 (56.2%) | 130 (43.8%) |
| 4+ Person Household | 253 (53.6%) | 219 (46.4%) |
| Total Housing Units | 2,018 (65.0%) | 1,088 (35.0%) |
Occupancy by Educational Attainment in Gresham Park
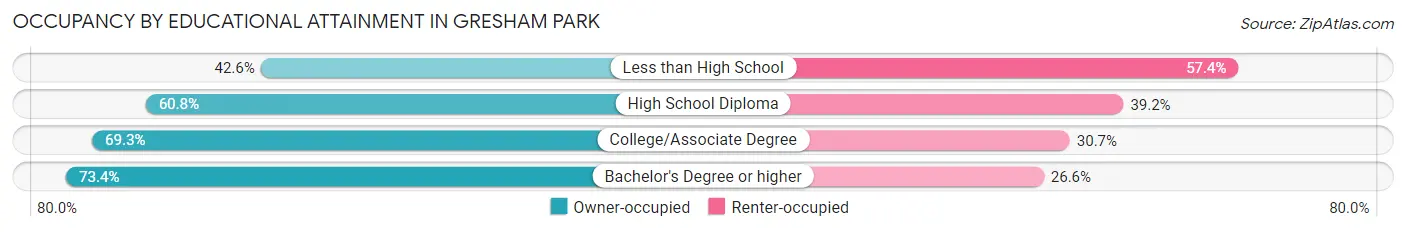
| Household Size | Owner-occupied | Renter-occupied |
| Less than High School | 201 (42.6%) | 271 (57.4%) |
| High School Diploma | 389 (60.8%) | 251 (39.2%) |
| College/Associate Degree | 600 (69.3%) | 266 (30.7%) |
| Bachelor's Degree or higher | 828 (73.4%) | 300 (26.6%) |
Occupancy by Age of Householder in Gresham Park
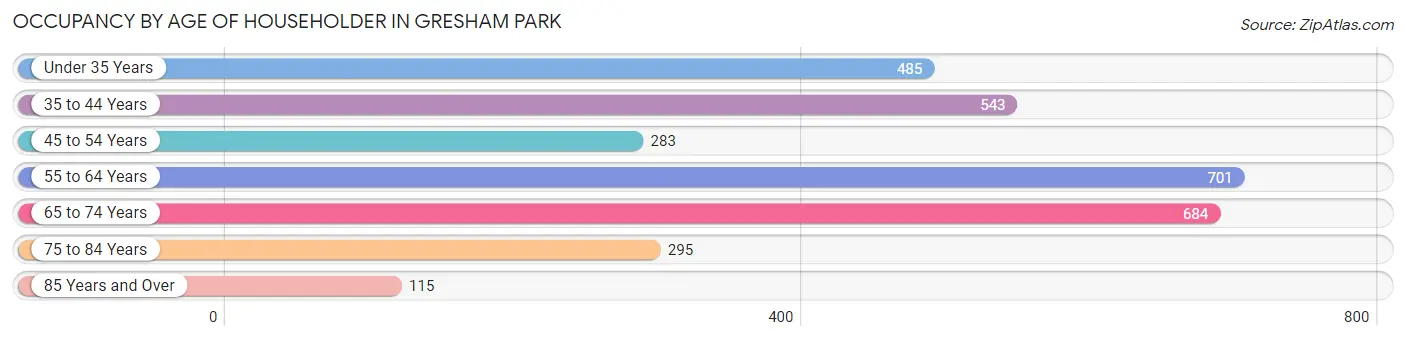
| Age Bracket | # Households | % Households |
| Under 35 Years | 485 | 15.6% |
| 35 to 44 Years | 543 | 17.5% |
| 45 to 54 Years | 283 | 9.1% |
| 55 to 64 Years | 701 | 22.6% |
| 65 to 74 Years | 684 | 22.0% |
| 75 to 84 Years | 295 | 9.5% |
| 85 Years and Over | 115 | 3.7% |
| Total | 3,106 | 100.0% |
Housing Finances in Gresham Park
Median Income by Occupancy in Gresham Park
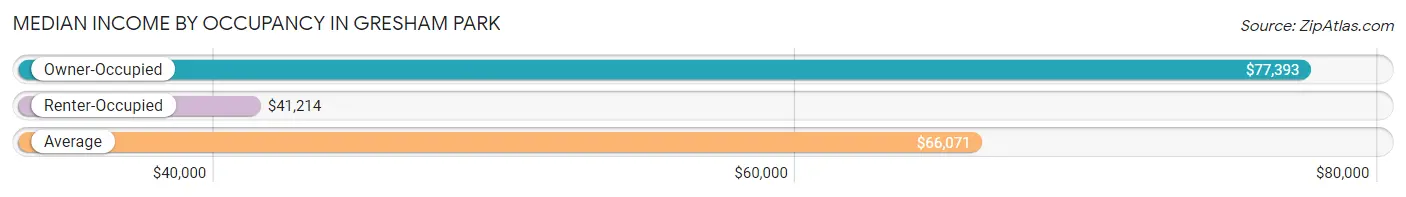
| Occupancy Type | # Households | Median Income |
| Owner-Occupied | 2,018 (65.0%) | $77,393 |
| Renter-Occupied | 1,088 (35.0%) | $41,214 |
| Average | 3,106 (100.0%) | $66,071 |
Occupancy by Householder Income Bracket in Gresham Park
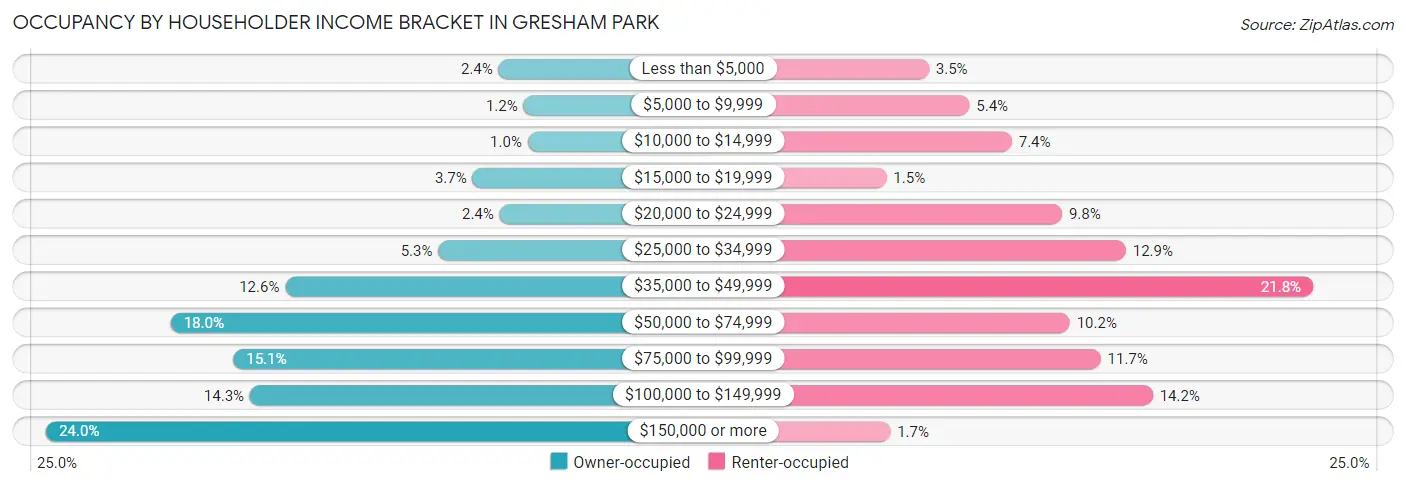
| Income Bracket | Owner-occupied | Renter-occupied |
| Less than $5,000 | 49 (2.4%) | 38 (3.5%) |
| $5,000 to $9,999 | 25 (1.2%) | 59 (5.4%) |
| $10,000 to $14,999 | 21 (1.0%) | 81 (7.4%) |
| $15,000 to $19,999 | 74 (3.7%) | 16 (1.5%) |
| $20,000 to $24,999 | 48 (2.4%) | 107 (9.8%) |
| $25,000 to $34,999 | 107 (5.3%) | 140 (12.9%) |
| $35,000 to $49,999 | 254 (12.6%) | 237 (21.8%) |
| $50,000 to $74,999 | 364 (18.0%) | 111 (10.2%) |
| $75,000 to $99,999 | 304 (15.1%) | 127 (11.7%) |
| $100,000 to $149,999 | 288 (14.3%) | 154 (14.1%) |
| $150,000 or more | 484 (24.0%) | 18 (1.7%) |
| Total | 2,018 (100.0%) | 1,088 (100.0%) |
Monthly Housing Cost Tiers in Gresham Park
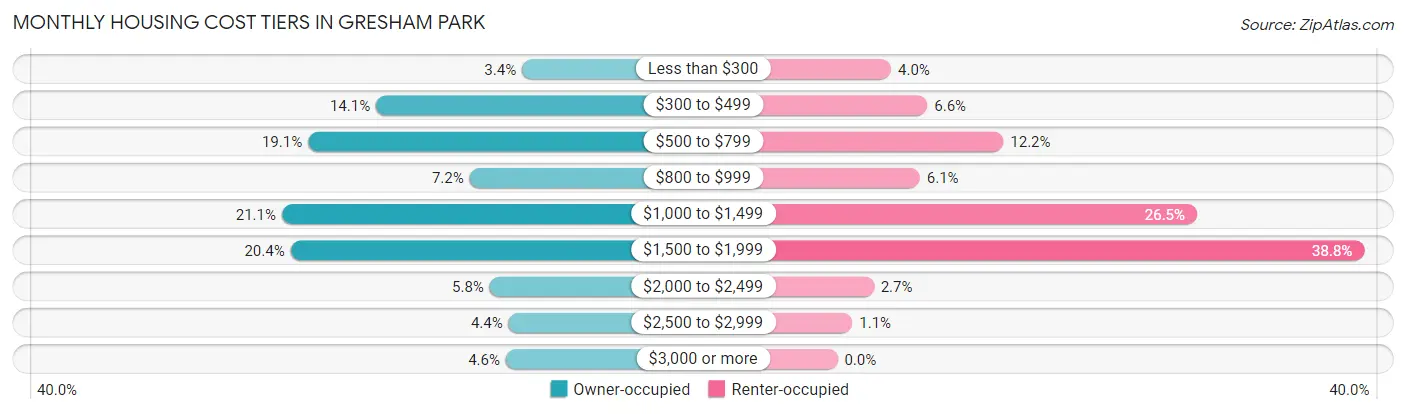
| Monthly Cost | Owner-occupied | Renter-occupied |
| Less than $300 | 68 (3.4%) | 43 (4.0%) |
| $300 to $499 | 285 (14.1%) | 72 (6.6%) |
| $500 to $799 | 386 (19.1%) | 133 (12.2%) |
| $800 to $999 | 146 (7.2%) | 66 (6.1%) |
| $1,000 to $1,499 | 425 (21.1%) | 288 (26.5%) |
| $1,500 to $1,999 | 412 (20.4%) | 422 (38.8%) |
| $2,000 to $2,499 | 116 (5.8%) | 29 (2.7%) |
| $2,500 to $2,999 | 88 (4.4%) | 12 (1.1%) |
| $3,000 or more | 92 (4.6%) | 0 (0.0%) |
| Total | 2,018 (100.0%) | 1,088 (100.0%) |
Physical Housing Characteristics in Gresham Park
Housing Structures in Gresham Park
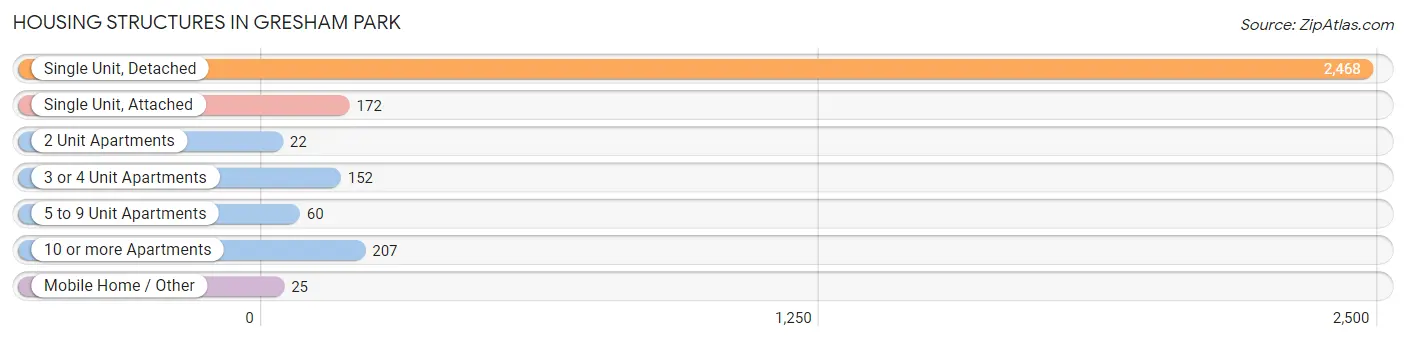
| Structure Type | # Housing Units | % Housing Units |
| Single Unit, Detached | 2,468 | 79.5% |
| Single Unit, Attached | 172 | 5.5% |
| 2 Unit Apartments | 22 | 0.7% |
| 3 or 4 Unit Apartments | 152 | 4.9% |
| 5 to 9 Unit Apartments | 60 | 1.9% |
| 10 or more Apartments | 207 | 6.7% |
| Mobile Home / Other | 25 | 0.8% |
| Total | 3,106 | 100.0% |
Housing Structures by Occupancy in Gresham Park
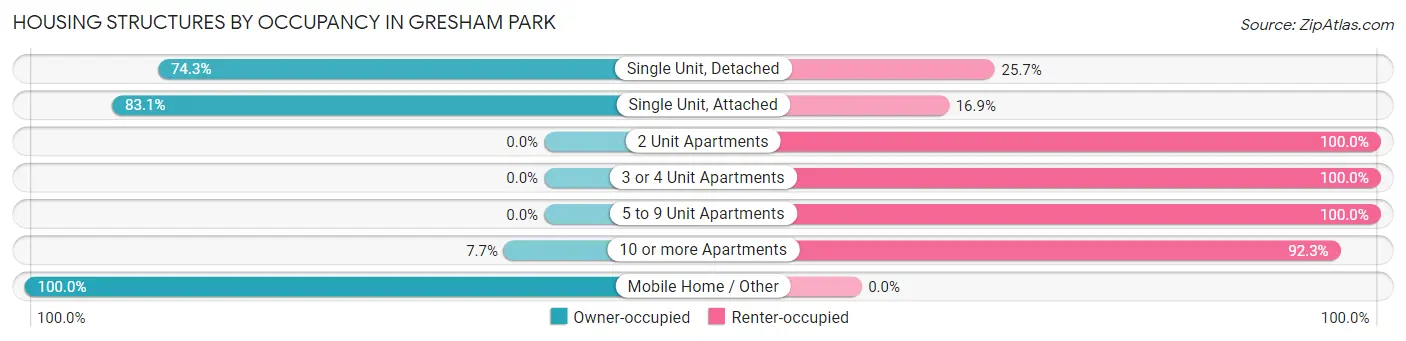
| Structure Type | Owner-occupied | Renter-occupied |
| Single Unit, Detached | 1,834 (74.3%) | 634 (25.7%) |
| Single Unit, Attached | 143 (83.1%) | 29 (16.9%) |
| 2 Unit Apartments | 0 (0.0%) | 22 (100.0%) |
| 3 or 4 Unit Apartments | 0 (0.0%) | 152 (100.0%) |
| 5 to 9 Unit Apartments | 0 (0.0%) | 60 (100.0%) |
| 10 or more Apartments | 16 (7.7%) | 191 (92.3%) |
| Mobile Home / Other | 25 (100.0%) | 0 (0.0%) |
| Total | 2,018 (65.0%) | 1,088 (35.0%) |
Housing Structures by Number of Rooms in Gresham Park
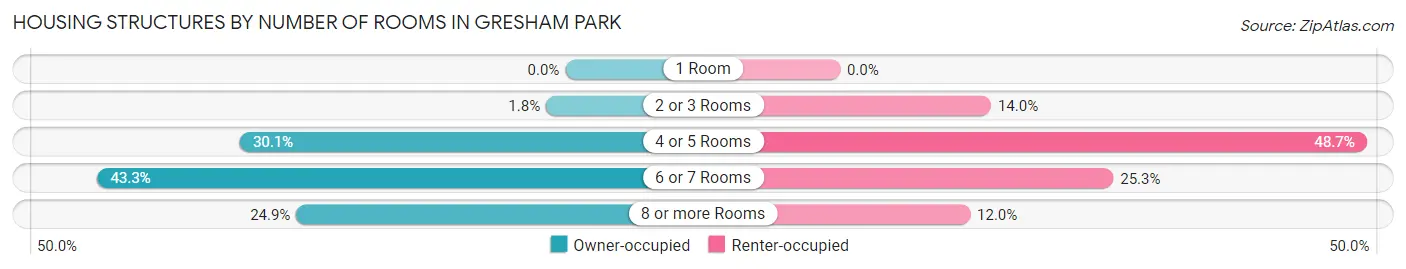
| Number of Rooms | Owner-occupied | Renter-occupied |
| 1 Room | 0 (0.0%) | 0 (0.0%) |
| 2 or 3 Rooms | 36 (1.8%) | 152 (14.0%) |
| 4 or 5 Rooms | 607 (30.1%) | 530 (48.7%) |
| 6 or 7 Rooms | 873 (43.3%) | 275 (25.3%) |
| 8 or more Rooms | 502 (24.9%) | 131 (12.0%) |
| Total | 2,018 (100.0%) | 1,088 (100.0%) |
Housing Structure by Heating Type in Gresham Park
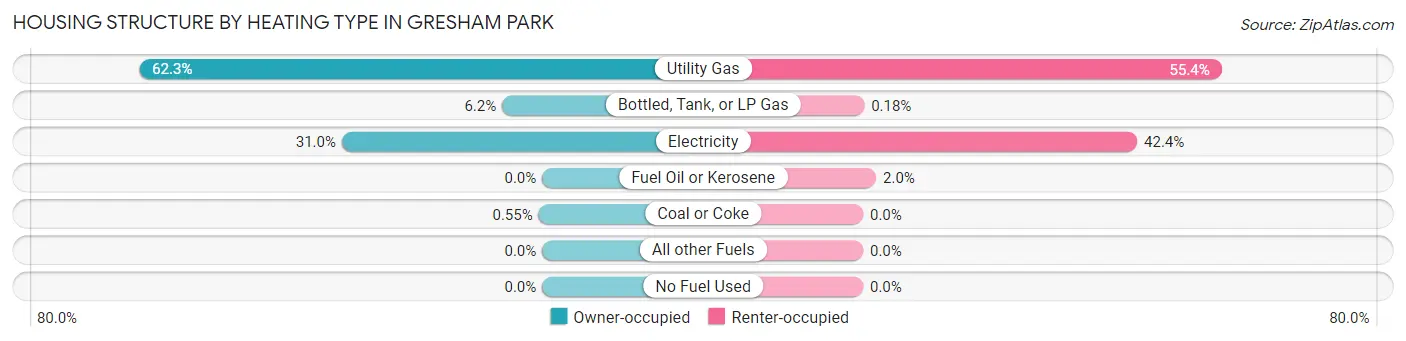
| Heating Type | Owner-occupied | Renter-occupied |
| Utility Gas | 1,257 (62.3%) | 603 (55.4%) |
| Bottled, Tank, or LP Gas | 125 (6.2%) | 2 (0.2%) |
| Electricity | 625 (31.0%) | 461 (42.4%) |
| Fuel Oil or Kerosene | 0 (0.0%) | 22 (2.0%) |
| Coal or Coke | 11 (0.5%) | 0 (0.0%) |
| All other Fuels | 0 (0.0%) | 0 (0.0%) |
| No Fuel Used | 0 (0.0%) | 0 (0.0%) |
| Total | 2,018 (100.0%) | 1,088 (100.0%) |
Household Vehicle Usage in Gresham Park
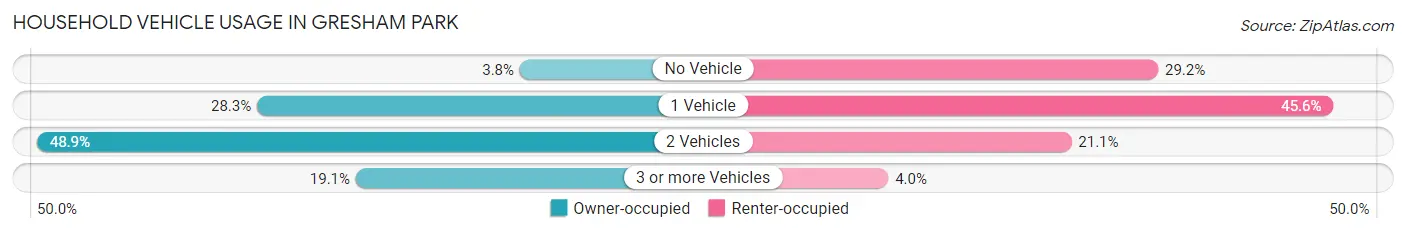
| Vehicles per Household | Owner-occupied | Renter-occupied |
| No Vehicle | 76 (3.8%) | 318 (29.2%) |
| 1 Vehicle | 571 (28.3%) | 496 (45.6%) |
| 2 Vehicles | 986 (48.9%) | 230 (21.1%) |
| 3 or more Vehicles | 385 (19.1%) | 44 (4.0%) |
| Total | 2,018 (100.0%) | 1,088 (100.0%) |
Real Estate & Mortgages in Gresham Park
Real Estate and Mortgage Overview in Gresham Park
| Characteristic | Without Mortgage | With Mortgage |
| Housing Units | 763 | 1,255 |
| Median Property Value | $208,500 | $275,500 |
| Median Household Income | $67,899 | $421 |
| Monthly Housing Costs | $542 | $92 |
| Real Estate Taxes | $1,412 | $10 |
Property Value by Mortgage Status in Gresham Park
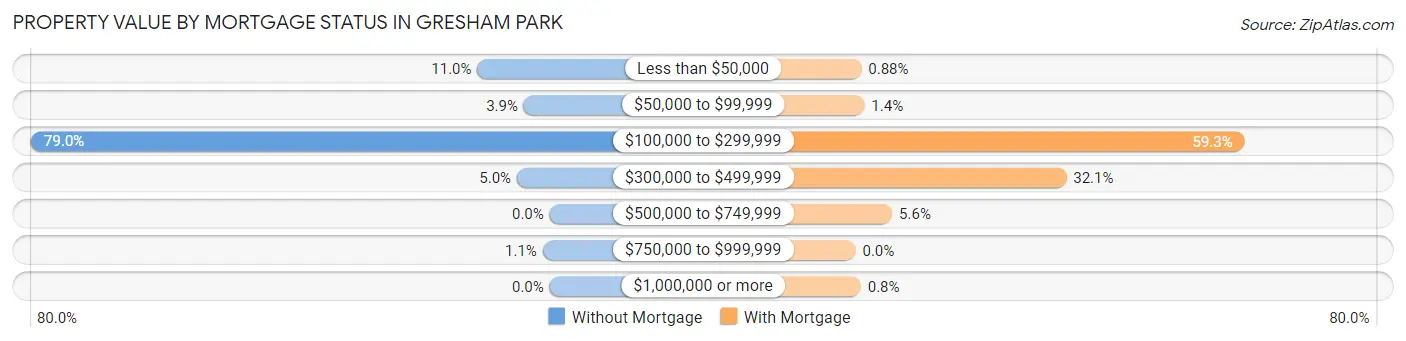
| Property Value | Without Mortgage | With Mortgage |
| Less than $50,000 | 84 (11.0%) | 11 (0.9%) |
| $50,000 to $99,999 | 30 (3.9%) | 17 (1.3%) |
| $100,000 to $299,999 | 603 (79.0%) | 744 (59.3%) |
| $300,000 to $499,999 | 38 (5.0%) | 403 (32.1%) |
| $500,000 to $749,999 | 0 (0.0%) | 70 (5.6%) |
| $750,000 to $999,999 | 8 (1.1%) | 0 (0.0%) |
| $1,000,000 or more | 0 (0.0%) | 10 (0.8%) |
| Total | 763 (100.0%) | 1,255 (100.0%) |
Household Income by Mortgage Status in Gresham Park
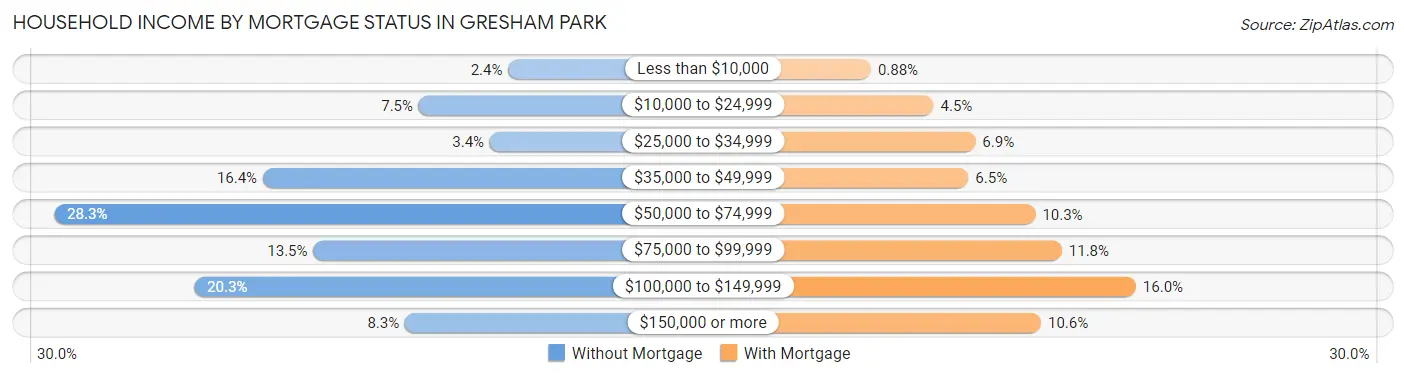
| Household Income | Without Mortgage | With Mortgage |
| Less than $10,000 | 18 (2.4%) | 11 (0.9%) |
| $10,000 to $24,999 | 57 (7.5%) | 56 (4.5%) |
| $25,000 to $34,999 | 26 (3.4%) | 86 (6.9%) |
| $35,000 to $49,999 | 125 (16.4%) | 81 (6.5%) |
| $50,000 to $74,999 | 216 (28.3%) | 129 (10.3%) |
| $75,000 to $99,999 | 103 (13.5%) | 148 (11.8%) |
| $100,000 to $149,999 | 155 (20.3%) | 201 (16.0%) |
| $150,000 or more | 63 (8.3%) | 133 (10.6%) |
| Total | 763 (100.0%) | 1,255 (100.0%) |
Property Value to Household Income Ratio in Gresham Park
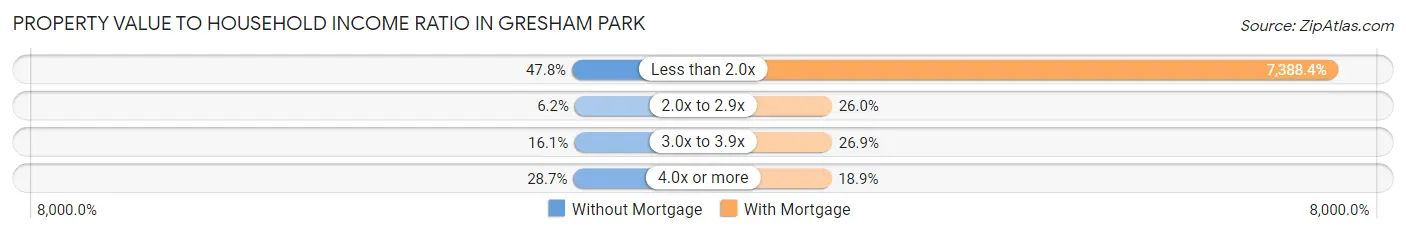
| Value-to-Income Ratio | Without Mortgage | With Mortgage |
| Less than 2.0x | 365 (47.8%) | 92,724 (7,388.4%) |
| 2.0x to 2.9x | 47 (6.2%) | 326 (26.0%) |
| 3.0x to 3.9x | 123 (16.1%) | 337 (26.9%) |
| 4.0x or more | 219 (28.7%) | 237 (18.9%) |
| Total | 763 (100.0%) | 1,255 (100.0%) |
Real Estate Taxes by Mortgage Status in Gresham Park
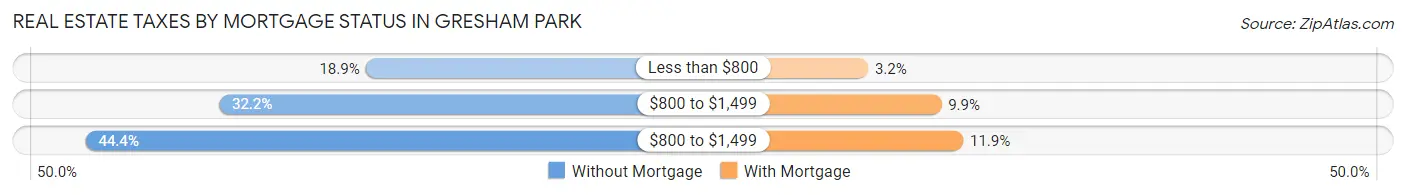
| Property Taxes | Without Mortgage | With Mortgage |
| Less than $800 | 144 (18.9%) | 40 (3.2%) |
| $800 to $1,499 | 246 (32.2%) | 124 (9.9%) |
| $800 to $1,499 | 339 (44.4%) | 149 (11.9%) |
| Total | 763 (100.0%) | 1,255 (100.0%) |
Health & Disability in Gresham Park
Health Insurance Coverage by Age in Gresham Park
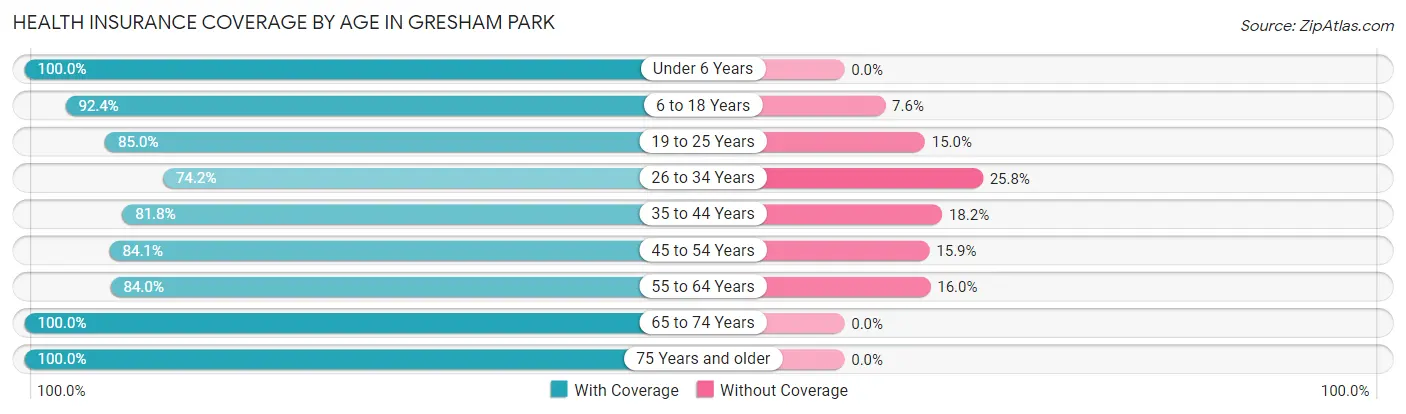
| Age Bracket | With Coverage | Without Coverage |
| Under 6 Years | 496 (100.0%) | 0 (0.0%) |
| 6 to 18 Years | 703 (92.4%) | 58 (7.6%) |
| 19 to 25 Years | 538 (85.0%) | 95 (15.0%) |
| 26 to 34 Years | 917 (74.2%) | 319 (25.8%) |
| 35 to 44 Years | 1,050 (81.8%) | 234 (18.2%) |
| 45 to 54 Years | 541 (84.1%) | 102 (15.9%) |
| 55 to 64 Years | 922 (84.0%) | 176 (16.0%) |
| 65 to 74 Years | 1,004 (100.0%) | 0 (0.0%) |
| 75 Years and older | 661 (100.0%) | 0 (0.0%) |
| Total | 6,832 (87.4%) | 984 (12.6%) |
Health Insurance Coverage by Citizenship Status in Gresham Park
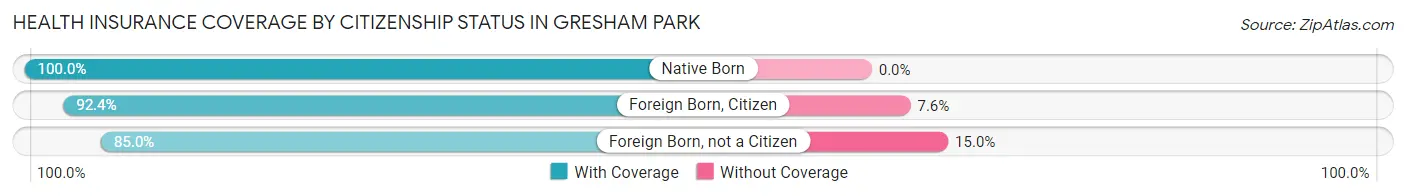
| Citizenship Status | With Coverage | Without Coverage |
| Native Born | 496 (100.0%) | 0 (0.0%) |
| Foreign Born, Citizen | 703 (92.4%) | 58 (7.6%) |
| Foreign Born, not a Citizen | 538 (85.0%) | 95 (15.0%) |
Health Insurance Coverage by Household Income in Gresham Park
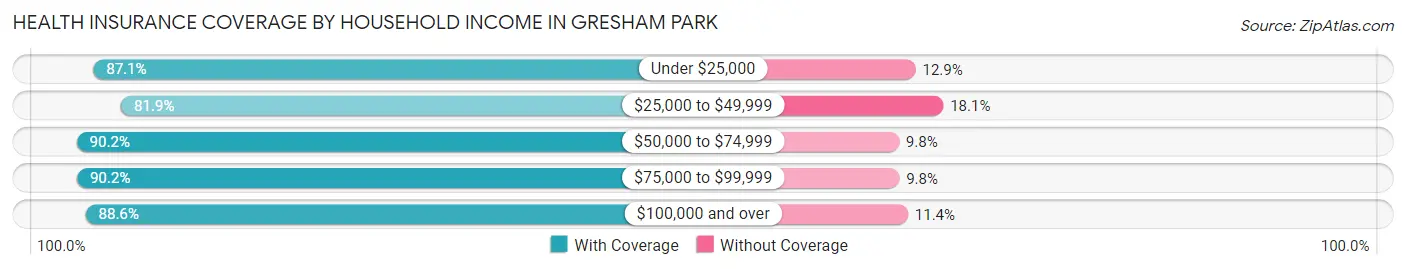
| Household Income | With Coverage | Without Coverage |
| Under $25,000 | 832 (87.1%) | 123 (12.9%) |
| $25,000 to $49,999 | 1,428 (81.9%) | 315 (18.1%) |
| $50,000 to $74,999 | 989 (90.2%) | 107 (9.8%) |
| $75,000 to $99,999 | 1,184 (90.2%) | 129 (9.8%) |
| $100,000 and over | 2,392 (88.6%) | 309 (11.4%) |
Public vs Private Health Insurance Coverage by Age in Gresham Park
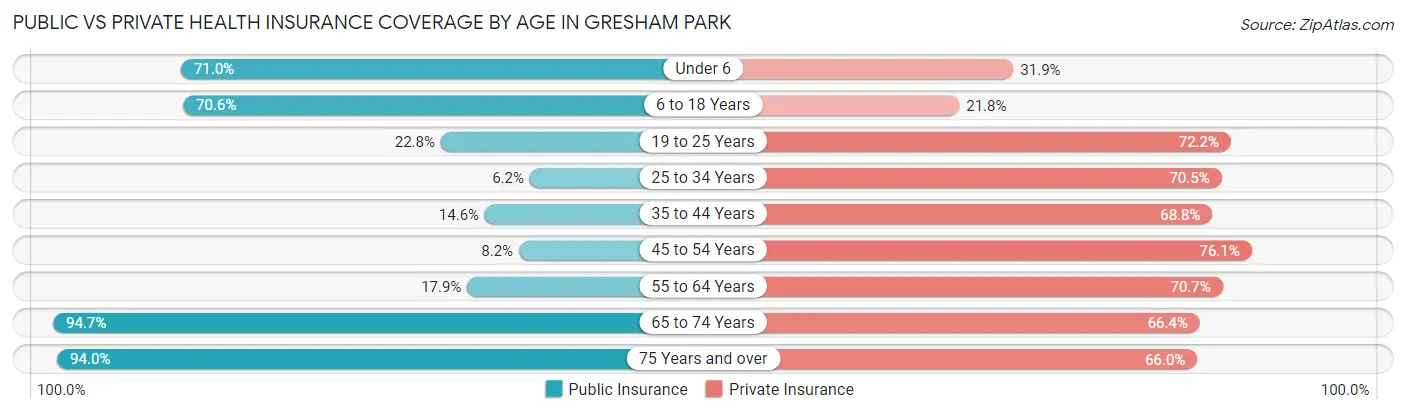
| Age Bracket | Public Insurance | Private Insurance |
| Under 6 | 352 (71.0%) | 158 (31.9%) |
| 6 to 18 Years | 537 (70.6%) | 166 (21.8%) |
| 19 to 25 Years | 144 (22.8%) | 457 (72.2%) |
| 25 to 34 Years | 77 (6.2%) | 871 (70.5%) |
| 35 to 44 Years | 187 (14.6%) | 883 (68.8%) |
| 45 to 54 Years | 53 (8.2%) | 489 (76.0%) |
| 55 to 64 Years | 196 (17.8%) | 776 (70.7%) |
| 65 to 74 Years | 951 (94.7%) | 667 (66.4%) |
| 75 Years and over | 621 (94.0%) | 436 (66.0%) |
| Total | 3,118 (39.9%) | 4,903 (62.7%) |
Disability Status by Sex by Age in Gresham Park
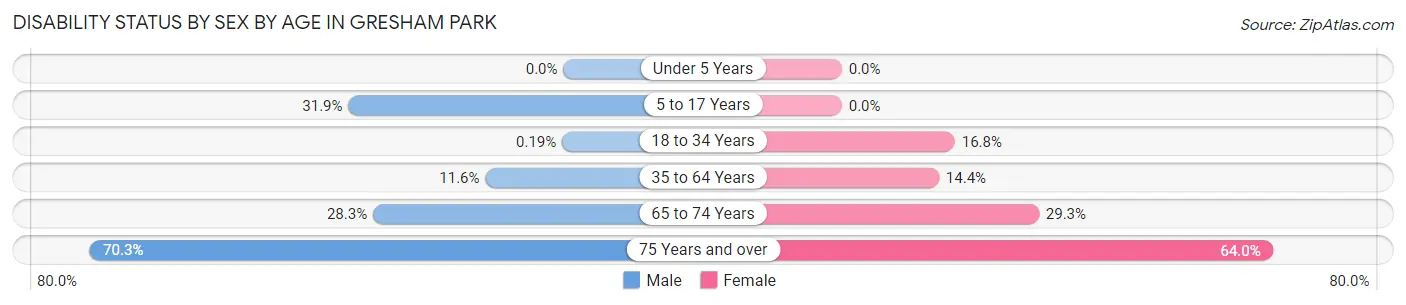
| Age Bracket | Male | Female |
| Under 5 Years | 0 (0.0%) | 0 (0.0%) |
| 5 to 17 Years | 173 (31.9%) | 0 (0.0%) |
| 18 to 34 Years | 2 (0.2%) | 142 (16.8%) |
| 35 to 64 Years | 180 (11.6%) | 212 (14.4%) |
| 65 to 74 Years | 108 (28.3%) | 182 (29.3%) |
| 75 Years and over | 326 (70.3%) | 126 (64.0%) |
Disability Class by Sex by Age in Gresham Park
Disability Class: Hearing Difficulty
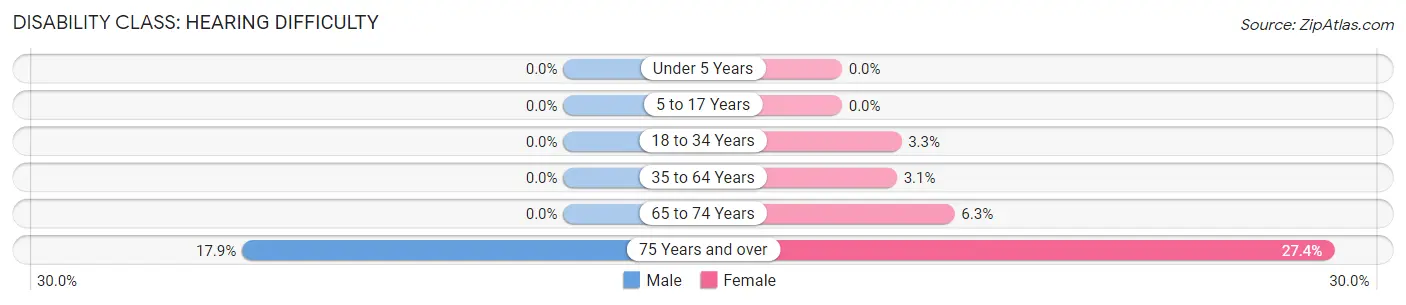
| Age Bracket | Male | Female |
| Under 5 Years | 0 (0.0%) | 0 (0.0%) |
| 5 to 17 Years | 0 (0.0%) | 0 (0.0%) |
| 18 to 34 Years | 0 (0.0%) | 28 (3.3%) |
| 35 to 64 Years | 0 (0.0%) | 45 (3.1%) |
| 65 to 74 Years | 0 (0.0%) | 39 (6.3%) |
| 75 Years and over | 83 (17.9%) | 54 (27.4%) |
Disability Class: Vision Difficulty
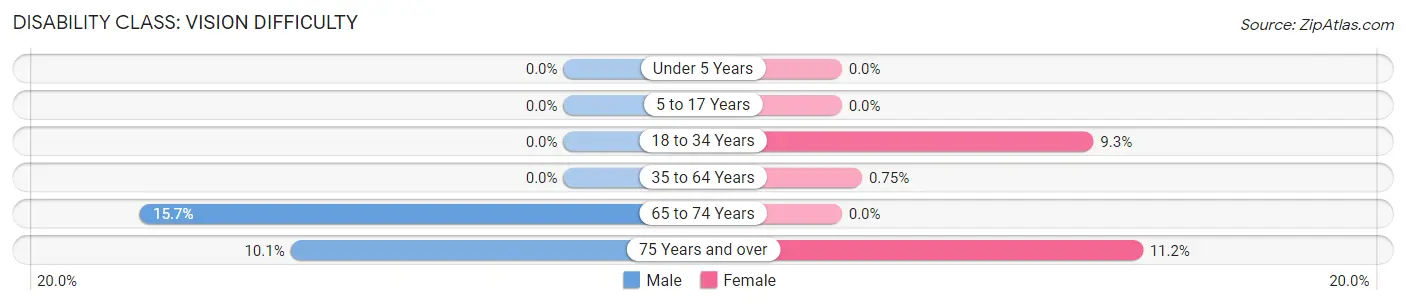
| Age Bracket | Male | Female |
| Under 5 Years | 0 (0.0%) | 0 (0.0%) |
| 5 to 17 Years | 0 (0.0%) | 0 (0.0%) |
| 18 to 34 Years | 0 (0.0%) | 79 (9.3%) |
| 35 to 64 Years | 0 (0.0%) | 11 (0.7%) |
| 65 to 74 Years | 60 (15.7%) | 0 (0.0%) |
| 75 Years and over | 47 (10.1%) | 22 (11.2%) |
Disability Class: Cognitive Difficulty
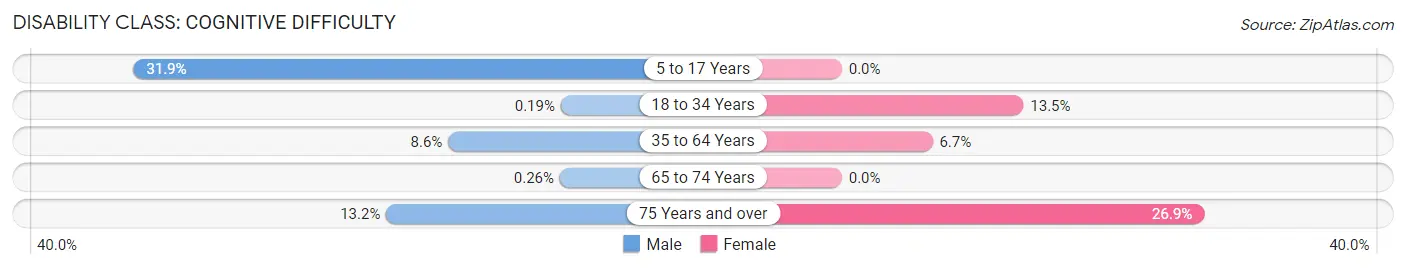
| Age Bracket | Male | Female |
| 5 to 17 Years | 173 (31.9%) | 0 (0.0%) |
| 18 to 34 Years | 2 (0.2%) | 114 (13.5%) |
| 35 to 64 Years | 133 (8.6%) | 99 (6.7%) |
| 65 to 74 Years | 1 (0.3%) | 0 (0.0%) |
| 75 Years and over | 61 (13.2%) | 53 (26.9%) |
Disability Class: Ambulatory Difficulty
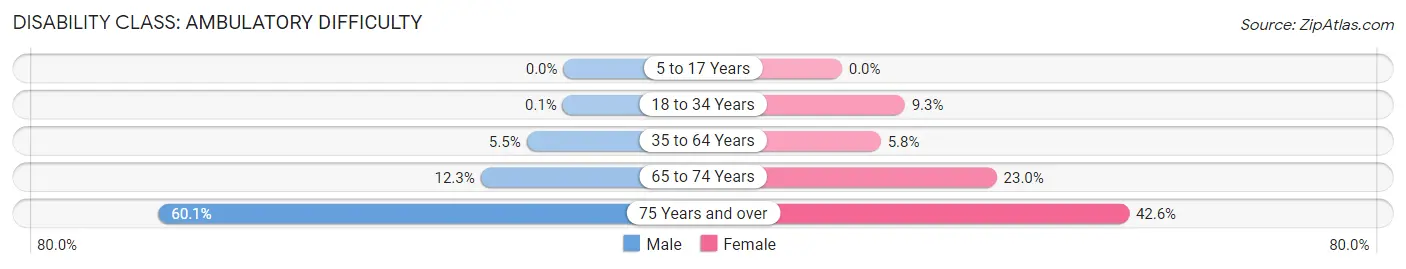
| Age Bracket | Male | Female |
| 5 to 17 Years | 0 (0.0%) | 0 (0.0%) |
| 18 to 34 Years | 1 (0.1%) | 79 (9.3%) |
| 35 to 64 Years | 85 (5.5%) | 85 (5.8%) |
| 65 to 74 Years | 47 (12.3%) | 143 (23.0%) |
| 75 Years and over | 279 (60.1%) | 84 (42.6%) |
Disability Class: Self-Care Difficulty
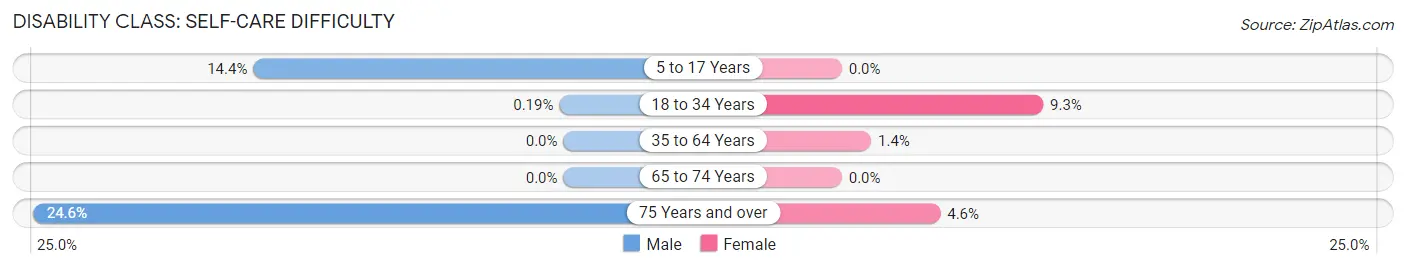
| Age Bracket | Male | Female |
| 5 to 17 Years | 78 (14.4%) | 0 (0.0%) |
| 18 to 34 Years | 2 (0.2%) | 79 (9.3%) |
| 35 to 64 Years | 0 (0.0%) | 20 (1.4%) |
| 65 to 74 Years | 0 (0.0%) | 0 (0.0%) |
| 75 Years and over | 114 (24.6%) | 9 (4.6%) |
Technology Access in Gresham Park
Computing Device Access in Gresham Park
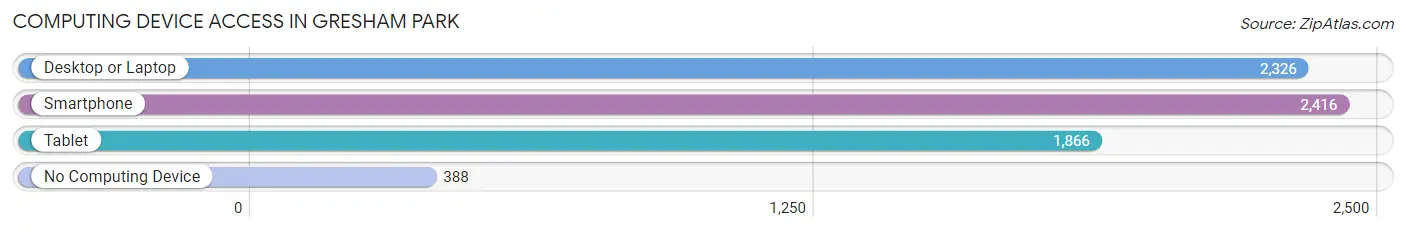
| Device Type | # Households | % Households |
| Desktop or Laptop | 2,326 | 74.9% |
| Smartphone | 2,416 | 77.8% |
| Tablet | 1,866 | 60.1% |
| No Computing Device | 388 | 12.5% |
| Total | 3,106 | 100.0% |
Internet Access in Gresham Park
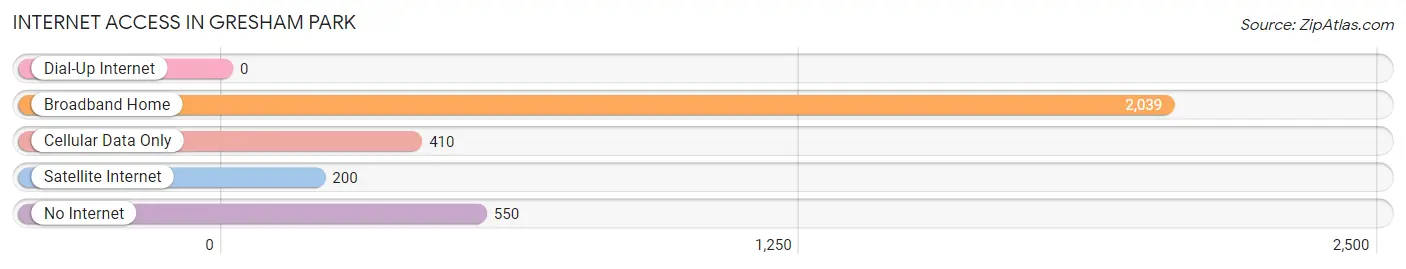
| Internet Type | # Households | % Households |
| Dial-Up Internet | 0 | 0.0% |
| Broadband Home | 2,039 | 65.6% |
| Cellular Data Only | 410 | 13.2% |
| Satellite Internet | 200 | 6.4% |
| No Internet | 550 | 17.7% |
| Total | 3,106 | 100.0% |
Gresham Park Summary
Gresham Park is a small unincorporated community located in DeKalb County, Georgia, United States. It is situated just east of the city of Atlanta and is part of the Atlanta metropolitan area. The population of Gresham Park was estimated to be 4,845 in 2019.
History
Gresham Park was originally part of the Creek Indian Nation. The area was settled by European Americans in the early 19th century. The community was named after the Gresham family, who were among the first settlers in the area. The Gresham family owned a large plantation in the area, which was later divided into smaller farms.
In the late 19th century, the area was annexed by the city of Atlanta. The area was then developed as a residential neighborhood. In the early 20th century, the area was annexed by DeKalb County.
Geography
Gresham Park is located in DeKalb County, Georgia, United States. It is situated just east of the city of Atlanta and is part of the Atlanta metropolitan area. The community is located at 33°45'N 84°19'W.
The area is mostly flat, with an elevation of around 1,000 feet. The area is located in the Piedmont region of Georgia, and is characterized by rolling hills and forests.
Economy
Gresham Park is primarily a residential community, with most of its residents employed in the nearby city of Atlanta. The area is home to a number of small businesses, including restaurants, retail stores, and professional services.
The area is also home to a number of industrial and manufacturing businesses. The largest employer in the area is the Georgia-Pacific Corporation, which operates a paper mill in the area.
Demographics
As of 2019, the population of Gresham Park was estimated to be 4,845. The population is primarily African American, with a small Hispanic population. The median household income in the area is $45,000, and the median home value is $150,000.
The area is served by the DeKalb County School District, which operates several elementary, middle, and high schools in the area. The area is also home to several private schools, including the Gresham Park Academy and the Gresham Park Christian Academy.
Conclusion
Gresham Park is a small unincorporated community located in DeKalb County, Georgia, United States. It is situated just east of the city of Atlanta and is part of the Atlanta metropolitan area. The population of Gresham Park was estimated to be 4,845 in 2019. The area is primarily a residential community, with most of its residents employed in the nearby city of Atlanta. The area is also home to a number of industrial and manufacturing businesses. The population is primarily African American, with a small Hispanic population. The area is served by the DeKalb County School District, which operates several elementary, middle, and high schools in the area.
Common Questions
What is Per Capita Income in Gresham Park?
Per Capita income in Gresham Park is $39,189.
What is the Median Family Income in Gresham Park?
Median Family Income in Gresham Park is $74,883.
What is the Median Household income in Gresham Park?
Median Household Income in Gresham Park is $66,071.
What is Income or Wage Gap in Gresham Park?
Income or Wage Gap in Gresham Park is 7.9%.
Women in Gresham Park earn 92.1 cents for every dollar earned by a man.
What is Inequality or Gini Index in Gresham Park?
Inequality or Gini Index in Gresham Park is 0.47.
What is the Total Population of Gresham Park?
Total Population of Gresham Park is 7,816.
What is the Total Male Population of Gresham Park?
Total Male Population of Gresham Park is 4,264.
What is the Total Female Population of Gresham Park?
Total Female Population of Gresham Park is 3,552.
What is the Ratio of Males per 100 Females in Gresham Park?
There are 120.05 Males per 100 Females in Gresham Park.
What is the Ratio of Females per 100 Males in Gresham Park?
There are 83.30 Females per 100 Males in Gresham Park.
What is the Median Population Age in Gresham Park?
Median Population Age in Gresham Park is 40.1 Years.
What is the Average Family Size in Gresham Park
Average Family Size in Gresham Park is 3.2 People.
What is the Average Household Size in Gresham Park
Average Household Size in Gresham Park is 2.5 People.
How Large is the Labor Force in Gresham Park?
There are 4,159 People in the Labor Forcein in Gresham Park.
What is the Percentage of People in the Labor Force in Gresham Park?
62.6% of People are in the Labor Force in Gresham Park.
What is the Unemployment Rate in Gresham Park?
Unemployment Rate in Gresham Park is 4.5%.