Hartwell, GA Map & Demographics
Hartwell Map
Hartwell Overview
$24,160
PER CAPITA INCOME
$57,255
AVG FAMILY INCOME
$46,875
AVG HOUSEHOLD INCOME
14.0%
WAGE / INCOME GAP [ % ]
86.0¢/ $1
WAGE / INCOME GAP [ $ ]
0.49
INEQUALITY / GINI INDEX
4,481
TOTAL POPULATION
2,109
MALE POPULATION
2,372
FEMALE POPULATION
88.91
MALES / 100 FEMALES
112.47
FEMALES / 100 MALES
44.2
MEDIAN AGE
3.3
AVG FAMILY SIZE
2.3
AVG HOUSEHOLD SIZE
2,080
LABOR FORCE [ PEOPLE ]
57.2%
PERCENT IN LABOR FORCE
0.3%
UNEMPLOYMENT RATE
Hartwell Zip Codes
Hartwell Area Codes
Income in Hartwell
Income Overview in Hartwell
Per Capita Income in Hartwell is $24,160, while median incomes of families and households are $57,255 and $46,875 respectively.
| Characteristic | Number | Measure |
| Per Capita Income | 4,481 | $24,160 |
| Median Family Income | 985 | $57,255 |
| Mean Family Income | 985 | $74,950 |
| Median Household Income | 1,850 | $46,875 |
| Mean Household Income | 1,850 | $55,776 |
| Income Deficit | 985 | $0 |
| Wage / Income Gap (%) | 4,481 | 13.99% |
| Wage / Income Gap ($) | 4,481 | 86.01¢ per $1 |
| Gini / Inequality Index | 4,481 | 0.49 |
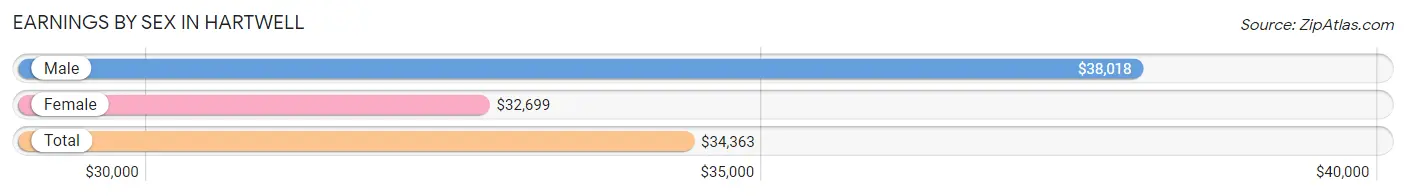
Earnings by Sex in Hartwell
Average Earnings in Hartwell are $34,363, $38,018 for men and $32,699 for women, a difference of 14.0%.
| Sex | Number | Average Earnings |
| Male | 1,102 (52.4%) | $38,018 |
| Female | 1,001 (47.6%) | $32,699 |
| Total | 2,103 (100.0%) | $34,363 |
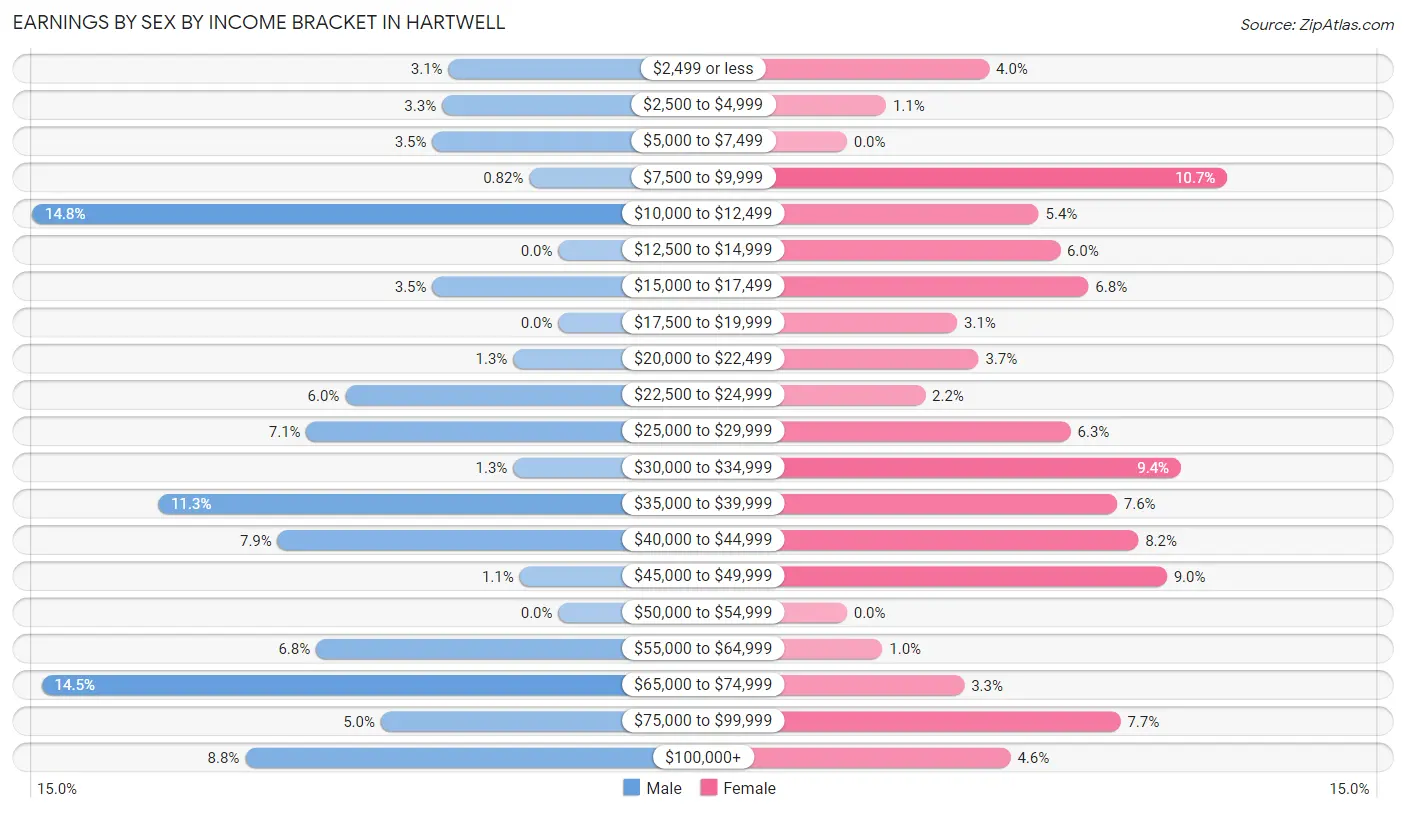
Earnings by Sex by Income Bracket in Hartwell
The most common earnings brackets in Hartwell are $10,000 to $12,499 for men (163 | 14.8%) and $7,500 to $9,999 for women (107 | 10.7%).
| Income | Male | Female |
| $2,499 or less | 34 (3.1%) | 40 (4.0%) |
| $2,500 to $4,999 | 36 (3.3%) | 11 (1.1%) |
| $5,000 to $7,499 | 39 (3.5%) | 0 (0.0%) |
| $7,500 to $9,999 | 9 (0.8%) | 107 (10.7%) |
| $10,000 to $12,499 | 163 (14.8%) | 54 (5.4%) |
| $12,500 to $14,999 | 0 (0.0%) | 60 (6.0%) |
| $15,000 to $17,499 | 39 (3.5%) | 68 (6.8%) |
| $17,500 to $19,999 | 0 (0.0%) | 31 (3.1%) |
| $20,000 to $22,499 | 14 (1.3%) | 37 (3.7%) |
| $22,500 to $24,999 | 66 (6.0%) | 22 (2.2%) |
| $25,000 to $29,999 | 78 (7.1%) | 63 (6.3%) |
| $30,000 to $34,999 | 14 (1.3%) | 94 (9.4%) |
| $35,000 to $39,999 | 124 (11.3%) | 76 (7.6%) |
| $40,000 to $44,999 | 87 (7.9%) | 82 (8.2%) |
| $45,000 to $49,999 | 12 (1.1%) | 90 (9.0%) |
| $50,000 to $54,999 | 0 (0.0%) | 0 (0.0%) |
| $55,000 to $64,999 | 75 (6.8%) | 10 (1.0%) |
| $65,000 to $74,999 | 160 (14.5%) | 33 (3.3%) |
| $75,000 to $99,999 | 55 (5.0%) | 77 (7.7%) |
| $100,000+ | 97 (8.8%) | 46 (4.6%) |
| Total | 1,102 (100.0%) | 1,001 (100.0%) |
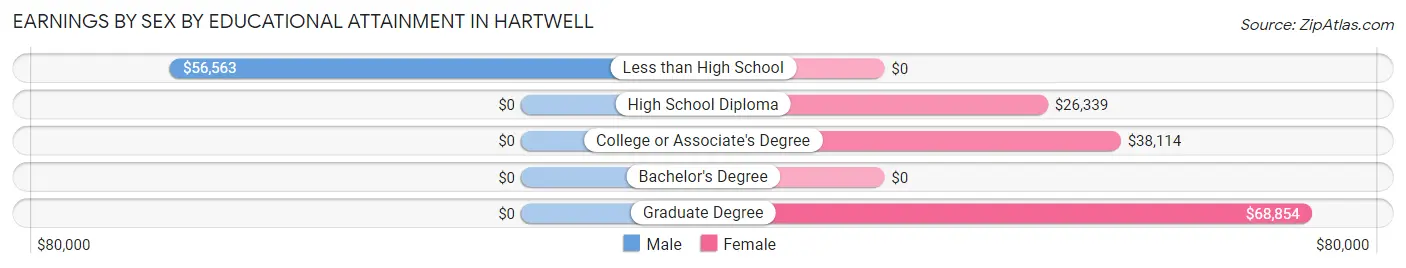
Earnings by Sex by Educational Attainment in Hartwell
Average earnings in Hartwell are $37,866 for men and $34,215 for women, a difference of 9.6%. Men with an educational attainment of less than high school enjoy the highest average annual earnings of $56,563, while those with less than high school education earn the least with $56,563. Women with an educational attainment of graduate degree earn the most with the average annual earnings of $68,854, while those with high school diploma education have the smallest earnings of $26,339.
| Educational Attainment | Male Income | Female Income |
| Less than High School | $56,563 | $0 |
| High School Diploma | - | - |
| College or Associate's Degree | - | - |
| Bachelor's Degree | - | - |
| Graduate Degree | - | - |
| Total | $37,866 | $34,215 |
Family Income in Hartwell
Family Income Brackets in Hartwell
According to the Hartwell family income data, there are 231 families falling into the $50,000 to $74,999 income range, which is the most common income bracket and makes up 23.4% of all families. Conversely, the $10,000 to $14,999 income bracket is the least frequent group with only 17 families (1.7%) belonging to this category.
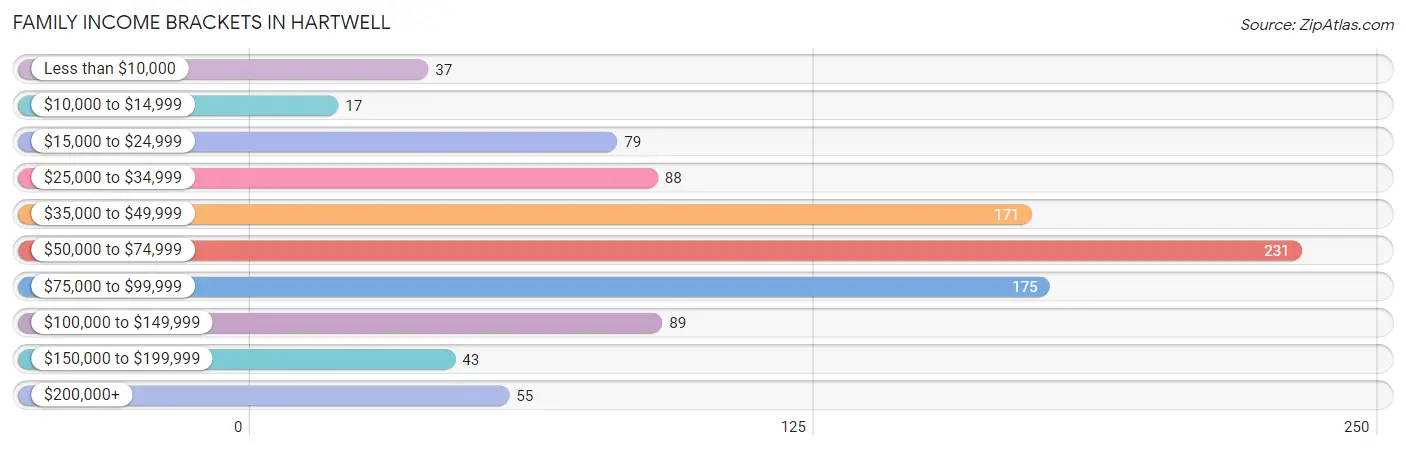
| Income Bracket | # Families | % Families |
| Less than $10,000 | 37 | 3.8% |
| $10,000 to $14,999 | 17 | 1.7% |
| $15,000 to $24,999 | 79 | 8.0% |
| $25,000 to $34,999 | 88 | 8.9% |
| $35,000 to $49,999 | 171 | 17.4% |
| $50,000 to $74,999 | 231 | 23.5% |
| $75,000 to $99,999 | 175 | 17.8% |
| $100,000 to $149,999 | 89 | 9.0% |
| $150,000 to $199,999 | 43 | 4.4% |
| $200,000+ | 55 | 5.6% |
Family Income by Famaliy Size in Hartwell
4-person families (242 | 24.6%) account for the highest median family income in Hartwell with $83,833 per family, while 2-person families (484 | 49.1%) have the highest median income of $26,462 per family member.
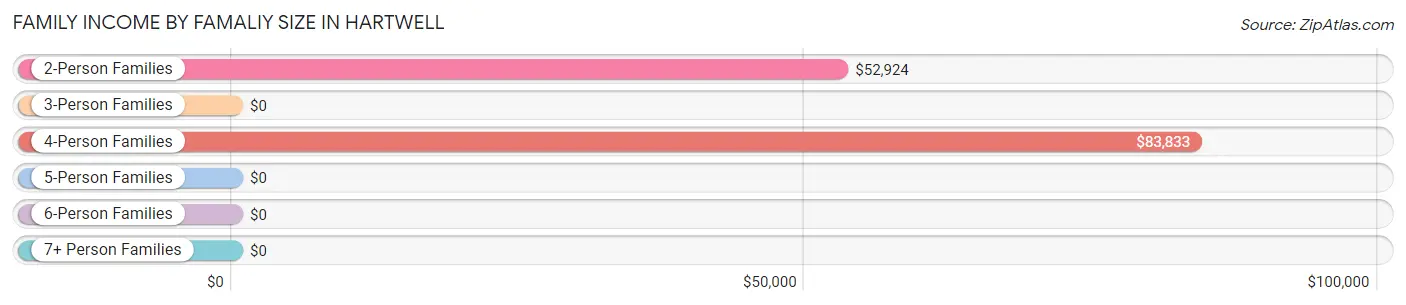
| Income Bracket | # Families | Median Income |
| 2-Person Families | 484 (49.1%) | $52,924 |
| 3-Person Families | 190 (19.3%) | $0 |
| 4-Person Families | 242 (24.6%) | $83,833 |
| 5-Person Families | 69 (7.0%) | $0 |
| 6-Person Families | 0 (0.0%) | $0 |
| 7+ Person Families | 0 (0.0%) | $0 |
| Total | 985 (100.0%) | $57,255 |
Family Income by Number of Earners in Hartwell
The median family income in Hartwell is $57,255, with families comprising 3+ earners (131) having the highest median family income of $104,097, while families with no earners (125) have the lowest median family income of $27,989, accounting for 13.3% and 12.7% of families, respectively.
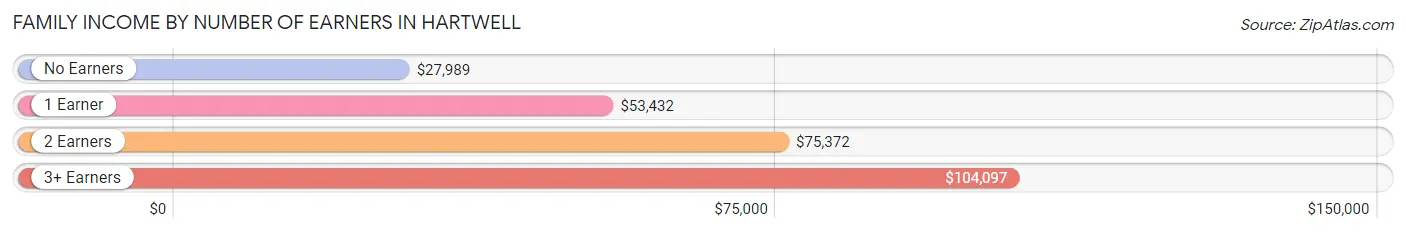
| Number of Earners | # Families | Median Income |
| No Earners | 125 (12.7%) | $27,989 |
| 1 Earner | 338 (34.3%) | $53,432 |
| 2 Earners | 391 (39.7%) | $75,372 |
| 3+ Earners | 131 (13.3%) | $104,097 |
| Total | 985 (100.0%) | $57,255 |
Household Income in Hartwell
Household Income Brackets in Hartwell
With 426 households falling in the category, the $50,000 to $74,999 income range is the most frequent in Hartwell, accounting for 23.0% of all households. In contrast, only 56 households (3.0%) fall into the $200,000+ income bracket, making it the least populous group.
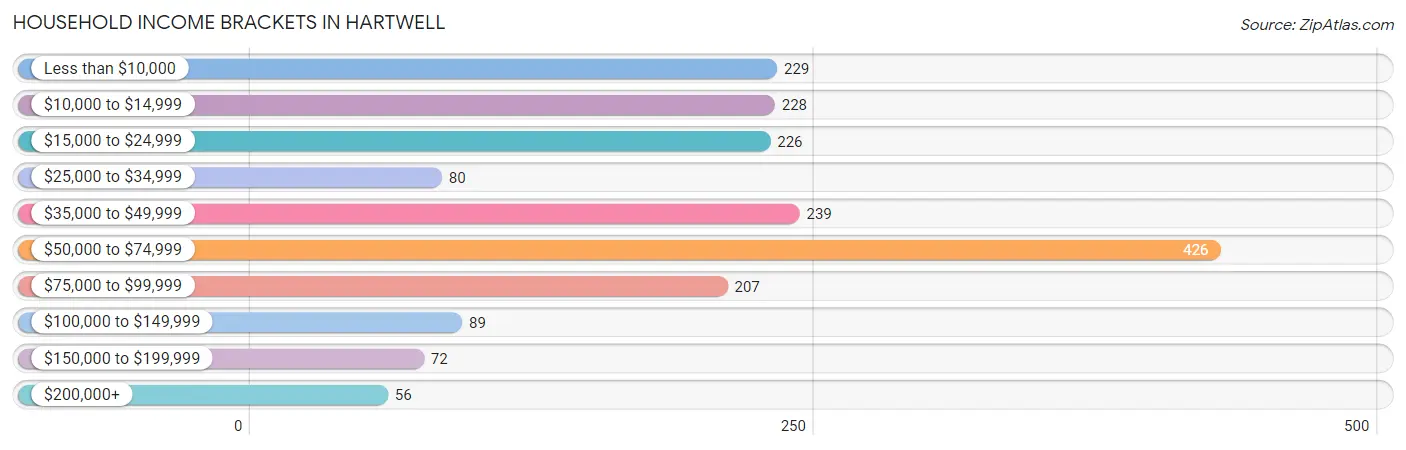
| Income Bracket | # Households | % Households |
| Less than $10,000 | 229 | 12.4% |
| $10,000 to $14,999 | 228 | 12.3% |
| $15,000 to $24,999 | 226 | 12.2% |
| $25,000 to $34,999 | 80 | 4.3% |
| $35,000 to $49,999 | 239 | 12.9% |
| $50,000 to $74,999 | 426 | 23.0% |
| $75,000 to $99,999 | 207 | 11.2% |
| $100,000 to $149,999 | 89 | 4.8% |
| $150,000 to $199,999 | 72 | 3.9% |
| $200,000+ | 56 | 3.0% |
Household Income by Householder Age in Hartwell
The median household income in Hartwell is $46,875, with the highest median household income of $55,000 found in the 25 to 44 years age bracket for the primary householder. A total of 432 households (23.4%) fall into this category. Meanwhile, the 65+ years age bracket for the primary householder has the lowest median household income of $22,116, with 641 households (34.6%) in this group.
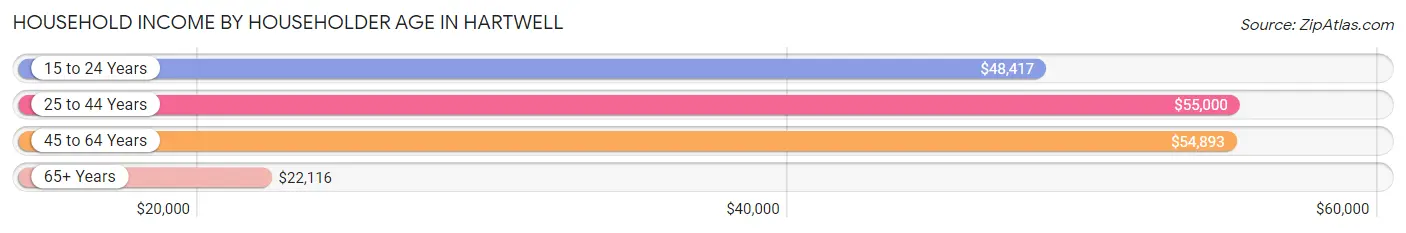
| Income Bracket | # Households | Median Income |
| 15 to 24 Years | 56 (3.0%) | $48,417 |
| 25 to 44 Years | 432 (23.4%) | $55,000 |
| 45 to 64 Years | 721 (39.0%) | $54,893 |
| 65+ Years | 641 (34.6%) | $22,116 |
| Total | 1,850 (100.0%) | $46,875 |
Poverty in Hartwell
Income Below Poverty by Sex and Age in Hartwell
With 13.9% poverty level for males and 19.1% for females among the residents of Hartwell, 75 year old and over males and 5 year old females are the most vulnerable to poverty, with 52 males (37.1%) and 13 females (100.0%) in their respective age groups living below the poverty level.
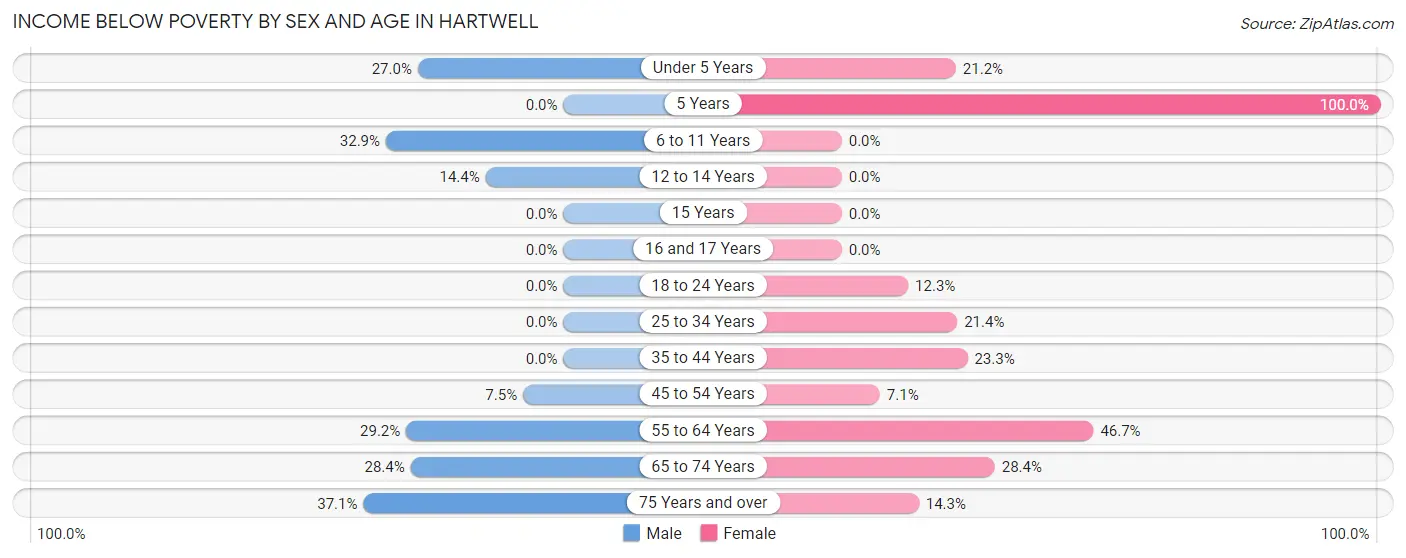
| Age Bracket | Male | Female |
| Under 5 Years | 10 (27.0%) | 18 (21.2%) |
| 5 Years | 0 (0.0%) | 13 (100.0%) |
| 6 to 11 Years | 56 (32.9%) | 0 (0.0%) |
| 12 to 14 Years | 26 (14.4%) | 0 (0.0%) |
| 15 Years | 0 (0.0%) | 0 (0.0%) |
| 16 and 17 Years | 0 (0.0%) | 0 (0.0%) |
| 18 to 24 Years | 0 (0.0%) | 17 (12.3%) |
| 25 to 34 Years | 0 (0.0%) | 57 (21.4%) |
| 35 to 44 Years | 0 (0.0%) | 35 (23.3%) |
| 45 to 54 Years | 20 (7.5%) | 21 (7.1%) |
| 55 to 64 Years | 54 (29.2%) | 142 (46.7%) |
| 65 to 74 Years | 59 (28.4%) | 94 (28.4%) |
| 75 Years and over | 52 (37.1%) | 33 (14.3%) |
| Total | 277 (13.9%) | 430 (19.1%) |
Income Above Poverty by Sex and Age in Hartwell
According to the poverty statistics in Hartwell, males aged 16 and 17 years and females aged 6 to 11 years are the age groups that are most secure financially, with 100.0% of males and 100.0% of females in these age groups living above the poverty line.
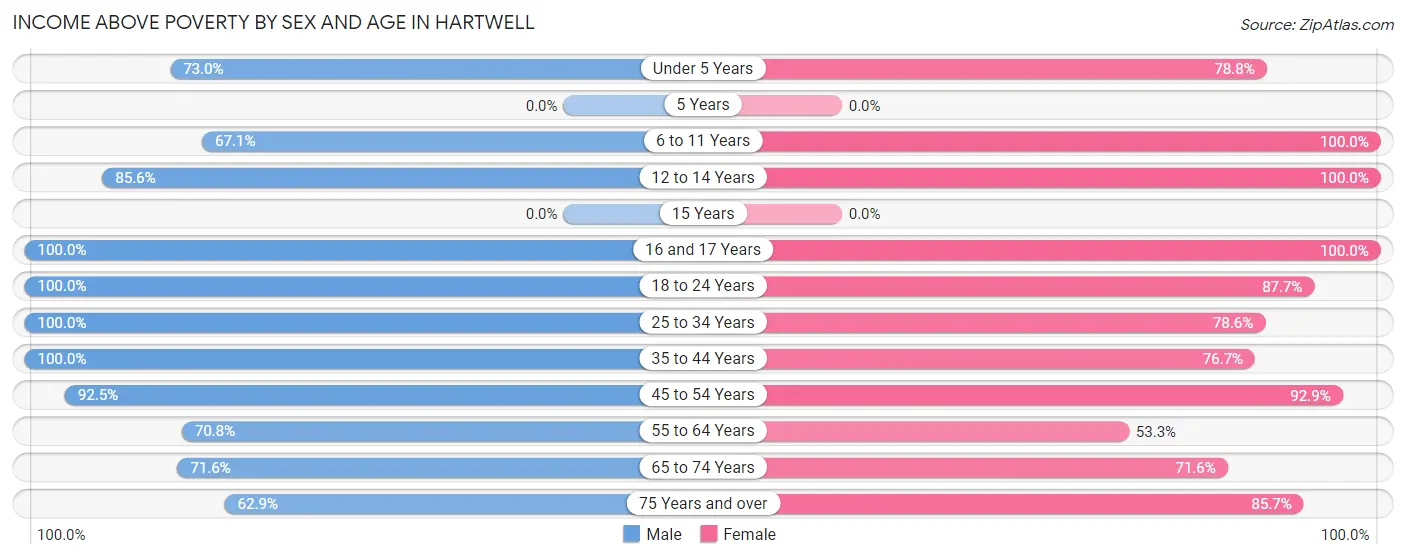
| Age Bracket | Male | Female |
| Under 5 Years | 27 (73.0%) | 67 (78.8%) |
| 5 Years | 0 (0.0%) | 0 (0.0%) |
| 6 to 11 Years | 114 (67.1%) | 308 (100.0%) |
| 12 to 14 Years | 154 (85.6%) | 51 (100.0%) |
| 15 Years | 0 (0.0%) | 0 (0.0%) |
| 16 and 17 Years | 37 (100.0%) | 76 (100.0%) |
| 18 to 24 Years | 96 (100.0%) | 121 (87.7%) |
| 25 to 34 Years | 430 (100.0%) | 209 (78.6%) |
| 35 to 44 Years | 244 (100.0%) | 115 (76.7%) |
| 45 to 54 Years | 247 (92.5%) | 276 (92.9%) |
| 55 to 64 Years | 131 (70.8%) | 162 (53.3%) |
| 65 to 74 Years | 149 (71.6%) | 237 (71.6%) |
| 75 Years and over | 88 (62.9%) | 198 (85.7%) |
| Total | 1,717 (86.1%) | 1,820 (80.9%) |
Income Below Poverty Among Married-Couple Families in Hartwell
The poverty statistics for married-couple families in Hartwell show that 2.5% or 17 of the total 695 families live below the poverty line. Families with 3 or 4 children have the highest poverty rate of 37.0%, comprising of 17 families. On the other hand, families with no children have the lowest poverty rate of 0.0%, which includes 0 families.
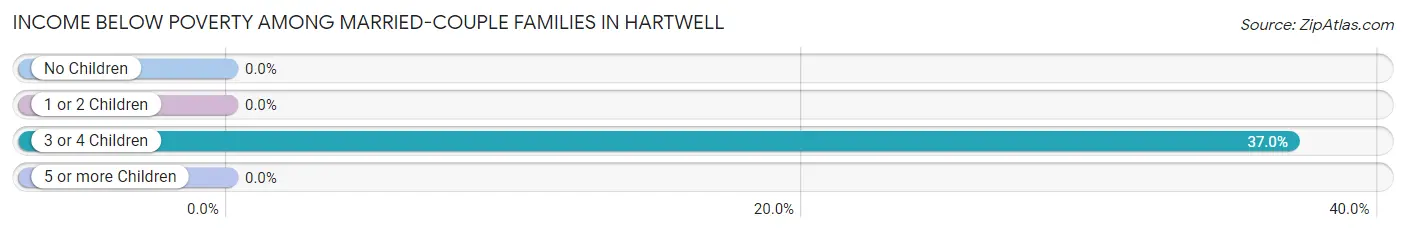
| Children | Above Poverty | Below Poverty |
| No Children | 334 (100.0%) | 0 (0.0%) |
| 1 or 2 Children | 315 (100.0%) | 0 (0.0%) |
| 3 or 4 Children | 29 (63.0%) | 17 (37.0%) |
| 5 or more Children | 0 (0.0%) | 0 (0.0%) |
| Total | 678 (97.6%) | 17 (2.5%) |
Income Below Poverty Among Single-Parent Households in Hartwell
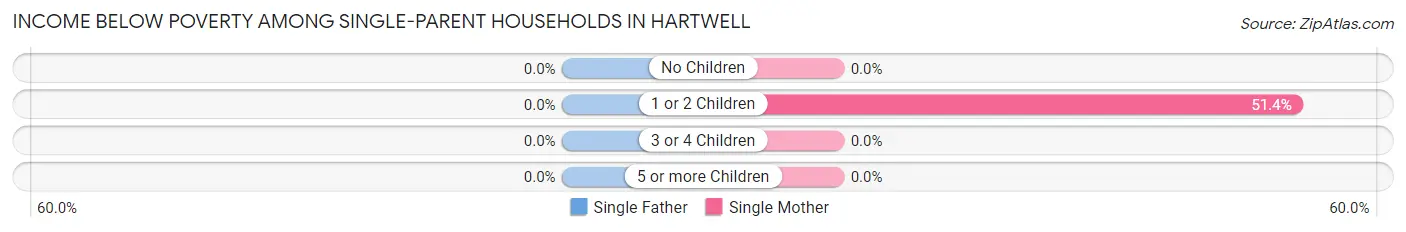
| Children | Single Father | Single Mother |
| No Children | 0 (0.0%) | 0 (0.0%) |
| 1 or 2 Children | 0 (0.0%) | 74 (51.4%) |
| 3 or 4 Children | 0 (0.0%) | 0 (0.0%) |
| 5 or more Children | 0 (0.0%) | 0 (0.0%) |
| Total | 0 (0.0%) | 74 (31.5%) |
Income Below Poverty Among Married-Couple vs Single-Parent Households in Hartwell
The poverty data for Hartwell shows that 17 of the married-couple family households (2.5%) and 74 of the single-parent households (25.5%) are living below the poverty level. Within the married-couple family households, those with 3 or 4 children have the highest poverty rate, with 17 households (37.0%) falling below the poverty line. Among the single-parent households, those with 1 or 2 children have the highest poverty rate, with 74 household (51.4%) living below poverty.
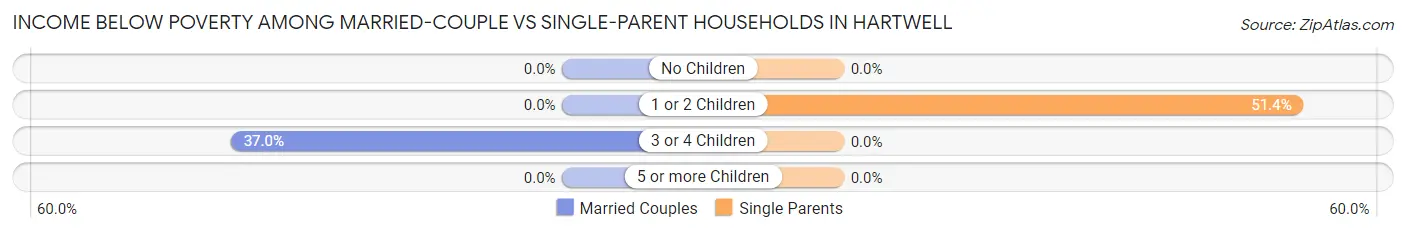
| Children | Married-Couple Families | Single-Parent Households |
| No Children | 0 (0.0%) | 0 (0.0%) |
| 1 or 2 Children | 0 (0.0%) | 74 (51.4%) |
| 3 or 4 Children | 17 (37.0%) | 0 (0.0%) |
| 5 or more Children | 0 (0.0%) | 0 (0.0%) |
| Total | 17 (2.5%) | 74 (25.5%) |
Race in Hartwell
The most populous races in Hartwell are White / Caucasian (2,448 | 54.6%), Black / African American (1,763 | 39.3%), and Two or more Races (167 | 3.7%).
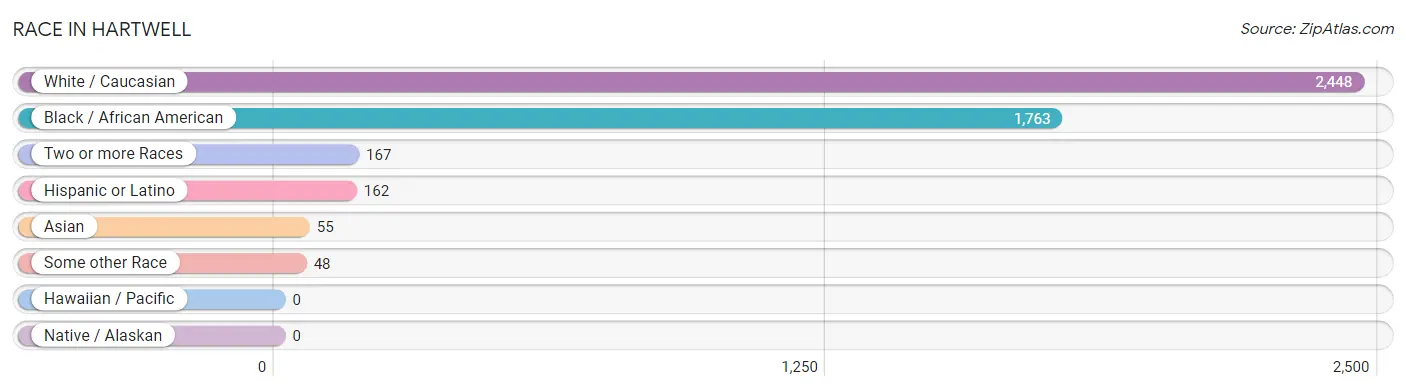
| Race | # Population | % Population |
| Asian | 55 | 1.2% |
| Black / African American | 1,763 | 39.3% |
| Hawaiian / Pacific | 0 | 0.0% |
| Hispanic or Latino | 162 | 3.6% |
| Native / Alaskan | 0 | 0.0% |
| White / Caucasian | 2,448 | 54.6% |
| Two or more Races | 167 | 3.7% |
| Some other Race | 48 | 1.1% |
| Total | 4,481 | 100.0% |
Ancestry in Hartwell
The most populous ancestries reported in Hartwell are American (384 | 8.6%), English (351 | 7.8%), Irish (249 | 5.6%), African (161 | 3.6%), and Subsaharan African (161 | 3.6%), together accounting for 29.1% of all Hartwell residents.
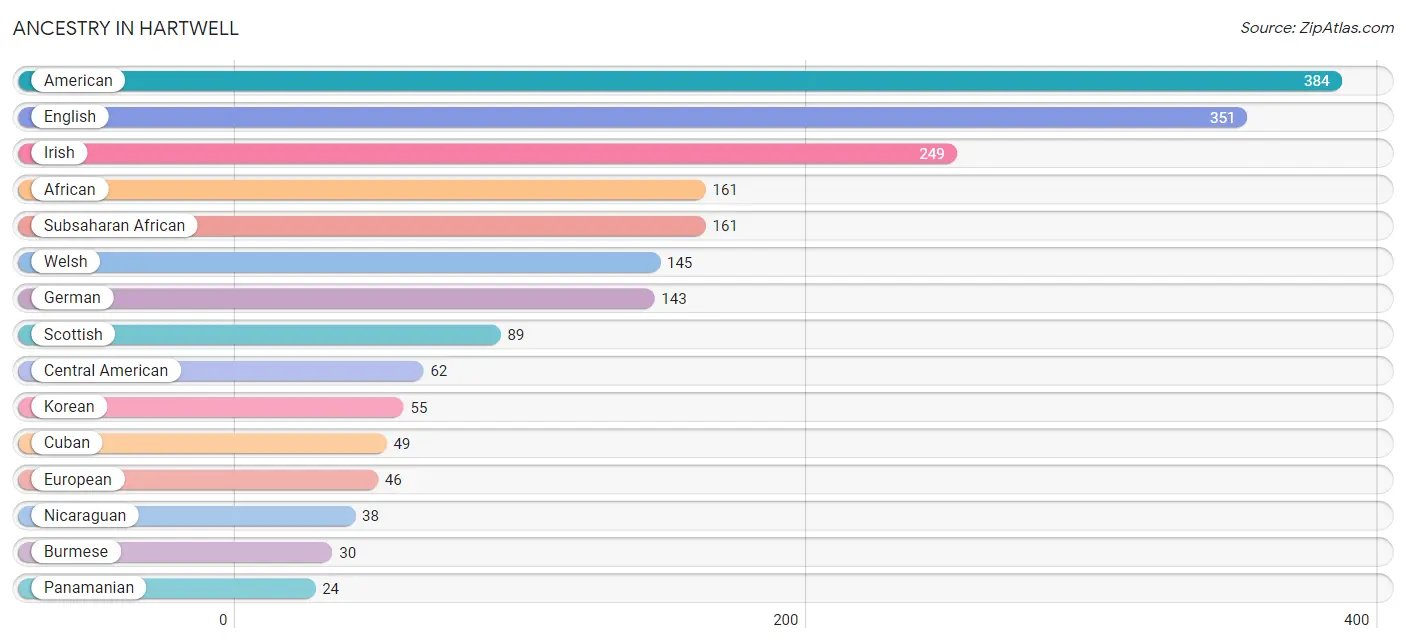
| Ancestry | # Population | % Population |
| African | 161 | 3.6% |
| American | 384 | 8.6% |
| Bhutanese | 10 | 0.2% |
| Burmese | 30 | 0.7% |
| Central American | 62 | 1.4% |
| Cherokee | 19 | 0.4% |
| Cuban | 49 | 1.1% |
| Dutch | 10 | 0.2% |
| English | 351 | 7.8% |
| European | 46 | 1.0% |
| Finnish | 5 | 0.1% |
| German | 143 | 3.2% |
| Greek | 9 | 0.2% |
| Irish | 249 | 5.6% |
| Italian | 7 | 0.2% |
| Korean | 55 | 1.2% |
| Mexican | 10 | 0.2% |
| Nicaraguan | 38 | 0.9% |
| Panamanian | 24 | 0.5% |
| Puerto Rican | 10 | 0.2% |
| Scotch-Irish | 19 | 0.4% |
| Scottish | 89 | 2.0% |
| Spaniard | 6 | 0.1% |
| Subsaharan African | 161 | 3.6% |
| Welsh | 145 | 3.2% | View All 25 Rows |
Immigrants in Hartwell
The most numerous immigrant groups reported in Hartwell came from Asia (46 | 1.0%), Eastern Asia (30 | 0.7%), Korea (30 | 0.7%), Central America (24 | 0.5%), and Latin America (24 | 0.5%), together accounting for 3.5% of all Hartwell residents.
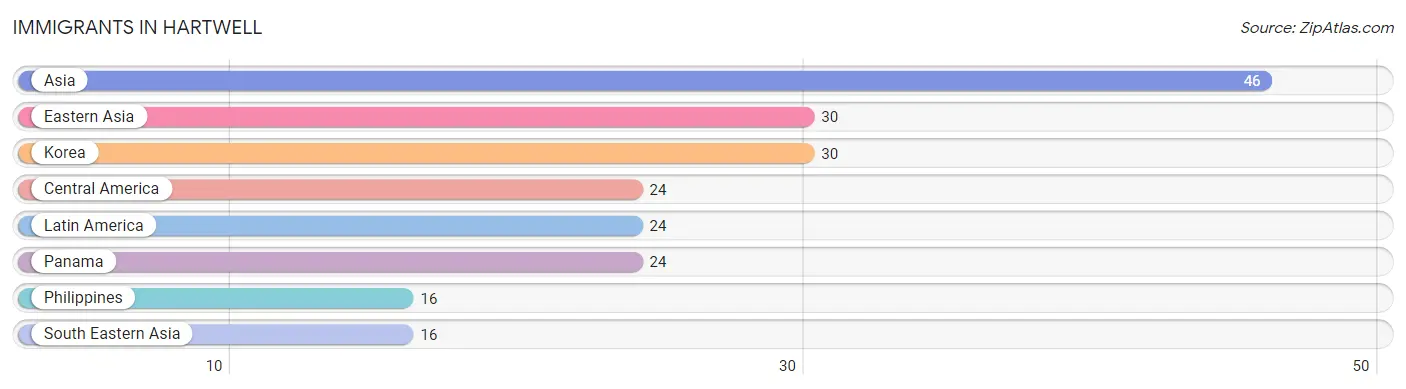
| Immigration Origin | # Population | % Population |
| Asia | 46 | 1.0% |
| Central America | 24 | 0.5% |
| Eastern Asia | 30 | 0.7% |
| Korea | 30 | 0.7% |
| Latin America | 24 | 0.5% |
| Panama | 24 | 0.5% |
| Philippines | 16 | 0.4% |
| South Eastern Asia | 16 | 0.4% | View All 8 Rows |
Sex and Age in Hartwell
Sex and Age in Hartwell
The most populous age groups in Hartwell are 10 to 14 Years (256 | 12.1%) for men and 5 to 9 Years (267 | 11.3%) for women.
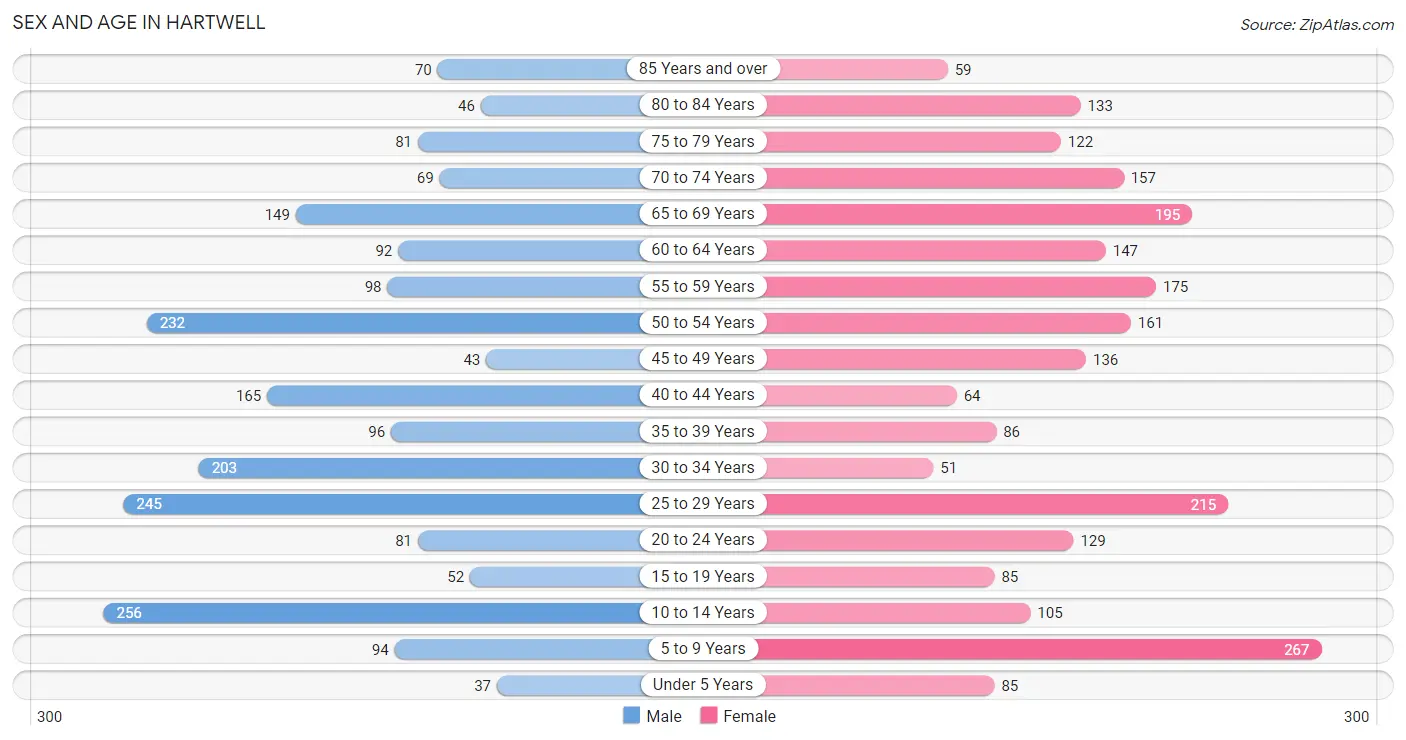
| Age Bracket | Male | Female |
| Under 5 Years | 37 (1.8%) | 85 (3.6%) |
| 5 to 9 Years | 94 (4.5%) | 267 (11.3%) |
| 10 to 14 Years | 256 (12.1%) | 105 (4.4%) |
| 15 to 19 Years | 52 (2.5%) | 85 (3.6%) |
| 20 to 24 Years | 81 (3.8%) | 129 (5.4%) |
| 25 to 29 Years | 245 (11.6%) | 215 (9.1%) |
| 30 to 34 Years | 203 (9.6%) | 51 (2.1%) |
| 35 to 39 Years | 96 (4.5%) | 86 (3.6%) |
| 40 to 44 Years | 165 (7.8%) | 64 (2.7%) |
| 45 to 49 Years | 43 (2.0%) | 136 (5.7%) |
| 50 to 54 Years | 232 (11.0%) | 161 (6.8%) |
| 55 to 59 Years | 98 (4.6%) | 175 (7.4%) |
| 60 to 64 Years | 92 (4.4%) | 147 (6.2%) |
| 65 to 69 Years | 149 (7.1%) | 195 (8.2%) |
| 70 to 74 Years | 69 (3.3%) | 157 (6.6%) |
| 75 to 79 Years | 81 (3.8%) | 122 (5.1%) |
| 80 to 84 Years | 46 (2.2%) | 133 (5.6%) |
| 85 Years and over | 70 (3.3%) | 59 (2.5%) |
| Total | 2,109 (100.0%) | 2,372 (100.0%) |
Families and Households in Hartwell
Median Family Size in Hartwell
The median family size in Hartwell is 3.30 persons per family, with married-couple families (695 | 70.6%) accounting for the largest median family size of 3.61 persons per family. On the other hand, single male/father families (55 | 5.6%) represent the smallest median family size with 2.35 persons per family.
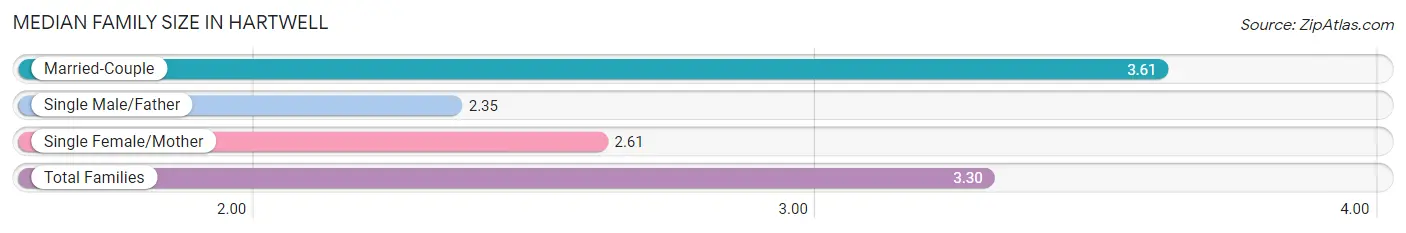
| Family Type | # Families | Family Size |
| Married-Couple | 695 (70.6%) | 3.61 |
| Single Male/Father | 55 (5.6%) | 2.35 |
| Single Female/Mother | 235 (23.9%) | 2.61 |
| Total Families | 985 (100.0%) | 3.30 |
Median Household Size in Hartwell
The median household size in Hartwell is 2.29 persons per household, with married-couple households (695 | 37.6%) accounting for the largest median household size of 3.63 persons per household. non-family households (865 | 46.8%) represent the smallest median household size with 1.09 persons per household.
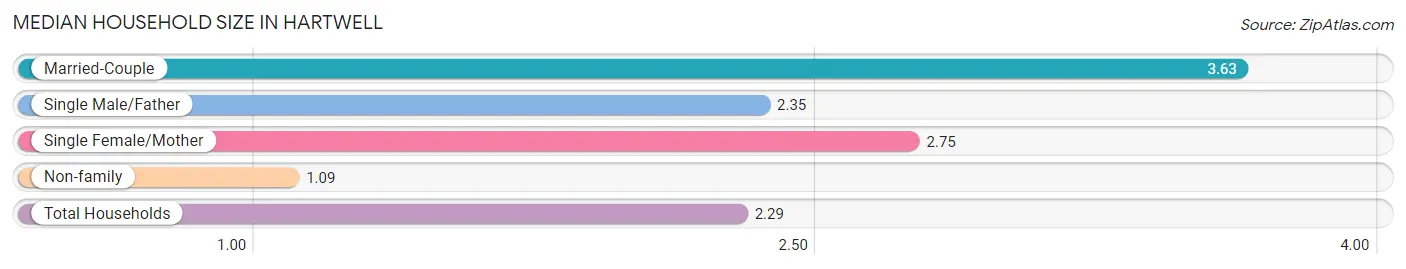
| Household Type | # Households | Household Size |
| Married-Couple | 695 (37.6%) | 3.63 |
| Single Male/Father | 55 (3.0%) | 2.35 |
| Single Female/Mother | 235 (12.7%) | 2.75 |
| Non-family | 865 (46.8%) | 1.09 |
| Total Households | 1,850 (100.0%) | 2.29 |
Household Size by Marriage Status in Hartwell
Out of a total of 1,850 households in Hartwell, 985 (53.2%) are family households, while 865 (46.8%) are nonfamily households. The most numerous type of family households are 2-person households, comprising 423, and the most common type of nonfamily households are 1-person households, comprising 808.
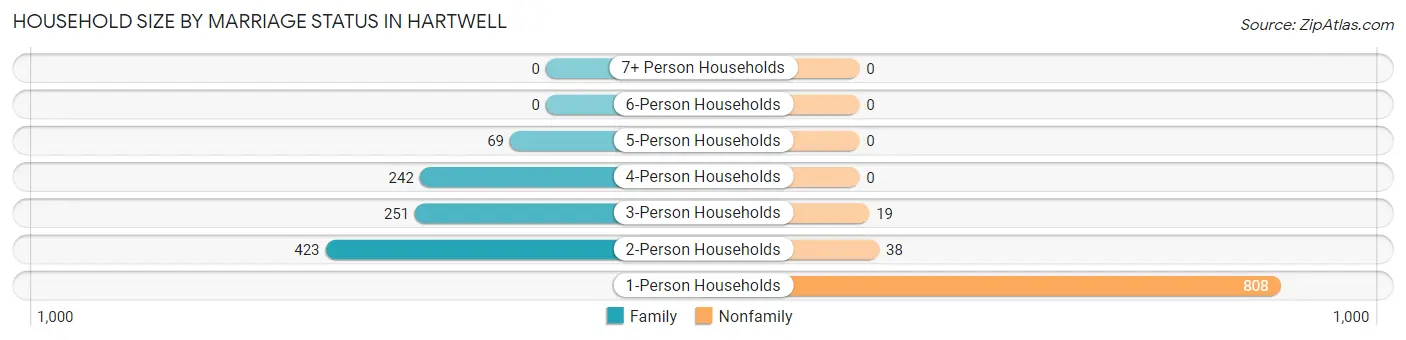
| Household Size | Family Households | Nonfamily Households |
| 1-Person Households | - | 808 (43.7%) |
| 2-Person Households | 423 (22.9%) | 38 (2.1%) |
| 3-Person Households | 251 (13.6%) | 19 (1.0%) |
| 4-Person Households | 242 (13.1%) | 0 (0.0%) |
| 5-Person Households | 69 (3.7%) | 0 (0.0%) |
| 6-Person Households | 0 (0.0%) | 0 (0.0%) |
| 7+ Person Households | 0 (0.0%) | 0 (0.0%) |
| Total | 985 (53.2%) | 865 (46.8%) |
Female Fertility in Hartwell
Fertility by Age in Hartwell
Average fertility rate in Hartwell is 82.0 births per 1,000 women. Women in the age bracket of 20 to 34 years have the highest fertility rate with 159.0 births per 1,000 women. Women in the age bracket of 20 to 34 years acount for 100.0% of all women with births.
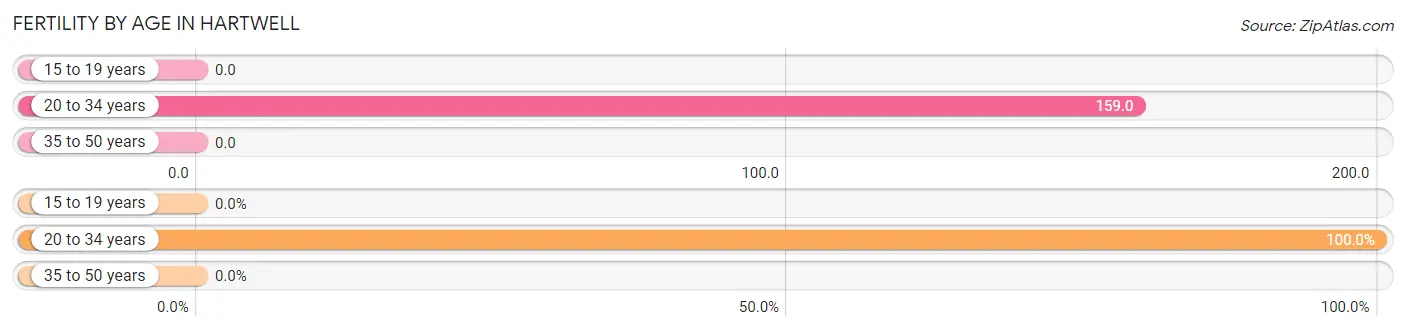
| Age Bracket | Women with Births | Births / 1,000 Women |
| 15 to 19 years | 0 (0.0%) | 0.0 |
| 20 to 34 years | 63 (100.0%) | 159.0 |
| 35 to 50 years | 0 (0.0%) | 0.0 |
| Total | 63 (100.0%) | 82.0 |
Fertility by Age by Marriage Status in Hartwell
73.0% of women with births (63) in Hartwell are married. The highest percentage of unmarried women with births falls into 20 to 34 years age bracket with 27.0% of them unmarried at the time of birth, while the lowest percentage of unmarried women with births belong to 20 to 34 years age bracket with 27.0% of them unmarried.
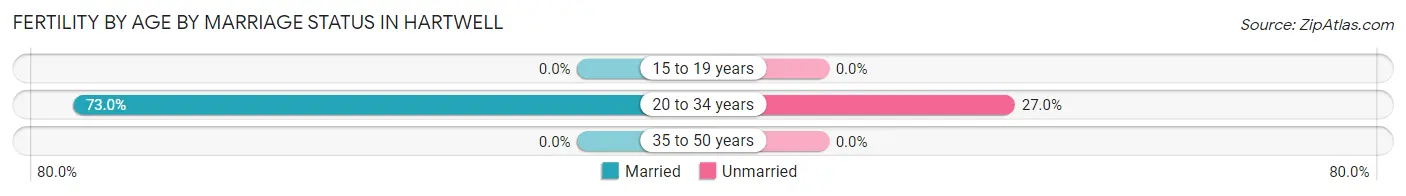
| Age Bracket | Married | Unmarried |
| 15 to 19 years | 0 (0.0%) | 0 (0.0%) |
| 20 to 34 years | 46 (73.0%) | 17 (27.0%) |
| 35 to 50 years | 0 (0.0%) | 0 (0.0%) |
| Total | 46 (73.0%) | 17 (27.0%) |
Fertility by Education in Hartwell
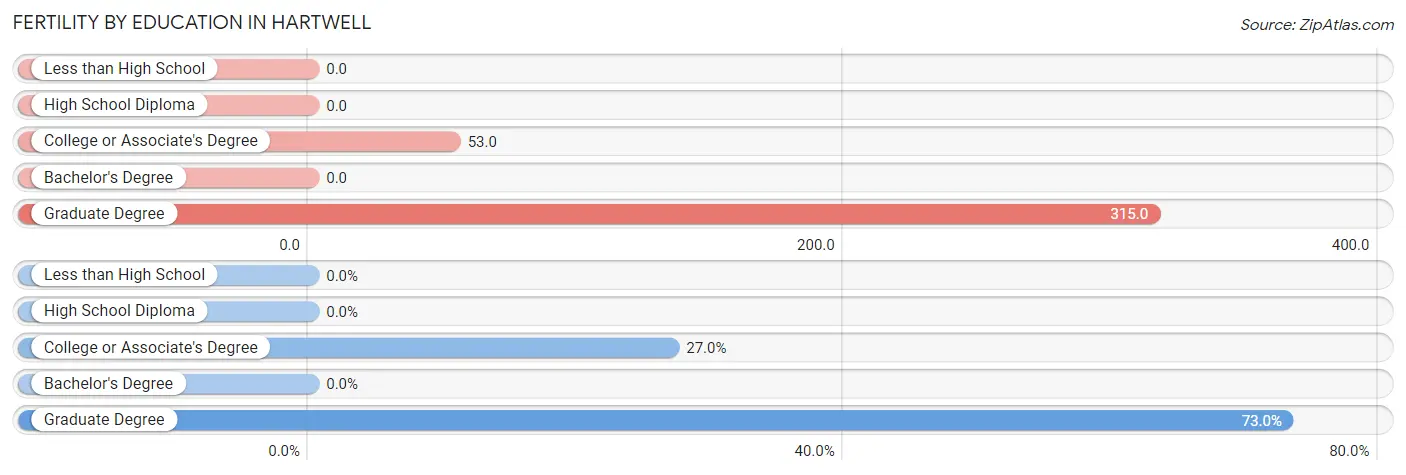
| Educational Attainment | Women with Births | Births / 1,000 Women |
| Less than High School | 0 (0.0%) | 0.0 |
| High School Diploma | 0 (0.0%) | 0.0 |
| College or Associate's Degree | 17 (27.0%) | 53.0 |
| Bachelor's Degree | 0 (0.0%) | 0.0 |
| Graduate Degree | 46 (73.0%) | 315.0 |
| Total | 63 (100.0%) | 82.0 |
Fertility by Education by Marriage Status in Hartwell
27.0% of women with births in Hartwell are unmarried. Women with the educational attainment of graduate degree are most likely to be married with 100.0% of them married at childbirth, while women with the educational attainment of college or associate's degree are least likely to be married with 100.0% of them unmarried at childbirth.
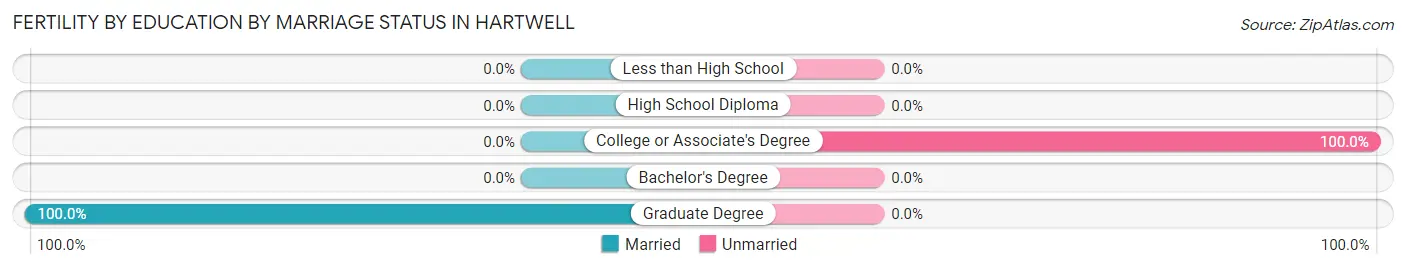
| Educational Attainment | Married | Unmarried |
| Less than High School | 0 (0.0%) | 0 (0.0%) |
| High School Diploma | 0 (0.0%) | 0 (0.0%) |
| College or Associate's Degree | 0 (0.0%) | 17 (100.0%) |
| Bachelor's Degree | 0 (0.0%) | 0 (0.0%) |
| Graduate Degree | 46 (100.0%) | 0 (0.0%) |
| Total | 46 (73.0%) | 17 (27.0%) |
Employment Characteristics in Hartwell
Employment by Class of Employer in Hartwell
Among the 2,043 employed individuals in Hartwell, private company employees (1,517 | 74.3%), local government employees (167 | 8.2%), and self-employed (not incorporated) (109 | 5.3%) make up the most common classes of employment.
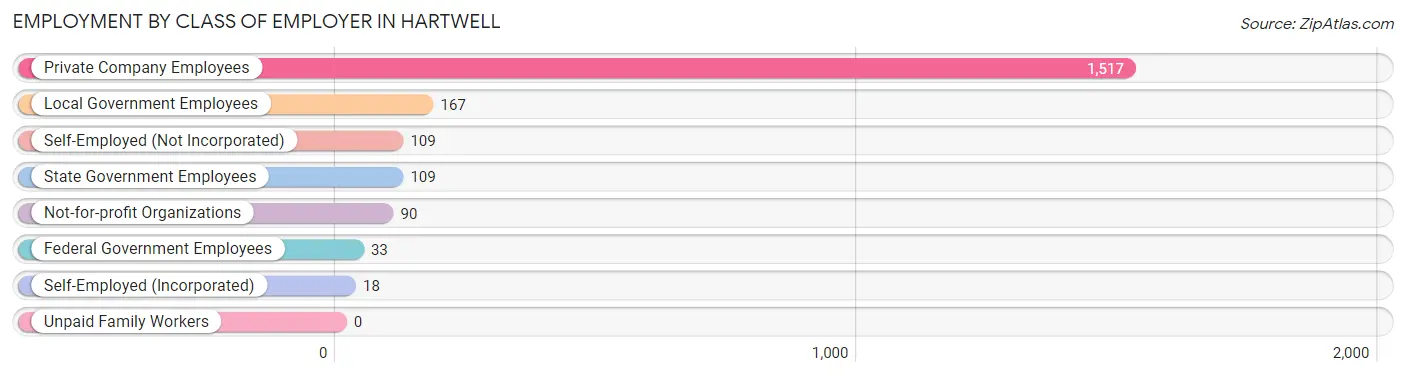
| Employer Class | # Employees | % Employees |
| Private Company Employees | 1,517 | 74.3% |
| Self-Employed (Incorporated) | 18 | 0.9% |
| Self-Employed (Not Incorporated) | 109 | 5.3% |
| Not-for-profit Organizations | 90 | 4.4% |
| Local Government Employees | 167 | 8.2% |
| State Government Employees | 109 | 5.3% |
| Federal Government Employees | 33 | 1.6% |
| Unpaid Family Workers | 0 | 0.0% |
| Total | 2,043 | 100.0% |
Employment Status by Age in Hartwell
According to the labor force statistics for Hartwell, out of the total population over 16 years of age (3,637), 57.2% or 2,080 individuals are in the labor force, with 0.3% or 6 of them unemployed. The age group with the highest labor force participation rate is 25 to 29 years, with 97.8% or 450 individuals in the labor force. Within the labor force, the 25 to 29 years age range has the highest percentage of unemployed individuals, with 1.6% or 7 of them being unemployed.
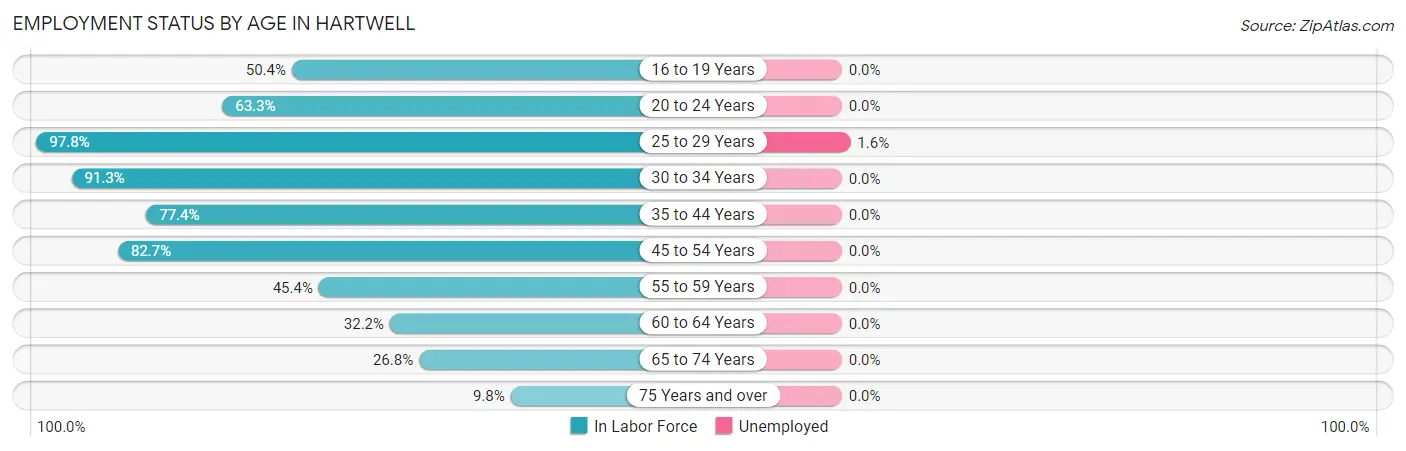
| Age Bracket | In Labor Force | Unemployed |
| 16 to 19 Years | 69 (50.4%) | 0 (0.0%) |
| 20 to 24 Years | 133 (63.3%) | 0 (0.0%) |
| 25 to 29 Years | 450 (97.8%) | 7 (1.6%) |
| 30 to 34 Years | 232 (91.3%) | 0 (0.0%) |
| 35 to 44 Years | 318 (77.4%) | 0 (0.0%) |
| 45 to 54 Years | 473 (82.7%) | 0 (0.0%) |
| 55 to 59 Years | 124 (45.4%) | 0 (0.0%) |
| 60 to 64 Years | 77 (32.2%) | 0 (0.0%) |
| 65 to 74 Years | 153 (26.8%) | 0 (0.0%) |
| 75 Years and over | 50 (9.8%) | 0 (0.0%) |
| Total | 2,080 (57.2%) | 6 (0.3%) |
Employment Status by Educational Attainment in Hartwell
According to labor force statistics for Hartwell, 75.8% of individuals (1,674) out of the total population between 25 and 64 years of age (2,209) are in the labor force, with 0.4% or 7 of them being unemployed. The group with the highest labor force participation rate are those with the educational attainment of bachelor's degree or higher, with 96.5% or 301 individuals in the labor force. Within the labor force, individuals with high school diploma education have the highest percentage of unemployment, with 1.3% or 7 of them being unemployed.
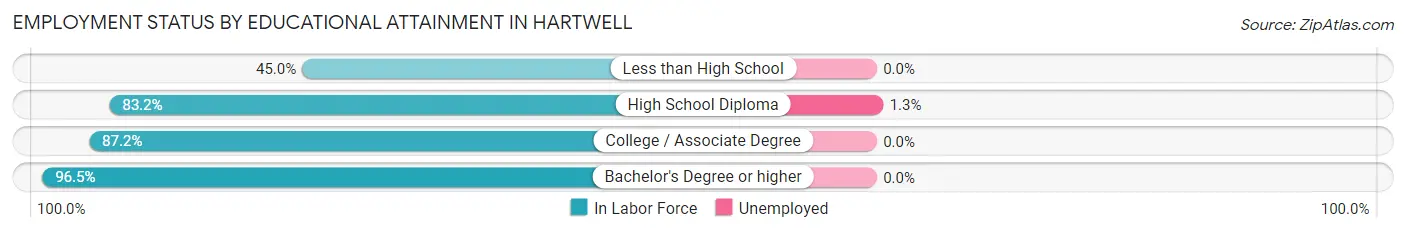
| Educational Attainment | In Labor Force | Unemployed |
| Less than High School | 272 (45.0%) | 0 (0.0%) |
| High School Diploma | 529 (83.2%) | 8 (1.3%) |
| College / Associate Degree | 572 (87.2%) | 0 (0.0%) |
| Bachelor's Degree or higher | 301 (96.5%) | 0 (0.0%) |
| Total | 1,674 (75.8%) | 9 (0.4%) |
Employment Occupations by Sex in Hartwell
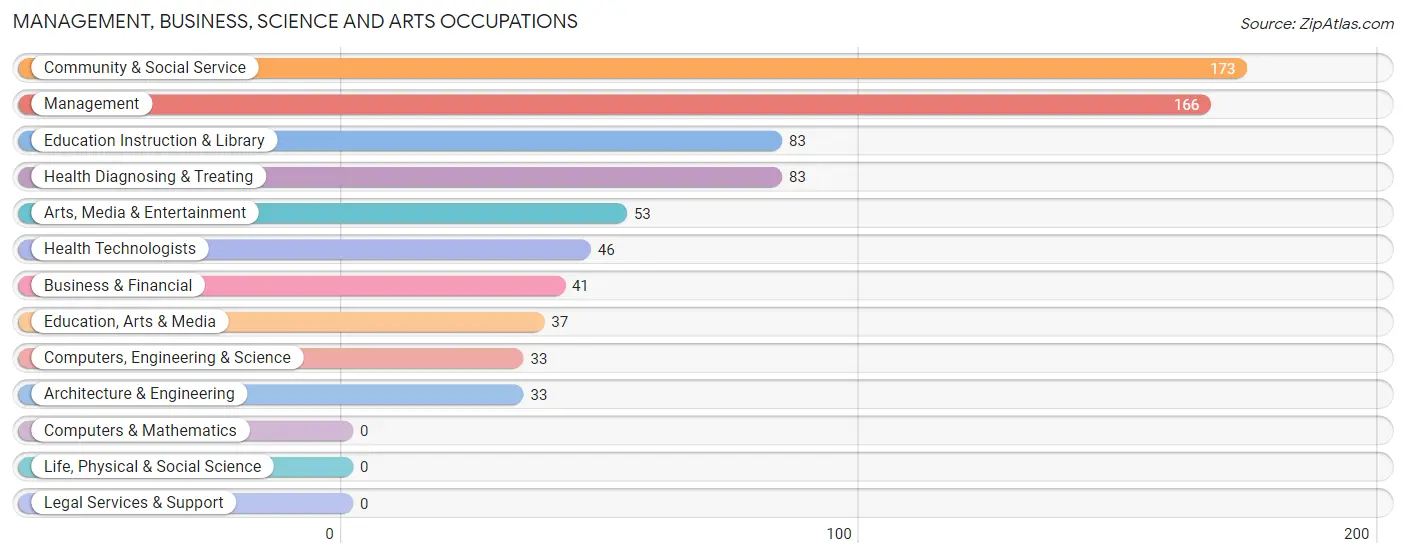
Management, Business, Science and Arts Occupations
The most common Management, Business, Science and Arts occupations in Hartwell are Community & Social Service (173 | 8.4%), Management (166 | 8.1%), Education Instruction & Library (83 | 4.0%), Health Diagnosing & Treating (83 | 4.0%), and Arts, Media & Entertainment (53 | 2.6%).
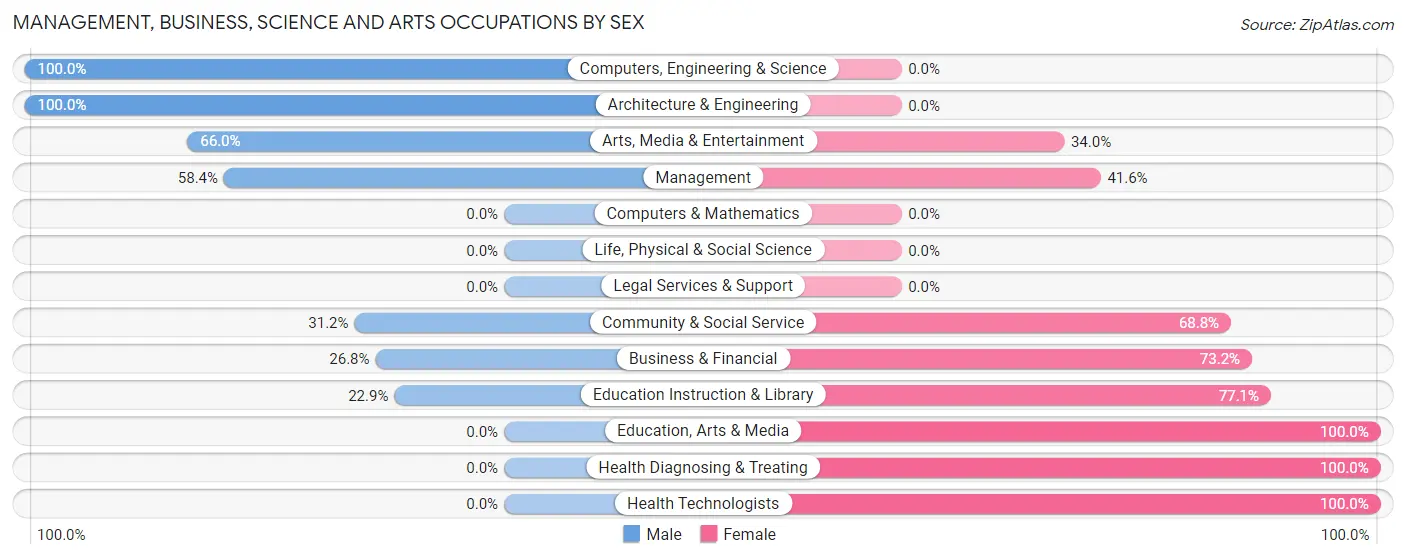
Management, Business, Science and Arts Occupations by Sex
Within the Management, Business, Science and Arts occupations in Hartwell, the most male-oriented occupations are Computers, Engineering & Science (100.0%), Architecture & Engineering (100.0%), and Arts, Media & Entertainment (66.0%), while the most female-oriented occupations are Education, Arts & Media (100.0%), Health Diagnosing & Treating (100.0%), and Health Technologists (100.0%).
| Occupation | Male | Female |
| Management | 97 (58.4%) | 69 (41.6%) |
| Business & Financial | 11 (26.8%) | 30 (73.2%) |
| Computers, Engineering & Science | 33 (100.0%) | 0 (0.0%) |
| Computers & Mathematics | 0 (0.0%) | 0 (0.0%) |
| Architecture & Engineering | 33 (100.0%) | 0 (0.0%) |
| Life, Physical & Social Science | 0 (0.0%) | 0 (0.0%) |
| Community & Social Service | 54 (31.2%) | 119 (68.8%) |
| Education, Arts & Media | 0 (0.0%) | 37 (100.0%) |
| Legal Services & Support | 0 (0.0%) | 0 (0.0%) |
| Education Instruction & Library | 19 (22.9%) | 64 (77.1%) |
| Arts, Media & Entertainment | 35 (66.0%) | 18 (34.0%) |
| Health Diagnosing & Treating | 0 (0.0%) | 83 (100.0%) |
| Health Technologists | 0 (0.0%) | 46 (100.0%) |
| Total (Category) | 195 (39.3%) | 301 (60.7%) |
| Total (Overall) | 1,065 (51.9%) | 988 (48.1%) |
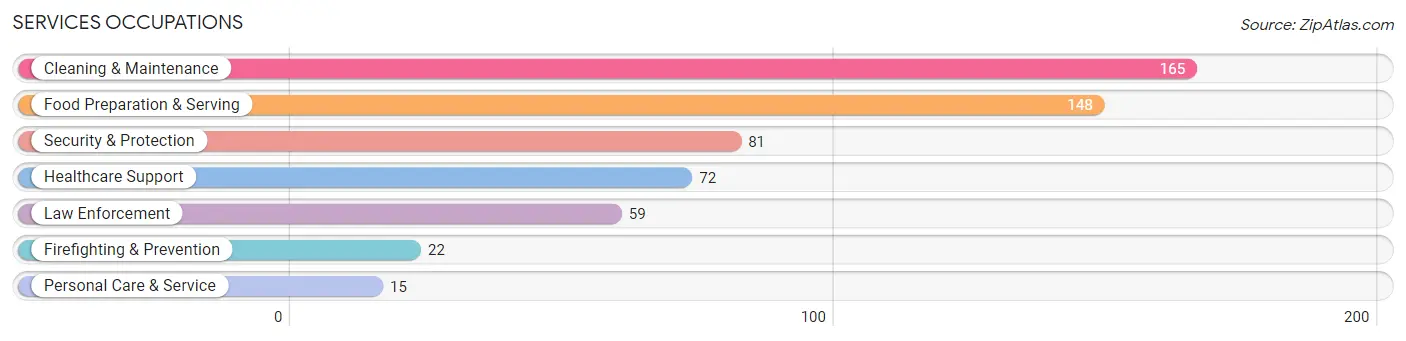
Services Occupations
The most common Services occupations in Hartwell are Cleaning & Maintenance (165 | 8.0%), Food Preparation & Serving (148 | 7.2%), Security & Protection (81 | 4.0%), Healthcare Support (72 | 3.5%), and Law Enforcement (59 | 2.9%).
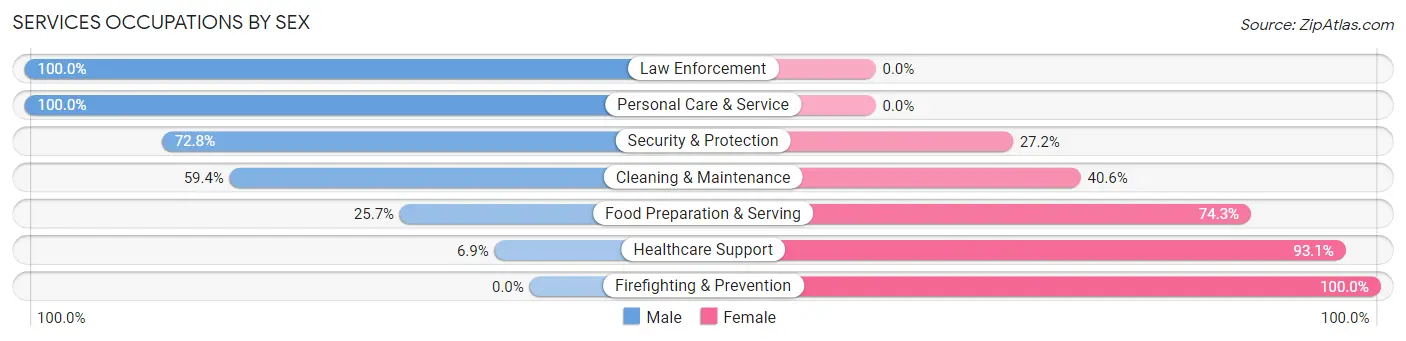
Services Occupations by Sex
Within the Services occupations in Hartwell, the most male-oriented occupations are Law Enforcement (100.0%), Personal Care & Service (100.0%), and Security & Protection (72.8%), while the most female-oriented occupations are Firefighting & Prevention (100.0%), Healthcare Support (93.1%), and Food Preparation & Serving (74.3%).
| Occupation | Male | Female |
| Healthcare Support | 5 (6.9%) | 67 (93.1%) |
| Security & Protection | 59 (72.8%) | 22 (27.2%) |
| Firefighting & Prevention | 0 (0.0%) | 22 (100.0%) |
| Law Enforcement | 59 (100.0%) | 0 (0.0%) |
| Food Preparation & Serving | 38 (25.7%) | 110 (74.3%) |
| Cleaning & Maintenance | 98 (59.4%) | 67 (40.6%) |
| Personal Care & Service | 15 (100.0%) | 0 (0.0%) |
| Total (Category) | 215 (44.7%) | 266 (55.3%) |
| Total (Overall) | 1,065 (51.9%) | 988 (48.1%) |
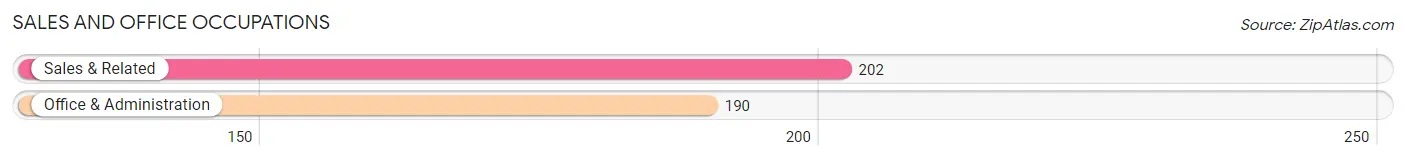
Sales and Office Occupations
The most common Sales and Office occupations in Hartwell are Sales & Related (202 | 9.8%), and Office & Administration (190 | 9.2%).
Sales and Office Occupations by Sex
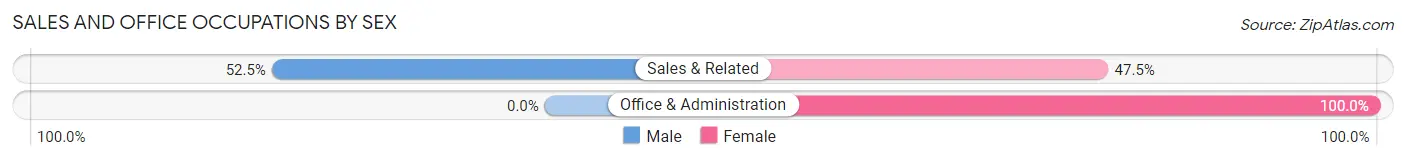
| Occupation | Male | Female |
| Sales & Related | 106 (52.5%) | 96 (47.5%) |
| Office & Administration | 0 (0.0%) | 190 (100.0%) |
| Total (Category) | 106 (27.0%) | 286 (73.0%) |
| Total (Overall) | 1,065 (51.9%) | 988 (48.1%) |
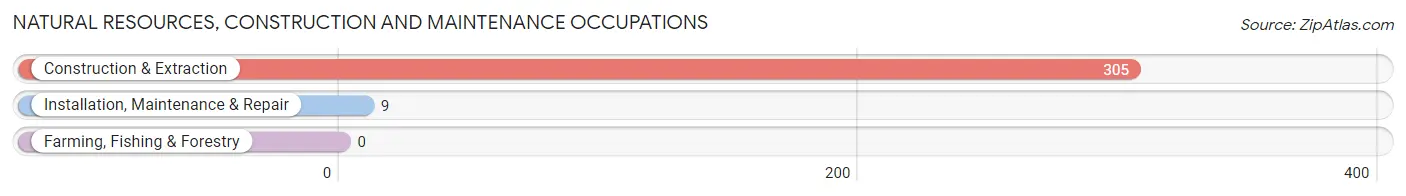
Natural Resources, Construction and Maintenance Occupations
The most common Natural Resources, Construction and Maintenance occupations in Hartwell are Construction & Extraction (305 | 14.9%), and Installation, Maintenance & Repair (9 | 0.4%).
Natural Resources, Construction and Maintenance Occupations by Sex
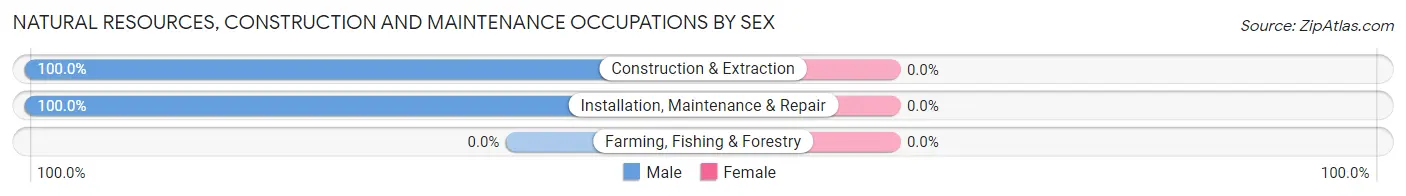
| Occupation | Male | Female |
| Farming, Fishing & Forestry | 0 (0.0%) | 0 (0.0%) |
| Construction & Extraction | 305 (100.0%) | 0 (0.0%) |
| Installation, Maintenance & Repair | 9 (100.0%) | 0 (0.0%) |
| Total (Category) | 314 (100.0%) | 0 (0.0%) |
| Total (Overall) | 1,065 (51.9%) | 988 (48.1%) |
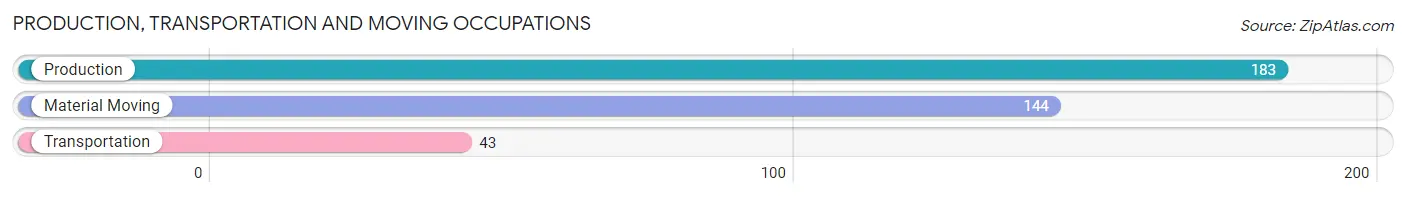
Production, Transportation and Moving Occupations
The most common Production, Transportation and Moving occupations in Hartwell are Production (183 | 8.9%), Material Moving (144 | 7.0%), and Transportation (43 | 2.1%).
Production, Transportation and Moving Occupations by Sex
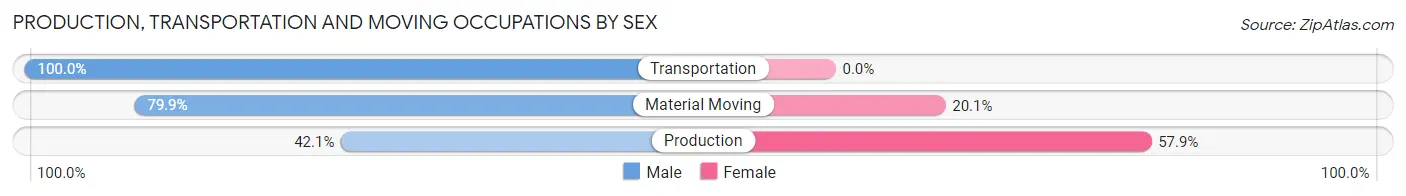
| Occupation | Male | Female |
| Production | 77 (42.1%) | 106 (57.9%) |
| Transportation | 43 (100.0%) | 0 (0.0%) |
| Material Moving | 115 (79.9%) | 29 (20.1%) |
| Total (Category) | 235 (63.5%) | 135 (36.5%) |
| Total (Overall) | 1,065 (51.9%) | 988 (48.1%) |
Employment Industries by Sex in Hartwell
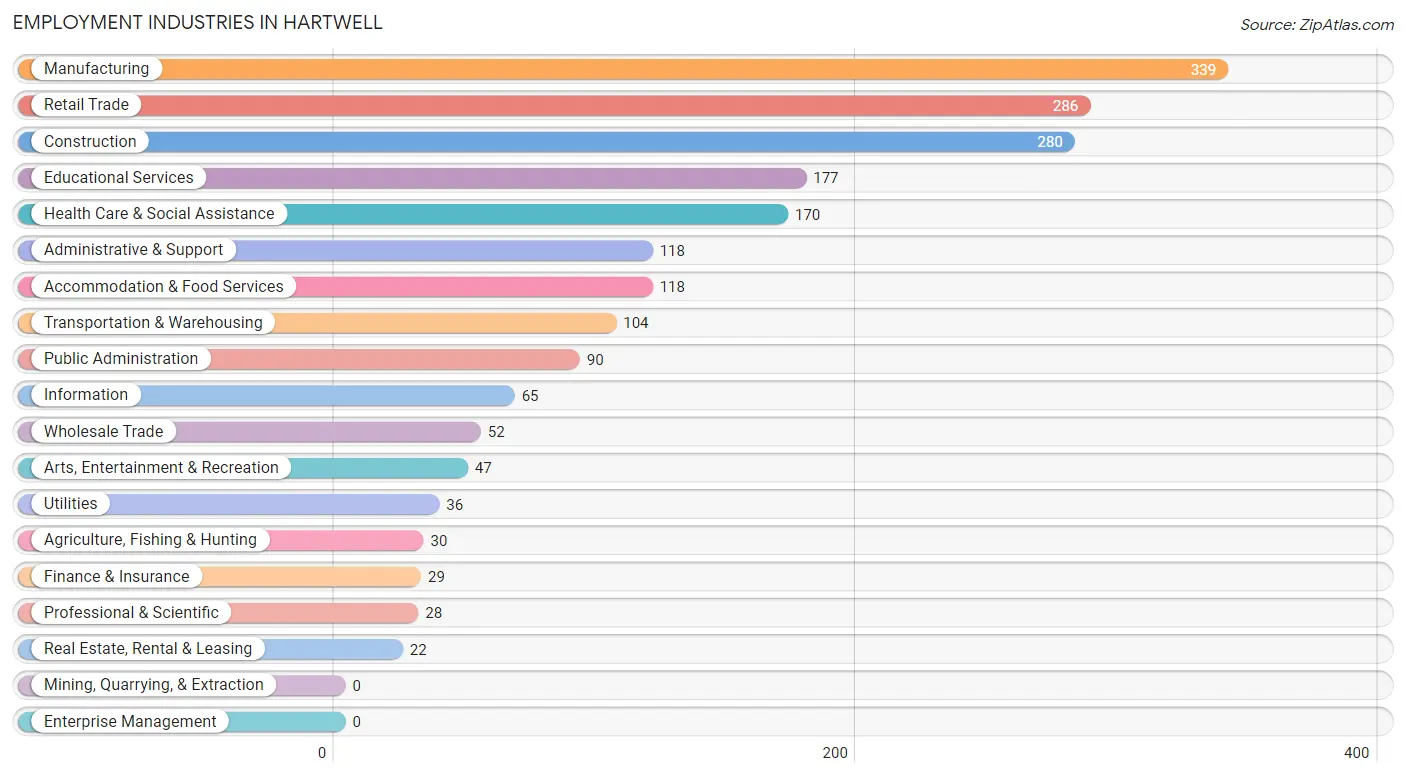
Employment Industries in Hartwell
The major employment industries in Hartwell include Manufacturing (339 | 16.5%), Retail Trade (286 | 13.9%), Construction (280 | 13.6%), Educational Services (177 | 8.6%), and Health Care & Social Assistance (170 | 8.3%).
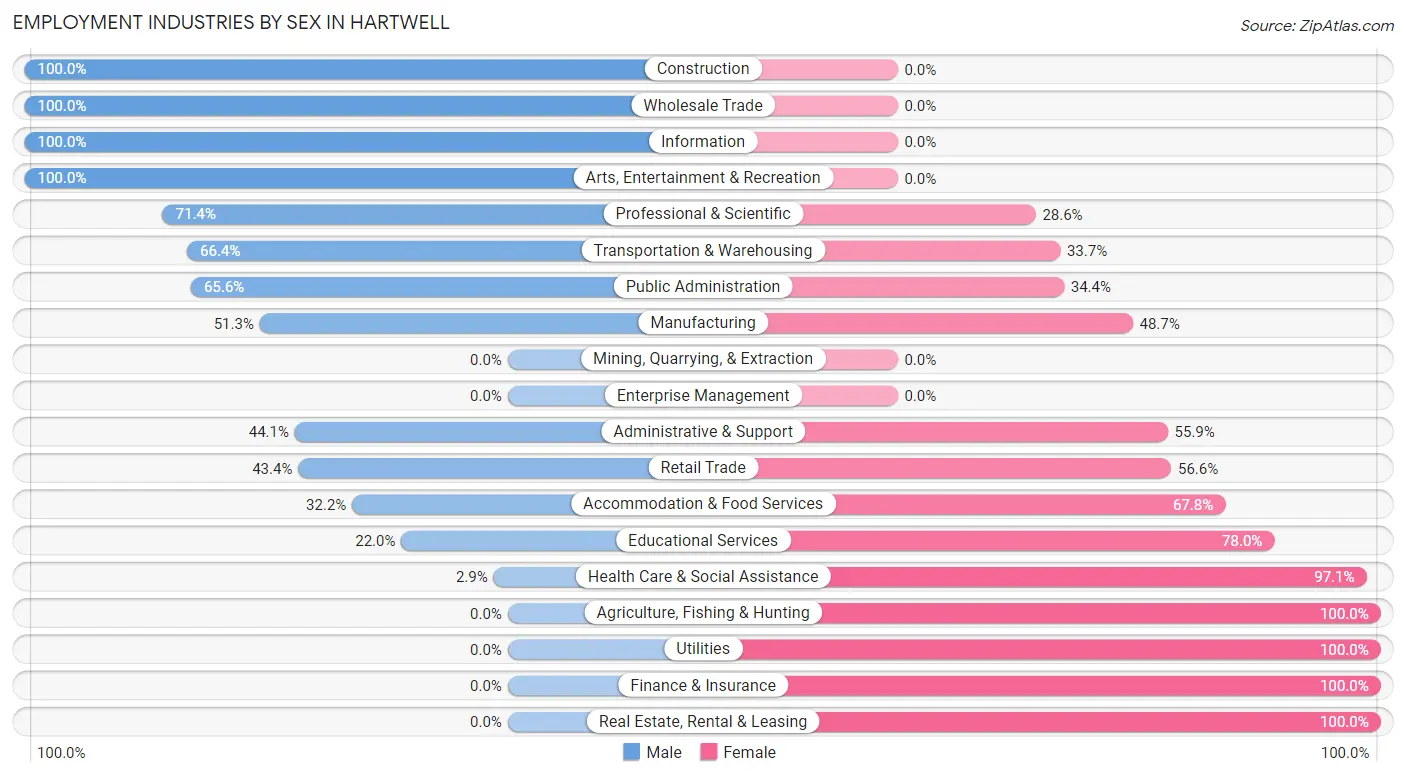
Employment Industries by Sex in Hartwell
The Hartwell industries that see more men than women are Construction (100.0%), Wholesale Trade (100.0%), and Information (100.0%), whereas the industries that tend to have a higher number of women are Agriculture, Fishing & Hunting (100.0%), Utilities (100.0%), and Finance & Insurance (100.0%).
| Industry | Male | Female |
| Agriculture, Fishing & Hunting | 0 (0.0%) | 30 (100.0%) |
| Mining, Quarrying, & Extraction | 0 (0.0%) | 0 (0.0%) |
| Construction | 280 (100.0%) | 0 (0.0%) |
| Manufacturing | 174 (51.3%) | 165 (48.7%) |
| Wholesale Trade | 52 (100.0%) | 0 (0.0%) |
| Retail Trade | 124 (43.4%) | 162 (56.6%) |
| Transportation & Warehousing | 69 (66.3%) | 35 (33.7%) |
| Utilities | 0 (0.0%) | 36 (100.0%) |
| Information | 65 (100.0%) | 0 (0.0%) |
| Finance & Insurance | 0 (0.0%) | 29 (100.0%) |
| Real Estate, Rental & Leasing | 0 (0.0%) | 22 (100.0%) |
| Professional & Scientific | 20 (71.4%) | 8 (28.6%) |
| Enterprise Management | 0 (0.0%) | 0 (0.0%) |
| Administrative & Support | 52 (44.1%) | 66 (55.9%) |
| Educational Services | 39 (22.0%) | 138 (78.0%) |
| Health Care & Social Assistance | 5 (2.9%) | 165 (97.1%) |
| Arts, Entertainment & Recreation | 47 (100.0%) | 0 (0.0%) |
| Accommodation & Food Services | 38 (32.2%) | 80 (67.8%) |
| Public Administration | 59 (65.6%) | 31 (34.4%) |
| Total | 1,065 (51.9%) | 988 (48.1%) |
Education in Hartwell
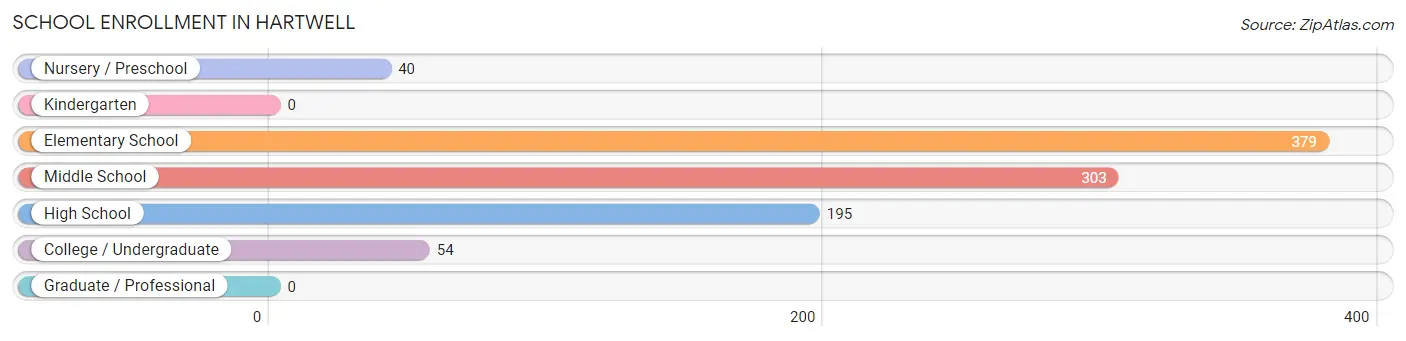
School Enrollment in Hartwell
The most common levels of schooling among the 971 students in Hartwell are elementary school (379 | 39.0%), middle school (303 | 31.2%), and high school (195 | 20.1%).
| School Level | # Students | % Students |
| Nursery / Preschool | 40 | 4.1% |
| Kindergarten | 0 | 0.0% |
| Elementary School | 379 | 39.0% |
| Middle School | 303 | 31.2% |
| High School | 195 | 20.1% |
| College / Undergraduate | 54 | 5.6% |
| Graduate / Professional | 0 | 0.0% |
| Total | 971 | 100.0% |
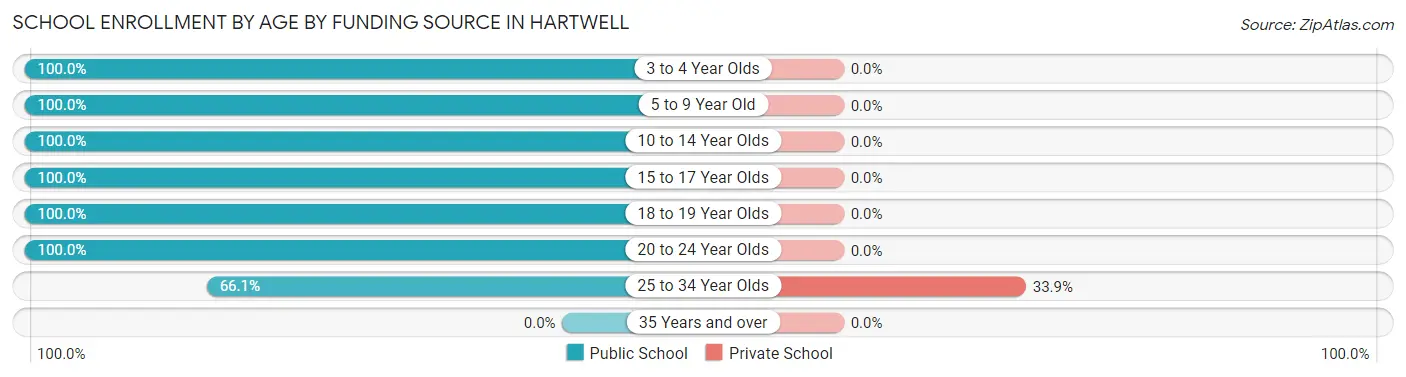
School Enrollment by Age by Funding Source in Hartwell
Out of a total of 971 students who are enrolled in schools in Hartwell, 19 (2.0%) attend a private institution, while the remaining 952 (98.0%) are enrolled in public schools. The age group of 25 to 34 year olds has the highest likelihood of being enrolled in private schools, with 19 (33.9% in the age bracket) enrolled. Conversely, the age group of 3 to 4 year olds has the lowest likelihood of being enrolled in a private school, with 27 (100.0% in the age bracket) attending a public institution.
| Age Bracket | Public School | Private School |
| 3 to 4 Year Olds | 27 (100.0%) | 0 (0.0%) |
| 5 to 9 Year Old | 361 (100.0%) | 0 (0.0%) |
| 10 to 14 Year Olds | 351 (100.0%) | 0 (0.0%) |
| 15 to 17 Year Olds | 113 (100.0%) | 0 (0.0%) |
| 18 to 19 Year Olds | 9 (100.0%) | 0 (0.0%) |
| 20 to 24 Year Olds | 54 (100.0%) | 0 (0.0%) |
| 25 to 34 Year Olds | 37 (66.1%) | 19 (33.9%) |
| 35 Years and over | 0 (0.0%) | 0 (0.0%) |
| Total | 952 (98.0%) | 19 (2.0%) |
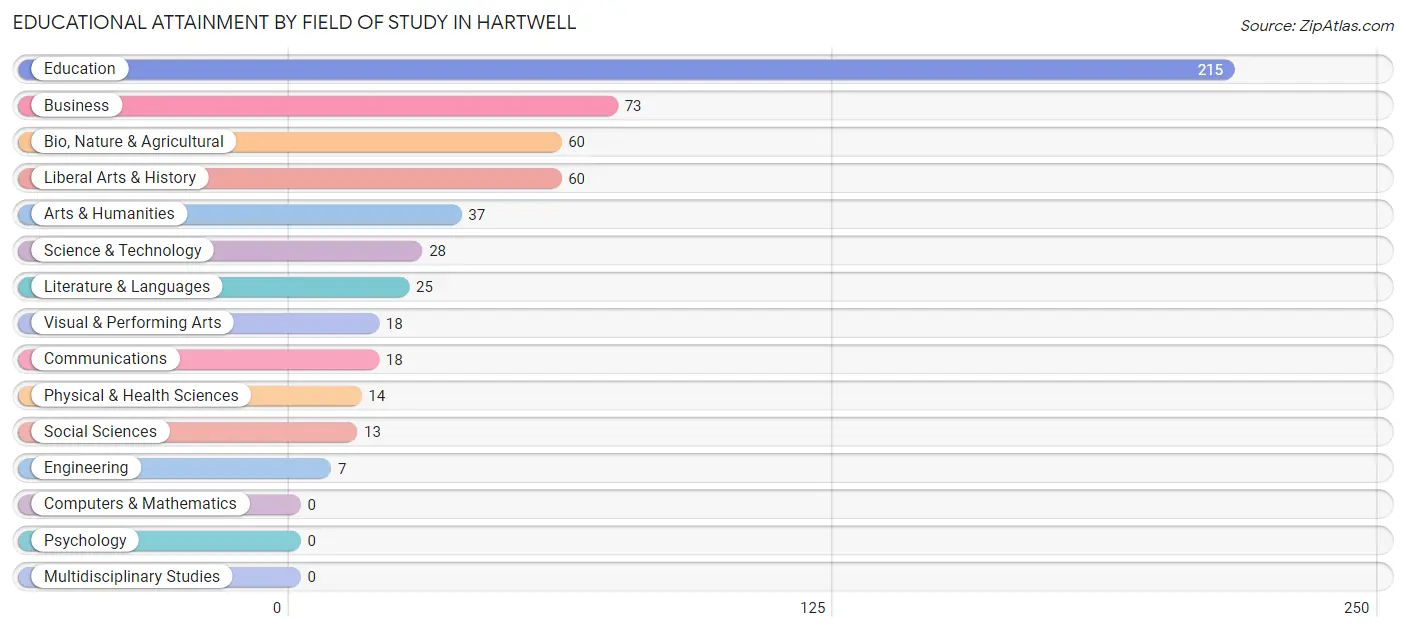
Educational Attainment by Field of Study in Hartwell
Education (215 | 37.9%), business (73 | 12.9%), bio, nature & agricultural (60 | 10.6%), liberal arts & history (60 | 10.6%), and arts & humanities (37 | 6.5%) are the most common fields of study among 568 individuals in Hartwell who have obtained a bachelor's degree or higher.
| Field of Study | # Graduates | % Graduates |
| Computers & Mathematics | 0 | 0.0% |
| Bio, Nature & Agricultural | 60 | 10.6% |
| Physical & Health Sciences | 14 | 2.5% |
| Psychology | 0 | 0.0% |
| Social Sciences | 13 | 2.3% |
| Engineering | 7 | 1.2% |
| Multidisciplinary Studies | 0 | 0.0% |
| Science & Technology | 28 | 4.9% |
| Business | 73 | 12.9% |
| Education | 215 | 37.9% |
| Literature & Languages | 25 | 4.4% |
| Liberal Arts & History | 60 | 10.6% |
| Visual & Performing Arts | 18 | 3.2% |
| Communications | 18 | 3.2% |
| Arts & Humanities | 37 | 6.5% |
| Total | 568 | 100.0% |
Transportation & Commute in Hartwell
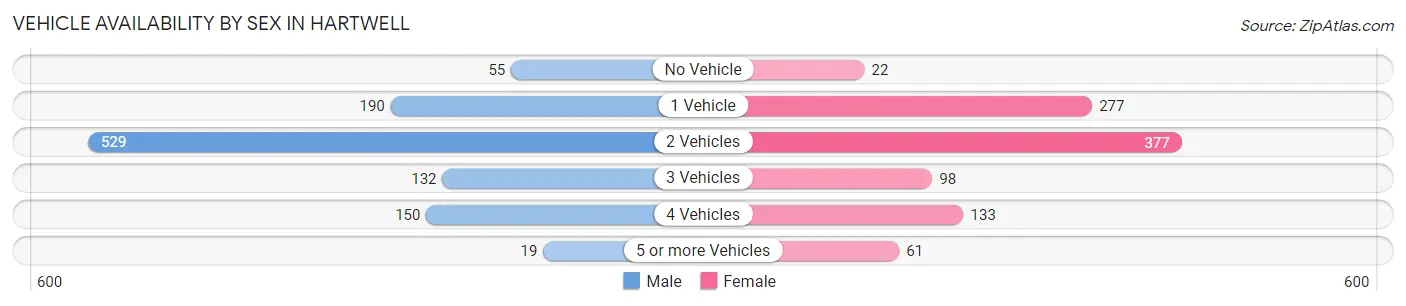
Vehicle Availability by Sex in Hartwell
The most prevalent vehicle ownership categories in Hartwell are males with 2 vehicles (529, accounting for 49.2%) and females with 2 vehicles (377, making up 54.6%).
| Vehicles Available | Male | Female |
| No Vehicle | 55 (5.1%) | 22 (2.3%) |
| 1 Vehicle | 190 (17.7%) | 277 (28.6%) |
| 2 Vehicles | 529 (49.2%) | 377 (39.0%) |
| 3 Vehicles | 132 (12.3%) | 98 (10.1%) |
| 4 Vehicles | 150 (14.0%) | 133 (13.7%) |
| 5 or more Vehicles | 19 (1.8%) | 61 (6.3%) |
| Total | 1,075 (100.0%) | 968 (100.0%) |
Commute Time in Hartwell
The most frequently occuring commute durations in Hartwell are 5 to 9 minutes (462 commuters, 23.0%), 15 to 19 minutes (314 commuters, 15.6%), and 20 to 24 minutes (309 commuters, 15.4%).
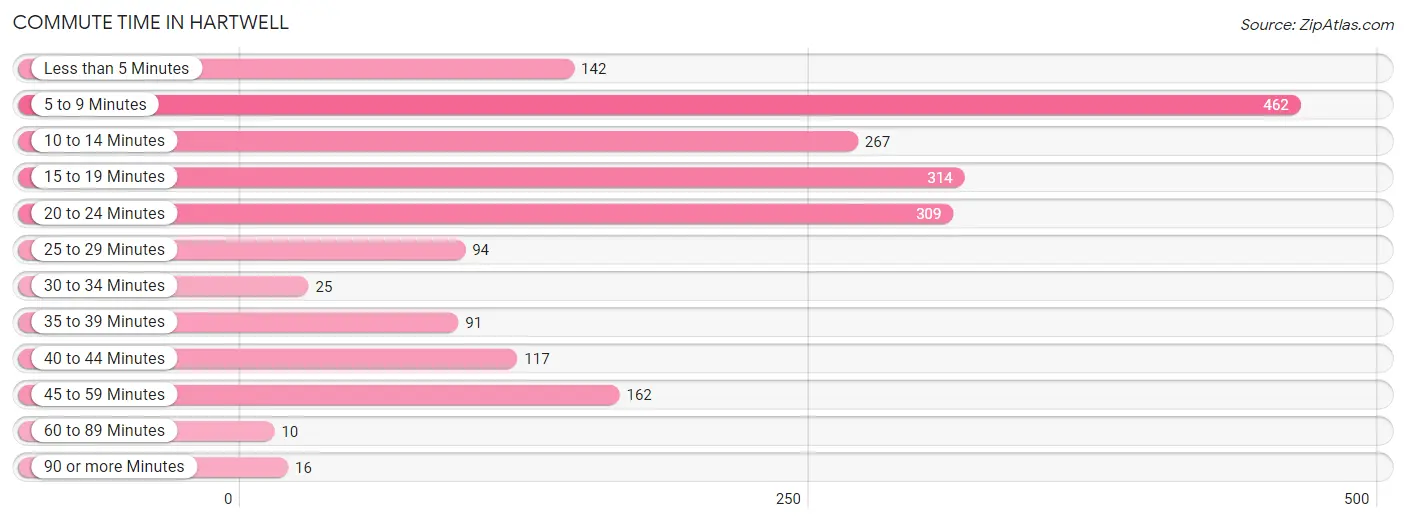
| Commute Time | # Commuters | % Commuters |
| Less than 5 Minutes | 142 | 7.1% |
| 5 to 9 Minutes | 462 | 23.0% |
| 10 to 14 Minutes | 267 | 13.3% |
| 15 to 19 Minutes | 314 | 15.6% |
| 20 to 24 Minutes | 309 | 15.4% |
| 25 to 29 Minutes | 94 | 4.7% |
| 30 to 34 Minutes | 25 | 1.2% |
| 35 to 39 Minutes | 91 | 4.5% |
| 40 to 44 Minutes | 117 | 5.8% |
| 45 to 59 Minutes | 162 | 8.1% |
| 60 to 89 Minutes | 10 | 0.5% |
| 90 or more Minutes | 16 | 0.8% |
Commute Time by Sex in Hartwell
The most common commute times in Hartwell are 20 to 24 minutes (271 commuters, 26.0%) for males and 5 to 9 minutes (269 commuters, 27.8%) for females.
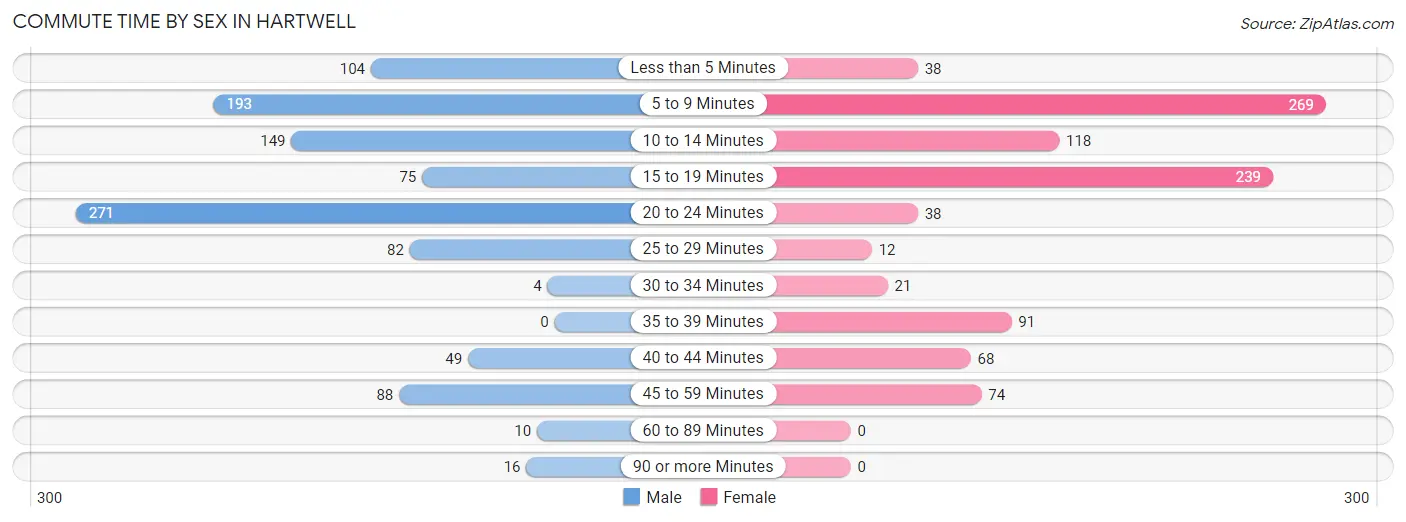
| Commute Time | Male | Female |
| Less than 5 Minutes | 104 (10.0%) | 38 (3.9%) |
| 5 to 9 Minutes | 193 (18.5%) | 269 (27.8%) |
| 10 to 14 Minutes | 149 (14.3%) | 118 (12.2%) |
| 15 to 19 Minutes | 75 (7.2%) | 239 (24.7%) |
| 20 to 24 Minutes | 271 (26.0%) | 38 (3.9%) |
| 25 to 29 Minutes | 82 (7.9%) | 12 (1.2%) |
| 30 to 34 Minutes | 4 (0.4%) | 21 (2.2%) |
| 35 to 39 Minutes | 0 (0.0%) | 91 (9.4%) |
| 40 to 44 Minutes | 49 (4.7%) | 68 (7.0%) |
| 45 to 59 Minutes | 88 (8.5%) | 74 (7.6%) |
| 60 to 89 Minutes | 10 (1.0%) | 0 (0.0%) |
| 90 or more Minutes | 16 (1.5%) | 0 (0.0%) |
Time of Departure to Work by Sex in Hartwell
The most frequent times of departure to work in Hartwell are 9:00 AM to 9:59 AM (318, 30.5%) for males and 7:30 AM to 7:59 AM (265, 27.4%) for females.
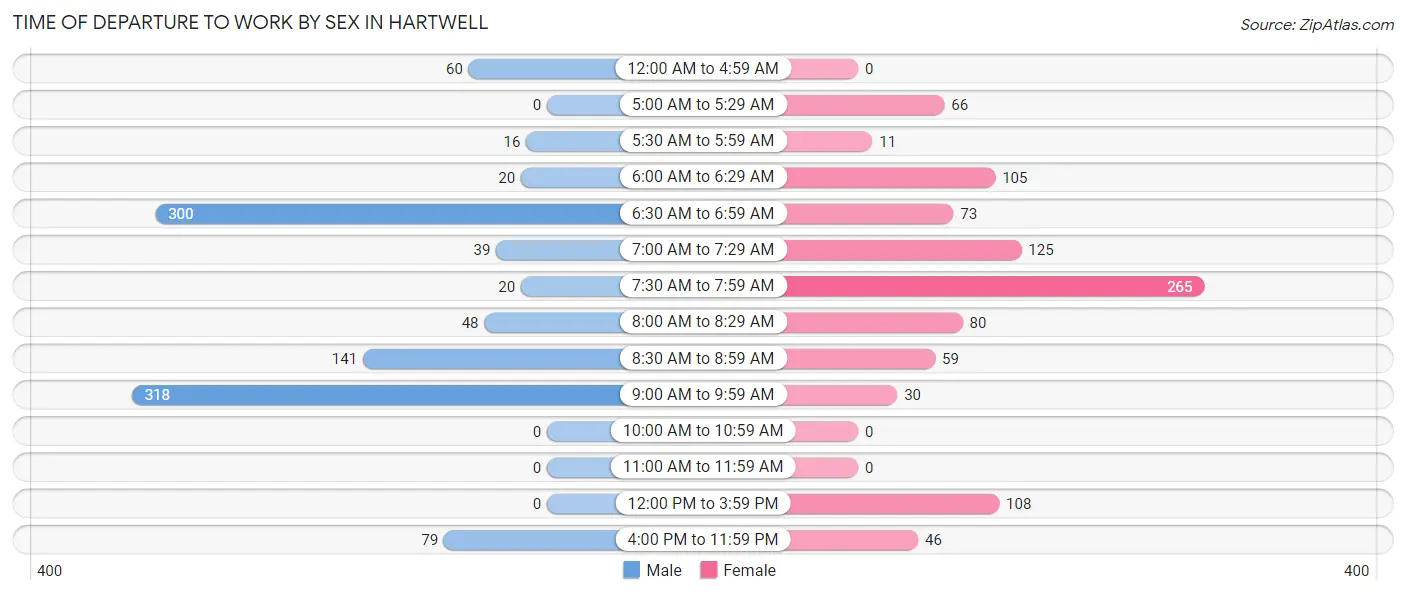
| Time of Departure | Male | Female |
| 12:00 AM to 4:59 AM | 60 (5.8%) | 0 (0.0%) |
| 5:00 AM to 5:29 AM | 0 (0.0%) | 66 (6.8%) |
| 5:30 AM to 5:59 AM | 16 (1.5%) | 11 (1.1%) |
| 6:00 AM to 6:29 AM | 20 (1.9%) | 105 (10.8%) |
| 6:30 AM to 6:59 AM | 300 (28.8%) | 73 (7.5%) |
| 7:00 AM to 7:29 AM | 39 (3.7%) | 125 (12.9%) |
| 7:30 AM to 7:59 AM | 20 (1.9%) | 265 (27.4%) |
| 8:00 AM to 8:29 AM | 48 (4.6%) | 80 (8.3%) |
| 8:30 AM to 8:59 AM | 141 (13.5%) | 59 (6.1%) |
| 9:00 AM to 9:59 AM | 318 (30.5%) | 30 (3.1%) |
| 10:00 AM to 10:59 AM | 0 (0.0%) | 0 (0.0%) |
| 11:00 AM to 11:59 AM | 0 (0.0%) | 0 (0.0%) |
| 12:00 PM to 3:59 PM | 0 (0.0%) | 108 (11.2%) |
| 4:00 PM to 11:59 PM | 79 (7.6%) | 46 (4.8%) |
| Total | 1,041 (100.0%) | 968 (100.0%) |
Housing Occupancy in Hartwell
Occupancy by Ownership in Hartwell
Of the total 1,850 dwellings in Hartwell, owner-occupied units account for 985 (53.2%), while renter-occupied units make up 865 (46.8%).
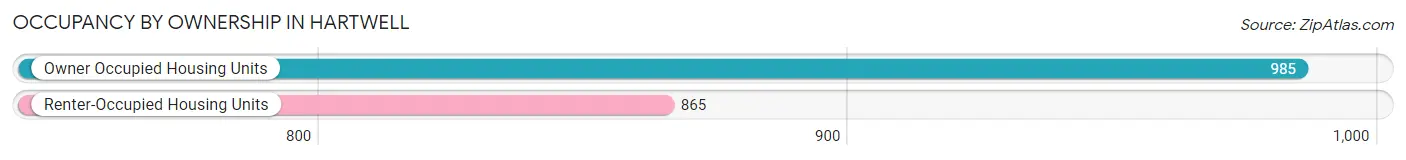
| Occupancy | # Housing Units | % Housing Units |
| Owner Occupied Housing Units | 985 | 53.2% |
| Renter-Occupied Housing Units | 865 | 46.8% |
| Total Occupied Housing Units | 1,850 | 100.0% |
Occupancy by Household Size in Hartwell
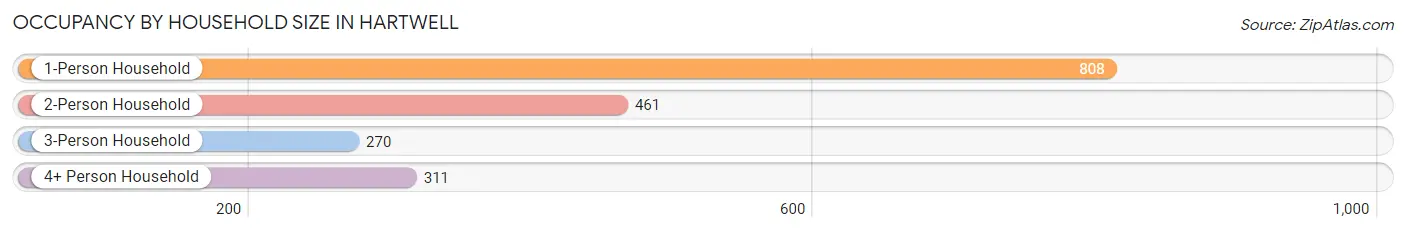
| Household Size | # Housing Units | % Housing Units |
| 1-Person Household | 808 | 43.7% |
| 2-Person Household | 461 | 24.9% |
| 3-Person Household | 270 | 14.6% |
| 4+ Person Household | 311 | 16.8% |
| Total Housing Units | 1,850 | 100.0% |
Occupancy by Ownership by Household Size in Hartwell
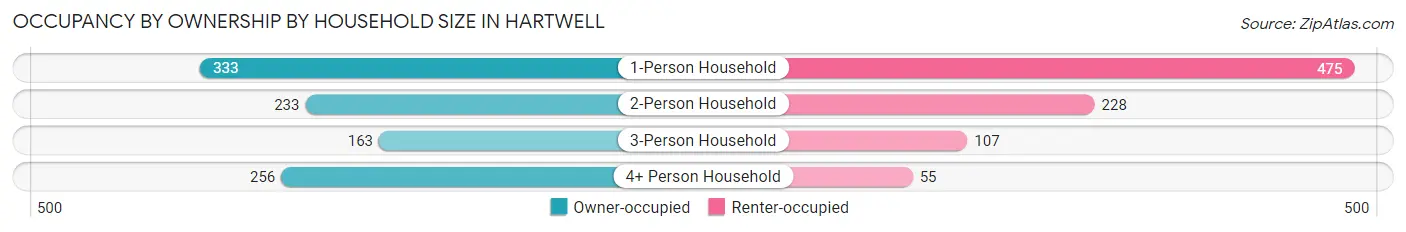
| Household Size | Owner-occupied | Renter-occupied |
| 1-Person Household | 333 (41.2%) | 475 (58.8%) |
| 2-Person Household | 233 (50.5%) | 228 (49.5%) |
| 3-Person Household | 163 (60.4%) | 107 (39.6%) |
| 4+ Person Household | 256 (82.3%) | 55 (17.7%) |
| Total Housing Units | 985 (53.2%) | 865 (46.8%) |
Occupancy by Educational Attainment in Hartwell
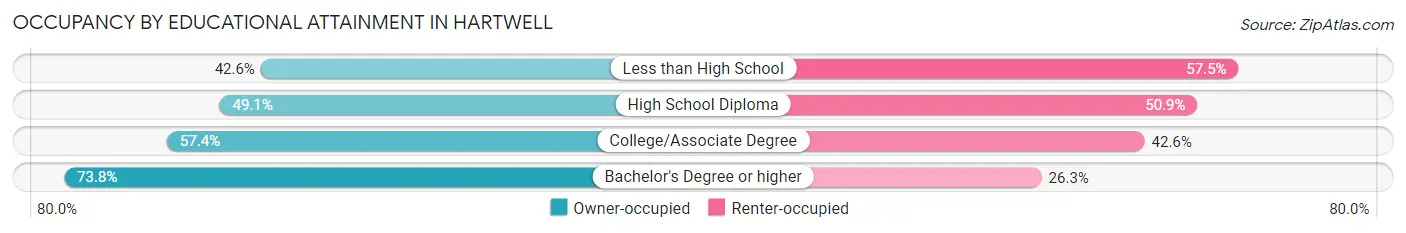
| Household Size | Owner-occupied | Renter-occupied |
| Less than High School | 234 (42.5%) | 316 (57.5%) |
| High School Diploma | 262 (49.1%) | 272 (50.9%) |
| College/Associate Degree | 267 (57.4%) | 198 (42.6%) |
| Bachelor's Degree or higher | 222 (73.8%) | 79 (26.3%) |
Occupancy by Age of Householder in Hartwell
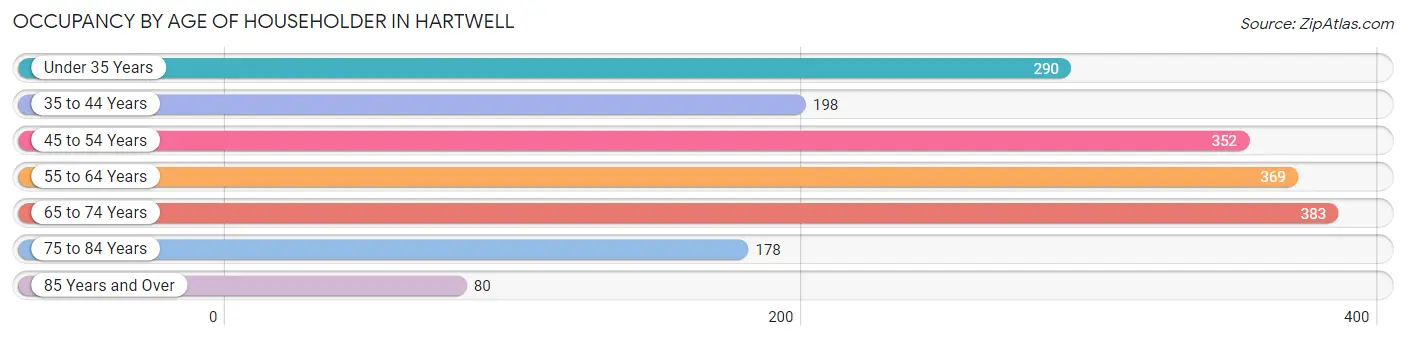
| Age Bracket | # Households | % Households |
| Under 35 Years | 290 | 15.7% |
| 35 to 44 Years | 198 | 10.7% |
| 45 to 54 Years | 352 | 19.0% |
| 55 to 64 Years | 369 | 20.0% |
| 65 to 74 Years | 383 | 20.7% |
| 75 to 84 Years | 178 | 9.6% |
| 85 Years and Over | 80 | 4.3% |
| Total | 1,850 | 100.0% |
Housing Finances in Hartwell
Median Income by Occupancy in Hartwell
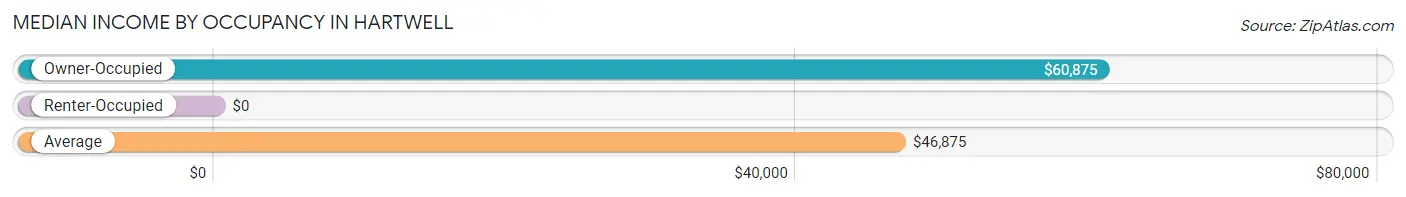
| Occupancy Type | # Households | Median Income |
| Owner-Occupied | 985 (53.2%) | $60,875 |
| Renter-Occupied | 865 (46.8%) | $0 |
| Average | 1,850 (100.0%) | $46,875 |
Occupancy by Householder Income Bracket in Hartwell
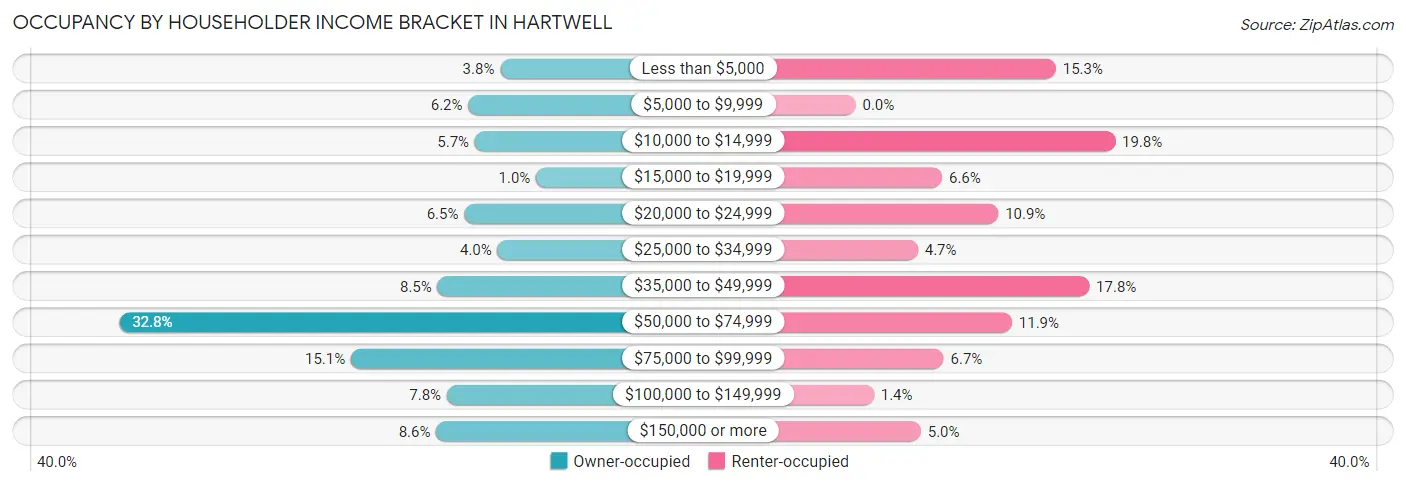
| Income Bracket | Owner-occupied | Renter-occupied |
| Less than $5,000 | 37 (3.8%) | 132 (15.3%) |
| $5,000 to $9,999 | 61 (6.2%) | 0 (0.0%) |
| $10,000 to $14,999 | 56 (5.7%) | 171 (19.8%) |
| $15,000 to $19,999 | 10 (1.0%) | 57 (6.6%) |
| $20,000 to $24,999 | 64 (6.5%) | 94 (10.9%) |
| $25,000 to $34,999 | 39 (4.0%) | 41 (4.7%) |
| $35,000 to $49,999 | 84 (8.5%) | 154 (17.8%) |
| $50,000 to $74,999 | 323 (32.8%) | 103 (11.9%) |
| $75,000 to $99,999 | 149 (15.1%) | 58 (6.7%) |
| $100,000 to $149,999 | 77 (7.8%) | 12 (1.4%) |
| $150,000 or more | 85 (8.6%) | 43 (5.0%) |
| Total | 985 (100.0%) | 865 (100.0%) |
Monthly Housing Cost Tiers in Hartwell
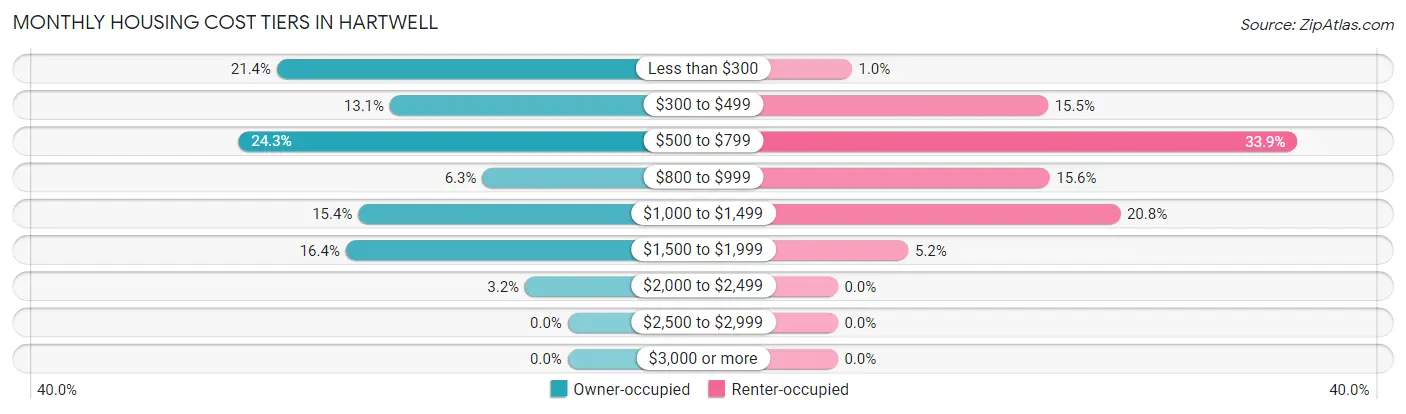
| Monthly Cost | Owner-occupied | Renter-occupied |
| Less than $300 | 211 (21.4%) | 9 (1.0%) |
| $300 to $499 | 129 (13.1%) | 134 (15.5%) |
| $500 to $799 | 239 (24.3%) | 293 (33.9%) |
| $800 to $999 | 62 (6.3%) | 135 (15.6%) |
| $1,000 to $1,499 | 152 (15.4%) | 180 (20.8%) |
| $1,500 to $1,999 | 161 (16.4%) | 45 (5.2%) |
| $2,000 to $2,499 | 31 (3.2%) | 0 (0.0%) |
| $2,500 to $2,999 | 0 (0.0%) | 0 (0.0%) |
| $3,000 or more | 0 (0.0%) | 0 (0.0%) |
| Total | 985 (100.0%) | 865 (100.0%) |
Physical Housing Characteristics in Hartwell
Housing Structures in Hartwell
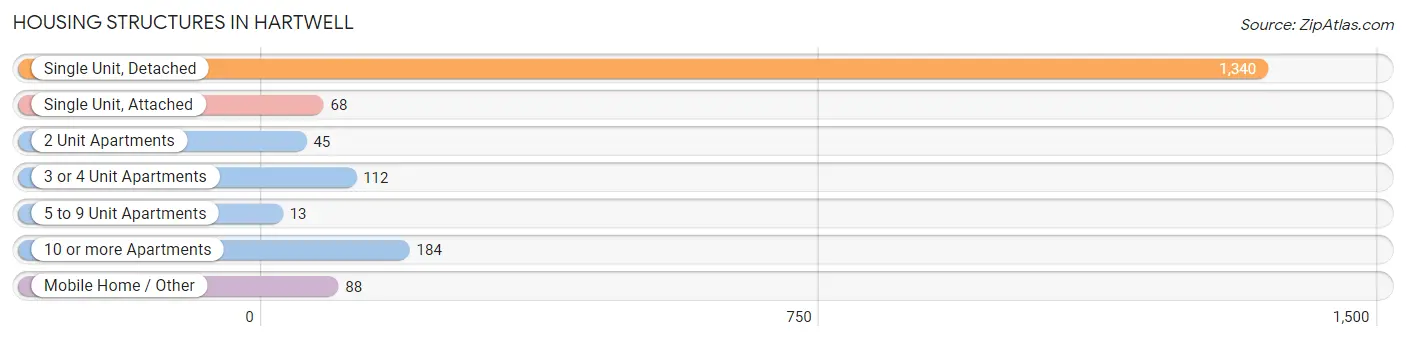
| Structure Type | # Housing Units | % Housing Units |
| Single Unit, Detached | 1,340 | 72.4% |
| Single Unit, Attached | 68 | 3.7% |
| 2 Unit Apartments | 45 | 2.4% |
| 3 or 4 Unit Apartments | 112 | 6.0% |
| 5 to 9 Unit Apartments | 13 | 0.7% |
| 10 or more Apartments | 184 | 10.0% |
| Mobile Home / Other | 88 | 4.8% |
| Total | 1,850 | 100.0% |
Housing Structures by Occupancy in Hartwell
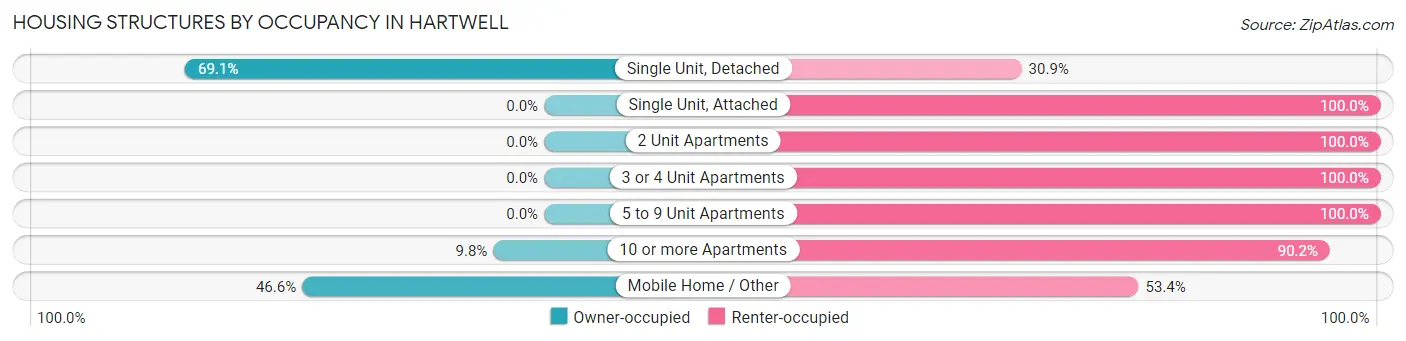
| Structure Type | Owner-occupied | Renter-occupied |
| Single Unit, Detached | 926 (69.1%) | 414 (30.9%) |
| Single Unit, Attached | 0 (0.0%) | 68 (100.0%) |
| 2 Unit Apartments | 0 (0.0%) | 45 (100.0%) |
| 3 or 4 Unit Apartments | 0 (0.0%) | 112 (100.0%) |
| 5 to 9 Unit Apartments | 0 (0.0%) | 13 (100.0%) |
| 10 or more Apartments | 18 (9.8%) | 166 (90.2%) |
| Mobile Home / Other | 41 (46.6%) | 47 (53.4%) |
| Total | 985 (53.2%) | 865 (46.8%) |
Housing Structures by Number of Rooms in Hartwell
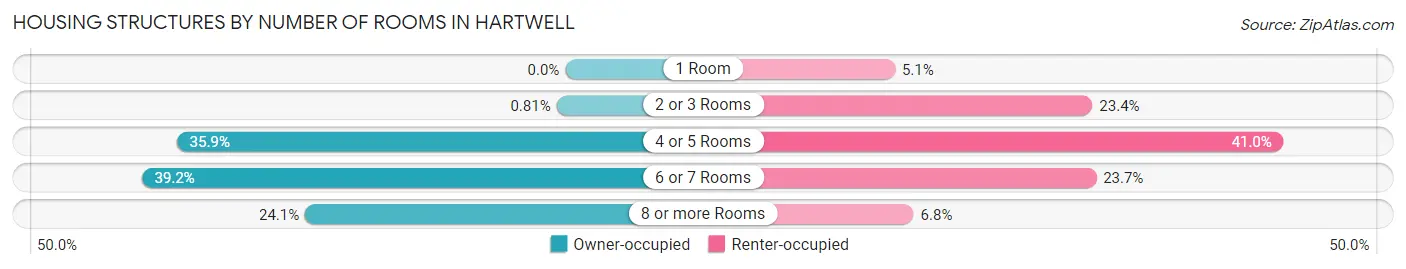
| Number of Rooms | Owner-occupied | Renter-occupied |
| 1 Room | 0 (0.0%) | 44 (5.1%) |
| 2 or 3 Rooms | 8 (0.8%) | 202 (23.4%) |
| 4 or 5 Rooms | 354 (35.9%) | 355 (41.0%) |
| 6 or 7 Rooms | 386 (39.2%) | 205 (23.7%) |
| 8 or more Rooms | 237 (24.1%) | 59 (6.8%) |
| Total | 985 (100.0%) | 865 (100.0%) |
Housing Structure by Heating Type in Hartwell
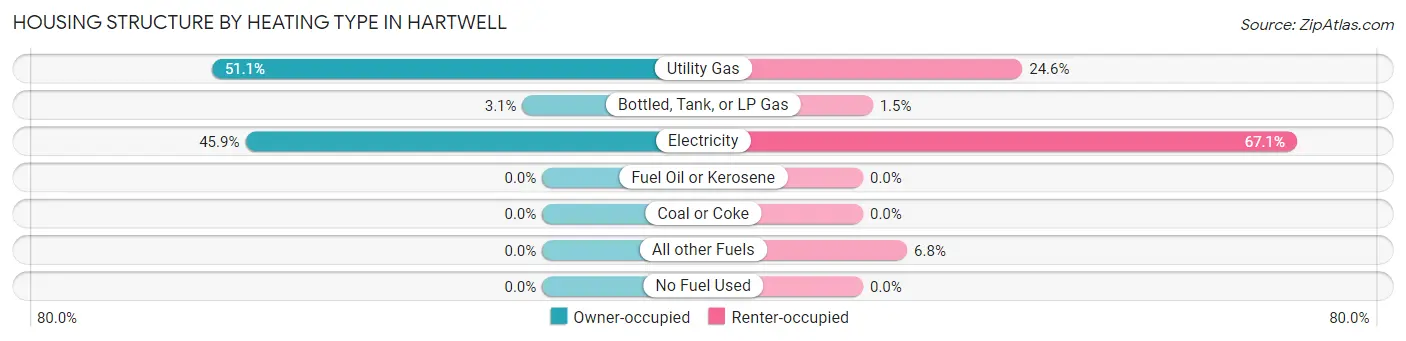
| Heating Type | Owner-occupied | Renter-occupied |
| Utility Gas | 503 (51.1%) | 213 (24.6%) |
| Bottled, Tank, or LP Gas | 30 (3.0%) | 13 (1.5%) |
| Electricity | 452 (45.9%) | 580 (67.0%) |
| Fuel Oil or Kerosene | 0 (0.0%) | 0 (0.0%) |
| Coal or Coke | 0 (0.0%) | 0 (0.0%) |
| All other Fuels | 0 (0.0%) | 59 (6.8%) |
| No Fuel Used | 0 (0.0%) | 0 (0.0%) |
| Total | 985 (100.0%) | 865 (100.0%) |
Household Vehicle Usage in Hartwell
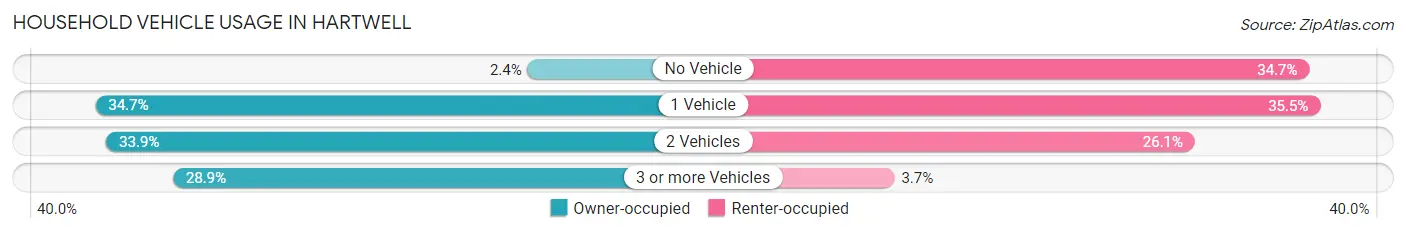
| Vehicles per Household | Owner-occupied | Renter-occupied |
| No Vehicle | 24 (2.4%) | 300 (34.7%) |
| 1 Vehicle | 342 (34.7%) | 307 (35.5%) |
| 2 Vehicles | 334 (33.9%) | 226 (26.1%) |
| 3 or more Vehicles | 285 (28.9%) | 32 (3.7%) |
| Total | 985 (100.0%) | 865 (100.0%) |
Real Estate & Mortgages in Hartwell
Real Estate and Mortgage Overview in Hartwell
| Characteristic | Without Mortgage | With Mortgage |
| Housing Units | 549 | 436 |
| Median Property Value | $121,800 | $173,400 |
| Median Household Income | $57,623 | $74 |
| Monthly Housing Costs | $386 | $0 |
| Real Estate Taxes | $500 | $20 |
Property Value by Mortgage Status in Hartwell
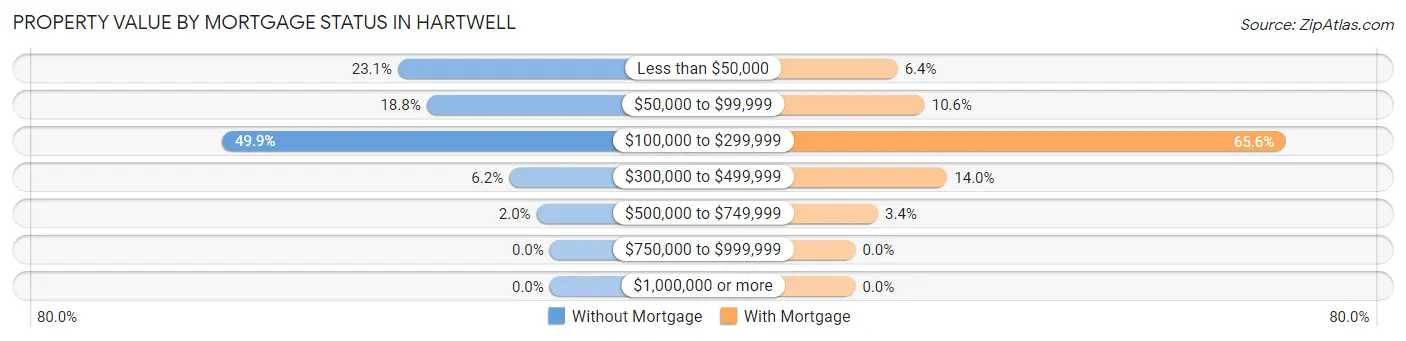
| Property Value | Without Mortgage | With Mortgage |
| Less than $50,000 | 127 (23.1%) | 28 (6.4%) |
| $50,000 to $99,999 | 103 (18.8%) | 46 (10.5%) |
| $100,000 to $299,999 | 274 (49.9%) | 286 (65.6%) |
| $300,000 to $499,999 | 34 (6.2%) | 61 (14.0%) |
| $500,000 to $749,999 | 11 (2.0%) | 15 (3.4%) |
| $750,000 to $999,999 | 0 (0.0%) | 0 (0.0%) |
| $1,000,000 or more | 0 (0.0%) | 0 (0.0%) |
| Total | 549 (100.0%) | 436 (100.0%) |
Household Income by Mortgage Status in Hartwell
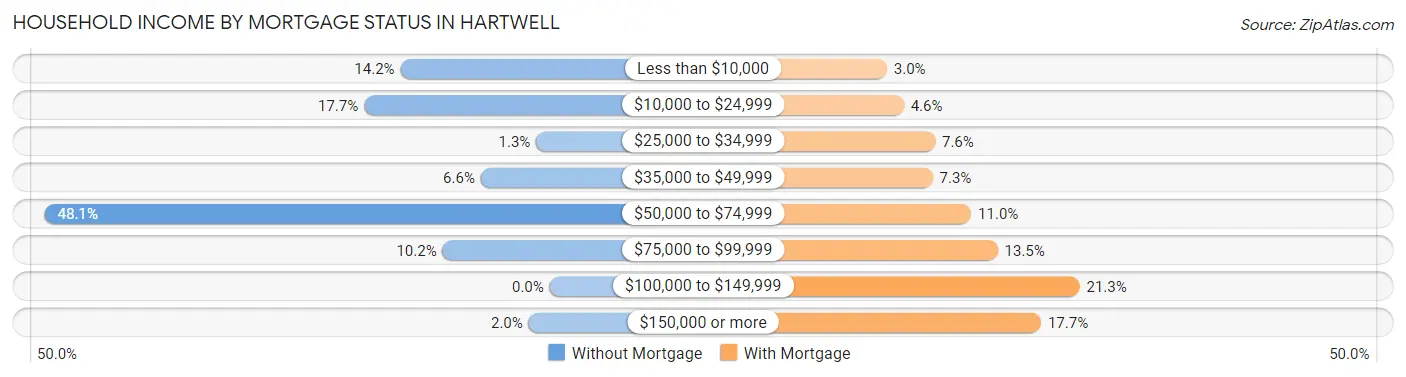
| Household Income | Without Mortgage | With Mortgage |
| Less than $10,000 | 78 (14.2%) | 13 (3.0%) |
| $10,000 to $24,999 | 97 (17.7%) | 20 (4.6%) |
| $25,000 to $34,999 | 7 (1.3%) | 33 (7.6%) |
| $35,000 to $49,999 | 36 (6.6%) | 32 (7.3%) |
| $50,000 to $74,999 | 264 (48.1%) | 48 (11.0%) |
| $75,000 to $99,999 | 56 (10.2%) | 59 (13.5%) |
| $100,000 to $149,999 | 0 (0.0%) | 93 (21.3%) |
| $150,000 or more | 11 (2.0%) | 77 (17.7%) |
| Total | 549 (100.0%) | 436 (100.0%) |
Property Value to Household Income Ratio in Hartwell
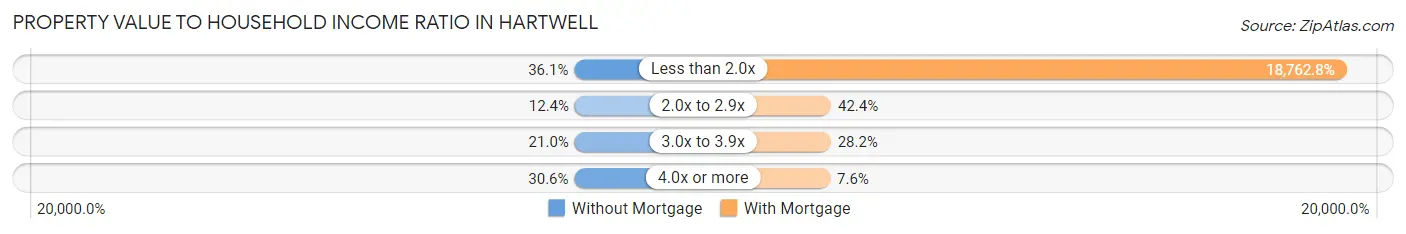
| Value-to-Income Ratio | Without Mortgage | With Mortgage |
| Less than 2.0x | 198 (36.1%) | 81,806 (18,762.8%) |
| 2.0x to 2.9x | 68 (12.4%) | 185 (42.4%) |
| 3.0x to 3.9x | 115 (20.9%) | 123 (28.2%) |
| 4.0x or more | 168 (30.6%) | 33 (7.6%) |
| Total | 549 (100.0%) | 436 (100.0%) |
Real Estate Taxes by Mortgage Status in Hartwell
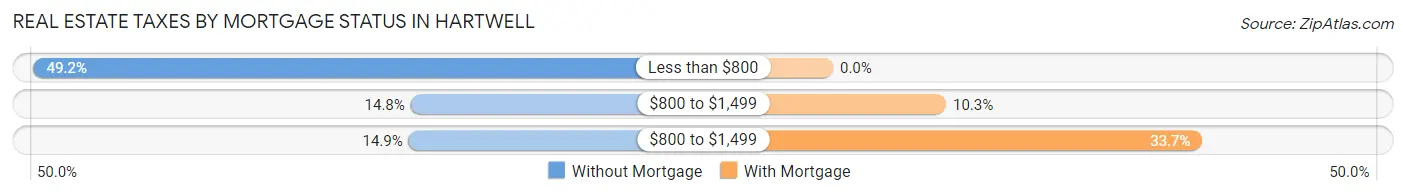
| Property Taxes | Without Mortgage | With Mortgage |
| Less than $800 | 270 (49.2%) | 0 (0.0%) |
| $800 to $1,499 | 81 (14.7%) | 45 (10.3%) |
| $800 to $1,499 | 82 (14.9%) | 147 (33.7%) |
| Total | 549 (100.0%) | 436 (100.0%) |
Health & Disability in Hartwell
Health Insurance Coverage by Age in Hartwell
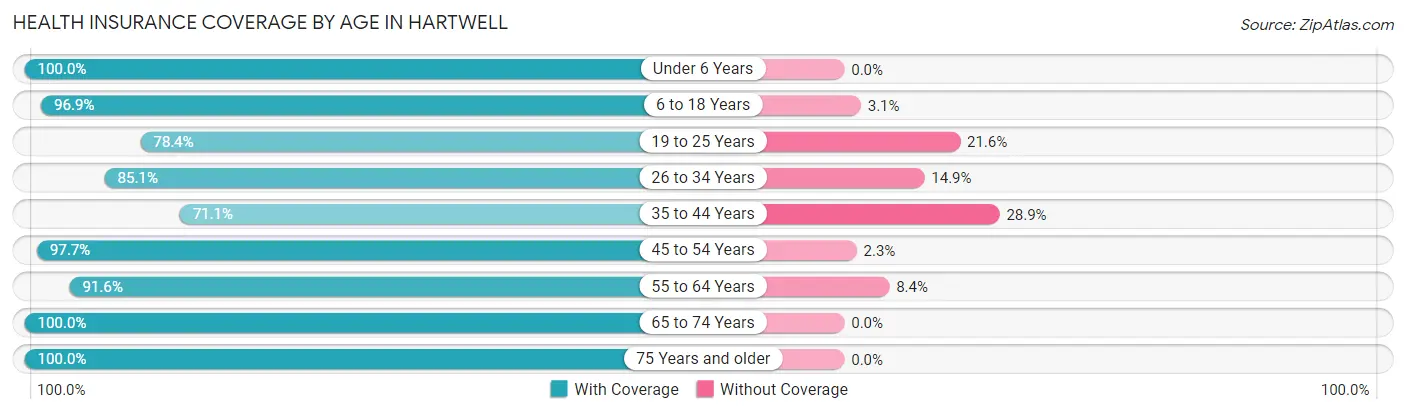
| Age Bracket | With Coverage | Without Coverage |
| Under 6 Years | 135 (100.0%) | 0 (0.0%) |
| 6 to 18 Years | 817 (96.9%) | 26 (3.1%) |
| 19 to 25 Years | 178 (78.4%) | 49 (21.6%) |
| 26 to 34 Years | 564 (85.1%) | 99 (14.9%) |
| 35 to 44 Years | 280 (71.1%) | 114 (28.9%) |
| 45 to 54 Years | 551 (97.7%) | 13 (2.3%) |
| 55 to 64 Years | 448 (91.6%) | 41 (8.4%) |
| 65 to 74 Years | 539 (100.0%) | 0 (0.0%) |
| 75 Years and older | 371 (100.0%) | 0 (0.0%) |
| Total | 3,883 (91.9%) | 342 (8.1%) |
Health Insurance Coverage by Citizenship Status in Hartwell
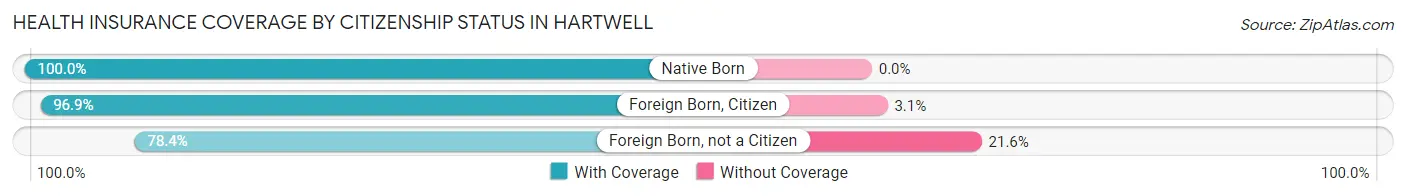
| Citizenship Status | With Coverage | Without Coverage |
| Native Born | 135 (100.0%) | 0 (0.0%) |
| Foreign Born, Citizen | 817 (96.9%) | 26 (3.1%) |
| Foreign Born, not a Citizen | 178 (78.4%) | 49 (21.6%) |
Health Insurance Coverage by Household Income in Hartwell
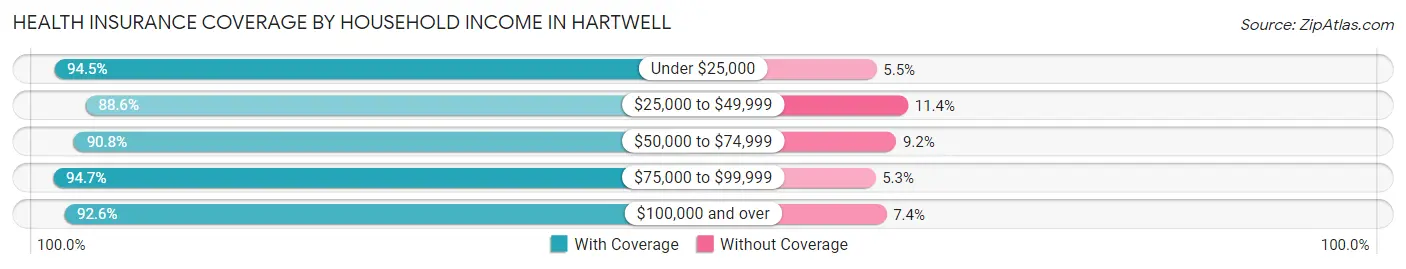
| Household Income | With Coverage | Without Coverage |
| Under $25,000 | 836 (94.5%) | 49 (5.5%) |
| $25,000 to $49,999 | 922 (88.6%) | 119 (11.4%) |
| $50,000 to $74,999 | 818 (90.8%) | 83 (9.2%) |
| $75,000 to $99,999 | 568 (94.7%) | 32 (5.3%) |
| $100,000 and over | 739 (92.6%) | 59 (7.4%) |
Public vs Private Health Insurance Coverage by Age in Hartwell
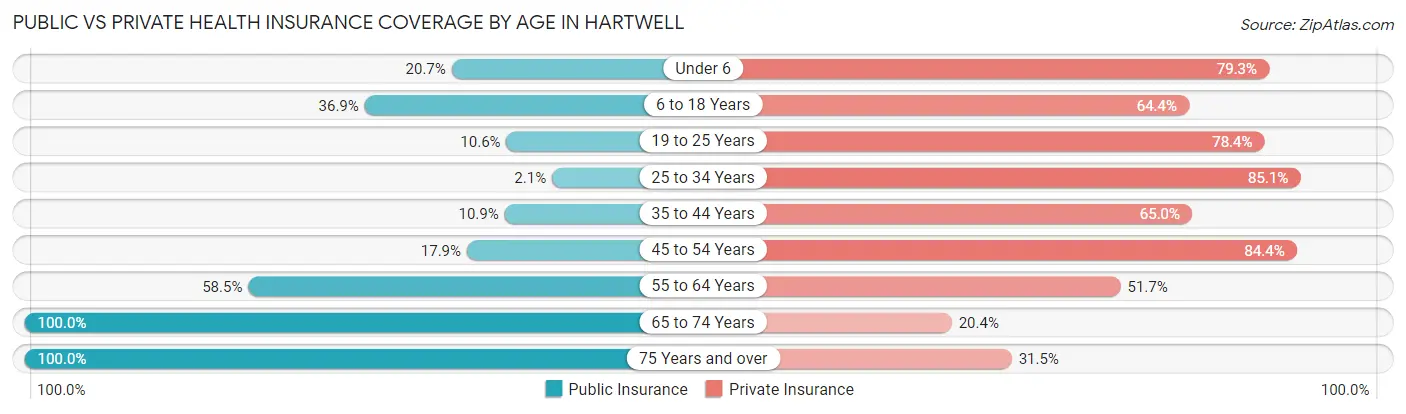
| Age Bracket | Public Insurance | Private Insurance |
| Under 6 | 28 (20.7%) | 107 (79.3%) |
| 6 to 18 Years | 311 (36.9%) | 543 (64.4%) |
| 19 to 25 Years | 24 (10.6%) | 178 (78.4%) |
| 25 to 34 Years | 14 (2.1%) | 564 (85.1%) |
| 35 to 44 Years | 43 (10.9%) | 256 (65.0%) |
| 45 to 54 Years | 101 (17.9%) | 476 (84.4%) |
| 55 to 64 Years | 286 (58.5%) | 253 (51.7%) |
| 65 to 74 Years | 539 (100.0%) | 110 (20.4%) |
| 75 Years and over | 371 (100.0%) | 117 (31.5%) |
| Total | 1,717 (40.6%) | 2,604 (61.6%) |
Disability Status by Sex by Age in Hartwell
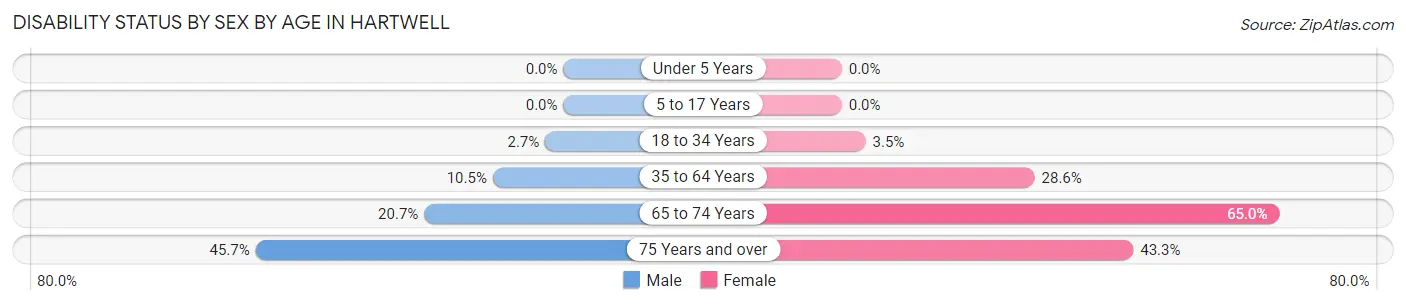
| Age Bracket | Male | Female |
| Under 5 Years | 0 (0.0%) | 0 (0.0%) |
| 5 to 17 Years | 0 (0.0%) | 0 (0.0%) |
| 18 to 34 Years | 14 (2.7%) | 14 (3.5%) |
| 35 to 64 Years | 73 (10.5%) | 215 (28.6%) |
| 65 to 74 Years | 43 (20.7%) | 215 (64.9%) |
| 75 Years and over | 64 (45.7%) | 100 (43.3%) |
Disability Class by Sex by Age in Hartwell
Disability Class: Hearing Difficulty
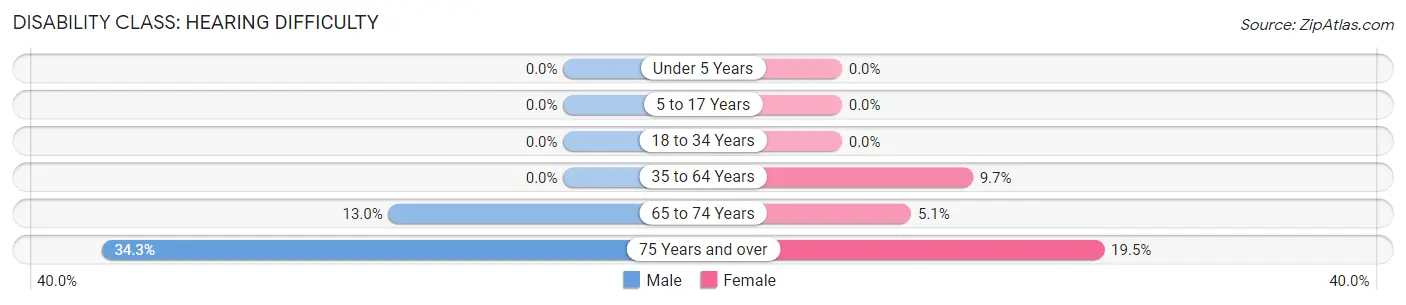
| Age Bracket | Male | Female |
| Under 5 Years | 0 (0.0%) | 0 (0.0%) |
| 5 to 17 Years | 0 (0.0%) | 0 (0.0%) |
| 18 to 34 Years | 0 (0.0%) | 0 (0.0%) |
| 35 to 64 Years | 0 (0.0%) | 73 (9.7%) |
| 65 to 74 Years | 27 (13.0%) | 17 (5.1%) |
| 75 Years and over | 48 (34.3%) | 45 (19.5%) |
Disability Class: Vision Difficulty
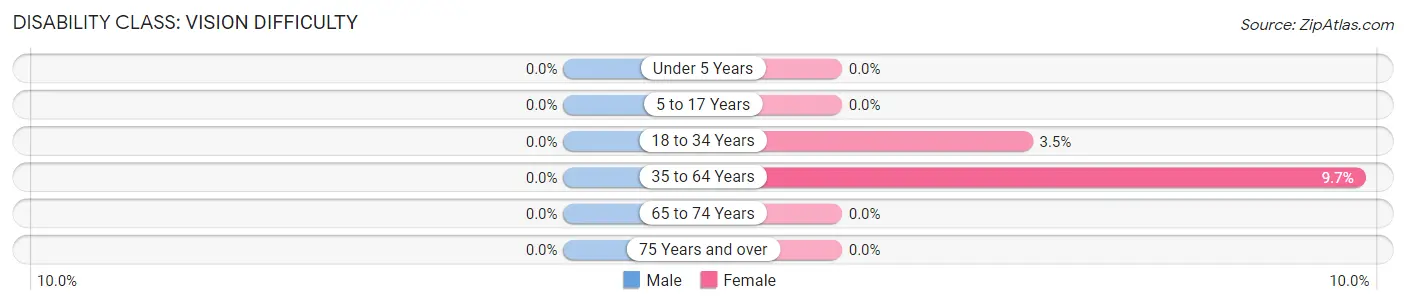
| Age Bracket | Male | Female |
| Under 5 Years | 0 (0.0%) | 0 (0.0%) |
| 5 to 17 Years | 0 (0.0%) | 0 (0.0%) |
| 18 to 34 Years | 0 (0.0%) | 14 (3.5%) |
| 35 to 64 Years | 0 (0.0%) | 73 (9.7%) |
| 65 to 74 Years | 0 (0.0%) | 0 (0.0%) |
| 75 Years and over | 0 (0.0%) | 0 (0.0%) |
Disability Class: Cognitive Difficulty
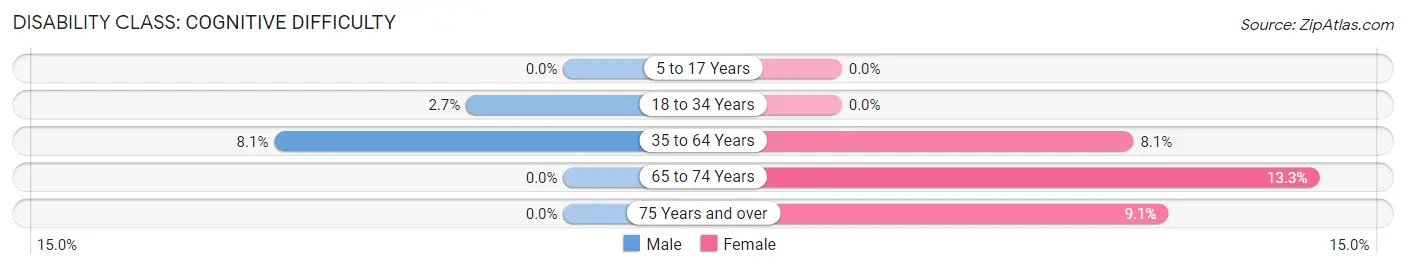
| Age Bracket | Male | Female |
| 5 to 17 Years | 0 (0.0%) | 0 (0.0%) |
| 18 to 34 Years | 14 (2.7%) | 0 (0.0%) |
| 35 to 64 Years | 56 (8.1%) | 61 (8.1%) |
| 65 to 74 Years | 0 (0.0%) | 44 (13.3%) |
| 75 Years and over | 0 (0.0%) | 21 (9.1%) |
Disability Class: Ambulatory Difficulty
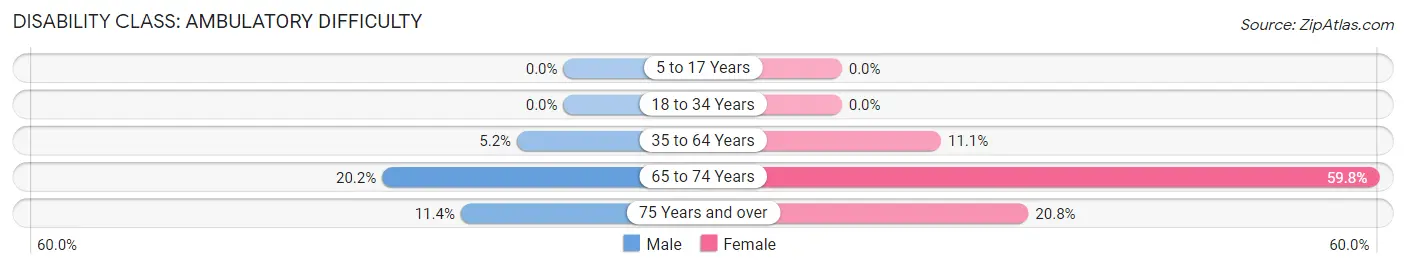
| Age Bracket | Male | Female |
| 5 to 17 Years | 0 (0.0%) | 0 (0.0%) |
| 18 to 34 Years | 0 (0.0%) | 0 (0.0%) |
| 35 to 64 Years | 36 (5.2%) | 83 (11.1%) |
| 65 to 74 Years | 42 (20.2%) | 198 (59.8%) |
| 75 Years and over | 16 (11.4%) | 48 (20.8%) |
Disability Class: Self-Care Difficulty
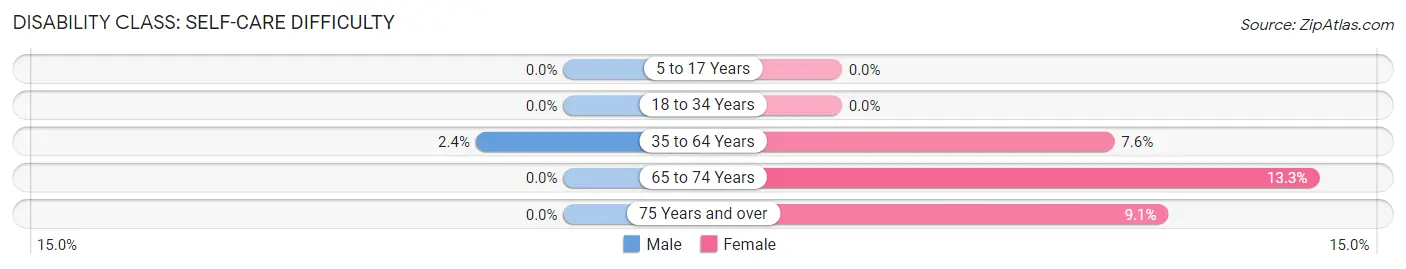
| Age Bracket | Male | Female |
| 5 to 17 Years | 0 (0.0%) | 0 (0.0%) |
| 18 to 34 Years | 0 (0.0%) | 0 (0.0%) |
| 35 to 64 Years | 17 (2.4%) | 57 (7.6%) |
| 65 to 74 Years | 0 (0.0%) | 44 (13.3%) |
| 75 Years and over | 0 (0.0%) | 21 (9.1%) |
Technology Access in Hartwell
Computing Device Access in Hartwell
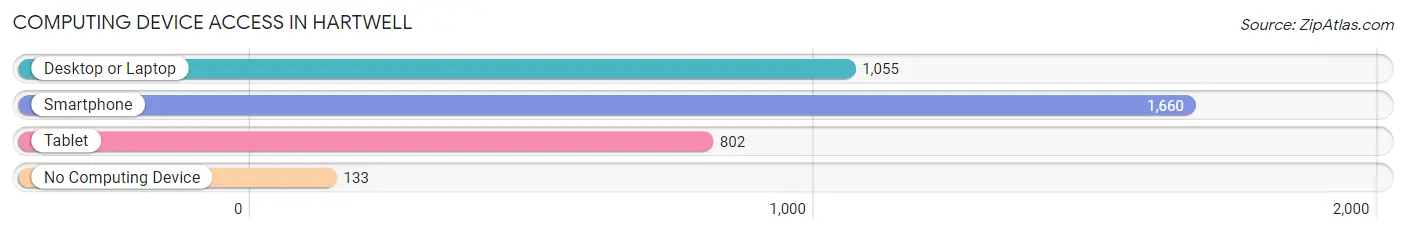
| Device Type | # Households | % Households |
| Desktop or Laptop | 1,055 | 57.0% |
| Smartphone | 1,660 | 89.7% |
| Tablet | 802 | 43.3% |
| No Computing Device | 133 | 7.2% |
| Total | 1,850 | 100.0% |
Internet Access in Hartwell
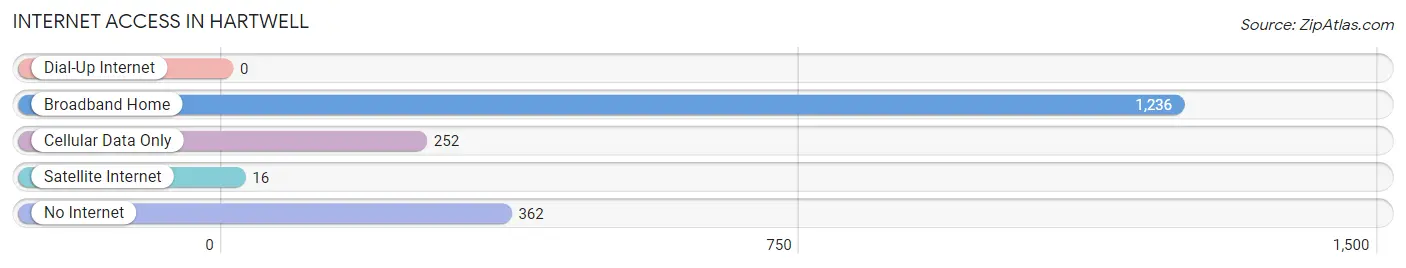
| Internet Type | # Households | % Households |
| Dial-Up Internet | 0 | 0.0% |
| Broadband Home | 1,236 | 66.8% |
| Cellular Data Only | 252 | 13.6% |
| Satellite Internet | 16 | 0.9% |
| No Internet | 362 | 19.6% |
| Total | 1,850 | 100.0% |
Hartwell Summary
Hartwell, Georgia is a small city located in the northeast corner of the state, in Hart County. It is situated on the banks of the Hartwell Lake, a reservoir created by the Hartwell Dam on the Savannah River. The city is home to a population of 4,109 people, according to the 2010 census.
History
The area that is now Hartwell was originally inhabited by the Cherokee Indians. The first white settlers arrived in the area in the late 1700s, and the town was officially founded in 1856. The town was named after Nancy Hart, a local Revolutionary War heroine.
In the late 1800s, the town began to grow and prosper due to the railroad, which connected it to other cities in the region. The railroad also brought new industry to the area, including a cotton mill and a furniture factory.
In the early 1900s, the town was incorporated and began to grow rapidly. The population increased from 1,000 in 1900 to over 4,000 by the 1950s.
Geography
Hartwell is located in the northeast corner of Georgia, in Hart County. It is situated on the banks of the Hartwell Lake, a reservoir created by the Hartwell Dam on the Savannah River. The city is located about 70 miles northeast of Atlanta and about 30 miles south of the South Carolina border.
The city has a total area of 4.2 square miles, all of which is land. The terrain is mostly flat, with some rolling hills in the surrounding area. The climate is mild, with hot summers and cool winters.
Economy
The economy of Hartwell is largely based on agriculture and manufacturing. The city is home to several large farms, which produce a variety of crops, including cotton, corn, soybeans, and peanuts. The city also has several manufacturing plants, which produce a variety of products, including furniture, textiles, and automotive parts.
The city is also home to several small businesses, including restaurants, retail stores, and professional services. The city is also home to several government offices, including the Hart County Courthouse and the Hartwell Police Department.
Demographics
According to the 2010 census, the population of Hartwell was 4,109. The racial makeup of the city was 79.3% White, 17.2% African American, 0.4% Native American, 0.7% Asian, 0.1% Pacific Islander, 1.2% from other races, and 1.1% from two or more races. Hispanic or Latino of any race were 2.7% of the population.
The median household income in Hartwell was $35,938, and the median family income was $41,944. The per capita income for the city was $17,945. About 17.2% of the population was below the poverty line.
Hartwell is a small city with a rich history and a diverse economy. It is home to a variety of businesses, from farms to manufacturing plants, and is a great place to live and work.
Common Questions
What is Per Capita Income in Hartwell?
Per Capita income in Hartwell is $24,160.
What is the Median Family Income in Hartwell?
Median Family Income in Hartwell is $57,255.
What is the Median Household income in Hartwell?
Median Household Income in Hartwell is $46,875.
What is Income or Wage Gap in Hartwell?
Income or Wage Gap in Hartwell is 14.0%.
Women in Hartwell earn 86.0 cents for every dollar earned by a man.
What is Inequality or Gini Index in Hartwell?
Inequality or Gini Index in Hartwell is 0.49.
What is the Total Population of Hartwell?
Total Population of Hartwell is 4,481.
What is the Total Male Population of Hartwell?
Total Male Population of Hartwell is 2,109.
What is the Total Female Population of Hartwell?
Total Female Population of Hartwell is 2,372.
What is the Ratio of Males per 100 Females in Hartwell?
There are 88.91 Males per 100 Females in Hartwell.
What is the Ratio of Females per 100 Males in Hartwell?
There are 112.47 Females per 100 Males in Hartwell.
What is the Median Population Age in Hartwell?
Median Population Age in Hartwell is 44.2 Years.
What is the Average Family Size in Hartwell
Average Family Size in Hartwell is 3.3 People.
What is the Average Household Size in Hartwell
Average Household Size in Hartwell is 2.3 People.
How Large is the Labor Force in Hartwell?
There are 2,080 People in the Labor Forcein in Hartwell.
What is the Percentage of People in the Labor Force in Hartwell?
57.2% of People are in the Labor Force in Hartwell.
What is the Unemployment Rate in Hartwell?
Unemployment Rate in Hartwell is 0.3%.