Villa Rica, GA Map & Demographics
Villa Rica Map
Villa Rica Overview
$32,131
PER CAPITA INCOME
$88,174
AVG FAMILY INCOME
$82,373
AVG HOUSEHOLD INCOME
15.8%
WAGE / INCOME GAP [ % ]
84.2¢/ $1
WAGE / INCOME GAP [ $ ]
$12,386
FAMILY INCOME DEFICIT
0.36
INEQUALITY / GINI INDEX
17,354
TOTAL POPULATION
7,777
MALE POPULATION
9,577
FEMALE POPULATION
81.20
MALES / 100 FEMALES
123.15
FEMALES / 100 MALES
34.0
MEDIAN AGE
3.4
AVG FAMILY SIZE
3.0
AVG HOUSEHOLD SIZE
9,286
LABOR FORCE [ PEOPLE ]
71.8%
PERCENT IN LABOR FORCE
4.4%
UNEMPLOYMENT RATE
Villa Rica Zip Codes
Income in Villa Rica
Income Overview in Villa Rica
Per Capita Income in Villa Rica is $32,131, while median incomes of families and households are $88,174 and $82,373 respectively.
| Characteristic | Number | Measure |
| Per Capita Income | 17,354 | $32,131 |
| Median Family Income | 4,420 | $88,174 |
| Mean Family Income | 4,420 | $101,274 |
| Median Household Income | 5,862 | $82,373 |
| Mean Household Income | 5,862 | $93,611 |
| Income Deficit | 4,420 | $12,386 |
| Wage / Income Gap (%) | 17,354 | 15.77% |
| Wage / Income Gap ($) | 17,354 | 84.23¢ per $1 |
| Gini / Inequality Index | 17,354 | 0.36 |
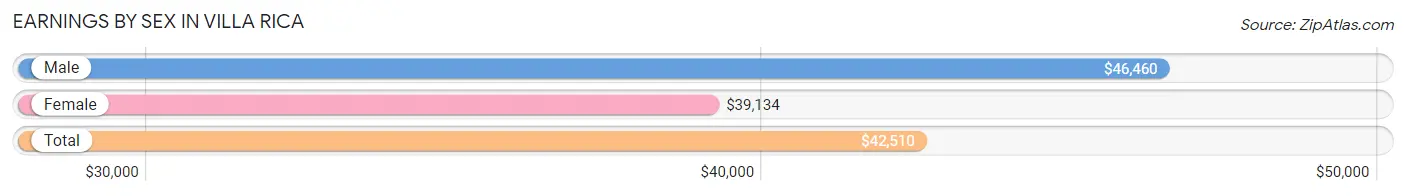
Earnings by Sex in Villa Rica
Average Earnings in Villa Rica are $42,510, $46,460 for men and $39,134 for women, a difference of 15.8%.
| Sex | Number | Average Earnings |
| Male | 4,712 (49.0%) | $46,460 |
| Female | 4,900 (51.0%) | $39,134 |
| Total | 9,612 (100.0%) | $42,510 |
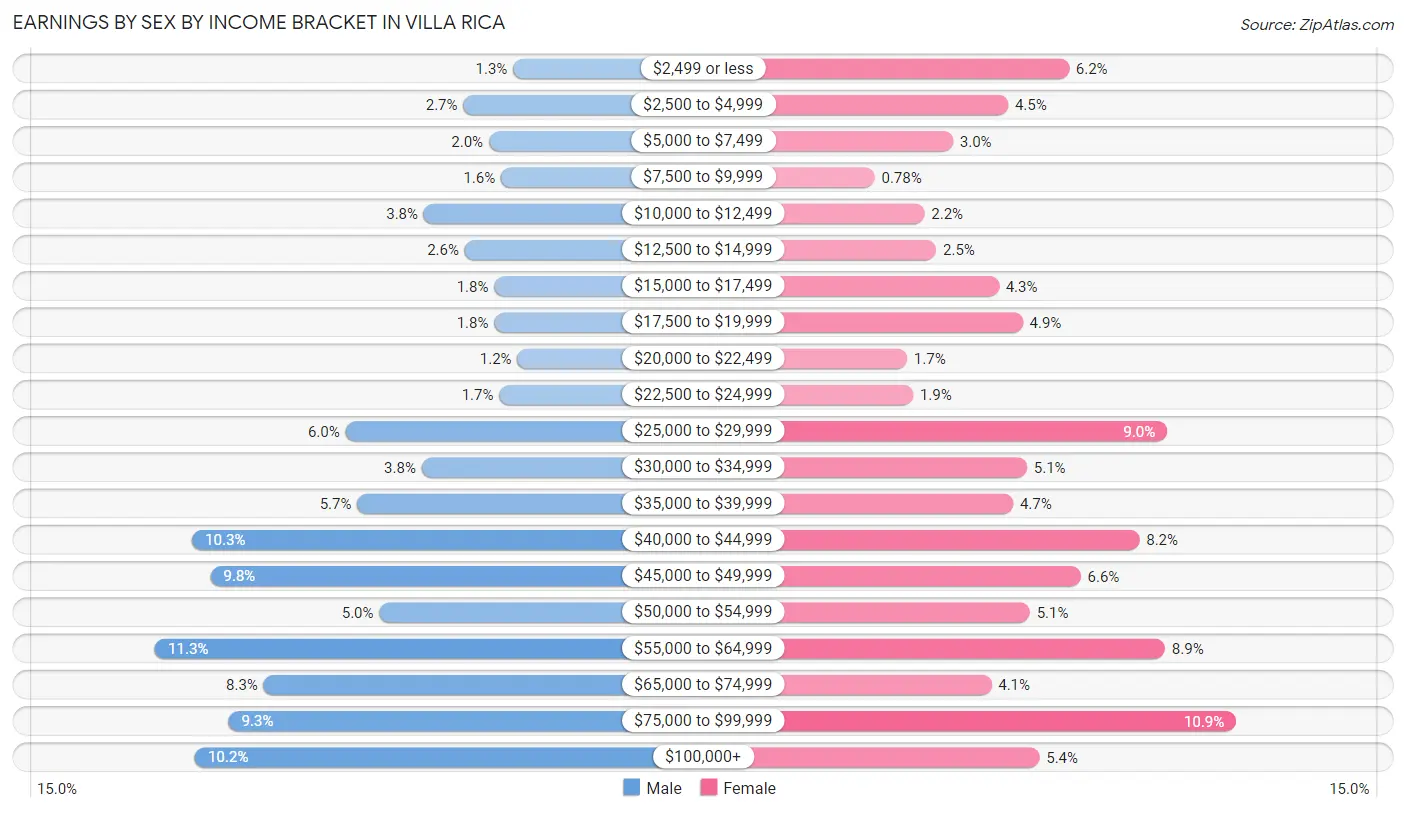
Earnings by Sex by Income Bracket in Villa Rica
The most common earnings brackets in Villa Rica are $55,000 to $64,999 for men (534 | 11.3%) and $75,000 to $99,999 for women (536 | 10.9%).
| Income | Male | Female |
| $2,499 or less | 60 (1.3%) | 306 (6.2%) |
| $2,500 to $4,999 | 126 (2.7%) | 222 (4.5%) |
| $5,000 to $7,499 | 92 (1.9%) | 146 (3.0%) |
| $7,500 to $9,999 | 76 (1.6%) | 38 (0.8%) |
| $10,000 to $12,499 | 178 (3.8%) | 107 (2.2%) |
| $12,500 to $14,999 | 124 (2.6%) | 123 (2.5%) |
| $15,000 to $17,499 | 85 (1.8%) | 209 (4.3%) |
| $17,500 to $19,999 | 85 (1.8%) | 242 (4.9%) |
| $20,000 to $22,499 | 54 (1.1%) | 83 (1.7%) |
| $22,500 to $24,999 | 78 (1.7%) | 91 (1.9%) |
| $25,000 to $29,999 | 282 (6.0%) | 441 (9.0%) |
| $30,000 to $34,999 | 181 (3.8%) | 248 (5.1%) |
| $35,000 to $39,999 | 266 (5.7%) | 229 (4.7%) |
| $40,000 to $44,999 | 485 (10.3%) | 403 (8.2%) |
| $45,000 to $49,999 | 461 (9.8%) | 322 (6.6%) |
| $50,000 to $54,999 | 237 (5.0%) | 252 (5.1%) |
| $55,000 to $64,999 | 534 (11.3%) | 438 (8.9%) |
| $65,000 to $74,999 | 390 (8.3%) | 199 (4.1%) |
| $75,000 to $99,999 | 437 (9.3%) | 536 (10.9%) |
| $100,000+ | 481 (10.2%) | 265 (5.4%) |
| Total | 4,712 (100.0%) | 4,900 (100.0%) |
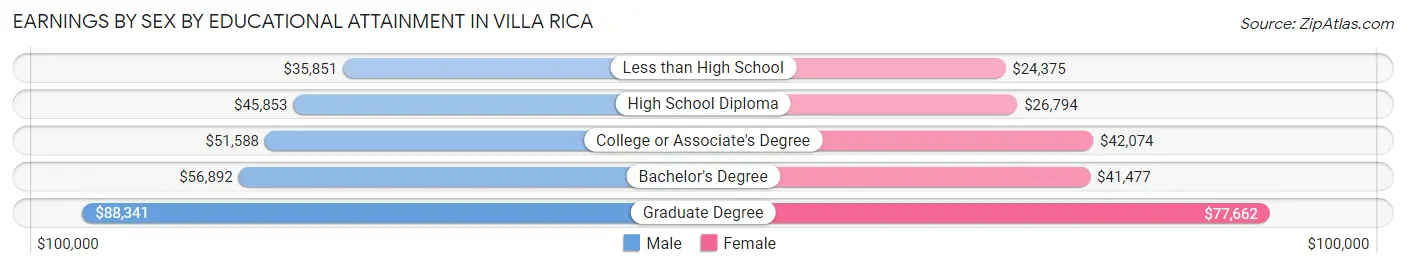
Earnings by Sex by Educational Attainment in Villa Rica
Average earnings in Villa Rica are $50,663 for men and $41,141 for women, a difference of 18.8%. Men with an educational attainment of graduate degree enjoy the highest average annual earnings of $88,341, while those with less than high school education earn the least with $35,851. Women with an educational attainment of graduate degree earn the most with the average annual earnings of $77,662, while those with less than high school education have the smallest earnings of $24,375.
| Educational Attainment | Male Income | Female Income |
| Less than High School | $35,851 | $24,375 |
| High School Diploma | $45,853 | $26,794 |
| College or Associate's Degree | $51,588 | $42,074 |
| Bachelor's Degree | $56,892 | $41,477 |
| Graduate Degree | $88,341 | $77,662 |
| Total | $50,663 | $41,141 |
Family Income in Villa Rica
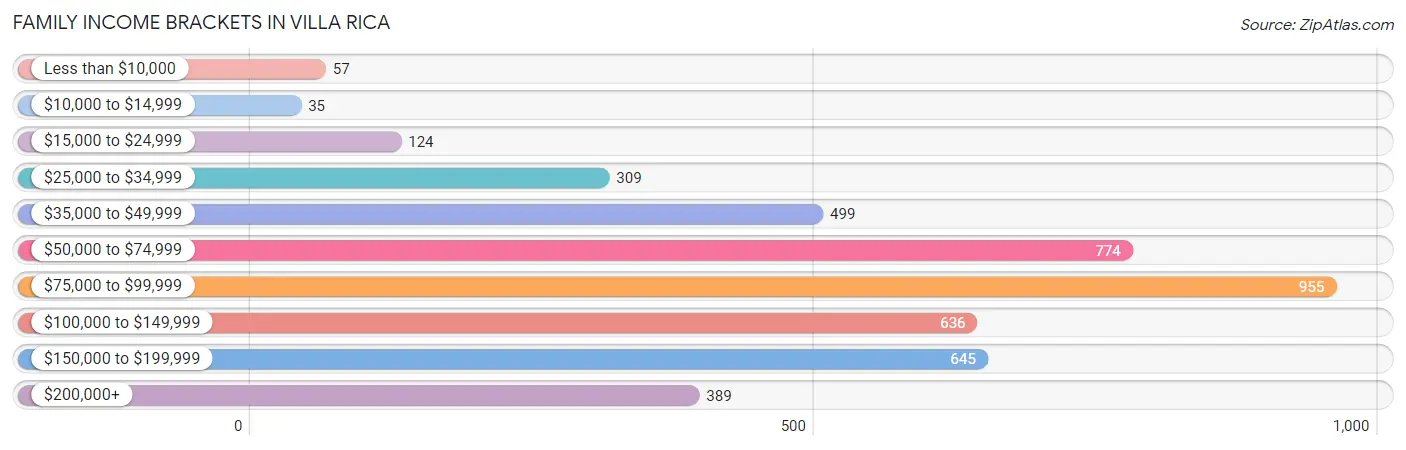
Family Income Brackets in Villa Rica
According to the Villa Rica family income data, there are 955 families falling into the $75,000 to $99,999 income range, which is the most common income bracket and makes up 21.6% of all families. Conversely, the $10,000 to $14,999 income bracket is the least frequent group with only 35 families (0.8%) belonging to this category.
| Income Bracket | # Families | % Families |
| Less than $10,000 | 57 | 1.3% |
| $10,000 to $14,999 | 35 | 0.8% |
| $15,000 to $24,999 | 124 | 2.8% |
| $25,000 to $34,999 | 309 | 7.0% |
| $35,000 to $49,999 | 499 | 11.3% |
| $50,000 to $74,999 | 774 | 17.5% |
| $75,000 to $99,999 | 955 | 21.6% |
| $100,000 to $149,999 | 636 | 14.4% |
| $150,000 to $199,999 | 645 | 14.6% |
| $200,000+ | 389 | 8.8% |
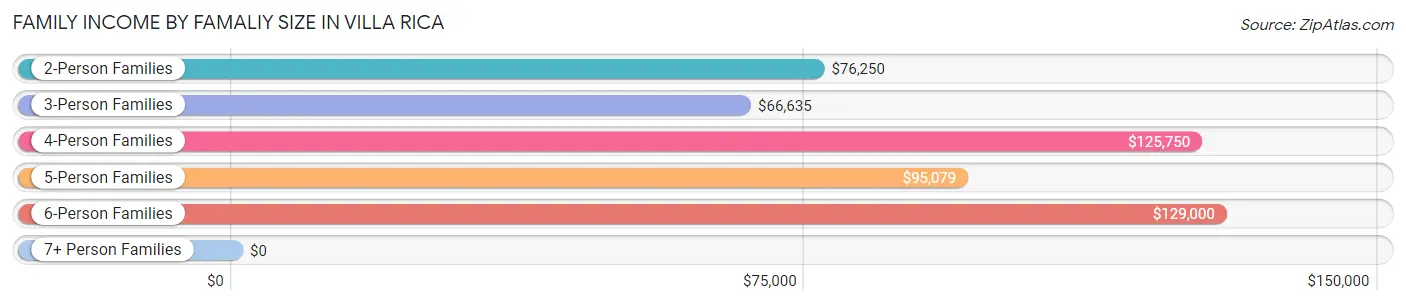
Family Income by Famaliy Size in Villa Rica
6-person families (212 | 4.8%) account for the highest median family income in Villa Rica with $129,000 per family, while 2-person families (1,431 | 32.4%) have the highest median income of $38,125 per family member.
| Income Bracket | # Families | Median Income |
| 2-Person Families | 1,431 (32.4%) | $76,250 |
| 3-Person Families | 1,133 (25.6%) | $66,635 |
| 4-Person Families | 951 (21.5%) | $125,750 |
| 5-Person Families | 633 (14.3%) | $95,079 |
| 6-Person Families | 212 (4.8%) | $129,000 |
| 7+ Person Families | 60 (1.4%) | $0 |
| Total | 4,420 (100.0%) | $88,174 |
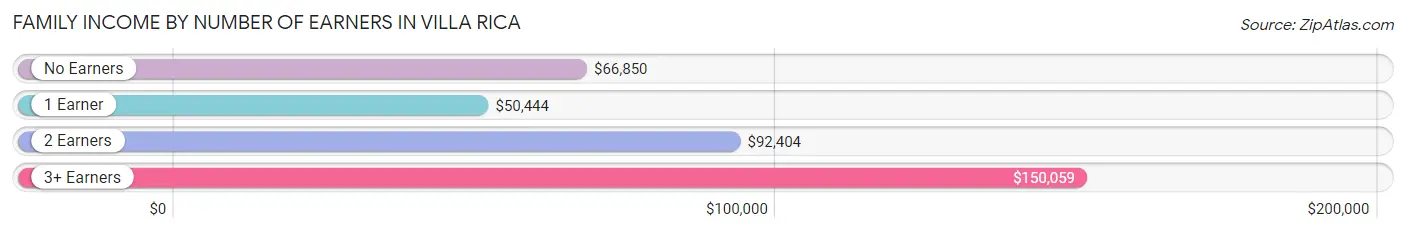
Family Income by Number of Earners in Villa Rica
The median family income in Villa Rica is $88,174, with families comprising 3+ earners (1,050) having the highest median family income of $150,059, while families with 1 earner (1,586) have the lowest median family income of $50,444, accounting for 23.8% and 35.9% of families, respectively.
| Number of Earners | # Families | Median Income |
| No Earners | 329 (7.4%) | $66,850 |
| 1 Earner | 1,586 (35.9%) | $50,444 |
| 2 Earners | 1,455 (32.9%) | $92,404 |
| 3+ Earners | 1,050 (23.8%) | $150,059 |
| Total | 4,420 (100.0%) | $88,174 |
Household Income in Villa Rica
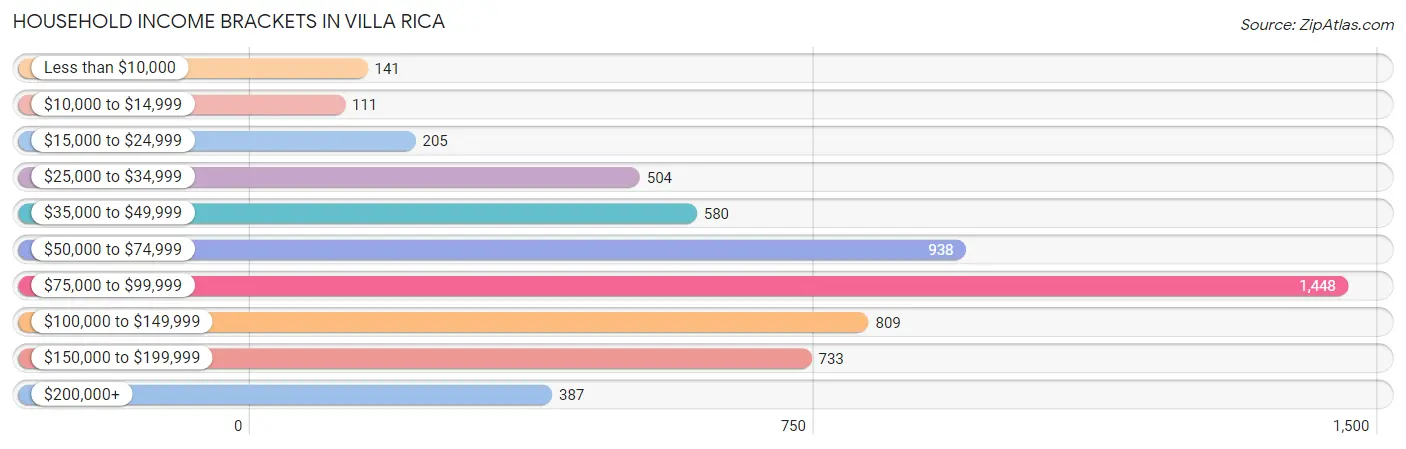
Household Income Brackets in Villa Rica
With 1,448 households falling in the category, the $75,000 to $99,999 income range is the most frequent in Villa Rica, accounting for 24.7% of all households. In contrast, only 111 households (1.9%) fall into the $10,000 to $14,999 income bracket, making it the least populous group.
| Income Bracket | # Households | % Households |
| Less than $10,000 | 141 | 2.4% |
| $10,000 to $14,999 | 111 | 1.9% |
| $15,000 to $24,999 | 205 | 3.5% |
| $25,000 to $34,999 | 504 | 8.6% |
| $35,000 to $49,999 | 580 | 9.9% |
| $50,000 to $74,999 | 938 | 16.0% |
| $75,000 to $99,999 | 1,448 | 24.7% |
| $100,000 to $149,999 | 809 | 13.8% |
| $150,000 to $199,999 | 733 | 12.5% |
| $200,000+ | 387 | 6.6% |
Household Income by Householder Age in Villa Rica
The median household income in Villa Rica is $82,373, with the highest median household income of $116,500 found in the 15 to 24 years age bracket for the primary householder. A total of 70 households (1.2%) fall into this category. Meanwhile, the 65+ years age bracket for the primary householder has the lowest median household income of $49,179, with 999 households (17.0%) in this group.
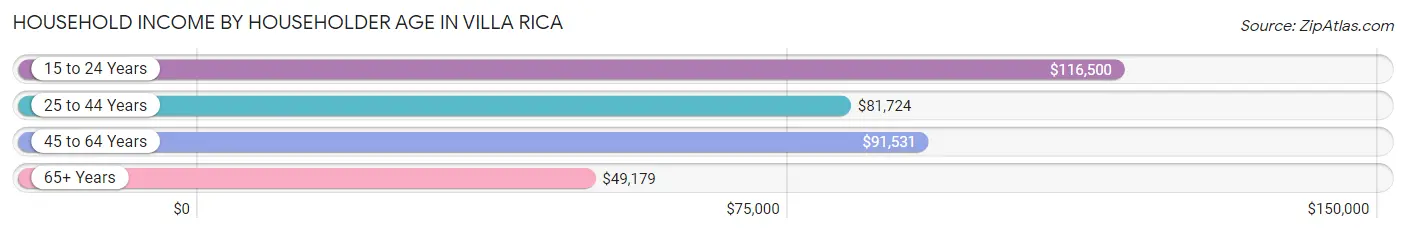
| Income Bracket | # Households | Median Income |
| 15 to 24 Years | 70 (1.2%) | $116,500 |
| 25 to 44 Years | 2,496 (42.6%) | $81,724 |
| 45 to 64 Years | 2,297 (39.2%) | $91,531 |
| 65+ Years | 999 (17.0%) | $49,179 |
| Total | 5,862 (100.0%) | $82,373 |
Poverty in Villa Rica
Income Below Poverty by Sex and Age in Villa Rica
With 8.1% poverty level for males and 7.6% for females among the residents of Villa Rica, 16 and 17 year old males and 75 year old and over females are the most vulnerable to poverty, with 47 males (26.7%) and 79 females (23.2%) in their respective age groups living below the poverty level.
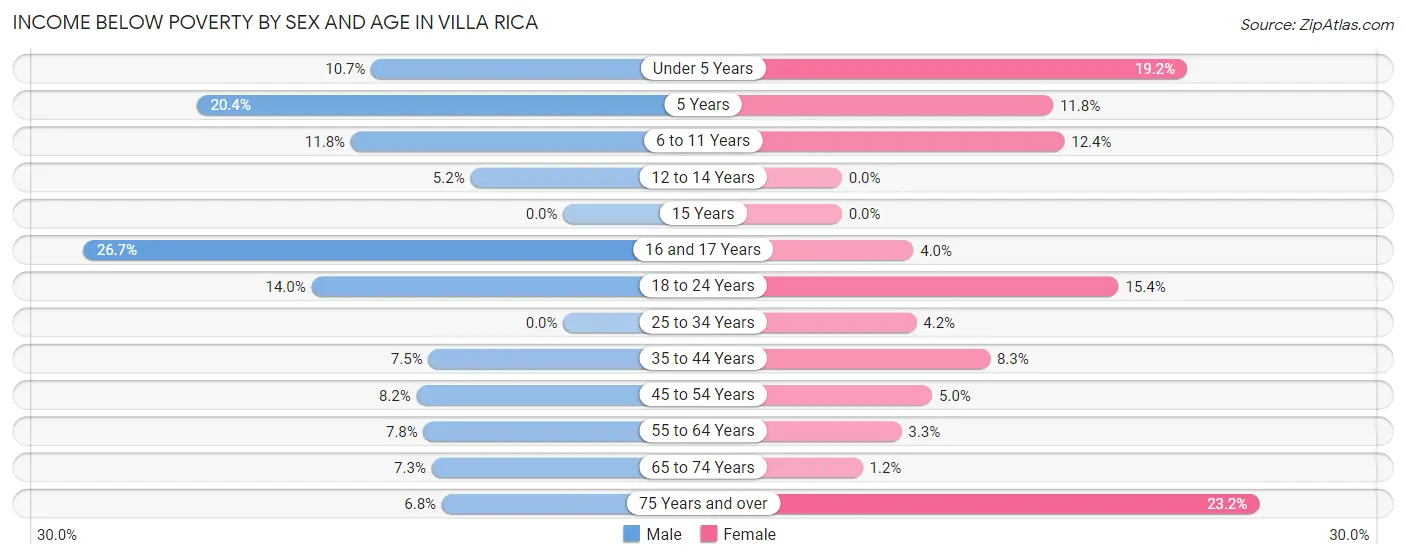
| Age Bracket | Male | Female |
| Under 5 Years | 51 (10.7%) | 108 (19.2%) |
| 5 Years | 11 (20.4%) | 10 (11.8%) |
| 6 to 11 Years | 122 (11.8%) | 129 (12.4%) |
| 12 to 14 Years | 14 (5.2%) | 0 (0.0%) |
| 15 Years | 0 (0.0%) | 0 (0.0%) |
| 16 and 17 Years | 47 (26.7%) | 21 (4.0%) |
| 18 to 24 Years | 92 (14.0%) | 86 (15.4%) |
| 25 to 34 Years | 0 (0.0%) | 56 (4.2%) |
| 35 to 44 Years | 81 (7.5%) | 146 (8.3%) |
| 45 to 54 Years | 99 (8.2%) | 54 (5.0%) |
| 55 to 64 Years | 54 (7.8%) | 32 (3.3%) |
| 65 to 74 Years | 40 (7.3%) | 7 (1.2%) |
| 75 Years and over | 15 (6.8%) | 79 (23.2%) |
| Total | 626 (8.1%) | 728 (7.6%) |
Income Above Poverty by Sex and Age in Villa Rica
According to the poverty statistics in Villa Rica, males aged 15 years and females aged 12 to 14 years are the age groups that are most secure financially, with 100.0% of males and 100.0% of females in these age groups living above the poverty line.
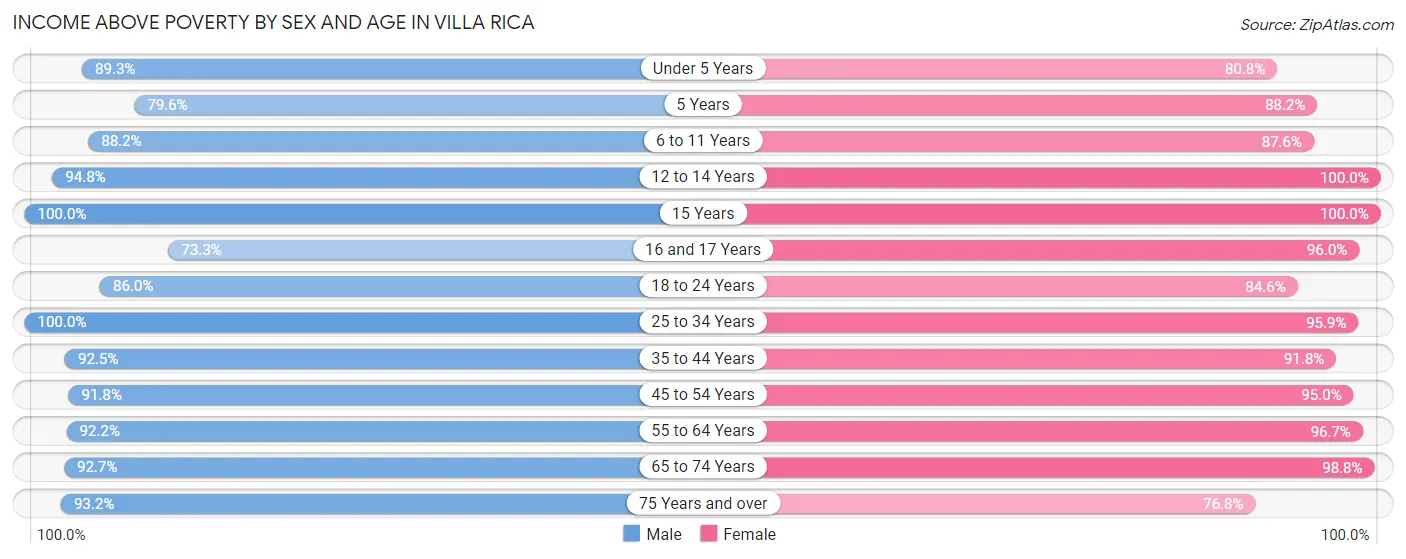
| Age Bracket | Male | Female |
| Under 5 Years | 426 (89.3%) | 454 (80.8%) |
| 5 Years | 43 (79.6%) | 75 (88.2%) |
| 6 to 11 Years | 909 (88.2%) | 912 (87.6%) |
| 12 to 14 Years | 257 (94.8%) | 377 (100.0%) |
| 15 Years | 169 (100.0%) | 260 (100.0%) |
| 16 and 17 Years | 129 (73.3%) | 507 (96.0%) |
| 18 to 24 Years | 564 (86.0%) | 472 (84.6%) |
| 25 to 34 Years | 1,163 (100.0%) | 1,293 (95.9%) |
| 35 to 44 Years | 997 (92.5%) | 1,623 (91.7%) |
| 45 to 54 Years | 1,113 (91.8%) | 1,019 (95.0%) |
| 55 to 64 Years | 640 (92.2%) | 933 (96.7%) |
| 65 to 74 Years | 506 (92.7%) | 597 (98.8%) |
| 75 Years and over | 207 (93.2%) | 261 (76.8%) |
| Total | 7,123 (91.9%) | 8,783 (92.3%) |
Income Below Poverty Among Married-Couple Families in Villa Rica
The poverty statistics for married-couple families in Villa Rica show that 4.3% or 121 of the total 2,787 families live below the poverty line. Families with 3 or 4 children have the highest poverty rate of 32.5%, comprising of 81 families. On the other hand, families with 1 or 2 children have the lowest poverty rate of 0.0%, which includes 0 families.
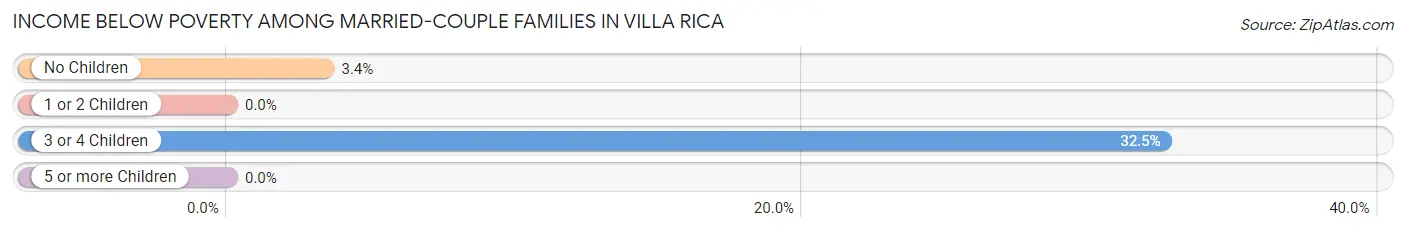
| Children | Above Poverty | Below Poverty |
| No Children | 1,152 (96.6%) | 40 (3.4%) |
| 1 or 2 Children | 1,346 (100.0%) | 0 (0.0%) |
| 3 or 4 Children | 168 (67.5%) | 81 (32.5%) |
| 5 or more Children | 0 (0.0%) | 0 (0.0%) |
| Total | 2,666 (95.7%) | 121 (4.3%) |
Income Below Poverty Among Single-Parent Households in Villa Rica
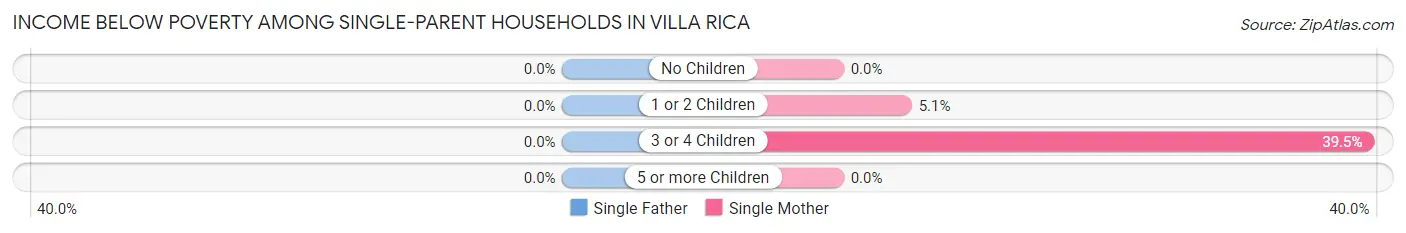
| Children | Single Father | Single Mother |
| No Children | 0 (0.0%) | 0 (0.0%) |
| 1 or 2 Children | 0 (0.0%) | 36 (5.1%) |
| 3 or 4 Children | 0 (0.0%) | 85 (39.5%) |
| 5 or more Children | 0 (0.0%) | 0 (0.0%) |
| Total | 0 (0.0%) | 121 (10.2%) |
Income Below Poverty Among Married-Couple vs Single-Parent Households in Villa Rica
The poverty data for Villa Rica shows that 121 of the married-couple family households (4.3%) and 121 of the single-parent households (7.4%) are living below the poverty level. Within the married-couple family households, those with 3 or 4 children have the highest poverty rate, with 81 households (32.5%) falling below the poverty line. Among the single-parent households, those with 3 or 4 children have the highest poverty rate, with 85 household (37.4%) living below poverty.
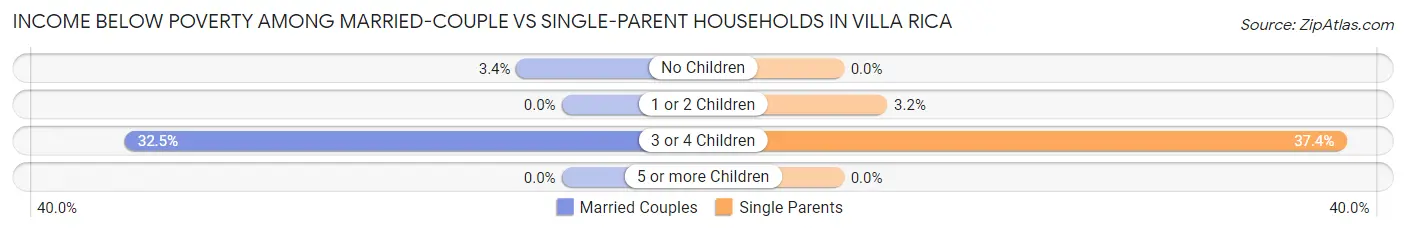
| Children | Married-Couple Families | Single-Parent Households |
| No Children | 40 (3.4%) | 0 (0.0%) |
| 1 or 2 Children | 0 (0.0%) | 36 (3.2%) |
| 3 or 4 Children | 81 (32.5%) | 85 (37.4%) |
| 5 or more Children | 0 (0.0%) | 0 (0.0%) |
| Total | 121 (4.3%) | 121 (7.4%) |
Race in Villa Rica
The most populous races in Villa Rica are Black / African American (7,759 | 44.7%), White / Caucasian (7,478 | 43.1%), and Hispanic or Latino (1,455 | 8.4%).
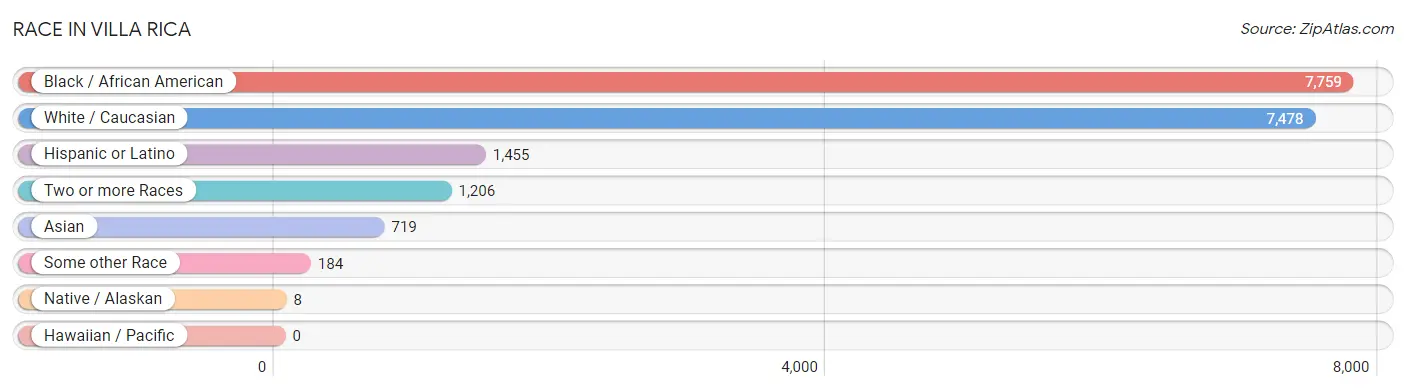
| Race | # Population | % Population |
| Asian | 719 | 4.1% |
| Black / African American | 7,759 | 44.7% |
| Hawaiian / Pacific | 0 | 0.0% |
| Hispanic or Latino | 1,455 | 8.4% |
| Native / Alaskan | 8 | 0.1% |
| White / Caucasian | 7,478 | 43.1% |
| Two or more Races | 1,206 | 7.0% |
| Some other Race | 184 | 1.1% |
| Total | 17,354 | 100.0% |
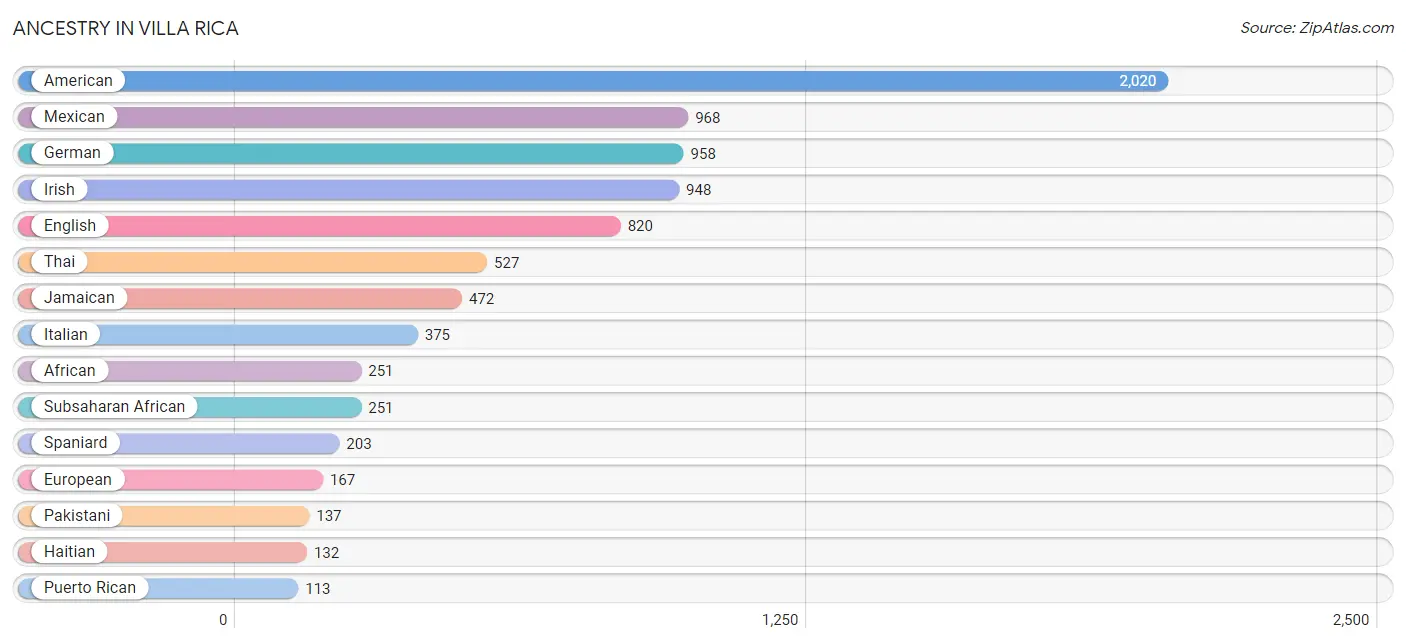
Ancestry in Villa Rica
The most populous ancestries reported in Villa Rica are American (2,020 | 11.6%), Mexican (968 | 5.6%), German (958 | 5.5%), Irish (948 | 5.5%), and English (820 | 4.7%), together accounting for 32.9% of all Villa Rica residents.
| Ancestry | # Population | % Population |
| African | 251 | 1.5% |
| Aleut | 11 | 0.1% |
| American | 2,020 | 11.6% |
| Argentinean | 2 | 0.0% |
| Austrian | 13 | 0.1% |
| Belgian | 20 | 0.1% |
| Belizean | 16 | 0.1% |
| Bermudan | 16 | 0.1% |
| Bhutanese | 5 | 0.0% |
| British | 22 | 0.1% |
| Burmese | 17 | 0.1% |
| Canadian | 1 | 0.0% |
| Central American | 56 | 0.3% |
| Cherokee | 55 | 0.3% |
| Crow | 98 | 0.6% |
| Cuban | 69 | 0.4% |
| Czechoslovakian | 13 | 0.1% |
| Dutch | 70 | 0.4% |
| Ecuadorian | 44 | 0.3% |
| English | 820 | 4.7% |
| European | 167 | 1.0% |
| French | 34 | 0.2% |
| French Canadian | 24 | 0.1% |
| German | 958 | 5.5% |
| Greek | 10 | 0.1% |
| Haitian | 132 | 0.8% |
| Indian (Asian) | 19 | 0.1% |
| Iranian | 15 | 0.1% |
| Irish | 948 | 5.5% |
| Italian | 375 | 2.2% |
| Jamaican | 472 | 2.7% |
| Japanese | 80 | 0.5% |
| Korean | 67 | 0.4% |
| Latvian | 24 | 0.1% |
| Malaysian | 57 | 0.3% |
| Mexican | 968 | 5.6% |
| Navajo | 8 | 0.1% |
| Pakistani | 137 | 0.8% |
| Polish | 48 | 0.3% |
| Puerto Rican | 113 | 0.6% |
| Salvadoran | 56 | 0.3% |
| Scandinavian | 39 | 0.2% |
| Scotch-Irish | 112 | 0.6% |
| Scottish | 70 | 0.4% |
| Slovene | 10 | 0.1% |
| South American | 46 | 0.3% |
| Spaniard | 203 | 1.2% |
| Subsaharan African | 251 | 1.5% |
| Swedish | 40 | 0.2% |
| Thai | 527 | 3.0% |
| Turkish | 14 | 0.1% | View All 51 Rows |
Immigrants in Villa Rica
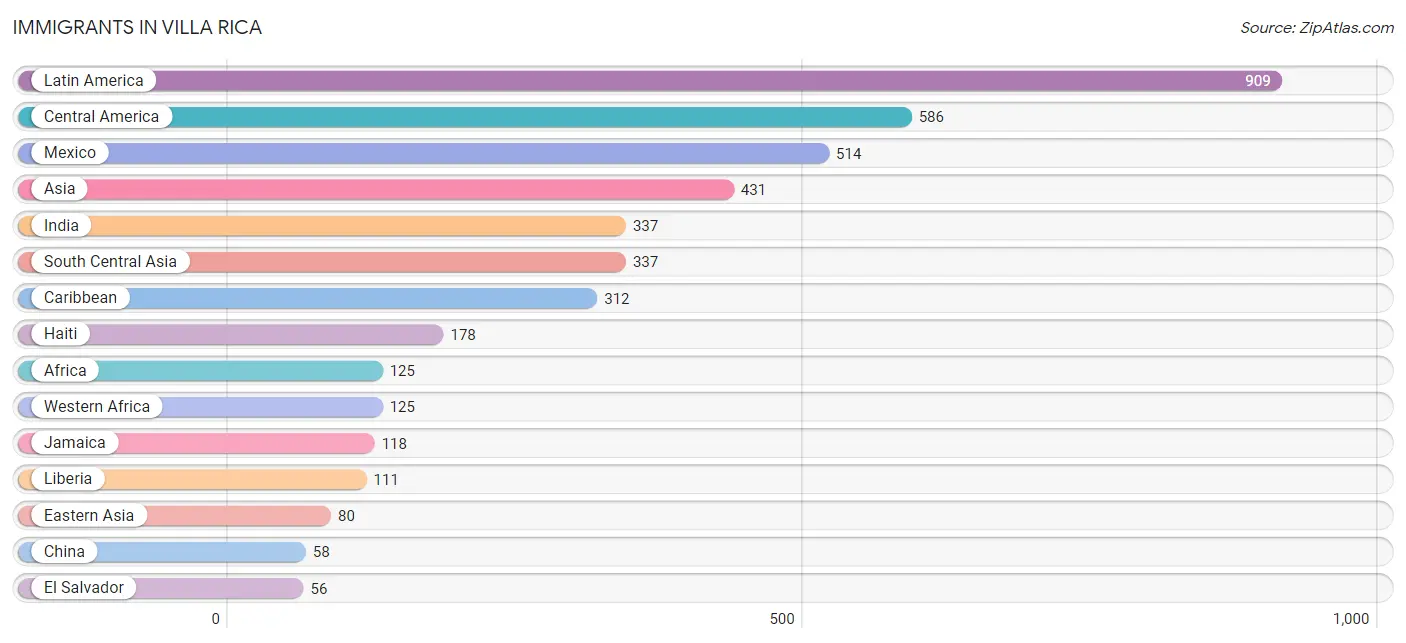
The most numerous immigrant groups reported in Villa Rica came from Latin America (909 | 5.2%), Central America (586 | 3.4%), Mexico (514 | 3.0%), Asia (431 | 2.5%), and India (337 | 1.9%), together accounting for 16.0% of all Villa Rica residents.
| Immigration Origin | # Population | % Population |
| Africa | 125 | 0.7% |
| Argentina | 2 | 0.0% |
| Asia | 431 | 2.5% |
| Austria | 13 | 0.1% |
| Belize | 16 | 0.1% |
| Canada | 18 | 0.1% |
| Caribbean | 312 | 1.8% |
| Central America | 586 | 3.4% |
| China | 58 | 0.3% |
| Cuba | 16 | 0.1% |
| Eastern Asia | 80 | 0.5% |
| Ecuador | 9 | 0.1% |
| El Salvador | 56 | 0.3% |
| Europe | 24 | 0.1% |
| Haiti | 178 | 1.0% |
| India | 337 | 1.9% |
| Jamaica | 118 | 0.7% |
| Japan | 5 | 0.0% |
| Korea | 17 | 0.1% |
| Latin America | 909 | 5.2% |
| Liberia | 111 | 0.6% |
| Mexico | 514 | 3.0% |
| Netherlands | 11 | 0.1% |
| Nigeria | 14 | 0.1% |
| Philippines | 14 | 0.1% |
| South America | 11 | 0.1% |
| South Central Asia | 337 | 1.9% |
| South Eastern Asia | 14 | 0.1% |
| Taiwan | 5 | 0.0% |
| Western Africa | 125 | 0.7% |
| Western Europe | 24 | 0.1% | View All 31 Rows |
Sex and Age in Villa Rica
Sex and Age in Villa Rica
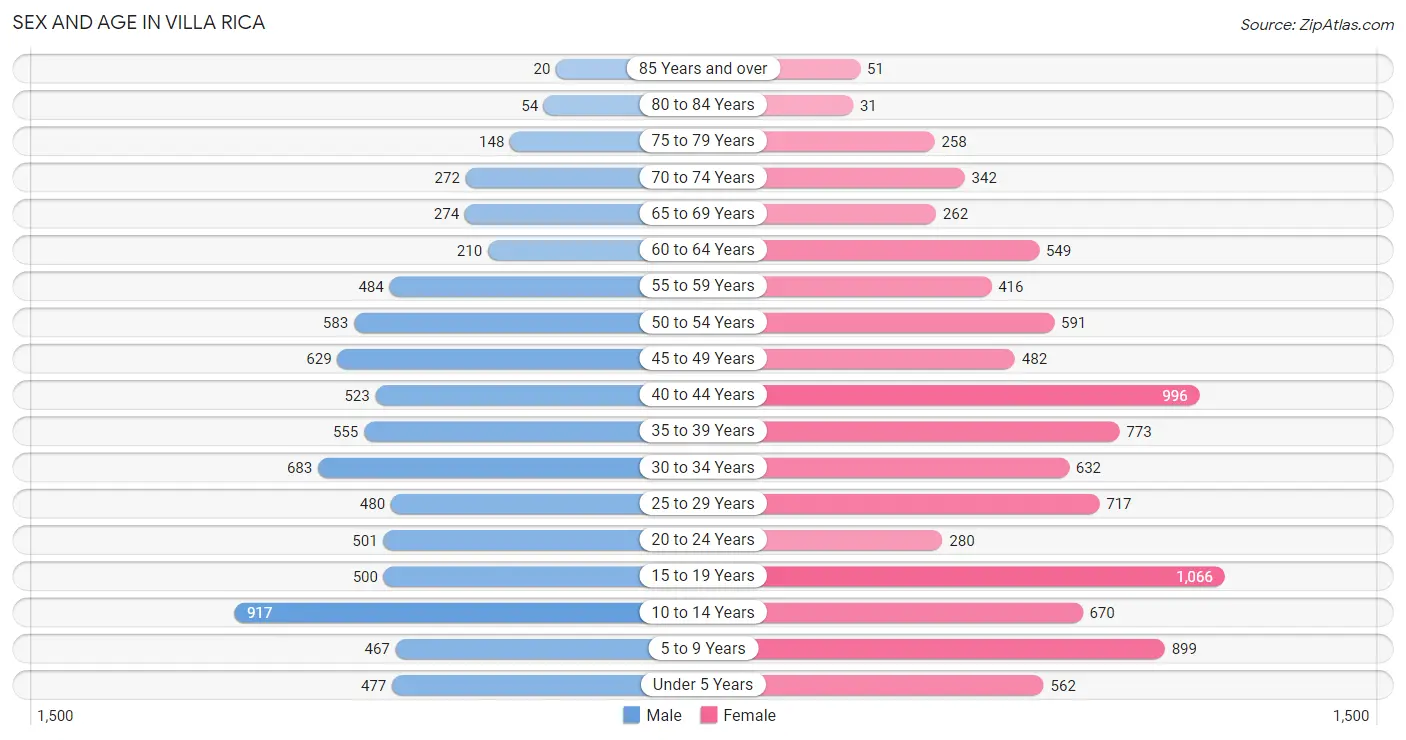
The most populous age groups in Villa Rica are 10 to 14 Years (917 | 11.8%) for men and 15 to 19 Years (1,066 | 11.1%) for women.
| Age Bracket | Male | Female |
| Under 5 Years | 477 (6.1%) | 562 (5.9%) |
| 5 to 9 Years | 467 (6.0%) | 899 (9.4%) |
| 10 to 14 Years | 917 (11.8%) | 670 (7.0%) |
| 15 to 19 Years | 500 (6.4%) | 1,066 (11.1%) |
| 20 to 24 Years | 501 (6.4%) | 280 (2.9%) |
| 25 to 29 Years | 480 (6.2%) | 717 (7.5%) |
| 30 to 34 Years | 683 (8.8%) | 632 (6.6%) |
| 35 to 39 Years | 555 (7.1%) | 773 (8.1%) |
| 40 to 44 Years | 523 (6.7%) | 996 (10.4%) |
| 45 to 49 Years | 629 (8.1%) | 482 (5.0%) |
| 50 to 54 Years | 583 (7.5%) | 591 (6.2%) |
| 55 to 59 Years | 484 (6.2%) | 416 (4.3%) |
| 60 to 64 Years | 210 (2.7%) | 549 (5.7%) |
| 65 to 69 Years | 274 (3.5%) | 262 (2.7%) |
| 70 to 74 Years | 272 (3.5%) | 342 (3.6%) |
| 75 to 79 Years | 148 (1.9%) | 258 (2.7%) |
| 80 to 84 Years | 54 (0.7%) | 31 (0.3%) |
| 85 Years and over | 20 (0.3%) | 51 (0.5%) |
| Total | 7,777 (100.0%) | 9,577 (100.0%) |
Families and Households in Villa Rica
Median Family Size in Villa Rica
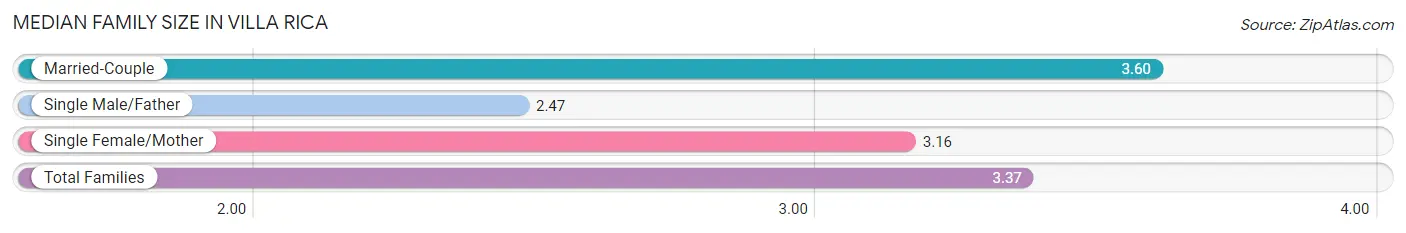
The median family size in Villa Rica is 3.37 persons per family, with married-couple families (2,787 | 63.0%) accounting for the largest median family size of 3.6 persons per family. On the other hand, single male/father families (448 | 10.1%) represent the smallest median family size with 2.47 persons per family.
| Family Type | # Families | Family Size |
| Married-Couple | 2,787 (63.0%) | 3.60 |
| Single Male/Father | 448 (10.1%) | 2.47 |
| Single Female/Mother | 1,185 (26.8%) | 3.16 |
| Total Families | 4,420 (100.0%) | 3.37 |
Median Household Size in Villa Rica
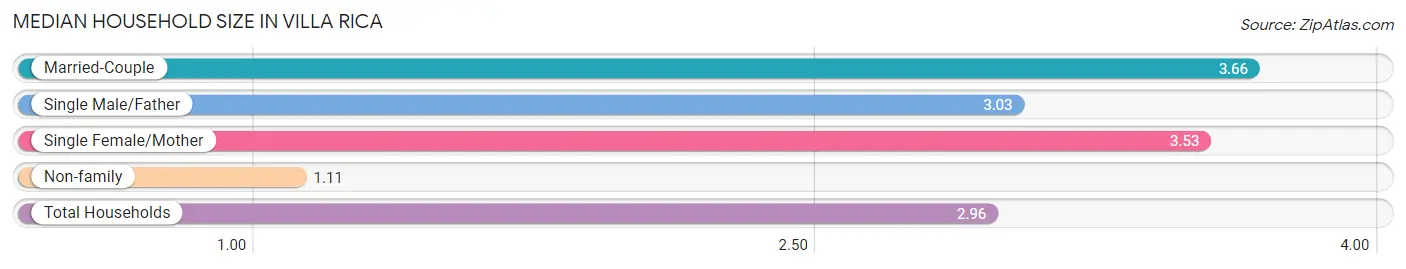
The median household size in Villa Rica is 2.96 persons per household, with married-couple households (2,787 | 47.5%) accounting for the largest median household size of 3.66 persons per household. non-family households (1,442 | 24.6%) represent the smallest median household size with 1.11 persons per household.
| Household Type | # Households | Household Size |
| Married-Couple | 2,787 (47.5%) | 3.66 |
| Single Male/Father | 448 (7.6%) | 3.03 |
| Single Female/Mother | 1,185 (20.2%) | 3.53 |
| Non-family | 1,442 (24.6%) | 1.11 |
| Total Households | 5,862 (100.0%) | 2.96 |
Household Size by Marriage Status in Villa Rica
Out of a total of 5,862 households in Villa Rica, 4,420 (75.4%) are family households, while 1,442 (24.6%) are nonfamily households. The most numerous type of family households are 2-person households, comprising 1,246, and the most common type of nonfamily households are 1-person households, comprising 1,291.
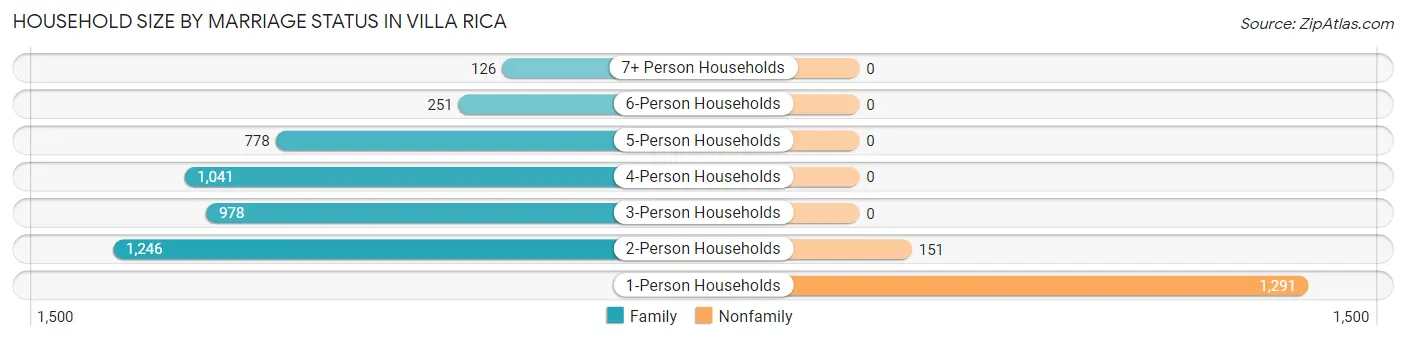
| Household Size | Family Households | Nonfamily Households |
| 1-Person Households | - | 1,291 (22.0%) |
| 2-Person Households | 1,246 (21.3%) | 151 (2.6%) |
| 3-Person Households | 978 (16.7%) | 0 (0.0%) |
| 4-Person Households | 1,041 (17.8%) | 0 (0.0%) |
| 5-Person Households | 778 (13.3%) | 0 (0.0%) |
| 6-Person Households | 251 (4.3%) | 0 (0.0%) |
| 7+ Person Households | 126 (2.1%) | 0 (0.0%) |
| Total | 4,420 (75.4%) | 1,442 (24.6%) |
Female Fertility in Villa Rica
Fertility by Age in Villa Rica
Average fertility rate in Villa Rica is 35.0 births per 1,000 women. Women in the age bracket of 20 to 34 years have the highest fertility rate with 47.0 births per 1,000 women. Women in the age bracket of 35 to 50 years acount for 56.7% of all women with births.
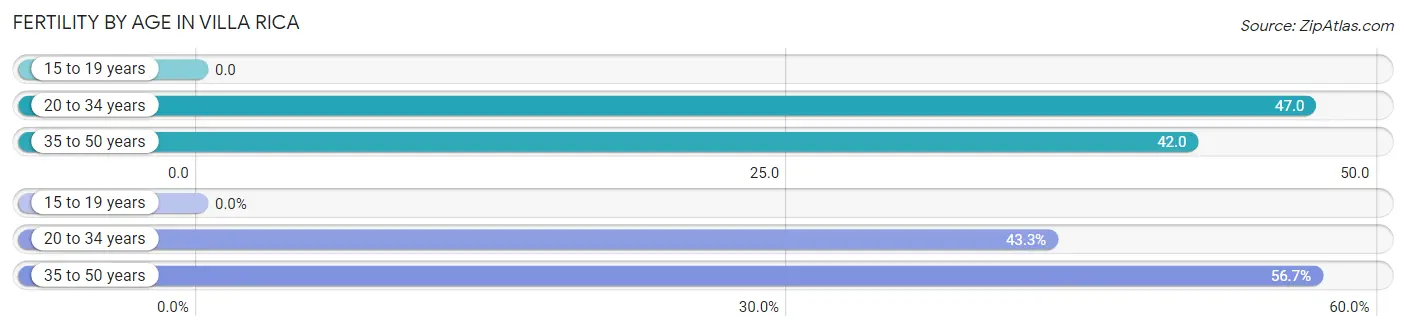
| Age Bracket | Women with Births | Births / 1,000 Women |
| 15 to 19 years | 0 (0.0%) | 0.0 |
| 20 to 34 years | 77 (43.3%) | 47.0 |
| 35 to 50 years | 101 (56.7%) | 42.0 |
| Total | 178 (100.0%) | 35.0 |
Fertility by Age by Marriage Status in Villa Rica
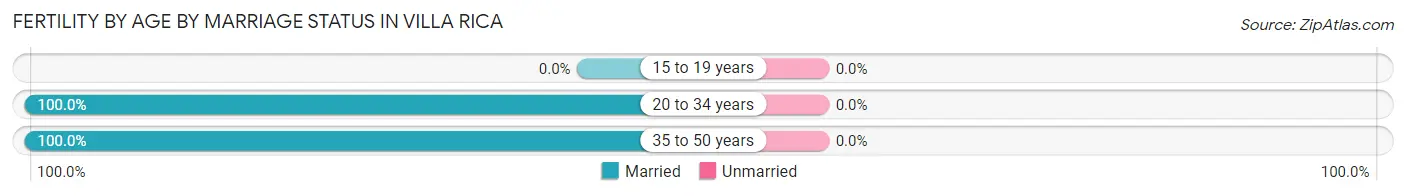
| Age Bracket | Married | Unmarried |
| 15 to 19 years | 0 (0.0%) | 0 (0.0%) |
| 20 to 34 years | 77 (100.0%) | 0 (0.0%) |
| 35 to 50 years | 101 (100.0%) | 0 (0.0%) |
| Total | 178 (100.0%) | 0 (0.0%) |
Fertility by Education in Villa Rica
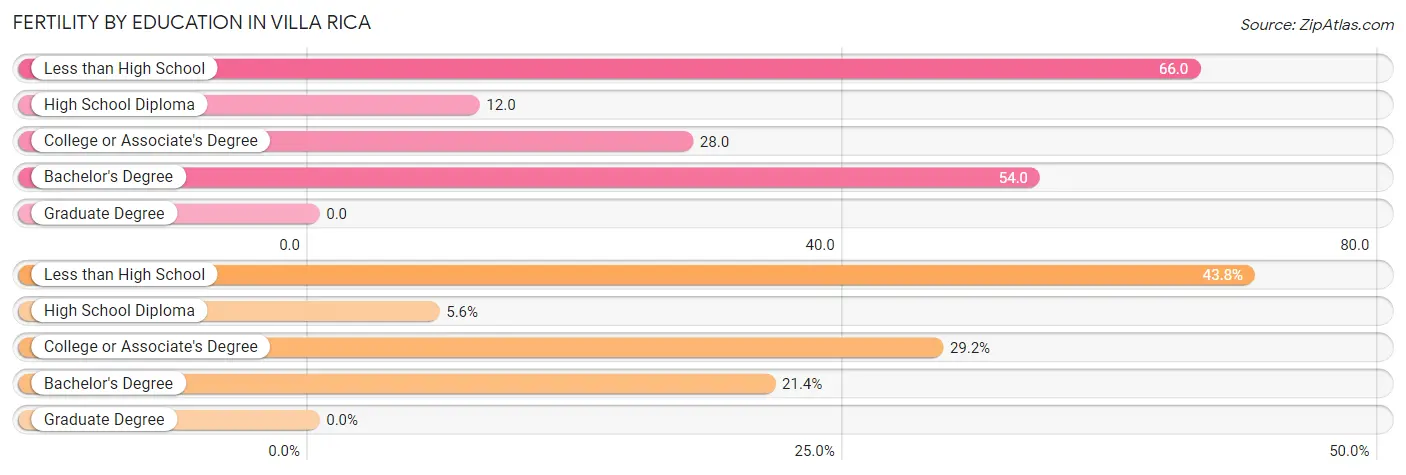
| Educational Attainment | Women with Births | Births / 1,000 Women |
| Less than High School | 78 (43.8%) | 66.0 |
| High School Diploma | 10 (5.6%) | 12.0 |
| College or Associate's Degree | 52 (29.2%) | 28.0 |
| Bachelor's Degree | 38 (21.3%) | 54.0 |
| Graduate Degree | 0 (0.0%) | 0.0 |
| Total | 178 (100.0%) | 35.0 |
Fertility by Education by Marriage Status in Villa Rica
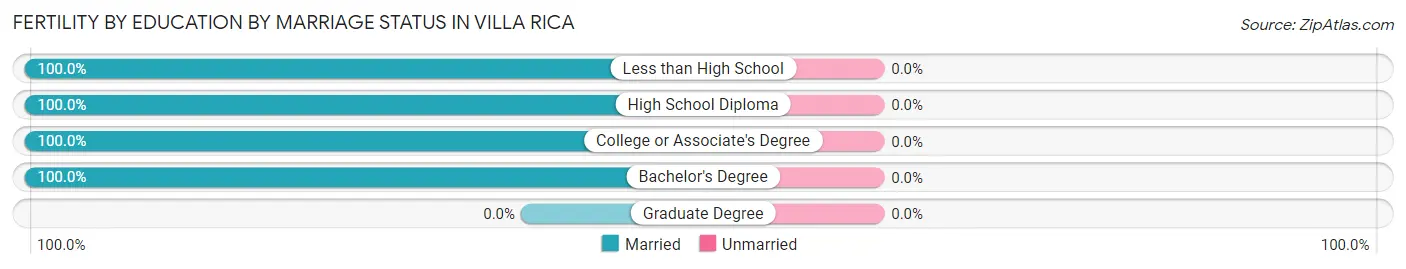
| Educational Attainment | Married | Unmarried |
| Less than High School | 78 (100.0%) | 0 (0.0%) |
| High School Diploma | 10 (100.0%) | 0 (0.0%) |
| College or Associate's Degree | 52 (100.0%) | 0 (0.0%) |
| Bachelor's Degree | 38 (100.0%) | 0 (0.0%) |
| Graduate Degree | 0 (0.0%) | 0 (0.0%) |
| Total | 178 (100.0%) | 0 (0.0%) |
Employment Characteristics in Villa Rica
Employment by Class of Employer in Villa Rica
Among the 8,770 employed individuals in Villa Rica, private company employees (6,364 | 72.6%), local government employees (776 | 8.8%), and self-employed (incorporated) (461 | 5.3%) make up the most common classes of employment.
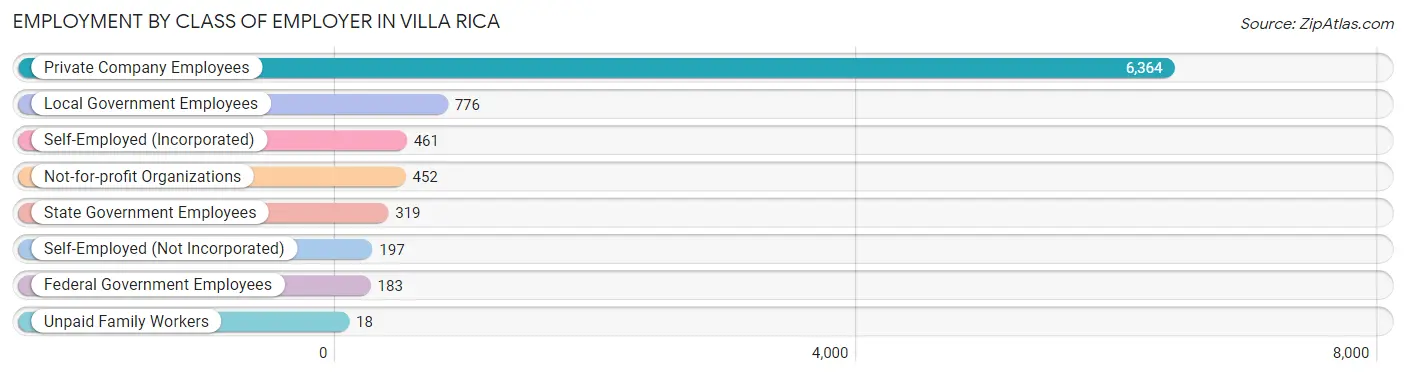
| Employer Class | # Employees | % Employees |
| Private Company Employees | 6,364 | 72.6% |
| Self-Employed (Incorporated) | 461 | 5.3% |
| Self-Employed (Not Incorporated) | 197 | 2.2% |
| Not-for-profit Organizations | 452 | 5.1% |
| Local Government Employees | 776 | 8.8% |
| State Government Employees | 319 | 3.6% |
| Federal Government Employees | 183 | 2.1% |
| Unpaid Family Workers | 18 | 0.2% |
| Total | 8,770 | 100.0% |
Employment Status by Age in Villa Rica
According to the labor force statistics for Villa Rica, out of the total population over 16 years of age (12,933), 71.8% or 9,286 individuals are in the labor force, with 4.4% or 409 of them unemployed. The age group with the highest labor force participation rate is 25 to 29 years, with 93.3% or 1,117 individuals in the labor force. Within the labor force, the 25 to 29 years age range has the highest percentage of unemployed individuals, with 9.4% or 105 of them being unemployed.
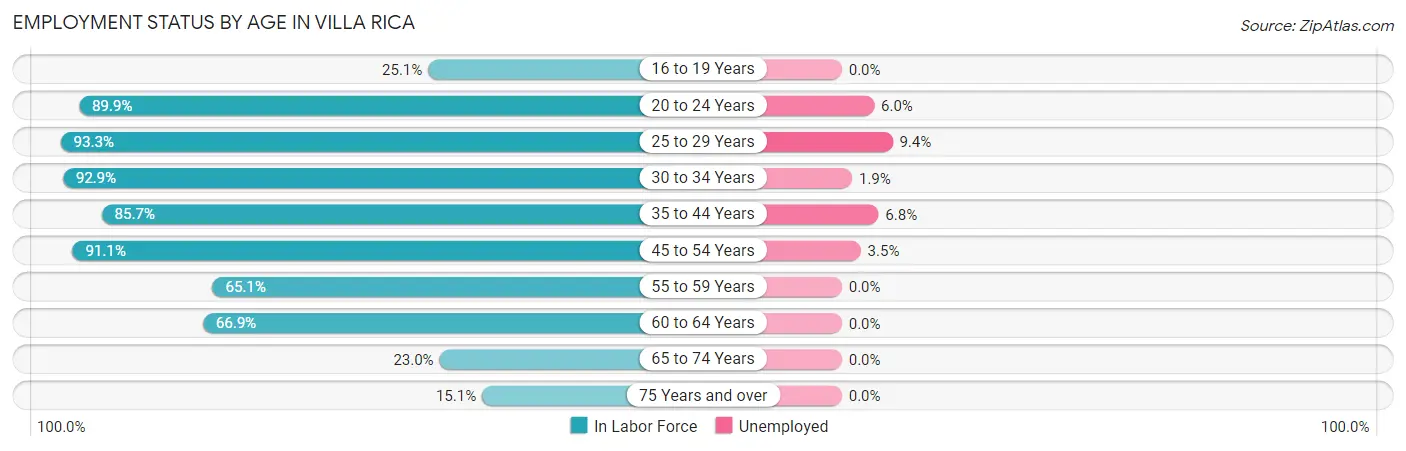
| Age Bracket | In Labor Force | Unemployed |
| 16 to 19 Years | 285 (25.1%) | 0 (0.0%) |
| 20 to 24 Years | 702 (89.9%) | 42 (6.0%) |
| 25 to 29 Years | 1,117 (93.3%) | 105 (9.4%) |
| 30 to 34 Years | 1,222 (92.9%) | 23 (1.9%) |
| 35 to 44 Years | 2,440 (85.7%) | 166 (6.8%) |
| 45 to 54 Years | 2,082 (91.1%) | 73 (3.5%) |
| 55 to 59 Years | 586 (65.1%) | 0 (0.0%) |
| 60 to 64 Years | 508 (66.9%) | 0 (0.0%) |
| 65 to 74 Years | 264 (23.0%) | 0 (0.0%) |
| 75 Years and over | 85 (15.1%) | 0 (0.0%) |
| Total | 9,286 (71.8%) | 409 (4.4%) |
Employment Status by Educational Attainment in Villa Rica
According to labor force statistics for Villa Rica, 85.5% of individuals (7,954) out of the total population between 25 and 64 years of age (9,303) are in the labor force, with 4.6% or 366 of them being unemployed. The group with the highest labor force participation rate are those with the educational attainment of high school diploma, with 89.3% or 2,162 individuals in the labor force. Within the labor force, individuals with bachelor's degree or higher education have the highest percentage of unemployment, with 5.0% or 111 of them being unemployed.
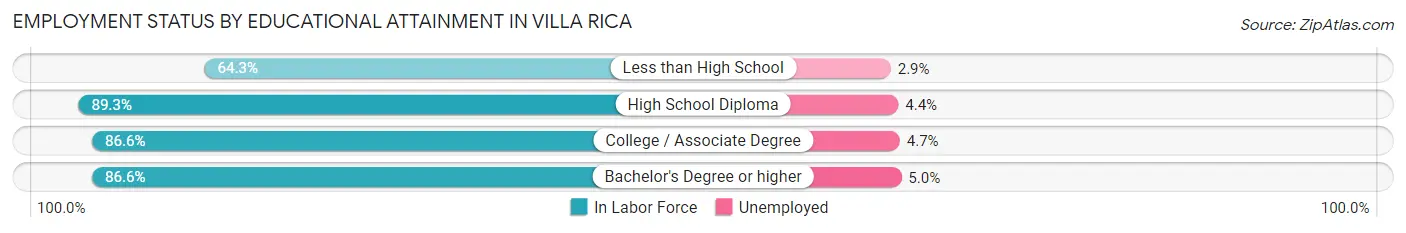
| Educational Attainment | In Labor Force | Unemployed |
| Less than High School | 483 (64.3%) | 22 (2.9%) |
| High School Diploma | 2,162 (89.3%) | 107 (4.4%) |
| College / Associate Degree | 3,086 (86.6%) | 168 (4.7%) |
| Bachelor's Degree or higher | 2,223 (86.6%) | 128 (5.0%) |
| Total | 7,954 (85.5%) | 428 (4.6%) |
Employment Occupations by Sex in Villa Rica
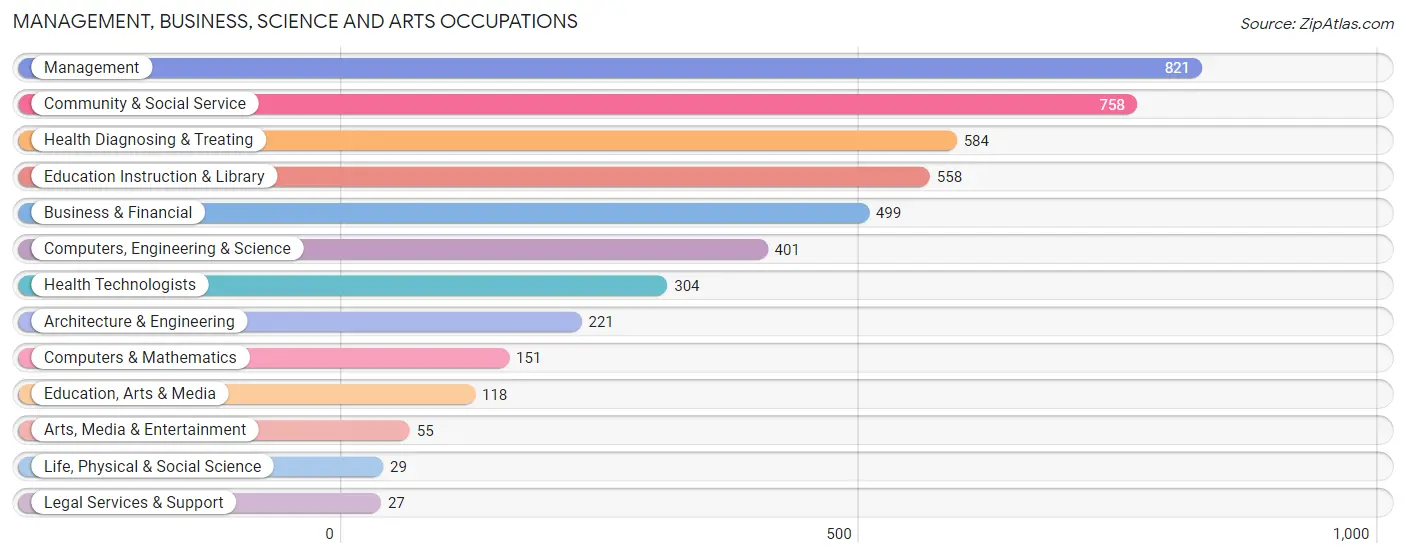
Management, Business, Science and Arts Occupations
The most common Management, Business, Science and Arts occupations in Villa Rica are Management (821 | 9.2%), Community & Social Service (758 | 8.5%), Health Diagnosing & Treating (584 | 6.6%), Education Instruction & Library (558 | 6.3%), and Business & Financial (499 | 5.6%).
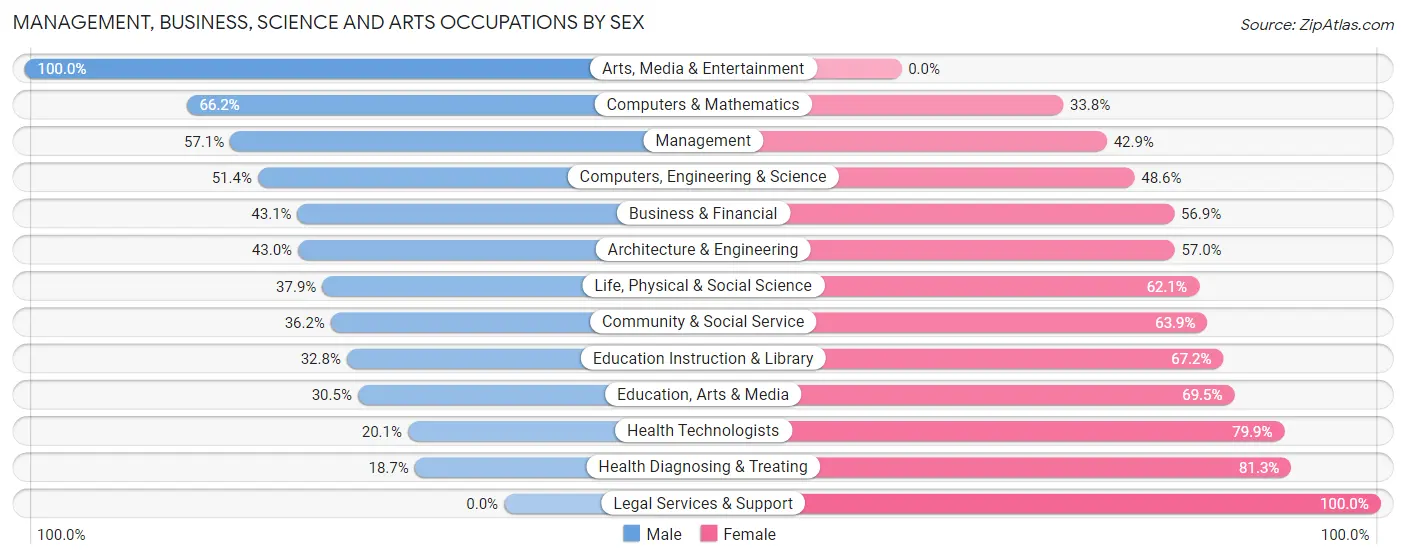
Management, Business, Science and Arts Occupations by Sex
Within the Management, Business, Science and Arts occupations in Villa Rica, the most male-oriented occupations are Arts, Media & Entertainment (100.0%), Computers & Mathematics (66.2%), and Management (57.1%), while the most female-oriented occupations are Legal Services & Support (100.0%), Health Diagnosing & Treating (81.3%), and Health Technologists (79.9%).
| Occupation | Male | Female |
| Management | 469 (57.1%) | 352 (42.9%) |
| Business & Financial | 215 (43.1%) | 284 (56.9%) |
| Computers, Engineering & Science | 206 (51.4%) | 195 (48.6%) |
| Computers & Mathematics | 100 (66.2%) | 51 (33.8%) |
| Architecture & Engineering | 95 (43.0%) | 126 (57.0%) |
| Life, Physical & Social Science | 11 (37.9%) | 18 (62.1%) |
| Community & Social Service | 274 (36.1%) | 484 (63.8%) |
| Education, Arts & Media | 36 (30.5%) | 82 (69.5%) |
| Legal Services & Support | 0 (0.0%) | 27 (100.0%) |
| Education Instruction & Library | 183 (32.8%) | 375 (67.2%) |
| Arts, Media & Entertainment | 55 (100.0%) | 0 (0.0%) |
| Health Diagnosing & Treating | 109 (18.7%) | 475 (81.3%) |
| Health Technologists | 61 (20.1%) | 243 (79.9%) |
| Total (Category) | 1,273 (41.6%) | 1,790 (58.4%) |
| Total (Overall) | 4,486 (50.5%) | 4,399 (49.5%) |
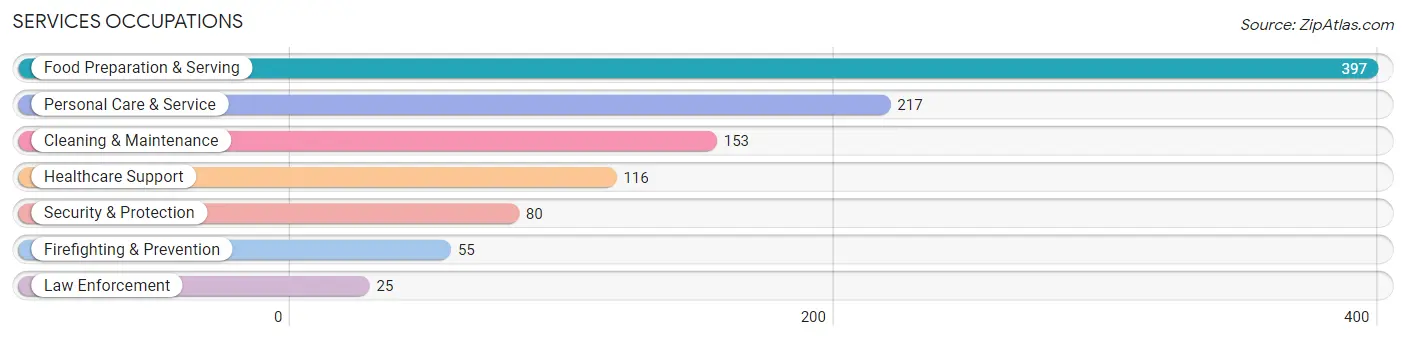
Services Occupations
The most common Services occupations in Villa Rica are Food Preparation & Serving (397 | 4.5%), Personal Care & Service (217 | 2.4%), Cleaning & Maintenance (153 | 1.7%), Healthcare Support (116 | 1.3%), and Security & Protection (80 | 0.9%).
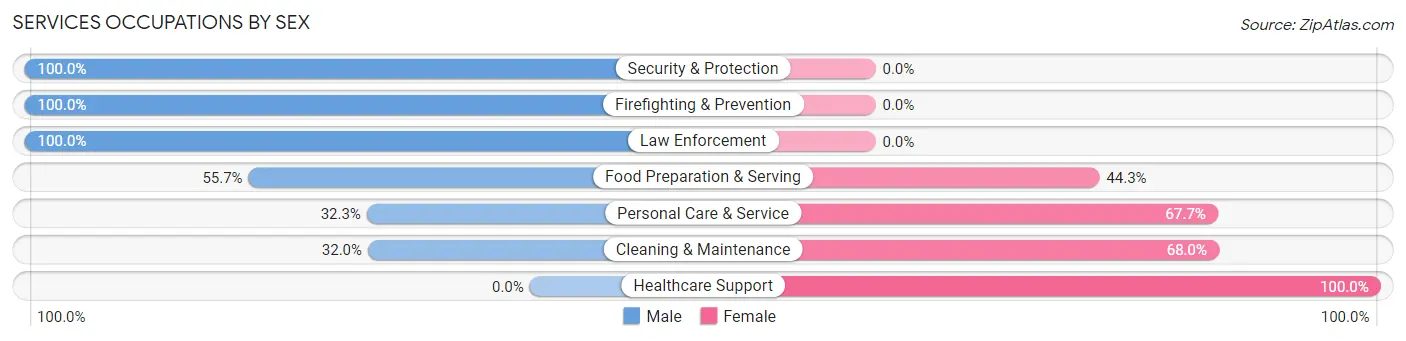
Services Occupations by Sex
Within the Services occupations in Villa Rica, the most male-oriented occupations are Security & Protection (100.0%), Firefighting & Prevention (100.0%), and Law Enforcement (100.0%), while the most female-oriented occupations are Healthcare Support (100.0%), Cleaning & Maintenance (68.0%), and Personal Care & Service (67.7%).
| Occupation | Male | Female |
| Healthcare Support | 0 (0.0%) | 116 (100.0%) |
| Security & Protection | 80 (100.0%) | 0 (0.0%) |
| Firefighting & Prevention | 55 (100.0%) | 0 (0.0%) |
| Law Enforcement | 25 (100.0%) | 0 (0.0%) |
| Food Preparation & Serving | 221 (55.7%) | 176 (44.3%) |
| Cleaning & Maintenance | 49 (32.0%) | 104 (68.0%) |
| Personal Care & Service | 70 (32.3%) | 147 (67.7%) |
| Total (Category) | 420 (43.6%) | 543 (56.4%) |
| Total (Overall) | 4,486 (50.5%) | 4,399 (49.5%) |
Sales and Office Occupations
The most common Sales and Office occupations in Villa Rica are Office & Administration (1,262 | 14.2%), and Sales & Related (913 | 10.3%).

Sales and Office Occupations by Sex
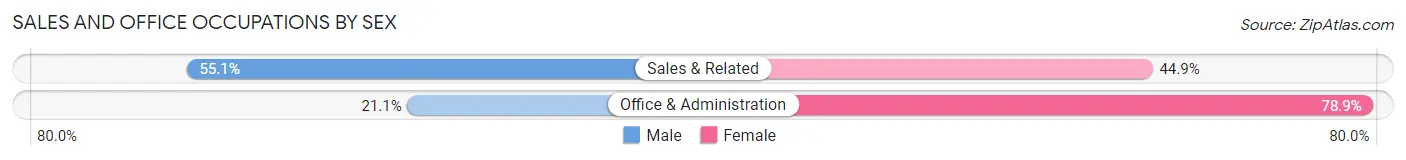
| Occupation | Male | Female |
| Sales & Related | 503 (55.1%) | 410 (44.9%) |
| Office & Administration | 266 (21.1%) | 996 (78.9%) |
| Total (Category) | 769 (35.4%) | 1,406 (64.6%) |
| Total (Overall) | 4,486 (50.5%) | 4,399 (49.5%) |
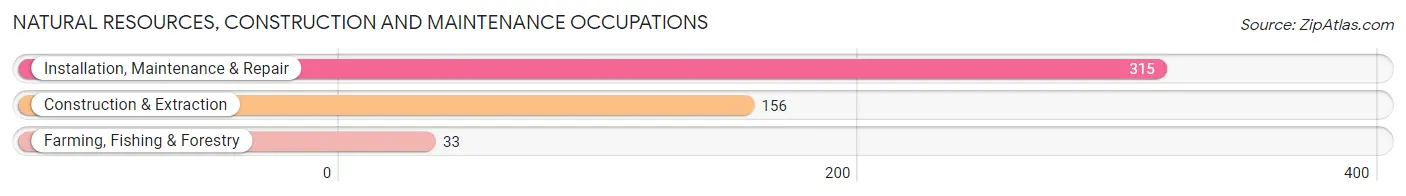
Natural Resources, Construction and Maintenance Occupations
The most common Natural Resources, Construction and Maintenance occupations in Villa Rica are Installation, Maintenance & Repair (315 | 3.5%), Construction & Extraction (156 | 1.8%), and Farming, Fishing & Forestry (33 | 0.4%).
Natural Resources, Construction and Maintenance Occupations by Sex
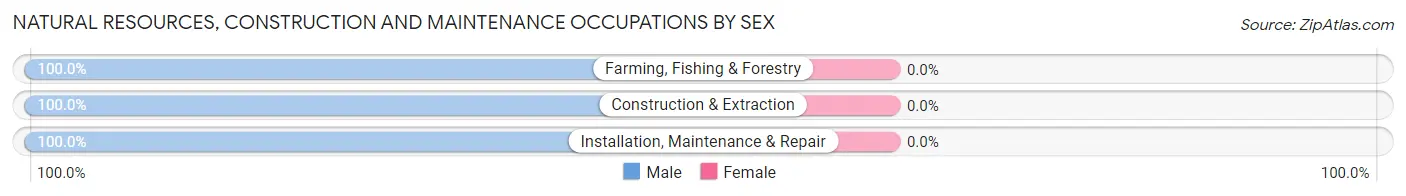
| Occupation | Male | Female |
| Farming, Fishing & Forestry | 33 (100.0%) | 0 (0.0%) |
| Construction & Extraction | 156 (100.0%) | 0 (0.0%) |
| Installation, Maintenance & Repair | 315 (100.0%) | 0 (0.0%) |
| Total (Category) | 504 (100.0%) | 0 (0.0%) |
| Total (Overall) | 4,486 (50.5%) | 4,399 (49.5%) |
Production, Transportation and Moving Occupations
The most common Production, Transportation and Moving occupations in Villa Rica are Production (1,036 | 11.7%), Material Moving (707 | 8.0%), and Transportation (437 | 4.9%).
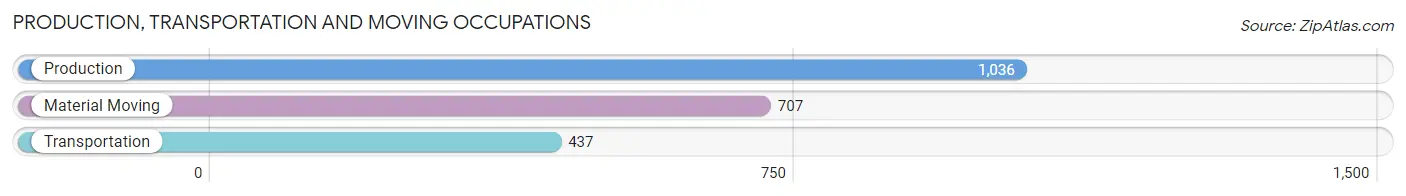
Production, Transportation and Moving Occupations by Sex
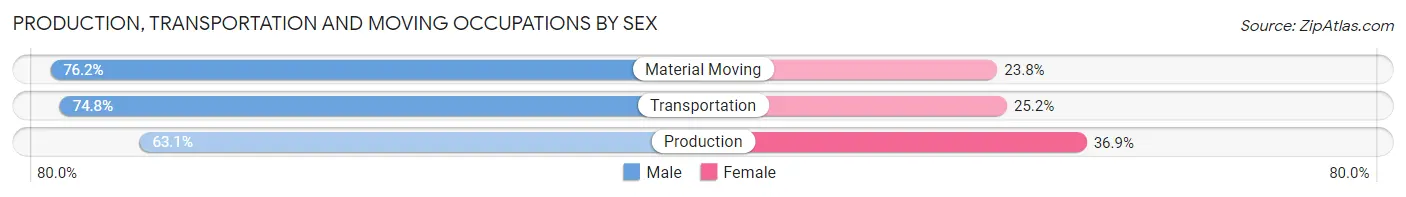
| Occupation | Male | Female |
| Production | 654 (63.1%) | 382 (36.9%) |
| Transportation | 327 (74.8%) | 110 (25.2%) |
| Material Moving | 539 (76.2%) | 168 (23.8%) |
| Total (Category) | 1,520 (69.7%) | 660 (30.3%) |
| Total (Overall) | 4,486 (50.5%) | 4,399 (49.5%) |
Employment Industries by Sex in Villa Rica
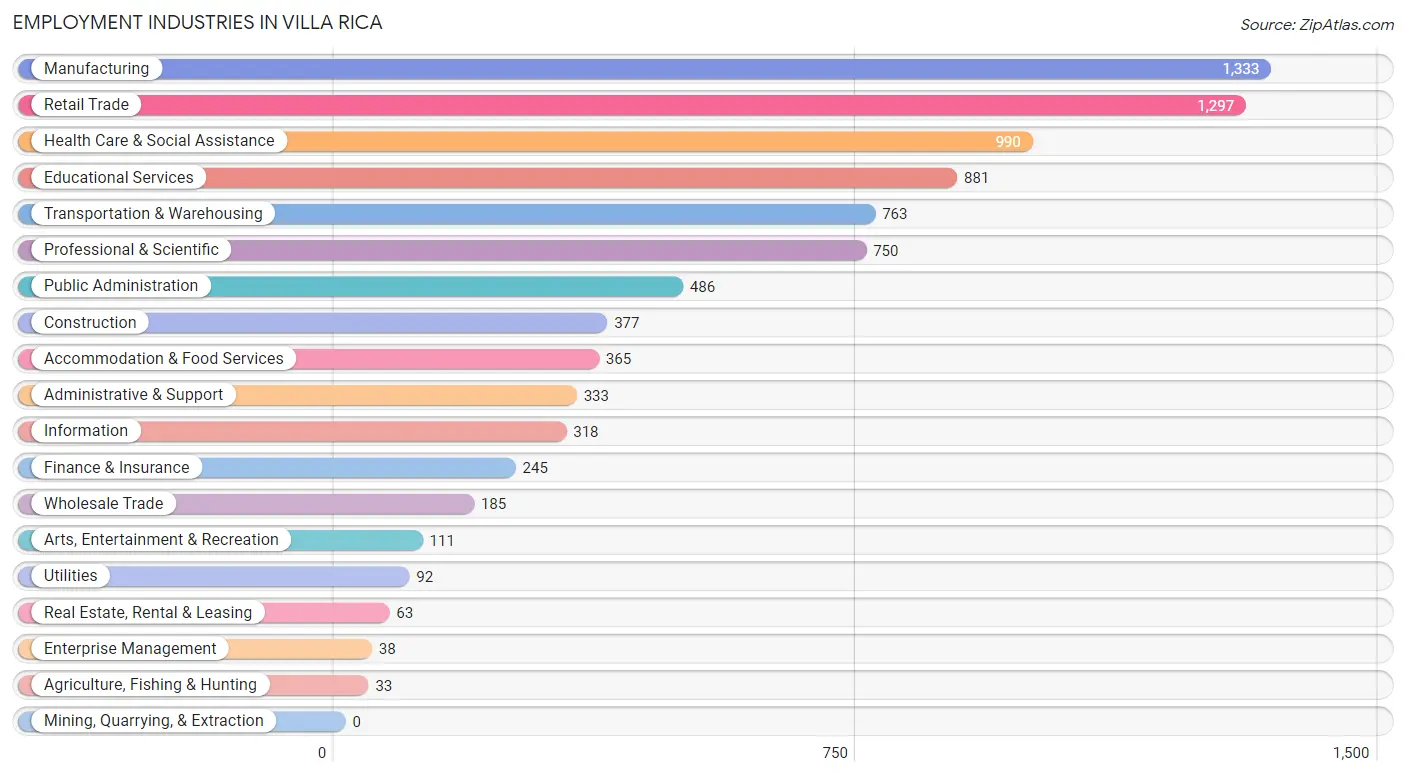
Employment Industries in Villa Rica
The major employment industries in Villa Rica include Manufacturing (1,333 | 15.0%), Retail Trade (1,297 | 14.6%), Health Care & Social Assistance (990 | 11.1%), Educational Services (881 | 9.9%), and Transportation & Warehousing (763 | 8.6%).
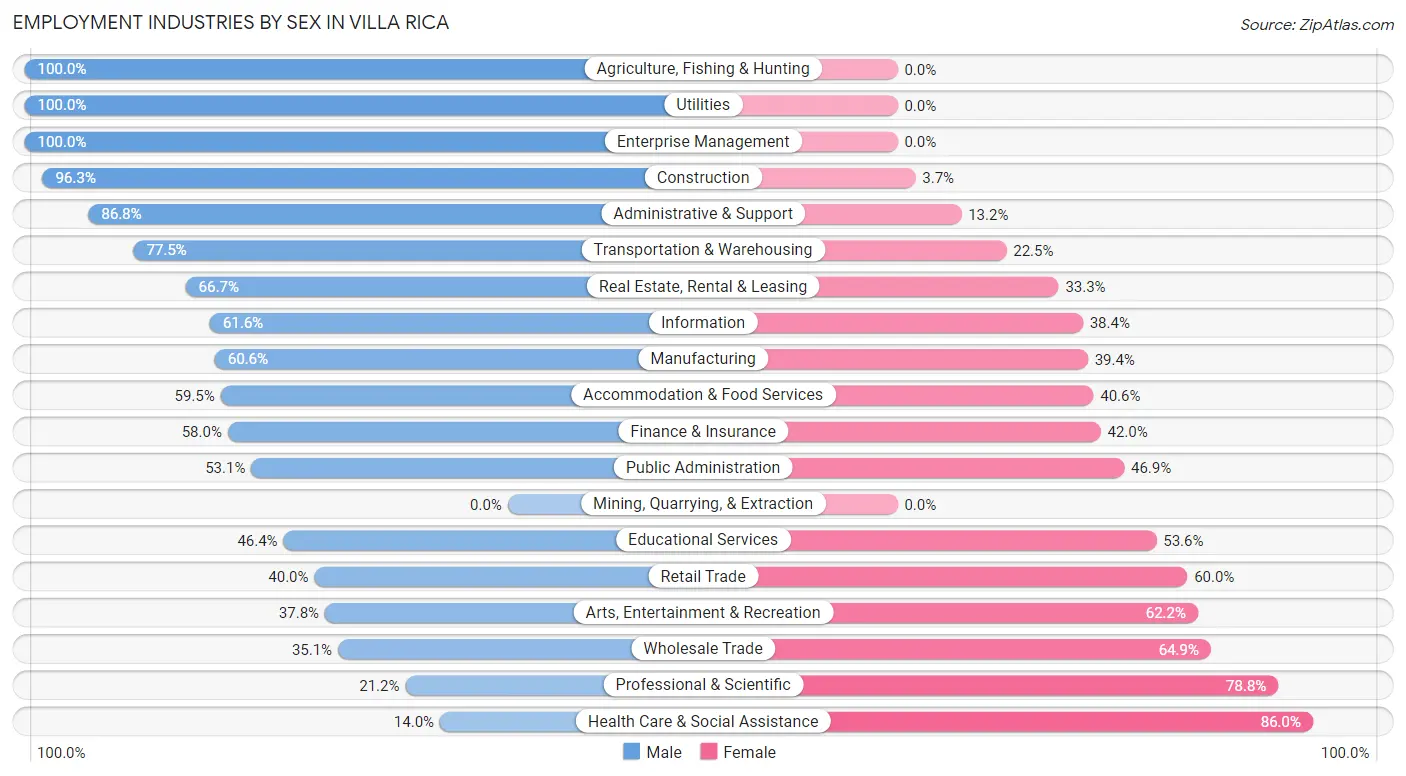
Employment Industries by Sex in Villa Rica
The Villa Rica industries that see more men than women are Agriculture, Fishing & Hunting (100.0%), Utilities (100.0%), and Enterprise Management (100.0%), whereas the industries that tend to have a higher number of women are Health Care & Social Assistance (86.0%), Professional & Scientific (78.8%), and Wholesale Trade (64.9%).
| Industry | Male | Female |
| Agriculture, Fishing & Hunting | 33 (100.0%) | 0 (0.0%) |
| Mining, Quarrying, & Extraction | 0 (0.0%) | 0 (0.0%) |
| Construction | 363 (96.3%) | 14 (3.7%) |
| Manufacturing | 808 (60.6%) | 525 (39.4%) |
| Wholesale Trade | 65 (35.1%) | 120 (64.9%) |
| Retail Trade | 519 (40.0%) | 778 (60.0%) |
| Transportation & Warehousing | 591 (77.5%) | 172 (22.5%) |
| Utilities | 92 (100.0%) | 0 (0.0%) |
| Information | 196 (61.6%) | 122 (38.4%) |
| Finance & Insurance | 142 (58.0%) | 103 (42.0%) |
| Real Estate, Rental & Leasing | 42 (66.7%) | 21 (33.3%) |
| Professional & Scientific | 159 (21.2%) | 591 (78.8%) |
| Enterprise Management | 38 (100.0%) | 0 (0.0%) |
| Administrative & Support | 289 (86.8%) | 44 (13.2%) |
| Educational Services | 409 (46.4%) | 472 (53.6%) |
| Health Care & Social Assistance | 139 (14.0%) | 851 (86.0%) |
| Arts, Entertainment & Recreation | 42 (37.8%) | 69 (62.2%) |
| Accommodation & Food Services | 217 (59.5%) | 148 (40.6%) |
| Public Administration | 258 (53.1%) | 228 (46.9%) |
| Total | 4,486 (50.5%) | 4,399 (49.5%) |
Education in Villa Rica
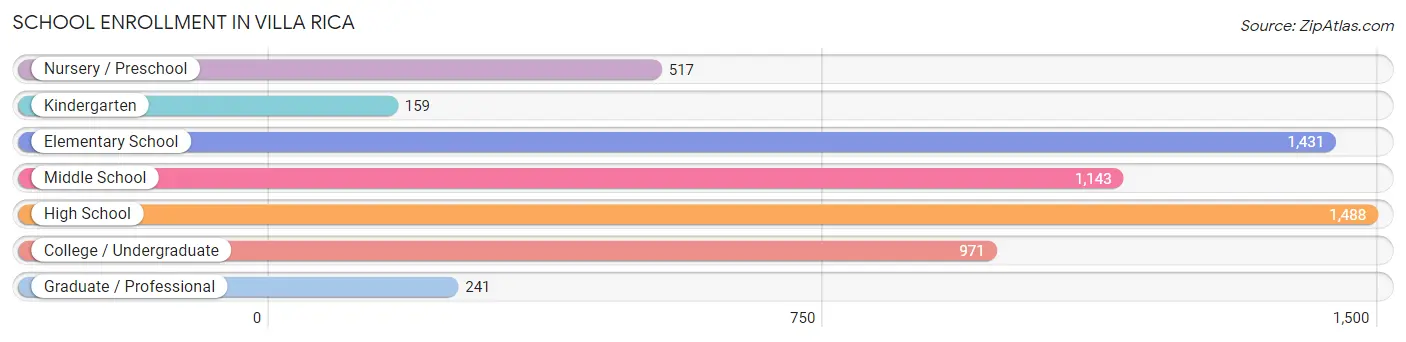
School Enrollment in Villa Rica
The most common levels of schooling among the 5,950 students in Villa Rica are high school (1,488 | 25.0%), elementary school (1,431 | 24.0%), and middle school (1,143 | 19.2%).
| School Level | # Students | % Students |
| Nursery / Preschool | 517 | 8.7% |
| Kindergarten | 159 | 2.7% |
| Elementary School | 1,431 | 24.0% |
| Middle School | 1,143 | 19.2% |
| High School | 1,488 | 25.0% |
| College / Undergraduate | 971 | 16.3% |
| Graduate / Professional | 241 | 4.1% |
| Total | 5,950 | 100.0% |
School Enrollment by Age by Funding Source in Villa Rica
Out of a total of 5,950 students who are enrolled in schools in Villa Rica, 333 (5.6%) attend a private institution, while the remaining 5,617 (94.4%) are enrolled in public schools. The age group of 3 to 4 year olds has the highest likelihood of being enrolled in private schools, with 109 (27.3% in the age bracket) enrolled. Conversely, the age group of 10 to 14 year olds has the lowest likelihood of being enrolled in a private school, with 1,561 (99.2% in the age bracket) attending a public institution.
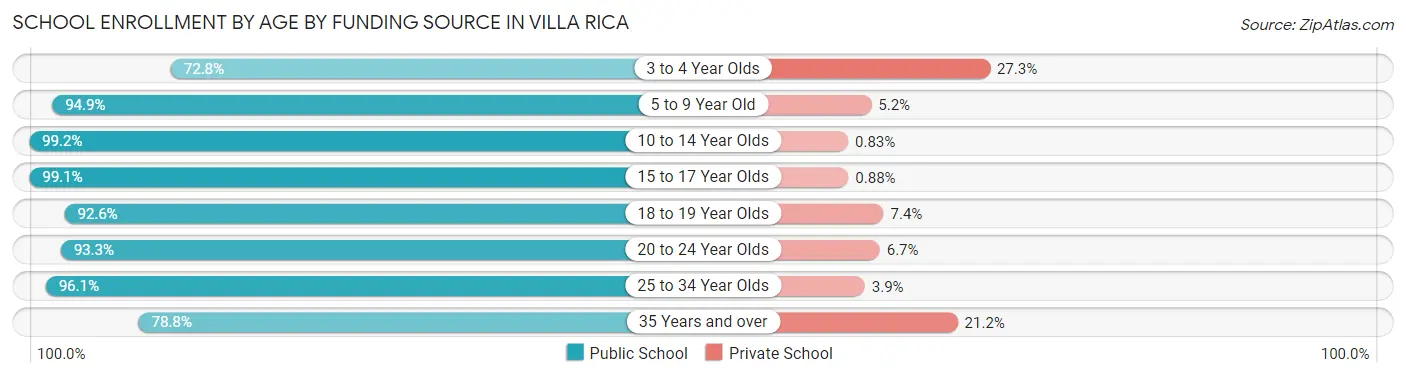
| Age Bracket | Public School | Private School |
| 3 to 4 Year Olds | 291 (72.8%) | 109 (27.3%) |
| 5 to 9 Year Old | 1,270 (94.9%) | 69 (5.1%) |
| 10 to 14 Year Olds | 1,561 (99.2%) | 13 (0.8%) |
| 15 to 17 Year Olds | 1,123 (99.1%) | 10 (0.9%) |
| 18 to 19 Year Olds | 324 (92.6%) | 26 (7.4%) |
| 20 to 24 Year Olds | 402 (93.3%) | 29 (6.7%) |
| 25 to 34 Year Olds | 414 (96.1%) | 17 (3.9%) |
| 35 Years and over | 230 (78.8%) | 62 (21.2%) |
| Total | 5,617 (94.4%) | 333 (5.6%) |
Educational Attainment by Field of Study in Villa Rica
Business (684 | 23.4%), education (609 | 20.8%), science & technology (517 | 17.7%), arts & humanities (235 | 8.0%), and bio, nature & agricultural (189 | 6.5%) are the most common fields of study among 2,928 individuals in Villa Rica who have obtained a bachelor's degree or higher.
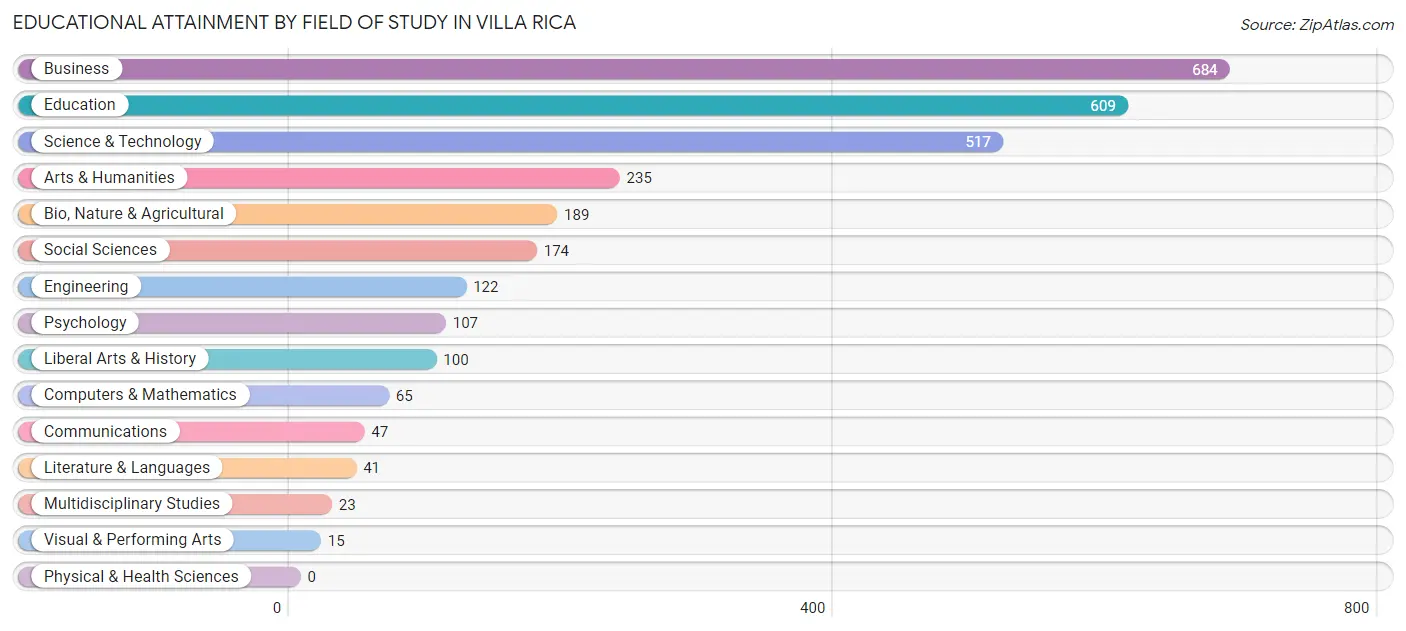
| Field of Study | # Graduates | % Graduates |
| Computers & Mathematics | 65 | 2.2% |
| Bio, Nature & Agricultural | 189 | 6.5% |
| Physical & Health Sciences | 0 | 0.0% |
| Psychology | 107 | 3.6% |
| Social Sciences | 174 | 5.9% |
| Engineering | 122 | 4.2% |
| Multidisciplinary Studies | 23 | 0.8% |
| Science & Technology | 517 | 17.7% |
| Business | 684 | 23.4% |
| Education | 609 | 20.8% |
| Literature & Languages | 41 | 1.4% |
| Liberal Arts & History | 100 | 3.4% |
| Visual & Performing Arts | 15 | 0.5% |
| Communications | 47 | 1.6% |
| Arts & Humanities | 235 | 8.0% |
| Total | 2,928 | 100.0% |
Transportation & Commute in Villa Rica
Vehicle Availability by Sex in Villa Rica
The most prevalent vehicle ownership categories in Villa Rica are males with 2 vehicles (1,540, accounting for 34.3%) and females with 2 vehicles (1,347, making up 35.9%).
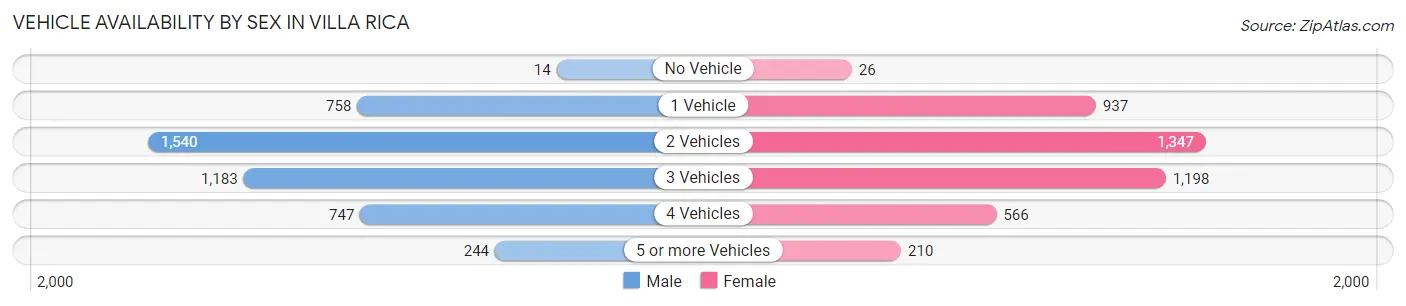
| Vehicles Available | Male | Female |
| No Vehicle | 14 (0.3%) | 26 (0.6%) |
| 1 Vehicle | 758 (16.9%) | 937 (21.9%) |
| 2 Vehicles | 1,540 (34.3%) | 1,347 (31.4%) |
| 3 Vehicles | 1,183 (26.4%) | 1,198 (28.0%) |
| 4 Vehicles | 747 (16.7%) | 566 (13.2%) |
| 5 or more Vehicles | 244 (5.4%) | 210 (4.9%) |
| Total | 4,486 (100.0%) | 4,284 (100.0%) |
Commute Time in Villa Rica
The most frequently occuring commute durations in Villa Rica are 20 to 24 minutes (1,272 commuters, 16.2%), 30 to 34 minutes (1,249 commuters, 15.9%), and 15 to 19 minutes (945 commuters, 12.0%).
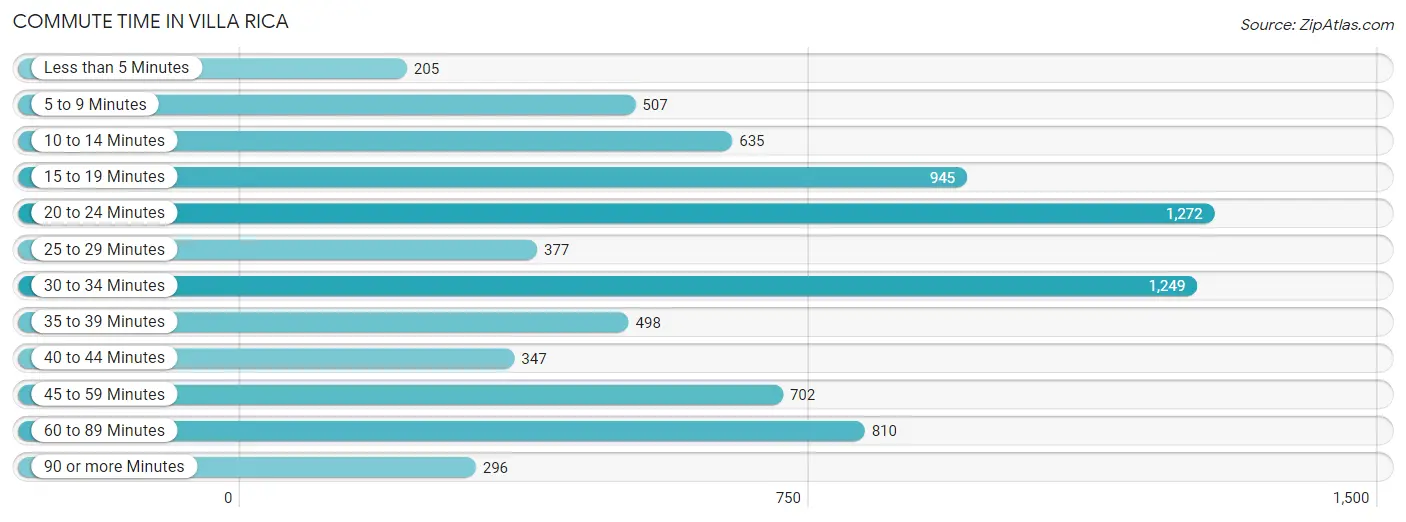
| Commute Time | # Commuters | % Commuters |
| Less than 5 Minutes | 205 | 2.6% |
| 5 to 9 Minutes | 507 | 6.5% |
| 10 to 14 Minutes | 635 | 8.1% |
| 15 to 19 Minutes | 945 | 12.0% |
| 20 to 24 Minutes | 1,272 | 16.2% |
| 25 to 29 Minutes | 377 | 4.8% |
| 30 to 34 Minutes | 1,249 | 15.9% |
| 35 to 39 Minutes | 498 | 6.4% |
| 40 to 44 Minutes | 347 | 4.4% |
| 45 to 59 Minutes | 702 | 8.9% |
| 60 to 89 Minutes | 810 | 10.3% |
| 90 or more Minutes | 296 | 3.8% |
Commute Time by Sex in Villa Rica
The most common commute times in Villa Rica are 30 to 34 minutes (767 commuters, 19.0%) for males and 20 to 24 minutes (685 commuters, 18.0%) for females.
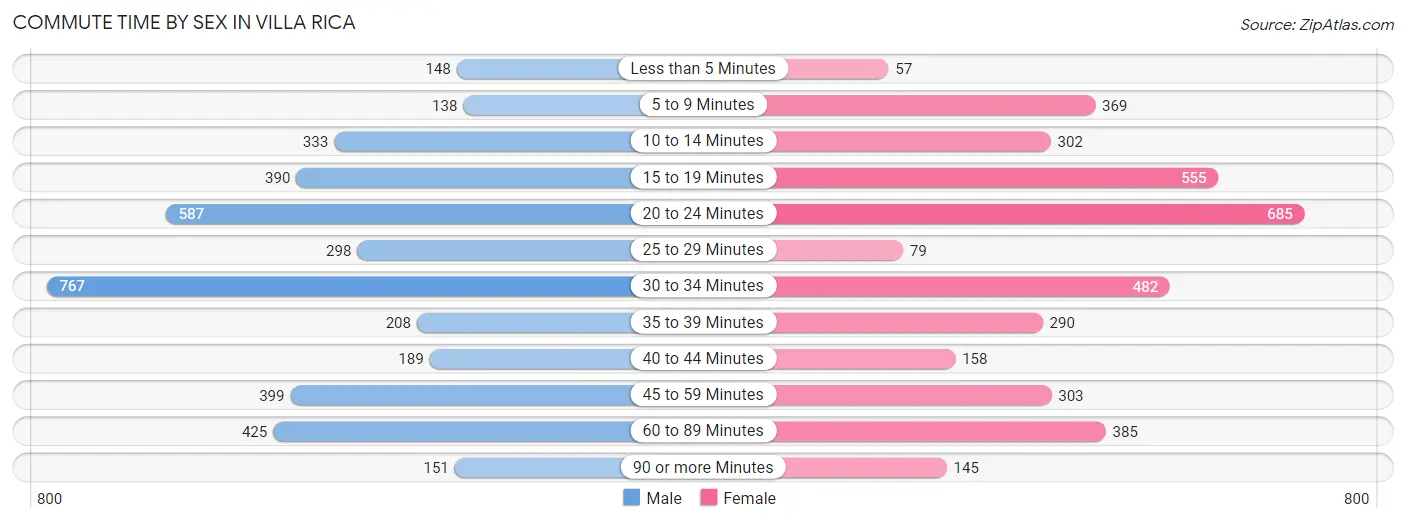
| Commute Time | Male | Female |
| Less than 5 Minutes | 148 (3.7%) | 57 (1.5%) |
| 5 to 9 Minutes | 138 (3.4%) | 369 (9.7%) |
| 10 to 14 Minutes | 333 (8.3%) | 302 (7.9%) |
| 15 to 19 Minutes | 390 (9.7%) | 555 (14.6%) |
| 20 to 24 Minutes | 587 (14.5%) | 685 (18.0%) |
| 25 to 29 Minutes | 298 (7.4%) | 79 (2.1%) |
| 30 to 34 Minutes | 767 (19.0%) | 482 (12.7%) |
| 35 to 39 Minutes | 208 (5.2%) | 290 (7.6%) |
| 40 to 44 Minutes | 189 (4.7%) | 158 (4.2%) |
| 45 to 59 Minutes | 399 (9.9%) | 303 (8.0%) |
| 60 to 89 Minutes | 425 (10.5%) | 385 (10.1%) |
| 90 or more Minutes | 151 (3.7%) | 145 (3.8%) |
Time of Departure to Work by Sex in Villa Rica
The most frequent times of departure to work in Villa Rica are 7:30 AM to 7:59 AM (645, 16.0%) for males and 7:30 AM to 7:59 AM (491, 12.9%) for females.
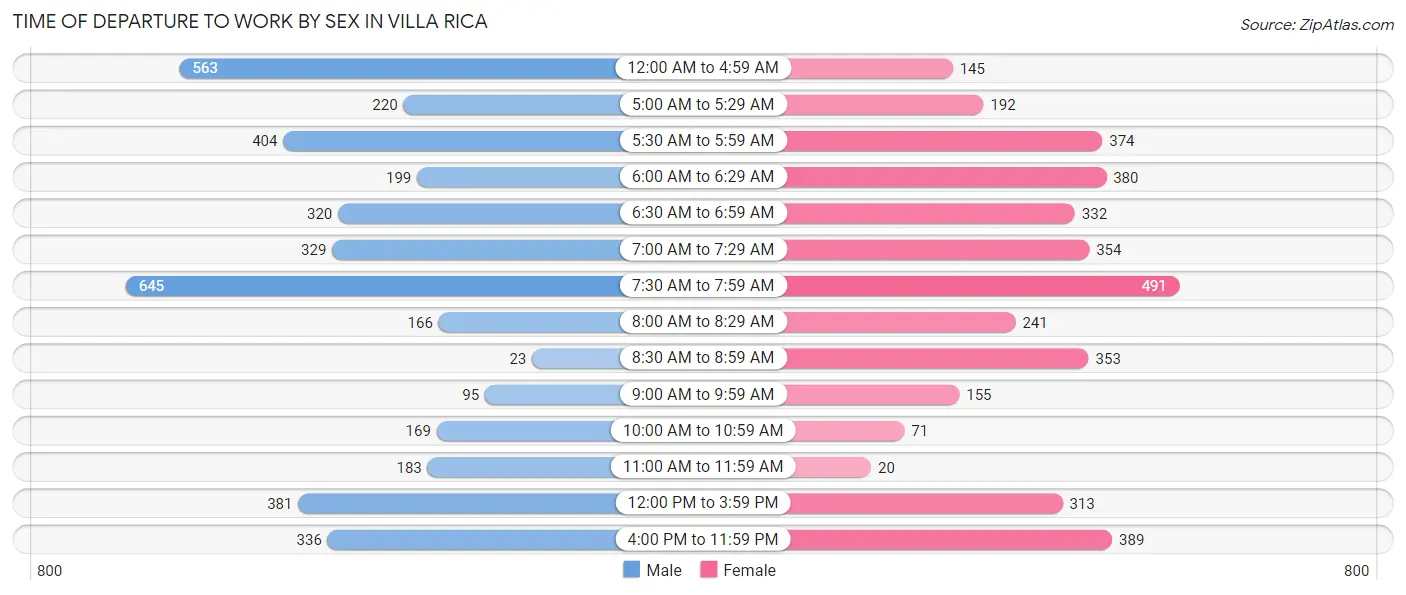
| Time of Departure | Male | Female |
| 12:00 AM to 4:59 AM | 563 (14.0%) | 145 (3.8%) |
| 5:00 AM to 5:29 AM | 220 (5.4%) | 192 (5.0%) |
| 5:30 AM to 5:59 AM | 404 (10.0%) | 374 (9.8%) |
| 6:00 AM to 6:29 AM | 199 (4.9%) | 380 (10.0%) |
| 6:30 AM to 6:59 AM | 320 (7.9%) | 332 (8.7%) |
| 7:00 AM to 7:29 AM | 329 (8.2%) | 354 (9.3%) |
| 7:30 AM to 7:59 AM | 645 (16.0%) | 491 (12.9%) |
| 8:00 AM to 8:29 AM | 166 (4.1%) | 241 (6.3%) |
| 8:30 AM to 8:59 AM | 23 (0.6%) | 353 (9.3%) |
| 9:00 AM to 9:59 AM | 95 (2.4%) | 155 (4.1%) |
| 10:00 AM to 10:59 AM | 169 (4.2%) | 71 (1.9%) |
| 11:00 AM to 11:59 AM | 183 (4.5%) | 20 (0.5%) |
| 12:00 PM to 3:59 PM | 381 (9.5%) | 313 (8.2%) |
| 4:00 PM to 11:59 PM | 336 (8.3%) | 389 (10.2%) |
| Total | 4,033 (100.0%) | 3,810 (100.0%) |
Housing Occupancy in Villa Rica
Occupancy by Ownership in Villa Rica
Of the total 5,862 dwellings in Villa Rica, owner-occupied units account for 3,748 (63.9%), while renter-occupied units make up 2,114 (36.1%).
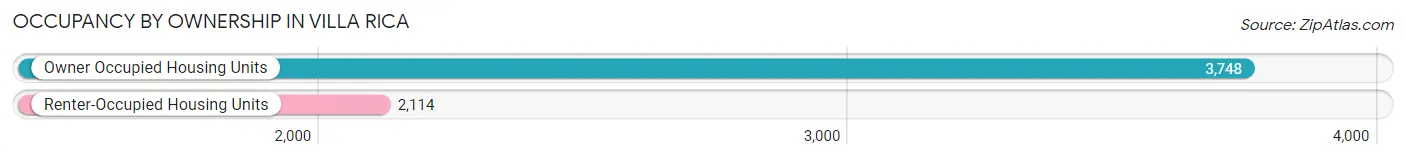
| Occupancy | # Housing Units | % Housing Units |
| Owner Occupied Housing Units | 3,748 | 63.9% |
| Renter-Occupied Housing Units | 2,114 | 36.1% |
| Total Occupied Housing Units | 5,862 | 100.0% |
Occupancy by Household Size in Villa Rica
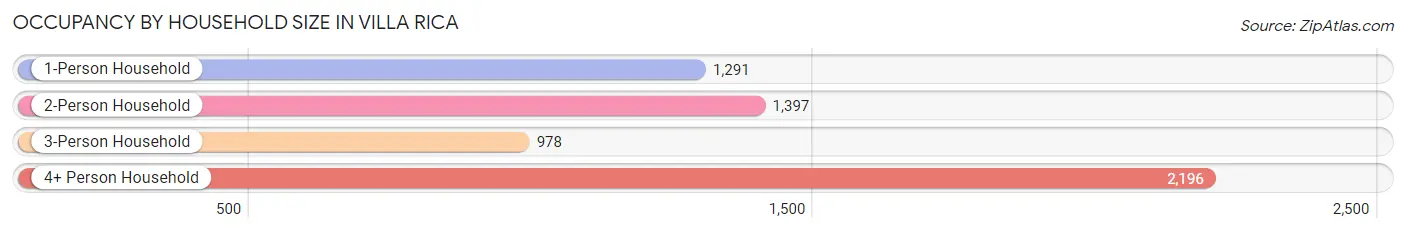
| Household Size | # Housing Units | % Housing Units |
| 1-Person Household | 1,291 | 22.0% |
| 2-Person Household | 1,397 | 23.8% |
| 3-Person Household | 978 | 16.7% |
| 4+ Person Household | 2,196 | 37.5% |
| Total Housing Units | 5,862 | 100.0% |
Occupancy by Ownership by Household Size in Villa Rica
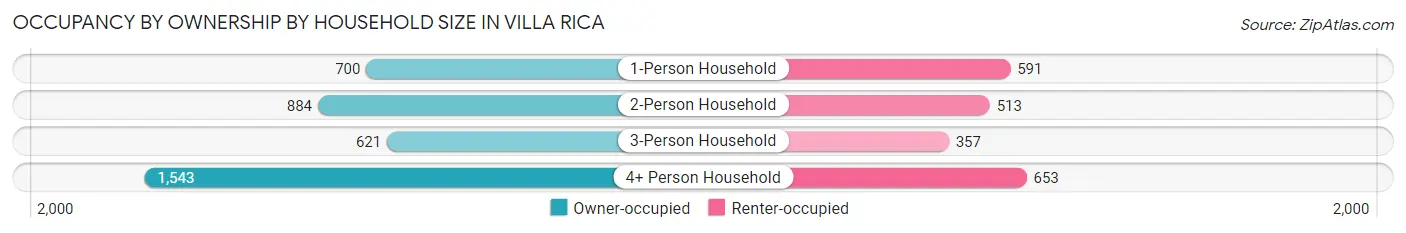
| Household Size | Owner-occupied | Renter-occupied |
| 1-Person Household | 700 (54.2%) | 591 (45.8%) |
| 2-Person Household | 884 (63.3%) | 513 (36.7%) |
| 3-Person Household | 621 (63.5%) | 357 (36.5%) |
| 4+ Person Household | 1,543 (70.3%) | 653 (29.7%) |
| Total Housing Units | 3,748 (63.9%) | 2,114 (36.1%) |
Occupancy by Educational Attainment in Villa Rica
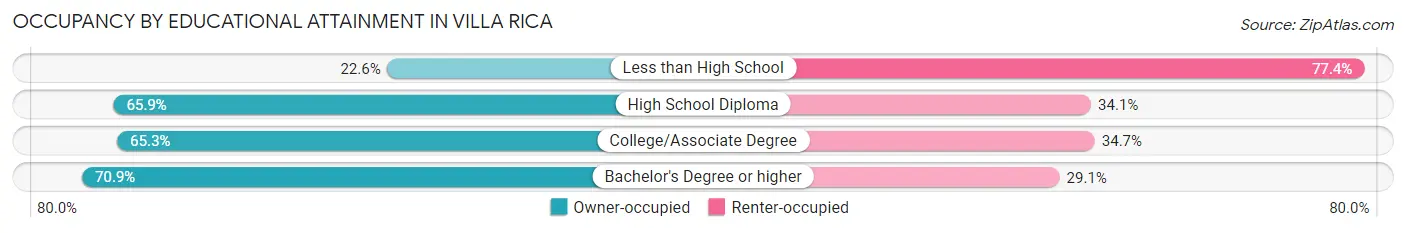
| Household Size | Owner-occupied | Renter-occupied |
| Less than High School | 92 (22.6%) | 315 (77.4%) |
| High School Diploma | 746 (65.9%) | 386 (34.1%) |
| College/Associate Degree | 1,811 (65.3%) | 962 (34.7%) |
| Bachelor's Degree or higher | 1,099 (70.9%) | 451 (29.1%) |
Occupancy by Age of Householder in Villa Rica
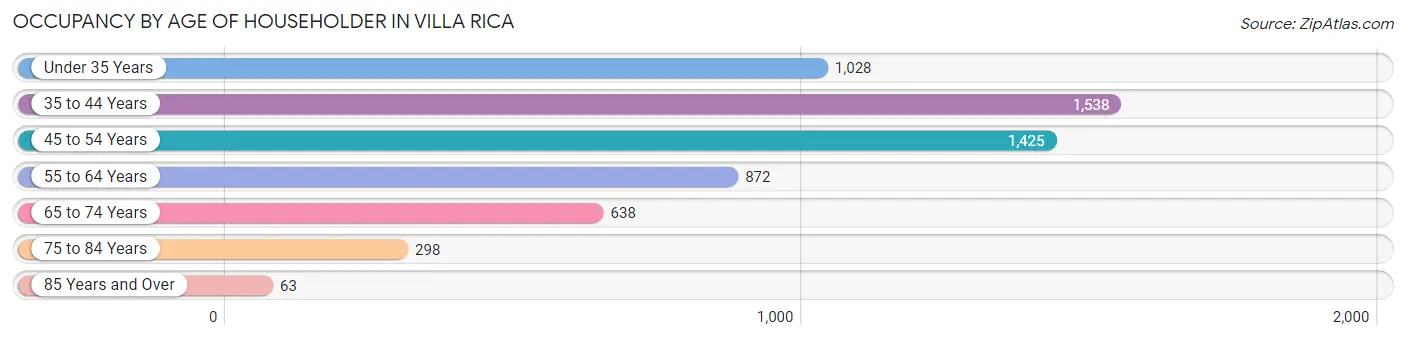
| Age Bracket | # Households | % Households |
| Under 35 Years | 1,028 | 17.5% |
| 35 to 44 Years | 1,538 | 26.2% |
| 45 to 54 Years | 1,425 | 24.3% |
| 55 to 64 Years | 872 | 14.9% |
| 65 to 74 Years | 638 | 10.9% |
| 75 to 84 Years | 298 | 5.1% |
| 85 Years and Over | 63 | 1.1% |
| Total | 5,862 | 100.0% |
Housing Finances in Villa Rica
Median Income by Occupancy in Villa Rica
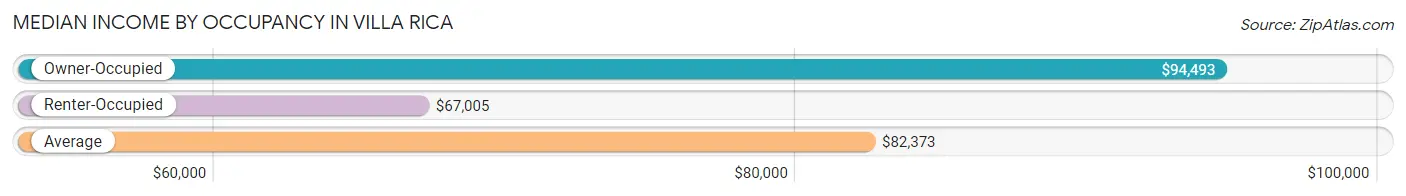
| Occupancy Type | # Households | Median Income |
| Owner-Occupied | 3,748 (63.9%) | $94,493 |
| Renter-Occupied | 2,114 (36.1%) | $67,005 |
| Average | 5,862 (100.0%) | $82,373 |
Occupancy by Householder Income Bracket in Villa Rica
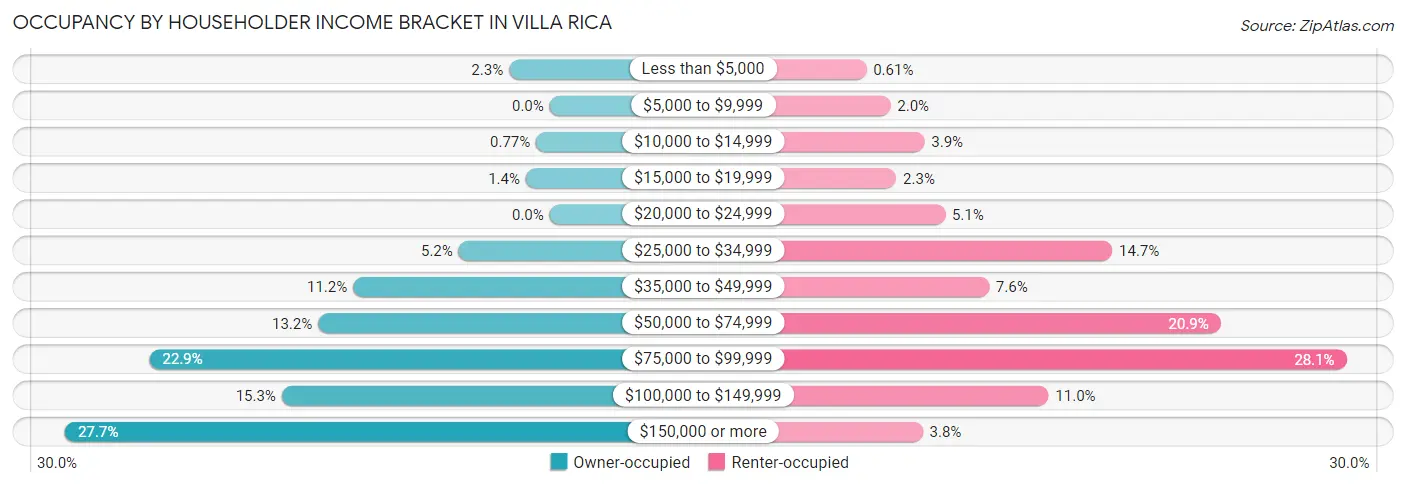
| Income Bracket | Owner-occupied | Renter-occupied |
| Less than $5,000 | 87 (2.3%) | 13 (0.6%) |
| $5,000 to $9,999 | 0 (0.0%) | 42 (2.0%) |
| $10,000 to $14,999 | 29 (0.8%) | 83 (3.9%) |
| $15,000 to $19,999 | 51 (1.4%) | 49 (2.3%) |
| $20,000 to $24,999 | 0 (0.0%) | 108 (5.1%) |
| $25,000 to $34,999 | 195 (5.2%) | 310 (14.7%) |
| $35,000 to $49,999 | 421 (11.2%) | 161 (7.6%) |
| $50,000 to $74,999 | 496 (13.2%) | 441 (20.9%) |
| $75,000 to $99,999 | 857 (22.9%) | 593 (28.1%) |
| $100,000 to $149,999 | 574 (15.3%) | 233 (11.0%) |
| $150,000 or more | 1,038 (27.7%) | 81 (3.8%) |
| Total | 3,748 (100.0%) | 2,114 (100.0%) |
Monthly Housing Cost Tiers in Villa Rica
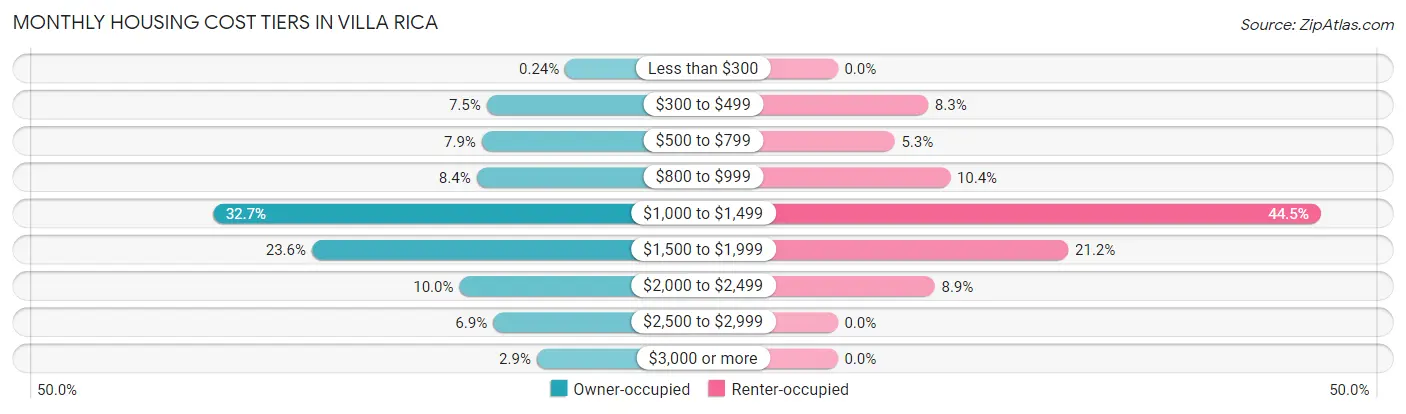
| Monthly Cost | Owner-occupied | Renter-occupied |
| Less than $300 | 9 (0.2%) | 0 (0.0%) |
| $300 to $499 | 280 (7.5%) | 176 (8.3%) |
| $500 to $799 | 297 (7.9%) | 111 (5.2%) |
| $800 to $999 | 315 (8.4%) | 219 (10.4%) |
| $1,000 to $1,499 | 1,225 (32.7%) | 940 (44.5%) |
| $1,500 to $1,999 | 883 (23.6%) | 449 (21.2%) |
| $2,000 to $2,499 | 374 (10.0%) | 189 (8.9%) |
| $2,500 to $2,999 | 258 (6.9%) | 0 (0.0%) |
| $3,000 or more | 107 (2.9%) | 0 (0.0%) |
| Total | 3,748 (100.0%) | 2,114 (100.0%) |
Physical Housing Characteristics in Villa Rica
Housing Structures in Villa Rica

| Structure Type | # Housing Units | % Housing Units |
| Single Unit, Detached | 4,770 | 81.4% |
| Single Unit, Attached | 72 | 1.2% |
| 2 Unit Apartments | 138 | 2.4% |
| 3 or 4 Unit Apartments | 88 | 1.5% |
| 5 to 9 Unit Apartments | 169 | 2.9% |
| 10 or more Apartments | 490 | 8.4% |
| Mobile Home / Other | 135 | 2.3% |
| Total | 5,862 | 100.0% |
Housing Structures by Occupancy in Villa Rica
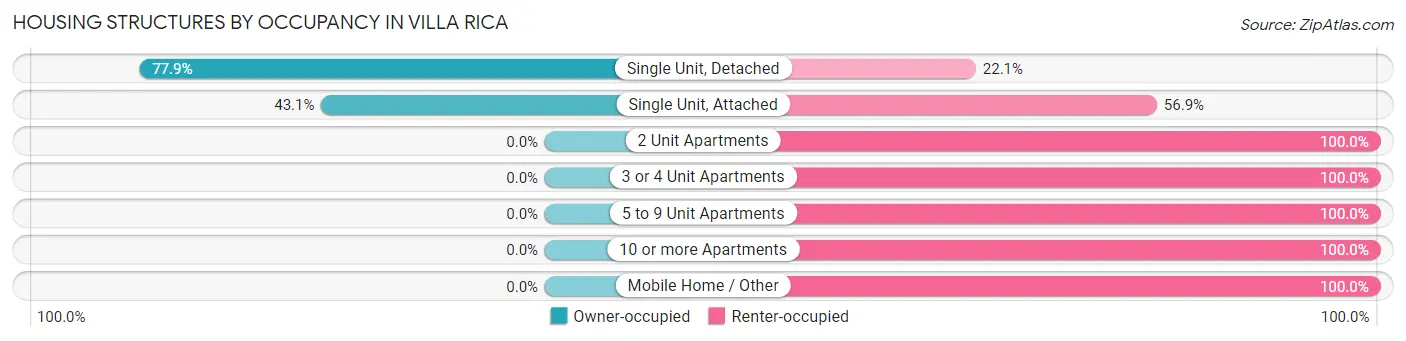
| Structure Type | Owner-occupied | Renter-occupied |
| Single Unit, Detached | 3,717 (77.9%) | 1,053 (22.1%) |
| Single Unit, Attached | 31 (43.1%) | 41 (56.9%) |
| 2 Unit Apartments | 0 (0.0%) | 138 (100.0%) |
| 3 or 4 Unit Apartments | 0 (0.0%) | 88 (100.0%) |
| 5 to 9 Unit Apartments | 0 (0.0%) | 169 (100.0%) |
| 10 or more Apartments | 0 (0.0%) | 490 (100.0%) |
| Mobile Home / Other | 0 (0.0%) | 135 (100.0%) |
| Total | 3,748 (63.9%) | 2,114 (36.1%) |
Housing Structures by Number of Rooms in Villa Rica
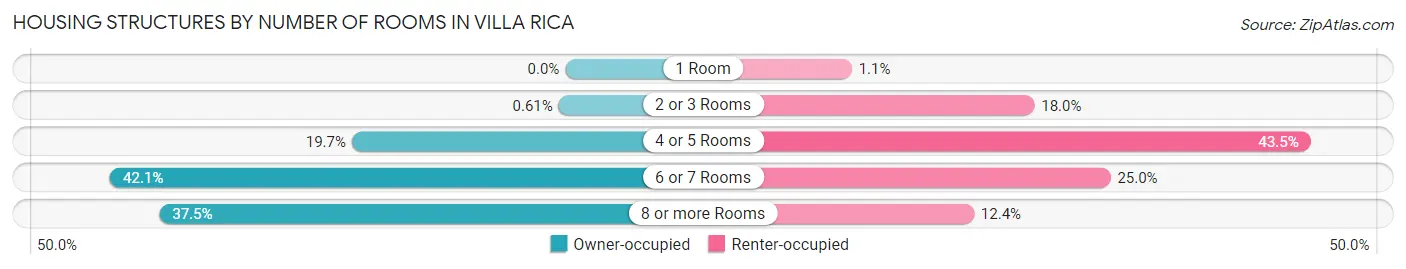
| Number of Rooms | Owner-occupied | Renter-occupied |
| 1 Room | 0 (0.0%) | 23 (1.1%) |
| 2 or 3 Rooms | 23 (0.6%) | 380 (18.0%) |
| 4 or 5 Rooms | 740 (19.7%) | 920 (43.5%) |
| 6 or 7 Rooms | 1,578 (42.1%) | 529 (25.0%) |
| 8 or more Rooms | 1,407 (37.5%) | 262 (12.4%) |
| Total | 3,748 (100.0%) | 2,114 (100.0%) |
Housing Structure by Heating Type in Villa Rica
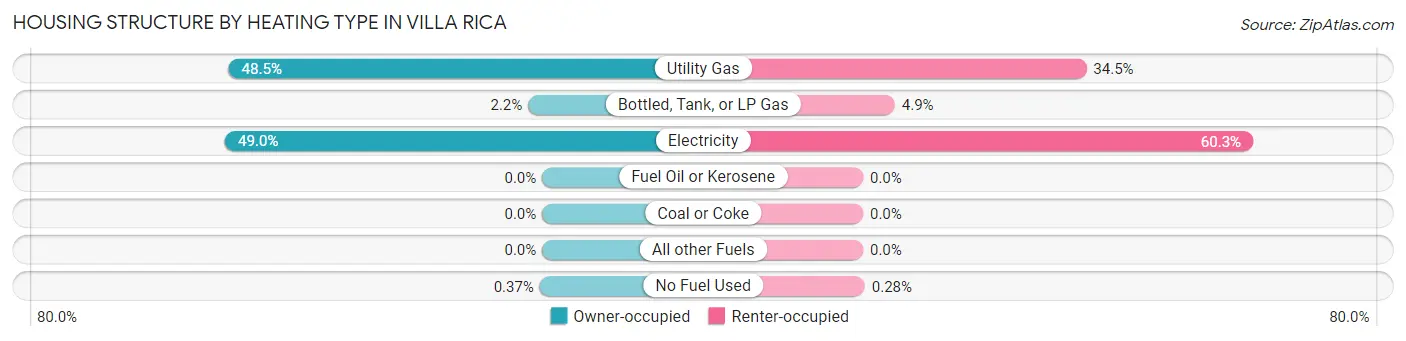
| Heating Type | Owner-occupied | Renter-occupied |
| Utility Gas | 1,816 (48.4%) | 730 (34.5%) |
| Bottled, Tank, or LP Gas | 81 (2.2%) | 104 (4.9%) |
| Electricity | 1,837 (49.0%) | 1,274 (60.3%) |
| Fuel Oil or Kerosene | 0 (0.0%) | 0 (0.0%) |
| Coal or Coke | 0 (0.0%) | 0 (0.0%) |
| All other Fuels | 0 (0.0%) | 0 (0.0%) |
| No Fuel Used | 14 (0.4%) | 6 (0.3%) |
| Total | 3,748 (100.0%) | 2,114 (100.0%) |
Household Vehicle Usage in Villa Rica
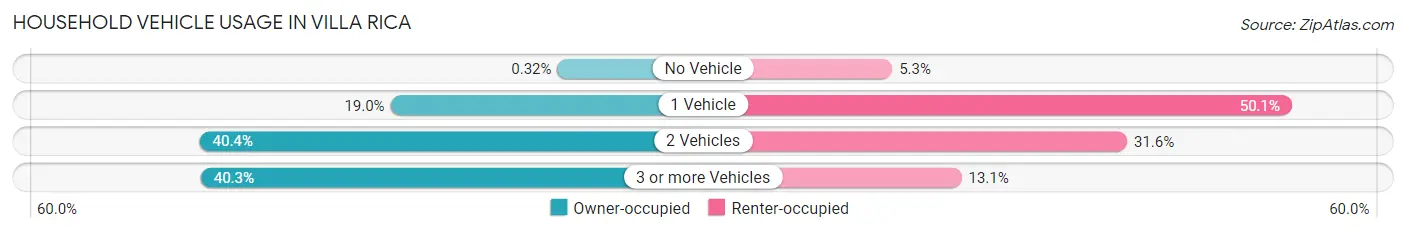
| Vehicles per Household | Owner-occupied | Renter-occupied |
| No Vehicle | 12 (0.3%) | 112 (5.3%) |
| 1 Vehicle | 713 (19.0%) | 1,058 (50.0%) |
| 2 Vehicles | 1,514 (40.4%) | 668 (31.6%) |
| 3 or more Vehicles | 1,509 (40.3%) | 276 (13.1%) |
| Total | 3,748 (100.0%) | 2,114 (100.0%) |
Real Estate & Mortgages in Villa Rica
Real Estate and Mortgage Overview in Villa Rica
| Characteristic | Without Mortgage | With Mortgage |
| Housing Units | 618 | 3,130 |
| Median Property Value | $248,600 | $214,700 |
| Median Household Income | $78,500 | $901 |
| Monthly Housing Costs | $531 | $107 |
| Real Estate Taxes | $1,948 | $78 |
Property Value by Mortgage Status in Villa Rica
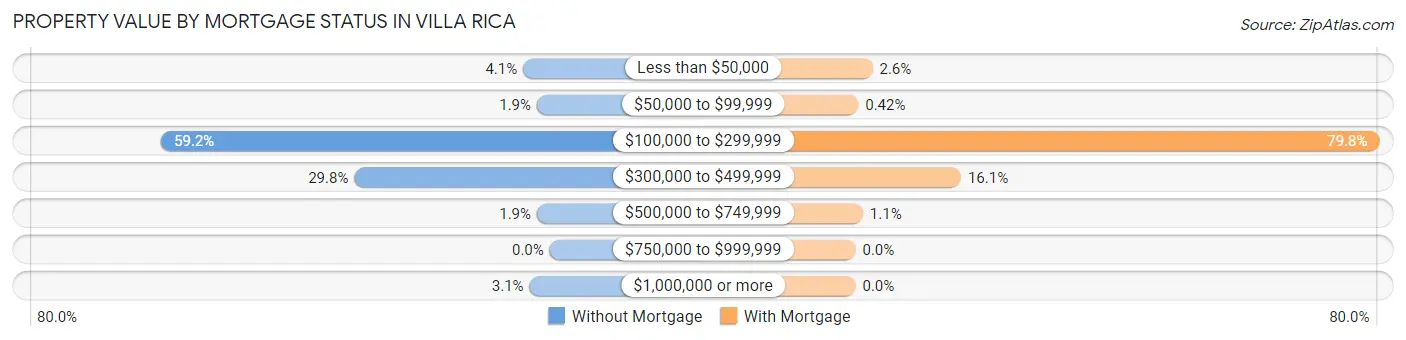
| Property Value | Without Mortgage | With Mortgage |
| Less than $50,000 | 25 (4.1%) | 81 (2.6%) |
| $50,000 to $99,999 | 12 (1.9%) | 13 (0.4%) |
| $100,000 to $299,999 | 366 (59.2%) | 2,498 (79.8%) |
| $300,000 to $499,999 | 184 (29.8%) | 503 (16.1%) |
| $500,000 to $749,999 | 12 (1.9%) | 35 (1.1%) |
| $750,000 to $999,999 | 0 (0.0%) | 0 (0.0%) |
| $1,000,000 or more | 19 (3.1%) | 0 (0.0%) |
| Total | 618 (100.0%) | 3,130 (100.0%) |
Household Income by Mortgage Status in Villa Rica
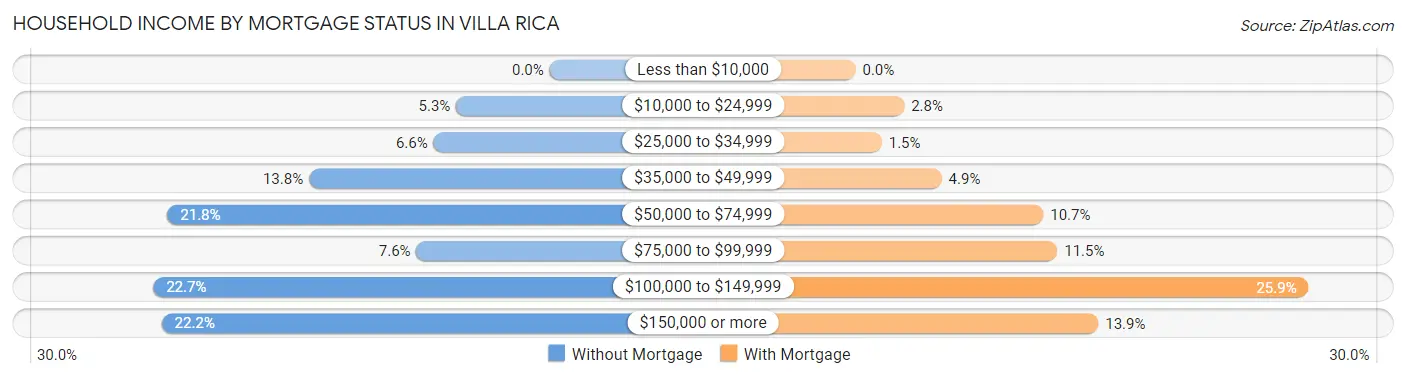
| Household Income | Without Mortgage | With Mortgage |
| Less than $10,000 | 0 (0.0%) | 0 (0.0%) |
| $10,000 to $24,999 | 33 (5.3%) | 87 (2.8%) |
| $25,000 to $34,999 | 41 (6.6%) | 47 (1.5%) |
| $35,000 to $49,999 | 85 (13.8%) | 154 (4.9%) |
| $50,000 to $74,999 | 135 (21.8%) | 336 (10.7%) |
| $75,000 to $99,999 | 47 (7.6%) | 361 (11.5%) |
| $100,000 to $149,999 | 140 (22.7%) | 810 (25.9%) |
| $150,000 or more | 137 (22.2%) | 434 (13.9%) |
| Total | 618 (100.0%) | 3,130 (100.0%) |
Property Value to Household Income Ratio in Villa Rica
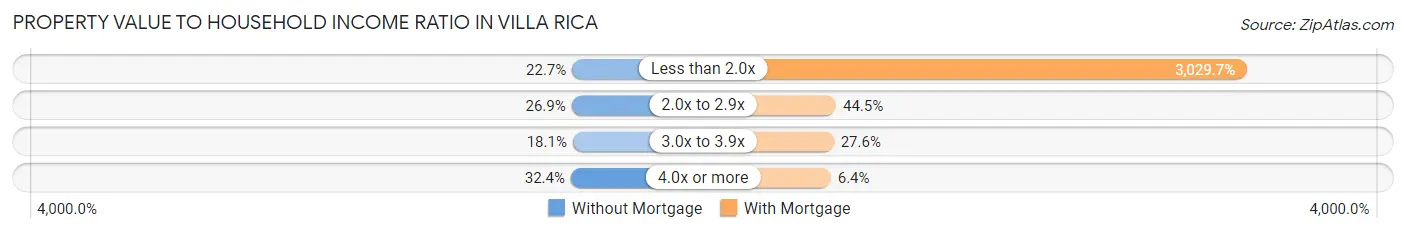
| Value-to-Income Ratio | Without Mortgage | With Mortgage |
| Less than 2.0x | 140 (22.7%) | 94,831 (3,029.7%) |
| 2.0x to 2.9x | 166 (26.9%) | 1,393 (44.5%) |
| 3.0x to 3.9x | 112 (18.1%) | 863 (27.6%) |
| 4.0x or more | 200 (32.4%) | 200 (6.4%) |
| Total | 618 (100.0%) | 3,130 (100.0%) |
Real Estate Taxes by Mortgage Status in Villa Rica
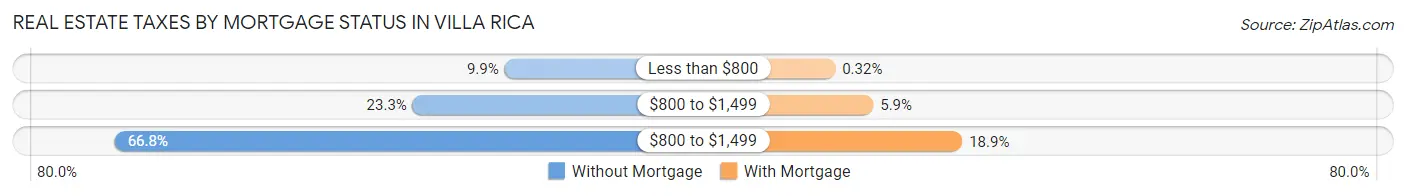
| Property Taxes | Without Mortgage | With Mortgage |
| Less than $800 | 61 (9.9%) | 10 (0.3%) |
| $800 to $1,499 | 144 (23.3%) | 184 (5.9%) |
| $800 to $1,499 | 413 (66.8%) | 591 (18.9%) |
| Total | 618 (100.0%) | 3,130 (100.0%) |
Health & Disability in Villa Rica
Health Insurance Coverage by Age in Villa Rica
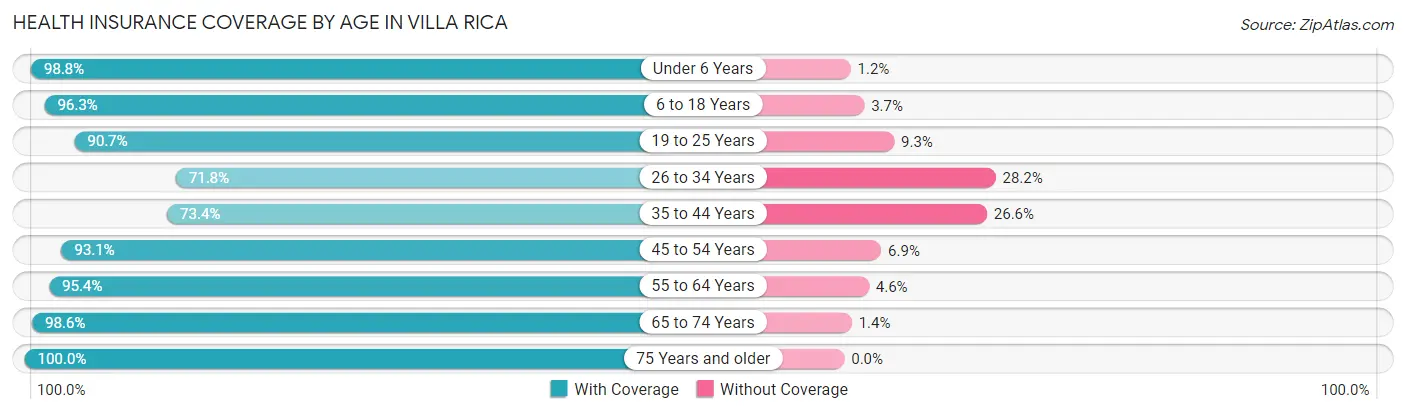
| Age Bracket | With Coverage | Without Coverage |
| Under 6 Years | 1,186 (98.8%) | 14 (1.2%) |
| 6 to 18 Years | 4,026 (96.3%) | 155 (3.7%) |
| 19 to 25 Years | 1,035 (90.7%) | 106 (9.3%) |
| 26 to 34 Years | 1,672 (71.8%) | 657 (28.2%) |
| 35 to 44 Years | 2,090 (73.4%) | 757 (26.6%) |
| 45 to 54 Years | 2,128 (93.1%) | 157 (6.9%) |
| 55 to 64 Years | 1,583 (95.4%) | 76 (4.6%) |
| 65 to 74 Years | 1,134 (98.6%) | 16 (1.4%) |
| 75 Years and older | 562 (100.0%) | 0 (0.0%) |
| Total | 15,416 (88.8%) | 1,938 (11.2%) |
Health Insurance Coverage by Citizenship Status in Villa Rica
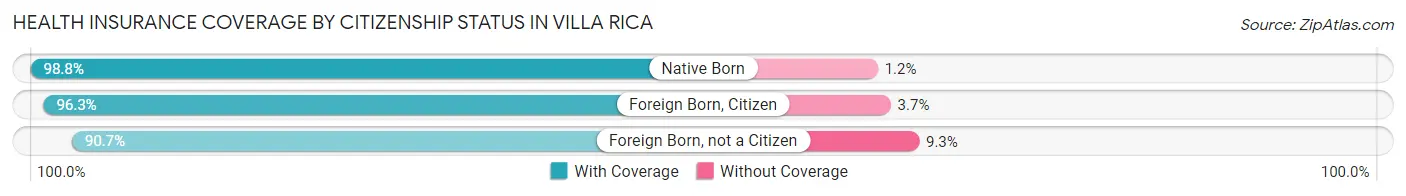
| Citizenship Status | With Coverage | Without Coverage |
| Native Born | 1,186 (98.8%) | 14 (1.2%) |
| Foreign Born, Citizen | 4,026 (96.3%) | 155 (3.7%) |
| Foreign Born, not a Citizen | 1,035 (90.7%) | 106 (9.3%) |
Health Insurance Coverage by Household Income in Villa Rica
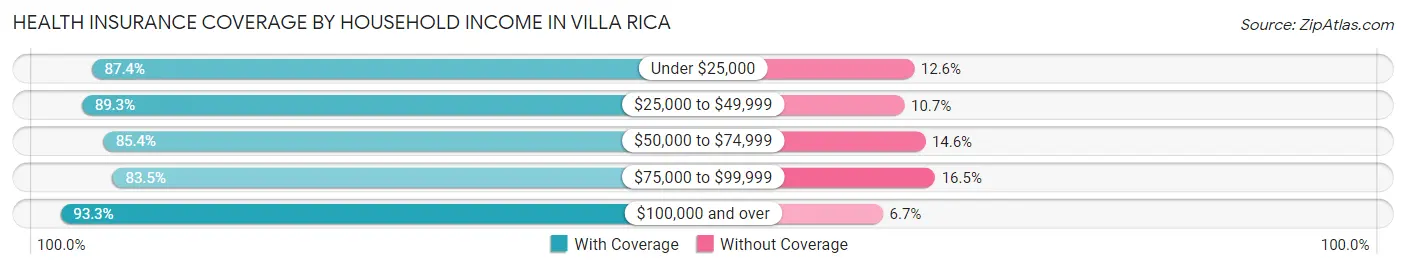
| Household Income | With Coverage | Without Coverage |
| Under $25,000 | 773 (87.4%) | 111 (12.6%) |
| $25,000 to $49,999 | 1,998 (89.3%) | 240 (10.7%) |
| $50,000 to $74,999 | 2,053 (85.4%) | 352 (14.6%) |
| $75,000 to $99,999 | 3,775 (83.5%) | 745 (16.5%) |
| $100,000 and over | 6,809 (93.3%) | 490 (6.7%) |
Public vs Private Health Insurance Coverage by Age in Villa Rica
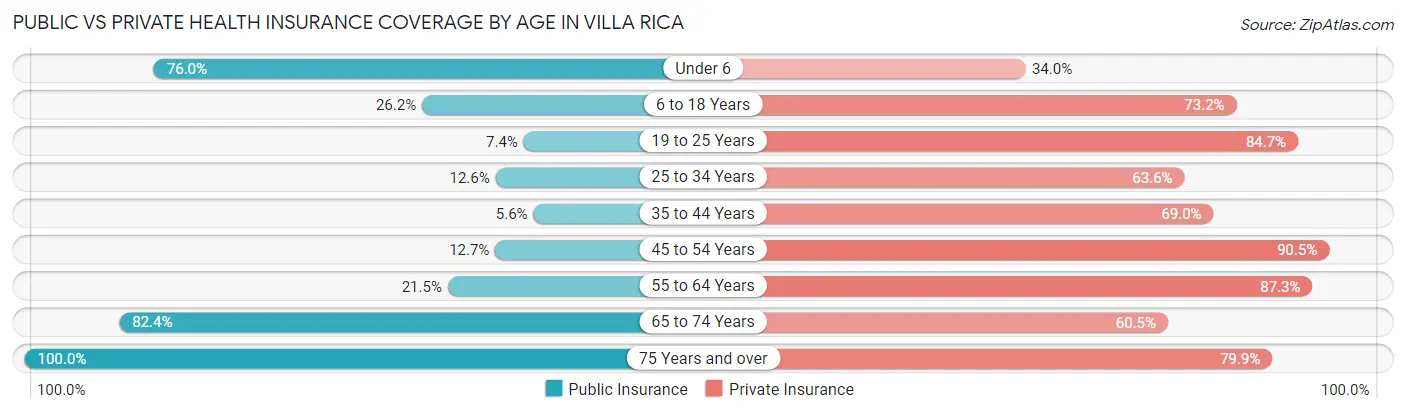
| Age Bracket | Public Insurance | Private Insurance |
| Under 6 | 912 (76.0%) | 408 (34.0%) |
| 6 to 18 Years | 1,097 (26.2%) | 3,062 (73.2%) |
| 19 to 25 Years | 84 (7.4%) | 966 (84.7%) |
| 25 to 34 Years | 293 (12.6%) | 1,481 (63.6%) |
| 35 to 44 Years | 158 (5.6%) | 1,964 (69.0%) |
| 45 to 54 Years | 289 (12.7%) | 2,067 (90.5%) |
| 55 to 64 Years | 356 (21.5%) | 1,449 (87.3%) |
| 65 to 74 Years | 948 (82.4%) | 696 (60.5%) |
| 75 Years and over | 562 (100.0%) | 449 (79.9%) |
| Total | 4,699 (27.1%) | 12,542 (72.3%) |
Disability Status by Sex by Age in Villa Rica
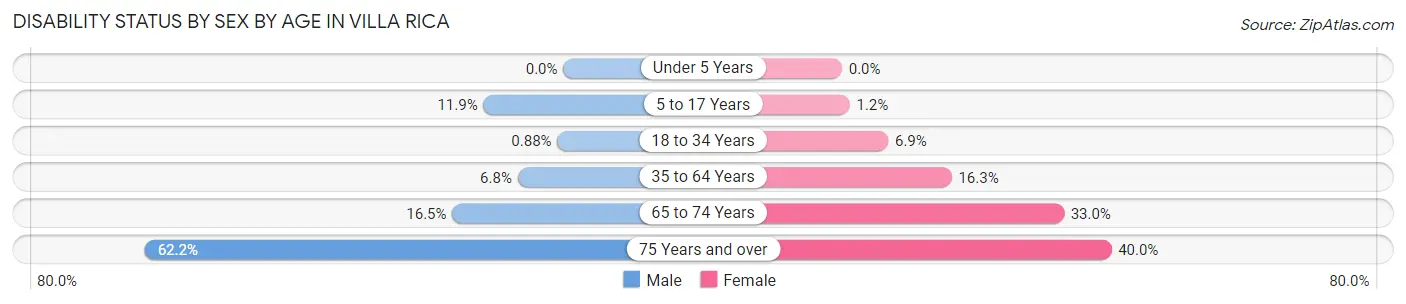
| Age Bracket | Male | Female |
| Under 5 Years | 0 (0.0%) | 0 (0.0%) |
| 5 to 17 Years | 205 (11.9%) | 27 (1.1%) |
| 18 to 34 Years | 16 (0.9%) | 131 (6.9%) |
| 35 to 64 Years | 202 (6.8%) | 620 (16.3%) |
| 65 to 74 Years | 90 (16.5%) | 199 (33.0%) |
| 75 Years and over | 138 (62.2%) | 136 (40.0%) |
Disability Class by Sex by Age in Villa Rica
Disability Class: Hearing Difficulty
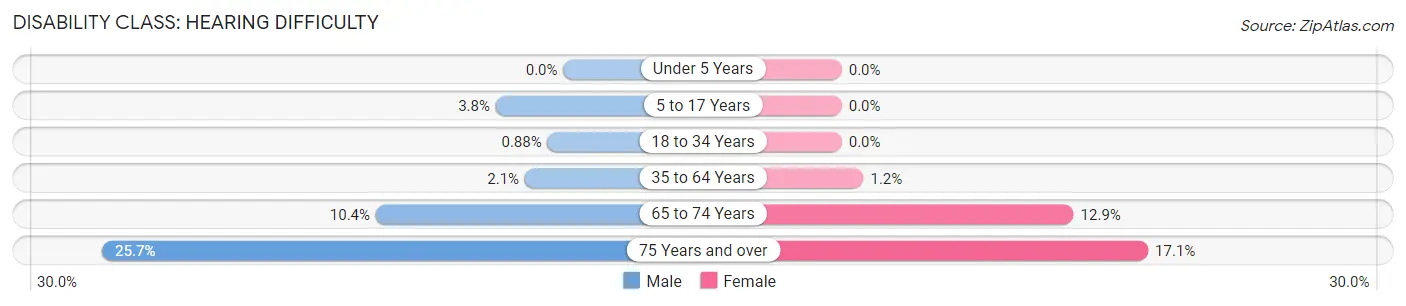
| Age Bracket | Male | Female |
| Under 5 Years | 0 (0.0%) | 0 (0.0%) |
| 5 to 17 Years | 65 (3.8%) | 0 (0.0%) |
| 18 to 34 Years | 16 (0.9%) | 0 (0.0%) |
| 35 to 64 Years | 64 (2.1%) | 46 (1.2%) |
| 65 to 74 Years | 57 (10.4%) | 78 (12.9%) |
| 75 Years and over | 57 (25.7%) | 58 (17.1%) |
Disability Class: Vision Difficulty
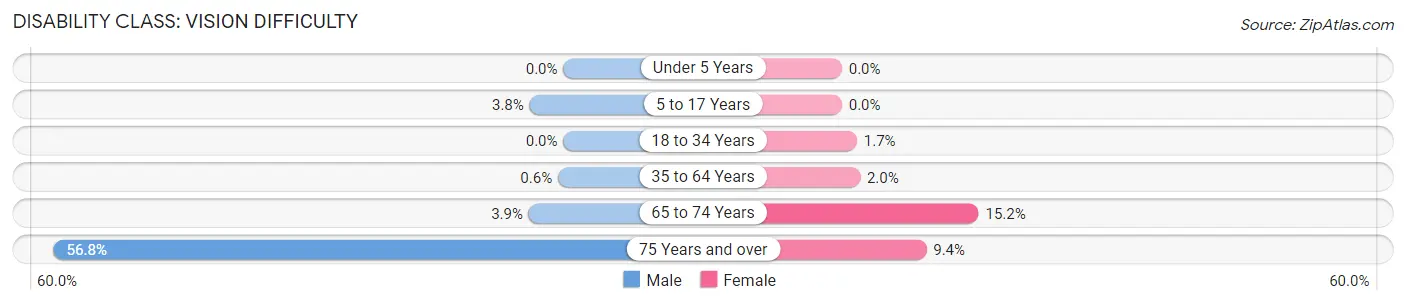
| Age Bracket | Male | Female |
| Under 5 Years | 0 (0.0%) | 0 (0.0%) |
| 5 to 17 Years | 65 (3.8%) | 0 (0.0%) |
| 18 to 34 Years | 0 (0.0%) | 32 (1.7%) |
| 35 to 64 Years | 18 (0.6%) | 77 (2.0%) |
| 65 to 74 Years | 21 (3.8%) | 92 (15.2%) |
| 75 Years and over | 126 (56.8%) | 32 (9.4%) |
Disability Class: Cognitive Difficulty
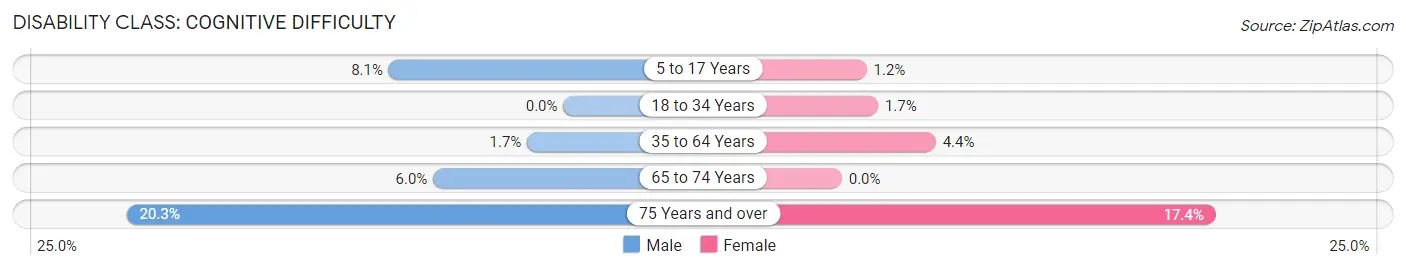
| Age Bracket | Male | Female |
| 5 to 17 Years | 140 (8.1%) | 27 (1.1%) |
| 18 to 34 Years | 0 (0.0%) | 32 (1.7%) |
| 35 to 64 Years | 50 (1.7%) | 166 (4.4%) |
| 65 to 74 Years | 33 (6.0%) | 0 (0.0%) |
| 75 Years and over | 45 (20.3%) | 59 (17.3%) |
Disability Class: Ambulatory Difficulty
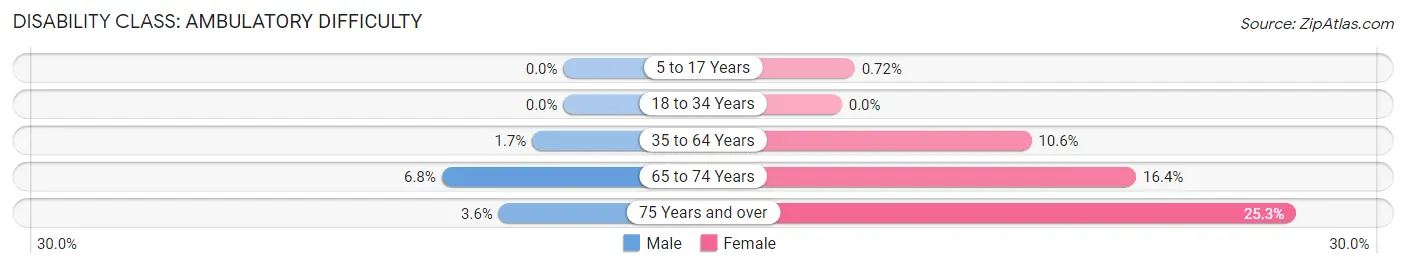
| Age Bracket | Male | Female |
| 5 to 17 Years | 0 (0.0%) | 17 (0.7%) |
| 18 to 34 Years | 0 (0.0%) | 0 (0.0%) |
| 35 to 64 Years | 52 (1.7%) | 402 (10.6%) |
| 65 to 74 Years | 37 (6.8%) | 99 (16.4%) |
| 75 Years and over | 8 (3.6%) | 86 (25.3%) |
Disability Class: Self-Care Difficulty
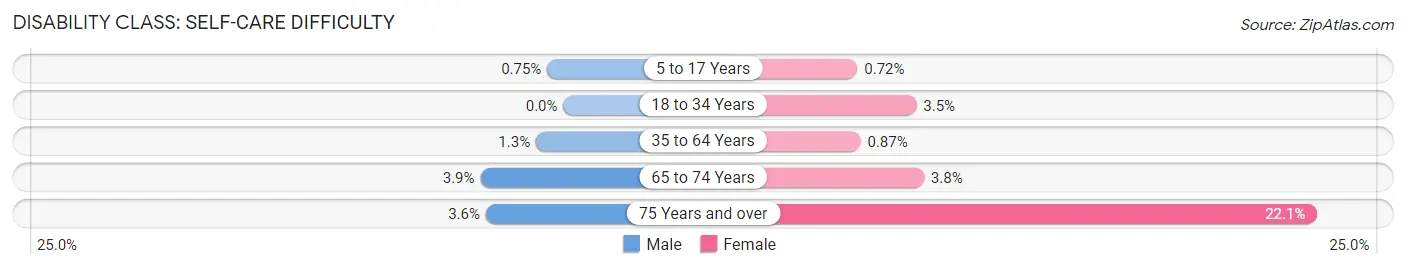
| Age Bracket | Male | Female |
| 5 to 17 Years | 13 (0.7%) | 17 (0.7%) |
| 18 to 34 Years | 0 (0.0%) | 66 (3.5%) |
| 35 to 64 Years | 38 (1.3%) | 33 (0.9%) |
| 65 to 74 Years | 21 (3.8%) | 23 (3.8%) |
| 75 Years and over | 8 (3.6%) | 75 (22.1%) |
Technology Access in Villa Rica
Computing Device Access in Villa Rica
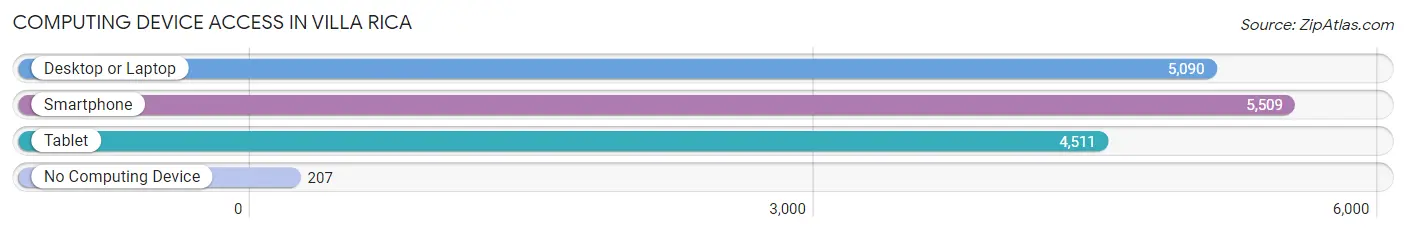
| Device Type | # Households | % Households |
| Desktop or Laptop | 5,090 | 86.8% |
| Smartphone | 5,509 | 94.0% |
| Tablet | 4,511 | 76.9% |
| No Computing Device | 207 | 3.5% |
| Total | 5,862 | 100.0% |
Internet Access in Villa Rica
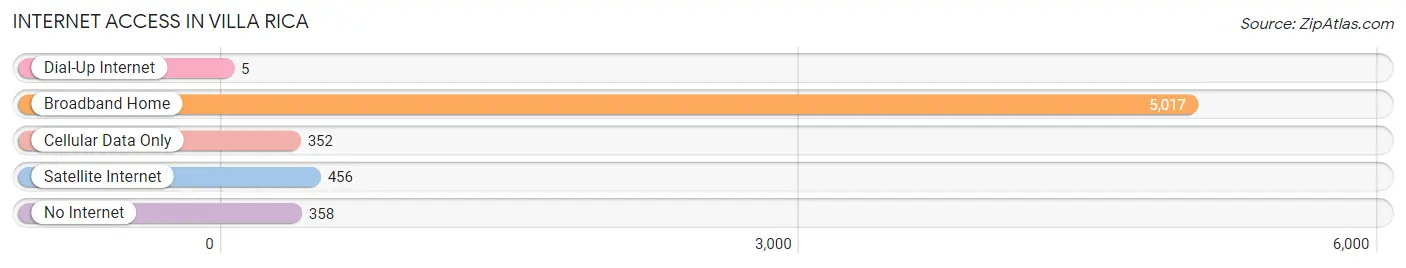
| Internet Type | # Households | % Households |
| Dial-Up Internet | 5 | 0.1% |
| Broadband Home | 5,017 | 85.6% |
| Cellular Data Only | 352 | 6.0% |
| Satellite Internet | 456 | 7.8% |
| No Internet | 358 | 6.1% |
| Total | 5,862 | 100.0% |
Villa Rica Summary
Villa Rica is a city located in Carroll and Douglas counties in the state of Georgia, United States. It is part of the Atlanta metropolitan area. The population was 4,134 at the 2010 census.
History
Villa Rica was founded in 1826 by settlers from the Georgia Gold Rush. The city was named for its location near the gold mines. The city was incorporated in 1881.
In the late 19th century, Villa Rica was a major center for the production of cotton and other agricultural products. The city was also home to several large manufacturing plants, including a cotton mill, a paper mill, and a brick factory.
Geography
Villa Rica is located in the foothills of the Appalachian Mountains, about 30 miles west of Atlanta. The city is situated at the intersection of Interstate 20 and US Highway 78.
The city has a total area of 8.3 square miles, of which 8.2 square miles is land and 0.1 square mile is water.
Economy
Villa Rica is home to several large employers, including a paper mill, a brick factory, and a cotton mill. The city is also home to several small businesses, including restaurants, retail stores, and professional services.
The city is also home to several industrial parks, including the Villa Rica Industrial Park and the West Georgia Industrial Park.
Demographics
As of the 2010 census, there were 4,134 people, 1,541 households, and 1,093 families residing in the city. The population density was 501.2 people per square mile. The racial makeup of the city was 73.2% White, 19.3% African American, 0.3% Native American, 0.7% Asian, 0.1% Pacific Islander, 4.2% from other races, and 2.3% from two or more races. Hispanic or Latino of any race were 8.2% of the population.
The median income for a household in the city was $37,917, and the median income for a family was $45,938. The per capita income for the city was $18,945. About 16.2% of families and 19.2% of the population were below the poverty line, including 28.2% of those under age 18 and 11.2% of those age 65 or over.
Common Questions
What is Per Capita Income in Villa Rica?
Per Capita income in Villa Rica is $32,131.
What is the Median Family Income in Villa Rica?
Median Family Income in Villa Rica is $88,174.
What is the Median Household income in Villa Rica?
Median Household Income in Villa Rica is $82,373.
What is Income or Wage Gap in Villa Rica?
Income or Wage Gap in Villa Rica is 15.8%.
Women in Villa Rica earn 84.2 cents for every dollar earned by a man.
What is Family Income Deficit in Villa Rica?
Family Income Deficit in Villa Rica is $12,386.
Families that are below poverty line in Villa Rica earn $12,386 less on average than the poverty threshold level.
What is Inequality or Gini Index in Villa Rica?
Inequality or Gini Index in Villa Rica is 0.36.
What is the Total Population of Villa Rica?
Total Population of Villa Rica is 17,354.
What is the Total Male Population of Villa Rica?
Total Male Population of Villa Rica is 7,777.
What is the Total Female Population of Villa Rica?
Total Female Population of Villa Rica is 9,577.
What is the Ratio of Males per 100 Females in Villa Rica?
There are 81.20 Males per 100 Females in Villa Rica.
What is the Ratio of Females per 100 Males in Villa Rica?
There are 123.15 Females per 100 Males in Villa Rica.
What is the Median Population Age in Villa Rica?
Median Population Age in Villa Rica is 34.0 Years.
What is the Average Family Size in Villa Rica
Average Family Size in Villa Rica is 3.4 People.
What is the Average Household Size in Villa Rica
Average Household Size in Villa Rica is 3.0 People.
How Large is the Labor Force in Villa Rica?
There are 9,286 People in the Labor Forcein in Villa Rica.
What is the Percentage of People in the Labor Force in Villa Rica?
71.8% of People are in the Labor Force in Villa Rica.
What is the Unemployment Rate in Villa Rica?
Unemployment Rate in Villa Rica is 4.4%.