Zip Codes with the Highest Percentage of Families with Income Above $200,000 in Delaware

RELATED REPORTS & OPTIONS

Family Income | $200k+
Population
Families and Households
Female Fertility
Female Fertility (Unmarried)
Race (Community Size)
Race (Percentage)
Ancestry (Community Size)
AfghanAfricanAlaska NativeAlaskan AthabascanAlbanianAleutAlsatianAmericanApacheArabArapahoArgentineanArmenianAssyrian / Chaldean / SyriacAustralianAustrianBahamianBangladeshiBarbadianBasqueBelgianBelizeanBermudanBhutaneseBlackfeetBolivianBrazilianBritishBritish West IndianBulgarianBurmeseCajunCambodianCanadianCape VerdeanCarpatho RusynCelticCentral AmericanCentral American IndianCherokeeCheyenneChickasawChileanChineseChippewaChoctawColombianColvilleComancheCosta RicanCreeCreekCroatianCrowCubanCypriotCzechCzechoslovakianDanishDelawareDominicanDutchDutch West IndianEastern EuropeanEcuadorianEgyptianEnglishEstonianEthiopianEuropeanFijianFilipinoFinnishFrenchFrench American IndianFrench CanadianGermanGerman RussianGhanaianGreekGuamanian / ChamorroGuatemalanGuyaneseHaitianHmongHonduranHopiHoumaHungarianIcelanderIndian (Asian)IndonesianInupiatIranianIraqiIrishIroquoisIsraeliItalianJamaicanJapaneseJordanianKenyanKiowaKoreanLaotianLatvianLebaneseLiberianLithuanianLumbeeLuxembourgerMacedonianMalaysianMalteseMarshalleseMenomineeMexicanMexican American IndianMongolianMoroccanNative HawaiianNavajoNepaleseNew ZealanderNicaraguanNigerianNorthern EuropeanNorwegianOkinawanOsageOttawaPaiutePakistaniPalestinianPanamanianParaguayanPennsylvania GermanPeruvianPimaPolishPortuguesePotawatomiPuebloPuerto RicanPuget Sound SalishRomanianRussianSalvadoranSamoanScandinavianScotch-IrishScottishSeminoleSenegaleseSerbianShoshoneSierra LeoneanSiouxSlavicSlovakSloveneSomaliSouth AfricanSouth AmericanSouth American IndianSoviet UnionSpaniardSpanishSpanish AmericanSpanish American IndianSri LankanSubsaharan AfricanSudaneseSwedishSwissSyrianTaiwaneseThaiTlingit-HaidaTohono O'OdhamTonganTrinidadian and TobagonianTsimshianTurkishU.S. Virgin IslanderUgandanUkrainianUruguayanUteVenezuelanVietnameseWelshWest IndianYakamaYaquiYugoslavianYumanYup'ikZimbabwean
Ancestry (Percentage)
AfghanAfricanAlaska NativeAlaskan AthabascanAlbanianAleutAlsatianAmericanApacheArabArapahoArgentineanArmenianAssyrian / Chaldean / SyriacAustralianAustrianBahamianBangladeshiBarbadianBasqueBelgianBelizeanBermudanBhutaneseBlackfeetBolivianBrazilianBritishBritish West IndianBulgarianBurmeseCajunCambodianCanadianCape VerdeanCarpatho RusynCelticCentral AmericanCentral American IndianCherokeeCheyenneChickasawChileanChineseChippewaChoctawColombianColvilleComancheCosta RicanCreeCreekCroatianCrowCubanCypriotCzechCzechoslovakianDanishDelawareDominicanDutchDutch West IndianEastern EuropeanEcuadorianEgyptianEnglishEstonianEthiopianEuropeanFijianFilipinoFinnishFrenchFrench American IndianFrench CanadianGermanGerman RussianGhanaianGreekGuamanian / ChamorroGuatemalanGuyaneseHaitianHmongHonduranHopiHoumaHungarianIcelanderIndian (Asian)IndonesianInupiatIranianIraqiIrishIroquoisIsraeliItalianJamaicanJapaneseJordanianKenyanKiowaKoreanLaotianLatvianLebaneseLiberianLithuanianLumbeeLuxembourgerMacedonianMalaysianMalteseMarshalleseMenomineeMexicanMexican American IndianMongolianMoroccanNative HawaiianNavajoNepaleseNew ZealanderNicaraguanNigerianNorthern EuropeanNorwegianOkinawanOsageOttawaPaiutePakistaniPalestinianPanamanianParaguayanPennsylvania GermanPeruvianPimaPolishPortuguesePotawatomiPuebloPuerto RicanPuget Sound SalishRomanianRussianSalvadoranSamoanScandinavianScotch-IrishScottishSeminoleSenegaleseSerbianShoshoneSierra LeoneanSiouxSlavicSlovakSloveneSomaliSouth AfricanSouth AmericanSouth American IndianSoviet UnionSpaniardSpanishSpanish AmericanSpanish American IndianSri LankanSubsaharan AfricanSudaneseSwedishSwissSyrianTaiwaneseThaiTlingit-HaidaTohono O'OdhamTonganTrinidadian and TobagonianTsimshianTurkishU.S. Virgin IslanderUgandanUkrainianUruguayanUteVenezuelanVietnameseWelshWest IndianYakamaYaquiYugoslavianYumanYup'ikZimbabwean
Immigrant Origin (Total)
AfghanistanAfricaAlbaniaArgentinaArmeniaAsiaAustraliaAustriaAzoresBahamasBangladeshBarbadosBelarusBelgiumBelizeBoliviaBosnia and HerzegovinaBrazilBulgariaBurma / MyanmarCabo VerdeCambodiaCameroonCanadaCaribbeanCentral AmericaChileChinaColombiaCongoCosta RicaCroatiaCubaCzechoslovakiaDenmarkDominicaDominican RepublicEastern AfricaEastern AsiaEastern EuropeEcuadorEgyptEl SalvadorEnglandEritreaEthiopiaEuropeFijiFranceGermanyGhanaGreeceGrenadaGuatemalaGuyanaHaitiHondurasHong KongHungaryIndiaIndonesiaIranIraqIrelandIsraelItalyJamaicaJapanJordanKazakhstanKenyaKoreaKuwaitLaosLatin AmericaLatviaLebanonLiberiaLithuaniaMalaysiaMexicoMicronesiaMiddle AfricaMoldovaMoroccoNepalNetherlandsNicaraguaNigeriaNorth MacedoniaNorthern AfricaNorthern EuropeNorwayOceaniaPakistanPanamaPeruPhilippinesPolandPortugalRomaniaRussiaSaudi ArabiaScotlandSenegalSerbiaSierra LeoneSingaporeSomaliaSouth AfricaSouth AmericaSouth Central AsiaSouth Eastern AsiaSouthern EuropeSpainSri LankaSt. Vincent and the GrenadinesSudanSwedenSwitzerlandSyriaTaiwanThailandTrinidad and TobagoTurkeyUgandaUkraineUruguayUzbekistanVenezuelaVietnamWest IndiesWestern AfricaWestern AsiaWestern EuropeYemenZaireZimbabwe
Immigrant Origin (Percentage)
AfghanistanAfricaAlbaniaArgentinaArmeniaAsiaAustraliaAustriaAzoresBahamasBangladeshBarbadosBelarusBelgiumBelizeBoliviaBosnia and HerzegovinaBrazilBulgariaBurma / MyanmarCabo VerdeCambodiaCameroonCanadaCaribbeanCentral AmericaChileChinaColombiaCongoCosta RicaCroatiaCubaCzechoslovakiaDenmarkDominicaDominican RepublicEastern AfricaEastern AsiaEastern EuropeEcuadorEgyptEl SalvadorEnglandEritreaEthiopiaEuropeFijiFranceGermanyGhanaGreeceGrenadaGuatemalaGuyanaHaitiHondurasHong KongHungaryIndiaIndonesiaIranIraqIrelandIsraelItalyJamaicaJapanJordanKazakhstanKenyaKoreaKuwaitLaosLatin AmericaLatviaLebanonLiberiaLithuaniaMalaysiaMexicoMicronesiaMiddle AfricaMoldovaMoroccoNepalNetherlandsNicaraguaNigeriaNorth MacedoniaNorthern AfricaNorthern EuropeNorwayOceaniaPakistanPanamaPeruPhilippinesPolandPortugalRomaniaRussiaSaudi ArabiaScotlandSenegalSerbiaSierra LeoneSingaporeSomaliaSouth AfricaSouth AmericaSouth Central AsiaSouth Eastern AsiaSouthern EuropeSpainSri LankaSt. Vincent and the GrenadinesSudanSwedenSwitzerlandSyriaTaiwanThailandTrinidad and TobagoTurkeyUgandaUkraineUruguayUzbekistanVenezuelaVietnamWest IndiesWestern AfricaWestern AsiaWestern EuropeYemenZaireZimbabwe
Income
Income (Families)
Income (Households)
Poverty
Poverty (Families)
Unemployment
Employment Occupations
Employment Industries
Employer Class
Commute Time
Commute Means
School Enrollment
Education by Degree Field
Occupancy
Finances
Physical Characteristics
Delaware
Compare Zip Codes
Comparison Subject

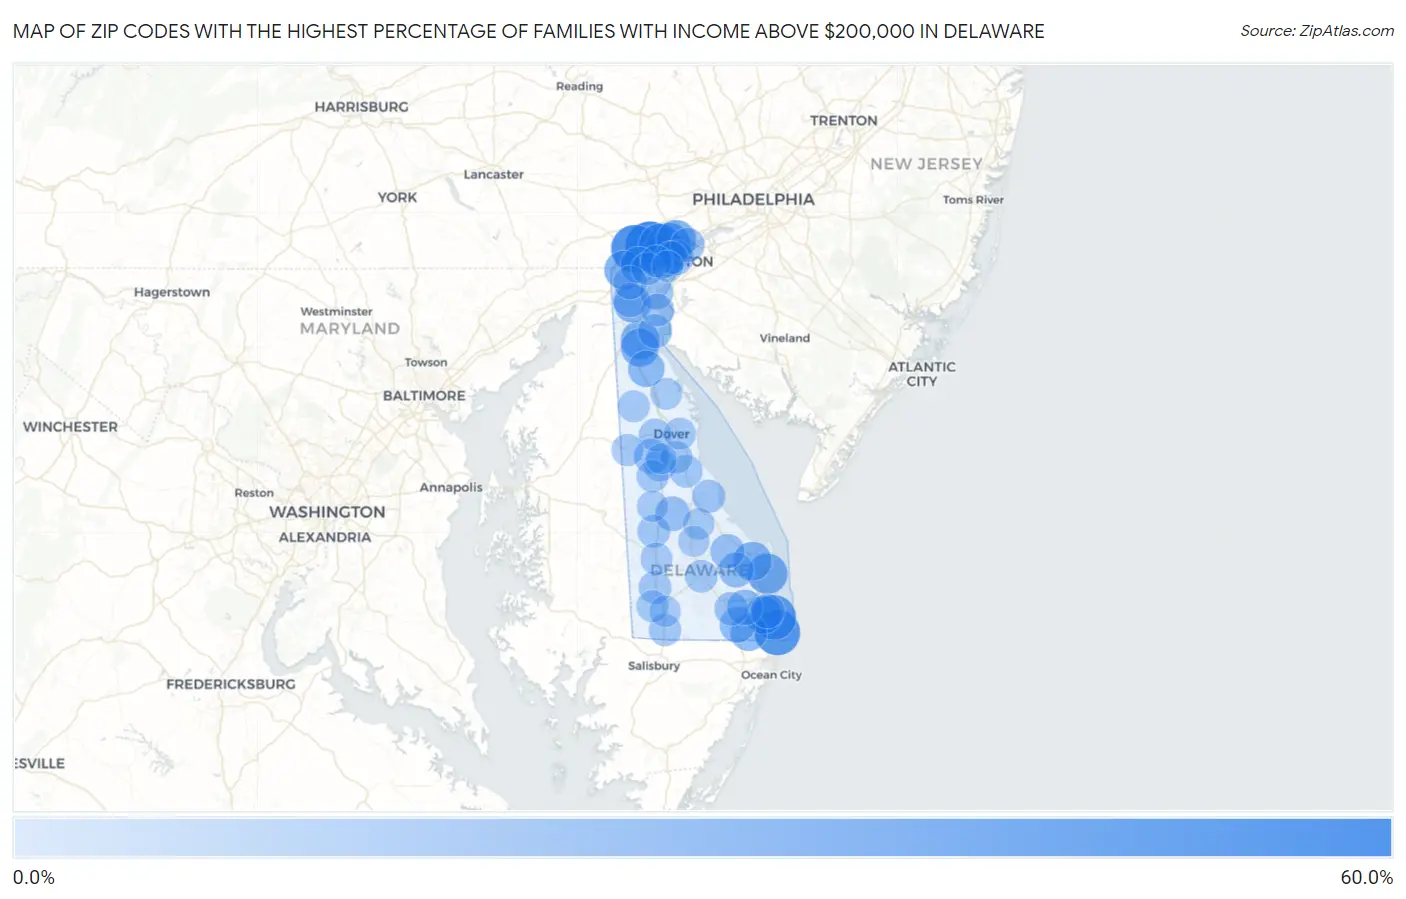
Map of Zip Codes with the Highest Percentage of Families with Income Above $200,000 in Delaware

0.0%
60.0%
Zip Codes with the Highest Percentage of Families with Income Above $200,000 in Delaware Map

Zip Codes with the Highest Percentage of Families with Income Above $200,000 in Delaware

Zip Code Families with Income > $200k vs State vs National
1.1980751.0%13.5%(+37.5)#114.8%(+36.2)#622
2.1970745.9%13.5%(+32.4)#214.8%(+31.1)#876
3.1994440.1%13.5%(+26.6)#314.8%(+25.3)#1,310
4.1993038.1%13.5%(+24.6)#414.8%(+23.3)#1,497
5.1980335.7%13.5%(+22.2)#514.8%(+20.9)#1,758
6.1980635.1%13.5%(+21.6)#614.8%(+20.3)#1,834
7.1973232.8%13.5%(+19.3)#714.8%(+18.0)#2,132
8.1997126.4%13.5%(+12.9)#814.8%(+11.6)#3,165
9.1981024.8%13.5%(+11.3)#914.8%(+10.00)#3,521
10.1971122.3%13.5%(+8.80)#1014.8%(+7.50)#4,129
11.1995822.2%13.5%(+8.70)#1114.8%(+7.40)#4,156
12.1970921.9%13.5%(+8.40)#1214.8%(+7.10)#4,230
13.1973020.9%13.5%(+7.40)#1314.8%(+6.10)#4,553
14.1970119.2%13.5%(+5.70)#1414.8%(+4.40)#5,072
15.1996719.2%13.5%(+5.70)#1514.8%(+4.40)#5,094
16.1997517.3%13.5%(+3.80)#1614.8%(+2.50)#5,864
17.1980816.3%13.5%(+2.80)#1714.8%(+1.50)#6,289
18.1973416.2%13.5%(+2.70)#1814.8%(+1.40)#6,354
19.1994513.8%13.5%(+0.300)#1914.8%(-1.00)#7,681
20.1993913.4%13.5%(-0.100)#2014.8%(-1.40)#7,937
21.1995112.3%13.5%(-1.20)#2114.8%(-2.50)#8,776
22.1980912.1%13.5%(-1.40)#2214.8%(-2.70)#8,900
23.1995411.8%13.5%(-1.70)#2314.8%(-3.00)#9,153
24.1993411.6%13.5%(-1.90)#2414.8%(-3.20)#9,276
25.1970210.8%13.5%(-2.70)#2514.8%(-4.00)#9,986
26.1996810.7%13.5%(-2.80)#2614.8%(-4.10)#10,116
27.1997010.5%13.5%(-3.00)#2714.8%(-4.30)#10,316
28.1970310.1%13.5%(-3.40)#2814.8%(-4.70)#10,704
29.197319.4%13.5%(-4.10)#2914.8%(-5.40)#11,510
30.197209.1%13.5%(-4.40)#3014.8%(-5.70)#11,754
31.199669.0%13.5%(-4.50)#3114.8%(-5.80)#11,901
32.197138.9%13.5%(-4.60)#3214.8%(-5.90)#12,020
33.199637.5%13.5%(-6.00)#3314.8%(-7.30)#13,877
34.198026.6%13.5%(-6.90)#3414.8%(-8.20)#15,384
35.199736.5%13.5%(-7.00)#3514.8%(-8.30)#15,519
36.199506.4%13.5%(-7.10)#3614.8%(-8.40)#15,736
37.197066.4%13.5%(-7.10)#3714.8%(-8.40)#15,794
38.198046.3%13.5%(-7.20)#3814.8%(-8.50)#15,905
39.199466.3%13.5%(-7.20)#3914.8%(-8.50)#15,948
40.199796.1%13.5%(-7.40)#4014.8%(-8.70)#16,395
41.199046.0%13.5%(-7.50)#4114.8%(-8.80)#16,433
42.199476.0%13.5%(-7.50)#4214.8%(-8.80)#16,460
43.199625.6%13.5%(-7.90)#4314.8%(-9.20)#17,204
44.199405.3%13.5%(-8.20)#4414.8%(-9.50)#17,850
45.199435.0%13.5%(-8.50)#4514.8%(-9.80)#18,441
46.199335.0%13.5%(-8.50)#4614.8%(-9.80)#18,446
47.199644.7%13.5%(-8.80)#4714.8%(-10.1)#19,095
48.198054.5%13.5%(-9.00)#4814.8%(-10.3)#19,372
49.199014.5%13.5%(-9.00)#4914.8%(-10.3)#19,373
50.199314.4%13.5%(-9.10)#5014.8%(-10.4)#19,733
51.199384.3%13.5%(-9.20)#5114.8%(-10.5)#19,809
52.199774.1%13.5%(-9.40)#5214.8%(-10.7)#20,191
53.199603.6%13.5%(-9.90)#5314.8%(-11.2)#21,301
54.198013.4%13.5%(-10.1)#5414.8%(-11.4)#21,677
55.199562.8%13.5%(-10.7)#5514.8%(-12.0)#22,912
56.199522.5%13.5%(-11.0)#5614.8%(-12.3)#23,517
57.199412.2%13.5%(-11.3)#5714.8%(-12.6)#24,157
58.199801.7%13.5%(-11.8)#5814.8%(-13.1)#25,141

Common Questions

What are the Top 10 Zip Codes with the Highest Percentage of Families with Income Above $200,000 in Delaware?
Top 10 Zip Codes with the Highest Percentage of Families with Income Above $200,000 in Delaware are:
#1
51.0%
#2
45.9%
#3
40.1%
#4
38.1%
#5
35.7%
#6
35.1%
#7
32.8%
#8
26.4%
#9
24.8%
#10
22.3%
What zip code has the Highest Percentage of Families with Income Above $200,000 in Delaware?
19807 has the Highest Percentage of Families with Income Above $200,000 in Delaware with 51.0%.
What is the Percentage of Families with Income Above $200,000 in the State of Delaware?
Percentage of Families with Income Above $200,000 in Delaware is 13.5%.
What is the Percentage of Families with Income Above $200,000 in the United States?
Percentage of Families with Income Above $200,000 in the United States is 14.8%.