Zip Codes with the Lowest Poverty Level Among Children Under the Age of 5 in Vermont
RELATED REPORTS & OPTIONS
Lowest Poverty | Child 0-5
Vermont
Compare Zip Codes
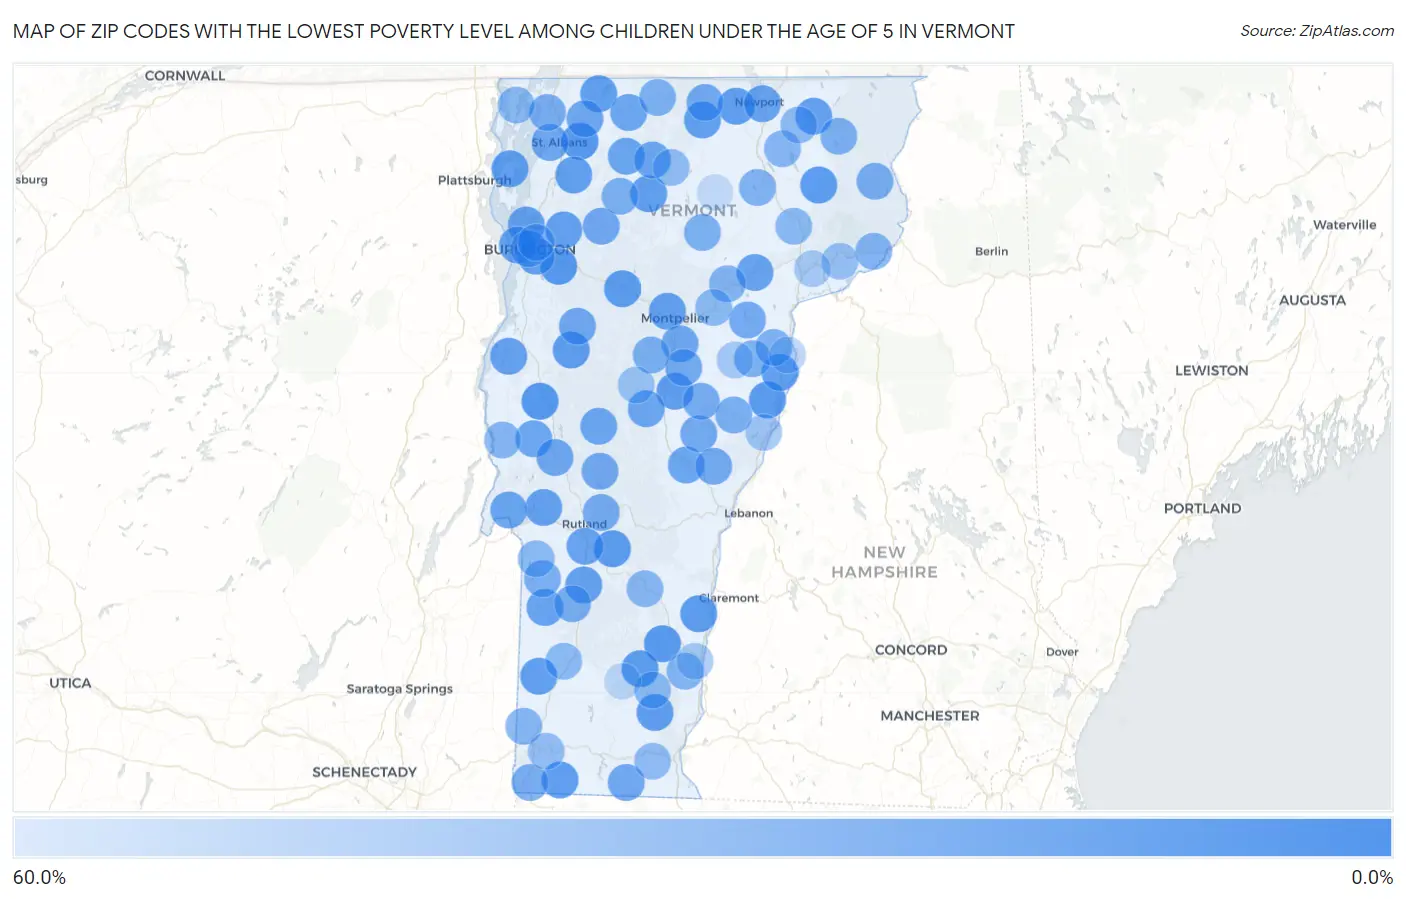
Map of Zip Codes with the Lowest Poverty Level Among Children Under the Age of 5 in Vermont
60.0%
0.0%
Zip Codes with the Lowest Poverty Level Among Children Under the Age of 5 in Vermont
| Zip Code | Child Poverty | vs State | vs National | |
| 1. | 05753 | 0.85% | 11.5%(-10.7)#1 | 18.1%(-17.2)#206 |
| 2. | 05495 | 1.2% | 11.5%(-10.3)#2 | 18.1%(-16.9)#373 |
| 3. | 05455 | 1.2% | 11.5%(-10.3)#3 | 18.1%(-16.9)#381 |
| 4. | 05033 | 1.6% | 11.5%(-9.89)#4 | 18.1%(-16.4)#607 |
| 5. | 05143 | 1.8% | 11.5%(-9.76)#5 | 18.1%(-16.3)#680 |
| 6. | 05871 | 2.9% | 11.5%(-8.58)#6 | 18.1%(-15.1)#1,466 |
| 7. | 05676 | 3.0% | 11.5%(-8.51)#7 | 18.1%(-15.1)#1,504 |
| 8. | 05359 | 3.4% | 11.5%(-8.07)#8 | 18.1%(-14.6)#1,799 |
| 9. | 05156 | 3.9% | 11.5%(-7.57)#9 | 18.1%(-14.1)#2,125 |
| 10. | 05738 | 4.0% | 11.5%(-7.48)#10 | 18.1%(-14.0)#2,200 |
| 11. | 05345 | 5.1% | 11.5%(-6.43)#11 | 18.1%(-13.0)#2,952 |
| 12. | 05857 | 5.1% | 11.5%(-6.42)#12 | 18.1%(-13.0)#2,971 |
| 13. | 05036 | 5.5% | 11.5%(-6.06)#13 | 18.1%(-12.6)#3,209 |
| 14. | 05443 | 5.6% | 11.5%(-5.96)#14 | 18.1%(-12.5)#3,276 |
| 15. | 05352 | 5.9% | 11.5%(-5.64)#15 | 18.1%(-12.2)#3,512 |
| 16. | 05051 | 6.1% | 11.5%(-5.44)#16 | 18.1%(-12.0)#3,651 |
| 17. | 05454 | 6.1% | 11.5%(-5.40)#17 | 18.1%(-11.9)#3,676 |
| 18. | 05250 | 6.2% | 11.5%(-5.31)#18 | 18.1%(-11.9)#3,741 |
| 19. | 05874 | 6.4% | 11.5%(-5.13)#19 | 18.1%(-11.7)#3,867 |
| 20. | 05458 | 6.7% | 11.5%(-4.85)#20 | 18.1%(-11.4)#4,037 |
| 21. | 05656 | 7.1% | 11.5%(-4.41)#21 | 18.1%(-11.0)#4,347 |
| 22. | 05457 | 7.1% | 11.5%(-4.37)#22 | 18.1%(-10.9)#4,370 |
| 23. | 05452 | 7.3% | 11.5%(-4.24)#23 | 18.1%(-10.8)#4,466 |
| 24. | 05602 | 7.3% | 11.5%(-4.17)#24 | 18.1%(-10.7)#4,507 |
| 25. | 05773 | 8.4% | 11.5%(-3.10)#25 | 18.1%(-9.64)#5,193 |
| 26. | 05853 | 8.6% | 11.5%(-2.95)#26 | 18.1%(-9.49)#5,306 |
| 27. | 05446 | 8.6% | 11.5%(-2.90)#27 | 18.1%(-9.45)#5,342 |
| 28. | 05403 | 8.7% | 11.5%(-2.84)#28 | 18.1%(-9.38)#5,384 |
| 29. | 05735 | 9.2% | 11.5%(-2.34)#29 | 18.1%(-8.89)#5,733 |
| 30. | 05408 | 9.5% | 11.5%(-2.04)#30 | 18.1%(-8.59)#5,923 |
| 31. | 05491 | 9.5% | 11.5%(-1.98)#31 | 18.1%(-8.52)#5,993 |
| 32. | 05855 | 9.8% | 11.5%(-1.73)#32 | 18.1%(-8.27)#6,131 |
| 33. | 05759 | 10.1% | 11.5%(-1.43)#33 | 18.1%(-7.98)#6,316 |
| 34. | 05761 | 10.2% | 11.5%(-1.31)#34 | 18.1%(-7.86)#6,385 |
| 35. | 05873 | 10.3% | 11.5%(-1.17)#35 | 18.1%(-7.72)#6,480 |
| 36. | 05743 | 11.2% | 11.5%(-0.281)#36 | 18.1%(-6.83)#6,996 |
| 37. | 05060 | 12.1% | 11.5%(+0.563)#37 | 18.1%(-5.98)#7,512 |
| 38. | 05068 | 12.3% | 11.5%(+0.828)#38 | 18.1%(-5.72)#7,660 |
| 39. | 05778 | 12.5% | 11.5%(+0.983)#39 | 18.1%(-5.56)#7,767 |
| 40. | 05441 | 12.5% | 11.5%(+0.983)#40 | 18.1%(-5.56)#7,777 |
| 41. | 05442 | 12.5% | 11.5%(+0.983)#41 | 18.1%(-5.56)#7,779 |
| 42. | 05748 | 12.9% | 11.5%(+1.39)#42 | 18.1%(-5.16)#7,993 |
| 43. | 05450 | 13.0% | 11.5%(+1.45)#43 | 18.1%(-5.09)#8,023 |
| 44. | 05733 | 13.1% | 11.5%(+1.60)#44 | 18.1%(-4.94)#8,117 |
| 45. | 05641 | 13.4% | 11.5%(+1.92)#45 | 18.1%(-4.62)#8,307 |
| 46. | 05478 | 13.9% | 11.5%(+2.34)#46 | 18.1%(-4.21)#8,552 |
| 47. | 05483 | 14.2% | 11.5%(+2.63)#47 | 18.1%(-3.91)#8,715 |
| 48. | 05342 | 14.3% | 11.5%(+2.77)#48 | 18.1%(-3.78)#8,832 |
| 49. | 05489 | 14.4% | 11.5%(+2.87)#49 | 18.1%(-3.67)#8,890 |
| 50. | 05487 | 14.5% | 11.5%(+2.98)#50 | 18.1%(-3.57)#8,940 |
| 51. | 05679 | 15.4% | 11.5%(+3.87)#51 | 18.1%(-2.68)#9,421 |
| 52. | 05077 | 15.4% | 11.5%(+3.87)#52 | 18.1%(-2.68)#9,436 |
| 53. | 05065 | 15.6% | 11.5%(+4.11)#53 | 18.1%(-2.44)#9,559 |
| 54. | 05859 | 16.3% | 11.5%(+4.74)#54 | 18.1%(-1.80)#9,888 |
| 55. | 05737 | 16.3% | 11.5%(+4.76)#55 | 18.1%(-1.78)#9,902 |
| 56. | 05046 | 17.6% | 11.5%(+6.13)#56 | 18.1%(-0.416)#10,539 |
| 57. | 05701 | 17.7% | 11.5%(+6.16)#57 | 18.1%(-0.382)#10,557 |
| 58. | 05038 | 17.9% | 11.5%(+6.43)#58 | 18.1%(-0.114)#10,690 |
| 59. | 05261 | 18.9% | 11.5%(+7.35)#59 | 18.1%(+0.805)#11,109 |
| 60. | 05488 | 18.9% | 11.5%(+7.40)#60 | 18.1%(+0.851)#11,134 |
| 61. | 05905 | 19.2% | 11.5%(+7.71)#61 | 18.1%(+1.17)#11,281 |
| 62. | 05739 | 19.7% | 11.5%(+8.15)#62 | 18.1%(+1.61)#11,482 |
| 63. | 05079 | 20.0% | 11.5%(+8.48)#63 | 18.1%(+1.94)#11,636 |
| 64. | 05774 | 20.3% | 11.5%(+8.82)#64 | 18.1%(+2.28)#11,800 |
| 65. | 05663 | 20.7% | 11.5%(+9.21)#65 | 18.1%(+2.67)#11,962 |
| 66. | 05680 | 21.4% | 11.5%(+9.84)#66 | 18.1%(+3.30)#12,220 |
| 67. | 05464 | 21.5% | 11.5%(+10.0)#67 | 18.1%(+3.46)#12,296 |
| 68. | 05846 | 21.6% | 11.5%(+10.1)#68 | 18.1%(+3.56)#12,330 |
| 69. | 05476 | 21.7% | 11.5%(+10.1)#69 | 18.1%(+3.59)#12,342 |
| 70. | 05401 | 21.8% | 11.5%(+10.3)#70 | 18.1%(+3.77)#12,418 |
| 71. | 05076 | 22.2% | 11.5%(+10.7)#71 | 18.1%(+4.16)#12,589 |
| 72. | 05069 | 23.3% | 11.5%(+11.8)#72 | 18.1%(+5.27)#13,037 |
| 73. | 05839 | 23.8% | 11.5%(+12.3)#73 | 18.1%(+5.75)#13,242 |
| 74. | 05404 | 24.8% | 11.5%(+13.3)#74 | 18.1%(+6.78)#13,598 |
| 75. | 05906 | 25.0% | 11.5%(+13.5)#75 | 18.1%(+6.94)#13,657 |
| 76. | 05154 | 25.3% | 11.5%(+13.8)#76 | 18.1%(+7.25)#13,800 |
| 77. | 05658 | 25.4% | 11.5%(+13.9)#77 | 18.1%(+7.31)#13,814 |
| 78. | 05257 | 26.6% | 11.5%(+15.1)#78 | 18.1%(+8.51)#14,222 |
| 79. | 05770 | 26.8% | 11.5%(+15.3)#79 | 18.1%(+8.72)#14,301 |
| 80. | 05860 | 27.1% | 11.5%(+15.6)#80 | 18.1%(+9.05)#14,396 |
| 81. | 05149 | 28.0% | 11.5%(+16.5)#81 | 18.1%(+9.99)#14,716 |
| 82. | 05440 | 28.1% | 11.5%(+16.6)#82 | 18.1%(+10.1)#14,731 |
| 83. | 05851 | 28.9% | 11.5%(+17.4)#83 | 18.1%(+10.8)#14,988 |
| 84. | 05353 | 29.2% | 11.5%(+17.6)#84 | 18.1%(+11.1)#15,066 |
| 85. | 05764 | 29.5% | 11.5%(+18.0)#85 | 18.1%(+11.4)#15,173 |
| 86. | 05255 | 29.9% | 11.5%(+18.3)#86 | 18.1%(+11.8)#15,285 |
| 87. | 05667 | 30.3% | 11.5%(+18.7)#87 | 18.1%(+12.2)#15,397 |
| 88. | 05872 | 31.2% | 11.5%(+19.7)#88 | 18.1%(+13.2)#15,655 |
| 89. | 05301 | 31.7% | 11.5%(+20.2)#89 | 18.1%(+13.6)#15,765 |
| 90. | 05652 | 33.3% | 11.5%(+21.8)#90 | 18.1%(+15.3)#16,191 |
| 91. | 05201 | 34.8% | 11.5%(+23.3)#91 | 18.1%(+16.7)#16,557 |
| 92. | 05824 | 35.7% | 11.5%(+24.2)#92 | 18.1%(+17.7)#16,779 |
| 93. | 05669 | 37.9% | 11.5%(+26.4)#93 | 18.1%(+19.8)#17,240 |
| 94. | 05045 | 40.4% | 11.5%(+28.9)#94 | 18.1%(+22.4)#17,730 |
| 95. | 05101 | 42.3% | 11.5%(+30.7)#95 | 18.1%(+24.2)#18,056 |
| 96. | 05086 | 43.5% | 11.5%(+32.0)#96 | 18.1%(+25.4)#18,257 |
| 97. | 05819 | 43.9% | 11.5%(+32.4)#97 | 18.1%(+25.8)#18,317 |
| 98. | 05081 | 50.0% | 11.5%(+38.5)#98 | 18.1%(+31.9)#19,103 |
| 99. | 05343 | 56.2% | 11.5%(+44.7)#99 | 18.1%(+38.2)#19,703 |
| 100. | 05826 | 58.8% | 11.5%(+47.3)#100 | 18.1%(+40.8)#19,892 |
Common Questions
What are the Top 10 Zip Codes with the Lowest Poverty Level Among Children Under the Age of 5 in Vermont?
Top 10 Zip Codes with the Lowest Poverty Level Among Children Under the Age of 5 in Vermont are:
What zip code has the Lowest Poverty Level Among Children Under the Age of 5 in Vermont?
05753 has the Lowest Poverty Level Among Children Under the Age of 5 in Vermont with 0.85%.
What is the Poverty Level Among Children Under the Age of 5 in the State of Vermont?
Poverty Level Among Children Under the Age of 5 in Vermont is 11.5%.
What is the Poverty Level Among Children Under the Age of 5 in the United States?
Poverty Level Among Children Under the Age of 5 in the United States is 18.1%.