Zip Codes with the Highest Percentage of Population with a Degree in Arts and Humanities in Utah
RELATED REPORTS & OPTIONS
Arts and Humanities
Utah
Compare Zip Codes
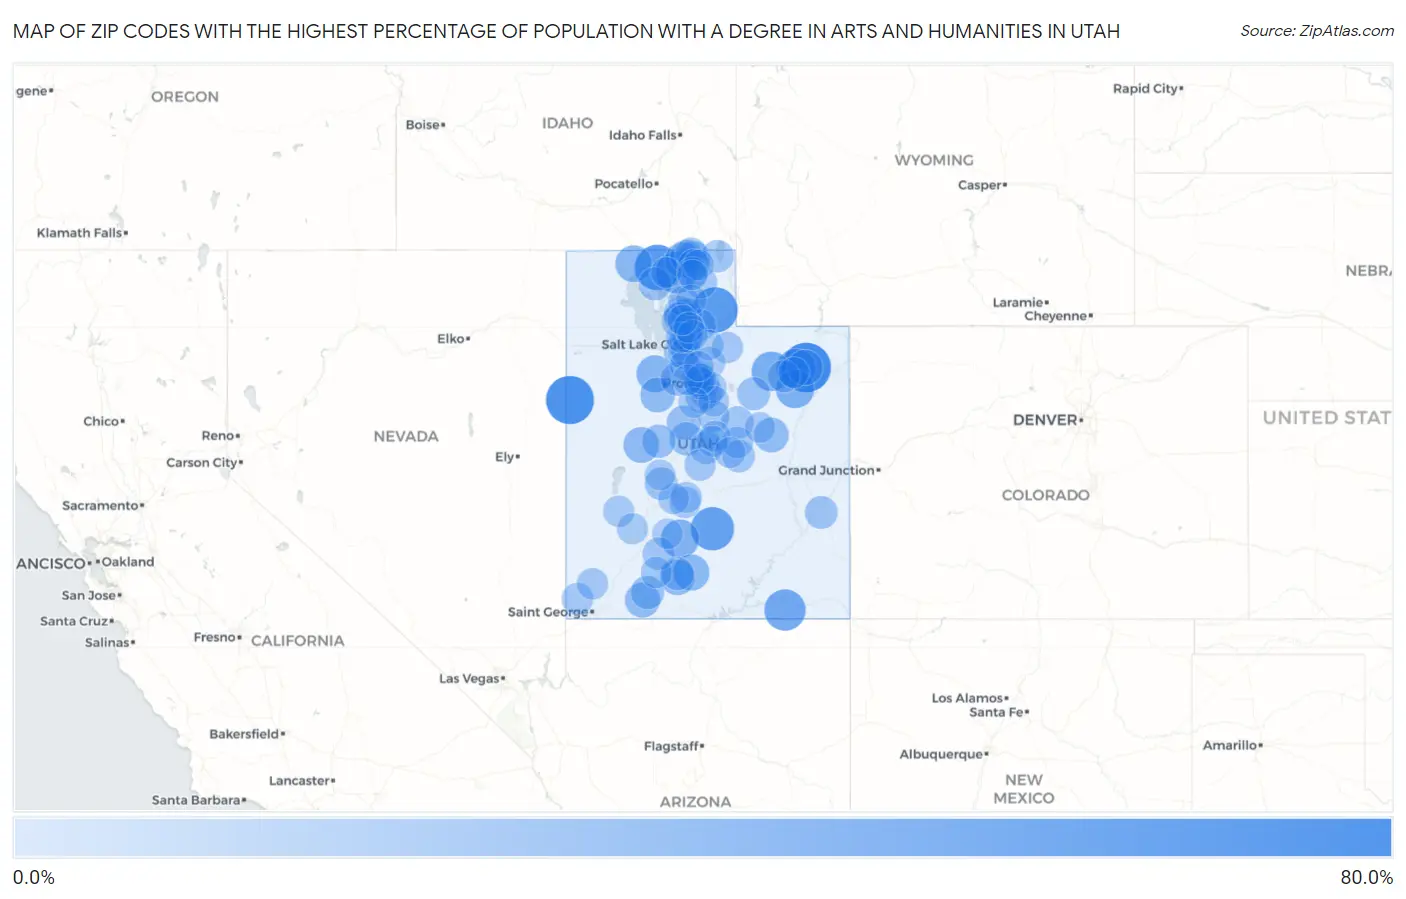
Map of Zip Codes with the Highest Percentage of Population with a Degree in Arts and Humanities in Utah
0.0%
80.0%
Zip Codes with the Highest Percentage of Population with a Degree in Arts and Humanities in Utah
| Zip Code | % Graduates | vs State | vs National | |
| 1. | 84039 | 61.3% | 7.9%(+53.4)#1 | 6.0%(+55.3)#153 |
| 2. | 84034 | 57.1% | 7.9%(+49.3)#2 | 6.0%(+51.1)#168 |
| 3. | 84316 | 50.0% | 7.9%(+42.1)#3 | 6.0%(+44.0)#217 |
| 4. | 84018 | 50.0% | 7.9%(+42.1)#4 | 6.0%(+44.0)#220 |
| 5. | 84773 | 43.9% | 7.9%(+36.0)#5 | 6.0%(+37.9)#291 |
| 6. | 84309 | 39.3% | 7.9%(+31.4)#6 | 6.0%(+33.3)#363 |
| 7. | 84536 | 38.5% | 7.9%(+30.6)#7 | 6.0%(+32.5)#374 |
| 8. | 84053 | 34.2% | 7.9%(+26.4)#8 | 6.0%(+28.3)#490 |
| 9. | 84051 | 32.8% | 7.9%(+24.9)#9 | 6.0%(+26.8)#548 |
| 10. | 84052 | 31.3% | 7.9%(+23.5)#10 | 6.0%(+25.3)#608 |
| 11. | 84712 | 30.0% | 7.9%(+22.1)#11 | 6.0%(+24.0)#663 |
| 12. | 84069 | 26.7% | 7.9%(+18.8)#12 | 6.0%(+20.7)#843 |
| 13. | 84336 | 25.9% | 7.9%(+18.0)#13 | 6.0%(+19.9)#894 |
| 14. | 84736 | 24.1% | 7.9%(+16.3)#14 | 6.0%(+18.1)#1,025 |
| 15. | 84635 | 23.4% | 7.9%(+15.5)#15 | 6.0%(+17.4)#1,083 |
| 16. | 84076 | 22.5% | 7.9%(+14.6)#16 | 6.0%(+16.5)#1,165 |
| 17. | 84327 | 22.1% | 7.9%(+14.2)#17 | 6.0%(+16.1)#1,223 |
| 18. | 84718 | 21.9% | 7.9%(+14.0)#18 | 6.0%(+15.9)#1,249 |
| 19. | 84758 | 21.6% | 7.9%(+13.7)#19 | 6.0%(+15.6)#1,283 |
| 20. | 84080 | 21.1% | 7.9%(+13.2)#20 | 6.0%(+15.1)#1,343 |
| 21. | 84520 | 20.9% | 7.9%(+13.0)#21 | 6.0%(+14.9)#1,361 |
| 22. | 84648 | 18.5% | 7.9%(+10.7)#22 | 6.0%(+12.5)#1,718 |
| 23. | 84013 | 18.4% | 7.9%(+10.5)#23 | 6.0%(+12.4)#1,749 |
| 24. | 84639 | 17.1% | 7.9%(+9.19)#24 | 6.0%(+11.1)#2,057 |
| 25. | 84729 | 16.7% | 7.9%(+8.78)#25 | 6.0%(+10.7)#2,165 |
| 26. | 84640 | 16.7% | 7.9%(+8.78)#26 | 6.0%(+10.7)#2,173 |
| 27. | 84307 | 16.0% | 7.9%(+8.14)#27 | 6.0%(+10.0)#2,335 |
| 28. | 84027 | 16.0% | 7.9%(+8.07)#28 | 6.0%(+9.96)#2,362 |
| 29. | 84776 | 15.6% | 7.9%(+7.74)#29 | 6.0%(+9.63)#2,447 |
| 30. | 84333 | 15.6% | 7.9%(+7.72)#30 | 6.0%(+9.61)#2,454 |
| 31. | 84087 | 15.6% | 7.9%(+7.70)#31 | 6.0%(+9.59)#2,463 |
| 32. | 84627 | 15.6% | 7.9%(+7.68)#32 | 6.0%(+9.57)#2,473 |
| 33. | 84644 | 15.4% | 7.9%(+7.50)#33 | 6.0%(+9.39)#2,538 |
| 34. | 84532 | 15.1% | 7.9%(+7.20)#34 | 6.0%(+9.08)#2,642 |
| 35. | 84338 | 15.0% | 7.9%(+7.12)#35 | 6.0%(+9.00)#2,670 |
| 36. | 84664 | 14.7% | 7.9%(+6.84)#36 | 6.0%(+8.73)#2,788 |
| 37. | 84759 | 14.4% | 7.9%(+6.55)#37 | 6.0%(+8.44)#2,911 |
| 38. | 84056 | 14.4% | 7.9%(+6.48)#38 | 6.0%(+8.36)#2,947 |
| 39. | 84118 | 14.2% | 7.9%(+6.35)#39 | 6.0%(+8.24)#3,014 |
| 40. | 84513 | 14.2% | 7.9%(+6.34)#40 | 6.0%(+8.23)#3,019 |
| 41. | 84526 | 14.2% | 7.9%(+6.33)#41 | 6.0%(+8.22)#3,023 |
| 42. | 84028 | 14.2% | 7.9%(+6.30)#42 | 6.0%(+8.19)#3,041 |
| 43. | 84067 | 13.7% | 7.9%(+5.81)#43 | 6.0%(+7.69)#3,269 |
| 44. | 84007 | 13.5% | 7.9%(+5.63)#44 | 6.0%(+7.52)#3,360 |
| 45. | 84320 | 13.2% | 7.9%(+5.33)#45 | 6.0%(+7.22)#3,512 |
| 46. | 84050 | 13.1% | 7.9%(+5.20)#46 | 6.0%(+7.09)#3,594 |
| 47. | 84075 | 12.9% | 7.9%(+5.07)#47 | 6.0%(+6.95)#3,678 |
| 48. | 84319 | 12.3% | 7.9%(+4.45)#48 | 6.0%(+6.33)#4,095 |
| 49. | 84318 | 12.2% | 7.9%(+4.33)#49 | 6.0%(+6.22)#4,172 |
| 50. | 84765 | 12.0% | 7.9%(+4.14)#50 | 6.0%(+6.03)#4,295 |
| 51. | 84629 | 12.0% | 7.9%(+4.12)#51 | 6.0%(+6.00)#4,307 |
| 52. | 84722 | 11.7% | 7.9%(+3.86)#52 | 6.0%(+5.75)#4,511 |
| 53. | 84528 | 11.7% | 7.9%(+3.79)#53 | 6.0%(+5.68)#4,554 |
| 54. | 84643 | 11.5% | 7.9%(+3.66)#54 | 6.0%(+5.54)#4,654 |
| 55. | 84735 | 11.5% | 7.9%(+3.66)#55 | 6.0%(+5.54)#4,661 |
| 56. | 84405 | 11.5% | 7.9%(+3.60)#56 | 6.0%(+5.49)#4,706 |
| 57. | 84055 | 11.5% | 7.9%(+3.57)#57 | 6.0%(+5.45)#4,729 |
| 58. | 84751 | 11.1% | 7.9%(+3.26)#58 | 6.0%(+5.14)#4,991 |
| 59. | 84744 | 11.1% | 7.9%(+3.23)#59 | 6.0%(+5.12)#5,053 |
| 60. | 84653 | 11.0% | 7.9%(+3.16)#60 | 6.0%(+5.05)#5,103 |
| 61. | 84647 | 10.9% | 7.9%(+3.01)#61 | 6.0%(+4.90)#5,240 |
| 62. | 84752 | 10.8% | 7.9%(+2.96)#62 | 6.0%(+4.85)#5,275 |
| 63. | 84606 | 10.8% | 7.9%(+2.93)#63 | 6.0%(+4.81)#5,310 |
| 64. | 84701 | 10.7% | 7.9%(+2.80)#64 | 6.0%(+4.69)#5,445 |
| 65. | 84601 | 10.7% | 7.9%(+2.77)#65 | 6.0%(+4.66)#5,480 |
| 66. | 84662 | 10.5% | 7.9%(+2.66)#66 | 6.0%(+4.54)#5,591 |
| 67. | 84057 | 10.4% | 7.9%(+2.54)#67 | 6.0%(+4.43)#5,720 |
| 68. | 84332 | 10.3% | 7.9%(+2.43)#68 | 6.0%(+4.32)#5,854 |
| 69. | 84537 | 10.2% | 7.9%(+2.36)#69 | 6.0%(+4.25)#5,942 |
| 70. | 84724 | 10.2% | 7.9%(+2.35)#70 | 6.0%(+4.24)#5,943 |
| 71. | 84066 | 10.1% | 7.9%(+2.26)#71 | 6.0%(+4.15)#6,060 |
| 72. | 84059 | 10.1% | 7.9%(+2.25)#72 | 6.0%(+4.14)#6,073 |
| 73. | 84049 | 10.1% | 7.9%(+2.23)#73 | 6.0%(+4.12)#6,095 |
| 74. | 84104 | 10.1% | 7.9%(+2.23)#74 | 6.0%(+4.11)#6,108 |
| 75. | 84414 | 10.1% | 7.9%(+2.22)#75 | 6.0%(+4.11)#6,117 |
| 76. | 84663 | 9.9% | 7.9%(+2.00)#76 | 6.0%(+3.89)#6,406 |
| 77. | 84660 | 9.9% | 7.9%(+2.00)#77 | 6.0%(+3.89)#6,418 |
| 78. | 84084 | 9.9% | 7.9%(+1.97)#78 | 6.0%(+3.86)#6,460 |
| 79. | 84025 | 9.8% | 7.9%(+1.96)#79 | 6.0%(+3.84)#6,471 |
| 80. | 84015 | 9.8% | 7.9%(+1.90)#80 | 6.0%(+3.79)#6,538 |
| 81. | 84058 | 9.8% | 7.9%(+1.89)#81 | 6.0%(+3.78)#6,562 |
| 82. | 84123 | 9.7% | 7.9%(+1.86)#82 | 6.0%(+3.75)#6,595 |
| 83. | 84631 | 9.7% | 7.9%(+1.82)#83 | 6.0%(+3.71)#6,643 |
| 84. | 84542 | 9.7% | 7.9%(+1.81)#84 | 6.0%(+3.70)#6,659 |
| 85. | 84337 | 9.7% | 7.9%(+1.81)#85 | 6.0%(+3.69)#6,669 |
| 86. | 84065 | 9.4% | 7.9%(+1.55)#86 | 6.0%(+3.43)#7,045 |
| 87. | 84321 | 9.4% | 7.9%(+1.54)#87 | 6.0%(+3.43)#7,050 |
| 88. | 84054 | 9.4% | 7.9%(+1.47)#88 | 6.0%(+3.36)#7,161 |
| 89. | 84116 | 9.3% | 7.9%(+1.38)#89 | 6.0%(+3.27)#7,298 |
| 90. | 84097 | 9.2% | 7.9%(+1.35)#90 | 6.0%(+3.24)#7,351 |
| 91. | 84310 | 9.2% | 7.9%(+1.34)#91 | 6.0%(+3.23)#7,366 |
| 92. | 84326 | 9.2% | 7.9%(+1.31)#92 | 6.0%(+3.19)#7,433 |
| 93. | 84655 | 9.2% | 7.9%(+1.30)#93 | 6.0%(+3.19)#7,437 |
| 94. | 84045 | 9.2% | 7.9%(+1.27)#94 | 6.0%(+3.16)#7,482 |
| 95. | 84037 | 9.1% | 7.9%(+1.21)#95 | 6.0%(+3.09)#7,613 |
| 96. | 84723 | 9.0% | 7.9%(+1.11)#96 | 6.0%(+2.99)#7,768 |
| 97. | 84098 | 8.8% | 7.9%(+0.962)#97 | 6.0%(+2.85)#7,993 |
| 98. | 84010 | 8.8% | 7.9%(+0.949)#98 | 6.0%(+2.84)#8,019 |
| 99. | 84003 | 8.8% | 7.9%(+0.890)#99 | 6.0%(+2.78)#8,131 |
| 100. | 84041 | 8.8% | 7.9%(+0.885)#100 | 6.0%(+2.77)#8,143 |
Common Questions
What are the Top 10 Zip Codes with the Highest Percentage of Population with a Degree in Arts and Humanities in Utah?
Top 10 Zip Codes with the Highest Percentage of Population with a Degree in Arts and Humanities in Utah are:
What zip code has the Highest Percentage of Population with a Degree in Arts and Humanities in Utah?
84039 has the Highest Percentage of Population with a Degree in Arts and Humanities in Utah with 61.3%.
What is the Percentage of Population with a Degree in Arts and Humanities in the State of Utah?
Percentage of Population with a Degree in Arts and Humanities in Utah is 7.9%.
What is the Percentage of Population with a Degree in Arts and Humanities in the United States?
Percentage of Population with a Degree in Arts and Humanities in the United States is 6.0%.