Serenada, TX Map & Demographics
Serenada Map
Serenada Overview
$41,657
PER CAPITA INCOME
$91,563
AVG FAMILY INCOME
$84,792
AVG HOUSEHOLD INCOME
60.2%
WAGE / INCOME GAP [ % ]
39.8¢/ $1
WAGE / INCOME GAP [ $ ]
0.29
INEQUALITY / GINI INDEX
1,695
TOTAL POPULATION
820
MALE POPULATION
875
FEMALE POPULATION
93.71
MALES / 100 FEMALES
106.71
FEMALES / 100 MALES
49.7
MEDIAN AGE
2.7
AVG FAMILY SIZE
2.5
AVG HOUSEHOLD SIZE
903
LABOR FORCE [ PEOPLE ]
60.5%
PERCENT IN LABOR FORCE
3.1%
UNEMPLOYMENT RATE
Income in Serenada
Income Overview in Serenada
Per Capita Income in Serenada is $41,657, while median incomes of families and households are $91,563 and $84,792 respectively.
| Characteristic | Number | Measure |
| Per Capita Income | 1,695 | $41,657 |
| Median Family Income | 558 | $91,563 |
| Mean Family Income | 558 | $113,189 |
| Median Household Income | 679 | $84,792 |
| Mean Household Income | 679 | $101,912 |
| Income Deficit | 558 | $0 |
| Wage / Income Gap (%) | 1,695 | 60.22% |
| Wage / Income Gap ($) | 1,695 | 39.78¢ per $1 |
| Gini / Inequality Index | 1,695 | 0.29 |
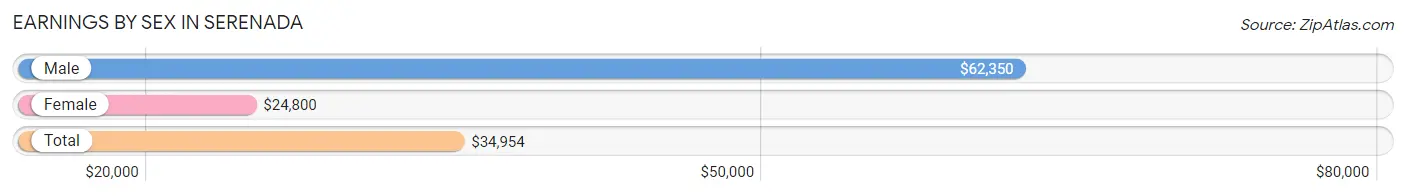
Earnings by Sex in Serenada
Average Earnings in Serenada are $34,954, $62,350 for men and $24,800 for women, a difference of 60.2%.
| Sex | Number | Average Earnings |
| Male | 453 (47.6%) | $62,350 |
| Female | 498 (52.4%) | $24,800 |
| Total | 951 (100.0%) | $34,954 |
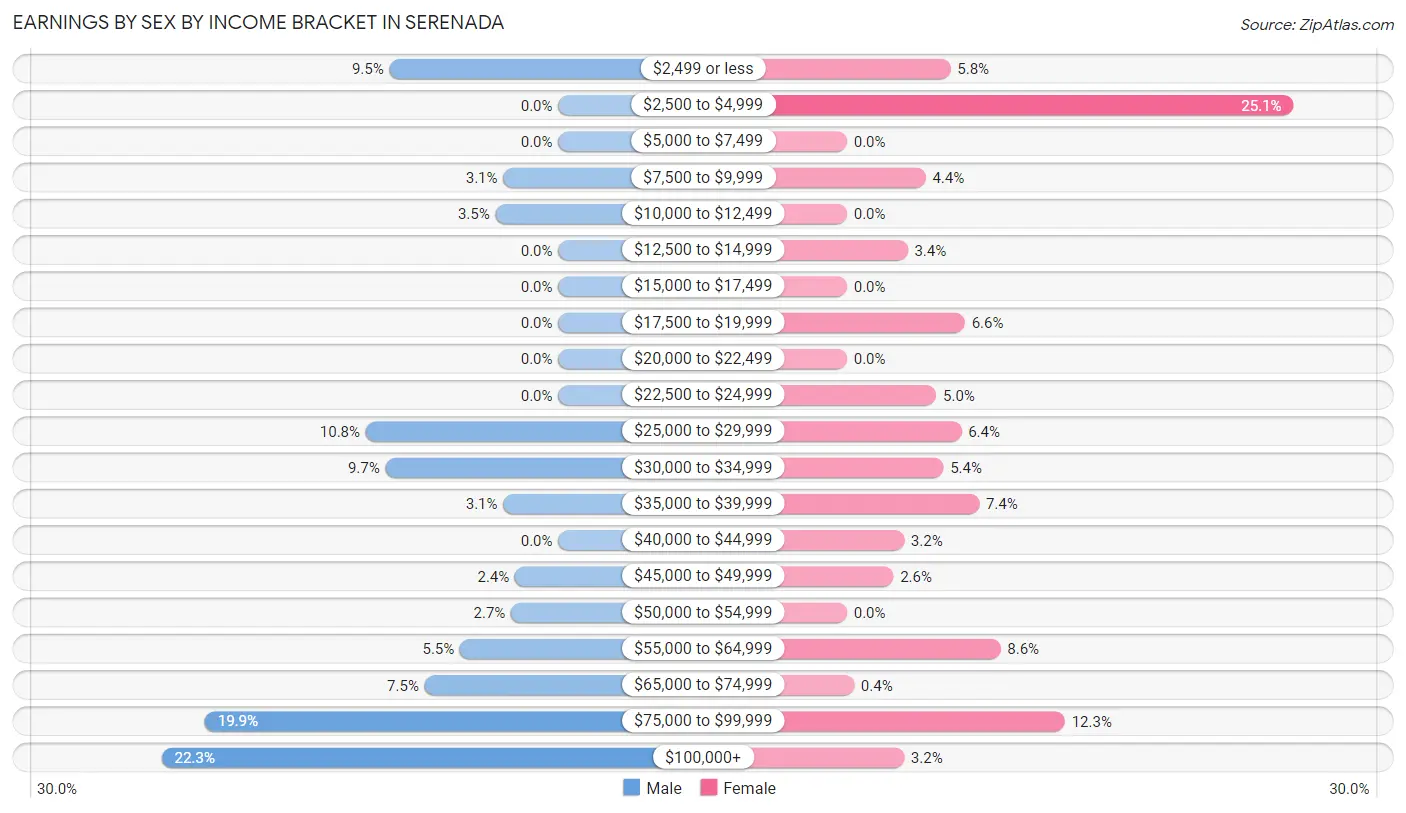
Earnings by Sex by Income Bracket in Serenada
The most common earnings brackets in Serenada are $100,000+ for men (101 | 22.3%) and $2,500 to $4,999 for women (125 | 25.1%).
| Income | Male | Female |
| $2,499 or less | 43 (9.5%) | 29 (5.8%) |
| $2,500 to $4,999 | 0 (0.0%) | 125 (25.1%) |
| $5,000 to $7,499 | 0 (0.0%) | 0 (0.0%) |
| $7,500 to $9,999 | 14 (3.1%) | 22 (4.4%) |
| $10,000 to $12,499 | 16 (3.5%) | 0 (0.0%) |
| $12,500 to $14,999 | 0 (0.0%) | 17 (3.4%) |
| $15,000 to $17,499 | 0 (0.0%) | 0 (0.0%) |
| $17,500 to $19,999 | 0 (0.0%) | 33 (6.6%) |
| $20,000 to $22,499 | 0 (0.0%) | 0 (0.0%) |
| $22,500 to $24,999 | 0 (0.0%) | 25 (5.0%) |
| $25,000 to $29,999 | 49 (10.8%) | 32 (6.4%) |
| $30,000 to $34,999 | 44 (9.7%) | 27 (5.4%) |
| $35,000 to $39,999 | 14 (3.1%) | 37 (7.4%) |
| $40,000 to $44,999 | 0 (0.0%) | 16 (3.2%) |
| $45,000 to $49,999 | 11 (2.4%) | 13 (2.6%) |
| $50,000 to $54,999 | 12 (2.6%) | 0 (0.0%) |
| $55,000 to $64,999 | 25 (5.5%) | 43 (8.6%) |
| $65,000 to $74,999 | 34 (7.5%) | 2 (0.4%) |
| $75,000 to $99,999 | 90 (19.9%) | 61 (12.2%) |
| $100,000+ | 101 (22.3%) | 16 (3.2%) |
| Total | 453 (100.0%) | 498 (100.0%) |
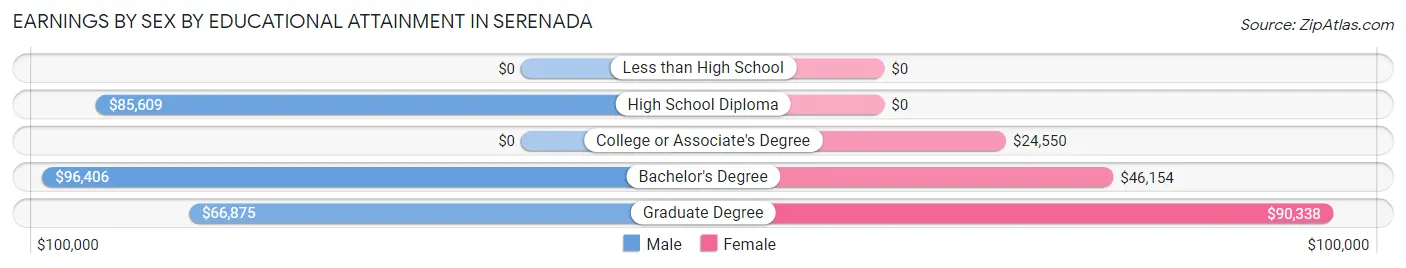
Earnings by Sex by Educational Attainment in Serenada
Average earnings in Serenada are $77,396 for men and $35,625 for women, a difference of 54.0%. Men with an educational attainment of bachelor's degree enjoy the highest average annual earnings of $96,406, while those with graduate degree education earn the least with $66,875. Women with an educational attainment of graduate degree earn the most with the average annual earnings of $90,338, while those with college or associate's degree education have the smallest earnings of $24,550.
| Educational Attainment | Male Income | Female Income |
| Less than High School | - | - |
| High School Diploma | $85,609 | $0 |
| College or Associate's Degree | - | - |
| Bachelor's Degree | $96,406 | $46,154 |
| Graduate Degree | $66,875 | $90,338 |
| Total | $77,396 | $35,625 |
Family Income in Serenada
Family Income Brackets in Serenada
According to the Serenada family income data, there are 156 families falling into the $75,000 to $99,999 income range, which is the most common income bracket and makes up 28.0% of all families.
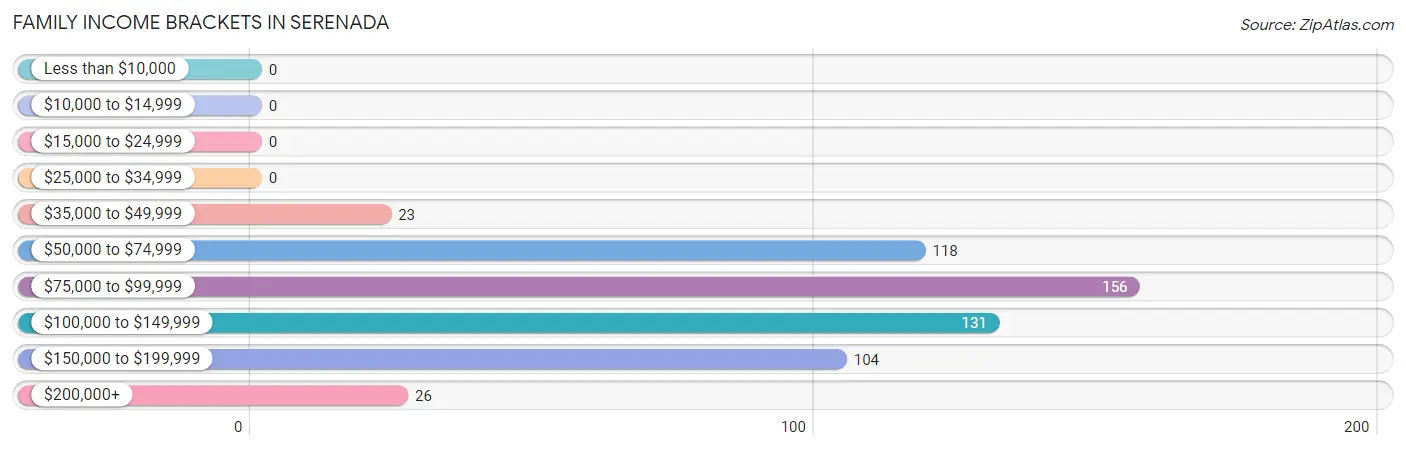
| Income Bracket | # Families | % Families |
| Less than $10,000 | 0 | 0.0% |
| $10,000 to $14,999 | 0 | 0.0% |
| $15,000 to $24,999 | 0 | 0.0% |
| $25,000 to $34,999 | 0 | 0.0% |
| $35,000 to $49,999 | 23 | 4.1% |
| $50,000 to $74,999 | 118 | 21.1% |
| $75,000 to $99,999 | 156 | 28.0% |
| $100,000 to $149,999 | 131 | 23.5% |
| $150,000 to $199,999 | 104 | 18.6% |
| $200,000+ | 26 | 4.7% |
Family Income by Famaliy Size in Serenada
4-person families (31 | 5.6%) account for the highest median family income in Serenada with $146,161 per family, while 2-person families (327 | 58.6%) have the highest median income of $40,168 per family member.
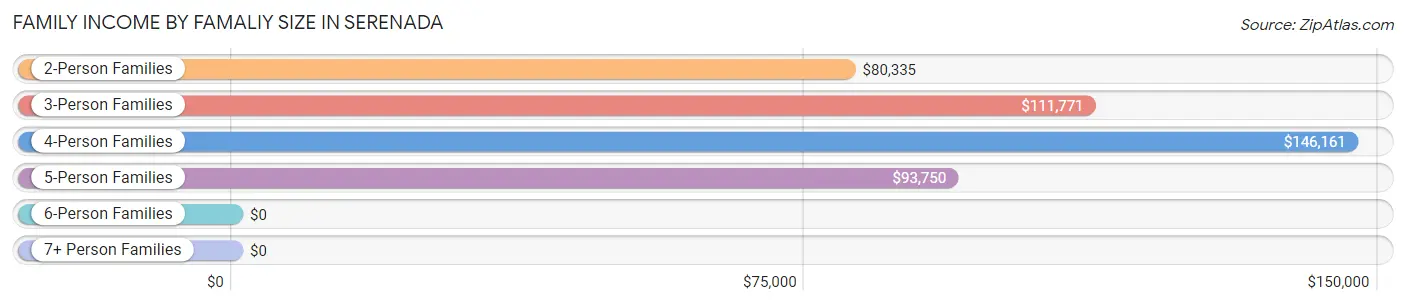
| Income Bracket | # Families | Median Income |
| 2-Person Families | 327 (58.6%) | $80,335 |
| 3-Person Families | 152 (27.2%) | $111,771 |
| 4-Person Families | 31 (5.6%) | $146,161 |
| 5-Person Families | 34 (6.1%) | $93,750 |
| 6-Person Families | 10 (1.8%) | $0 |
| 7+ Person Families | 4 (0.7%) | $0 |
| Total | 558 (100.0%) | $91,563 |
Family Income by Number of Earners in Serenada
The median family income in Serenada is $91,563, with families comprising 2 earners (226) having the highest median family income of $133,750, while families with no earners (119) have the lowest median family income of $74,583, accounting for 40.5% and 21.3% of families, respectively.
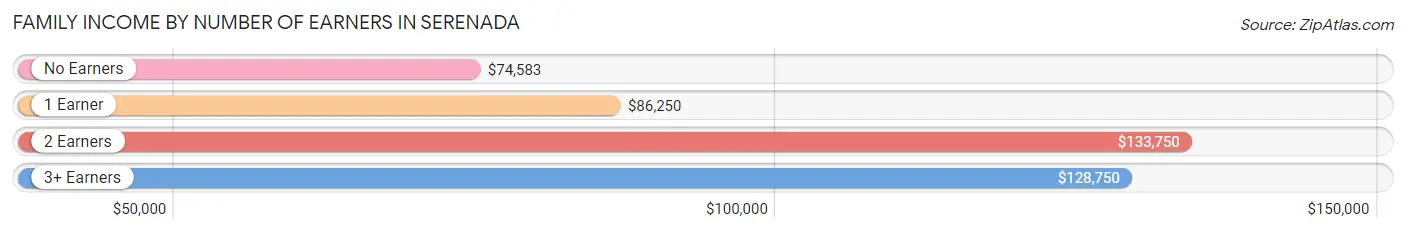
| Number of Earners | # Families | Median Income |
| No Earners | 119 (21.3%) | $74,583 |
| 1 Earner | 165 (29.6%) | $86,250 |
| 2 Earners | 226 (40.5%) | $133,750 |
| 3+ Earners | 48 (8.6%) | $128,750 |
| Total | 558 (100.0%) | $91,563 |
Household Income in Serenada
Household Income Brackets in Serenada
With 186 households falling in the category, the $50,000 to $74,999 income range is the most frequent in Serenada, accounting for 27.4% of all households.
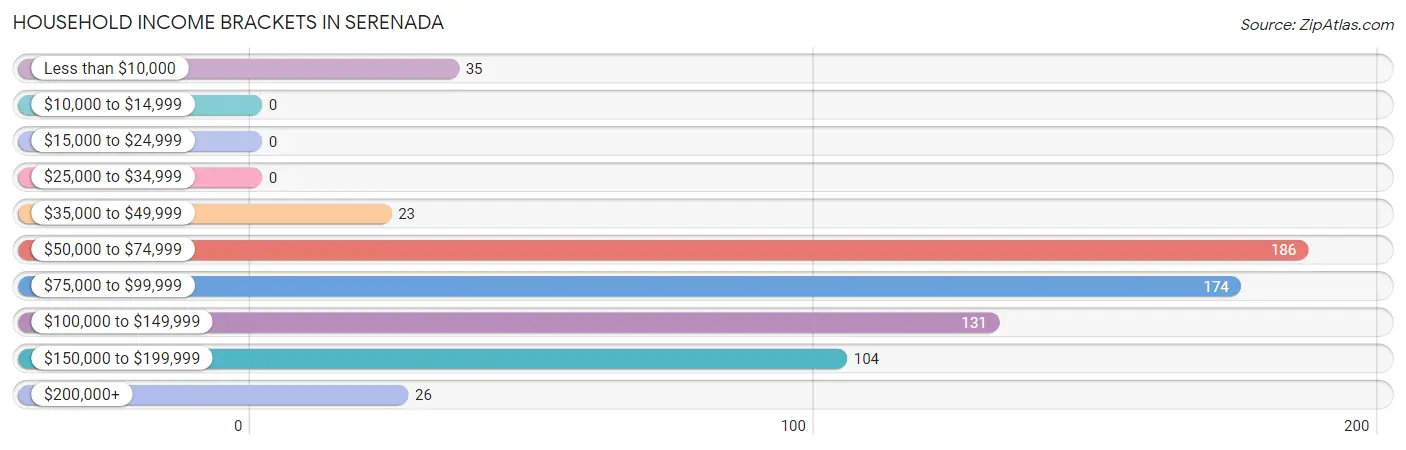
| Income Bracket | # Households | % Households |
| Less than $10,000 | 35 | 5.2% |
| $10,000 to $14,999 | 0 | 0.0% |
| $15,000 to $24,999 | 0 | 0.0% |
| $25,000 to $34,999 | 0 | 0.0% |
| $35,000 to $49,999 | 23 | 3.4% |
| $50,000 to $74,999 | 186 | 27.4% |
| $75,000 to $99,999 | 174 | 25.6% |
| $100,000 to $149,999 | 131 | 19.3% |
| $150,000 to $199,999 | 104 | 15.3% |
| $200,000+ | 26 | 3.8% |
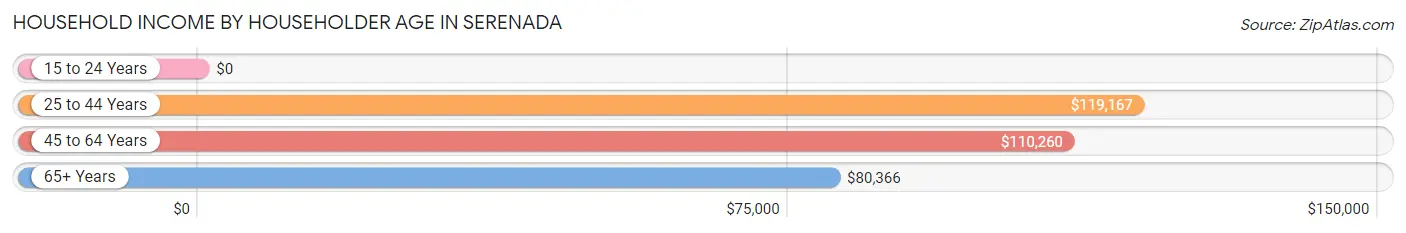
Household Income by Householder Age in Serenada
The median household income in Serenada is $84,792, with the highest median household income of $119,167 found in the 25 to 44 years age bracket for the primary householder. A total of 104 households (15.3%) fall into this category. Meanwhile, the 15 to 24 years age bracket for the primary householder has the lowest median household income of $0, with 68 households (10.0%) in this group.
| Income Bracket | # Households | Median Income |
| 15 to 24 Years | 68 (10.0%) | $0 |
| 25 to 44 Years | 104 (15.3%) | $119,167 |
| 45 to 64 Years | 279 (41.1%) | $110,260 |
| 65+ Years | 228 (33.6%) | $80,366 |
| Total | 679 (100.0%) | $84,792 |
Poverty in Serenada
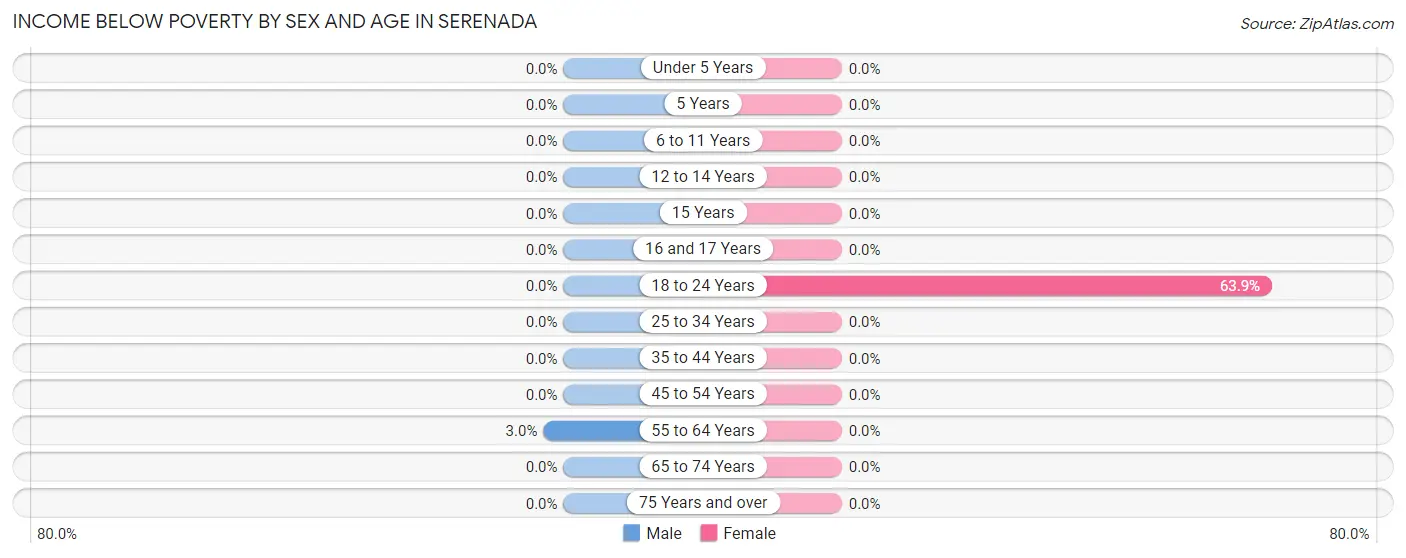
Income Below Poverty by Sex and Age in Serenada
With 0.6% poverty level for males and 8.7% for females among the residents of Serenada, 55 to 64 year old males and 18 to 24 year old females are the most vulnerable to poverty, with 5 males (3.0%) and 76 females (63.9%) in their respective age groups living below the poverty level.
| Age Bracket | Male | Female |
| Under 5 Years | 0 (0.0%) | 0 (0.0%) |
| 5 Years | 0 (0.0%) | 0 (0.0%) |
| 6 to 11 Years | 0 (0.0%) | 0 (0.0%) |
| 12 to 14 Years | 0 (0.0%) | 0 (0.0%) |
| 15 Years | 0 (0.0%) | 0 (0.0%) |
| 16 and 17 Years | 0 (0.0%) | 0 (0.0%) |
| 18 to 24 Years | 0 (0.0%) | 76 (63.9%) |
| 25 to 34 Years | 0 (0.0%) | 0 (0.0%) |
| 35 to 44 Years | 0 (0.0%) | 0 (0.0%) |
| 45 to 54 Years | 0 (0.0%) | 0 (0.0%) |
| 55 to 64 Years | 5 (3.0%) | 0 (0.0%) |
| 65 to 74 Years | 0 (0.0%) | 0 (0.0%) |
| 75 Years and over | 0 (0.0%) | 0 (0.0%) |
| Total | 5 (0.6%) | 76 (8.7%) |
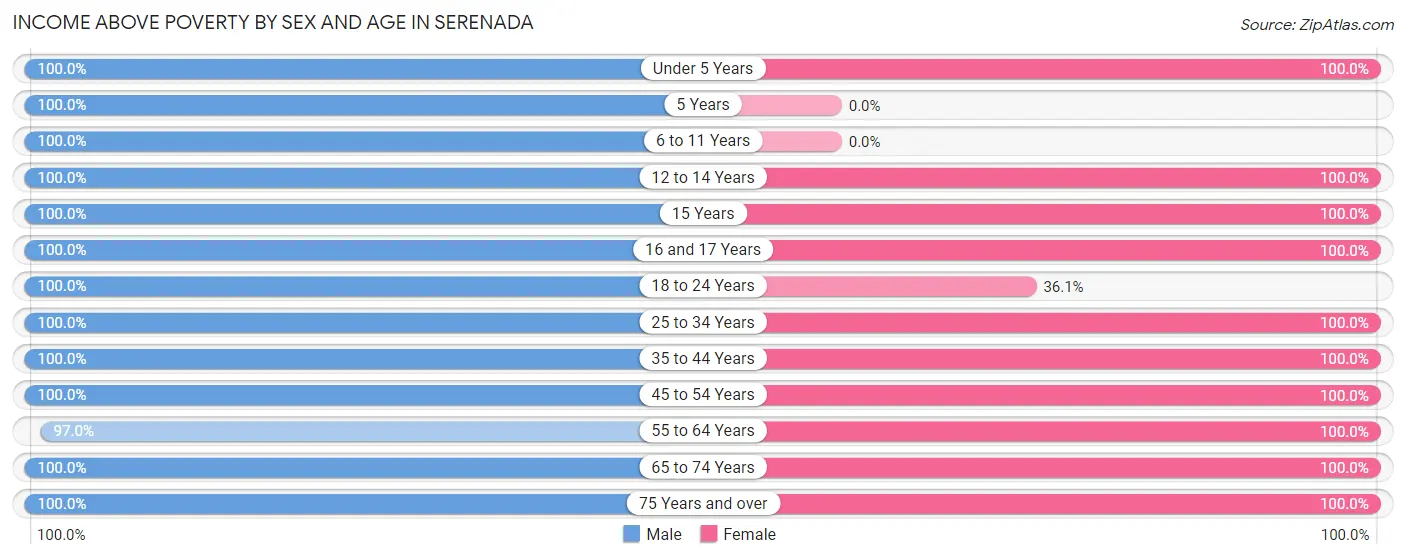
Income Above Poverty by Sex and Age in Serenada
According to the poverty statistics in Serenada, males aged under 5 years and females aged under 5 years are the age groups that are most secure financially, with 100.0% of males and 100.0% of females in these age groups living above the poverty line.
| Age Bracket | Male | Female |
| Under 5 Years | 18 (100.0%) | 49 (100.0%) |
| 5 Years | 5 (100.0%) | 0 (0.0%) |
| 6 to 11 Years | 21 (100.0%) | 0 (0.0%) |
| 12 to 14 Years | 30 (100.0%) | 30 (100.0%) |
| 15 Years | 12 (100.0%) | 37 (100.0%) |
| 16 and 17 Years | 22 (100.0%) | 21 (100.0%) |
| 18 to 24 Years | 85 (100.0%) | 43 (36.1%) |
| 25 to 34 Years | 110 (100.0%) | 65 (100.0%) |
| 35 to 44 Years | 72 (100.0%) | 68 (100.0%) |
| 45 to 54 Years | 65 (100.0%) | 86 (100.0%) |
| 55 to 64 Years | 162 (97.0%) | 200 (100.0%) |
| 65 to 74 Years | 135 (100.0%) | 86 (100.0%) |
| 75 Years and over | 78 (100.0%) | 114 (100.0%) |
| Total | 815 (99.4%) | 799 (91.3%) |
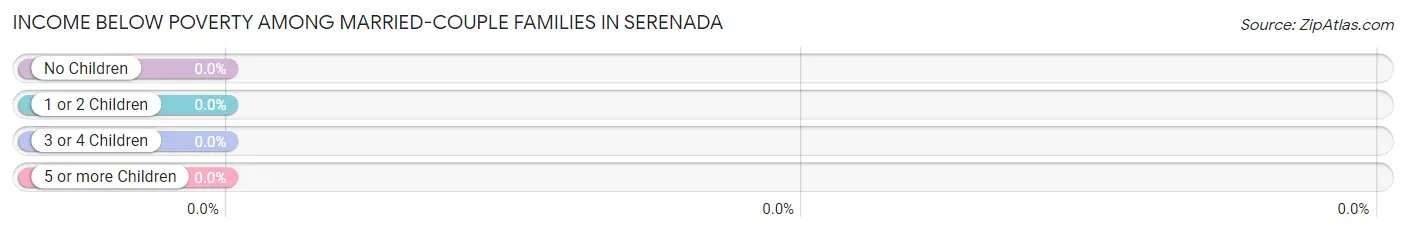
Income Below Poverty Among Married-Couple Families in Serenada
| Children | Above Poverty | Below Poverty |
| No Children | 316 (100.0%) | 0 (0.0%) |
| 1 or 2 Children | 131 (100.0%) | 0 (0.0%) |
| 3 or 4 Children | 27 (100.0%) | 0 (0.0%) |
| 5 or more Children | 0 (0.0%) | 0 (0.0%) |
| Total | 474 (100.0%) | 0 (0.0%) |
Income Below Poverty Among Single-Parent Households in Serenada
| Children | Single Father | Single Mother |
| No Children | 0 (0.0%) | 0 (0.0%) |
| 1 or 2 Children | 0 (0.0%) | 0 (0.0%) |
| 3 or 4 Children | 0 (0.0%) | 0 (0.0%) |
| 5 or more Children | 0 (0.0%) | 0 (0.0%) |
| Total | 0 (0.0%) | 0 (0.0%) |
Income Below Poverty Among Married-Couple vs Single-Parent Households in Serenada
| Children | Married-Couple Families | Single-Parent Households |
| No Children | 0 (0.0%) | 0 (0.0%) |
| 1 or 2 Children | 0 (0.0%) | 0 (0.0%) |
| 3 or 4 Children | 0 (0.0%) | 0 (0.0%) |
| 5 or more Children | 0 (0.0%) | 0 (0.0%) |
| Total | 0 (0.0%) | 0 (0.0%) |
Race in Serenada
The most populous races in Serenada are White / Caucasian (1,560 | 92.0%), Hispanic or Latino (105 | 6.2%), and Two or more Races (94 | 5.6%).
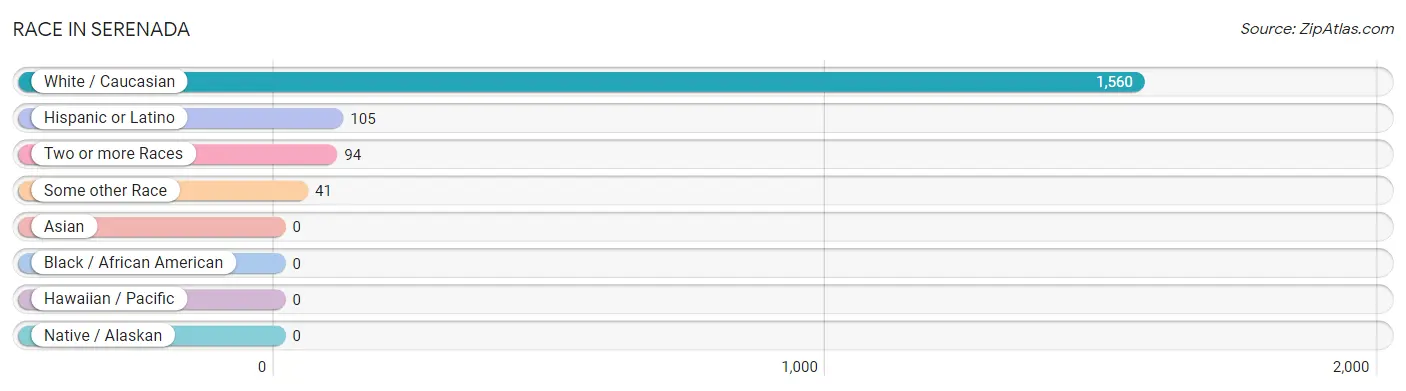
| Race | # Population | % Population |
| Asian | 0 | 0.0% |
| Black / African American | 0 | 0.0% |
| Hawaiian / Pacific | 0 | 0.0% |
| Hispanic or Latino | 105 | 6.2% |
| Native / Alaskan | 0 | 0.0% |
| White / Caucasian | 1,560 | 92.0% |
| Two or more Races | 94 | 5.6% |
| Some other Race | 41 | 2.4% |
| Total | 1,695 | 100.0% |
Ancestry in Serenada
The most populous ancestries reported in Serenada are German (342 | 20.2%), English (315 | 18.6%), Irish (210 | 12.4%), French (101 | 6.0%), and Mexican (95 | 5.6%), together accounting for 62.7% of all Serenada residents.
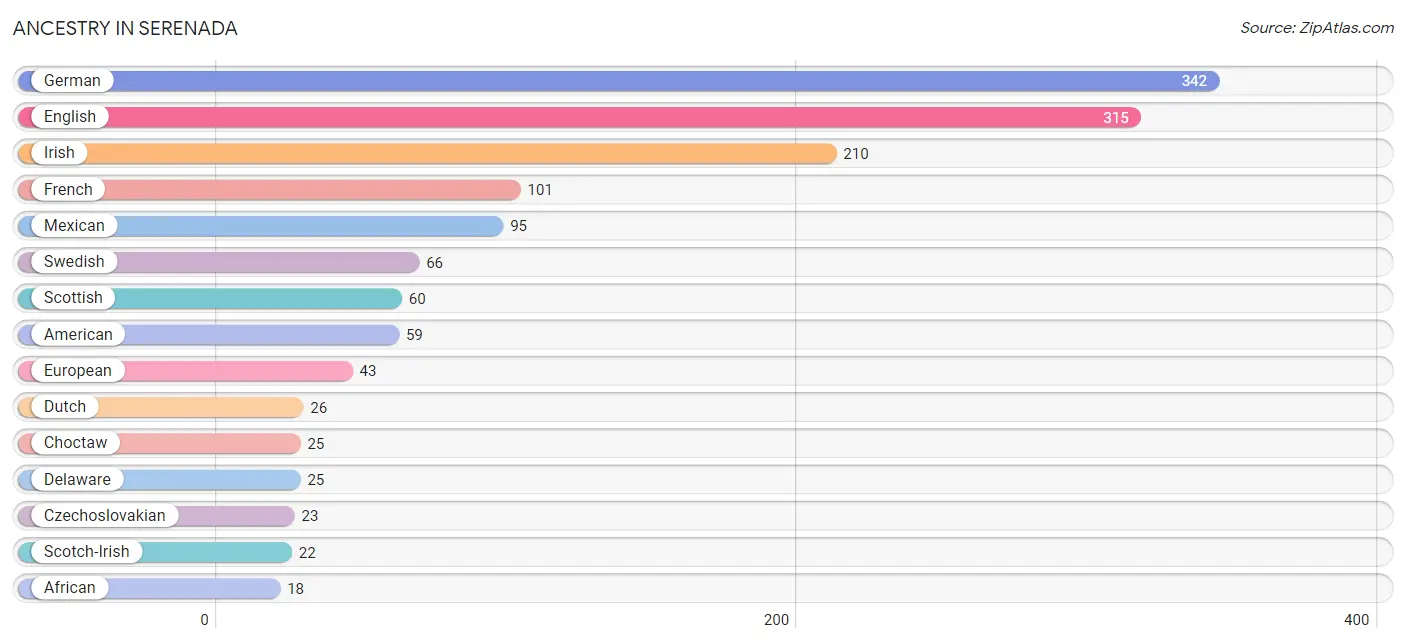
| Ancestry | # Population | % Population |
| African | 18 | 1.1% |
| American | 59 | 3.5% |
| Choctaw | 25 | 1.5% |
| Czechoslovakian | 23 | 1.4% |
| Delaware | 25 | 1.5% |
| Dutch | 26 | 1.5% |
| English | 315 | 18.6% |
| European | 43 | 2.5% |
| Finnish | 8 | 0.5% |
| French | 101 | 6.0% |
| French Canadian | 4 | 0.2% |
| German | 342 | 20.2% |
| Indian (Asian) | 12 | 0.7% |
| Irish | 210 | 12.4% |
| Italian | 12 | 0.7% |
| Mexican | 95 | 5.6% |
| Norwegian | 11 | 0.6% |
| Polish | 18 | 1.1% |
| Scandinavian | 10 | 0.6% |
| Scotch-Irish | 22 | 1.3% |
| Scottish | 60 | 3.5% |
| Spanish | 10 | 0.6% |
| Subsaharan African | 18 | 1.1% |
| Swedish | 66 | 3.9% |
| Ukrainian | 8 | 0.5% |
| Welsh | 8 | 0.5% | View All 26 Rows |
Immigrants in Serenada
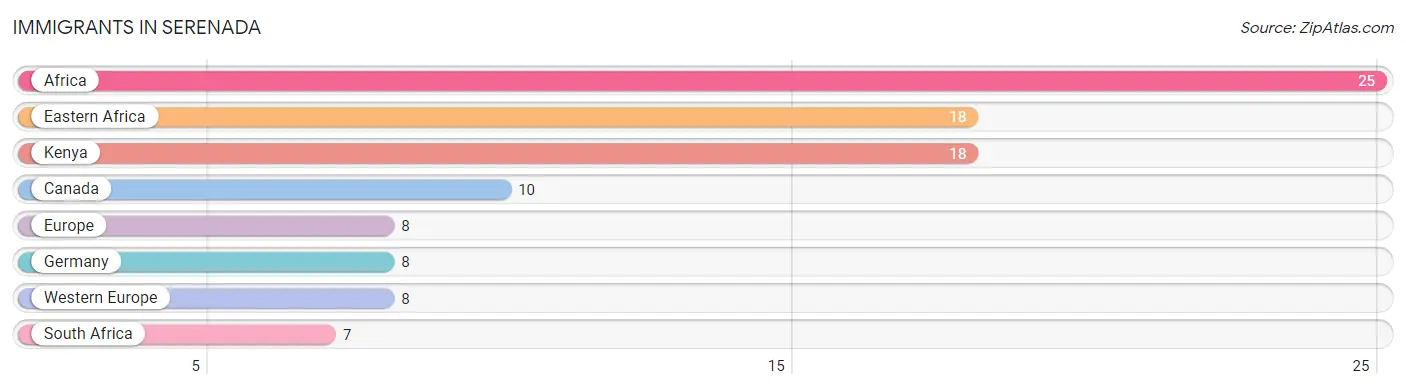
The most numerous immigrant groups reported in Serenada came from Africa (25 | 1.5%), Eastern Africa (18 | 1.1%), Kenya (18 | 1.1%), Canada (10 | 0.6%), and Europe (8 | 0.5%), together accounting for 4.7% of all Serenada residents.
| Immigration Origin | # Population | % Population |
| Africa | 25 | 1.5% |
| Canada | 10 | 0.6% |
| Eastern Africa | 18 | 1.1% |
| Europe | 8 | 0.5% |
| Germany | 8 | 0.5% |
| Kenya | 18 | 1.1% |
| South Africa | 7 | 0.4% |
| Western Europe | 8 | 0.5% | View All 8 Rows |
Sex and Age in Serenada
Sex and Age in Serenada
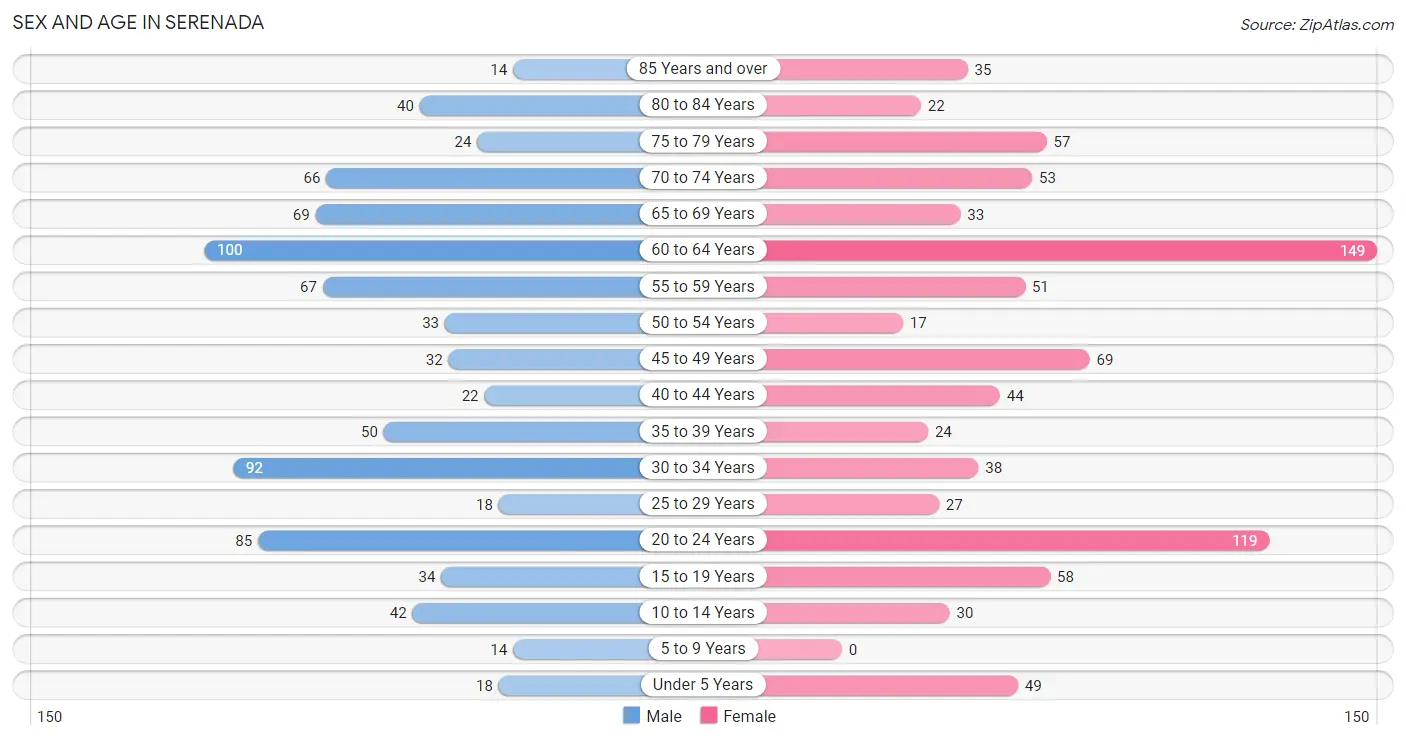
The most populous age groups in Serenada are 60 to 64 Years (100 | 12.2%) for men and 60 to 64 Years (149 | 17.0%) for women.
| Age Bracket | Male | Female |
| Under 5 Years | 18 (2.2%) | 49 (5.6%) |
| 5 to 9 Years | 14 (1.7%) | 0 (0.0%) |
| 10 to 14 Years | 42 (5.1%) | 30 (3.4%) |
| 15 to 19 Years | 34 (4.2%) | 58 (6.6%) |
| 20 to 24 Years | 85 (10.4%) | 119 (13.6%) |
| 25 to 29 Years | 18 (2.2%) | 27 (3.1%) |
| 30 to 34 Years | 92 (11.2%) | 38 (4.3%) |
| 35 to 39 Years | 50 (6.1%) | 24 (2.7%) |
| 40 to 44 Years | 22 (2.7%) | 44 (5.0%) |
| 45 to 49 Years | 32 (3.9%) | 69 (7.9%) |
| 50 to 54 Years | 33 (4.0%) | 17 (1.9%) |
| 55 to 59 Years | 67 (8.2%) | 51 (5.8%) |
| 60 to 64 Years | 100 (12.2%) | 149 (17.0%) |
| 65 to 69 Years | 69 (8.4%) | 33 (3.8%) |
| 70 to 74 Years | 66 (8.1%) | 53 (6.1%) |
| 75 to 79 Years | 24 (2.9%) | 57 (6.5%) |
| 80 to 84 Years | 40 (4.9%) | 22 (2.5%) |
| 85 Years and over | 14 (1.7%) | 35 (4.0%) |
| Total | 820 (100.0%) | 875 (100.0%) |
Families and Households in Serenada
Median Family Size in Serenada
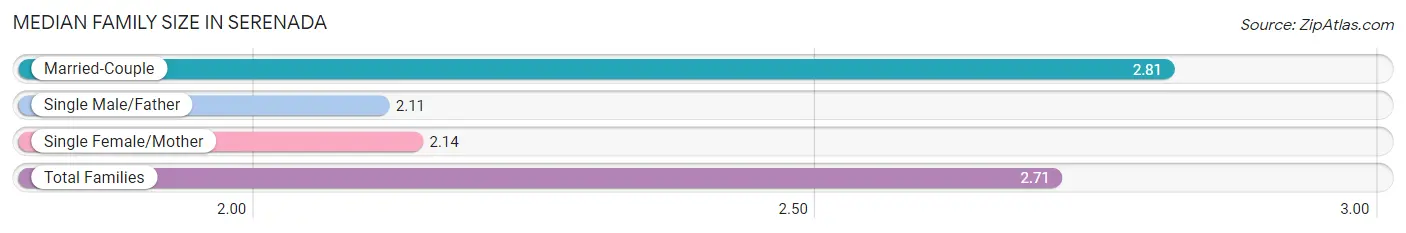
The median family size in Serenada is 2.71 persons per family, with married-couple families (474 | 85.0%) accounting for the largest median family size of 2.81 persons per family. On the other hand, single male/father families (56 | 10.0%) represent the smallest median family size with 2.11 persons per family.
| Family Type | # Families | Family Size |
| Married-Couple | 474 (85.0%) | 2.81 |
| Single Male/Father | 56 (10.0%) | 2.11 |
| Single Female/Mother | 28 (5.0%) | 2.14 |
| Total Families | 558 (100.0%) | 2.71 |
Median Household Size in Serenada
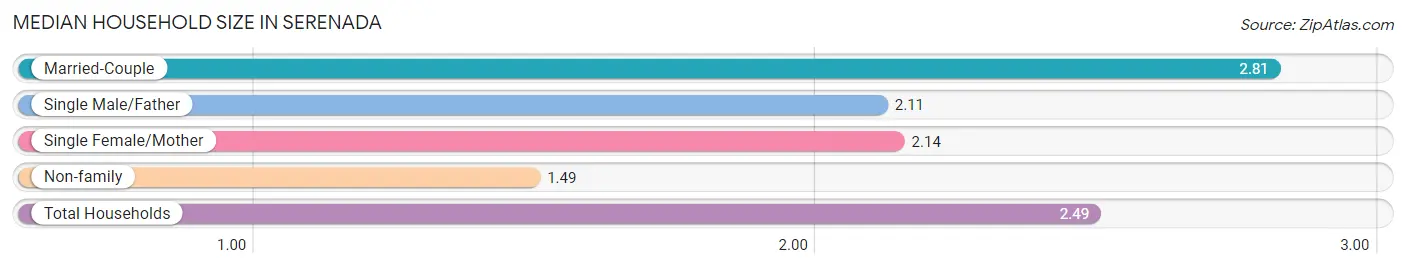
The median household size in Serenada is 2.49 persons per household, with married-couple households (474 | 69.8%) accounting for the largest median household size of 2.81 persons per household. non-family households (121 | 17.8%) represent the smallest median household size with 1.49 persons per household.
| Household Type | # Households | Household Size |
| Married-Couple | 474 (69.8%) | 2.81 |
| Single Male/Father | 56 (8.3%) | 2.11 |
| Single Female/Mother | 28 (4.1%) | 2.14 |
| Non-family | 121 (17.8%) | 1.49 |
| Total Households | 679 (100.0%) | 2.49 |
Household Size by Marriage Status in Serenada
Out of a total of 679 households in Serenada, 558 (82.2%) are family households, while 121 (17.8%) are nonfamily households. The most numerous type of family households are 2-person households, comprising 327, and the most common type of nonfamily households are 1-person households, comprising 68.
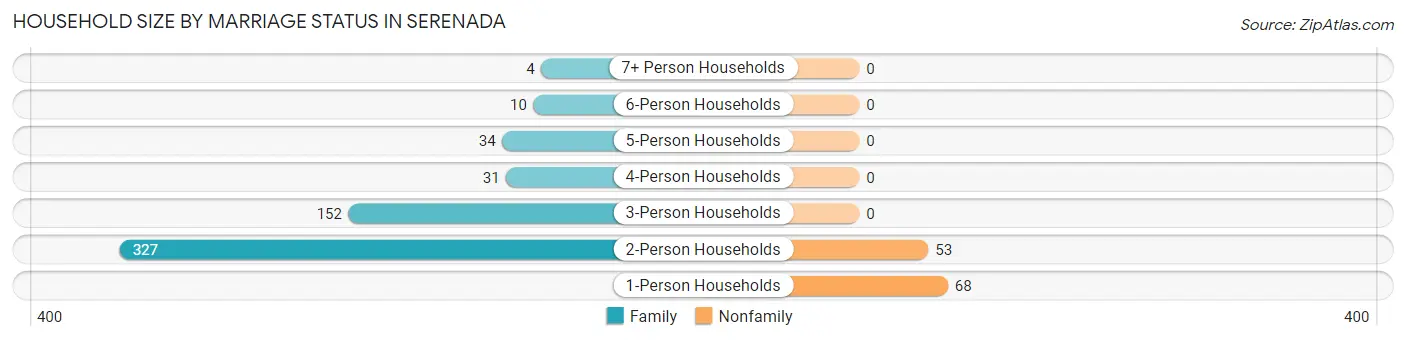
| Household Size | Family Households | Nonfamily Households |
| 1-Person Households | - | 68 (10.0%) |
| 2-Person Households | 327 (48.2%) | 53 (7.8%) |
| 3-Person Households | 152 (22.4%) | 0 (0.0%) |
| 4-Person Households | 31 (4.6%) | 0 (0.0%) |
| 5-Person Households | 34 (5.0%) | 0 (0.0%) |
| 6-Person Households | 10 (1.5%) | 0 (0.0%) |
| 7+ Person Households | 4 (0.6%) | 0 (0.0%) |
| Total | 558 (82.2%) | 121 (17.8%) |
Female Fertility in Serenada
Fertility by Age in Serenada
| Age Bracket | Women with Births | Births / 1,000 Women |
| 15 to 19 years | 0 (0.0%) | 0.0 |
| 20 to 34 years | 0 (0.0%) | 0.0 |
| 35 to 50 years | 0 (0.0%) | 0.0 |
| Total | 0 (0.0%) | 0.0 |
Fertility by Age by Marriage Status in Serenada
| Age Bracket | Married | Unmarried |
| 15 to 19 years | 0 (0.0%) | 0 (0.0%) |
| 20 to 34 years | 0 (0.0%) | 0 (0.0%) |
| 35 to 50 years | 0 (0.0%) | 0 (0.0%) |
| Total | 0 (0.0%) | 0 (0.0%) |
Fertility by Education in Serenada
| Educational Attainment | Women with Births | Births / 1,000 Women |
| Less than High School | 0 (0.0%) | 0.0 |
| High School Diploma | 0 (0.0%) | 0.0 |
| College or Associate's Degree | 0 (0.0%) | 0.0 |
| Bachelor's Degree | 0 (0.0%) | 0.0 |
| Graduate Degree | 0 (0.0%) | 0.0 |
| Total | 0 (0.0%) | 0.0 |
Fertility by Education by Marriage Status in Serenada
| Educational Attainment | Married | Unmarried |
| Less than High School | 0 (0.0%) | 0 (0.0%) |
| High School Diploma | 0 (0.0%) | 0 (0.0%) |
| College or Associate's Degree | 0 (0.0%) | 0 (0.0%) |
| Bachelor's Degree | 0 (0.0%) | 0 (0.0%) |
| Graduate Degree | 0 (0.0%) | 0 (0.0%) |
| Total | 0 (0.0%) | 0 (0.0%) |
Employment Characteristics in Serenada
Employment by Class of Employer in Serenada
Among the 865 employed individuals in Serenada, private company employees (557 | 64.4%), state government employees (163 | 18.8%), and not-for-profit organizations (88 | 10.2%) make up the most common classes of employment.
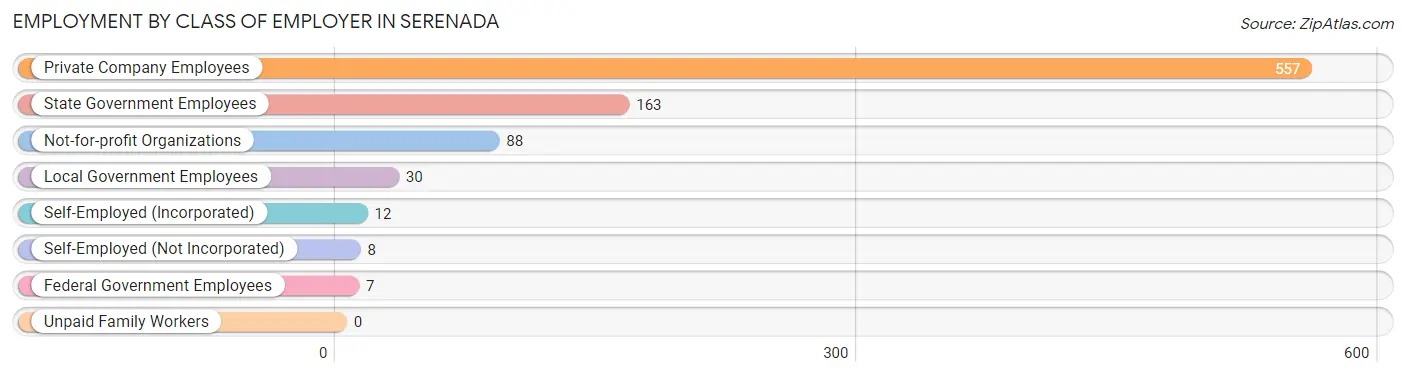
| Employer Class | # Employees | % Employees |
| Private Company Employees | 557 | 64.4% |
| Self-Employed (Incorporated) | 12 | 1.4% |
| Self-Employed (Not Incorporated) | 8 | 0.9% |
| Not-for-profit Organizations | 88 | 10.2% |
| Local Government Employees | 30 | 3.5% |
| State Government Employees | 163 | 18.8% |
| Federal Government Employees | 7 | 0.8% |
| Unpaid Family Workers | 0 | 0.0% |
| Total | 865 | 100.0% |
Employment Status by Age in Serenada
According to the labor force statistics for Serenada, out of the total population over 16 years of age (1,493), 60.5% or 903 individuals are in the labor force, with 3.1% or 28 of them unemployed. The age group with the highest labor force participation rate is 25 to 29 years, with 100.0% or 45 individuals in the labor force. Within the labor force, the 55 to 59 years age range has the highest percentage of unemployed individuals, with 11.0% or 10 of them being unemployed.
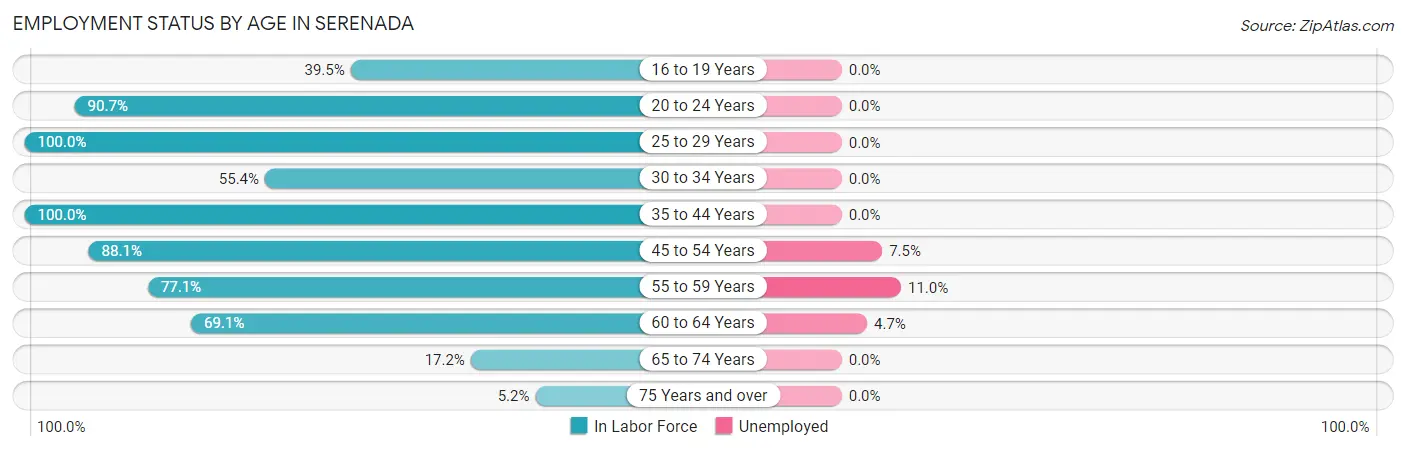
| Age Bracket | In Labor Force | Unemployed |
| 16 to 19 Years | 17 (39.5%) | 0 (0.0%) |
| 20 to 24 Years | 185 (90.7%) | 0 (0.0%) |
| 25 to 29 Years | 45 (100.0%) | 0 (0.0%) |
| 30 to 34 Years | 72 (55.4%) | 0 (0.0%) |
| 35 to 44 Years | 140 (100.0%) | 0 (0.0%) |
| 45 to 54 Years | 133 (88.1%) | 10 (7.5%) |
| 55 to 59 Years | 91 (77.1%) | 10 (11.0%) |
| 60 to 64 Years | 172 (69.1%) | 8 (4.7%) |
| 65 to 74 Years | 38 (17.2%) | 0 (0.0%) |
| 75 Years and over | 10 (5.2%) | 0 (0.0%) |
| Total | 903 (60.5%) | 28 (3.1%) |
Employment Status by Educational Attainment in Serenada
According to labor force statistics for Serenada, 78.4% of individuals (653) out of the total population between 25 and 64 years of age (833) are in the labor force, with 4.3% or 28 of them being unemployed. The group with the highest labor force participation rate are those with the educational attainment of less than high school, with 93.8% or 76 individuals in the labor force. Within the labor force, individuals with college / associate degree education have the highest percentage of unemployment, with 15.0% or 28 of them being unemployed.
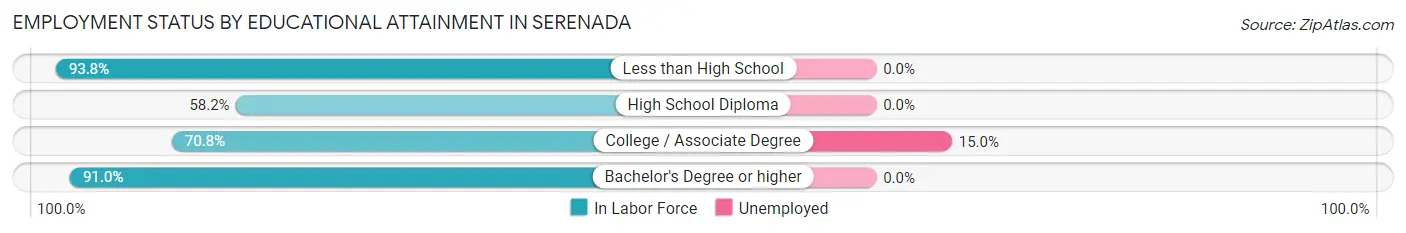
| Educational Attainment | In Labor Force | Unemployed |
| Less than High School | 76 (93.8%) | 0 (0.0%) |
| High School Diploma | 96 (58.2%) | 0 (0.0%) |
| College / Associate Degree | 187 (70.8%) | 40 (15.0%) |
| Bachelor's Degree or higher | 294 (91.0%) | 0 (0.0%) |
| Total | 653 (78.4%) | 36 (4.3%) |
Employment Occupations by Sex in Serenada
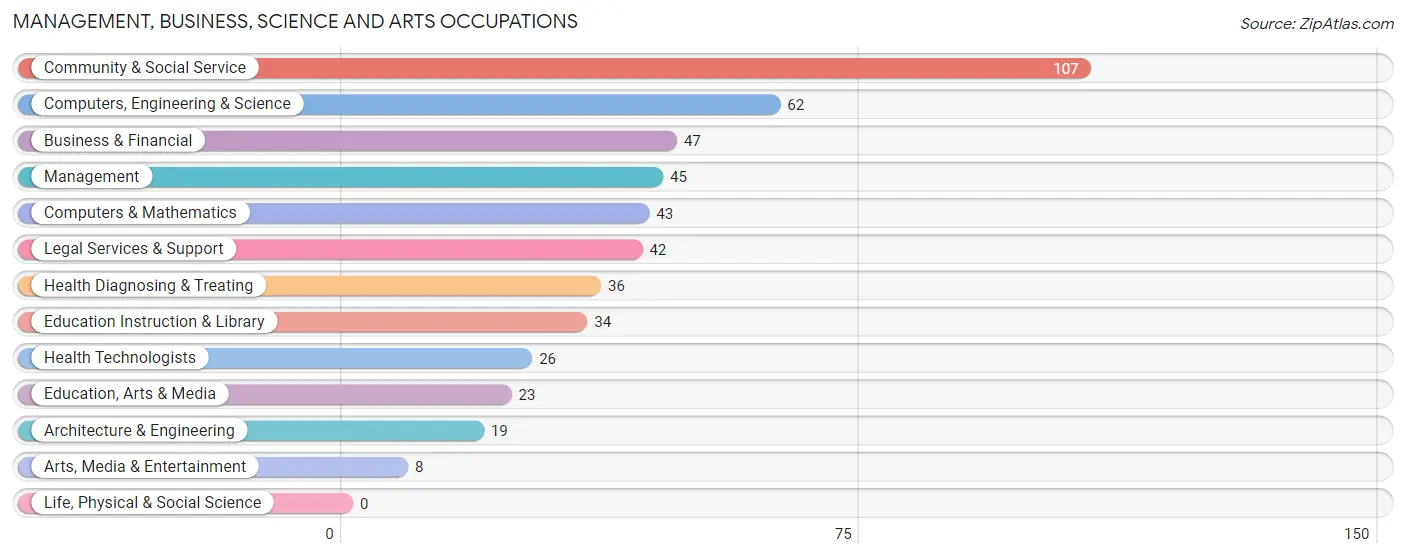
Management, Business, Science and Arts Occupations
The most common Management, Business, Science and Arts occupations in Serenada are Community & Social Service (107 | 12.2%), Computers, Engineering & Science (62 | 7.1%), Business & Financial (47 | 5.4%), Management (45 | 5.1%), and Computers & Mathematics (43 | 4.9%).
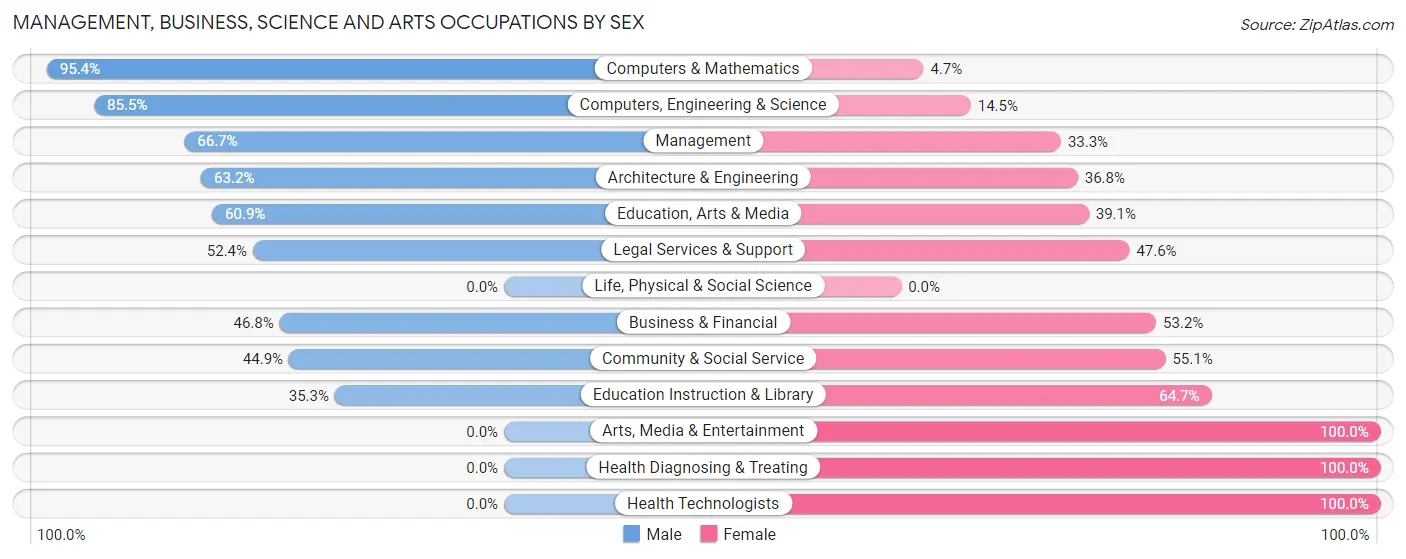
Management, Business, Science and Arts Occupations by Sex
Within the Management, Business, Science and Arts occupations in Serenada, the most male-oriented occupations are Computers & Mathematics (95.4%), Computers, Engineering & Science (85.5%), and Management (66.7%), while the most female-oriented occupations are Arts, Media & Entertainment (100.0%), Health Diagnosing & Treating (100.0%), and Health Technologists (100.0%).
| Occupation | Male | Female |
| Management | 30 (66.7%) | 15 (33.3%) |
| Business & Financial | 22 (46.8%) | 25 (53.2%) |
| Computers, Engineering & Science | 53 (85.5%) | 9 (14.5%) |
| Computers & Mathematics | 41 (95.4%) | 2 (4.6%) |
| Architecture & Engineering | 12 (63.2%) | 7 (36.8%) |
| Life, Physical & Social Science | 0 (0.0%) | 0 (0.0%) |
| Community & Social Service | 48 (44.9%) | 59 (55.1%) |
| Education, Arts & Media | 14 (60.9%) | 9 (39.1%) |
| Legal Services & Support | 22 (52.4%) | 20 (47.6%) |
| Education Instruction & Library | 12 (35.3%) | 22 (64.7%) |
| Arts, Media & Entertainment | 0 (0.0%) | 8 (100.0%) |
| Health Diagnosing & Treating | 0 (0.0%) | 36 (100.0%) |
| Health Technologists | 0 (0.0%) | 26 (100.0%) |
| Total (Category) | 153 (51.5%) | 144 (48.5%) |
| Total (Overall) | 405 (46.3%) | 470 (53.7%) |
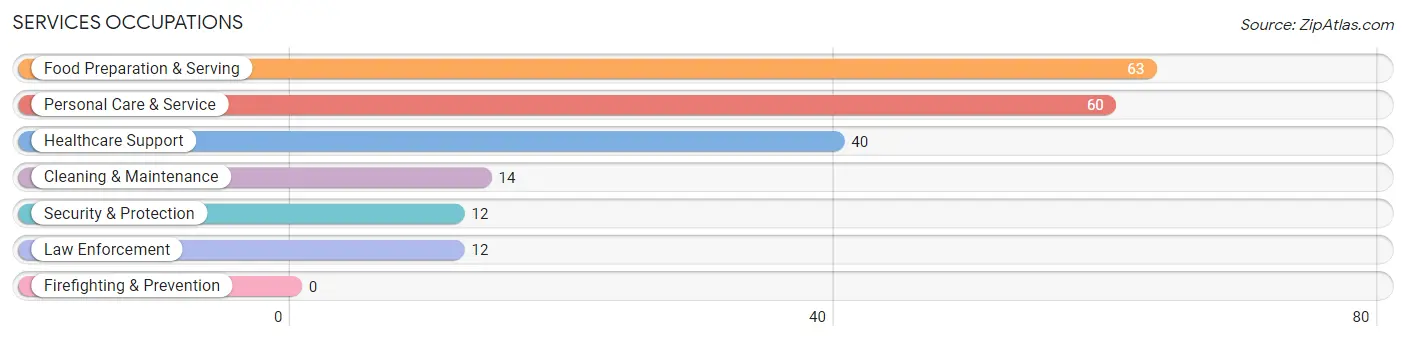
Services Occupations
The most common Services occupations in Serenada are Food Preparation & Serving (63 | 7.2%), Personal Care & Service (60 | 6.9%), Healthcare Support (40 | 4.6%), Cleaning & Maintenance (14 | 1.6%), and Security & Protection (12 | 1.4%).
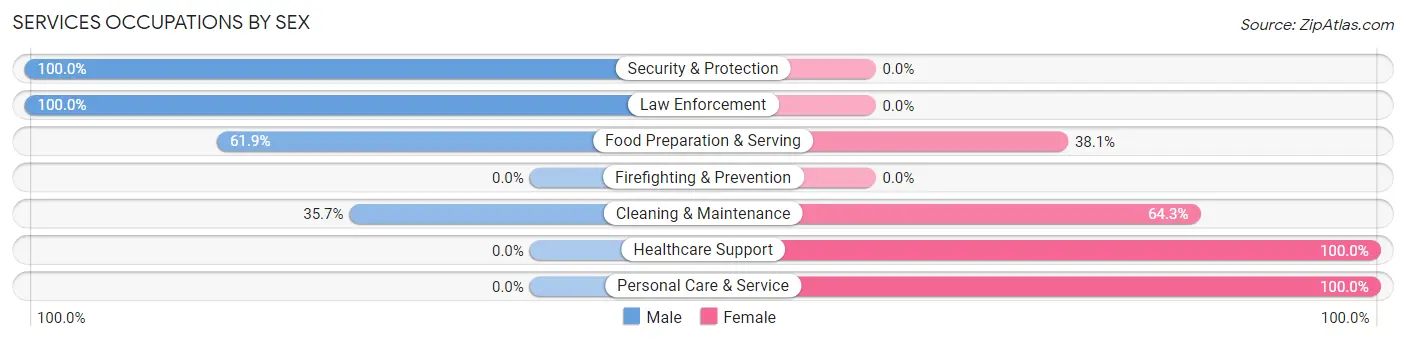
Services Occupations by Sex
Within the Services occupations in Serenada, the most male-oriented occupations are Security & Protection (100.0%), Law Enforcement (100.0%), and Food Preparation & Serving (61.9%), while the most female-oriented occupations are Healthcare Support (100.0%), Personal Care & Service (100.0%), and Cleaning & Maintenance (64.3%).
| Occupation | Male | Female |
| Healthcare Support | 0 (0.0%) | 40 (100.0%) |
| Security & Protection | 12 (100.0%) | 0 (0.0%) |
| Firefighting & Prevention | 0 (0.0%) | 0 (0.0%) |
| Law Enforcement | 12 (100.0%) | 0 (0.0%) |
| Food Preparation & Serving | 39 (61.9%) | 24 (38.1%) |
| Cleaning & Maintenance | 5 (35.7%) | 9 (64.3%) |
| Personal Care & Service | 0 (0.0%) | 60 (100.0%) |
| Total (Category) | 56 (29.6%) | 133 (70.4%) |
| Total (Overall) | 405 (46.3%) | 470 (53.7%) |
Sales and Office Occupations
The most common Sales and Office occupations in Serenada are Office & Administration (166 | 19.0%), and Sales & Related (50 | 5.7%).
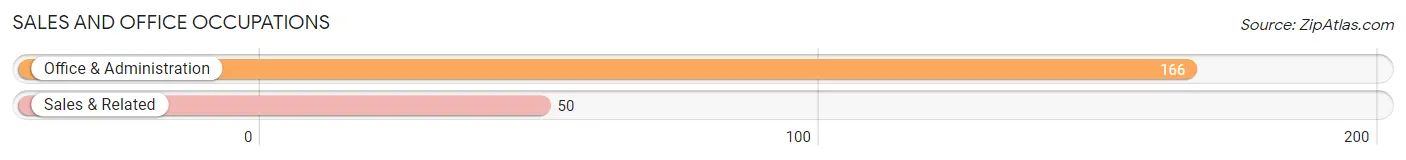
Sales and Office Occupations by Sex
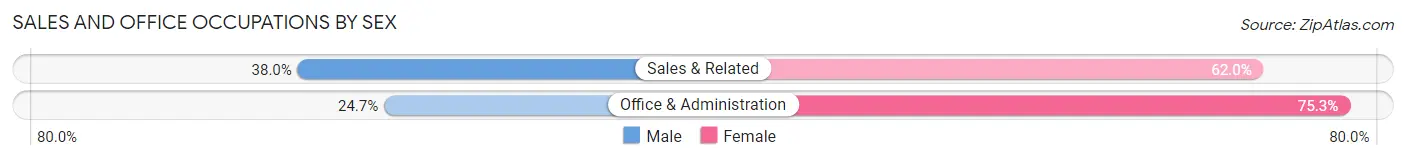
| Occupation | Male | Female |
| Sales & Related | 19 (38.0%) | 31 (62.0%) |
| Office & Administration | 41 (24.7%) | 125 (75.3%) |
| Total (Category) | 60 (27.8%) | 156 (72.2%) |
| Total (Overall) | 405 (46.3%) | 470 (53.7%) |
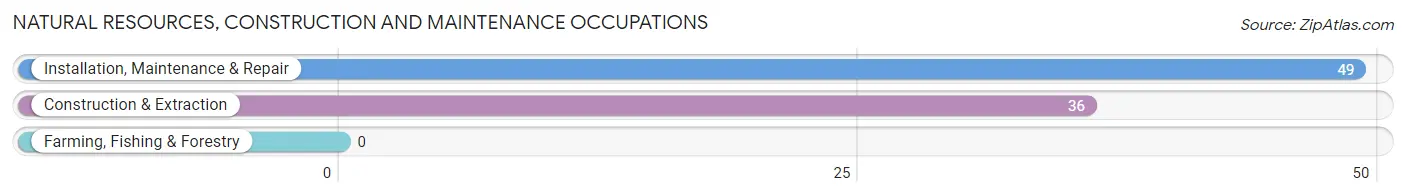
Natural Resources, Construction and Maintenance Occupations
The most common Natural Resources, Construction and Maintenance occupations in Serenada are Installation, Maintenance & Repair (49 | 5.6%), and Construction & Extraction (36 | 4.1%).
Natural Resources, Construction and Maintenance Occupations by Sex
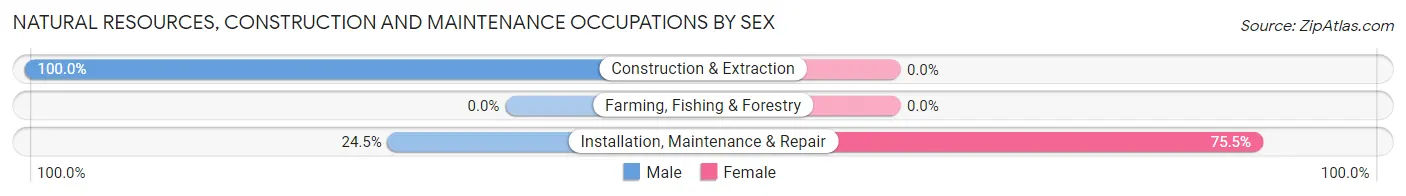
| Occupation | Male | Female |
| Farming, Fishing & Forestry | 0 (0.0%) | 0 (0.0%) |
| Construction & Extraction | 36 (100.0%) | 0 (0.0%) |
| Installation, Maintenance & Repair | 12 (24.5%) | 37 (75.5%) |
| Total (Category) | 48 (56.5%) | 37 (43.5%) |
| Total (Overall) | 405 (46.3%) | 470 (53.7%) |
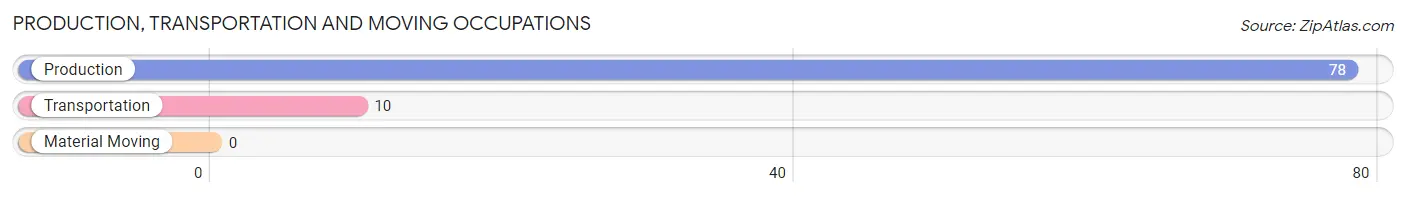
Production, Transportation and Moving Occupations
The most common Production, Transportation and Moving occupations in Serenada are Production (78 | 8.9%), and Transportation (10 | 1.1%).
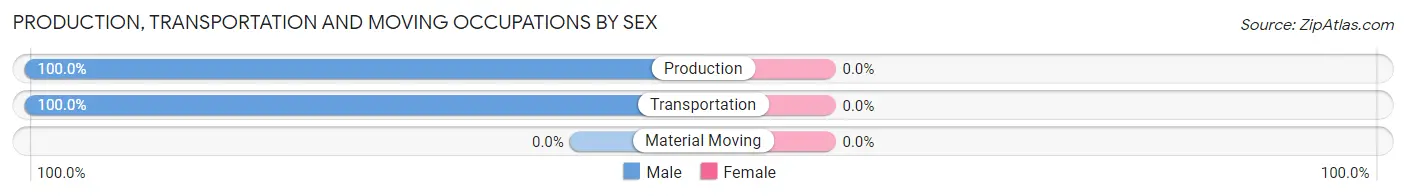
Production, Transportation and Moving Occupations by Sex
| Occupation | Male | Female |
| Production | 78 (100.0%) | 0 (0.0%) |
| Transportation | 10 (100.0%) | 0 (0.0%) |
| Material Moving | 0 (0.0%) | 0 (0.0%) |
| Total (Category) | 88 (100.0%) | 0 (0.0%) |
| Total (Overall) | 405 (46.3%) | 470 (53.7%) |
Employment Industries by Sex in Serenada
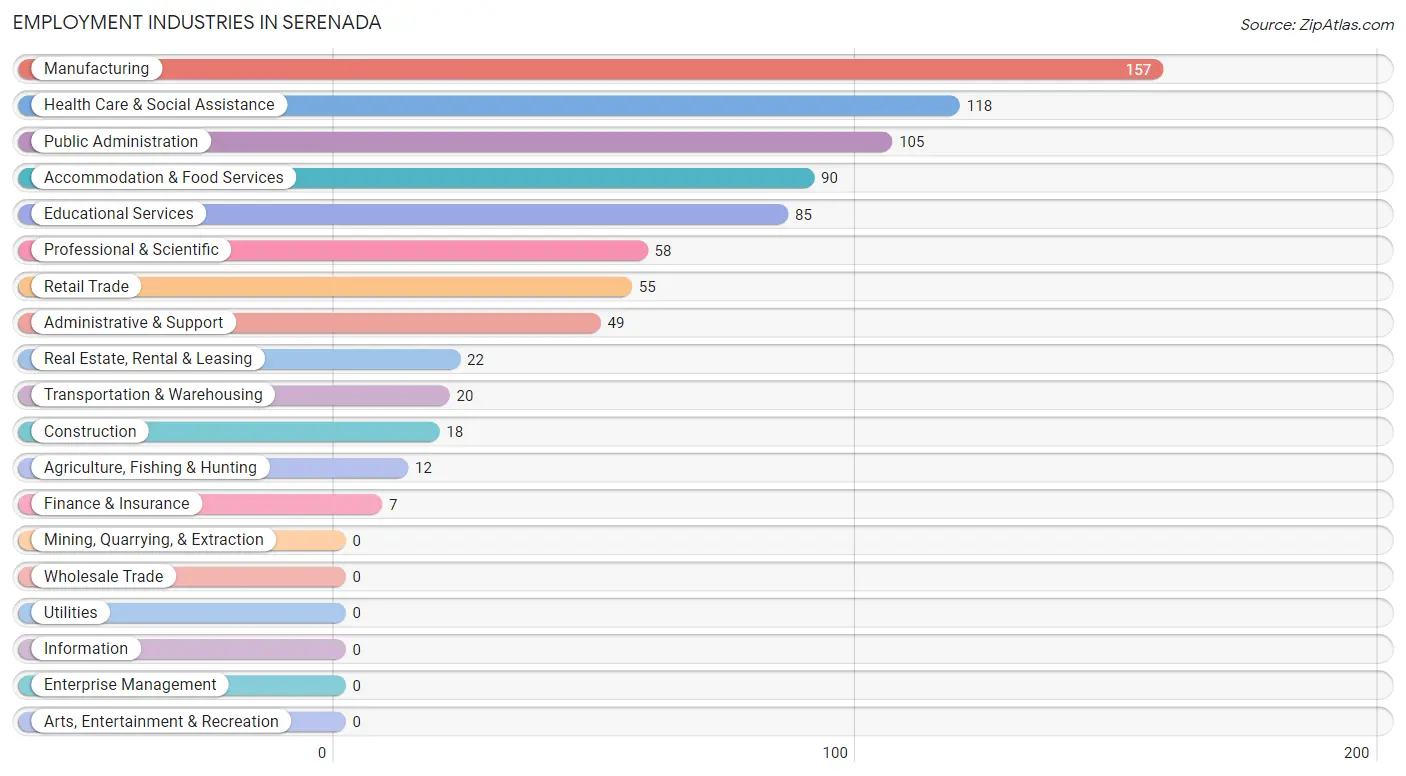
Employment Industries in Serenada
The major employment industries in Serenada include Manufacturing (157 | 17.9%), Health Care & Social Assistance (118 | 13.5%), Public Administration (105 | 12.0%), Accommodation & Food Services (90 | 10.3%), and Educational Services (85 | 9.7%).
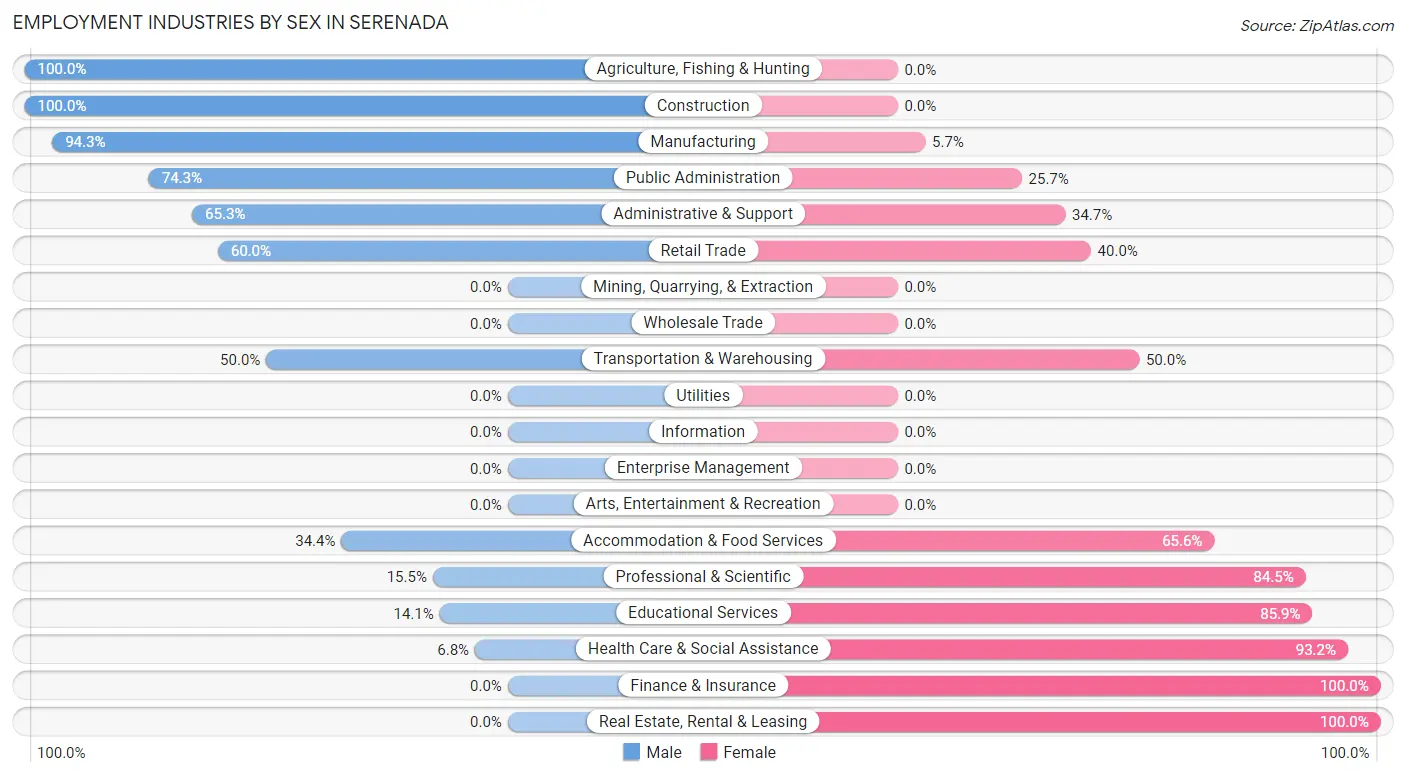
Employment Industries by Sex in Serenada
The Serenada industries that see more men than women are Agriculture, Fishing & Hunting (100.0%), Construction (100.0%), and Manufacturing (94.3%), whereas the industries that tend to have a higher number of women are Finance & Insurance (100.0%), Real Estate, Rental & Leasing (100.0%), and Health Care & Social Assistance (93.2%).
| Industry | Male | Female |
| Agriculture, Fishing & Hunting | 12 (100.0%) | 0 (0.0%) |
| Mining, Quarrying, & Extraction | 0 (0.0%) | 0 (0.0%) |
| Construction | 18 (100.0%) | 0 (0.0%) |
| Manufacturing | 148 (94.3%) | 9 (5.7%) |
| Wholesale Trade | 0 (0.0%) | 0 (0.0%) |
| Retail Trade | 33 (60.0%) | 22 (40.0%) |
| Transportation & Warehousing | 10 (50.0%) | 10 (50.0%) |
| Utilities | 0 (0.0%) | 0 (0.0%) |
| Information | 0 (0.0%) | 0 (0.0%) |
| Finance & Insurance | 0 (0.0%) | 7 (100.0%) |
| Real Estate, Rental & Leasing | 0 (0.0%) | 22 (100.0%) |
| Professional & Scientific | 9 (15.5%) | 49 (84.5%) |
| Enterprise Management | 0 (0.0%) | 0 (0.0%) |
| Administrative & Support | 32 (65.3%) | 17 (34.7%) |
| Educational Services | 12 (14.1%) | 73 (85.9%) |
| Health Care & Social Assistance | 8 (6.8%) | 110 (93.2%) |
| Arts, Entertainment & Recreation | 0 (0.0%) | 0 (0.0%) |
| Accommodation & Food Services | 31 (34.4%) | 59 (65.6%) |
| Public Administration | 78 (74.3%) | 27 (25.7%) |
| Total | 405 (46.3%) | 470 (53.7%) |
Education in Serenada
School Enrollment in Serenada
The most common levels of schooling among the 412 students in Serenada are college / undergraduate (137 | 33.3%), high school (92 | 22.3%), and middle school (72 | 17.5%).
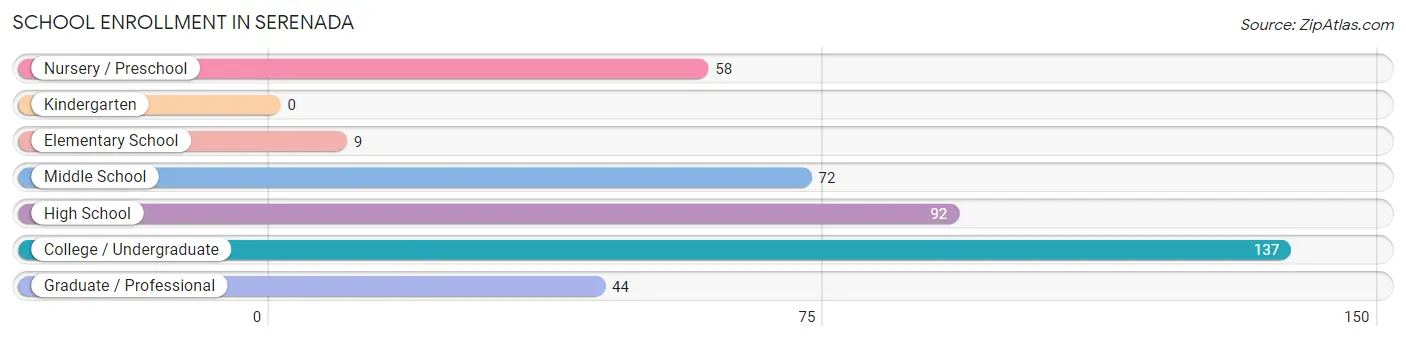
| School Level | # Students | % Students |
| Nursery / Preschool | 58 | 14.1% |
| Kindergarten | 0 | 0.0% |
| Elementary School | 9 | 2.2% |
| Middle School | 72 | 17.5% |
| High School | 92 | 22.3% |
| College / Undergraduate | 137 | 33.3% |
| Graduate / Professional | 44 | 10.7% |
| Total | 412 | 100.0% |
School Enrollment by Age by Funding Source in Serenada
Out of a total of 412 students who are enrolled in schools in Serenada, 159 (38.6%) attend a private institution, while the remaining 253 (61.4%) are enrolled in public schools. The age group of 25 to 34 year olds has the highest likelihood of being enrolled in private schools, with 21 (100.0% in the age bracket) enrolled. Conversely, the age group of 5 to 9 year old has the lowest likelihood of being enrolled in a private school, with 14 (100.0% in the age bracket) attending a public institution.
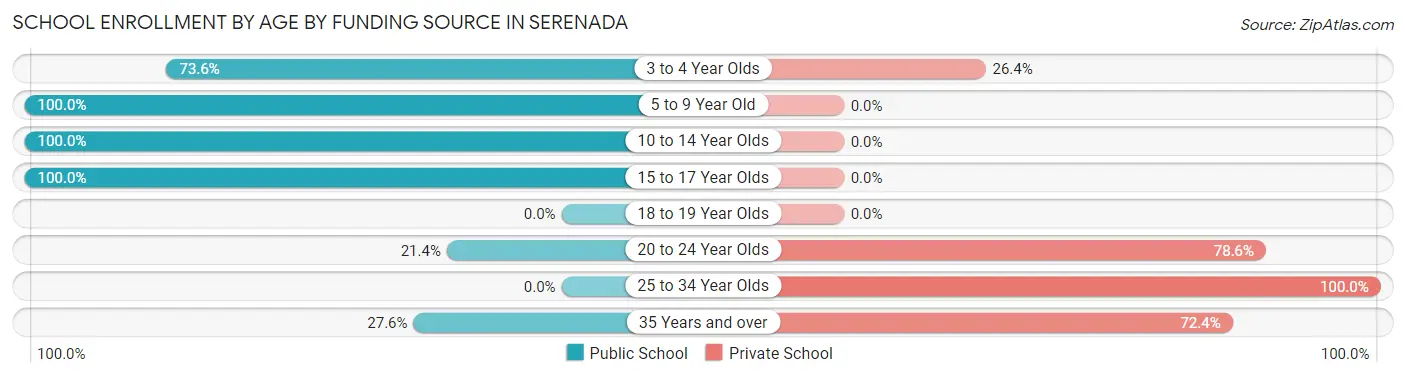
| Age Bracket | Public School | Private School |
| 3 to 4 Year Olds | 39 (73.6%) | 14 (26.4%) |
| 5 to 9 Year Old | 14 (100.0%) | 0 (0.0%) |
| 10 to 14 Year Olds | 72 (100.0%) | 0 (0.0%) |
| 15 to 17 Year Olds | 92 (100.0%) | 0 (0.0%) |
| 18 to 19 Year Olds | 0 (0.0%) | 0 (0.0%) |
| 20 to 24 Year Olds | 28 (21.4%) | 103 (78.6%) |
| 25 to 34 Year Olds | 0 (0.0%) | 21 (100.0%) |
| 35 Years and over | 8 (27.6%) | 21 (72.4%) |
| Total | 253 (61.4%) | 159 (38.6%) |
Educational Attainment by Field of Study in Serenada
Education (106 | 17.7%), engineering (99 | 16.5%), business (92 | 15.3%), social sciences (89 | 14.8%), and bio, nature & agricultural (60 | 10.0%) are the most common fields of study among 600 individuals in Serenada who have obtained a bachelor's degree or higher.
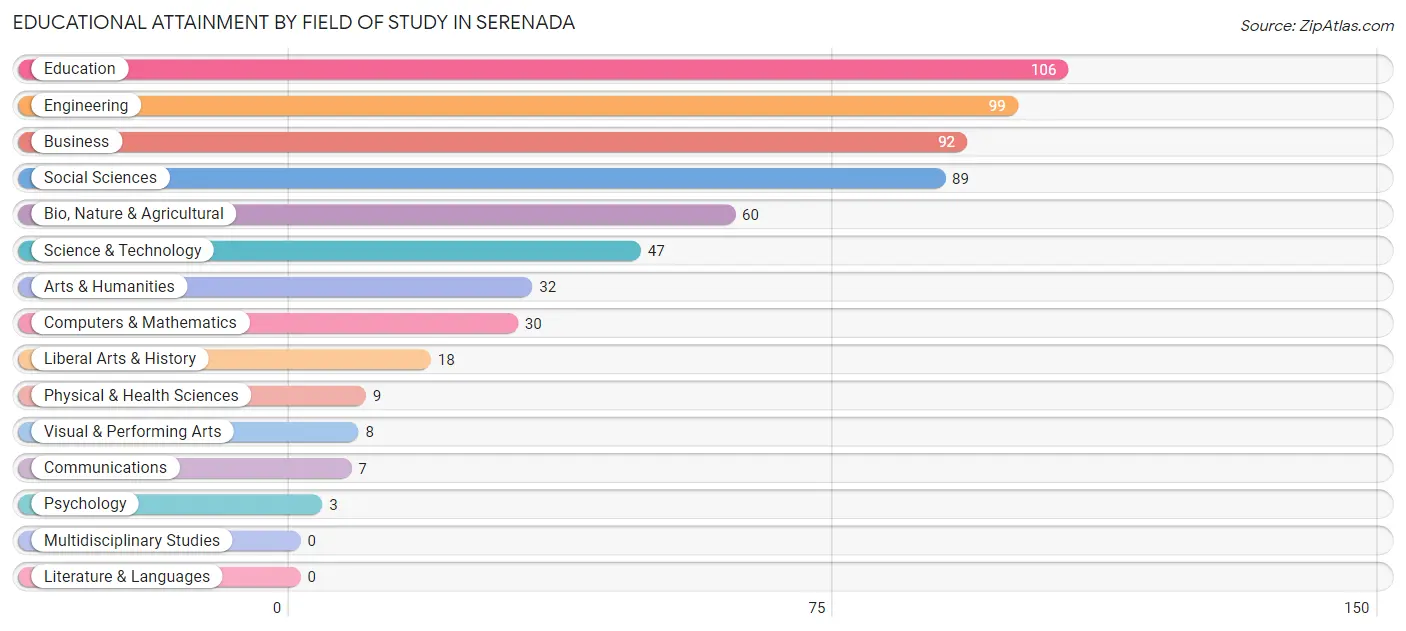
| Field of Study | # Graduates | % Graduates |
| Computers & Mathematics | 30 | 5.0% |
| Bio, Nature & Agricultural | 60 | 10.0% |
| Physical & Health Sciences | 9 | 1.5% |
| Psychology | 3 | 0.5% |
| Social Sciences | 89 | 14.8% |
| Engineering | 99 | 16.5% |
| Multidisciplinary Studies | 0 | 0.0% |
| Science & Technology | 47 | 7.8% |
| Business | 92 | 15.3% |
| Education | 106 | 17.7% |
| Literature & Languages | 0 | 0.0% |
| Liberal Arts & History | 18 | 3.0% |
| Visual & Performing Arts | 8 | 1.3% |
| Communications | 7 | 1.2% |
| Arts & Humanities | 32 | 5.3% |
| Total | 600 | 100.0% |
Transportation & Commute in Serenada
Vehicle Availability by Sex in Serenada
The most prevalent vehicle ownership categories in Serenada are males with 2 vehicles (129, accounting for 32.7%) and females with 2 vehicles (185, making up 27.5%).
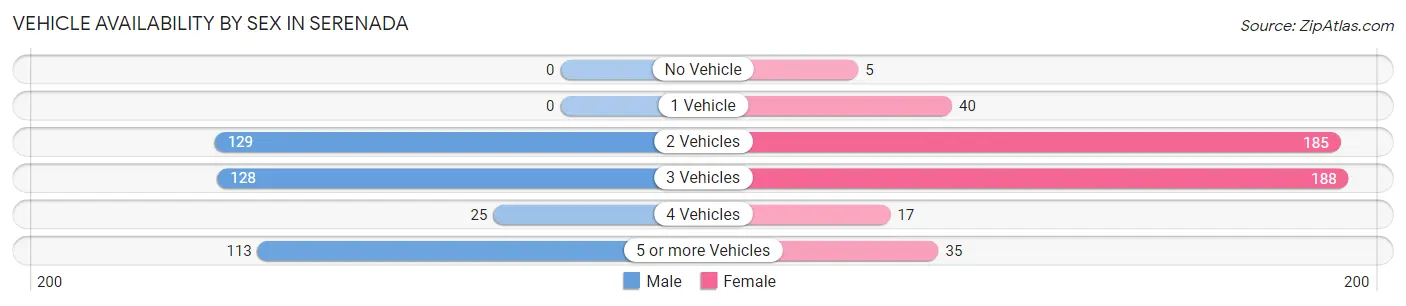
| Vehicles Available | Male | Female |
| No Vehicle | 0 (0.0%) | 5 (1.1%) |
| 1 Vehicle | 0 (0.0%) | 40 (8.5%) |
| 2 Vehicles | 129 (32.7%) | 185 (39.4%) |
| 3 Vehicles | 128 (32.4%) | 188 (40.0%) |
| 4 Vehicles | 25 (6.3%) | 17 (3.6%) |
| 5 or more Vehicles | 113 (28.6%) | 35 (7.4%) |
| Total | 395 (100.0%) | 470 (100.0%) |
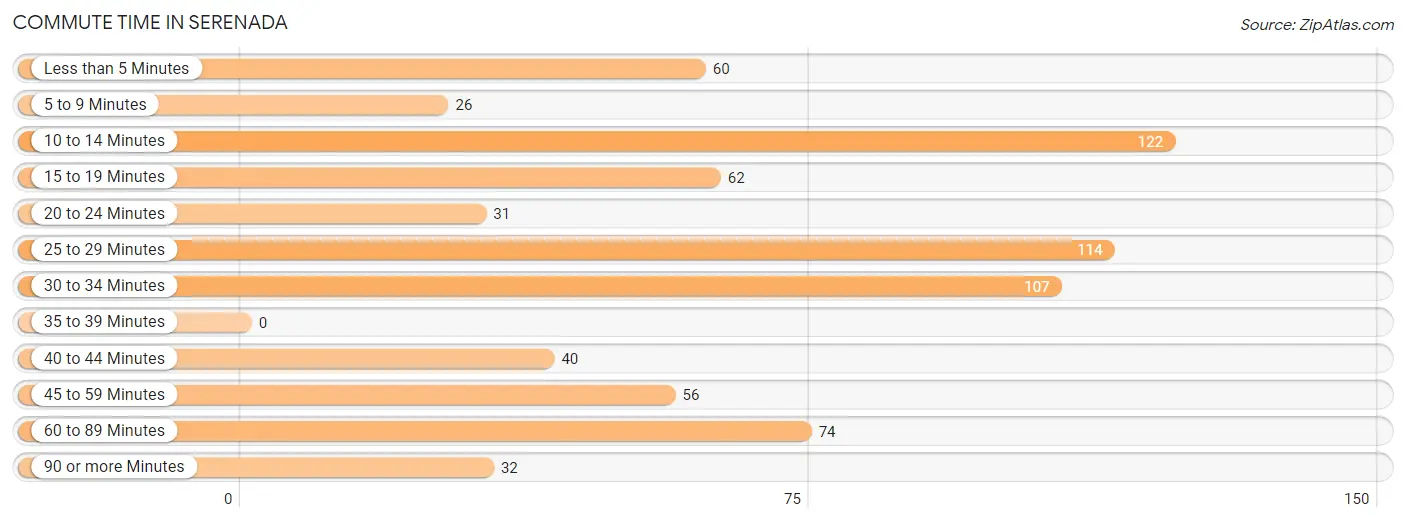
Commute Time in Serenada
The most frequently occuring commute durations in Serenada are 10 to 14 minutes (122 commuters, 16.9%), 25 to 29 minutes (114 commuters, 15.8%), and 30 to 34 minutes (107 commuters, 14.8%).
| Commute Time | # Commuters | % Commuters |
| Less than 5 Minutes | 60 | 8.3% |
| 5 to 9 Minutes | 26 | 3.6% |
| 10 to 14 Minutes | 122 | 16.9% |
| 15 to 19 Minutes | 62 | 8.6% |
| 20 to 24 Minutes | 31 | 4.3% |
| 25 to 29 Minutes | 114 | 15.8% |
| 30 to 34 Minutes | 107 | 14.8% |
| 35 to 39 Minutes | 0 | 0.0% |
| 40 to 44 Minutes | 40 | 5.5% |
| 45 to 59 Minutes | 56 | 7.7% |
| 60 to 89 Minutes | 74 | 10.2% |
| 90 or more Minutes | 32 | 4.4% |
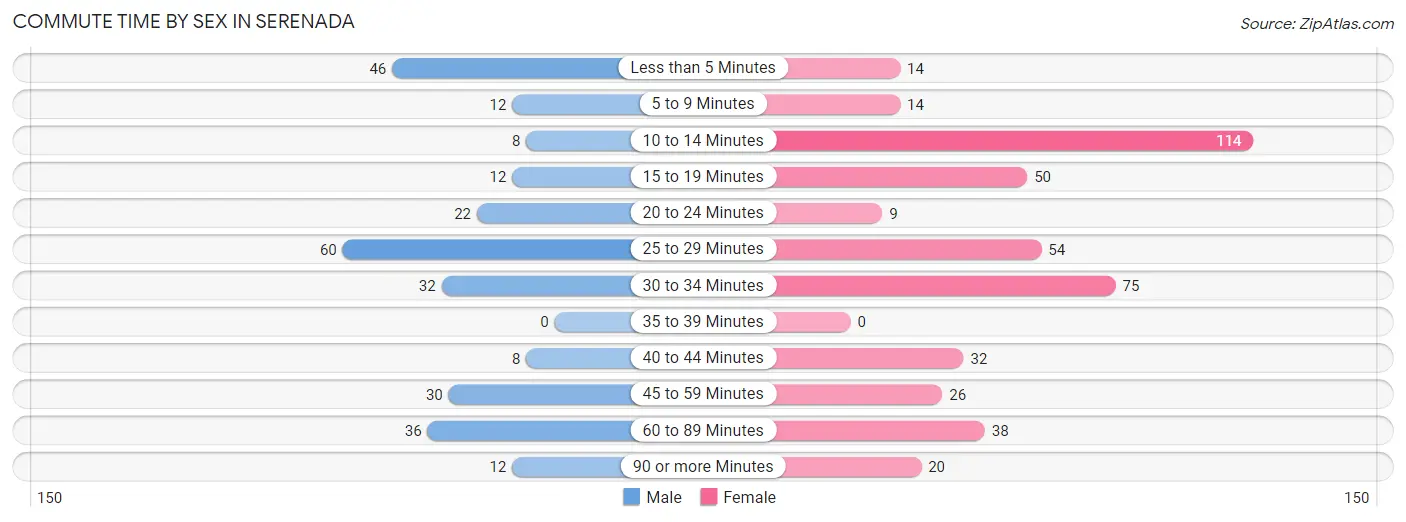
Commute Time by Sex in Serenada
The most common commute times in Serenada are 25 to 29 minutes (60 commuters, 21.6%) for males and 10 to 14 minutes (114 commuters, 25.6%) for females.
| Commute Time | Male | Female |
| Less than 5 Minutes | 46 (16.6%) | 14 (3.1%) |
| 5 to 9 Minutes | 12 (4.3%) | 14 (3.1%) |
| 10 to 14 Minutes | 8 (2.9%) | 114 (25.6%) |
| 15 to 19 Minutes | 12 (4.3%) | 50 (11.2%) |
| 20 to 24 Minutes | 22 (7.9%) | 9 (2.0%) |
| 25 to 29 Minutes | 60 (21.6%) | 54 (12.1%) |
| 30 to 34 Minutes | 32 (11.5%) | 75 (16.8%) |
| 35 to 39 Minutes | 0 (0.0%) | 0 (0.0%) |
| 40 to 44 Minutes | 8 (2.9%) | 32 (7.2%) |
| 45 to 59 Minutes | 30 (10.8%) | 26 (5.8%) |
| 60 to 89 Minutes | 36 (13.0%) | 38 (8.5%) |
| 90 or more Minutes | 12 (4.3%) | 20 (4.5%) |
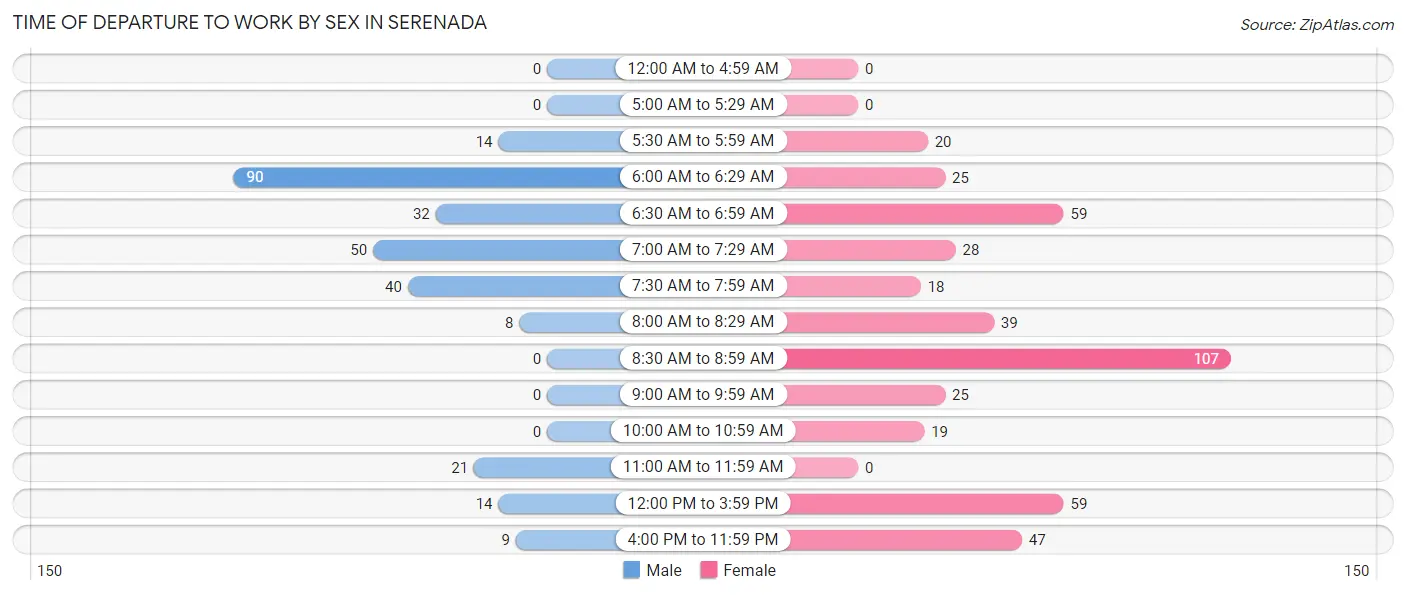
Time of Departure to Work by Sex in Serenada
The most frequent times of departure to work in Serenada are 6:00 AM to 6:29 AM (90, 32.4%) for males and 8:30 AM to 8:59 AM (107, 24.0%) for females.
| Time of Departure | Male | Female |
| 12:00 AM to 4:59 AM | 0 (0.0%) | 0 (0.0%) |
| 5:00 AM to 5:29 AM | 0 (0.0%) | 0 (0.0%) |
| 5:30 AM to 5:59 AM | 14 (5.0%) | 20 (4.5%) |
| 6:00 AM to 6:29 AM | 90 (32.4%) | 25 (5.6%) |
| 6:30 AM to 6:59 AM | 32 (11.5%) | 59 (13.2%) |
| 7:00 AM to 7:29 AM | 50 (18.0%) | 28 (6.3%) |
| 7:30 AM to 7:59 AM | 40 (14.4%) | 18 (4.0%) |
| 8:00 AM to 8:29 AM | 8 (2.9%) | 39 (8.7%) |
| 8:30 AM to 8:59 AM | 0 (0.0%) | 107 (24.0%) |
| 9:00 AM to 9:59 AM | 0 (0.0%) | 25 (5.6%) |
| 10:00 AM to 10:59 AM | 0 (0.0%) | 19 (4.3%) |
| 11:00 AM to 11:59 AM | 21 (7.5%) | 0 (0.0%) |
| 12:00 PM to 3:59 PM | 14 (5.0%) | 59 (13.2%) |
| 4:00 PM to 11:59 PM | 9 (3.2%) | 47 (10.5%) |
| Total | 278 (100.0%) | 446 (100.0%) |
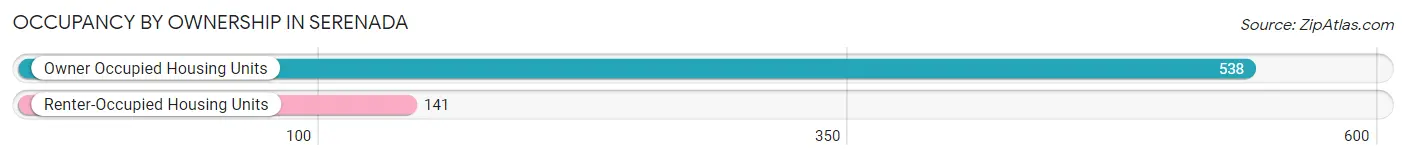
Housing Occupancy in Serenada
Occupancy by Ownership in Serenada
Of the total 679 dwellings in Serenada, owner-occupied units account for 538 (79.2%), while renter-occupied units make up 141 (20.8%).
| Occupancy | # Housing Units | % Housing Units |
| Owner Occupied Housing Units | 538 | 79.2% |
| Renter-Occupied Housing Units | 141 | 20.8% |
| Total Occupied Housing Units | 679 | 100.0% |
Occupancy by Household Size in Serenada
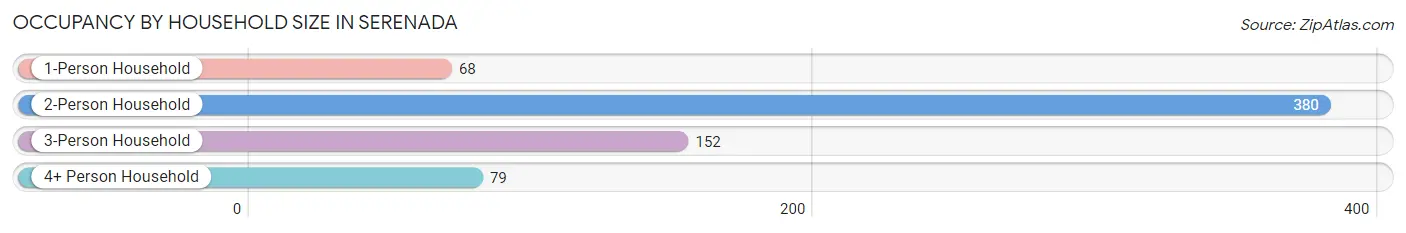
| Household Size | # Housing Units | % Housing Units |
| 1-Person Household | 68 | 10.0% |
| 2-Person Household | 380 | 56.0% |
| 3-Person Household | 152 | 22.4% |
| 4+ Person Household | 79 | 11.6% |
| Total Housing Units | 679 | 100.0% |
Occupancy by Ownership by Household Size in Serenada
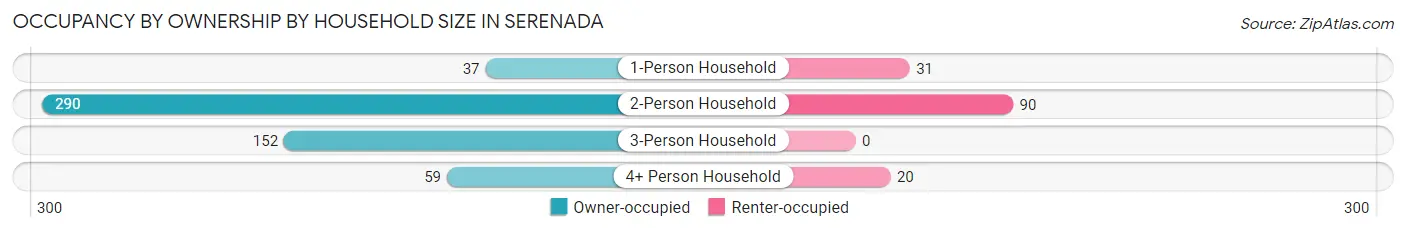
| Household Size | Owner-occupied | Renter-occupied |
| 1-Person Household | 37 (54.4%) | 31 (45.6%) |
| 2-Person Household | 290 (76.3%) | 90 (23.7%) |
| 3-Person Household | 152 (100.0%) | 0 (0.0%) |
| 4+ Person Household | 59 (74.7%) | 20 (25.3%) |
| Total Housing Units | 538 (79.2%) | 141 (20.8%) |
Occupancy by Educational Attainment in Serenada
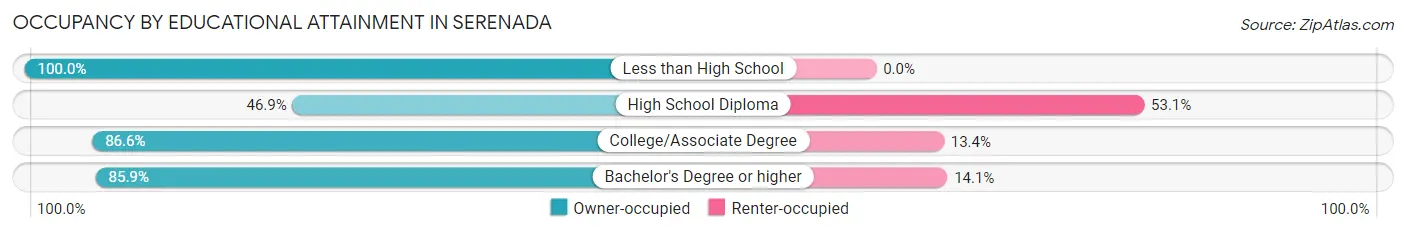
| Household Size | Owner-occupied | Renter-occupied |
| Less than High School | 24 (100.0%) | 0 (0.0%) |
| High School Diploma | 60 (46.9%) | 68 (53.1%) |
| College/Associate Degree | 155 (86.6%) | 24 (13.4%) |
| Bachelor's Degree or higher | 299 (85.9%) | 49 (14.1%) |
Occupancy by Age of Householder in Serenada
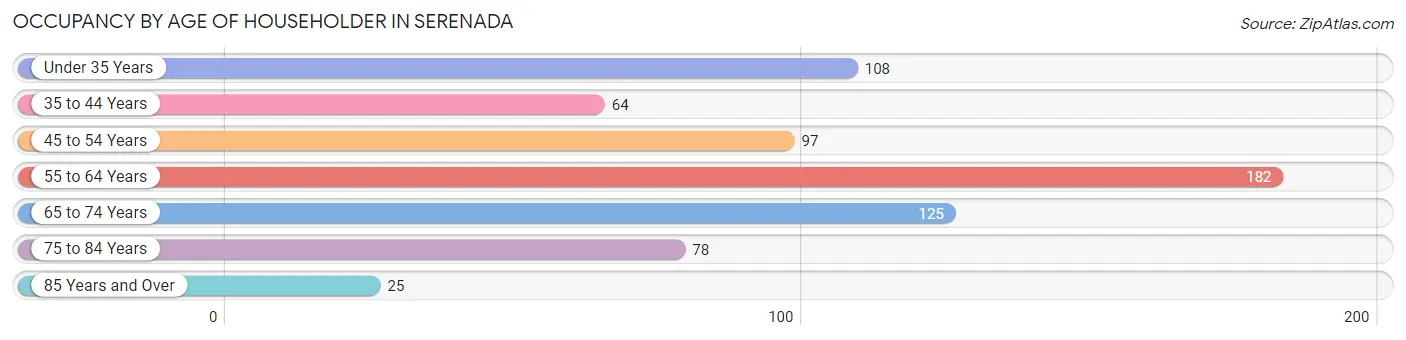
| Age Bracket | # Households | % Households |
| Under 35 Years | 108 | 15.9% |
| 35 to 44 Years | 64 | 9.4% |
| 45 to 54 Years | 97 | 14.3% |
| 55 to 64 Years | 182 | 26.8% |
| 65 to 74 Years | 125 | 18.4% |
| 75 to 84 Years | 78 | 11.5% |
| 85 Years and Over | 25 | 3.7% |
| Total | 679 | 100.0% |
Housing Finances in Serenada
Median Income by Occupancy in Serenada
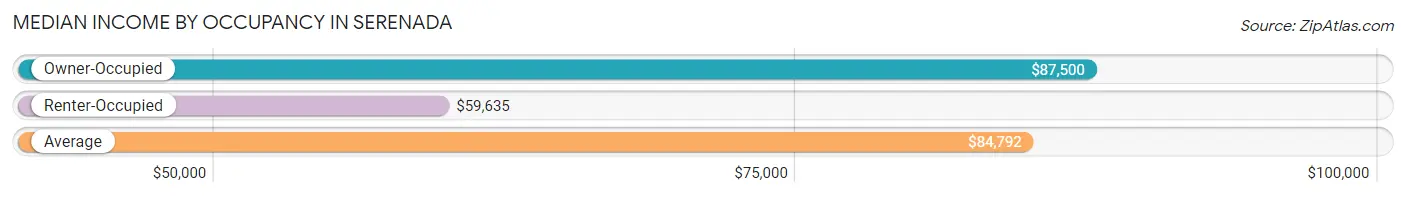
| Occupancy Type | # Households | Median Income |
| Owner-Occupied | 538 (79.2%) | $87,500 |
| Renter-Occupied | 141 (20.8%) | $59,635 |
| Average | 679 (100.0%) | $84,792 |
Occupancy by Householder Income Bracket in Serenada
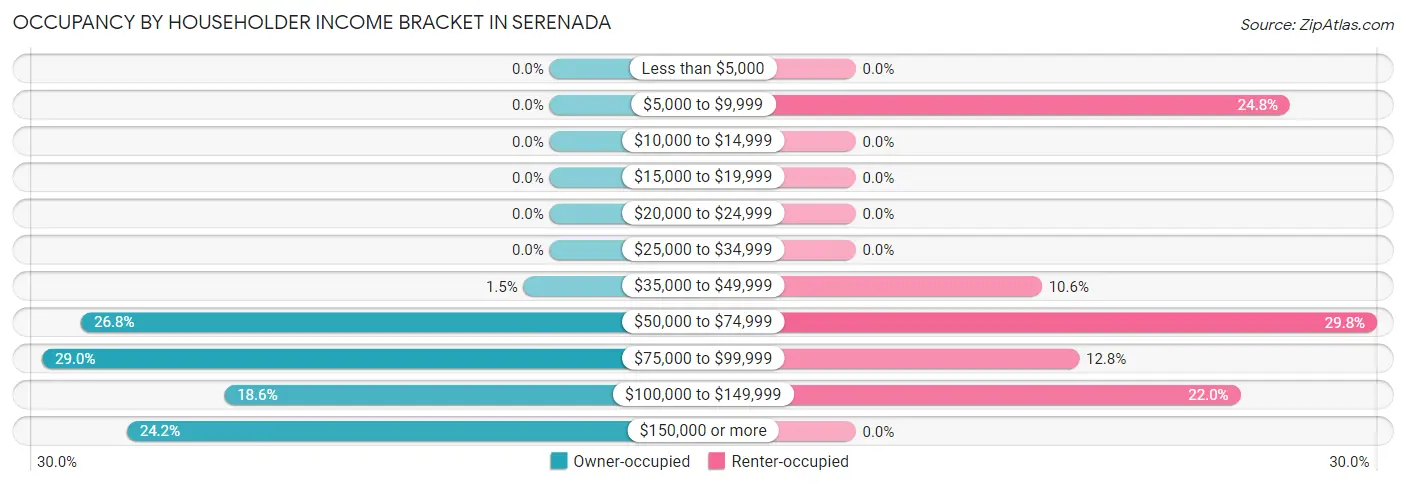
| Income Bracket | Owner-occupied | Renter-occupied |
| Less than $5,000 | 0 (0.0%) | 0 (0.0%) |
| $5,000 to $9,999 | 0 (0.0%) | 35 (24.8%) |
| $10,000 to $14,999 | 0 (0.0%) | 0 (0.0%) |
| $15,000 to $19,999 | 0 (0.0%) | 0 (0.0%) |
| $20,000 to $24,999 | 0 (0.0%) | 0 (0.0%) |
| $25,000 to $34,999 | 0 (0.0%) | 0 (0.0%) |
| $35,000 to $49,999 | 8 (1.5%) | 15 (10.6%) |
| $50,000 to $74,999 | 144 (26.8%) | 42 (29.8%) |
| $75,000 to $99,999 | 156 (29.0%) | 18 (12.8%) |
| $100,000 to $149,999 | 100 (18.6%) | 31 (22.0%) |
| $150,000 or more | 130 (24.2%) | 0 (0.0%) |
| Total | 538 (100.0%) | 141 (100.0%) |
Monthly Housing Cost Tiers in Serenada
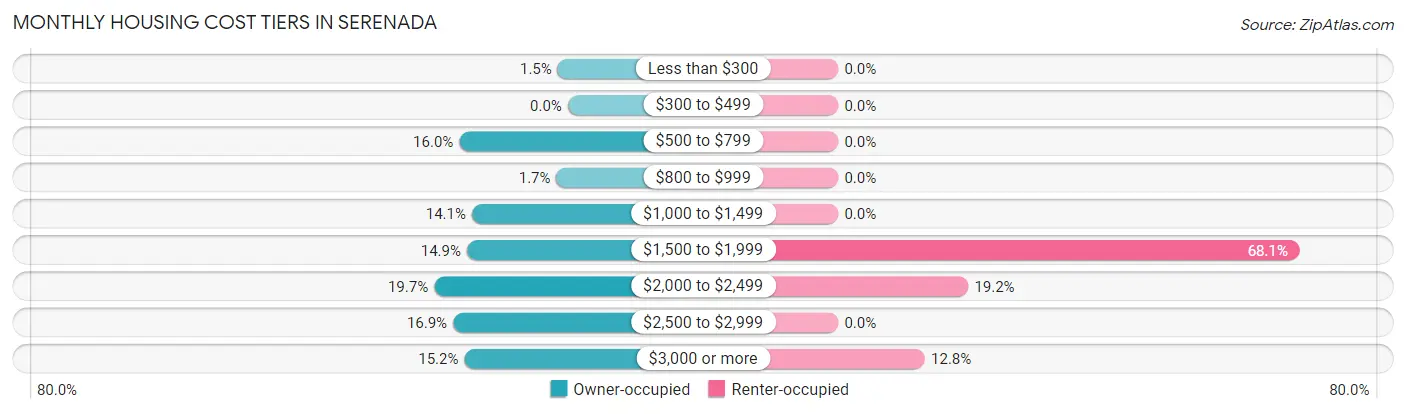
| Monthly Cost | Owner-occupied | Renter-occupied |
| Less than $300 | 8 (1.5%) | 0 (0.0%) |
| $300 to $499 | 0 (0.0%) | 0 (0.0%) |
| $500 to $799 | 86 (16.0%) | 0 (0.0%) |
| $800 to $999 | 9 (1.7%) | 0 (0.0%) |
| $1,000 to $1,499 | 76 (14.1%) | 0 (0.0%) |
| $1,500 to $1,999 | 80 (14.9%) | 96 (68.1%) |
| $2,000 to $2,499 | 106 (19.7%) | 27 (19.2%) |
| $2,500 to $2,999 | 91 (16.9%) | 0 (0.0%) |
| $3,000 or more | 82 (15.2%) | 18 (12.8%) |
| Total | 538 (100.0%) | 141 (100.0%) |
Physical Housing Characteristics in Serenada
Housing Structures in Serenada
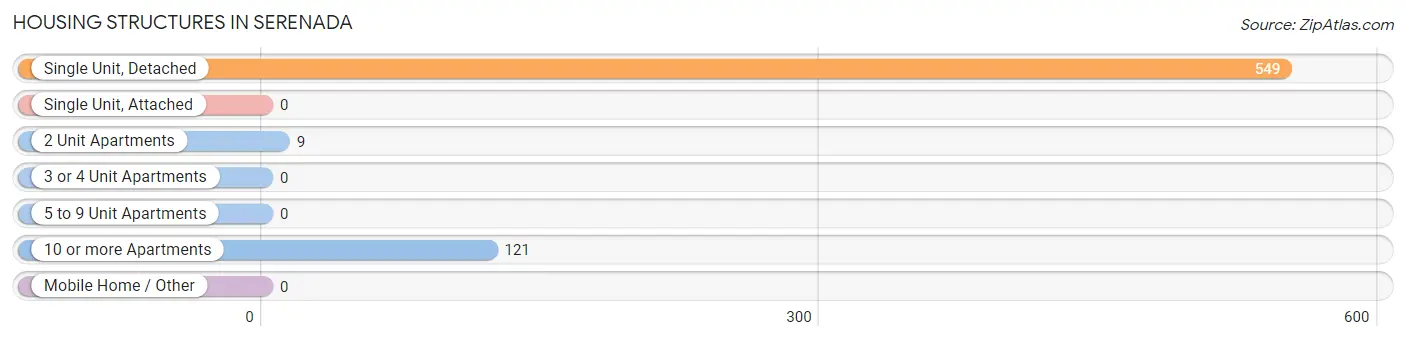
| Structure Type | # Housing Units | % Housing Units |
| Single Unit, Detached | 549 | 80.8% |
| Single Unit, Attached | 0 | 0.0% |
| 2 Unit Apartments | 9 | 1.3% |
| 3 or 4 Unit Apartments | 0 | 0.0% |
| 5 to 9 Unit Apartments | 0 | 0.0% |
| 10 or more Apartments | 121 | 17.8% |
| Mobile Home / Other | 0 | 0.0% |
| Total | 679 | 100.0% |
Housing Structures by Occupancy in Serenada
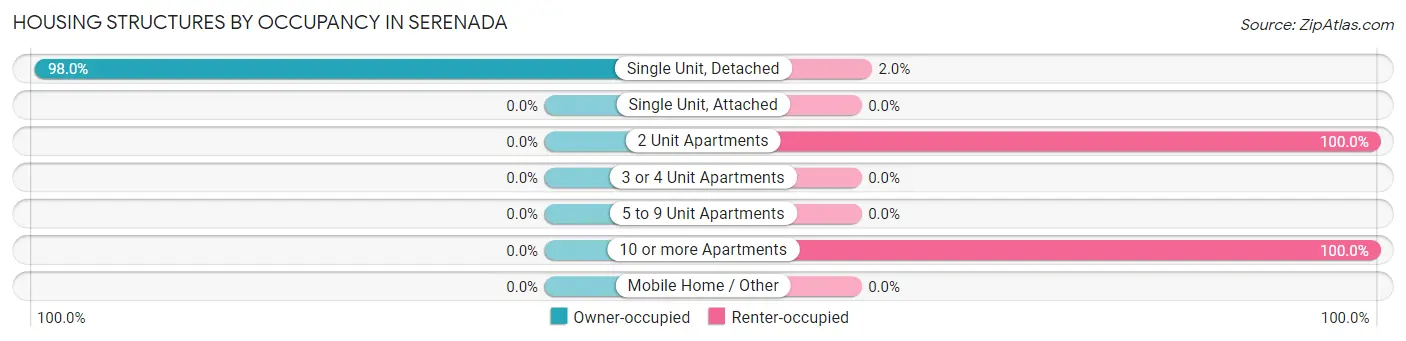
| Structure Type | Owner-occupied | Renter-occupied |
| Single Unit, Detached | 538 (98.0%) | 11 (2.0%) |
| Single Unit, Attached | 0 (0.0%) | 0 (0.0%) |
| 2 Unit Apartments | 0 (0.0%) | 9 (100.0%) |
| 3 or 4 Unit Apartments | 0 (0.0%) | 0 (0.0%) |
| 5 to 9 Unit Apartments | 0 (0.0%) | 0 (0.0%) |
| 10 or more Apartments | 0 (0.0%) | 121 (100.0%) |
| Mobile Home / Other | 0 (0.0%) | 0 (0.0%) |
| Total | 538 (79.2%) | 141 (20.8%) |
Housing Structures by Number of Rooms in Serenada
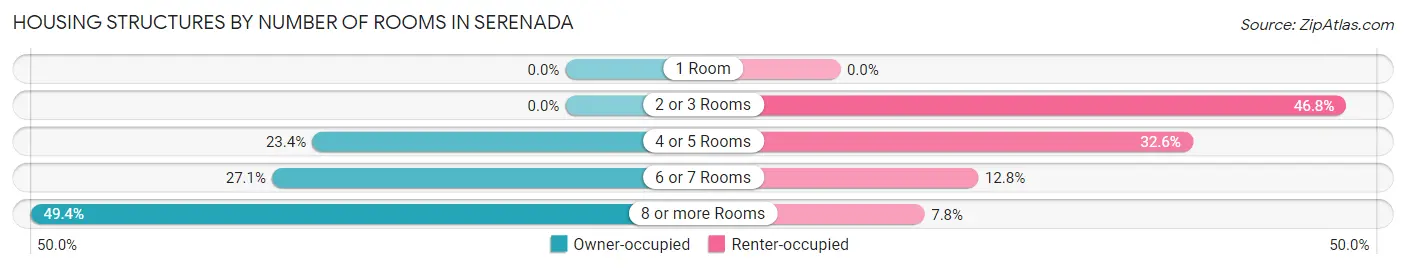
| Number of Rooms | Owner-occupied | Renter-occupied |
| 1 Room | 0 (0.0%) | 0 (0.0%) |
| 2 or 3 Rooms | 0 (0.0%) | 66 (46.8%) |
| 4 or 5 Rooms | 126 (23.4%) | 46 (32.6%) |
| 6 or 7 Rooms | 146 (27.1%) | 18 (12.8%) |
| 8 or more Rooms | 266 (49.4%) | 11 (7.8%) |
| Total | 538 (100.0%) | 141 (100.0%) |
Housing Structure by Heating Type in Serenada
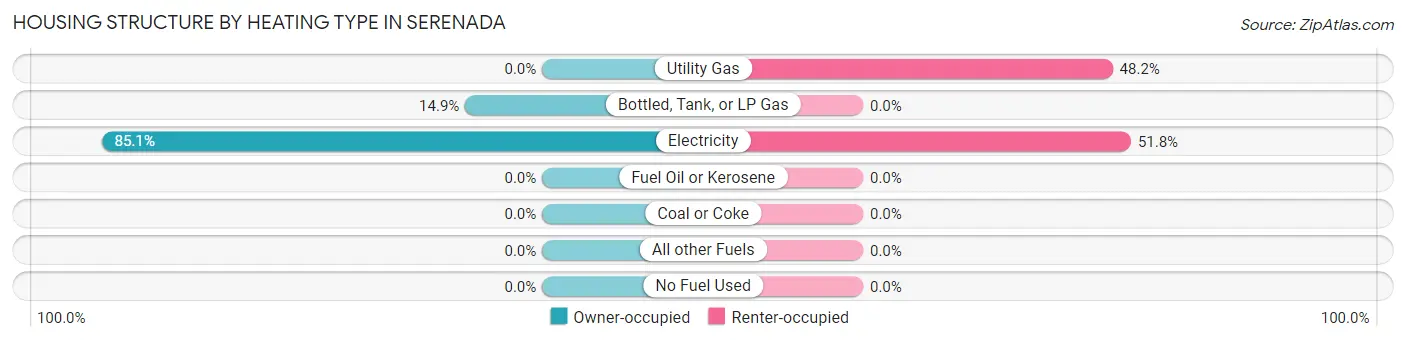
| Heating Type | Owner-occupied | Renter-occupied |
| Utility Gas | 0 (0.0%) | 68 (48.2%) |
| Bottled, Tank, or LP Gas | 80 (14.9%) | 0 (0.0%) |
| Electricity | 458 (85.1%) | 73 (51.8%) |
| Fuel Oil or Kerosene | 0 (0.0%) | 0 (0.0%) |
| Coal or Coke | 0 (0.0%) | 0 (0.0%) |
| All other Fuels | 0 (0.0%) | 0 (0.0%) |
| No Fuel Used | 0 (0.0%) | 0 (0.0%) |
| Total | 538 (100.0%) | 141 (100.0%) |
Household Vehicle Usage in Serenada
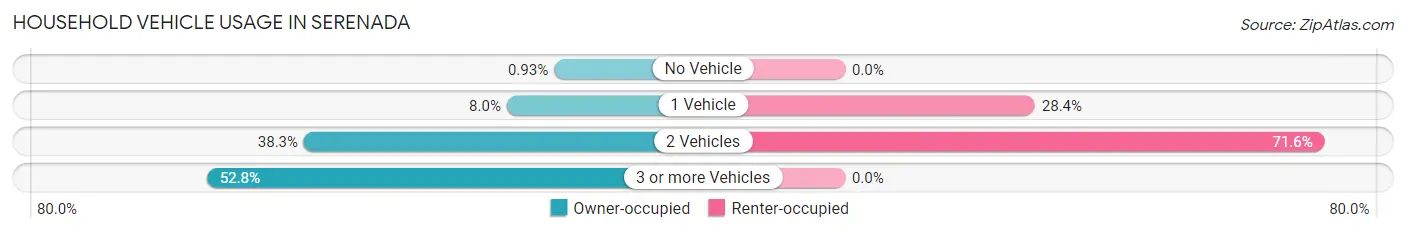
| Vehicles per Household | Owner-occupied | Renter-occupied |
| No Vehicle | 5 (0.9%) | 0 (0.0%) |
| 1 Vehicle | 43 (8.0%) | 40 (28.4%) |
| 2 Vehicles | 206 (38.3%) | 101 (71.6%) |
| 3 or more Vehicles | 284 (52.8%) | 0 (0.0%) |
| Total | 538 (100.0%) | 141 (100.0%) |
Real Estate & Mortgages in Serenada
Real Estate and Mortgage Overview in Serenada
| Characteristic | Without Mortgage | With Mortgage |
| Housing Units | 156 | 382 |
| Median Property Value | $420,000 | $457,100 |
| Median Household Income | $72,258 | $100 |
| Monthly Housing Costs | $706 | $82 |
| Real Estate Taxes | $3,911 | $4 |
Property Value by Mortgage Status in Serenada
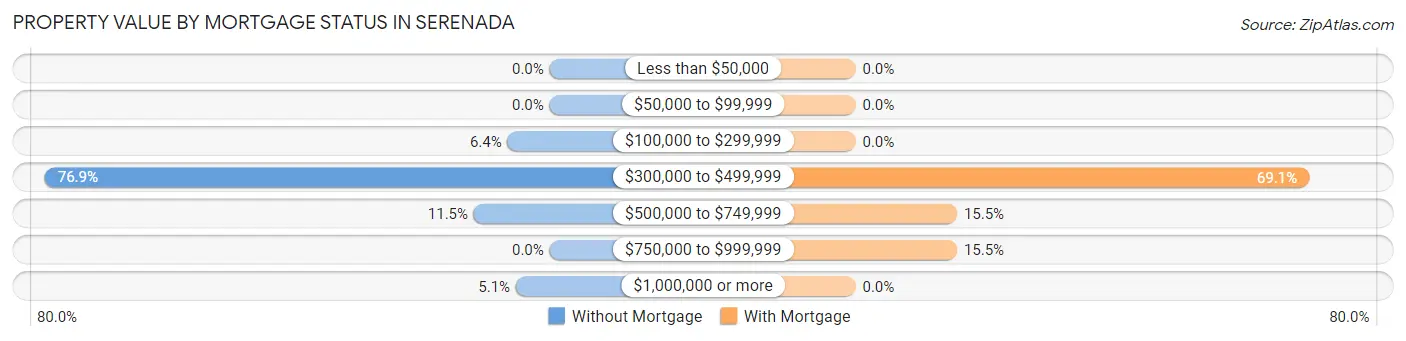
| Property Value | Without Mortgage | With Mortgage |
| Less than $50,000 | 0 (0.0%) | 0 (0.0%) |
| $50,000 to $99,999 | 0 (0.0%) | 0 (0.0%) |
| $100,000 to $299,999 | 10 (6.4%) | 0 (0.0%) |
| $300,000 to $499,999 | 120 (76.9%) | 264 (69.1%) |
| $500,000 to $749,999 | 18 (11.5%) | 59 (15.4%) |
| $750,000 to $999,999 | 0 (0.0%) | 59 (15.4%) |
| $1,000,000 or more | 8 (5.1%) | 0 (0.0%) |
| Total | 156 (100.0%) | 382 (100.0%) |
Household Income by Mortgage Status in Serenada
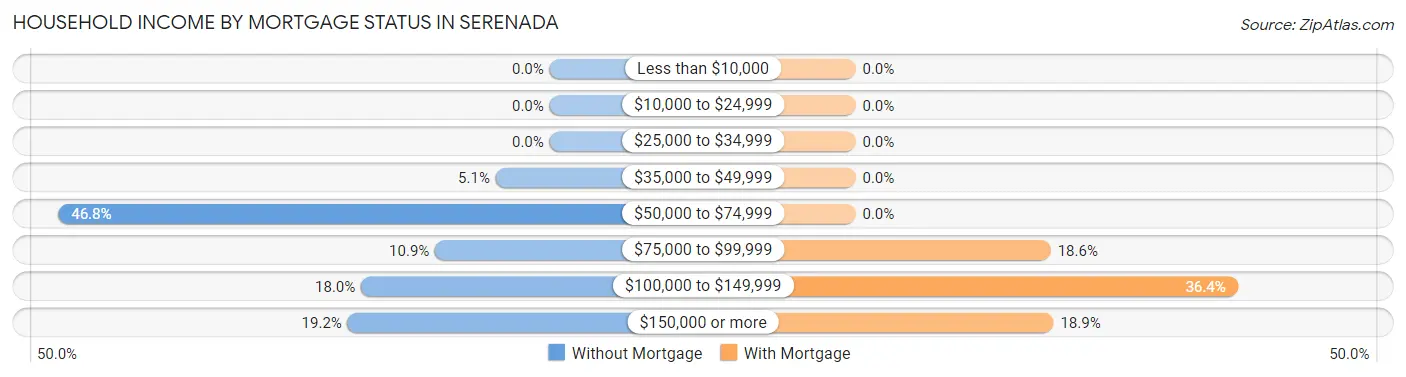
| Household Income | Without Mortgage | With Mortgage |
| Less than $10,000 | 0 (0.0%) | 0 (0.0%) |
| $10,000 to $24,999 | 0 (0.0%) | 0 (0.0%) |
| $25,000 to $34,999 | 0 (0.0%) | 0 (0.0%) |
| $35,000 to $49,999 | 8 (5.1%) | 0 (0.0%) |
| $50,000 to $74,999 | 73 (46.8%) | 0 (0.0%) |
| $75,000 to $99,999 | 17 (10.9%) | 71 (18.6%) |
| $100,000 to $149,999 | 28 (17.9%) | 139 (36.4%) |
| $150,000 or more | 30 (19.2%) | 72 (18.9%) |
| Total | 156 (100.0%) | 382 (100.0%) |
Property Value to Household Income Ratio in Serenada
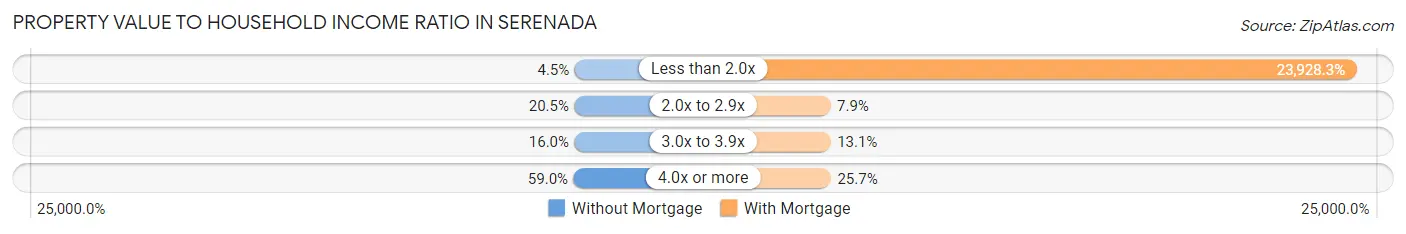
| Value-to-Income Ratio | Without Mortgage | With Mortgage |
| Less than 2.0x | 7 (4.5%) | 91,406 (23,928.3%) |
| 2.0x to 2.9x | 32 (20.5%) | 30 (7.9%) |
| 3.0x to 3.9x | 25 (16.0%) | 50 (13.1%) |
| 4.0x or more | 92 (59.0%) | 98 (25.7%) |
| Total | 156 (100.0%) | 382 (100.0%) |
Real Estate Taxes by Mortgage Status in Serenada
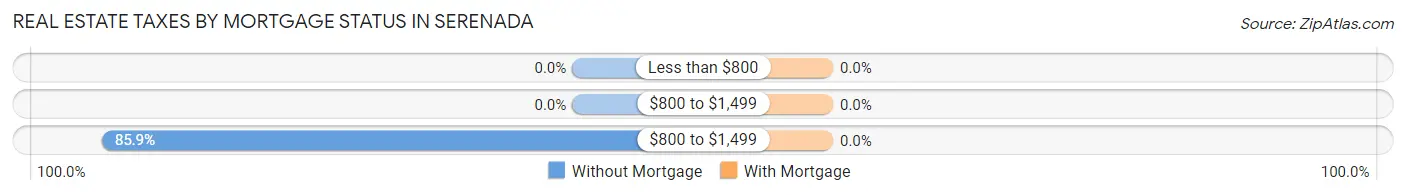
| Property Taxes | Without Mortgage | With Mortgage |
| Less than $800 | 0 (0.0%) | 0 (0.0%) |
| $800 to $1,499 | 0 (0.0%) | 0 (0.0%) |
| $800 to $1,499 | 134 (85.9%) | 0 (0.0%) |
| Total | 156 (100.0%) | 382 (100.0%) |
Health & Disability in Serenada
Health Insurance Coverage by Age in Serenada
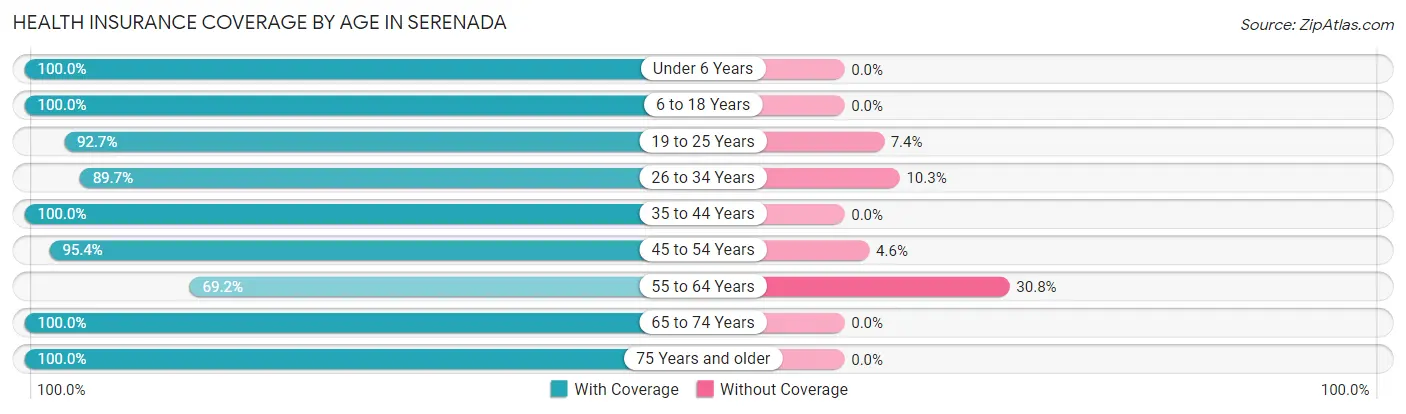
| Age Bracket | With Coverage | Without Coverage |
| Under 6 Years | 72 (100.0%) | 0 (0.0%) |
| 6 to 18 Years | 173 (100.0%) | 0 (0.0%) |
| 19 to 25 Years | 189 (92.6%) | 15 (7.3%) |
| 26 to 34 Years | 157 (89.7%) | 18 (10.3%) |
| 35 to 44 Years | 140 (100.0%) | 0 (0.0%) |
| 45 to 54 Years | 144 (95.4%) | 7 (4.6%) |
| 55 to 64 Years | 254 (69.2%) | 113 (30.8%) |
| 65 to 74 Years | 221 (100.0%) | 0 (0.0%) |
| 75 Years and older | 192 (100.0%) | 0 (0.0%) |
| Total | 1,542 (91.0%) | 153 (9.0%) |
Health Insurance Coverage by Citizenship Status in Serenada
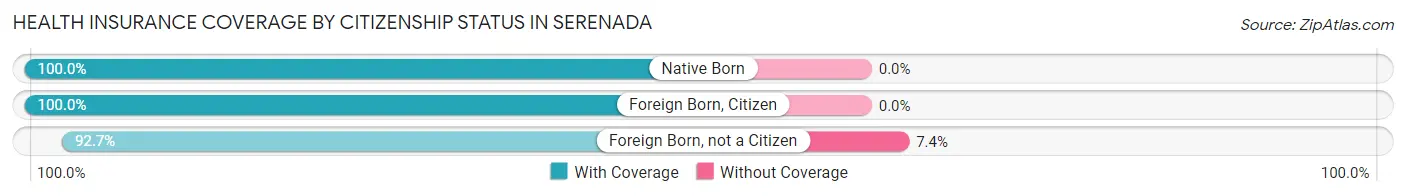
| Citizenship Status | With Coverage | Without Coverage |
| Native Born | 72 (100.0%) | 0 (0.0%) |
| Foreign Born, Citizen | 173 (100.0%) | 0 (0.0%) |
| Foreign Born, not a Citizen | 189 (92.6%) | 15 (7.3%) |
Health Insurance Coverage by Household Income in Serenada
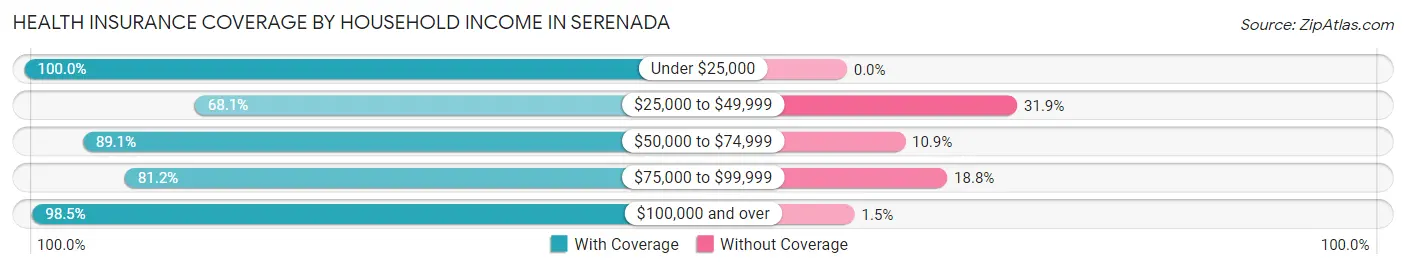
| Household Income | With Coverage | Without Coverage |
| Under $25,000 | 76 (100.0%) | 0 (0.0%) |
| $25,000 to $49,999 | 32 (68.1%) | 15 (31.9%) |
| $50,000 to $74,999 | 294 (89.1%) | 36 (10.9%) |
| $75,000 to $99,999 | 393 (81.2%) | 91 (18.8%) |
| $100,000 and over | 742 (98.5%) | 11 (1.5%) |
Public vs Private Health Insurance Coverage by Age in Serenada
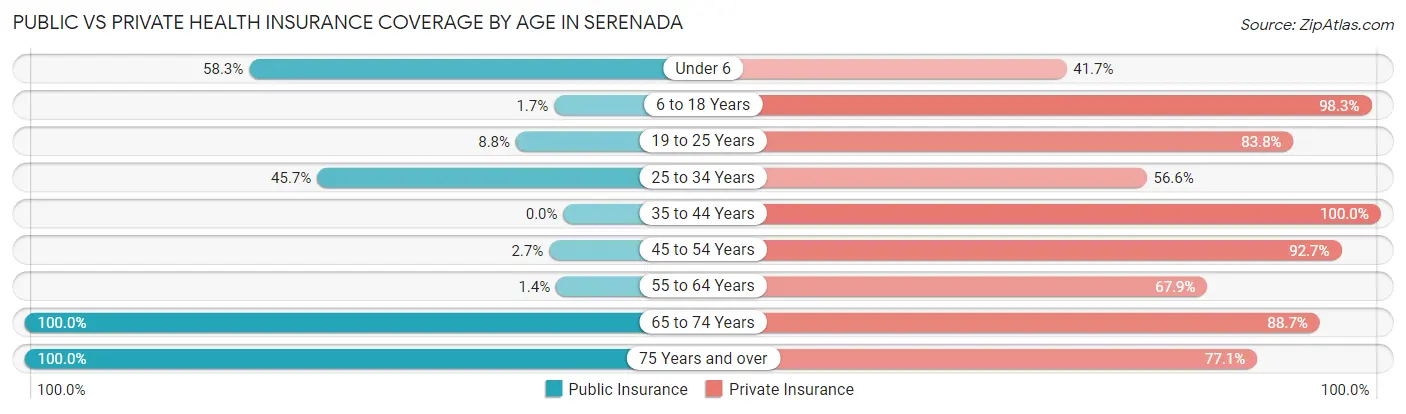
| Age Bracket | Public Insurance | Private Insurance |
| Under 6 | 42 (58.3%) | 30 (41.7%) |
| 6 to 18 Years | 3 (1.7%) | 170 (98.3%) |
| 19 to 25 Years | 18 (8.8%) | 171 (83.8%) |
| 25 to 34 Years | 80 (45.7%) | 99 (56.6%) |
| 35 to 44 Years | 0 (0.0%) | 140 (100.0%) |
| 45 to 54 Years | 4 (2.6%) | 140 (92.7%) |
| 55 to 64 Years | 5 (1.4%) | 249 (67.8%) |
| 65 to 74 Years | 221 (100.0%) | 196 (88.7%) |
| 75 Years and over | 192 (100.0%) | 148 (77.1%) |
| Total | 565 (33.3%) | 1,343 (79.2%) |
Disability Status by Sex by Age in Serenada
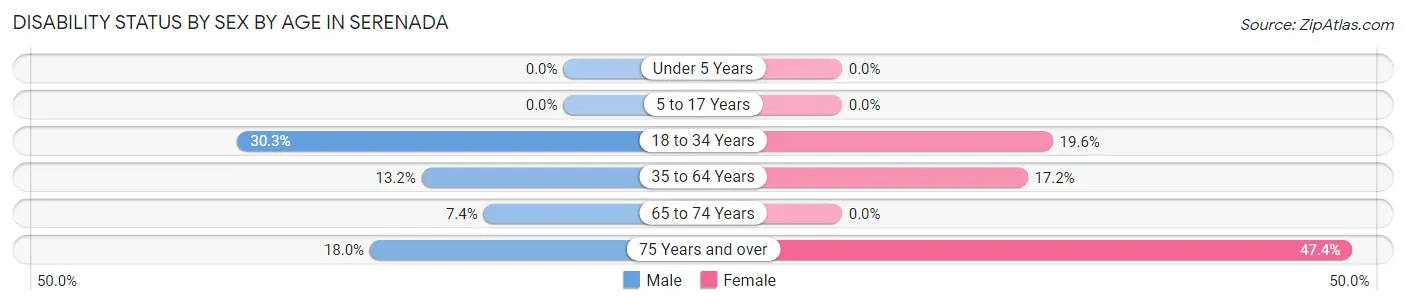
| Age Bracket | Male | Female |
| Under 5 Years | 0 (0.0%) | 0 (0.0%) |
| 5 to 17 Years | 0 (0.0%) | 0 (0.0%) |
| 18 to 34 Years | 59 (30.3%) | 36 (19.6%) |
| 35 to 64 Years | 40 (13.2%) | 61 (17.2%) |
| 65 to 74 Years | 10 (7.4%) | 0 (0.0%) |
| 75 Years and over | 14 (17.9%) | 54 (47.4%) |
Disability Class by Sex by Age in Serenada
Disability Class: Hearing Difficulty
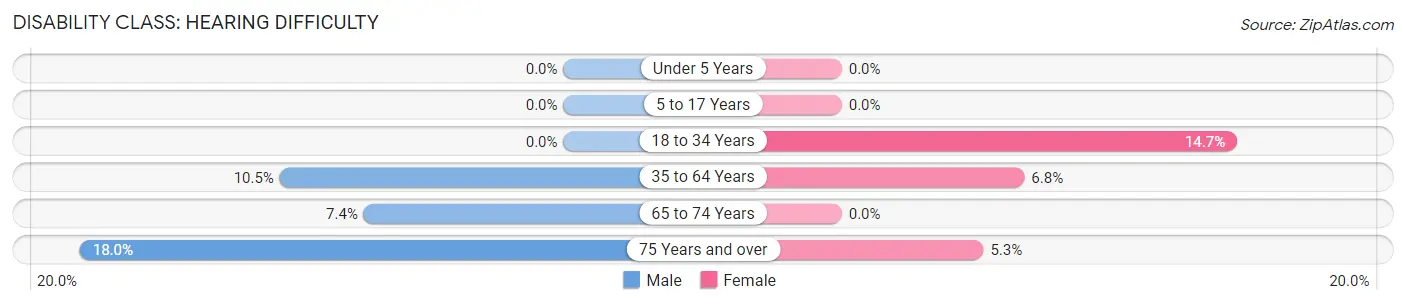
| Age Bracket | Male | Female |
| Under 5 Years | 0 (0.0%) | 0 (0.0%) |
| 5 to 17 Years | 0 (0.0%) | 0 (0.0%) |
| 18 to 34 Years | 0 (0.0%) | 27 (14.7%) |
| 35 to 64 Years | 32 (10.5%) | 24 (6.8%) |
| 65 to 74 Years | 10 (7.4%) | 0 (0.0%) |
| 75 Years and over | 14 (17.9%) | 6 (5.3%) |
Disability Class: Vision Difficulty
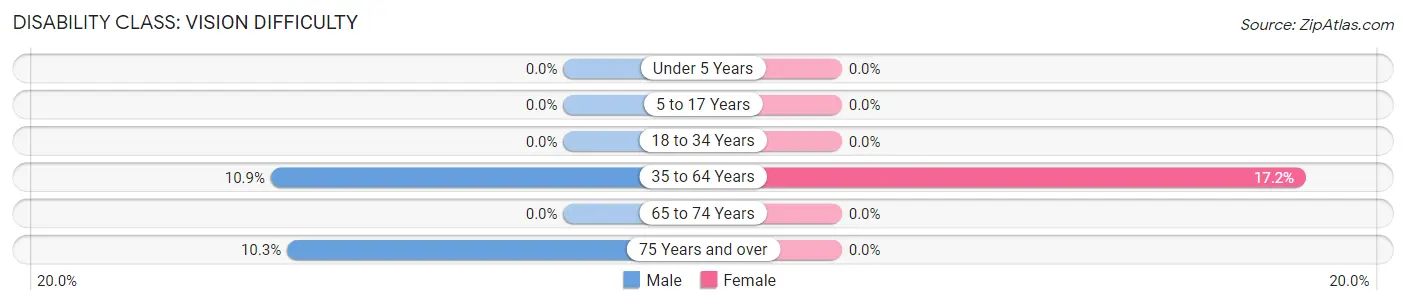
| Age Bracket | Male | Female |
| Under 5 Years | 0 (0.0%) | 0 (0.0%) |
| 5 to 17 Years | 0 (0.0%) | 0 (0.0%) |
| 18 to 34 Years | 0 (0.0%) | 0 (0.0%) |
| 35 to 64 Years | 33 (10.9%) | 61 (17.2%) |
| 65 to 74 Years | 0 (0.0%) | 0 (0.0%) |
| 75 Years and over | 8 (10.3%) | 0 (0.0%) |
Disability Class: Cognitive Difficulty
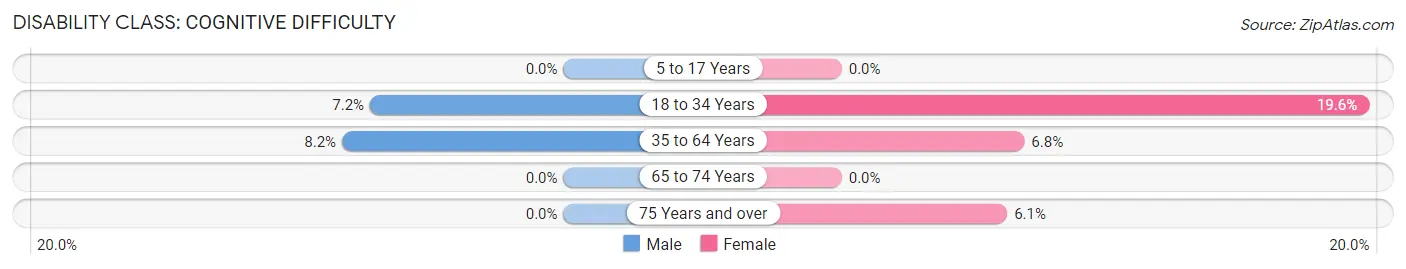
| Age Bracket | Male | Female |
| 5 to 17 Years | 0 (0.0%) | 0 (0.0%) |
| 18 to 34 Years | 14 (7.2%) | 36 (19.6%) |
| 35 to 64 Years | 25 (8.2%) | 24 (6.8%) |
| 65 to 74 Years | 0 (0.0%) | 0 (0.0%) |
| 75 Years and over | 0 (0.0%) | 7 (6.1%) |
Disability Class: Ambulatory Difficulty
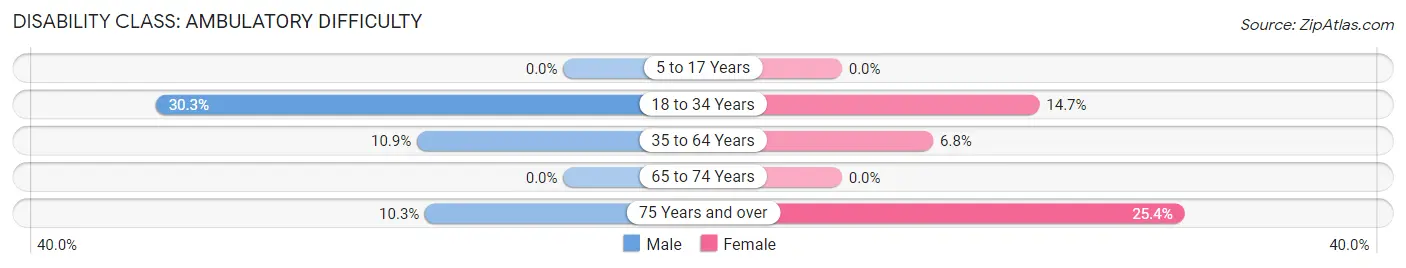
| Age Bracket | Male | Female |
| 5 to 17 Years | 0 (0.0%) | 0 (0.0%) |
| 18 to 34 Years | 59 (30.3%) | 27 (14.7%) |
| 35 to 64 Years | 33 (10.9%) | 24 (6.8%) |
| 65 to 74 Years | 0 (0.0%) | 0 (0.0%) |
| 75 Years and over | 8 (10.3%) | 29 (25.4%) |
Disability Class: Self-Care Difficulty
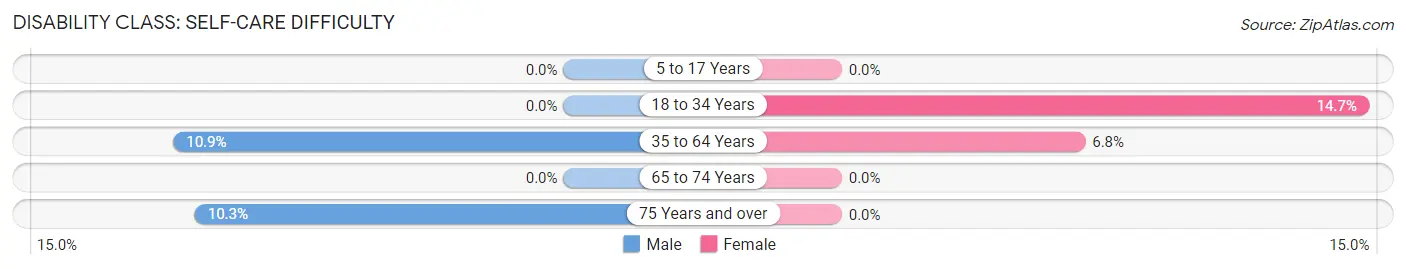
| Age Bracket | Male | Female |
| 5 to 17 Years | 0 (0.0%) | 0 (0.0%) |
| 18 to 34 Years | 0 (0.0%) | 27 (14.7%) |
| 35 to 64 Years | 33 (10.9%) | 24 (6.8%) |
| 65 to 74 Years | 0 (0.0%) | 0 (0.0%) |
| 75 Years and over | 8 (10.3%) | 0 (0.0%) |
Technology Access in Serenada
Computing Device Access in Serenada
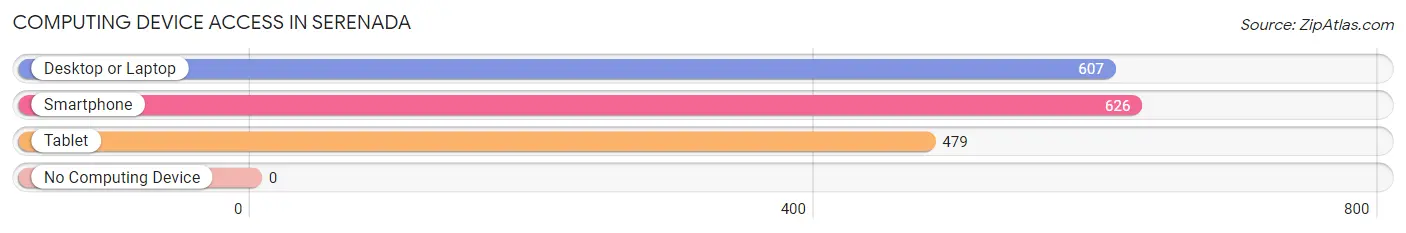
| Device Type | # Households | % Households |
| Desktop or Laptop | 607 | 89.4% |
| Smartphone | 626 | 92.2% |
| Tablet | 479 | 70.5% |
| No Computing Device | 0 | 0.0% |
| Total | 679 | 100.0% |
Internet Access in Serenada
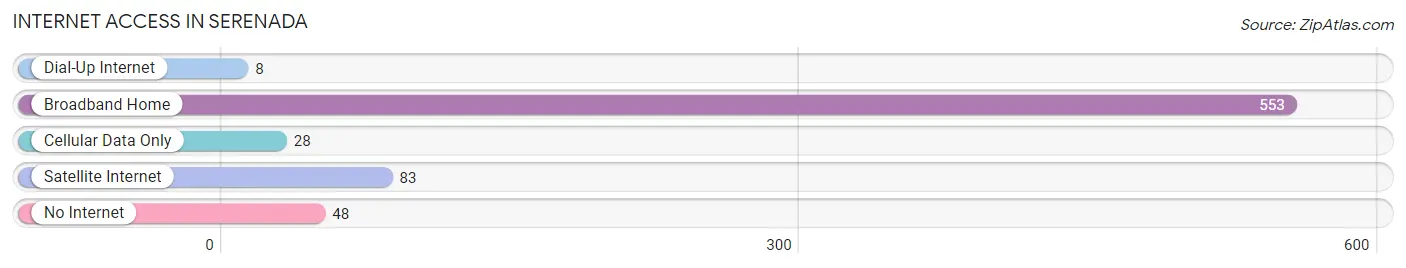
| Internet Type | # Households | % Households |
| Dial-Up Internet | 8 | 1.2% |
| Broadband Home | 553 | 81.4% |
| Cellular Data Only | 28 | 4.1% |
| Satellite Internet | 83 | 12.2% |
| No Internet | 48 | 7.1% |
| Total | 679 | 100.0% |
Serenada Summary
Serenada is a small unincorporated community located in Hays County, Texas, United States. It is situated about 20 miles southwest of Austin, the state capital. The population of Serenada was estimated to be around 1,000 in 2020.
History
Serenada was founded in 1854 by a group of German immigrants who had settled in the area. The town was originally called “Serenada”, which is Spanish for “serenade”. The name was chosen to reflect the peaceful nature of the area. The town was officially incorporated in 1876.
In the late 19th century, Serenada was a thriving agricultural community. The town was home to several cotton gins, a grist mill, and a blacksmith shop. The town also had a post office, a school, and a church.
In the early 20th century, Serenada began to decline as the railroad bypassed the town. The population decreased and the town became a small, rural community.
Geography
Serenada is located in Hays County, Texas, about 20 miles southwest of Austin. The town is situated on the banks of the Blanco River, which flows through the area. The terrain is mostly flat, with some rolling hills. The climate is generally mild, with hot summers and mild winters.
Economy
Serenada’s economy is largely based on agriculture. The town is home to several farms, which produce a variety of crops, including cotton, corn, and hay. The town also has a few small businesses, including a grocery store, a gas station, and a few restaurants.
Demographics
As of 2020, the population of Serenada was estimated to be around 1,000. The town is predominantly white, with a small Hispanic population. The median household income is around $50,000, and the median home value is around $150,000.
Conclusion
Serenada is a small, rural community located in Hays County, Texas. The town was founded in 1854 by a group of German immigrants and was once a thriving agricultural community. Today, the town’s economy is largely based on agriculture, and the population is estimated to be around 1,000. Serenada is predominantly white, with a small Hispanic population, and the median household income is around $50,000.
Common Questions
What is Per Capita Income in Serenada?
Per Capita income in Serenada is $41,657.
What is the Median Family Income in Serenada?
Median Family Income in Serenada is $91,563.
What is the Median Household income in Serenada?
Median Household Income in Serenada is $84,792.
What is Income or Wage Gap in Serenada?
Income or Wage Gap in Serenada is 60.2%.
Women in Serenada earn 39.8 cents for every dollar earned by a man.
What is Inequality or Gini Index in Serenada?
Inequality or Gini Index in Serenada is 0.29.
What is the Total Population of Serenada?
Total Population of Serenada is 1,695.
What is the Total Male Population of Serenada?
Total Male Population of Serenada is 820.
What is the Total Female Population of Serenada?
Total Female Population of Serenada is 875.
What is the Ratio of Males per 100 Females in Serenada?
There are 93.71 Males per 100 Females in Serenada.
What is the Ratio of Females per 100 Males in Serenada?
There are 106.71 Females per 100 Males in Serenada.
What is the Median Population Age in Serenada?
Median Population Age in Serenada is 49.7 Years.
What is the Average Family Size in Serenada
Average Family Size in Serenada is 2.7 People.
What is the Average Household Size in Serenada
Average Household Size in Serenada is 2.5 People.
How Large is the Labor Force in Serenada?
There are 903 People in the Labor Forcein in Serenada.
What is the Percentage of People in the Labor Force in Serenada?
60.5% of People are in the Labor Force in Serenada.
What is the Unemployment Rate in Serenada?
Unemployment Rate in Serenada is 3.1%.