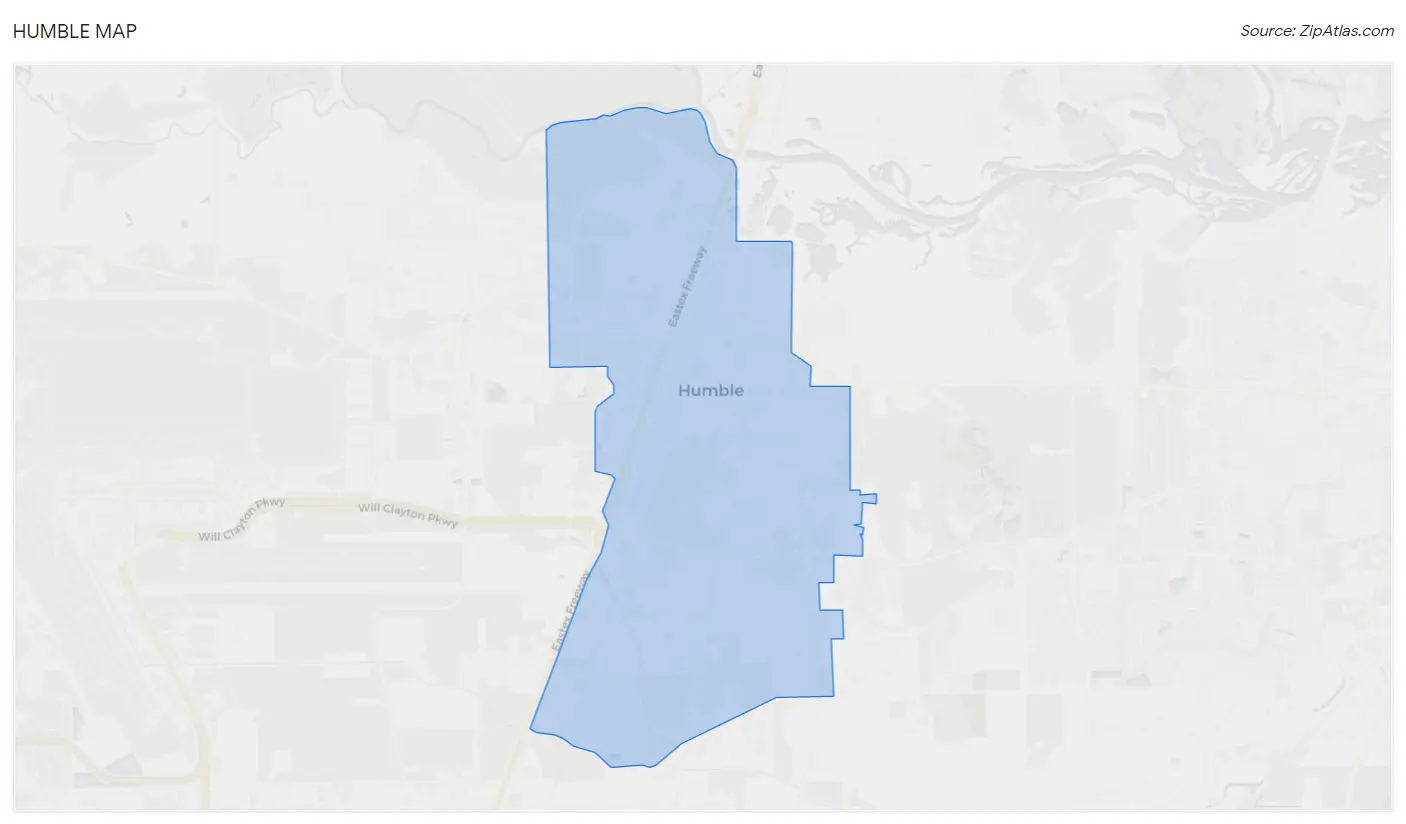
Humble, TX Map & Demographics
Humble Map
Humble Overview
$27,242
PER CAPITA INCOME
$74,538
AVG FAMILY INCOME
$58,581
AVG HOUSEHOLD INCOME
24.9%
WAGE / INCOME GAP [ % ]
75.1¢/ $1
WAGE / INCOME GAP [ $ ]
$7,768
FAMILY INCOME DEFICIT
0.41
INEQUALITY / GINI INDEX
16,563
TOTAL POPULATION
7,729
MALE POPULATION
8,834
FEMALE POPULATION
87.49
MALES / 100 FEMALES
114.30
FEMALES / 100 MALES
33.5
MEDIAN AGE
3.5
AVG FAMILY SIZE
2.6
AVG HOUSEHOLD SIZE
8,574
LABOR FORCE [ PEOPLE ]
66.7%
PERCENT IN LABOR FORCE
6.1%
UNEMPLOYMENT RATE
Income in Humble
Income Overview in Humble
Per Capita Income in Humble is $27,242, while median incomes of families and households are $74,538 and $58,581 respectively.
| Characteristic | Number | Measure |
| Per Capita Income | 16,563 | $27,242 |
| Median Family Income | 3,524 | $74,538 |
| Mean Family Income | 3,524 | $84,084 |
| Median Household Income | 6,347 | $58,581 |
| Mean Household Income | 6,347 | $68,846 |
| Income Deficit | 3,524 | $7,768 |
| Wage / Income Gap (%) | 16,563 | 24.91% |
| Wage / Income Gap ($) | 16,563 | 75.09¢ per $1 |
| Gini / Inequality Index | 16,563 | 0.41 |
Earnings by Sex in Humble
Average Earnings in Humble are $33,743, $37,122 for men and $27,876 for women, a difference of 24.9%.
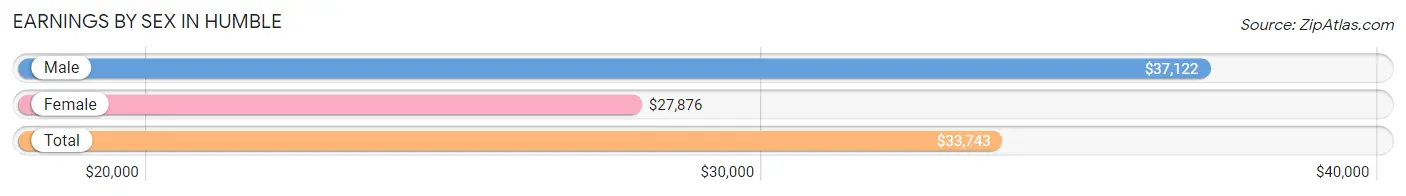
| Sex | Number | Average Earnings |
| Male | 4,862 (56.7%) | $37,122 |
| Female | 3,720 (43.3%) | $27,876 |
| Total | 8,582 (100.0%) | $33,743 |
Earnings by Sex by Income Bracket in Humble
The most common earnings brackets in Humble are $75,000 to $99,999 for men (568 | 11.7%) and $55,000 to $64,999 for women (290 | 7.8%).
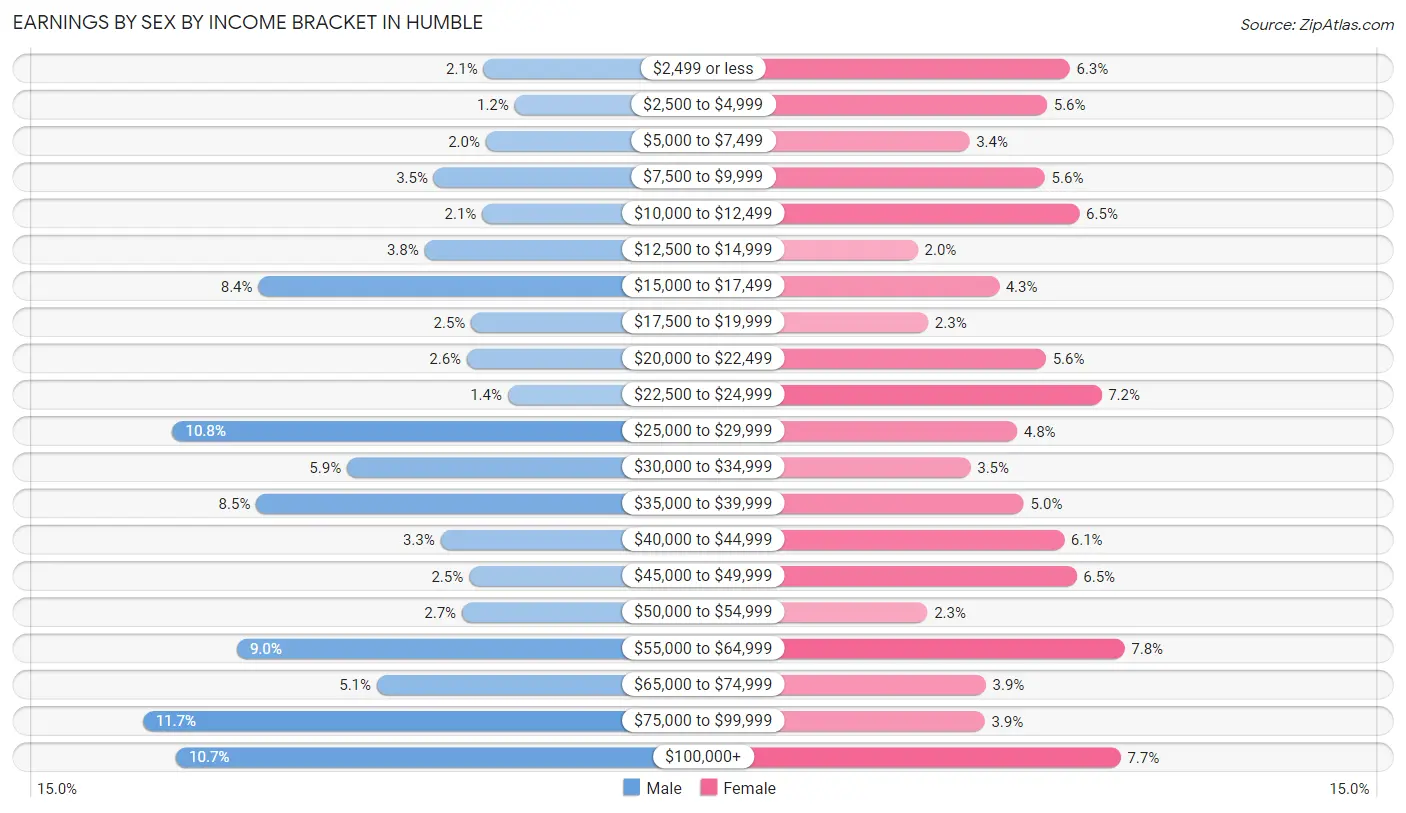
| Income | Male | Female |
| $2,499 or less | 102 (2.1%) | 233 (6.3%) |
| $2,500 to $4,999 | 60 (1.2%) | 209 (5.6%) |
| $5,000 to $7,499 | 99 (2.0%) | 128 (3.4%) |
| $7,500 to $9,999 | 170 (3.5%) | 207 (5.6%) |
| $10,000 to $12,499 | 104 (2.1%) | 243 (6.5%) |
| $12,500 to $14,999 | 183 (3.8%) | 74 (2.0%) |
| $15,000 to $17,499 | 410 (8.4%) | 159 (4.3%) |
| $17,500 to $19,999 | 119 (2.5%) | 85 (2.3%) |
| $20,000 to $22,499 | 125 (2.6%) | 208 (5.6%) |
| $22,500 to $24,999 | 69 (1.4%) | 266 (7.1%) |
| $25,000 to $29,999 | 527 (10.8%) | 178 (4.8%) |
| $30,000 to $34,999 | 289 (5.9%) | 129 (3.5%) |
| $35,000 to $39,999 | 413 (8.5%) | 185 (5.0%) |
| $40,000 to $44,999 | 161 (3.3%) | 227 (6.1%) |
| $45,000 to $49,999 | 122 (2.5%) | 240 (6.5%) |
| $50,000 to $54,999 | 132 (2.7%) | 84 (2.3%) |
| $55,000 to $64,999 | 439 (9.0%) | 290 (7.8%) |
| $65,000 to $74,999 | 248 (5.1%) | 145 (3.9%) |
| $75,000 to $99,999 | 568 (11.7%) | 144 (3.9%) |
| $100,000+ | 522 (10.7%) | 286 (7.7%) |
| Total | 4,862 (100.0%) | 3,720 (100.0%) |
Earnings by Sex by Educational Attainment in Humble
Average earnings in Humble are $39,555 for men and $35,405 for women, a difference of 10.5%. Men with an educational attainment of bachelor's degree enjoy the highest average annual earnings of $78,994, while those with college or associate's degree education earn the least with $31,335. Women with an educational attainment of bachelor's degree earn the most with the average annual earnings of $115,288, while those with less than high school education have the smallest earnings of $23,613.
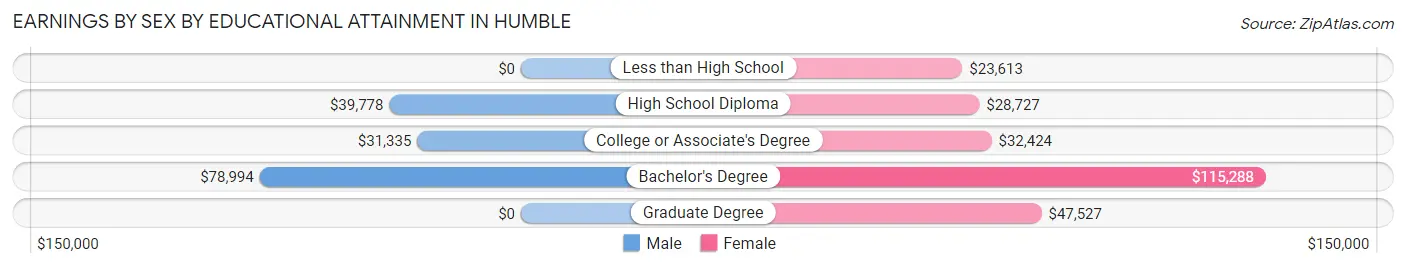
| Educational Attainment | Male Income | Female Income |
| Less than High School | - | - |
| High School Diploma | $39,778 | $28,727 |
| College or Associate's Degree | $31,335 | $32,424 |
| Bachelor's Degree | $78,994 | $115,288 |
| Graduate Degree | - | - |
| Total | $39,555 | $35,405 |
Family Income in Humble
Family Income Brackets in Humble
According to the Humble family income data, there are 941 families falling into the $100,000 to $149,999 income range, which is the most common income bracket and makes up 26.7% of all families. Conversely, the $200,000+ income bracket is the least frequent group with only 92 families (2.6%) belonging to this category.
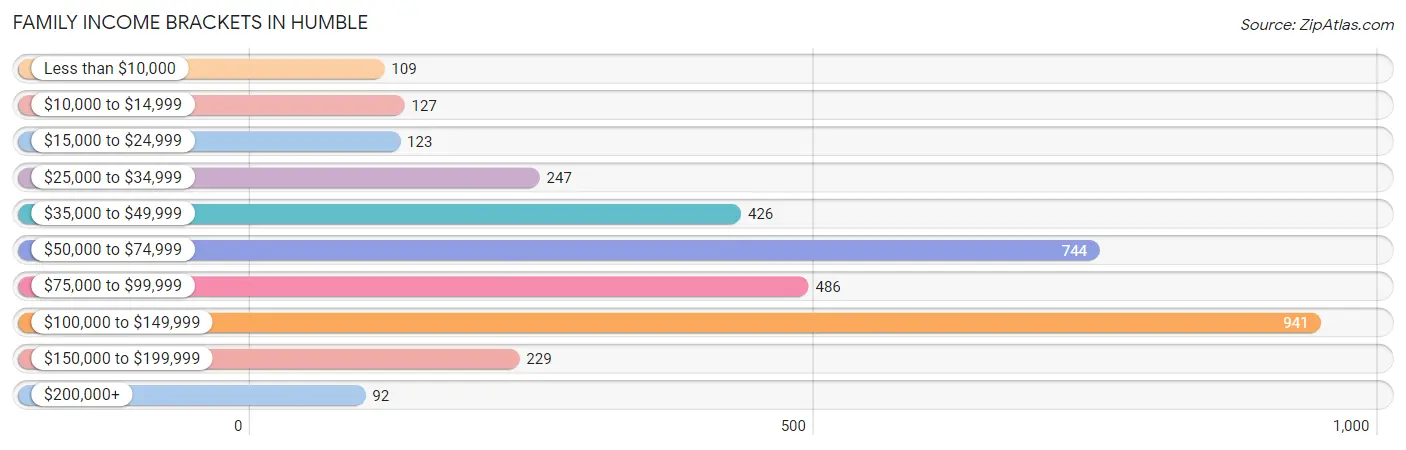
| Income Bracket | # Families | % Families |
| Less than $10,000 | 109 | 3.1% |
| $10,000 to $14,999 | 127 | 3.6% |
| $15,000 to $24,999 | 123 | 3.5% |
| $25,000 to $34,999 | 247 | 7.0% |
| $35,000 to $49,999 | 426 | 12.1% |
| $50,000 to $74,999 | 744 | 21.1% |
| $75,000 to $99,999 | 486 | 13.8% |
| $100,000 to $149,999 | 941 | 26.7% |
| $150,000 to $199,999 | 229 | 6.5% |
| $200,000+ | 92 | 2.6% |
Family Income by Famaliy Size in Humble
5-person families (451 | 12.8%) account for the highest median family income in Humble with $94,503 per family, while 2-person families (1,117 | 31.7%) have the highest median income of $34,516 per family member.
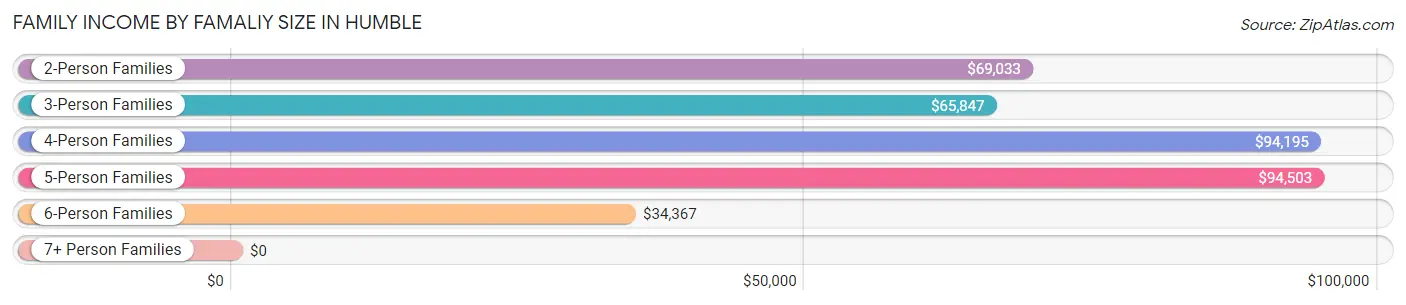
| Income Bracket | # Families | Median Income |
| 2-Person Families | 1,117 (31.7%) | $69,033 |
| 3-Person Families | 773 (21.9%) | $65,847 |
| 4-Person Families | 919 (26.1%) | $94,195 |
| 5-Person Families | 451 (12.8%) | $94,503 |
| 6-Person Families | 231 (6.6%) | $34,367 |
| 7+ Person Families | 33 (0.9%) | $0 |
| Total | 3,524 (100.0%) | $74,538 |
Family Income by Number of Earners in Humble
The median family income in Humble is $74,538, with families comprising 3+ earners (461) having the highest median family income of $114,525, while families with no earners (206) have the lowest median family income of $55,326, accounting for 13.1% and 5.9% of families, respectively.
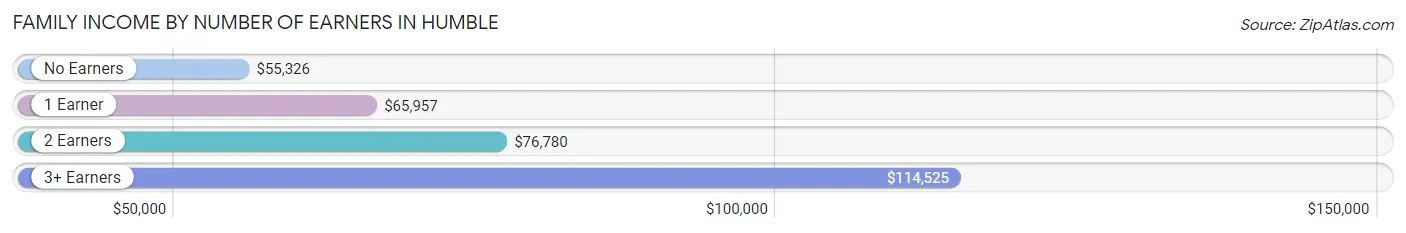
| Number of Earners | # Families | Median Income |
| No Earners | 206 (5.9%) | $55,326 |
| 1 Earner | 1,661 (47.1%) | $65,957 |
| 2 Earners | 1,196 (33.9%) | $76,780 |
| 3+ Earners | 461 (13.1%) | $114,525 |
| Total | 3,524 (100.0%) | $74,538 |
Household Income in Humble
Household Income Brackets in Humble
With 1,282 households falling in the category, the $50,000 to $74,999 income range is the most frequent in Humble, accounting for 20.2% of all households. In contrast, only 102 households (1.6%) fall into the $200,000+ income bracket, making it the least populous group.
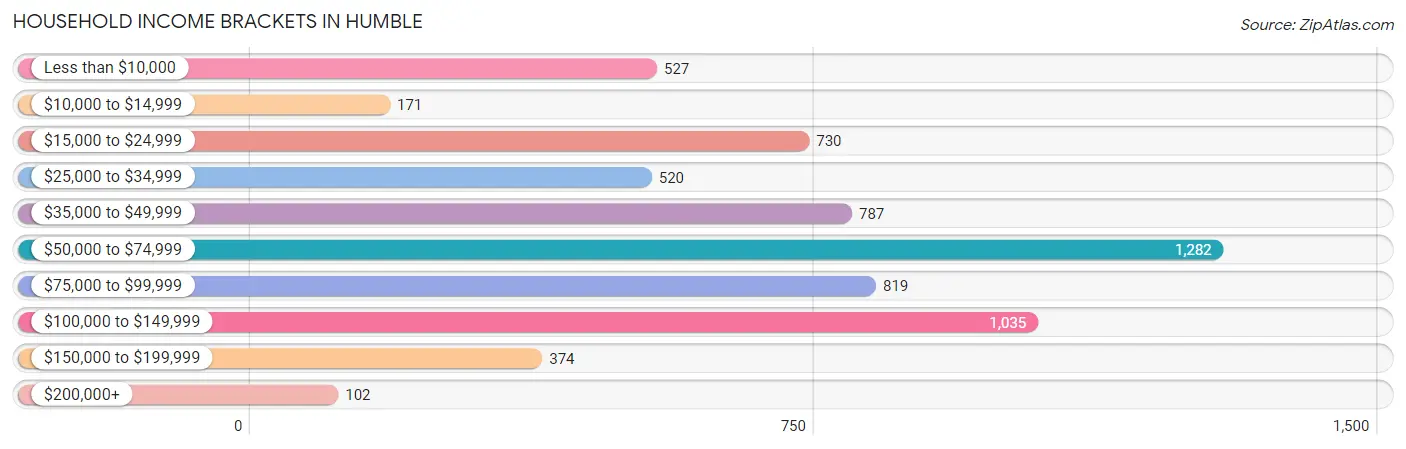
| Income Bracket | # Households | % Households |
| Less than $10,000 | 527 | 8.3% |
| $10,000 to $14,999 | 171 | 2.7% |
| $15,000 to $24,999 | 730 | 11.5% |
| $25,000 to $34,999 | 520 | 8.2% |
| $35,000 to $49,999 | 787 | 12.4% |
| $50,000 to $74,999 | 1,282 | 20.2% |
| $75,000 to $99,999 | 819 | 12.9% |
| $100,000 to $149,999 | 1,035 | 16.3% |
| $150,000 to $199,999 | 374 | 5.9% |
| $200,000+ | 102 | 1.6% |
Household Income by Householder Age in Humble
The median household income in Humble is $58,581, with the highest median household income of $64,495 found in the 45 to 64 years age bracket for the primary householder. A total of 2,383 households (37.6%) fall into this category. Meanwhile, the 15 to 24 years age bracket for the primary householder has the lowest median household income of $18,950, with 279 households (4.4%) in this group.
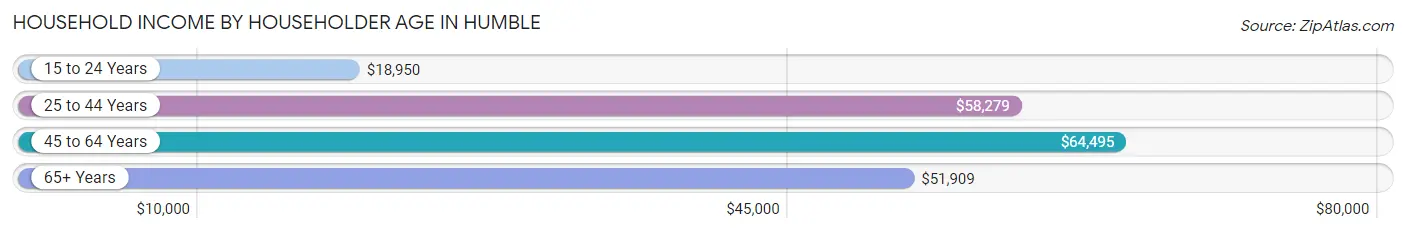
| Income Bracket | # Households | Median Income |
| 15 to 24 Years | 279 (4.4%) | $18,950 |
| 25 to 44 Years | 2,385 (37.6%) | $58,279 |
| 45 to 64 Years | 2,383 (37.6%) | $64,495 |
| 65+ Years | 1,300 (20.5%) | $51,909 |
| Total | 6,347 (100.0%) | $58,581 |
Poverty in Humble
Income Below Poverty by Sex and Age in Humble
With 12.1% poverty level for males and 22.0% for females among the residents of Humble, 12 to 14 year old males and 15 year old females are the most vulnerable to poverty, with 198 males (54.4%) and 194 females (55.6%) in their respective age groups living below the poverty level.
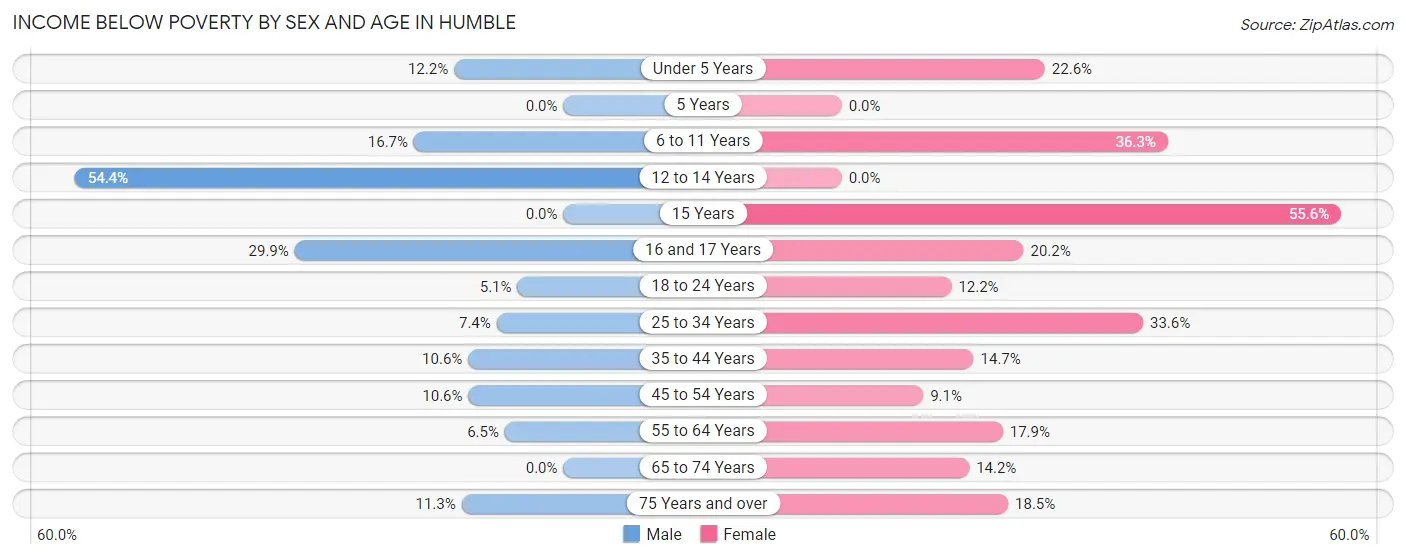
| Age Bracket | Male | Female |
| Under 5 Years | 47 (12.2%) | 57 (22.6%) |
| 5 Years | 0 (0.0%) | 0 (0.0%) |
| 6 to 11 Years | 140 (16.7%) | 376 (36.3%) |
| 12 to 14 Years | 198 (54.4%) | 0 (0.0%) |
| 15 Years | 0 (0.0%) | 194 (55.6%) |
| 16 and 17 Years | 82 (29.9%) | 101 (20.2%) |
| 18 to 24 Years | 34 (5.1%) | 83 (12.2%) |
| 25 to 34 Years | 105 (7.4%) | 509 (33.6%) |
| 35 to 44 Years | 119 (10.6%) | 112 (14.7%) |
| 45 to 54 Years | 117 (10.6%) | 99 (9.1%) |
| 55 to 64 Years | 39 (6.5%) | 165 (17.9%) |
| 65 to 74 Years | 0 (0.0%) | 106 (14.2%) |
| 75 Years and over | 44 (11.3%) | 75 (18.5%) |
| Total | 925 (12.1%) | 1,877 (22.0%) |
Income Above Poverty by Sex and Age in Humble
According to the poverty statistics in Humble, males aged 5 years and females aged 5 years are the age groups that are most secure financially, with 100.0% of males and 100.0% of females in these age groups living above the poverty line.
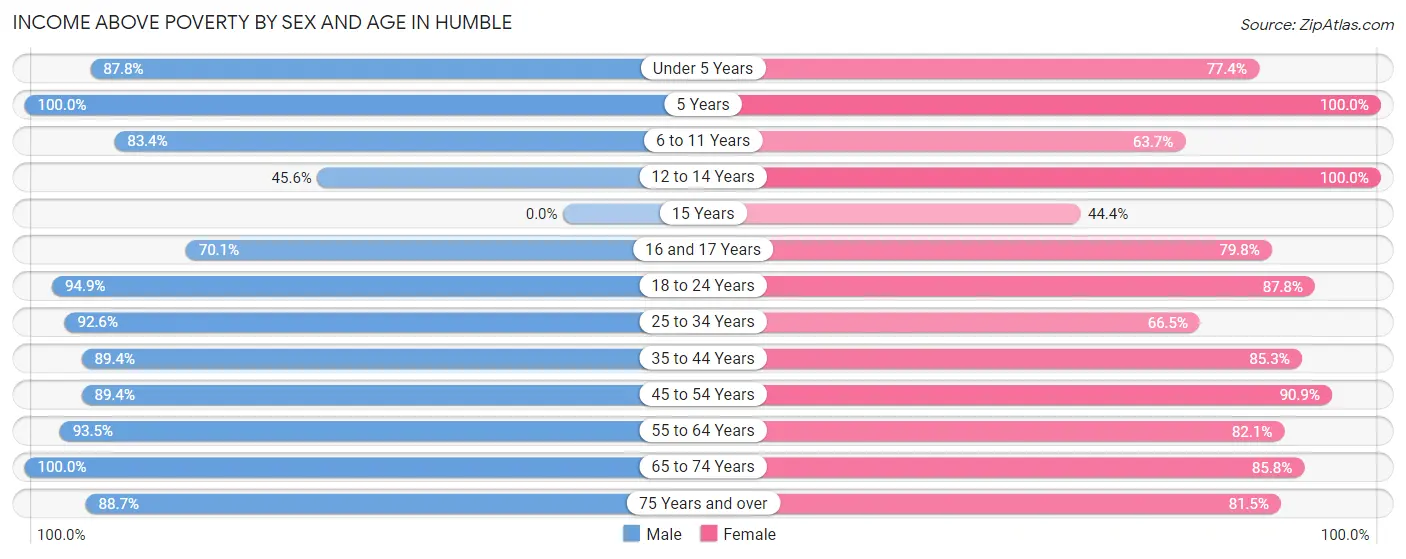
| Age Bracket | Male | Female |
| Under 5 Years | 339 (87.8%) | 195 (77.4%) |
| 5 Years | 98 (100.0%) | 26 (100.0%) |
| 6 to 11 Years | 701 (83.4%) | 660 (63.7%) |
| 12 to 14 Years | 166 (45.6%) | 235 (100.0%) |
| 15 Years | 0 (0.0%) | 155 (44.4%) |
| 16 and 17 Years | 192 (70.1%) | 398 (79.8%) |
| 18 to 24 Years | 630 (94.9%) | 597 (87.8%) |
| 25 to 34 Years | 1,308 (92.6%) | 1,008 (66.4%) |
| 35 to 44 Years | 1,004 (89.4%) | 651 (85.3%) |
| 45 to 54 Years | 989 (89.4%) | 992 (90.9%) |
| 55 to 64 Years | 559 (93.5%) | 755 (82.1%) |
| 65 to 74 Years | 416 (100.0%) | 641 (85.8%) |
| 75 Years and over | 344 (88.7%) | 330 (81.5%) |
| Total | 6,746 (87.9%) | 6,643 (78.0%) |
Income Below Poverty Among Married-Couple Families in Humble
The poverty statistics for married-couple families in Humble show that 8.4% or 178 of the total 2,130 families live below the poverty line. Families with 3 or 4 children have the highest poverty rate of 37.4%, comprising of 135 families. On the other hand, families with 1 or 2 children have the lowest poverty rate of 0.0%, which includes 0 families.
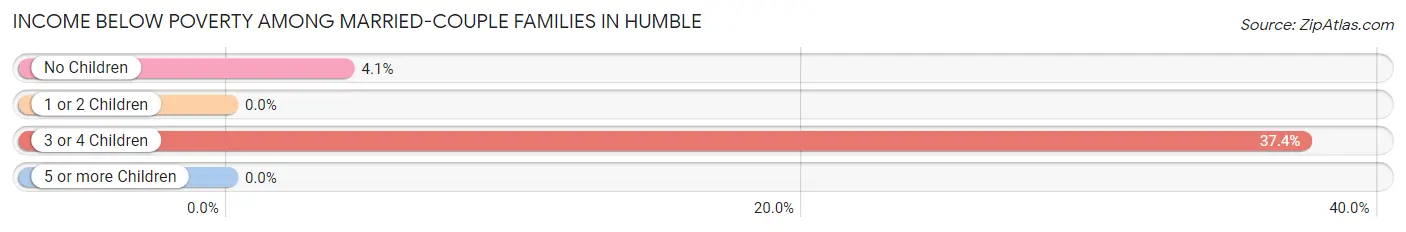
| Children | Above Poverty | Below Poverty |
| No Children | 1,016 (95.9%) | 43 (4.1%) |
| 1 or 2 Children | 710 (100.0%) | 0 (0.0%) |
| 3 or 4 Children | 226 (62.6%) | 135 (37.4%) |
| 5 or more Children | 0 (0.0%) | 0 (0.0%) |
| Total | 1,952 (91.6%) | 178 (8.4%) |
Income Below Poverty Among Single-Parent Households in Humble
| Children | Single Father | Single Mother |
| No Children | 0 (0.0%) | 68 (24.5%) |
| 1 or 2 Children | 0 (0.0%) | 164 (25.0%) |
| 3 or 4 Children | 0 (0.0%) | 115 (51.3%) |
| 5 or more Children | 0 (0.0%) | 0 (0.0%) |
| Total | 0 (0.0%) | 347 (30.0%) |
Income Below Poverty Among Married-Couple vs Single-Parent Households in Humble
The poverty data for Humble shows that 178 of the married-couple family households (8.4%) and 347 of the single-parent households (24.9%) are living below the poverty level. Within the married-couple family households, those with 3 or 4 children have the highest poverty rate, with 135 households (37.4%) falling below the poverty line. Among the single-parent households, those with 3 or 4 children have the highest poverty rate, with 115 household (51.3%) living below poverty.
| Children | Married-Couple Families | Single-Parent Households |
| No Children | 43 (4.1%) | 68 (17.5%) |
| 1 or 2 Children | 0 (0.0%) | 164 (21.0%) |
| 3 or 4 Children | 135 (37.4%) | 115 (51.3%) |
| 5 or more Children | 0 (0.0%) | 0 (0.0%) |
| Total | 178 (8.4%) | 347 (24.9%) |
Race in Humble
The most populous races in Humble are Hispanic or Latino (8,227 | 49.7%), White / Caucasian (7,574 | 45.7%), and Black / African American (4,219 | 25.5%).
| Race | # Population | % Population |
| Asian | 217 | 1.3% |
| Black / African American | 4,219 | 25.5% |
| Hawaiian / Pacific | 119 | 0.7% |
| Hispanic or Latino | 8,227 | 49.7% |
| Native / Alaskan | 25 | 0.2% |
| White / Caucasian | 7,574 | 45.7% |
| Two or more Races | 2,927 | 17.7% |
| Some other Race | 1,482 | 8.9% |
| Total | 16,563 | 100.0% |
Ancestry in Humble
The most populous ancestries reported in Humble are Mexican (6,501 | 39.3%), English (1,252 | 7.6%), German (903 | 5.4%), Central American (876 | 5.3%), and Salvadoran (636 | 3.8%), together accounting for 61.4% of all Humble residents.
| Ancestry | # Population | % Population |
| African | 40 | 0.2% |
| American | 533 | 3.2% |
| Bahamian | 21 | 0.1% |
| British | 14 | 0.1% |
| Cajun | 22 | 0.1% |
| Canadian | 49 | 0.3% |
| Celtic | 34 | 0.2% |
| Central American | 876 | 5.3% |
| Central American Indian | 25 | 0.2% |
| Cuban | 19 | 0.1% |
| Czech | 50 | 0.3% |
| Dominican | 26 | 0.2% |
| Ecuadorian | 45 | 0.3% |
| English | 1,252 | 7.6% |
| French | 211 | 1.3% |
| French Canadian | 36 | 0.2% |
| German | 903 | 5.4% |
| Guamanian / Chamorro | 24 | 0.1% |
| Honduran | 213 | 1.3% |
| Indian (Asian) | 105 | 0.6% |
| Irish | 522 | 3.2% |
| Italian | 29 | 0.2% |
| Jamaican | 90 | 0.5% |
| Korean | 52 | 0.3% |
| Laotian | 46 | 0.3% |
| Mexican | 6,501 | 39.3% |
| Nigerian | 6 | 0.0% |
| Norwegian | 39 | 0.2% |
| Panamanian | 27 | 0.2% |
| Peruvian | 10 | 0.1% |
| Polish | 103 | 0.6% |
| Pueblo | 12 | 0.1% |
| Puerto Rican | 255 | 1.5% |
| Salvadoran | 636 | 3.8% |
| Scandinavian | 18 | 0.1% |
| Scotch-Irish | 157 | 0.9% |
| Scottish | 101 | 0.6% |
| South American | 55 | 0.3% |
| Sri Lankan | 24 | 0.1% |
| Subsaharan African | 46 | 0.3% |
| Swedish | 84 | 0.5% |
| Thai | 19 | 0.1% | View All 42 Rows |
Immigrants in Humble
The most numerous immigrant groups reported in Humble came from Latin America (2,477 | 15.0%), Central America (2,380 | 14.4%), Mexico (1,888 | 11.4%), Africa (267 | 1.6%), and Cameroon (239 | 1.4%), together accounting for 43.8% of all Humble residents.
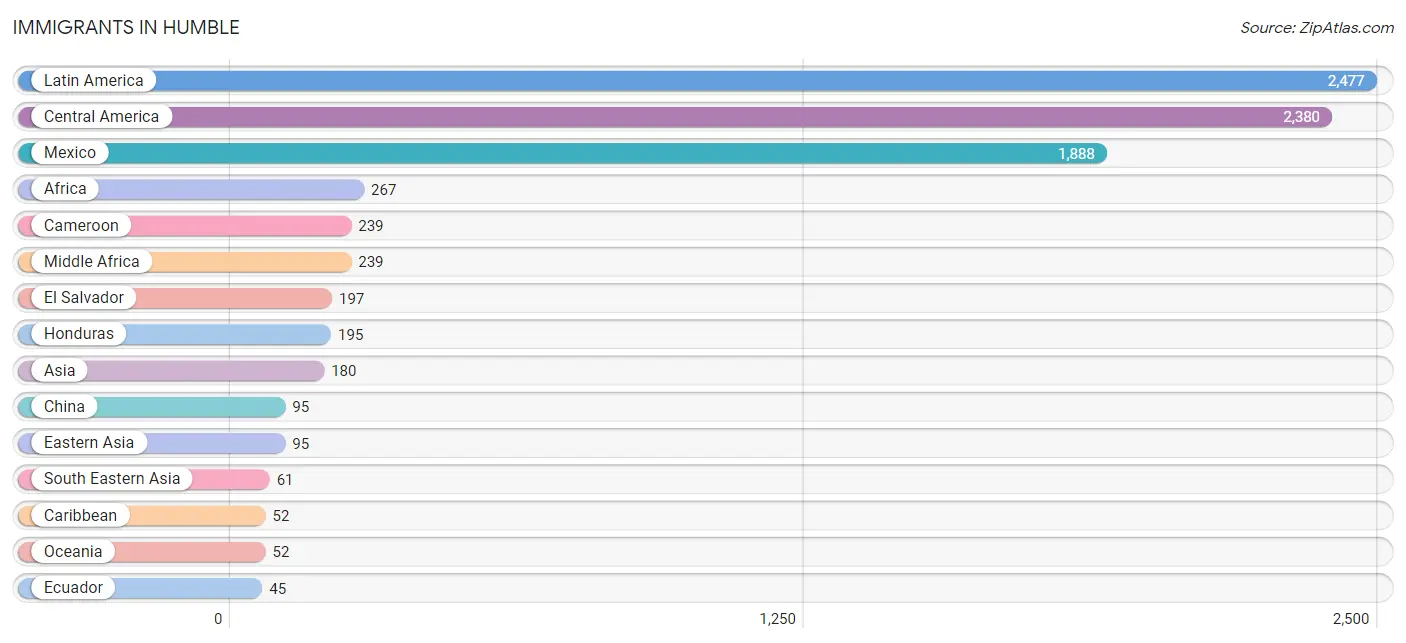
| Immigration Origin | # Population | % Population |
| Africa | 267 | 1.6% |
| Asia | 180 | 1.1% |
| Cameroon | 239 | 1.4% |
| Canada | 21 | 0.1% |
| Caribbean | 52 | 0.3% |
| Central America | 2,380 | 14.4% |
| China | 95 | 0.6% |
| Dominican Republic | 26 | 0.2% |
| Eastern Africa | 22 | 0.1% |
| Eastern Asia | 95 | 0.6% |
| Ecuador | 45 | 0.3% |
| El Salvador | 197 | 1.2% |
| Europe | 21 | 0.1% |
| Germany | 21 | 0.1% |
| Honduras | 195 | 1.2% |
| Indonesia | 22 | 0.1% |
| Jamaica | 26 | 0.2% |
| Kenya | 22 | 0.1% |
| Latin America | 2,477 | 15.0% |
| Mexico | 1,888 | 11.4% |
| Micronesia | 33 | 0.2% |
| Middle Africa | 239 | 1.4% |
| Nigeria | 6 | 0.0% |
| Oceania | 52 | 0.3% |
| Pakistan | 24 | 0.1% |
| Panama | 27 | 0.2% |
| Philippines | 32 | 0.2% |
| South America | 45 | 0.3% |
| South Central Asia | 24 | 0.1% |
| South Eastern Asia | 61 | 0.4% |
| Vietnam | 7 | 0.0% |
| Western Africa | 6 | 0.0% |
| Western Europe | 21 | 0.1% | View All 33 Rows |
Sex and Age in Humble
Sex and Age in Humble
The most populous age groups in Humble are 30 to 34 Years (855 | 11.1%) for men and 30 to 34 Years (1,052 | 11.9%) for women.
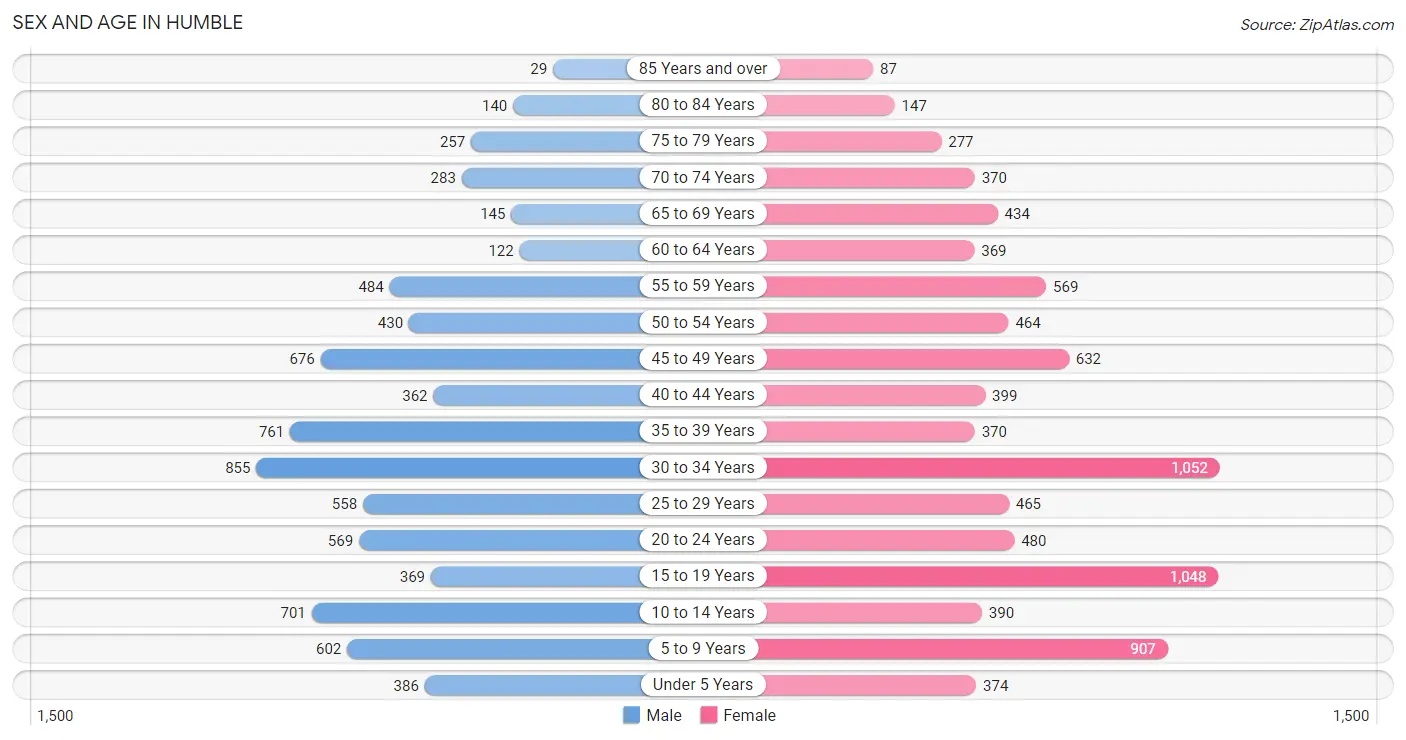
| Age Bracket | Male | Female |
| Under 5 Years | 386 (5.0%) | 374 (4.2%) |
| 5 to 9 Years | 602 (7.8%) | 907 (10.3%) |
| 10 to 14 Years | 701 (9.1%) | 390 (4.4%) |
| 15 to 19 Years | 369 (4.8%) | 1,048 (11.9%) |
| 20 to 24 Years | 569 (7.4%) | 480 (5.4%) |
| 25 to 29 Years | 558 (7.2%) | 465 (5.3%) |
| 30 to 34 Years | 855 (11.1%) | 1,052 (11.9%) |
| 35 to 39 Years | 761 (9.9%) | 370 (4.2%) |
| 40 to 44 Years | 362 (4.7%) | 399 (4.5%) |
| 45 to 49 Years | 676 (8.7%) | 632 (7.1%) |
| 50 to 54 Years | 430 (5.6%) | 464 (5.2%) |
| 55 to 59 Years | 484 (6.3%) | 569 (6.4%) |
| 60 to 64 Years | 122 (1.6%) | 369 (4.2%) |
| 65 to 69 Years | 145 (1.9%) | 434 (4.9%) |
| 70 to 74 Years | 283 (3.7%) | 370 (4.2%) |
| 75 to 79 Years | 257 (3.3%) | 277 (3.1%) |
| 80 to 84 Years | 140 (1.8%) | 147 (1.7%) |
| 85 Years and over | 29 (0.4%) | 87 (1.0%) |
| Total | 7,729 (100.0%) | 8,834 (100.0%) |
Families and Households in Humble
Median Family Size in Humble
The median family size in Humble is 3.53 persons per family, with single female/mother families (1,158 | 32.9%) accounting for the largest median family size of 3.74 persons per family. On the other hand, single male/father families (236 | 6.7%) represent the smallest median family size with 2.61 persons per family.
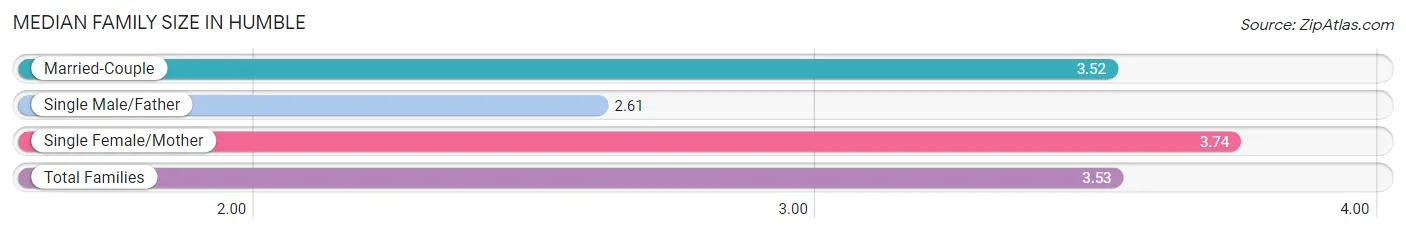
| Family Type | # Families | Family Size |
| Married-Couple | 2,130 (60.4%) | 3.52 |
| Single Male/Father | 236 (6.7%) | 2.61 |
| Single Female/Mother | 1,158 (32.9%) | 3.74 |
| Total Families | 3,524 (100.0%) | 3.53 |
Median Household Size in Humble
The median household size in Humble is 2.57 persons per household, with single female/mother households (1,158 | 18.2%) accounting for the largest median household size of 4.11 persons per household. non-family households (2,823 | 44.5%) represent the smallest median household size with 1.16 persons per household.
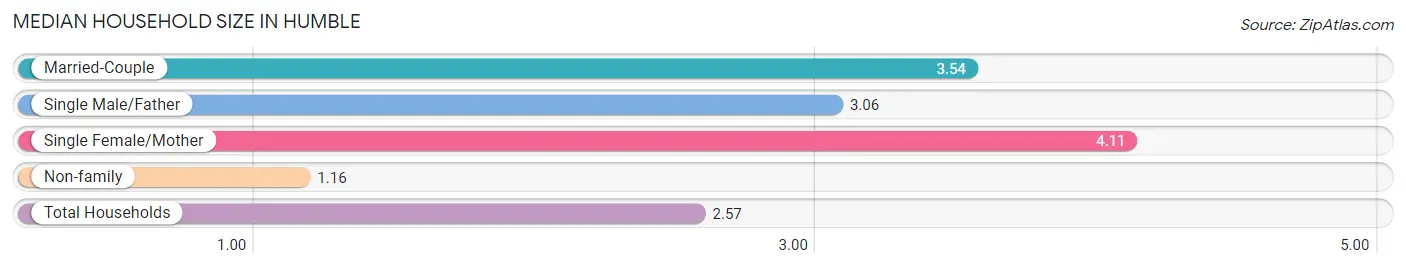
| Household Type | # Households | Household Size |
| Married-Couple | 2,130 (33.6%) | 3.54 |
| Single Male/Father | 236 (3.7%) | 3.06 |
| Single Female/Mother | 1,158 (18.2%) | 4.11 |
| Non-family | 2,823 (44.5%) | 1.16 |
| Total Households | 6,347 (100.0%) | 2.57 |
Household Size by Marriage Status in Humble
Out of a total of 6,347 households in Humble, 3,524 (55.5%) are family households, while 2,823 (44.5%) are nonfamily households. The most numerous type of family households are 4-person households, comprising 1,152, and the most common type of nonfamily households are 1-person households, comprising 2,476.
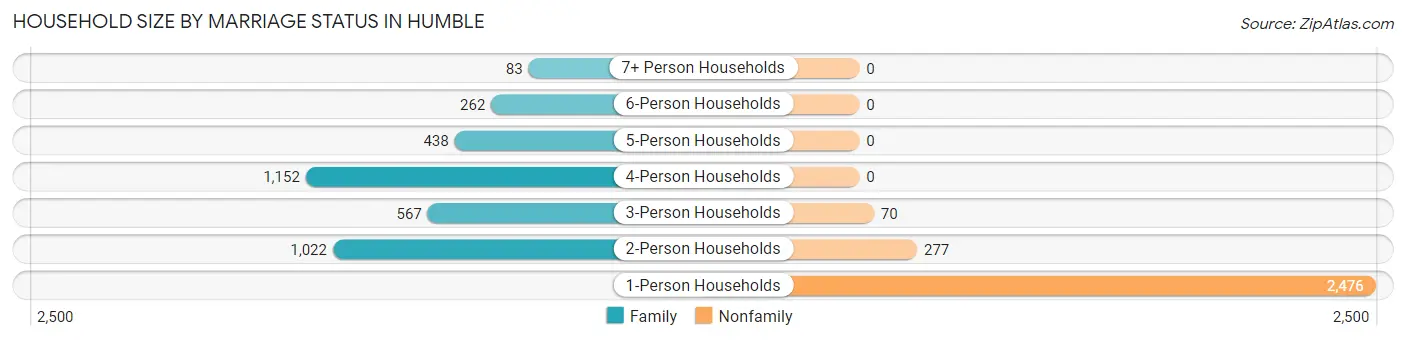
| Household Size | Family Households | Nonfamily Households |
| 1-Person Households | - | 2,476 (39.0%) |
| 2-Person Households | 1,022 (16.1%) | 277 (4.4%) |
| 3-Person Households | 567 (8.9%) | 70 (1.1%) |
| 4-Person Households | 1,152 (18.1%) | 0 (0.0%) |
| 5-Person Households | 438 (6.9%) | 0 (0.0%) |
| 6-Person Households | 262 (4.1%) | 0 (0.0%) |
| 7+ Person Households | 83 (1.3%) | 0 (0.0%) |
| Total | 3,524 (55.5%) | 2,823 (44.5%) |
Female Fertility in Humble
Fertility by Age in Humble
| Age Bracket | Women with Births | Births / 1,000 Women |
| 15 to 19 years | 0 (0.0%) | 0.0 |
| 20 to 34 years | 0 (0.0%) | 0.0 |
| 35 to 50 years | 0 (0.0%) | 0.0 |
| Total | 0 (0.0%) | 0.0 |
Fertility by Age by Marriage Status in Humble
| Age Bracket | Married | Unmarried |
| 15 to 19 years | 0 (0.0%) | 0 (0.0%) |
| 20 to 34 years | 0 (0.0%) | 0 (0.0%) |
| 35 to 50 years | 0 (0.0%) | 0 (0.0%) |
| Total | 0 (0.0%) | 0 (0.0%) |
Fertility by Education in Humble
| Educational Attainment | Women with Births | Births / 1,000 Women |
| Less than High School | 0 (0.0%) | 0.0 |
| High School Diploma | 0 (0.0%) | 0.0 |
| College or Associate's Degree | 0 (0.0%) | 0.0 |
| Bachelor's Degree | 0 (0.0%) | 0.0 |
| Graduate Degree | 0 (0.0%) | 0.0 |
| Total | 0 (0.0%) | 0.0 |
Fertility by Education by Marriage Status in Humble
| Educational Attainment | Married | Unmarried |
| Less than High School | 0 (0.0%) | 0 (0.0%) |
| High School Diploma | 0 (0.0%) | 0 (0.0%) |
| College or Associate's Degree | 0 (0.0%) | 0 (0.0%) |
| Bachelor's Degree | 0 (0.0%) | 0 (0.0%) |
| Graduate Degree | 0 (0.0%) | 0 (0.0%) |
| Total | 0 (0.0%) | 0 (0.0%) |
Employment Characteristics in Humble
Employment by Class of Employer in Humble
Among the 7,742 employed individuals in Humble, private company employees (6,222 | 80.4%), self-employed (not incorporated) (386 | 5.0%), and local government employees (312 | 4.0%) make up the most common classes of employment.
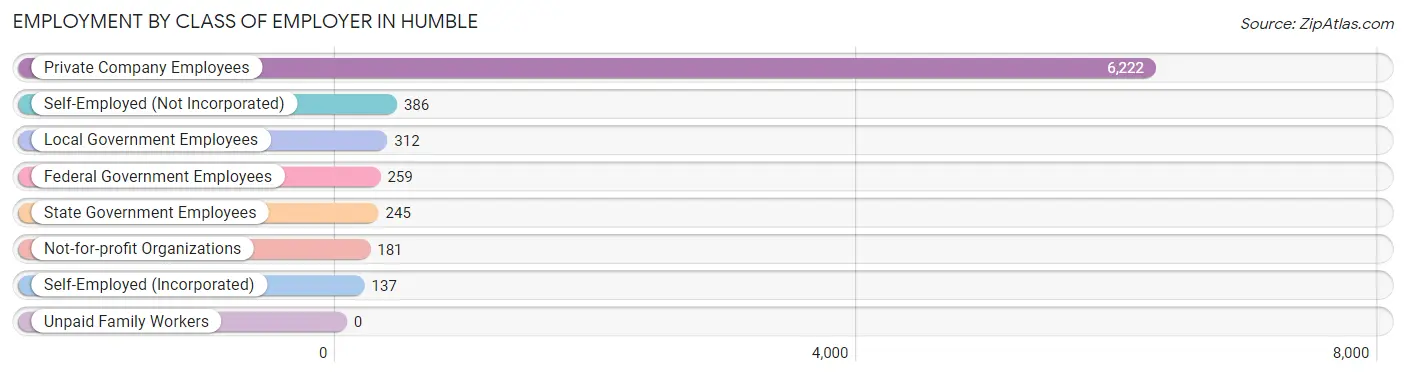
| Employer Class | # Employees | % Employees |
| Private Company Employees | 6,222 | 80.4% |
| Self-Employed (Incorporated) | 137 | 1.8% |
| Self-Employed (Not Incorporated) | 386 | 5.0% |
| Not-for-profit Organizations | 181 | 2.3% |
| Local Government Employees | 312 | 4.0% |
| State Government Employees | 245 | 3.2% |
| Federal Government Employees | 259 | 3.4% |
| Unpaid Family Workers | 0 | 0.0% |
| Total | 7,742 | 100.0% |
Employment Status by Age in Humble
According to the labor force statistics for Humble, out of the total population over 16 years of age (12,854), 66.7% or 8,574 individuals are in the labor force, with 6.1% or 523 of them unemployed. The age group with the highest labor force participation rate is 20 to 24 years, with 94.6% or 992 individuals in the labor force. Within the labor force, the 55 to 59 years age range has the highest percentage of unemployed individuals, with 22.5% or 198 of them being unemployed.
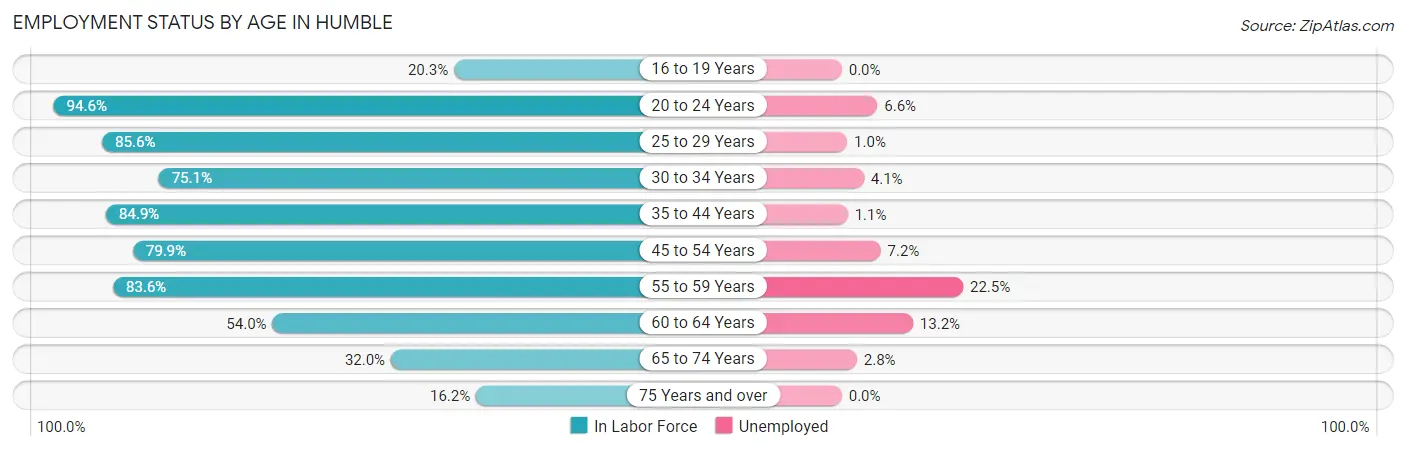
| Age Bracket | In Labor Force | Unemployed |
| 16 to 19 Years | 217 (20.3%) | 0 (0.0%) |
| 20 to 24 Years | 992 (94.6%) | 65 (6.6%) |
| 25 to 29 Years | 876 (85.6%) | 9 (1.0%) |
| 30 to 34 Years | 1,432 (75.1%) | 59 (4.1%) |
| 35 to 44 Years | 1,606 (84.9%) | 18 (1.1%) |
| 45 to 54 Years | 1,759 (79.9%) | 127 (7.2%) |
| 55 to 59 Years | 880 (83.6%) | 198 (22.5%) |
| 60 to 64 Years | 265 (54.0%) | 35 (13.2%) |
| 65 to 74 Years | 394 (32.0%) | 11 (2.8%) |
| 75 Years and over | 152 (16.2%) | 0 (0.0%) |
| Total | 8,574 (66.7%) | 523 (6.1%) |
Employment Status by Educational Attainment in Humble
According to labor force statistics for Humble, 79.6% of individuals (6,820) out of the total population between 25 and 64 years of age (8,568) are in the labor force, with 6.5% or 443 of them being unemployed. The group with the highest labor force participation rate are those with the educational attainment of bachelor's degree or higher, with 86.4% or 825 individuals in the labor force. Within the labor force, individuals with less than high school education have the highest percentage of unemployment, with 14.7% or 134 of them being unemployed.
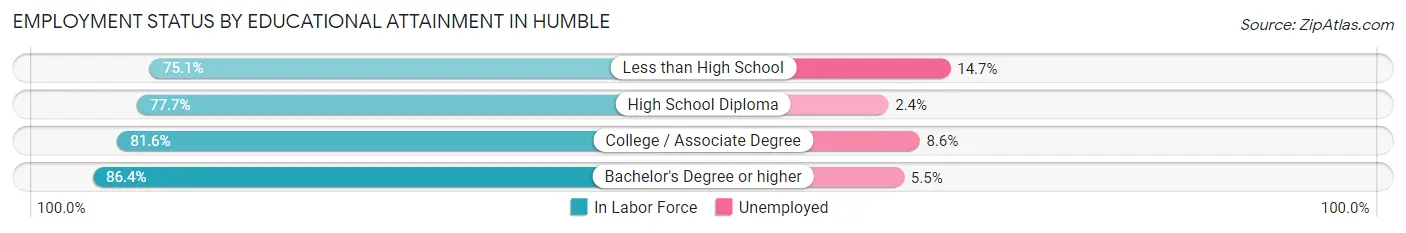
| Educational Attainment | In Labor Force | Unemployed |
| Less than High School | 909 (75.1%) | 178 (14.7%) |
| High School Diploma | 2,757 (77.7%) | 85 (2.4%) |
| College / Associate Degree | 2,330 (81.6%) | 246 (8.6%) |
| Bachelor's Degree or higher | 825 (86.4%) | 53 (5.5%) |
| Total | 6,820 (79.6%) | 557 (6.5%) |
Employment Occupations by Sex in Humble
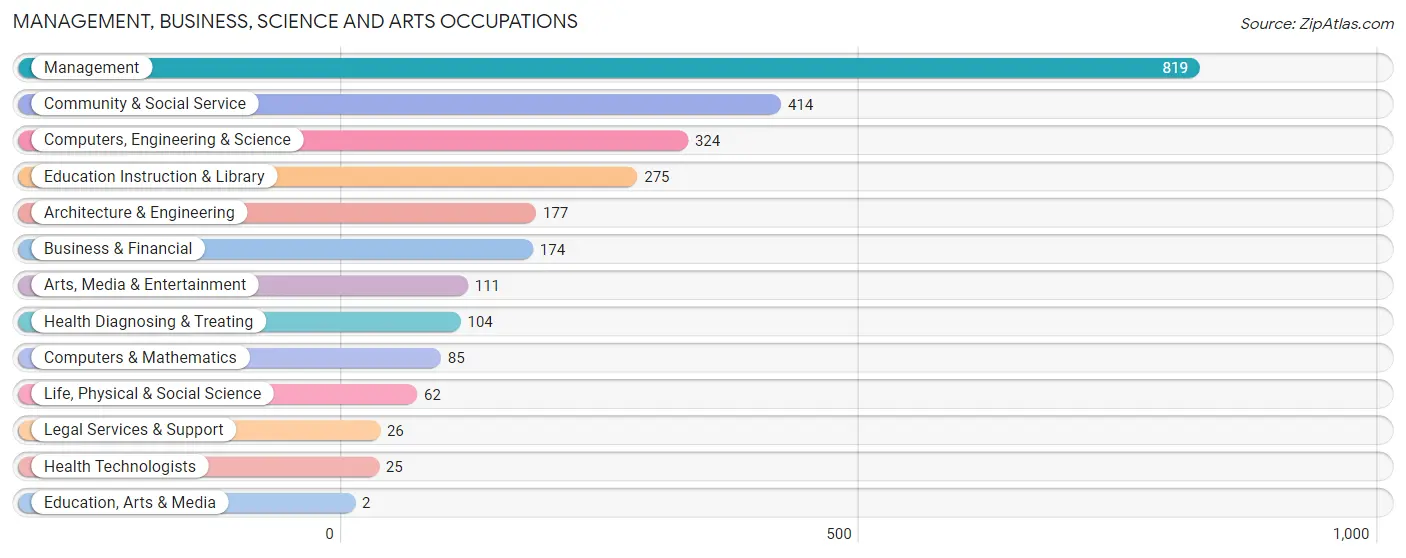
Management, Business, Science and Arts Occupations
The most common Management, Business, Science and Arts occupations in Humble are Management (819 | 10.2%), Community & Social Service (414 | 5.1%), Computers, Engineering & Science (324 | 4.0%), Education Instruction & Library (275 | 3.4%), and Architecture & Engineering (177 | 2.2%).
Management, Business, Science and Arts Occupations by Sex
Within the Management, Business, Science and Arts occupations in Humble, the most male-oriented occupations are Legal Services & Support (100.0%), Management (75.5%), and Life, Physical & Social Science (67.7%), while the most female-oriented occupations are Education, Arts & Media (100.0%), Arts, Media & Entertainment (100.0%), and Health Technologists (100.0%).
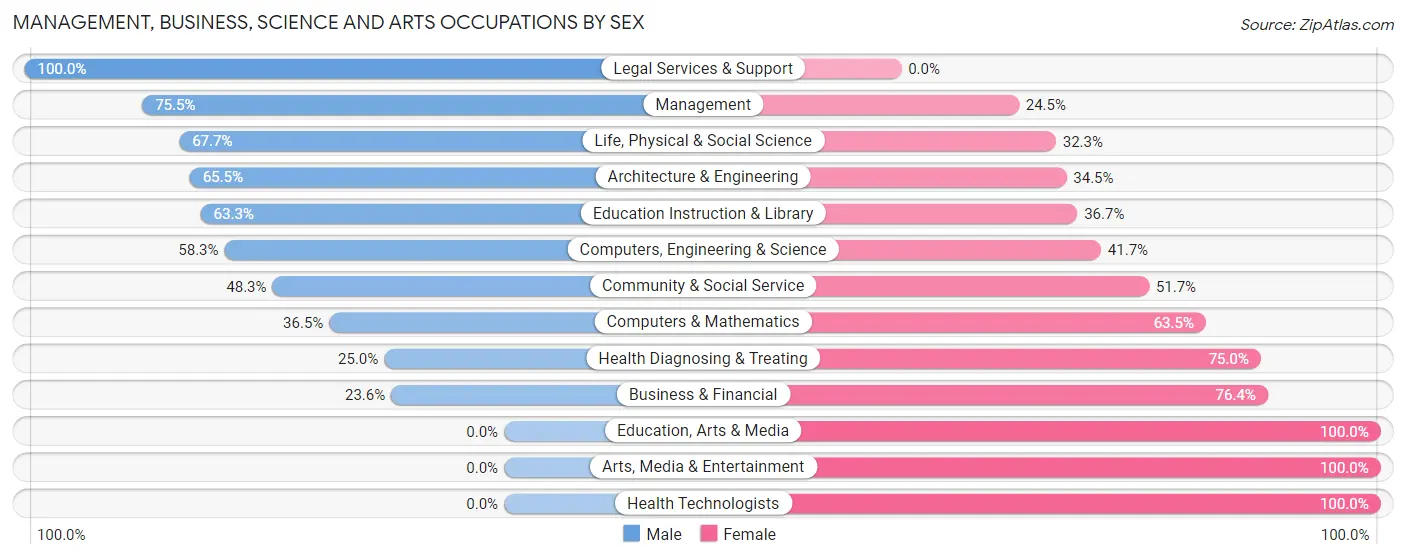
| Occupation | Male | Female |
| Management | 618 (75.5%) | 201 (24.5%) |
| Business & Financial | 41 (23.6%) | 133 (76.4%) |
| Computers, Engineering & Science | 189 (58.3%) | 135 (41.7%) |
| Computers & Mathematics | 31 (36.5%) | 54 (63.5%) |
| Architecture & Engineering | 116 (65.5%) | 61 (34.5%) |
| Life, Physical & Social Science | 42 (67.7%) | 20 (32.3%) |
| Community & Social Service | 200 (48.3%) | 214 (51.7%) |
| Education, Arts & Media | 0 (0.0%) | 2 (100.0%) |
| Legal Services & Support | 26 (100.0%) | 0 (0.0%) |
| Education Instruction & Library | 174 (63.3%) | 101 (36.7%) |
| Arts, Media & Entertainment | 0 (0.0%) | 111 (100.0%) |
| Health Diagnosing & Treating | 26 (25.0%) | 78 (75.0%) |
| Health Technologists | 0 (0.0%) | 25 (100.0%) |
| Total (Category) | 1,074 (58.5%) | 761 (41.5%) |
| Total (Overall) | 4,491 (55.7%) | 3,564 (44.3%) |
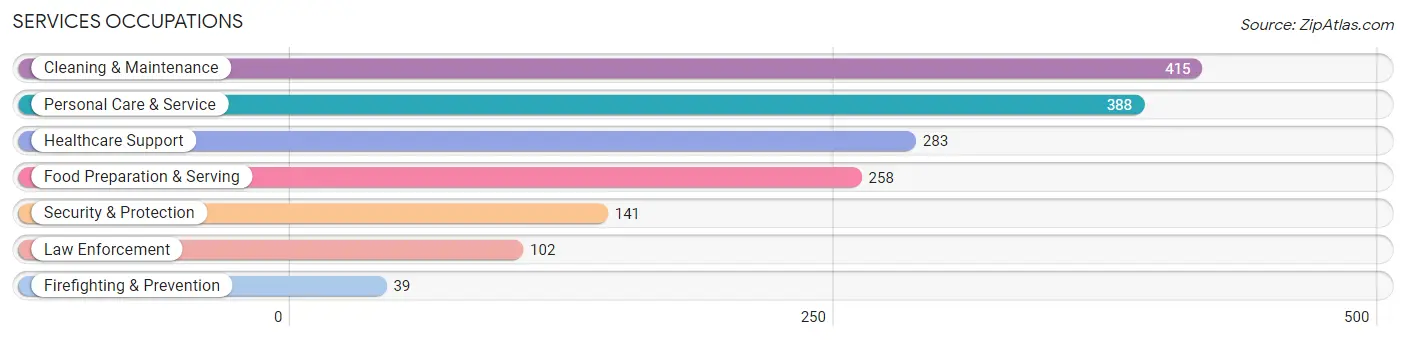
Services Occupations
The most common Services occupations in Humble are Cleaning & Maintenance (415 | 5.1%), Personal Care & Service (388 | 4.8%), Healthcare Support (283 | 3.5%), Food Preparation & Serving (258 | 3.2%), and Security & Protection (141 | 1.8%).
Services Occupations by Sex
Within the Services occupations in Humble, the most male-oriented occupations are Cleaning & Maintenance (61.7%), Food Preparation & Serving (48.1%), and Healthcare Support (15.2%), while the most female-oriented occupations are Security & Protection (100.0%), Firefighting & Prevention (100.0%), and Law Enforcement (100.0%).
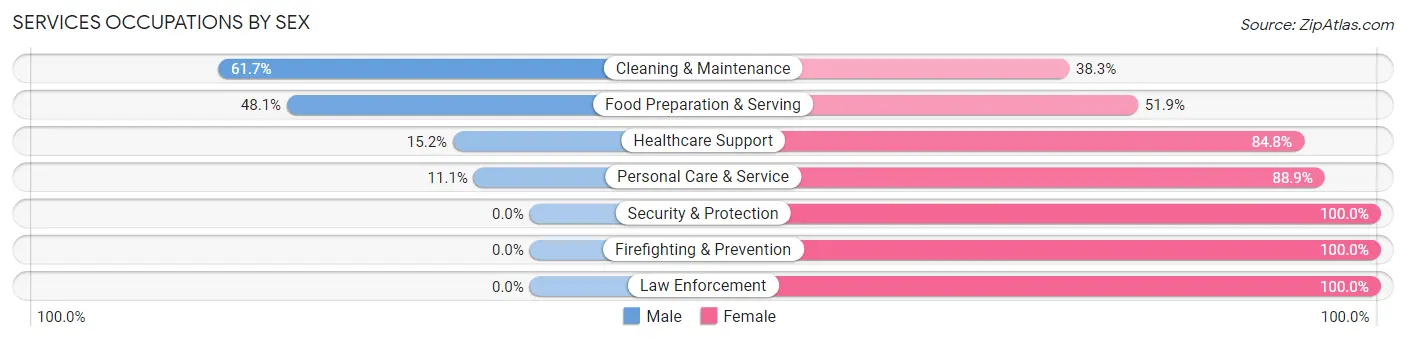
| Occupation | Male | Female |
| Healthcare Support | 43 (15.2%) | 240 (84.8%) |
| Security & Protection | 0 (0.0%) | 141 (100.0%) |
| Firefighting & Prevention | 0 (0.0%) | 39 (100.0%) |
| Law Enforcement | 0 (0.0%) | 102 (100.0%) |
| Food Preparation & Serving | 124 (48.1%) | 134 (51.9%) |
| Cleaning & Maintenance | 256 (61.7%) | 159 (38.3%) |
| Personal Care & Service | 43 (11.1%) | 345 (88.9%) |
| Total (Category) | 466 (31.4%) | 1,019 (68.6%) |
| Total (Overall) | 4,491 (55.7%) | 3,564 (44.3%) |
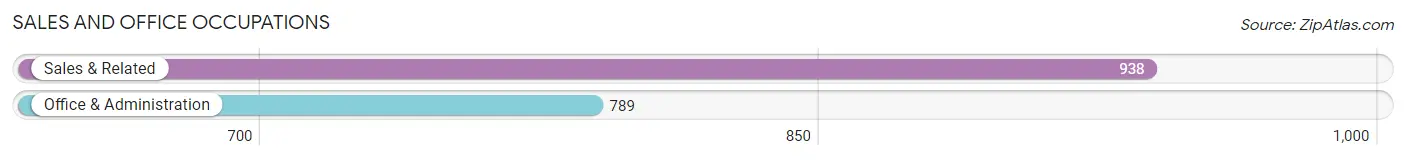
Sales and Office Occupations
The most common Sales and Office occupations in Humble are Sales & Related (938 | 11.6%), and Office & Administration (789 | 9.8%).
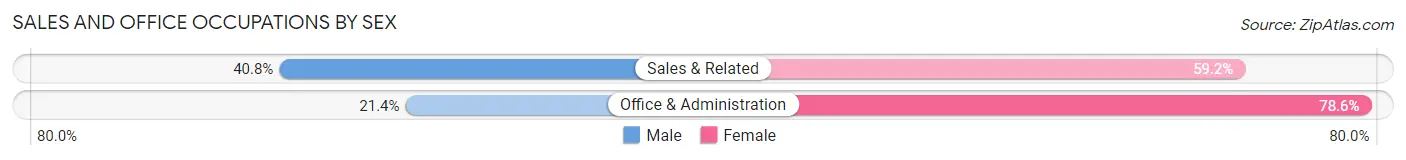
Sales and Office Occupations by Sex
| Occupation | Male | Female |
| Sales & Related | 383 (40.8%) | 555 (59.2%) |
| Office & Administration | 169 (21.4%) | 620 (78.6%) |
| Total (Category) | 552 (32.0%) | 1,175 (68.0%) |
| Total (Overall) | 4,491 (55.7%) | 3,564 (44.3%) |
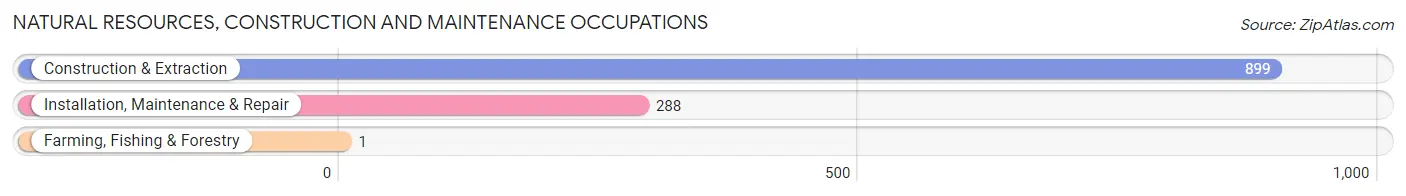
Natural Resources, Construction and Maintenance Occupations
The most common Natural Resources, Construction and Maintenance occupations in Humble are Construction & Extraction (899 | 11.2%), Installation, Maintenance & Repair (288 | 3.6%), and Farming, Fishing & Forestry (1 | 0.0%).
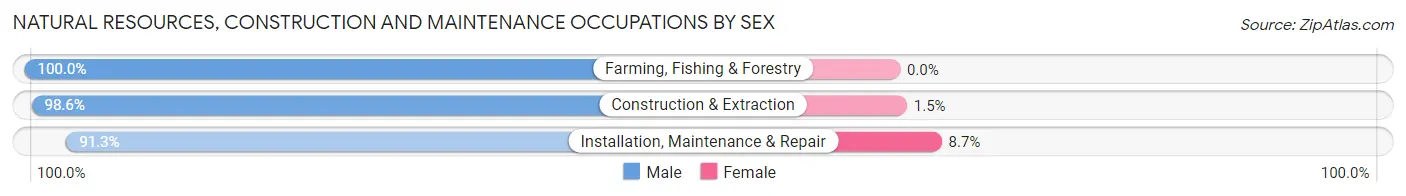
Natural Resources, Construction and Maintenance Occupations by Sex
| Occupation | Male | Female |
| Farming, Fishing & Forestry | 1 (100.0%) | 0 (0.0%) |
| Construction & Extraction | 886 (98.6%) | 13 (1.5%) |
| Installation, Maintenance & Repair | 263 (91.3%) | 25 (8.7%) |
| Total (Category) | 1,150 (96.8%) | 38 (3.2%) |
| Total (Overall) | 4,491 (55.7%) | 3,564 (44.3%) |
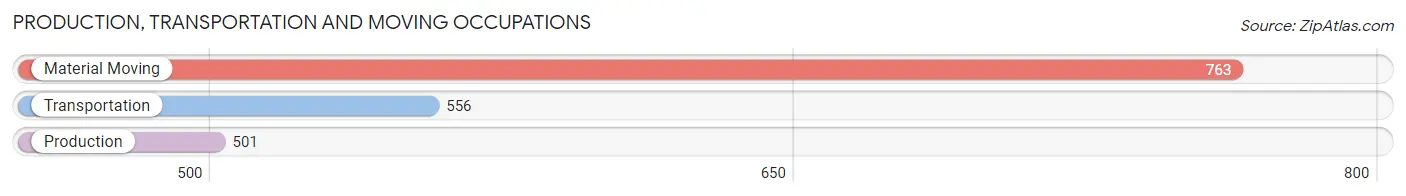
Production, Transportation and Moving Occupations
The most common Production, Transportation and Moving occupations in Humble are Material Moving (763 | 9.5%), Transportation (556 | 6.9%), and Production (501 | 6.2%).
Production, Transportation and Moving Occupations by Sex
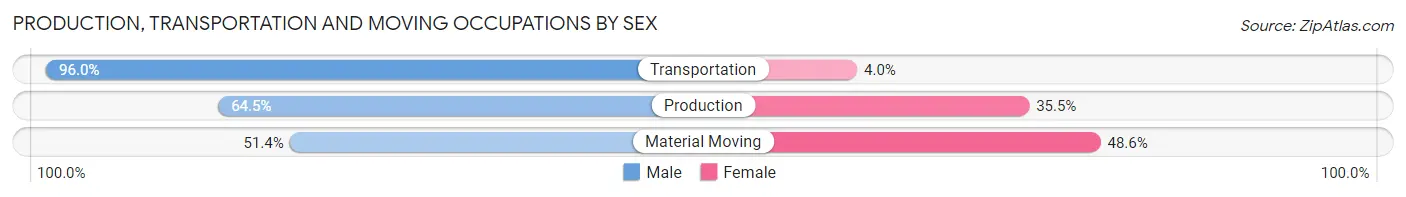
| Occupation | Male | Female |
| Production | 323 (64.5%) | 178 (35.5%) |
| Transportation | 534 (96.0%) | 22 (4.0%) |
| Material Moving | 392 (51.4%) | 371 (48.6%) |
| Total (Category) | 1,249 (68.6%) | 571 (31.4%) |
| Total (Overall) | 4,491 (55.7%) | 3,564 (44.3%) |
Employment Industries by Sex in Humble
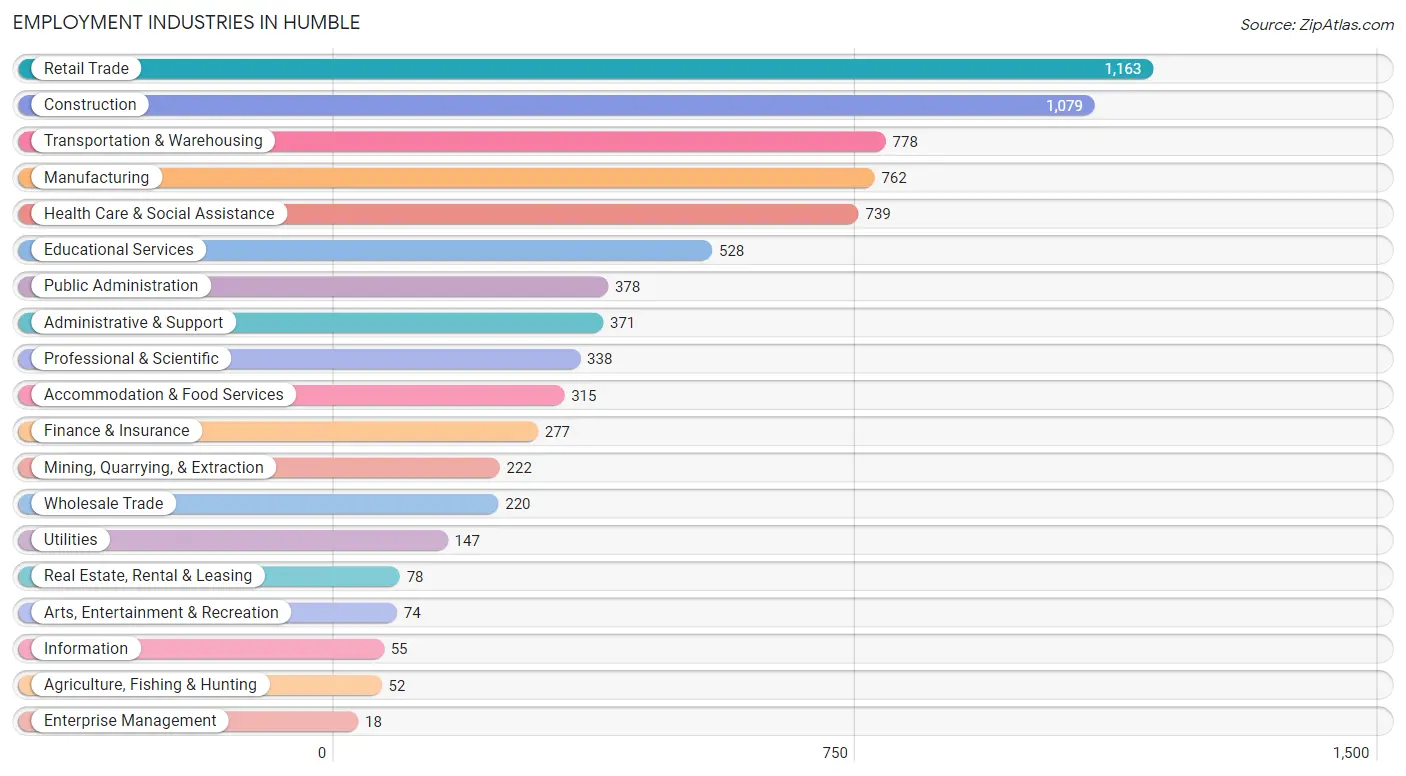
Employment Industries in Humble
The major employment industries in Humble include Retail Trade (1,163 | 14.4%), Construction (1,079 | 13.4%), Transportation & Warehousing (778 | 9.7%), Manufacturing (762 | 9.5%), and Health Care & Social Assistance (739 | 9.2%).
Employment Industries by Sex in Humble
The Humble industries that see more men than women are Agriculture, Fishing & Hunting (100.0%), Wholesale Trade (100.0%), and Arts, Entertainment & Recreation (100.0%), whereas the industries that tend to have a higher number of women are Information (100.0%), Enterprise Management (100.0%), and Health Care & Social Assistance (80.5%).
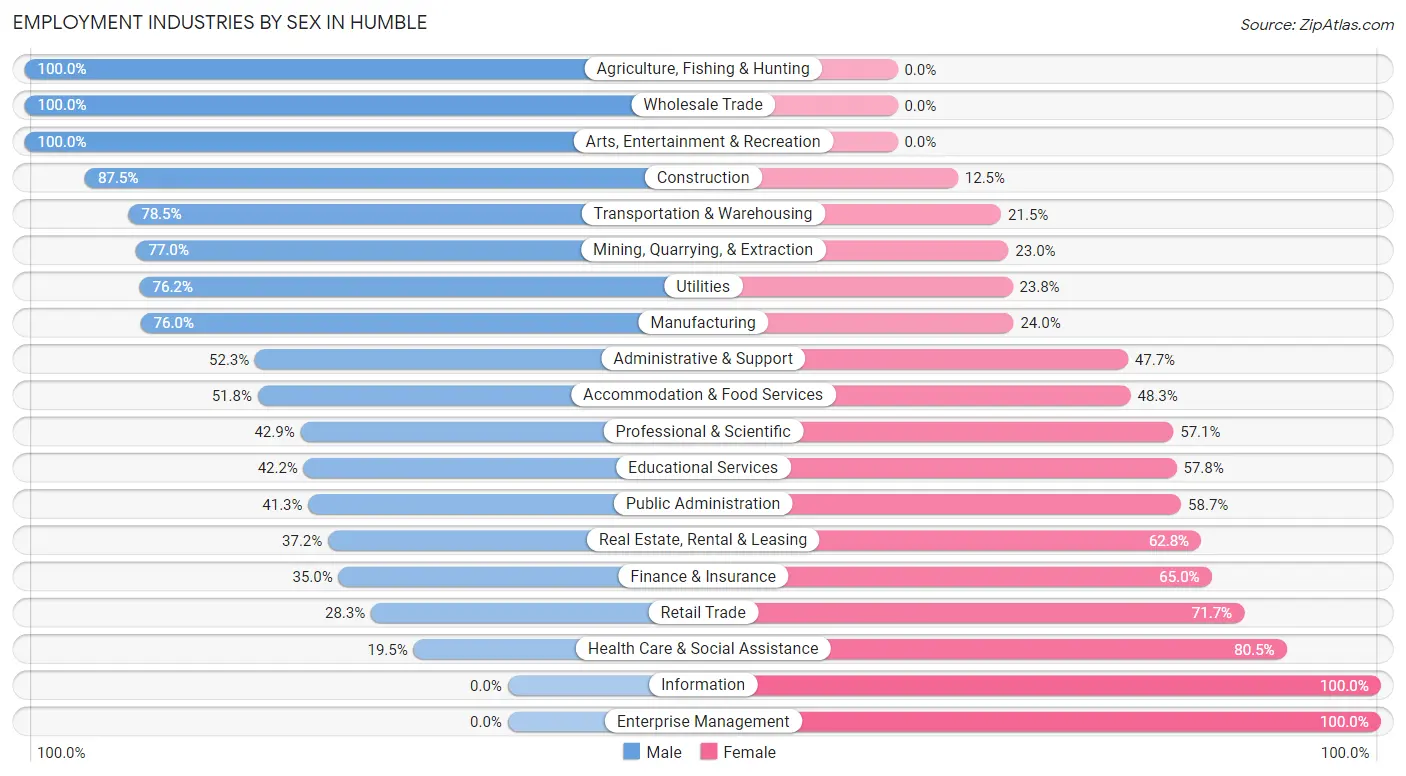
| Industry | Male | Female |
| Agriculture, Fishing & Hunting | 52 (100.0%) | 0 (0.0%) |
| Mining, Quarrying, & Extraction | 171 (77.0%) | 51 (23.0%) |
| Construction | 944 (87.5%) | 135 (12.5%) |
| Manufacturing | 579 (76.0%) | 183 (24.0%) |
| Wholesale Trade | 220 (100.0%) | 0 (0.0%) |
| Retail Trade | 329 (28.3%) | 834 (71.7%) |
| Transportation & Warehousing | 611 (78.5%) | 167 (21.5%) |
| Utilities | 112 (76.2%) | 35 (23.8%) |
| Information | 0 (0.0%) | 55 (100.0%) |
| Finance & Insurance | 97 (35.0%) | 180 (65.0%) |
| Real Estate, Rental & Leasing | 29 (37.2%) | 49 (62.8%) |
| Professional & Scientific | 145 (42.9%) | 193 (57.1%) |
| Enterprise Management | 0 (0.0%) | 18 (100.0%) |
| Administrative & Support | 194 (52.3%) | 177 (47.7%) |
| Educational Services | 223 (42.2%) | 305 (57.8%) |
| Health Care & Social Assistance | 144 (19.5%) | 595 (80.5%) |
| Arts, Entertainment & Recreation | 74 (100.0%) | 0 (0.0%) |
| Accommodation & Food Services | 163 (51.7%) | 152 (48.2%) |
| Public Administration | 156 (41.3%) | 222 (58.7%) |
| Total | 4,491 (55.7%) | 3,564 (44.3%) |
Education in Humble
School Enrollment in Humble
The most common levels of schooling among the 4,712 students in Humble are elementary school (1,331 | 28.2%), middle school (1,121 | 23.8%), and high school (1,092 | 23.2%).
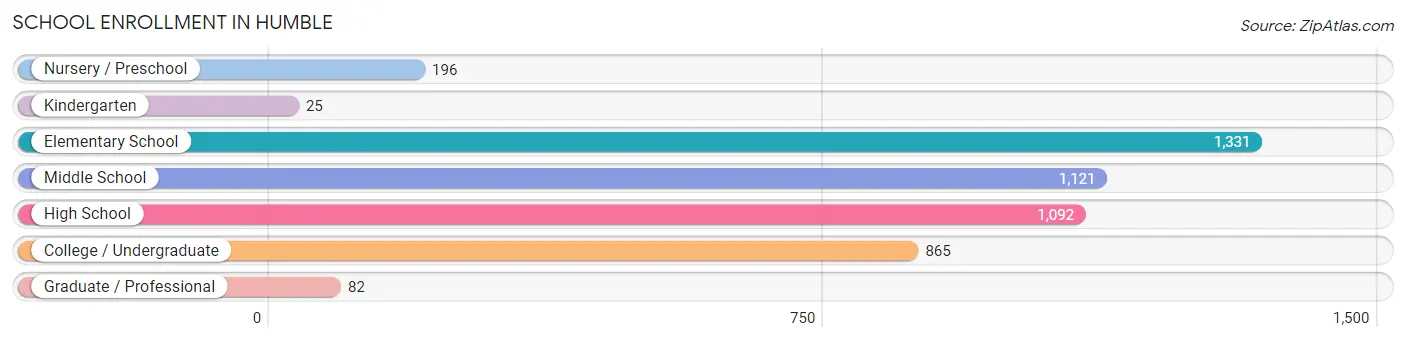
| School Level | # Students | % Students |
| Nursery / Preschool | 196 | 4.2% |
| Kindergarten | 25 | 0.5% |
| Elementary School | 1,331 | 28.2% |
| Middle School | 1,121 | 23.8% |
| High School | 1,092 | 23.2% |
| College / Undergraduate | 865 | 18.4% |
| Graduate / Professional | 82 | 1.7% |
| Total | 4,712 | 100.0% |
School Enrollment by Age by Funding Source in Humble
Out of a total of 4,712 students who are enrolled in schools in Humble, 250 (5.3%) attend a private institution, while the remaining 4,462 (94.7%) are enrolled in public schools. The age group of 3 to 4 year olds has the highest likelihood of being enrolled in private schools, with 123 (100.0% in the age bracket) enrolled. Conversely, the age group of 20 to 24 year olds has the lowest likelihood of being enrolled in a private school, with 384 (100.0% in the age bracket) attending a public institution.
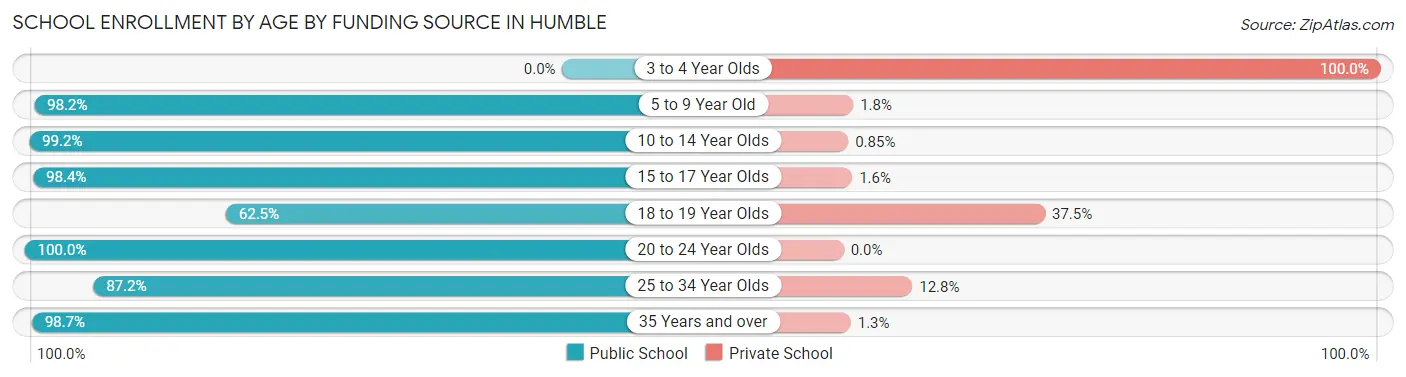
| Age Bracket | Public School | Private School |
| 3 to 4 Year Olds | 0 (0.0%) | 123 (100.0%) |
| 5 to 9 Year Old | 1,432 (98.2%) | 26 (1.8%) |
| 10 to 14 Year Olds | 1,050 (99.2%) | 9 (0.9%) |
| 15 to 17 Year Olds | 1,104 (98.4%) | 18 (1.6%) |
| 18 to 19 Year Olds | 45 (62.5%) | 27 (37.5%) |
| 20 to 24 Year Olds | 384 (100.0%) | 0 (0.0%) |
| 25 to 34 Year Olds | 300 (87.2%) | 44 (12.8%) |
| 35 Years and over | 148 (98.7%) | 2 (1.3%) |
| Total | 4,462 (94.7%) | 250 (5.3%) |
Educational Attainment by Field of Study in Humble
Education (320 | 21.2%), business (240 | 15.9%), engineering (147 | 9.8%), communications (131 | 8.7%), and liberal arts & history (128 | 8.5%) are the most common fields of study among 1,508 individuals in Humble who have obtained a bachelor's degree or higher.
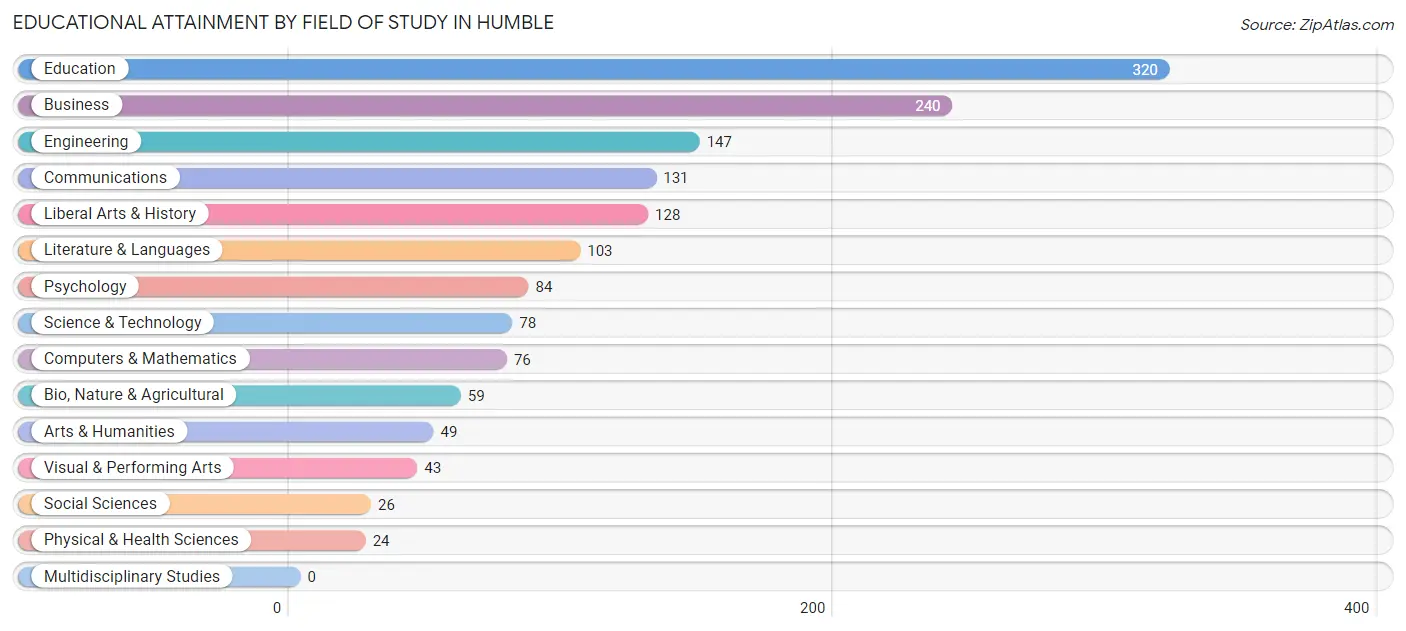
| Field of Study | # Graduates | % Graduates |
| Computers & Mathematics | 76 | 5.0% |
| Bio, Nature & Agricultural | 59 | 3.9% |
| Physical & Health Sciences | 24 | 1.6% |
| Psychology | 84 | 5.6% |
| Social Sciences | 26 | 1.7% |
| Engineering | 147 | 9.8% |
| Multidisciplinary Studies | 0 | 0.0% |
| Science & Technology | 78 | 5.2% |
| Business | 240 | 15.9% |
| Education | 320 | 21.2% |
| Literature & Languages | 103 | 6.8% |
| Liberal Arts & History | 128 | 8.5% |
| Visual & Performing Arts | 43 | 2.9% |
| Communications | 131 | 8.7% |
| Arts & Humanities | 49 | 3.3% |
| Total | 1,508 | 100.0% |
Transportation & Commute in Humble
Vehicle Availability by Sex in Humble
The most prevalent vehicle ownership categories in Humble are males with 2 vehicles (1,631, accounting for 37.2%) and females with 2 vehicles (1,575, making up 48.7%).
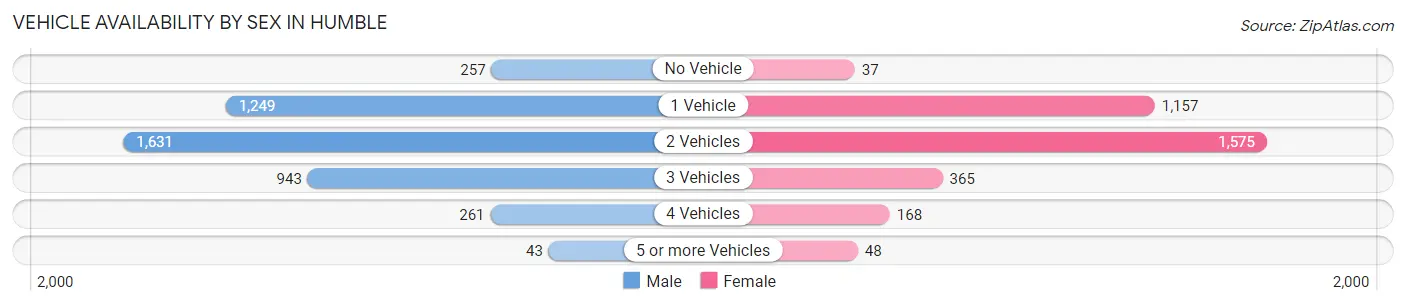
| Vehicles Available | Male | Female |
| No Vehicle | 257 (5.9%) | 37 (1.1%) |
| 1 Vehicle | 1,249 (28.5%) | 1,157 (34.5%) |
| 2 Vehicles | 1,631 (37.2%) | 1,575 (47.0%) |
| 3 Vehicles | 943 (21.5%) | 365 (10.9%) |
| 4 Vehicles | 261 (5.9%) | 168 (5.0%) |
| 5 or more Vehicles | 43 (1.0%) | 48 (1.4%) |
| Total | 4,384 (100.0%) | 3,350 (100.0%) |
Commute Time in Humble
The most frequently occuring commute durations in Humble are 20 to 24 minutes (1,303 commuters, 18.0%), 15 to 19 minutes (1,255 commuters, 17.3%), and 30 to 34 minutes (1,085 commuters, 14.9%).
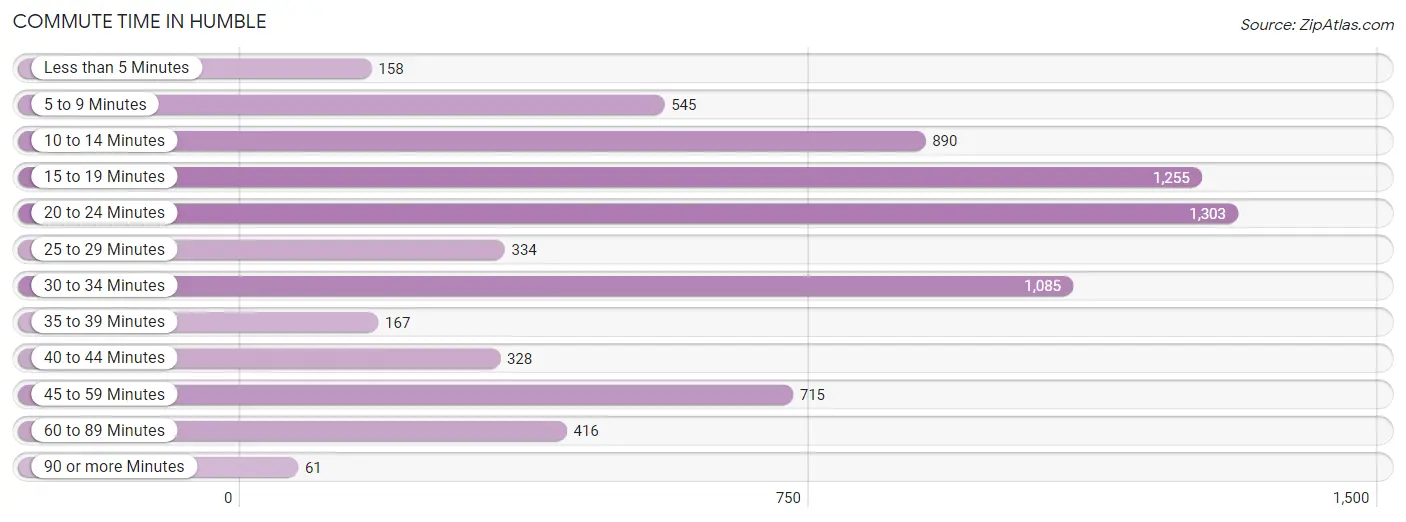
| Commute Time | # Commuters | % Commuters |
| Less than 5 Minutes | 158 | 2.2% |
| 5 to 9 Minutes | 545 | 7.5% |
| 10 to 14 Minutes | 890 | 12.3% |
| 15 to 19 Minutes | 1,255 | 17.3% |
| 20 to 24 Minutes | 1,303 | 18.0% |
| 25 to 29 Minutes | 334 | 4.6% |
| 30 to 34 Minutes | 1,085 | 14.9% |
| 35 to 39 Minutes | 167 | 2.3% |
| 40 to 44 Minutes | 328 | 4.5% |
| 45 to 59 Minutes | 715 | 9.9% |
| 60 to 89 Minutes | 416 | 5.7% |
| 90 or more Minutes | 61 | 0.8% |
Commute Time by Sex in Humble
The most common commute times in Humble are 15 to 19 minutes (761 commuters, 18.3%) for males and 20 to 24 minutes (779 commuters, 25.1%) for females.
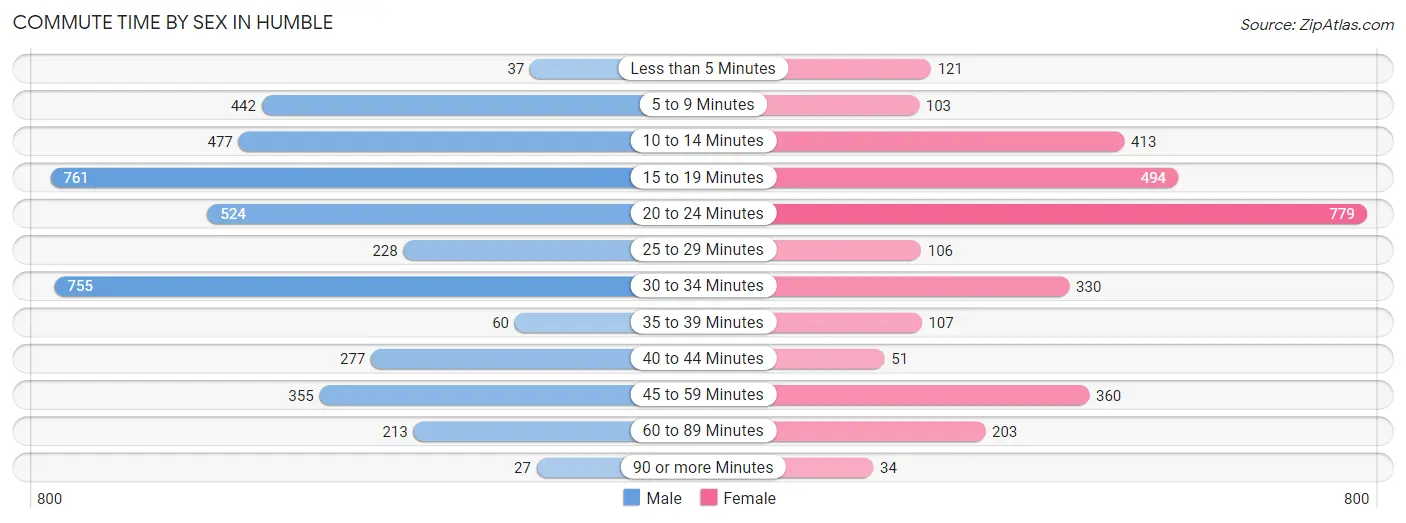
| Commute Time | Male | Female |
| Less than 5 Minutes | 37 (0.9%) | 121 (3.9%) |
| 5 to 9 Minutes | 442 (10.6%) | 103 (3.3%) |
| 10 to 14 Minutes | 477 (11.5%) | 413 (13.3%) |
| 15 to 19 Minutes | 761 (18.3%) | 494 (15.9%) |
| 20 to 24 Minutes | 524 (12.6%) | 779 (25.1%) |
| 25 to 29 Minutes | 228 (5.5%) | 106 (3.4%) |
| 30 to 34 Minutes | 755 (18.2%) | 330 (10.6%) |
| 35 to 39 Minutes | 60 (1.4%) | 107 (3.5%) |
| 40 to 44 Minutes | 277 (6.7%) | 51 (1.6%) |
| 45 to 59 Minutes | 355 (8.5%) | 360 (11.6%) |
| 60 to 89 Minutes | 213 (5.1%) | 203 (6.6%) |
| 90 or more Minutes | 27 (0.6%) | 34 (1.1%) |
Time of Departure to Work by Sex in Humble
The most frequent times of departure to work in Humble are 6:00 AM to 6:29 AM (519, 12.5%) for males and 12:00 AM to 4:59 AM (441, 14.2%) for females.
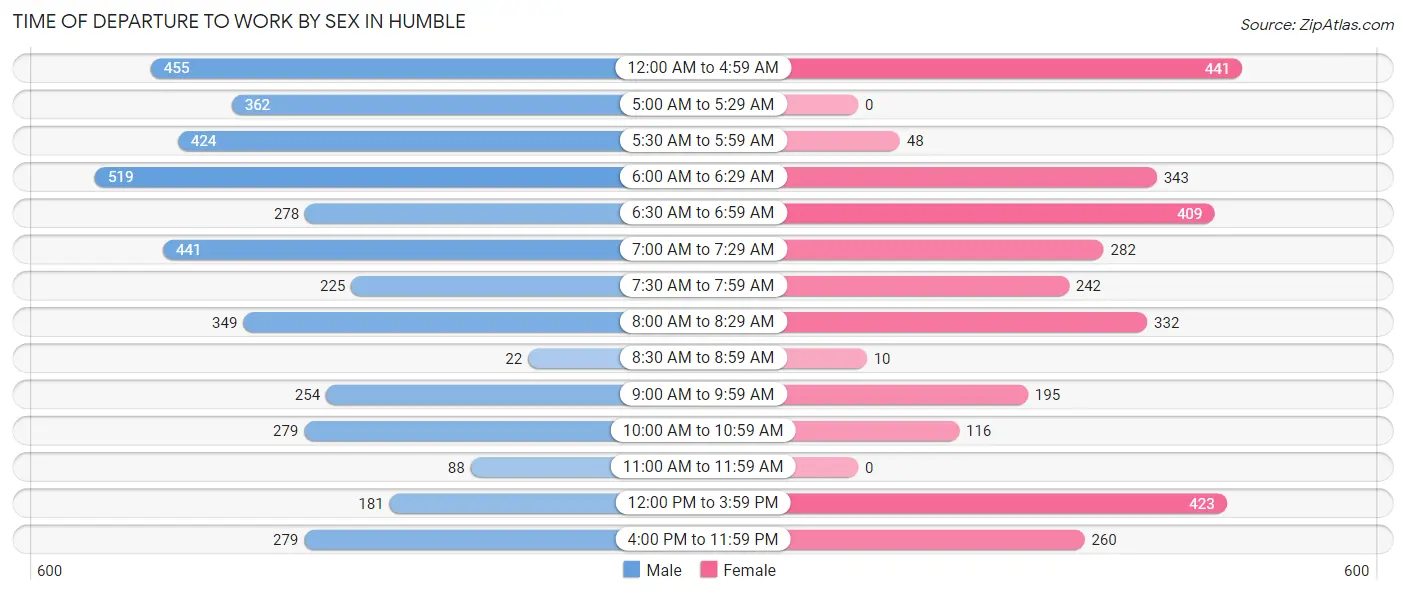
| Time of Departure | Male | Female |
| 12:00 AM to 4:59 AM | 455 (11.0%) | 441 (14.2%) |
| 5:00 AM to 5:29 AM | 362 (8.7%) | 0 (0.0%) |
| 5:30 AM to 5:59 AM | 424 (10.2%) | 48 (1.5%) |
| 6:00 AM to 6:29 AM | 519 (12.5%) | 343 (11.1%) |
| 6:30 AM to 6:59 AM | 278 (6.7%) | 409 (13.2%) |
| 7:00 AM to 7:29 AM | 441 (10.6%) | 282 (9.1%) |
| 7:30 AM to 7:59 AM | 225 (5.4%) | 242 (7.8%) |
| 8:00 AM to 8:29 AM | 349 (8.4%) | 332 (10.7%) |
| 8:30 AM to 8:59 AM | 22 (0.5%) | 10 (0.3%) |
| 9:00 AM to 9:59 AM | 254 (6.1%) | 195 (6.3%) |
| 10:00 AM to 10:59 AM | 279 (6.7%) | 116 (3.7%) |
| 11:00 AM to 11:59 AM | 88 (2.1%) | 0 (0.0%) |
| 12:00 PM to 3:59 PM | 181 (4.4%) | 423 (13.6%) |
| 4:00 PM to 11:59 PM | 279 (6.7%) | 260 (8.4%) |
| Total | 4,156 (100.0%) | 3,101 (100.0%) |
Housing Occupancy in Humble
Occupancy by Ownership in Humble
Of the total 6,347 dwellings in Humble, owner-occupied units account for 2,331 (36.7%), while renter-occupied units make up 4,016 (63.3%).
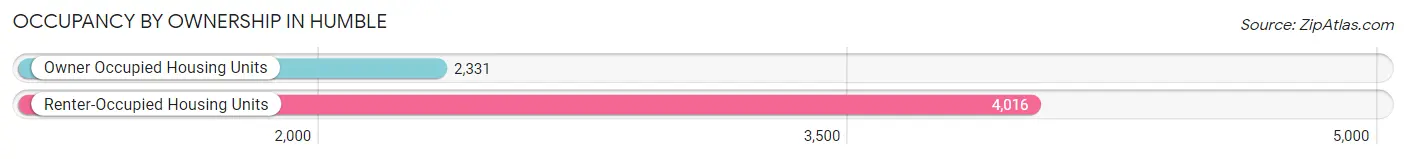
| Occupancy | # Housing Units | % Housing Units |
| Owner Occupied Housing Units | 2,331 | 36.7% |
| Renter-Occupied Housing Units | 4,016 | 63.3% |
| Total Occupied Housing Units | 6,347 | 100.0% |
Occupancy by Household Size in Humble
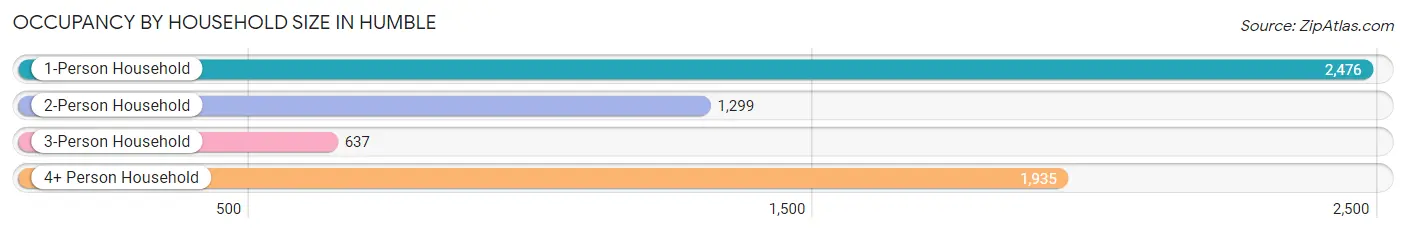
| Household Size | # Housing Units | % Housing Units |
| 1-Person Household | 2,476 | 39.0% |
| 2-Person Household | 1,299 | 20.5% |
| 3-Person Household | 637 | 10.0% |
| 4+ Person Household | 1,935 | 30.5% |
| Total Housing Units | 6,347 | 100.0% |
Occupancy by Ownership by Household Size in Humble
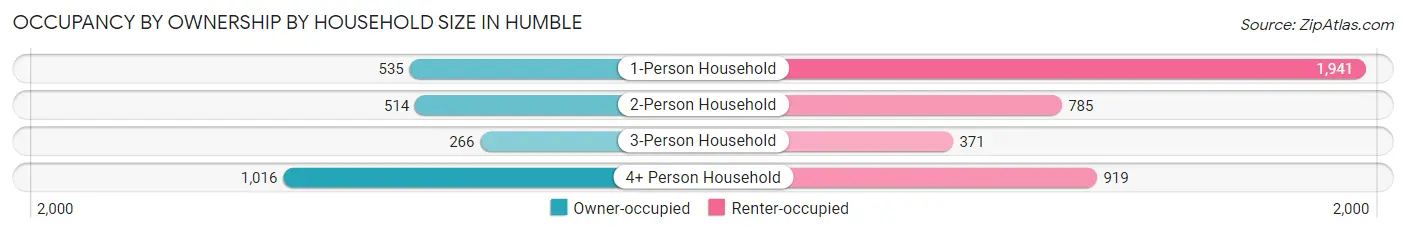
| Household Size | Owner-occupied | Renter-occupied |
| 1-Person Household | 535 (21.6%) | 1,941 (78.4%) |
| 2-Person Household | 514 (39.6%) | 785 (60.4%) |
| 3-Person Household | 266 (41.8%) | 371 (58.2%) |
| 4+ Person Household | 1,016 (52.5%) | 919 (47.5%) |
| Total Housing Units | 2,331 (36.7%) | 4,016 (63.3%) |
Occupancy by Educational Attainment in Humble
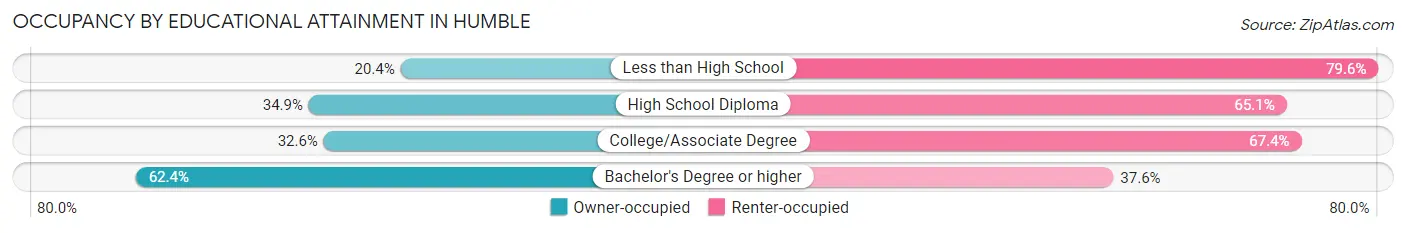
| Household Size | Owner-occupied | Renter-occupied |
| Less than High School | 120 (20.4%) | 469 (79.6%) |
| High School Diploma | 835 (34.9%) | 1,556 (65.1%) |
| College/Associate Degree | 791 (32.6%) | 1,638 (67.4%) |
| Bachelor's Degree or higher | 585 (62.4%) | 353 (37.6%) |
Occupancy by Age of Householder in Humble
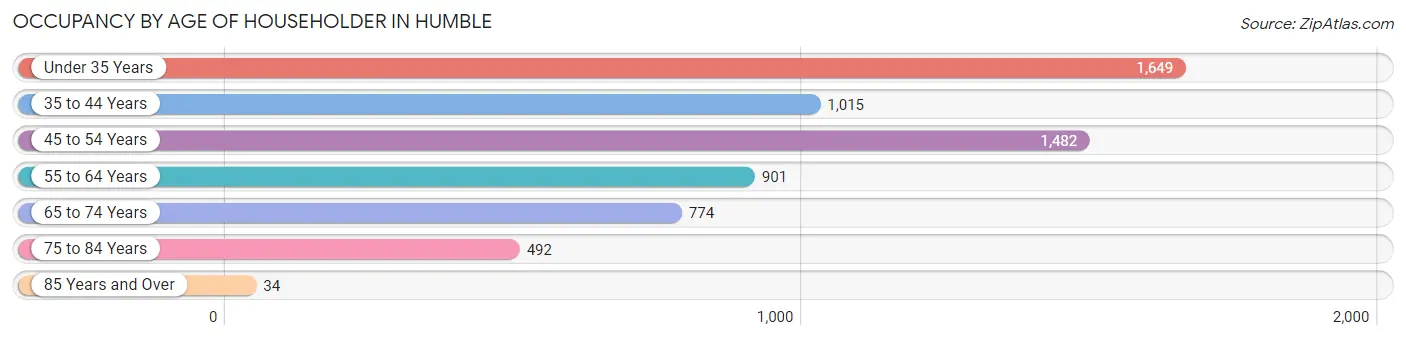
| Age Bracket | # Households | % Households |
| Under 35 Years | 1,649 | 26.0% |
| 35 to 44 Years | 1,015 | 16.0% |
| 45 to 54 Years | 1,482 | 23.4% |
| 55 to 64 Years | 901 | 14.2% |
| 65 to 74 Years | 774 | 12.2% |
| 75 to 84 Years | 492 | 7.7% |
| 85 Years and Over | 34 | 0.5% |
| Total | 6,347 | 100.0% |
Housing Finances in Humble
Median Income by Occupancy in Humble
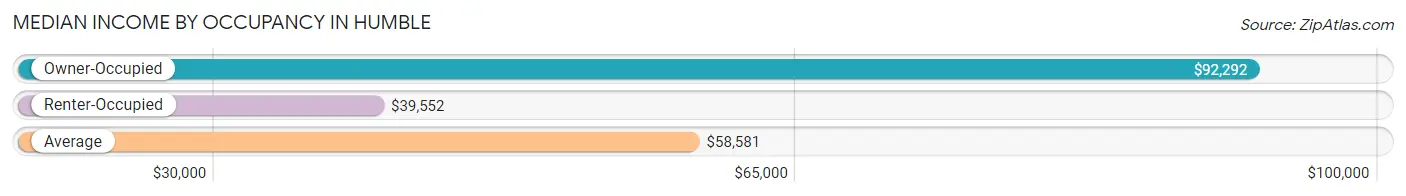
| Occupancy Type | # Households | Median Income |
| Owner-Occupied | 2,331 (36.7%) | $92,292 |
| Renter-Occupied | 4,016 (63.3%) | $39,552 |
| Average | 6,347 (100.0%) | $58,581 |
Occupancy by Householder Income Bracket in Humble
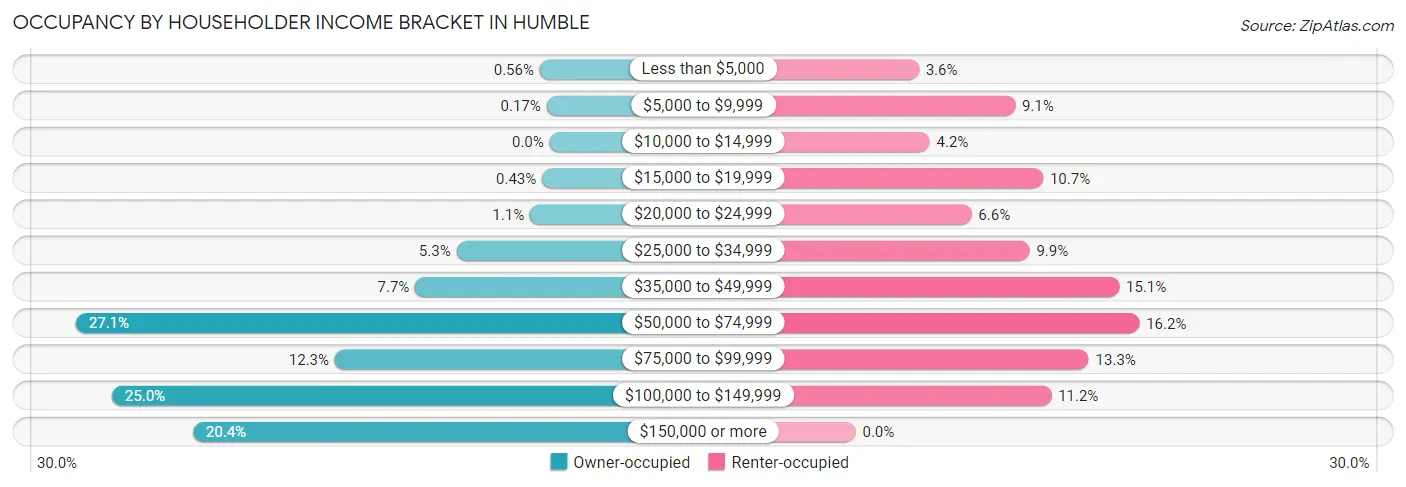
| Income Bracket | Owner-occupied | Renter-occupied |
| Less than $5,000 | 13 (0.6%) | 145 (3.6%) |
| $5,000 to $9,999 | 4 (0.2%) | 366 (9.1%) |
| $10,000 to $14,999 | 0 (0.0%) | 170 (4.2%) |
| $15,000 to $19,999 | 10 (0.4%) | 430 (10.7%) |
| $20,000 to $24,999 | 26 (1.1%) | 266 (6.6%) |
| $25,000 to $34,999 | 124 (5.3%) | 399 (9.9%) |
| $35,000 to $49,999 | 179 (7.7%) | 605 (15.1%) |
| $50,000 to $74,999 | 631 (27.1%) | 651 (16.2%) |
| $75,000 to $99,999 | 286 (12.3%) | 535 (13.3%) |
| $100,000 to $149,999 | 583 (25.0%) | 449 (11.2%) |
| $150,000 or more | 475 (20.4%) | 0 (0.0%) |
| Total | 2,331 (100.0%) | 4,016 (100.0%) |
Monthly Housing Cost Tiers in Humble
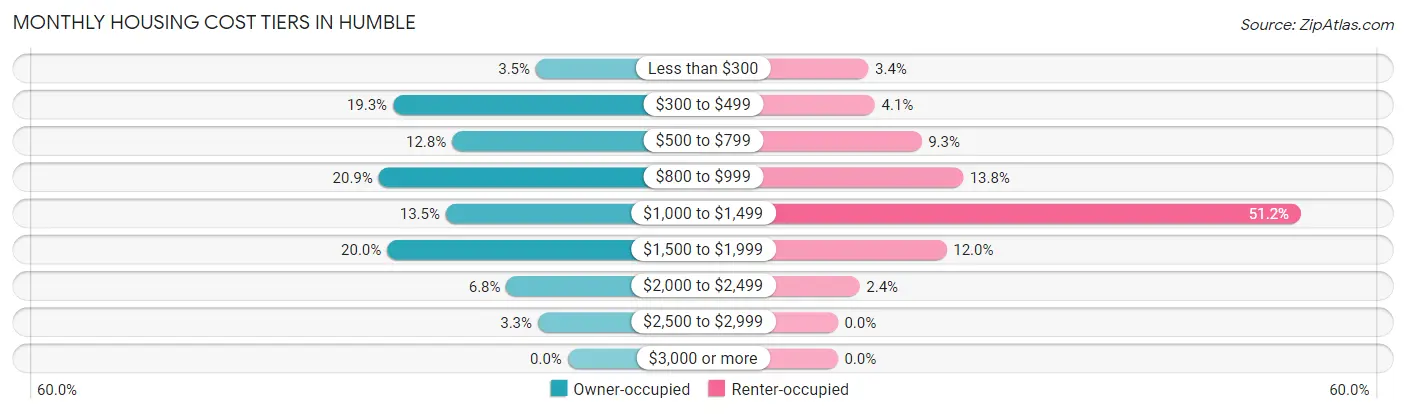
| Monthly Cost | Owner-occupied | Renter-occupied |
| Less than $300 | 82 (3.5%) | 136 (3.4%) |
| $300 to $499 | 450 (19.3%) | 165 (4.1%) |
| $500 to $799 | 298 (12.8%) | 372 (9.3%) |
| $800 to $999 | 487 (20.9%) | 556 (13.8%) |
| $1,000 to $1,499 | 314 (13.5%) | 2,056 (51.2%) |
| $1,500 to $1,999 | 465 (20.0%) | 483 (12.0%) |
| $2,000 to $2,499 | 158 (6.8%) | 97 (2.4%) |
| $2,500 to $2,999 | 77 (3.3%) | 0 (0.0%) |
| $3,000 or more | 0 (0.0%) | 0 (0.0%) |
| Total | 2,331 (100.0%) | 4,016 (100.0%) |
Physical Housing Characteristics in Humble
Housing Structures in Humble
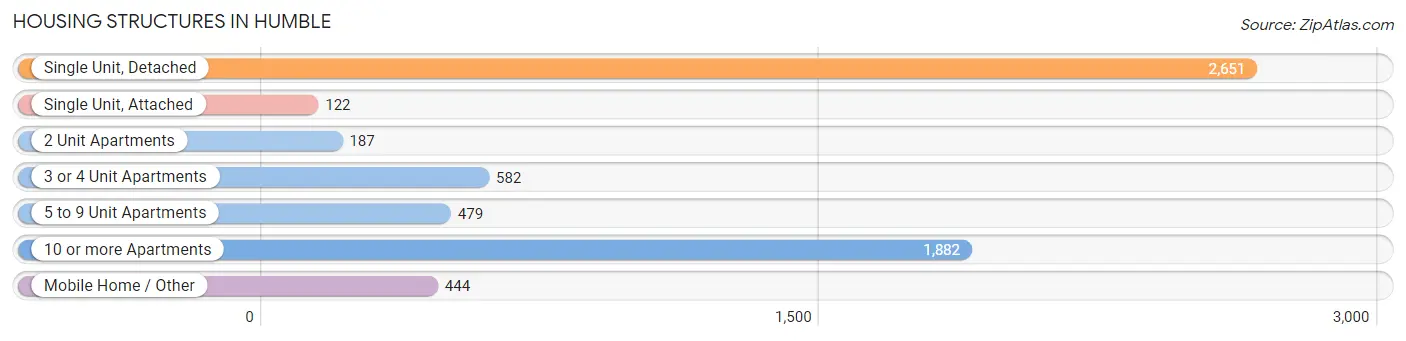
| Structure Type | # Housing Units | % Housing Units |
| Single Unit, Detached | 2,651 | 41.8% |
| Single Unit, Attached | 122 | 1.9% |
| 2 Unit Apartments | 187 | 2.9% |
| 3 or 4 Unit Apartments | 582 | 9.2% |
| 5 to 9 Unit Apartments | 479 | 7.5% |
| 10 or more Apartments | 1,882 | 29.6% |
| Mobile Home / Other | 444 | 7.0% |
| Total | 6,347 | 100.0% |
Housing Structures by Occupancy in Humble
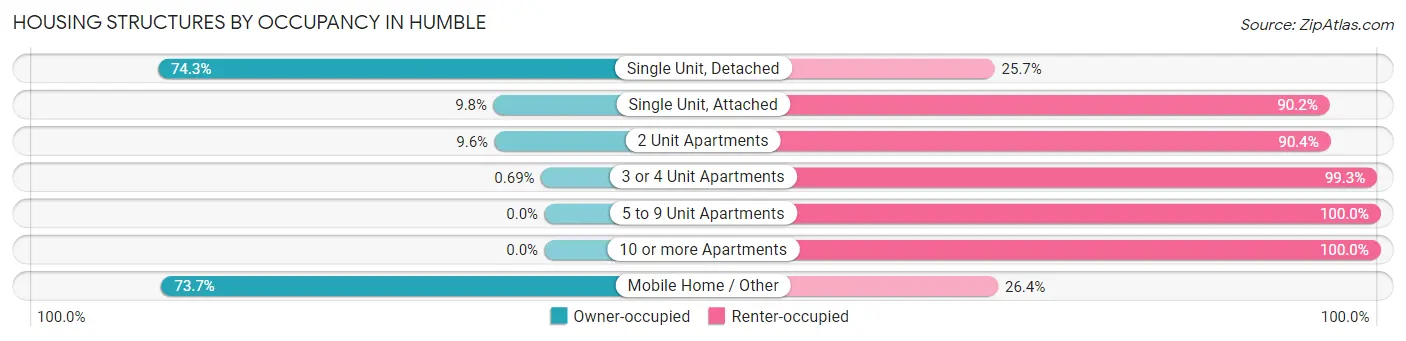
| Structure Type | Owner-occupied | Renter-occupied |
| Single Unit, Detached | 1,970 (74.3%) | 681 (25.7%) |
| Single Unit, Attached | 12 (9.8%) | 110 (90.2%) |
| 2 Unit Apartments | 18 (9.6%) | 169 (90.4%) |
| 3 or 4 Unit Apartments | 4 (0.7%) | 578 (99.3%) |
| 5 to 9 Unit Apartments | 0 (0.0%) | 479 (100.0%) |
| 10 or more Apartments | 0 (0.0%) | 1,882 (100.0%) |
| Mobile Home / Other | 327 (73.7%) | 117 (26.4%) |
| Total | 2,331 (36.7%) | 4,016 (63.3%) |
Housing Structures by Number of Rooms in Humble
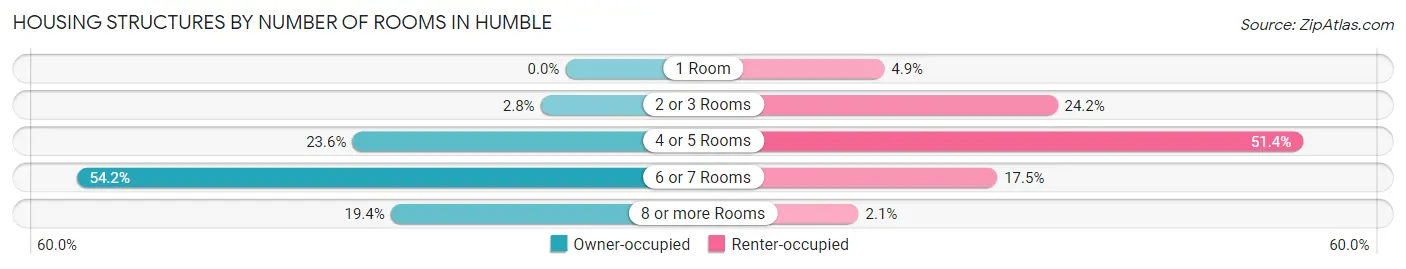
| Number of Rooms | Owner-occupied | Renter-occupied |
| 1 Room | 0 (0.0%) | 198 (4.9%) |
| 2 or 3 Rooms | 64 (2.8%) | 970 (24.1%) |
| 4 or 5 Rooms | 551 (23.6%) | 2,064 (51.4%) |
| 6 or 7 Rooms | 1,264 (54.2%) | 701 (17.5%) |
| 8 or more Rooms | 452 (19.4%) | 83 (2.1%) |
| Total | 2,331 (100.0%) | 4,016 (100.0%) |
Housing Structure by Heating Type in Humble
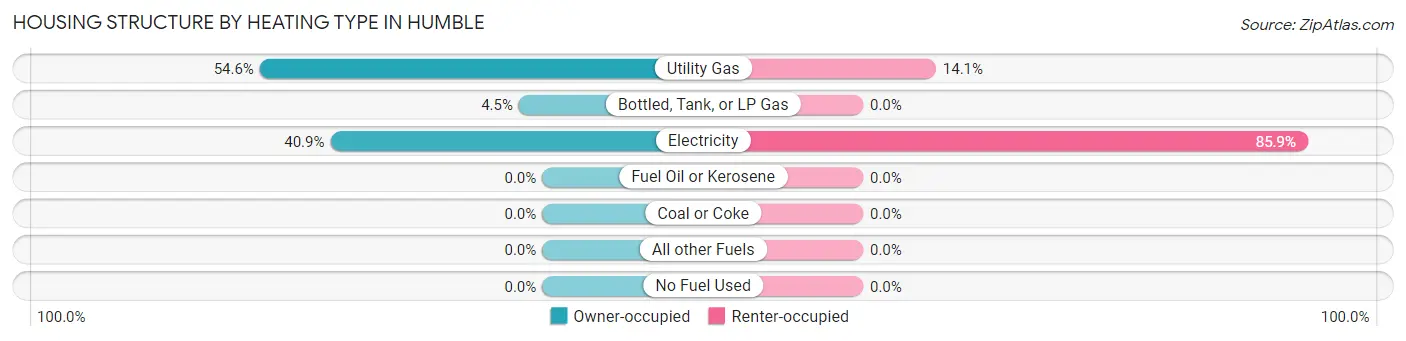
| Heating Type | Owner-occupied | Renter-occupied |
| Utility Gas | 1,272 (54.6%) | 565 (14.1%) |
| Bottled, Tank, or LP Gas | 105 (4.5%) | 0 (0.0%) |
| Electricity | 954 (40.9%) | 3,451 (85.9%) |
| Fuel Oil or Kerosene | 0 (0.0%) | 0 (0.0%) |
| Coal or Coke | 0 (0.0%) | 0 (0.0%) |
| All other Fuels | 0 (0.0%) | 0 (0.0%) |
| No Fuel Used | 0 (0.0%) | 0 (0.0%) |
| Total | 2,331 (100.0%) | 4,016 (100.0%) |
Household Vehicle Usage in Humble
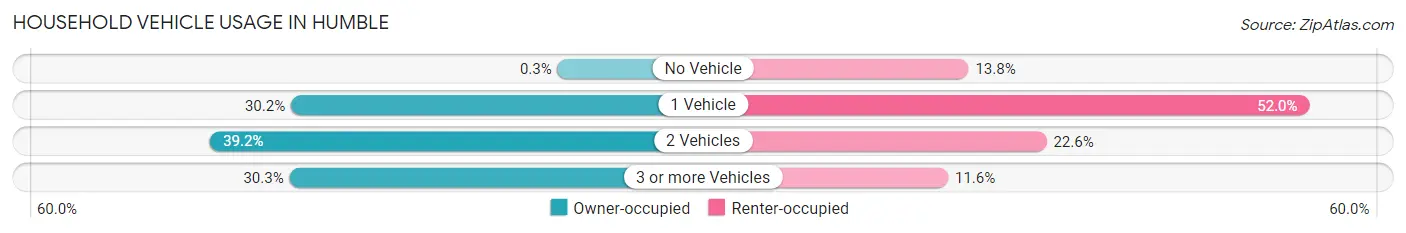
| Vehicles per Household | Owner-occupied | Renter-occupied |
| No Vehicle | 7 (0.3%) | 556 (13.8%) |
| 1 Vehicle | 703 (30.2%) | 2,089 (52.0%) |
| 2 Vehicles | 914 (39.2%) | 907 (22.6%) |
| 3 or more Vehicles | 707 (30.3%) | 464 (11.6%) |
| Total | 2,331 (100.0%) | 4,016 (100.0%) |
Real Estate & Mortgages in Humble
Real Estate and Mortgage Overview in Humble
| Characteristic | Without Mortgage | With Mortgage |
| Housing Units | 1,198 | 1,133 |
| Median Property Value | $179,200 | $173,800 |
| Median Household Income | $63,197 | $277 |
| Monthly Housing Costs | $626 | $0 |
| Real Estate Taxes | $1,341 | $0 |
Property Value by Mortgage Status in Humble
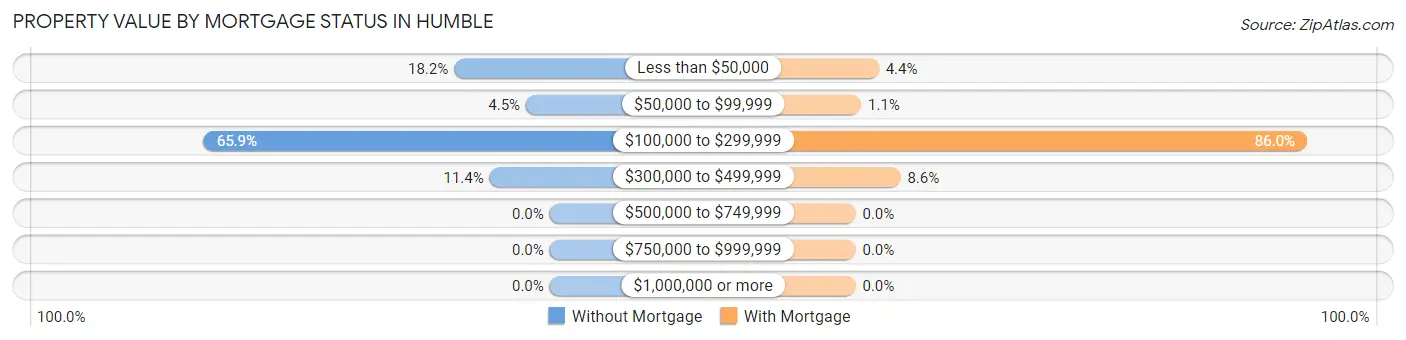
| Property Value | Without Mortgage | With Mortgage |
| Less than $50,000 | 218 (18.2%) | 50 (4.4%) |
| $50,000 to $99,999 | 54 (4.5%) | 12 (1.1%) |
| $100,000 to $299,999 | 789 (65.9%) | 974 (86.0%) |
| $300,000 to $499,999 | 137 (11.4%) | 97 (8.6%) |
| $500,000 to $749,999 | 0 (0.0%) | 0 (0.0%) |
| $750,000 to $999,999 | 0 (0.0%) | 0 (0.0%) |
| $1,000,000 or more | 0 (0.0%) | 0 (0.0%) |
| Total | 1,198 (100.0%) | 1,133 (100.0%) |
Household Income by Mortgage Status in Humble
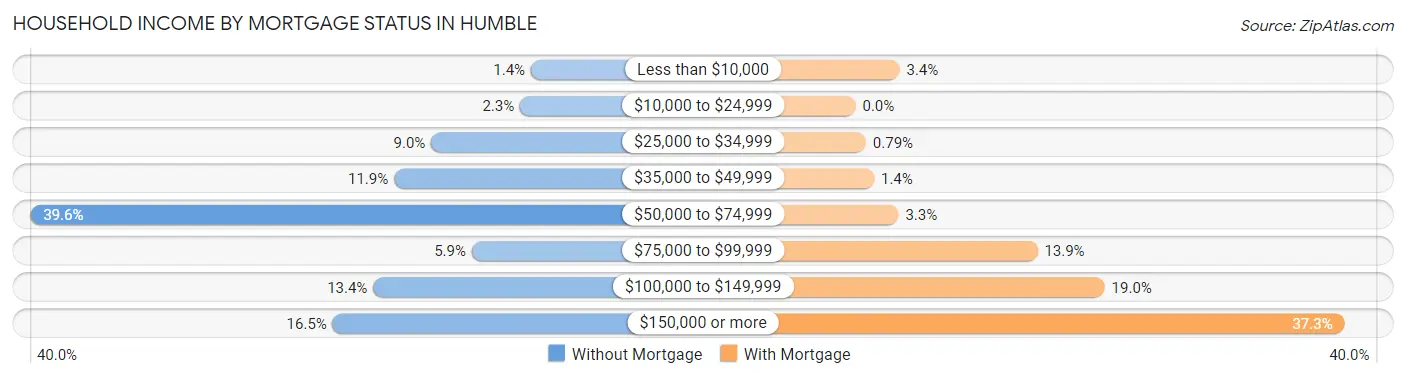
| Household Income | Without Mortgage | With Mortgage |
| Less than $10,000 | 17 (1.4%) | 38 (3.4%) |
| $10,000 to $24,999 | 27 (2.2%) | 0 (0.0%) |
| $25,000 to $34,999 | 108 (9.0%) | 9 (0.8%) |
| $35,000 to $49,999 | 142 (11.8%) | 16 (1.4%) |
| $50,000 to $74,999 | 474 (39.6%) | 37 (3.3%) |
| $75,000 to $99,999 | 71 (5.9%) | 157 (13.9%) |
| $100,000 to $149,999 | 161 (13.4%) | 215 (19.0%) |
| $150,000 or more | 198 (16.5%) | 422 (37.2%) |
| Total | 1,198 (100.0%) | 1,133 (100.0%) |
Property Value to Household Income Ratio in Humble
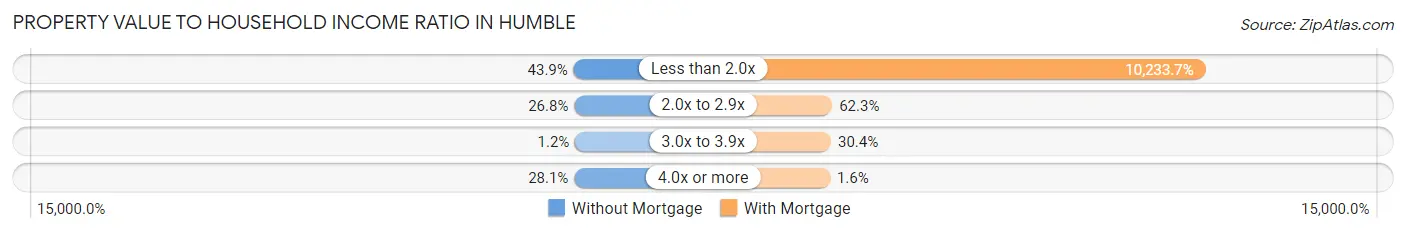
| Value-to-Income Ratio | Without Mortgage | With Mortgage |
| Less than 2.0x | 526 (43.9%) | 115,948 (10,233.7%) |
| 2.0x to 2.9x | 321 (26.8%) | 706 (62.3%) |
| 3.0x to 3.9x | 14 (1.2%) | 344 (30.4%) |
| 4.0x or more | 337 (28.1%) | 18 (1.6%) |
| Total | 1,198 (100.0%) | 1,133 (100.0%) |
Real Estate Taxes by Mortgage Status in Humble
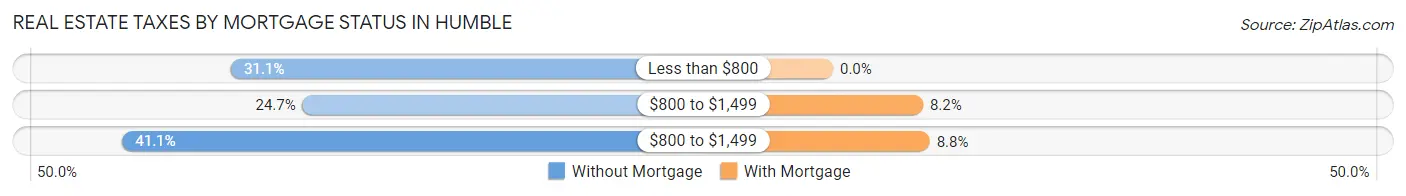
| Property Taxes | Without Mortgage | With Mortgage |
| Less than $800 | 373 (31.1%) | 0 (0.0%) |
| $800 to $1,499 | 296 (24.7%) | 93 (8.2%) |
| $800 to $1,499 | 492 (41.1%) | 100 (8.8%) |
| Total | 1,198 (100.0%) | 1,133 (100.0%) |
Health & Disability in Humble
Health Insurance Coverage by Age in Humble
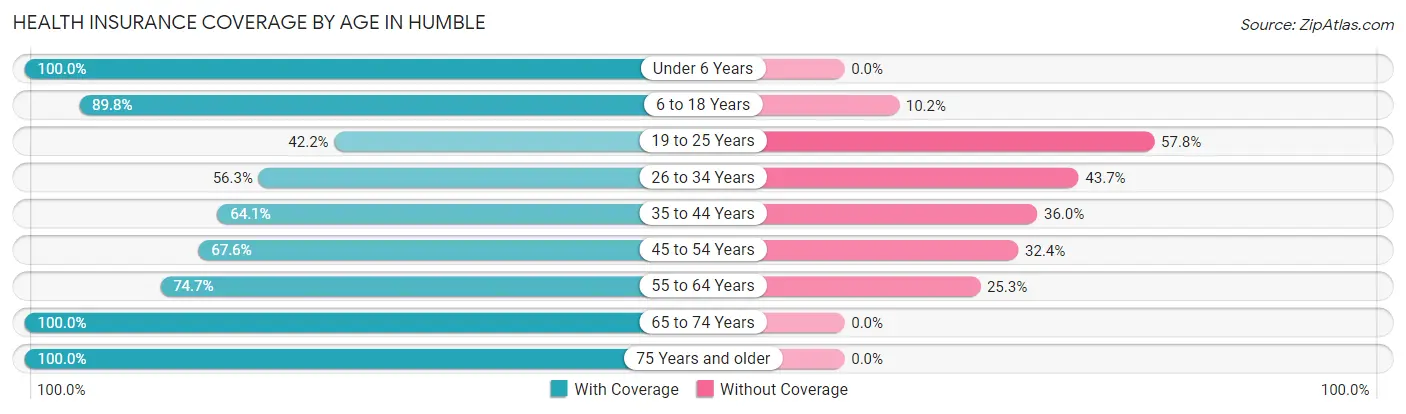
| Age Bracket | With Coverage | Without Coverage |
| Under 6 Years | 884 (100.0%) | 0 (0.0%) |
| 6 to 18 Years | 3,406 (89.8%) | 385 (10.2%) |
| 19 to 25 Years | 584 (42.2%) | 799 (57.8%) |
| 26 to 34 Years | 1,520 (56.3%) | 1,178 (43.7%) |
| 35 to 44 Years | 1,208 (64.0%) | 678 (35.9%) |
| 45 to 54 Years | 1,485 (67.6%) | 712 (32.4%) |
| 55 to 64 Years | 1,134 (74.7%) | 384 (25.3%) |
| 65 to 74 Years | 1,163 (100.0%) | 0 (0.0%) |
| 75 Years and older | 793 (100.0%) | 0 (0.0%) |
| Total | 12,177 (74.7%) | 4,136 (25.4%) |
Health Insurance Coverage by Citizenship Status in Humble
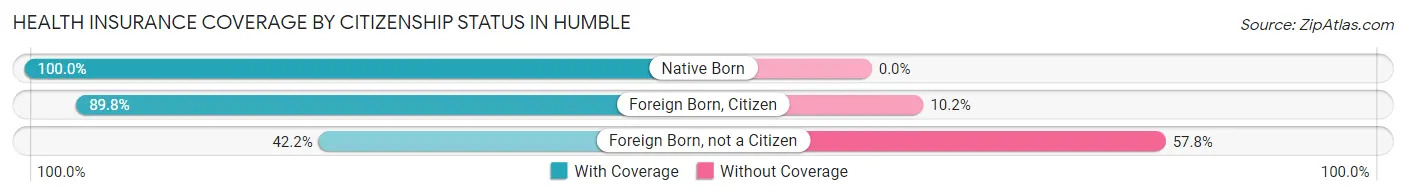
| Citizenship Status | With Coverage | Without Coverage |
| Native Born | 884 (100.0%) | 0 (0.0%) |
| Foreign Born, Citizen | 3,406 (89.8%) | 385 (10.2%) |
| Foreign Born, not a Citizen | 584 (42.2%) | 799 (57.8%) |
Health Insurance Coverage by Household Income in Humble
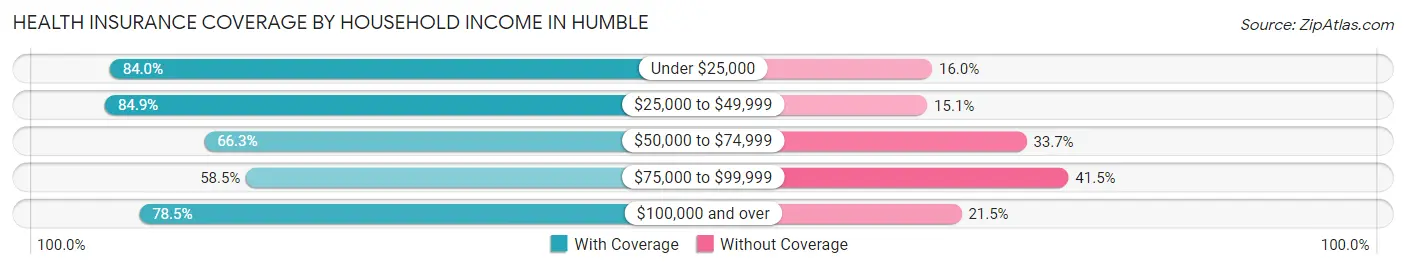
| Household Income | With Coverage | Without Coverage |
| Under $25,000 | 1,737 (84.0%) | 330 (16.0%) |
| $25,000 to $49,999 | 2,774 (84.9%) | 492 (15.1%) |
| $50,000 to $74,999 | 1,969 (66.3%) | 999 (33.7%) |
| $75,000 to $99,999 | 1,728 (58.5%) | 1,227 (41.5%) |
| $100,000 and over | 3,959 (78.5%) | 1,083 (21.5%) |
Public vs Private Health Insurance Coverage by Age in Humble
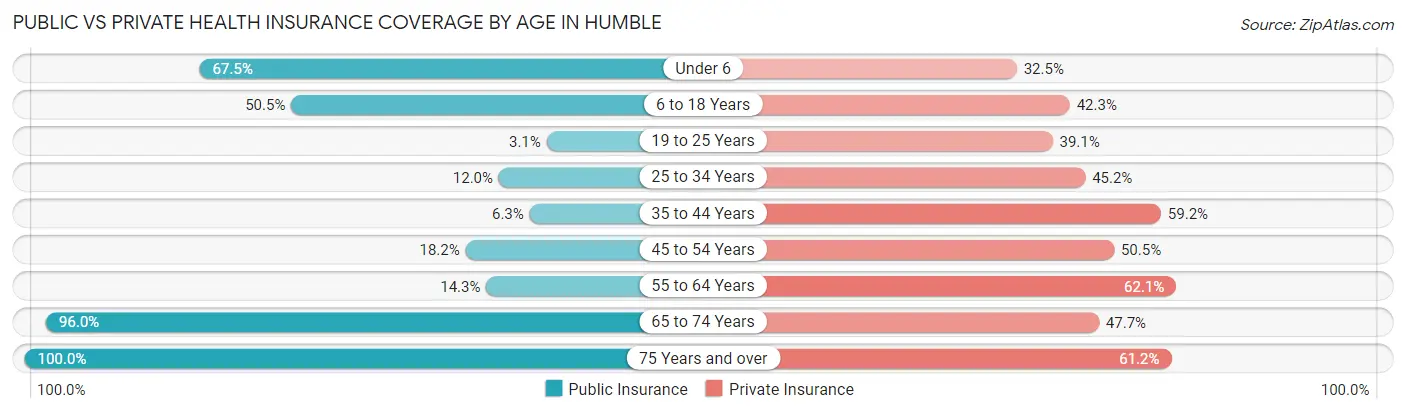
| Age Bracket | Public Insurance | Private Insurance |
| Under 6 | 597 (67.5%) | 287 (32.5%) |
| 6 to 18 Years | 1,915 (50.5%) | 1,604 (42.3%) |
| 19 to 25 Years | 43 (3.1%) | 541 (39.1%) |
| 25 to 34 Years | 323 (12.0%) | 1,219 (45.2%) |
| 35 to 44 Years | 118 (6.3%) | 1,117 (59.2%) |
| 45 to 54 Years | 399 (18.2%) | 1,110 (50.5%) |
| 55 to 64 Years | 217 (14.3%) | 942 (62.1%) |
| 65 to 74 Years | 1,117 (96.0%) | 555 (47.7%) |
| 75 Years and over | 793 (100.0%) | 485 (61.2%) |
| Total | 5,522 (33.9%) | 7,860 (48.2%) |
Disability Status by Sex by Age in Humble
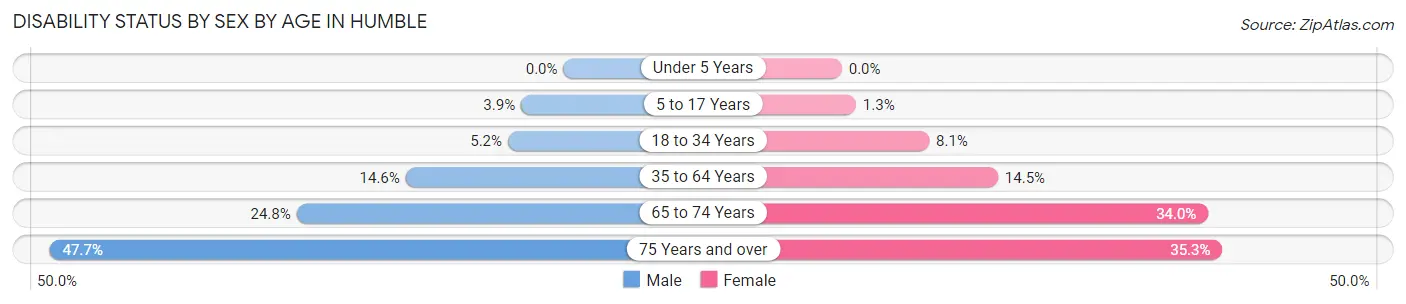
| Age Bracket | Male | Female |
| Under 5 Years | 0 (0.0%) | 0 (0.0%) |
| 5 to 17 Years | 62 (3.9%) | 28 (1.3%) |
| 18 to 34 Years | 107 (5.1%) | 178 (8.1%) |
| 35 to 64 Years | 414 (14.6%) | 402 (14.5%) |
| 65 to 74 Years | 103 (24.8%) | 254 (34.0%) |
| 75 Years and over | 185 (47.7%) | 143 (35.3%) |
Disability Class by Sex by Age in Humble
Disability Class: Hearing Difficulty
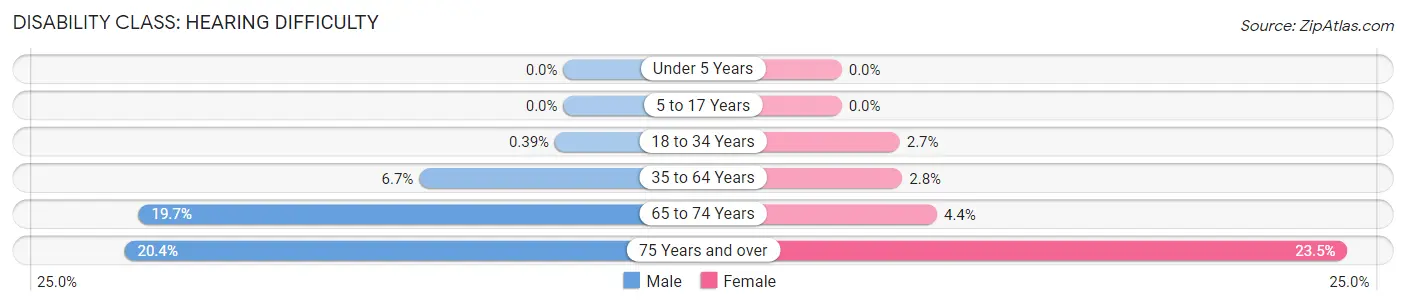
| Age Bracket | Male | Female |
| Under 5 Years | 0 (0.0%) | 0 (0.0%) |
| 5 to 17 Years | 0 (0.0%) | 0 (0.0%) |
| 18 to 34 Years | 8 (0.4%) | 59 (2.7%) |
| 35 to 64 Years | 189 (6.7%) | 78 (2.8%) |
| 65 to 74 Years | 82 (19.7%) | 33 (4.4%) |
| 75 Years and over | 79 (20.4%) | 95 (23.5%) |
Disability Class: Vision Difficulty
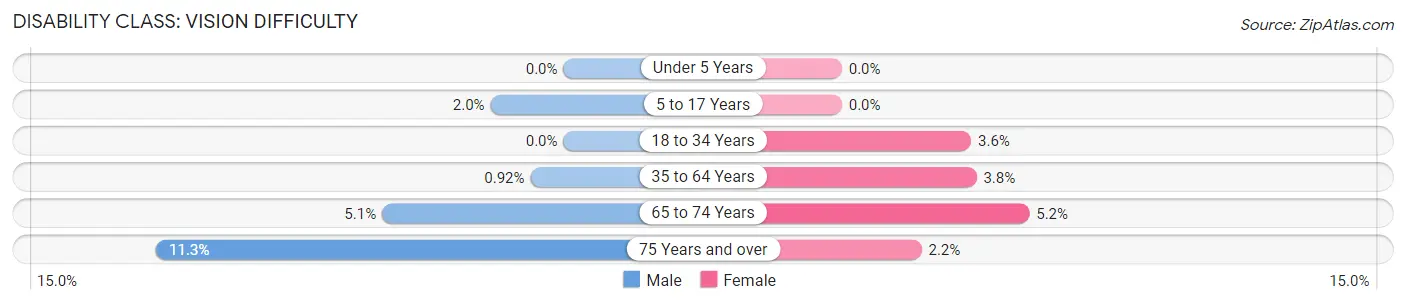
| Age Bracket | Male | Female |
| Under 5 Years | 0 (0.0%) | 0 (0.0%) |
| 5 to 17 Years | 32 (2.0%) | 0 (0.0%) |
| 18 to 34 Years | 0 (0.0%) | 79 (3.6%) |
| 35 to 64 Years | 26 (0.9%) | 104 (3.7%) |
| 65 to 74 Years | 21 (5.1%) | 39 (5.2%) |
| 75 Years and over | 44 (11.3%) | 9 (2.2%) |
Disability Class: Cognitive Difficulty
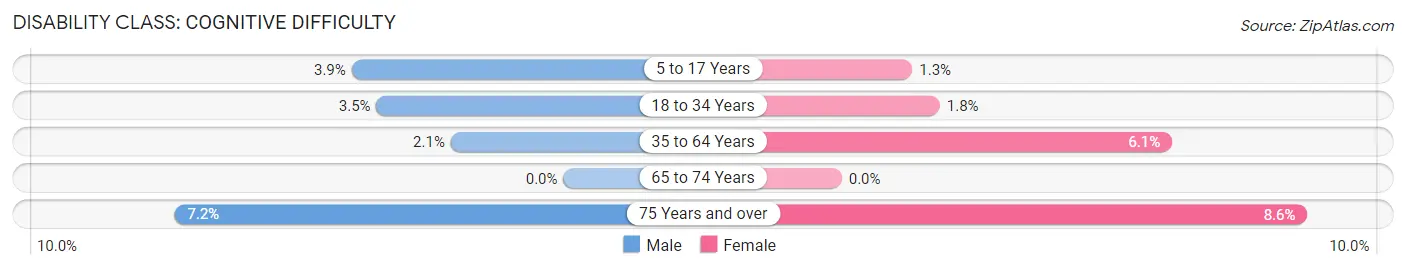
| Age Bracket | Male | Female |
| 5 to 17 Years | 62 (3.9%) | 28 (1.3%) |
| 18 to 34 Years | 72 (3.5%) | 40 (1.8%) |
| 35 to 64 Years | 59 (2.1%) | 170 (6.1%) |
| 65 to 74 Years | 0 (0.0%) | 0 (0.0%) |
| 75 Years and over | 28 (7.2%) | 35 (8.6%) |
Disability Class: Ambulatory Difficulty
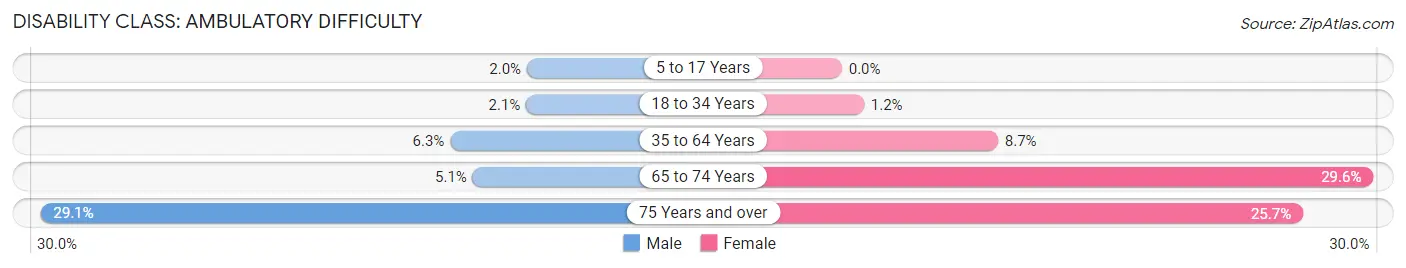
| Age Bracket | Male | Female |
| 5 to 17 Years | 32 (2.0%) | 0 (0.0%) |
| 18 to 34 Years | 43 (2.1%) | 27 (1.2%) |
| 35 to 64 Years | 178 (6.3%) | 241 (8.7%) |
| 65 to 74 Years | 21 (5.1%) | 221 (29.6%) |
| 75 Years and over | 113 (29.1%) | 104 (25.7%) |
Disability Class: Self-Care Difficulty
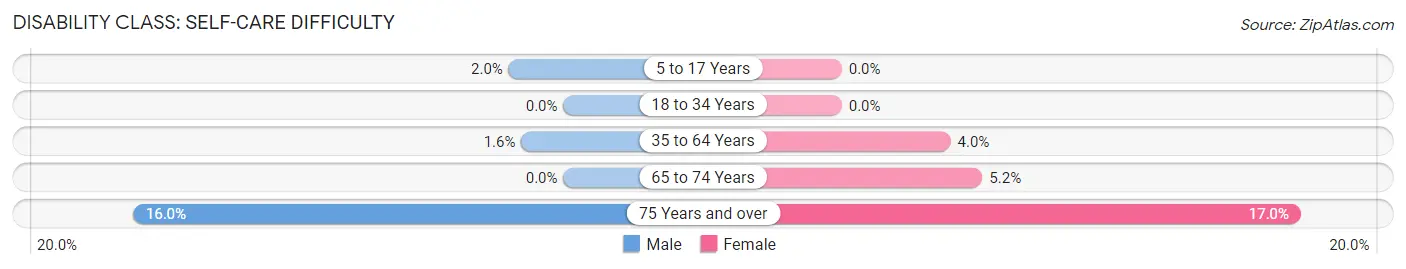
| Age Bracket | Male | Female |
| 5 to 17 Years | 32 (2.0%) | 0 (0.0%) |
| 18 to 34 Years | 0 (0.0%) | 0 (0.0%) |
| 35 to 64 Years | 44 (1.6%) | 112 (4.0%) |
| 65 to 74 Years | 0 (0.0%) | 39 (5.2%) |
| 75 Years and over | 62 (16.0%) | 69 (17.0%) |
Technology Access in Humble
Computing Device Access in Humble
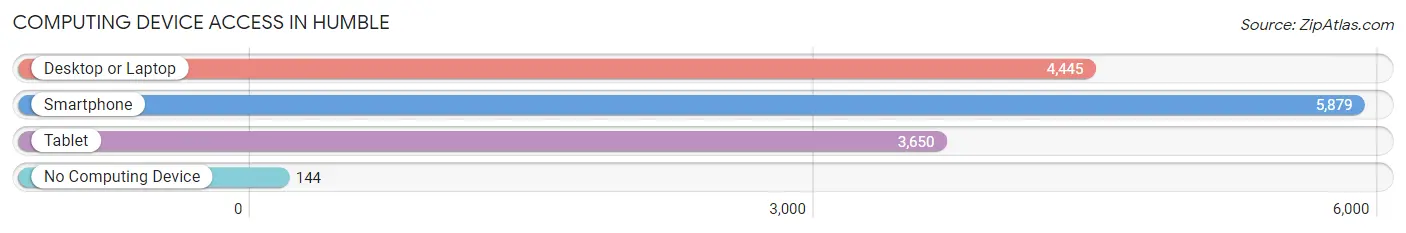
| Device Type | # Households | % Households |
| Desktop or Laptop | 4,445 | 70.0% |
| Smartphone | 5,879 | 92.6% |
| Tablet | 3,650 | 57.5% |
| No Computing Device | 144 | 2.3% |
| Total | 6,347 | 100.0% |
Internet Access in Humble
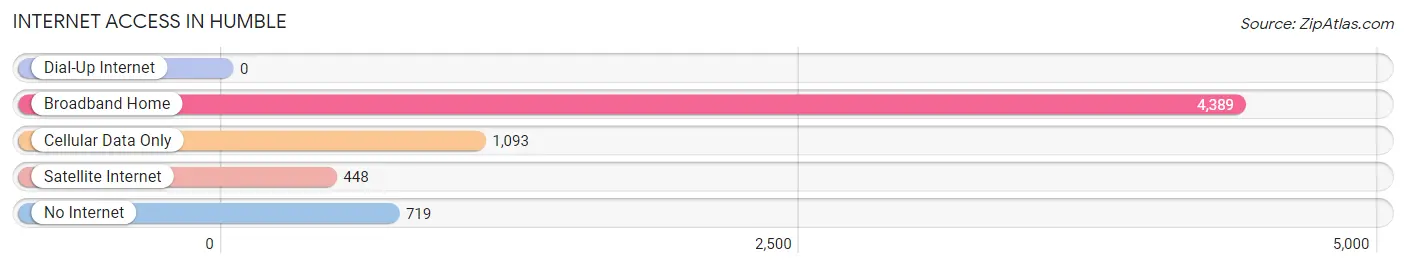
| Internet Type | # Households | % Households |
| Dial-Up Internet | 0 | 0.0% |
| Broadband Home | 4,389 | 69.2% |
| Cellular Data Only | 1,093 | 17.2% |
| Satellite Internet | 448 | 7.1% |
| No Internet | 719 | 11.3% |
| Total | 6,347 | 100.0% |
Humble Summary
Humble, Texas is a city located in Harris County, Texas, United States. It is located approximately 25 miles northeast of downtown Houston. The city is part of the Houston–The Woodlands–Sugar Land metropolitan area. As of the 2010 census, the city population was 15,133.
History
Humble, Texas was founded in 1892 by Pleasant Humble, a civil engineer and land surveyor. He named the city after himself. The city was originally a small farming community, but it quickly grew into a thriving oil town. In 1904, the first oil well was drilled in Humble, and the city soon became a major oil producer. By the 1920s, Humble was home to several oil refineries and was a major center for the oil industry.
In the 1950s, Humble began to diversify its economy and become a bedroom community for Houston. The city experienced rapid growth in the 1970s and 1980s, and by the 1990s, it had become a major suburb of Houston.
Geography
Humble is located at 29°59'45" North, 95°14'45" West (29.995833, -95.245833). It is situated at the intersection of Interstate 69/U.S. Highway 59 and Farm to Market Road 1960. The city is located in the Houston–The Woodlands–Sugar Land metropolitan area.
The city has a total area of 10.3 square miles, of which 10.2 square miles is land and 0.1 square miles is water. The city is located in the humid subtropical climate zone, with hot, humid summers and mild winters.
Economy
Humble’s economy is largely based on the oil and gas industry. The city is home to several oil refineries and is a major center for the oil industry. In addition, the city is home to several large employers, including Halliburton, Schlumberger, and Baker Hughes.
The city also has a growing retail sector, with several shopping centers and malls located in the city. The city is also home to several restaurants, hotels, and other businesses.
Demographics
As of the 2010 census, the city had a population of 15,133. The racial makeup of the city was 63.2% White, 22.3% African American, 0.7% Native American, 4.2% Asian, 0.1% Pacific Islander, 6.2% from other races, and 3.3% from two or more races. Hispanic or Latino of any race were 22.3% of the population.
The median income for a household in the city was $45,945, and the median income for a family was $54,945. The per capita income for the city was $22,945. About 11.2% of families and 14.2% of the population were below the poverty line, including 19.2% of those under age 18 and 8.2% of those age 65 or over.
Humble is served by the Humble Independent School District. The city is also home to Lone Star College, a community college.
Common Questions
What is Per Capita Income in Humble?
Per Capita income in Humble is $27,242.
What is the Median Family Income in Humble?
Median Family Income in Humble is $74,538.
What is the Median Household income in Humble?
Median Household Income in Humble is $58,581.
What is Income or Wage Gap in Humble?
Income or Wage Gap in Humble is 24.9%.
Women in Humble earn 75.1 cents for every dollar earned by a man.
What is Family Income Deficit in Humble?
Family Income Deficit in Humble is $7,768.
Families that are below poverty line in Humble earn $7,768 less on average than the poverty threshold level.
What is Inequality or Gini Index in Humble?
Inequality or Gini Index in Humble is 0.41.
What is the Total Population of Humble?
Total Population of Humble is 16,563.
What is the Total Male Population of Humble?
Total Male Population of Humble is 7,729.
What is the Total Female Population of Humble?
Total Female Population of Humble is 8,834.
What is the Ratio of Males per 100 Females in Humble?
There are 87.49 Males per 100 Females in Humble.
What is the Ratio of Females per 100 Males in Humble?
There are 114.30 Females per 100 Males in Humble.
What is the Median Population Age in Humble?
Median Population Age in Humble is 33.5 Years.
What is the Average Family Size in Humble
Average Family Size in Humble is 3.5 People.
What is the Average Household Size in Humble
Average Household Size in Humble is 2.6 People.
How Large is the Labor Force in Humble?
There are 8,574 People in the Labor Forcein in Humble.
What is the Percentage of People in the Labor Force in Humble?
66.7% of People are in the Labor Force in Humble.
What is the Unemployment Rate in Humble?
Unemployment Rate in Humble is 6.1%.