Emory, TX Map & Demographics
Emory Map
Emory Overview
$23,499
PER CAPITA INCOME
$81,324
AVG FAMILY INCOME
$38,750
AVG HOUSEHOLD INCOME
15.9%
WAGE / INCOME GAP [ % ]
84.1¢/ $1
WAGE / INCOME GAP [ $ ]
0.44
INEQUALITY / GINI INDEX
1,373
TOTAL POPULATION
750
MALE POPULATION
623
FEMALE POPULATION
120.39
MALES / 100 FEMALES
83.07
FEMALES / 100 MALES
32.7
MEDIAN AGE
4.1
AVG FAMILY SIZE
3.2
AVG HOUSEHOLD SIZE
668
LABOR FORCE [ PEOPLE ]
61.0%
PERCENT IN LABOR FORCE
3.0%
UNEMPLOYMENT RATE
Emory Zip Codes
Emory Area Codes
Income in Emory
Income Overview in Emory
Per Capita Income in Emory is $23,499, while median incomes of families and households are $81,324 and $38,750 respectively.
| Characteristic | Number | Measure |
| Per Capita Income | 1,373 | $23,499 |
| Median Family Income | 268 | $81,324 |
| Mean Family Income | 268 | $79,822 |
| Median Household Income | 410 | $38,750 |
| Mean Household Income | 410 | $62,103 |
| Income Deficit | 268 | $0 |
| Wage / Income Gap (%) | 1,373 | 15.85% |
| Wage / Income Gap ($) | 1,373 | 84.15¢ per $1 |
| Gini / Inequality Index | 1,373 | 0.44 |
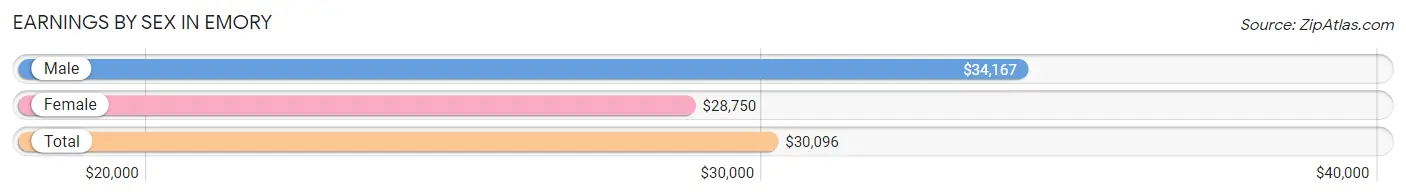
Earnings by Sex in Emory
Average Earnings in Emory are $30,096, $34,167 for men and $28,750 for women, a difference of 15.9%.
| Sex | Number | Average Earnings |
| Male | 434 (60.5%) | $34,167 |
| Female | 283 (39.5%) | $28,750 |
| Total | 717 (100.0%) | $30,096 |
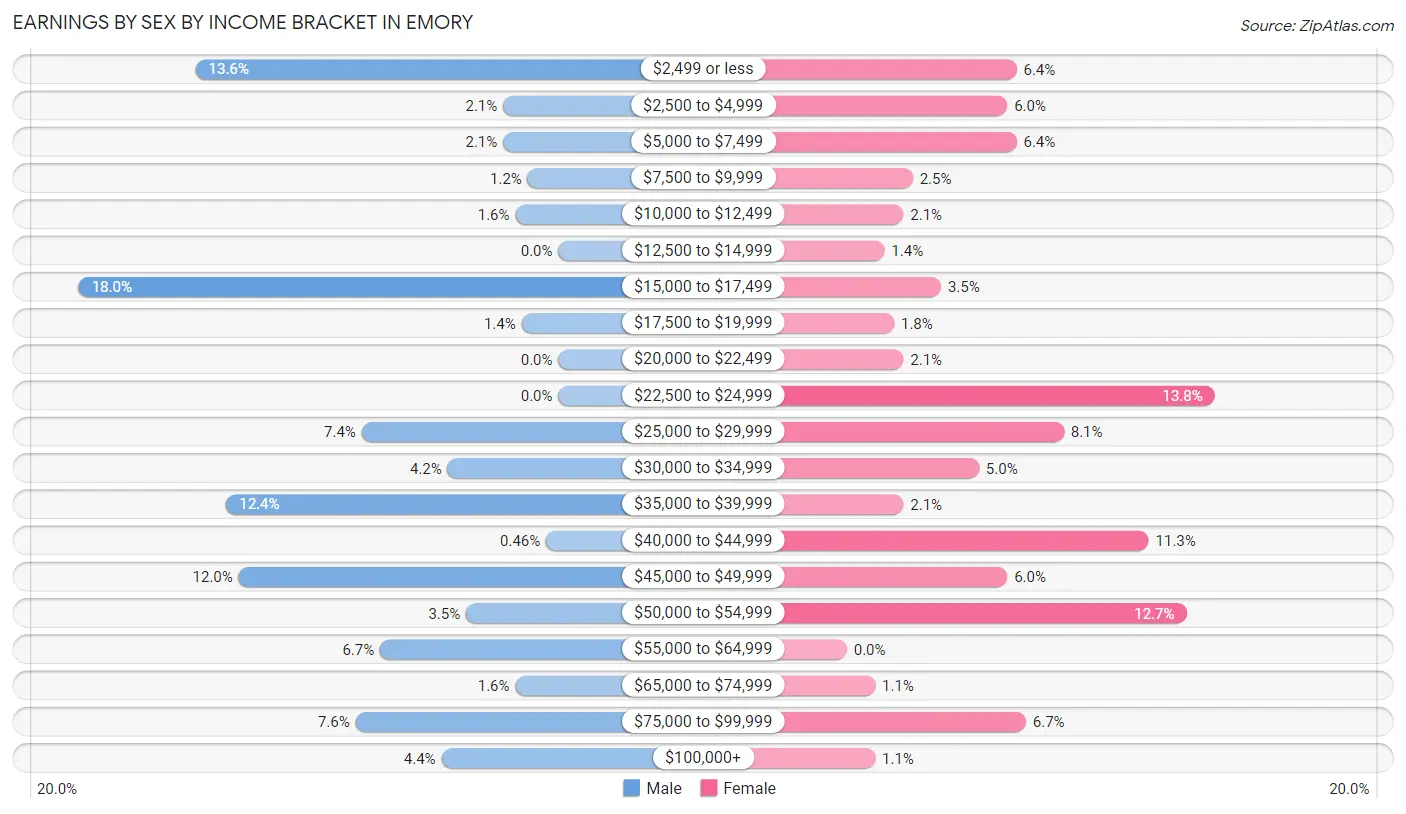
Earnings by Sex by Income Bracket in Emory
The most common earnings brackets in Emory are $15,000 to $17,499 for men (78 | 18.0%) and $22,500 to $24,999 for women (39 | 13.8%).
| Income | Male | Female |
| $2,499 or less | 59 (13.6%) | 18 (6.4%) |
| $2,500 to $4,999 | 9 (2.1%) | 17 (6.0%) |
| $5,000 to $7,499 | 9 (2.1%) | 18 (6.4%) |
| $7,500 to $9,999 | 5 (1.1%) | 7 (2.5%) |
| $10,000 to $12,499 | 7 (1.6%) | 6 (2.1%) |
| $12,500 to $14,999 | 0 (0.0%) | 4 (1.4%) |
| $15,000 to $17,499 | 78 (18.0%) | 10 (3.5%) |
| $17,500 to $19,999 | 6 (1.4%) | 5 (1.8%) |
| $20,000 to $22,499 | 0 (0.0%) | 6 (2.1%) |
| $22,500 to $24,999 | 0 (0.0%) | 39 (13.8%) |
| $25,000 to $29,999 | 32 (7.4%) | 23 (8.1%) |
| $30,000 to $34,999 | 18 (4.2%) | 14 (5.0%) |
| $35,000 to $39,999 | 54 (12.4%) | 6 (2.1%) |
| $40,000 to $44,999 | 2 (0.5%) | 32 (11.3%) |
| $45,000 to $49,999 | 52 (12.0%) | 17 (6.0%) |
| $50,000 to $54,999 | 15 (3.5%) | 36 (12.7%) |
| $55,000 to $64,999 | 29 (6.7%) | 0 (0.0%) |
| $65,000 to $74,999 | 7 (1.6%) | 3 (1.1%) |
| $75,000 to $99,999 | 33 (7.6%) | 19 (6.7%) |
| $100,000+ | 19 (4.4%) | 3 (1.1%) |
| Total | 434 (100.0%) | 283 (100.0%) |
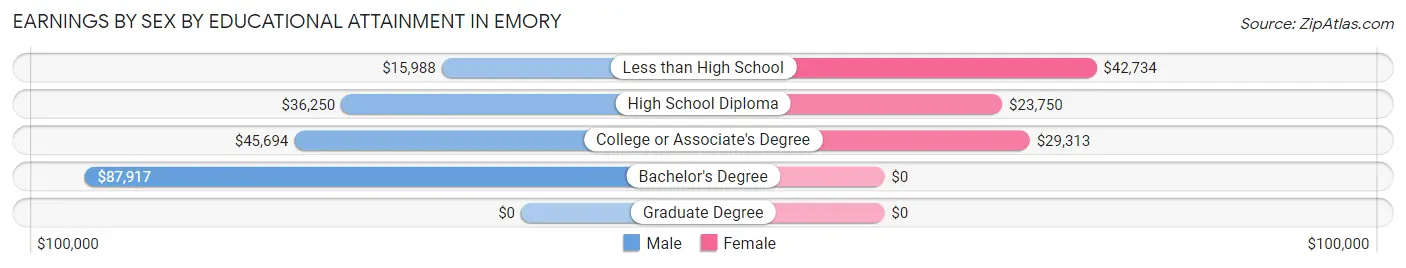
Earnings by Sex by Educational Attainment in Emory
Average earnings in Emory are $34,653 for men and $30,192 for women, a difference of 12.9%. Men with an educational attainment of bachelor's degree enjoy the highest average annual earnings of $87,917, while those with less than high school education earn the least with $15,988. Women with an educational attainment of less than high school earn the most with the average annual earnings of $42,734, while those with high school diploma education have the smallest earnings of $23,750.
| Educational Attainment | Male Income | Female Income |
| Less than High School | $15,988 | $42,734 |
| High School Diploma | $36,250 | $23,750 |
| College or Associate's Degree | $45,694 | $29,313 |
| Bachelor's Degree | $87,917 | $0 |
| Graduate Degree | - | - |
| Total | $34,653 | $30,192 |
Family Income in Emory
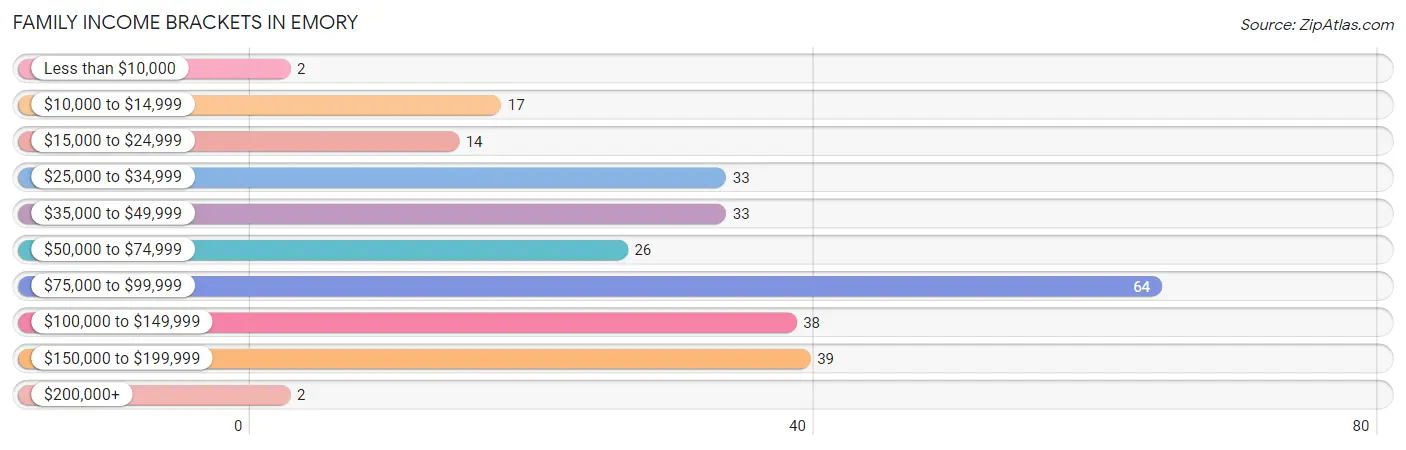
Family Income Brackets in Emory
According to the Emory family income data, there are 64 families falling into the $75,000 to $99,999 income range, which is the most common income bracket and makes up 23.9% of all families. Conversely, the less than $10,000 income bracket is the least frequent group with only 2 families (0.7%) belonging to this category.
| Income Bracket | # Families | % Families |
| Less than $10,000 | 2 | 0.7% |
| $10,000 to $14,999 | 17 | 6.3% |
| $15,000 to $24,999 | 14 | 5.2% |
| $25,000 to $34,999 | 33 | 12.3% |
| $35,000 to $49,999 | 33 | 12.3% |
| $50,000 to $74,999 | 26 | 9.7% |
| $75,000 to $99,999 | 64 | 23.9% |
| $100,000 to $149,999 | 38 | 14.2% |
| $150,000 to $199,999 | 39 | 14.6% |
| $200,000+ | 2 | 0.7% |
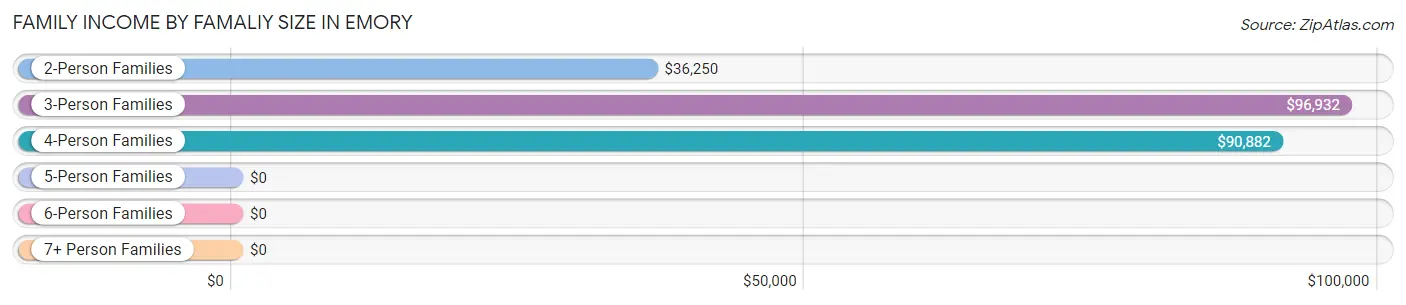
Family Income by Famaliy Size in Emory
3-person families (49 | 18.3%) account for the highest median family income in Emory with $96,932 per family, while 3-person families (49 | 18.3%) have the highest median income of $32,311 per family member.
| Income Bracket | # Families | Median Income |
| 2-Person Families | 95 (35.4%) | $36,250 |
| 3-Person Families | 49 (18.3%) | $96,932 |
| 4-Person Families | 74 (27.6%) | $90,882 |
| 5-Person Families | 41 (15.3%) | $0 |
| 6-Person Families | 9 (3.4%) | $0 |
| 7+ Person Families | 0 (0.0%) | $0 |
| Total | 268 (100.0%) | $81,324 |
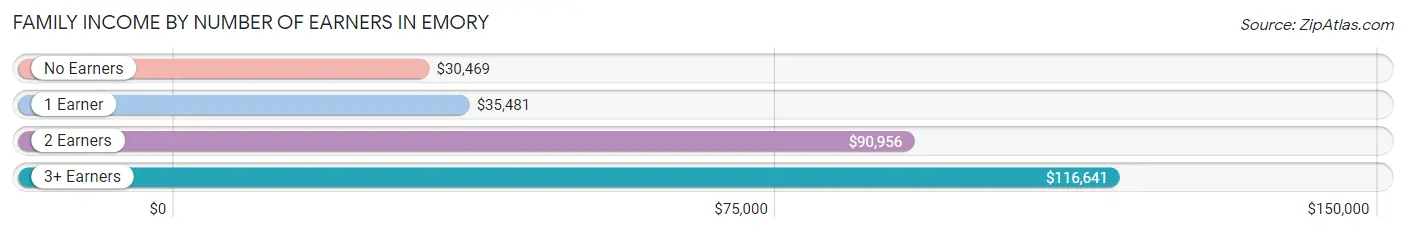
Family Income by Number of Earners in Emory
The median family income in Emory is $81,324, with families comprising 3+ earners (43) having the highest median family income of $116,641, while families with no earners (13) have the lowest median family income of $30,469, accounting for 16.0% and 4.9% of families, respectively.
| Number of Earners | # Families | Median Income |
| No Earners | 13 (4.9%) | $30,469 |
| 1 Earner | 93 (34.7%) | $35,481 |
| 2 Earners | 119 (44.4%) | $90,956 |
| 3+ Earners | 43 (16.0%) | $116,641 |
| Total | 268 (100.0%) | $81,324 |
Household Income in Emory
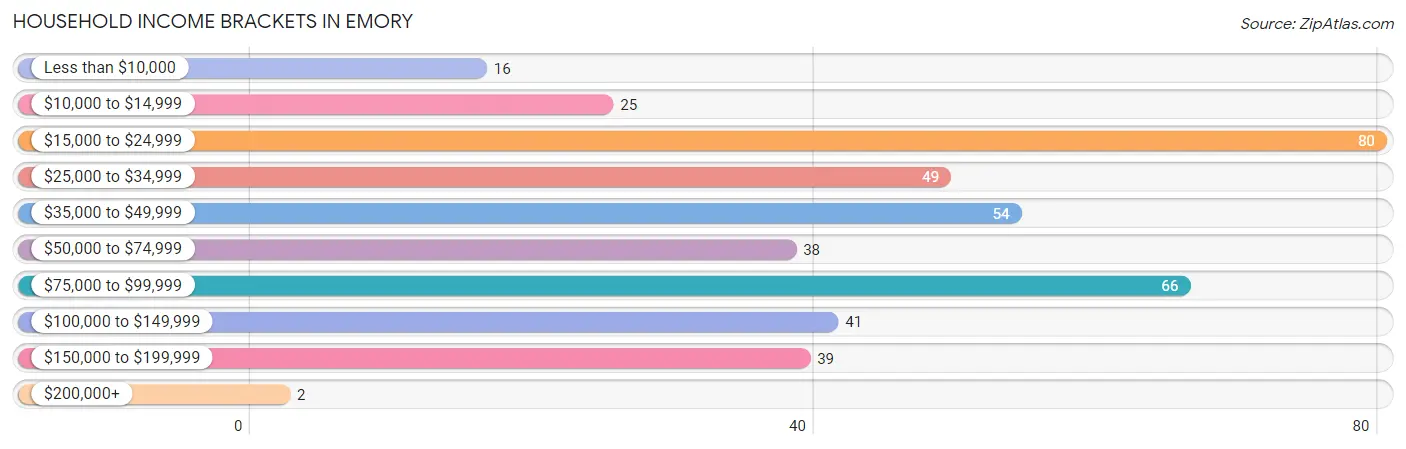
Household Income Brackets in Emory
With 80 households falling in the category, the $15,000 to $24,999 income range is the most frequent in Emory, accounting for 19.5% of all households. In contrast, only 2 households (0.5%) fall into the $200,000+ income bracket, making it the least populous group.
| Income Bracket | # Households | % Households |
| Less than $10,000 | 16 | 3.9% |
| $10,000 to $14,999 | 25 | 6.1% |
| $15,000 to $24,999 | 80 | 19.5% |
| $25,000 to $34,999 | 49 | 12.0% |
| $35,000 to $49,999 | 54 | 13.2% |
| $50,000 to $74,999 | 38 | 9.3% |
| $75,000 to $99,999 | 66 | 16.1% |
| $100,000 to $149,999 | 41 | 10.0% |
| $150,000 to $199,999 | 39 | 9.5% |
| $200,000+ | 2 | 0.5% |
Household Income by Householder Age in Emory
The median household income in Emory is $38,750, with the highest median household income of $81,544 found in the 45 to 64 years age bracket for the primary householder. A total of 131 households (32.0%) fall into this category. Meanwhile, the 25 to 44 years age bracket for the primary householder has the lowest median household income of $0, with 107 households (26.1%) in this group.
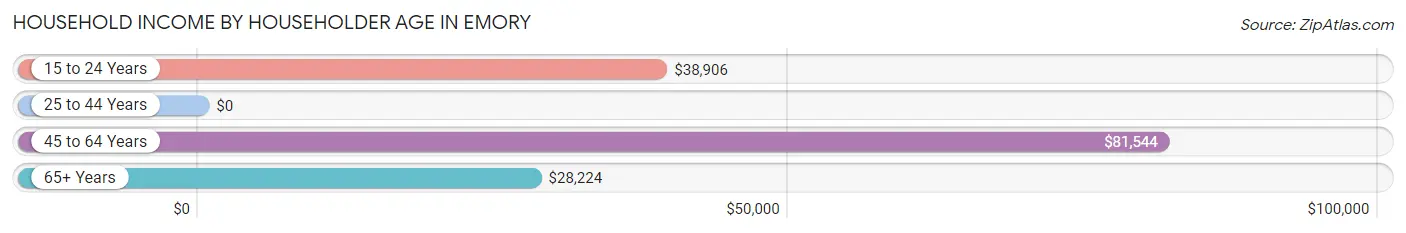
| Income Bracket | # Households | Median Income |
| 15 to 24 Years | 13 (3.2%) | $38,906 |
| 25 to 44 Years | 107 (26.1%) | $0 |
| 45 to 64 Years | 131 (32.0%) | $81,544 |
| 65+ Years | 159 (38.8%) | $28,224 |
| Total | 410 (100.0%) | $38,750 |
Poverty in Emory
Income Below Poverty by Sex and Age in Emory
With 12.6% poverty level for males and 21.3% for females among the residents of Emory, 6 to 11 year old males and 12 to 14 year old females are the most vulnerable to poverty, with 9 males (100.0%) and 15 females (71.4%) in their respective age groups living below the poverty level.
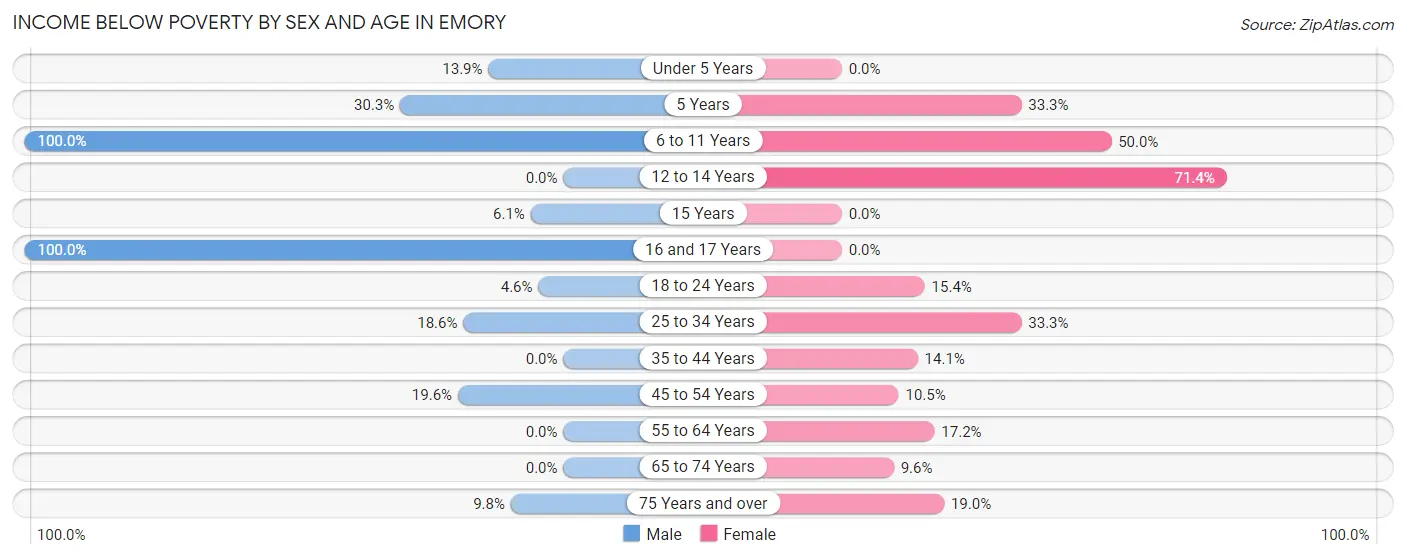
| Age Bracket | Male | Female |
| Under 5 Years | 11 (13.9%) | 0 (0.0%) |
| 5 Years | 10 (30.3%) | 3 (33.3%) |
| 6 to 11 Years | 9 (100.0%) | 24 (50.0%) |
| 12 to 14 Years | 0 (0.0%) | 15 (71.4%) |
| 15 Years | 2 (6.1%) | 0 (0.0%) |
| 16 and 17 Years | 13 (100.0%) | 0 (0.0%) |
| 18 to 24 Years | 7 (4.6%) | 6 (15.4%) |
| 25 to 34 Years | 26 (18.6%) | 31 (33.3%) |
| 35 to 44 Years | 0 (0.0%) | 10 (14.1%) |
| 45 to 54 Years | 9 (19.6%) | 6 (10.5%) |
| 55 to 64 Years | 0 (0.0%) | 11 (17.2%) |
| 65 to 74 Years | 0 (0.0%) | 8 (9.6%) |
| 75 Years and over | 4 (9.8%) | 11 (19.0%) |
| Total | 91 (12.6%) | 125 (21.3%) |
Income Above Poverty by Sex and Age in Emory
According to the poverty statistics in Emory, males aged 12 to 14 years and females aged under 5 years are the age groups that are most secure financially, with 100.0% of males and 100.0% of females in these age groups living above the poverty line.
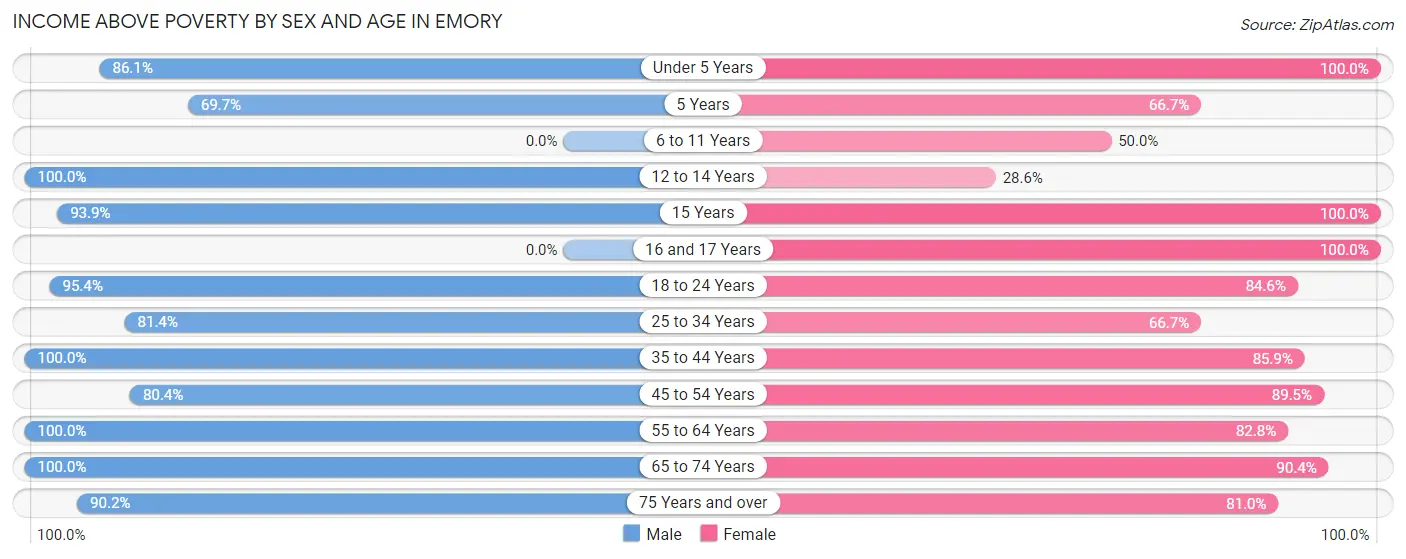
| Age Bracket | Male | Female |
| Under 5 Years | 68 (86.1%) | 34 (100.0%) |
| 5 Years | 23 (69.7%) | 6 (66.7%) |
| 6 to 11 Years | 0 (0.0%) | 24 (50.0%) |
| 12 to 14 Years | 9 (100.0%) | 6 (28.6%) |
| 15 Years | 31 (93.9%) | 3 (100.0%) |
| 16 and 17 Years | 0 (0.0%) | 7 (100.0%) |
| 18 to 24 Years | 144 (95.4%) | 33 (84.6%) |
| 25 to 34 Years | 114 (81.4%) | 62 (66.7%) |
| 35 to 44 Years | 84 (100.0%) | 61 (85.9%) |
| 45 to 54 Years | 37 (80.4%) | 51 (89.5%) |
| 55 to 64 Years | 70 (100.0%) | 53 (82.8%) |
| 65 to 74 Years | 14 (100.0%) | 75 (90.4%) |
| 75 Years and over | 37 (90.2%) | 47 (81.0%) |
| Total | 631 (87.4%) | 462 (78.7%) |
Income Below Poverty Among Married-Couple Families in Emory
The poverty statistics for married-couple families in Emory show that 6.8% or 11 of the total 162 families live below the poverty line. Families with 1 or 2 children have the highest poverty rate of 8.0%, comprising of 8 families. On the other hand, families with no children have the lowest poverty rate of 4.8%, which includes 3 families.
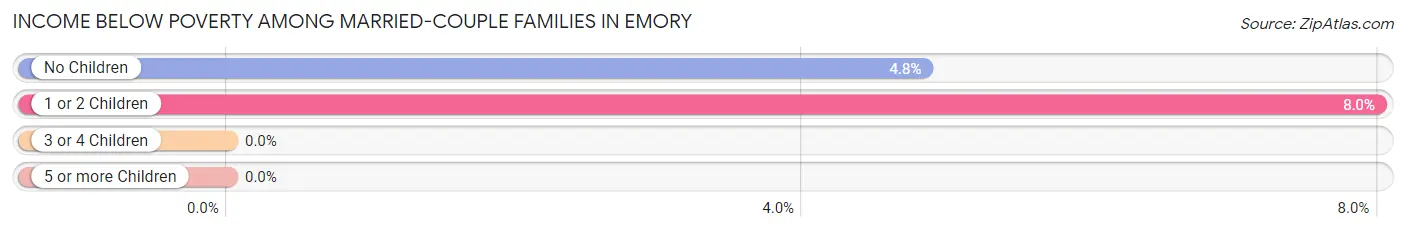
| Children | Above Poverty | Below Poverty |
| No Children | 59 (95.2%) | 3 (4.8%) |
| 1 or 2 Children | 92 (92.0%) | 8 (8.0%) |
| 3 or 4 Children | 0 (0.0%) | 0 (0.0%) |
| 5 or more Children | 0 (0.0%) | 0 (0.0%) |
| Total | 151 (93.2%) | 11 (6.8%) |
Income Below Poverty Among Single-Parent Households in Emory
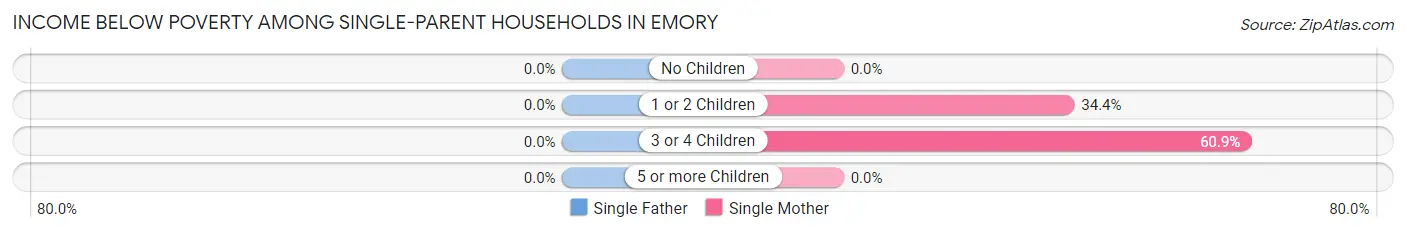
| Children | Single Father | Single Mother |
| No Children | 0 (0.0%) | 0 (0.0%) |
| 1 or 2 Children | 0 (0.0%) | 11 (34.4%) |
| 3 or 4 Children | 0 (0.0%) | 14 (60.9%) |
| 5 or more Children | 0 (0.0%) | 0 (0.0%) |
| Total | 0 (0.0%) | 25 (28.7%) |
Income Below Poverty Among Married-Couple vs Single-Parent Households in Emory
The poverty data for Emory shows that 11 of the married-couple family households (6.8%) and 25 of the single-parent households (23.6%) are living below the poverty level. Within the married-couple family households, those with 1 or 2 children have the highest poverty rate, with 8 households (8.0%) falling below the poverty line. Among the single-parent households, those with 3 or 4 children have the highest poverty rate, with 14 household (60.9%) living below poverty.
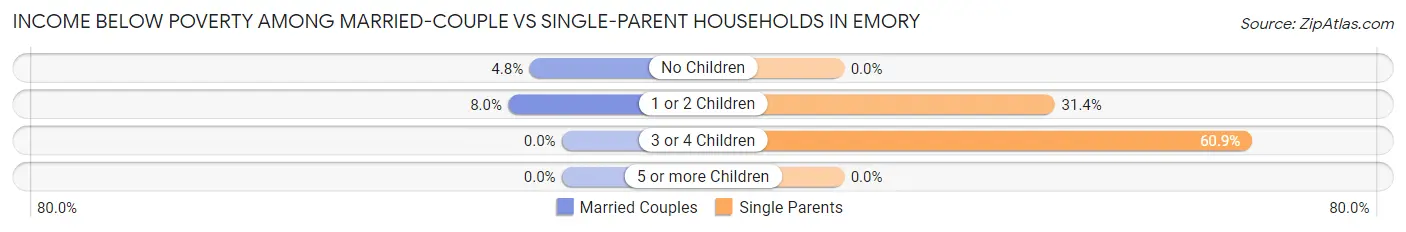
| Children | Married-Couple Families | Single-Parent Households |
| No Children | 3 (4.8%) | 0 (0.0%) |
| 1 or 2 Children | 8 (8.0%) | 11 (31.4%) |
| 3 or 4 Children | 0 (0.0%) | 14 (60.9%) |
| 5 or more Children | 0 (0.0%) | 0 (0.0%) |
| Total | 11 (6.8%) | 25 (23.6%) |
Race in Emory
The most populous races in Emory are White / Caucasian (1,166 | 84.9%), Black / African American (150 | 10.9%), and Hispanic or Latino (47 | 3.4%).
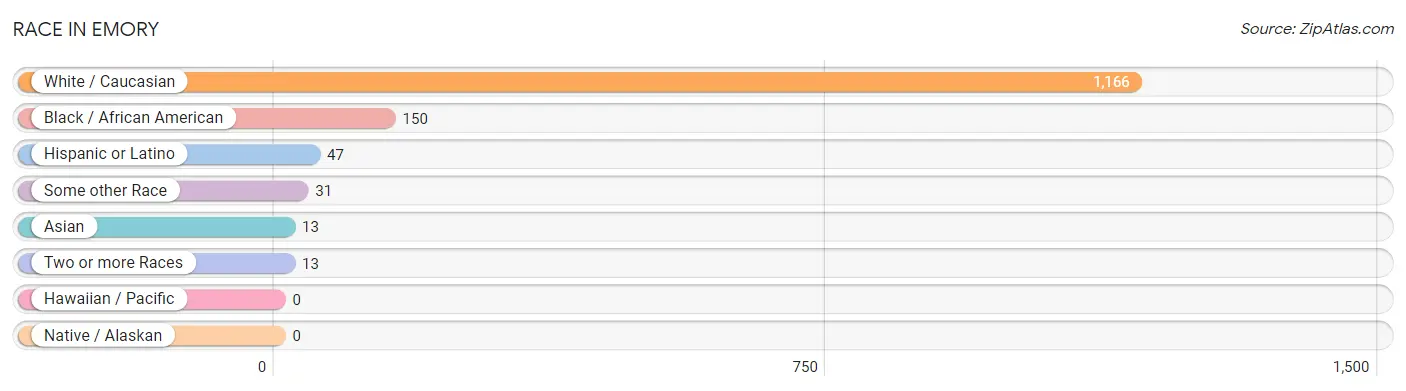
| Race | # Population | % Population |
| Asian | 13 | 0.9% |
| Black / African American | 150 | 10.9% |
| Hawaiian / Pacific | 0 | 0.0% |
| Hispanic or Latino | 47 | 3.4% |
| Native / Alaskan | 0 | 0.0% |
| White / Caucasian | 1,166 | 84.9% |
| Two or more Races | 13 | 0.9% |
| Some other Race | 31 | 2.3% |
| Total | 1,373 | 100.0% |
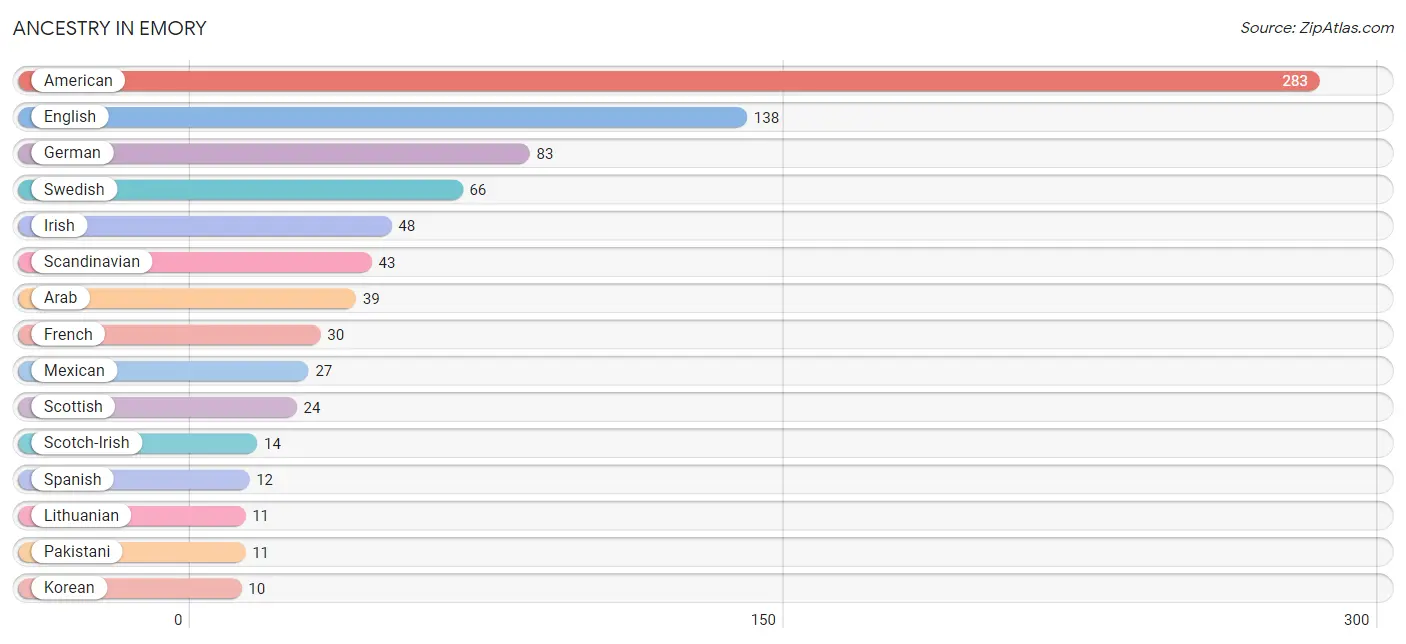
Ancestry in Emory
The most populous ancestries reported in Emory are American (283 | 20.6%), English (138 | 10.1%), German (83 | 6.0%), Swedish (66 | 4.8%), and Irish (48 | 3.5%), together accounting for 45.0% of all Emory residents.
| Ancestry | # Population | % Population |
| African | 5 | 0.4% |
| American | 283 | 20.6% |
| Apache | 2 | 0.2% |
| Arab | 39 | 2.8% |
| Belgian | 6 | 0.4% |
| British | 3 | 0.2% |
| Czech | 4 | 0.3% |
| English | 138 | 10.1% |
| European | 5 | 0.4% |
| French | 30 | 2.2% |
| German | 83 | 6.0% |
| Greek | 5 | 0.4% |
| Hungarian | 1 | 0.1% |
| Irish | 48 | 3.5% |
| Italian | 6 | 0.4% |
| Jordanian | 9 | 0.7% |
| Korean | 10 | 0.7% |
| Lithuanian | 11 | 0.8% |
| Mexican | 27 | 2.0% |
| Norwegian | 7 | 0.5% |
| Pakistani | 11 | 0.8% |
| Scandinavian | 43 | 3.1% |
| Scotch-Irish | 14 | 1.0% |
| Scottish | 24 | 1.8% |
| Spanish | 12 | 0.9% |
| Subsaharan African | 5 | 0.4% |
| Swedish | 66 | 4.8% |
| Welsh | 1 | 0.1% | View All 28 Rows |
Immigrants in Emory
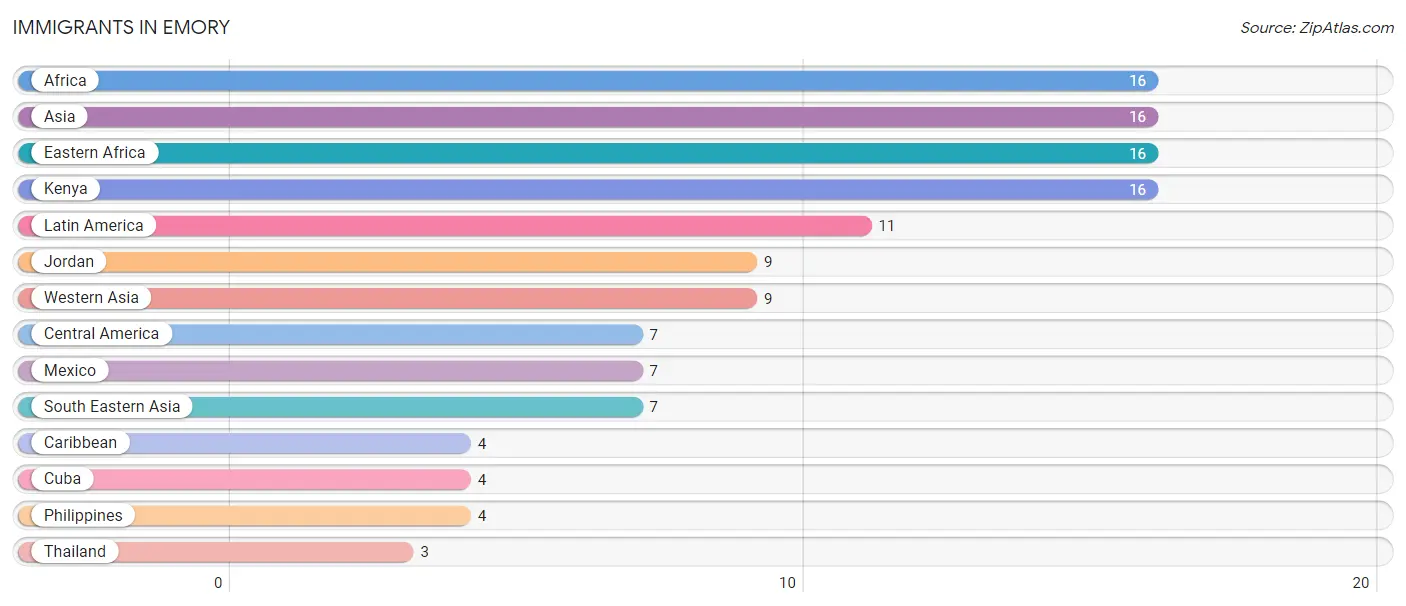
The most numerous immigrant groups reported in Emory came from Africa (16 | 1.2%), Asia (16 | 1.2%), Eastern Africa (16 | 1.2%), Kenya (16 | 1.2%), and Latin America (11 | 0.8%), together accounting for 5.5% of all Emory residents.
| Immigration Origin | # Population | % Population |
| Africa | 16 | 1.2% |
| Asia | 16 | 1.2% |
| Caribbean | 4 | 0.3% |
| Central America | 7 | 0.5% |
| Cuba | 4 | 0.3% |
| Eastern Africa | 16 | 1.2% |
| Jordan | 9 | 0.7% |
| Kenya | 16 | 1.2% |
| Latin America | 11 | 0.8% |
| Mexico | 7 | 0.5% |
| Philippines | 4 | 0.3% |
| South Eastern Asia | 7 | 0.5% |
| Thailand | 3 | 0.2% |
| Western Asia | 9 | 0.7% | View All 14 Rows |
Sex and Age in Emory
Sex and Age in Emory
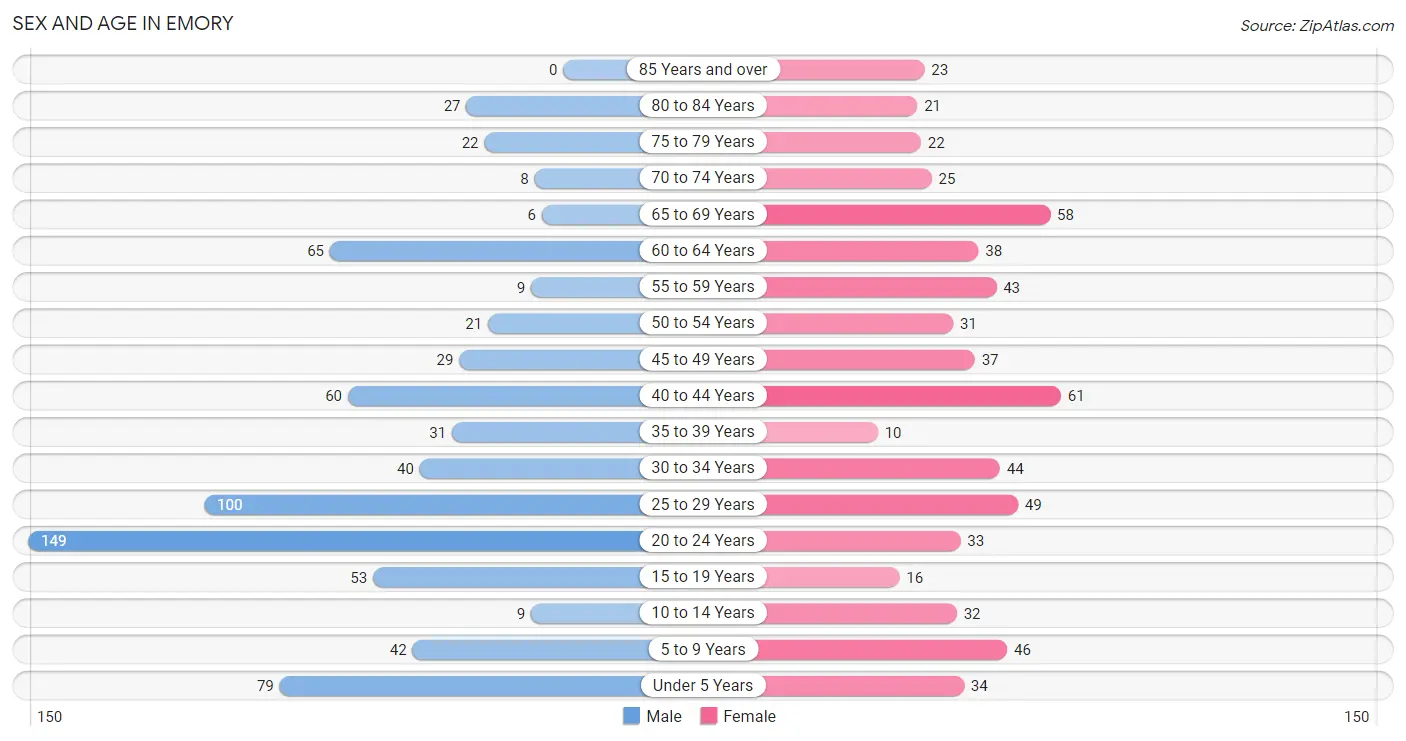
The most populous age groups in Emory are 20 to 24 Years (149 | 19.9%) for men and 40 to 44 Years (61 | 9.8%) for women.
| Age Bracket | Male | Female |
| Under 5 Years | 79 (10.5%) | 34 (5.5%) |
| 5 to 9 Years | 42 (5.6%) | 46 (7.4%) |
| 10 to 14 Years | 9 (1.2%) | 32 (5.1%) |
| 15 to 19 Years | 53 (7.1%) | 16 (2.6%) |
| 20 to 24 Years | 149 (19.9%) | 33 (5.3%) |
| 25 to 29 Years | 100 (13.3%) | 49 (7.9%) |
| 30 to 34 Years | 40 (5.3%) | 44 (7.1%) |
| 35 to 39 Years | 31 (4.1%) | 10 (1.6%) |
| 40 to 44 Years | 60 (8.0%) | 61 (9.8%) |
| 45 to 49 Years | 29 (3.9%) | 37 (5.9%) |
| 50 to 54 Years | 21 (2.8%) | 31 (5.0%) |
| 55 to 59 Years | 9 (1.2%) | 43 (6.9%) |
| 60 to 64 Years | 65 (8.7%) | 38 (6.1%) |
| 65 to 69 Years | 6 (0.8%) | 58 (9.3%) |
| 70 to 74 Years | 8 (1.1%) | 25 (4.0%) |
| 75 to 79 Years | 22 (2.9%) | 22 (3.5%) |
| 80 to 84 Years | 27 (3.6%) | 21 (3.4%) |
| 85 Years and over | 0 (0.0%) | 23 (3.7%) |
| Total | 750 (100.0%) | 623 (100.0%) |
Families and Households in Emory
Median Family Size in Emory
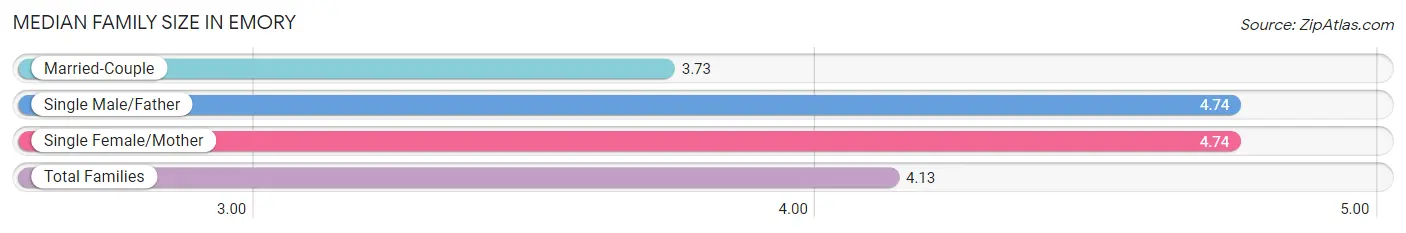
The median family size in Emory is 4.13 persons per family, with single male/father families (19 | 7.1%) accounting for the largest median family size of 4.74 persons per family. On the other hand, married-couple families (162 | 60.5%) represent the smallest median family size with 3.73 persons per family.
| Family Type | # Families | Family Size |
| Married-Couple | 162 (60.5%) | 3.73 |
| Single Male/Father | 19 (7.1%) | 4.74 |
| Single Female/Mother | 87 (32.5%) | 4.74 |
| Total Families | 268 (100.0%) | 4.13 |
Median Household Size in Emory
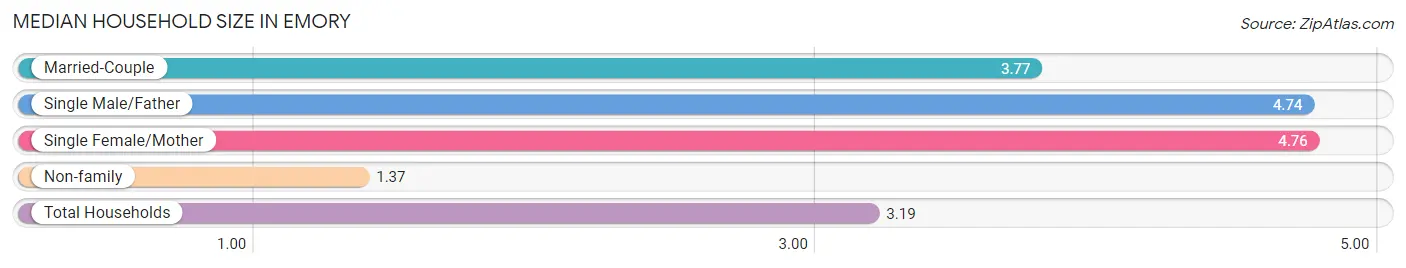
The median household size in Emory is 3.19 persons per household, with single female/mother households (87 | 21.2%) accounting for the largest median household size of 4.76 persons per household. non-family households (142 | 34.6%) represent the smallest median household size with 1.37 persons per household.
| Household Type | # Households | Household Size |
| Married-Couple | 162 (39.5%) | 3.77 |
| Single Male/Father | 19 (4.6%) | 4.74 |
| Single Female/Mother | 87 (21.2%) | 4.76 |
| Non-family | 142 (34.6%) | 1.37 |
| Total Households | 410 (100.0%) | 3.19 |
Household Size by Marriage Status in Emory
Out of a total of 410 households in Emory, 268 (65.4%) are family households, while 142 (34.6%) are nonfamily households. The most numerous type of family households are 2-person households, comprising 90, and the most common type of nonfamily households are 1-person households, comprising 128.
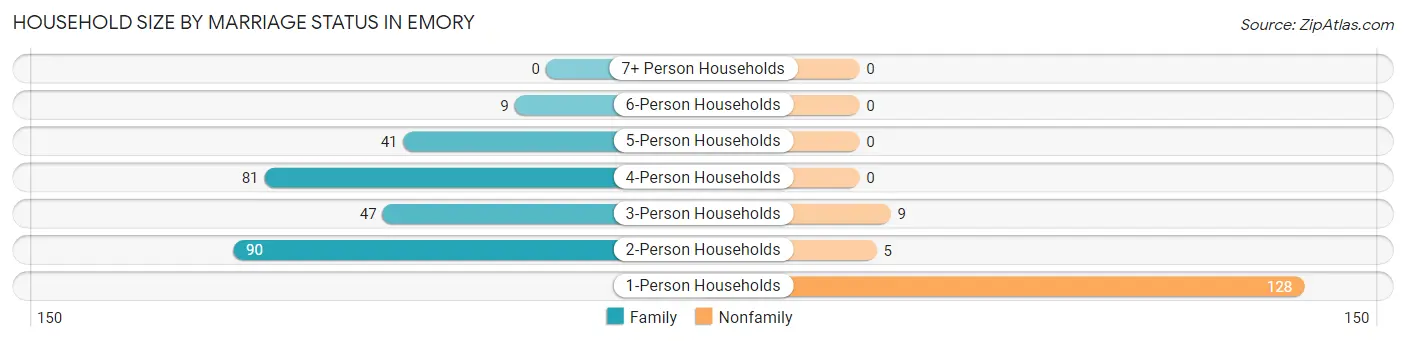
| Household Size | Family Households | Nonfamily Households |
| 1-Person Households | - | 128 (31.2%) |
| 2-Person Households | 90 (22.0%) | 5 (1.2%) |
| 3-Person Households | 47 (11.5%) | 9 (2.2%) |
| 4-Person Households | 81 (19.8%) | 0 (0.0%) |
| 5-Person Households | 41 (10.0%) | 0 (0.0%) |
| 6-Person Households | 9 (2.2%) | 0 (0.0%) |
| 7+ Person Households | 0 (0.0%) | 0 (0.0%) |
| Total | 268 (65.4%) | 142 (34.6%) |
Female Fertility in Emory
Fertility by Age in Emory
Average fertility rate in Emory is 36.0 births per 1,000 women. Women in the age bracket of 20 to 34 years have the highest fertility rate with 71.0 births per 1,000 women. Women in the age bracket of 20 to 34 years acount for 100.0% of all women with births.
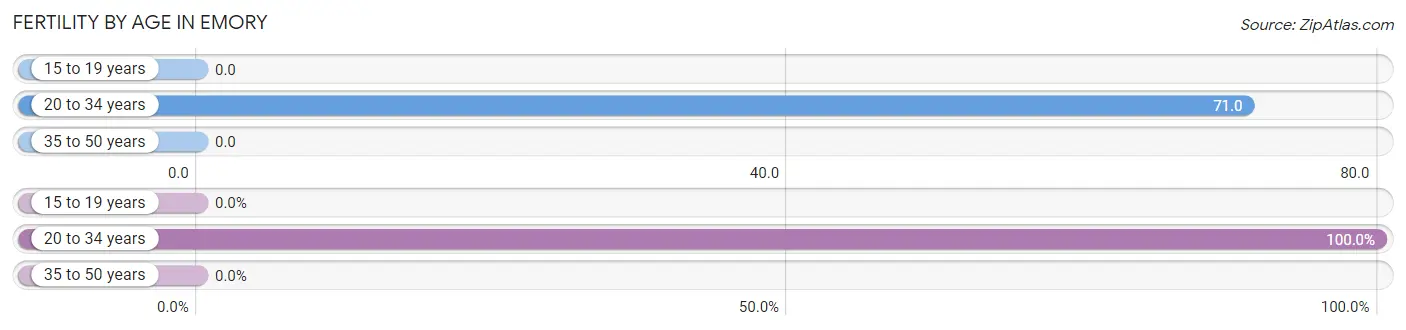
| Age Bracket | Women with Births | Births / 1,000 Women |
| 15 to 19 years | 0 (0.0%) | 0.0 |
| 20 to 34 years | 9 (100.0%) | 71.0 |
| 35 to 50 years | 0 (0.0%) | 0.0 |
| Total | 9 (100.0%) | 36.0 |
Fertility by Age by Marriage Status in Emory
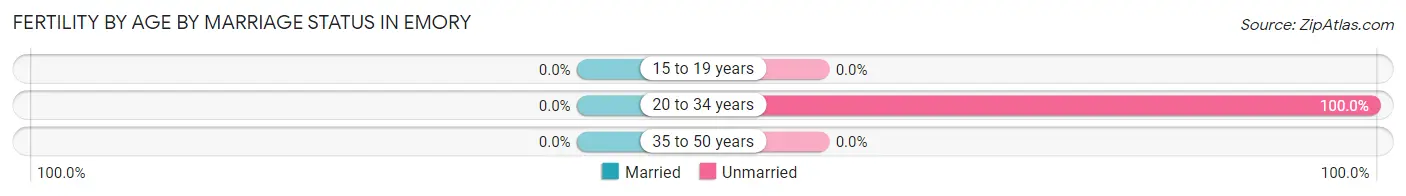
| Age Bracket | Married | Unmarried |
| 15 to 19 years | 0 (0.0%) | 0 (0.0%) |
| 20 to 34 years | 0 (0.0%) | 9 (100.0%) |
| 35 to 50 years | 0 (0.0%) | 0 (0.0%) |
| Total | 0 (0.0%) | 9 (100.0%) |
Fertility by Education in Emory
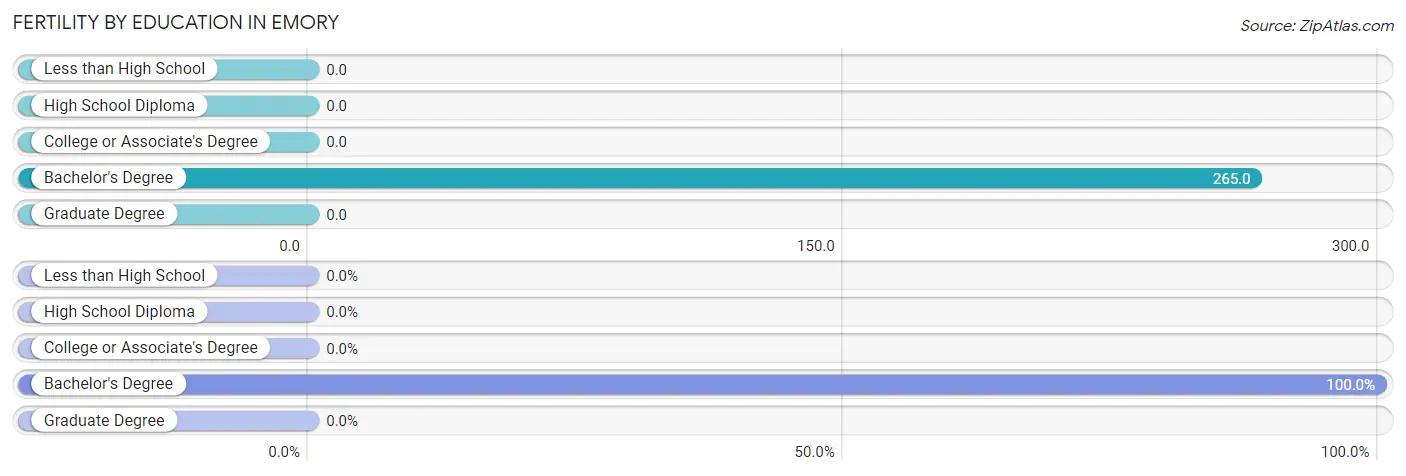
| Educational Attainment | Women with Births | Births / 1,000 Women |
| Less than High School | 0 (0.0%) | 0.0 |
| High School Diploma | 0 (0.0%) | 0.0 |
| College or Associate's Degree | 0 (0.0%) | 0.0 |
| Bachelor's Degree | 9 (100.0%) | 265.0 |
| Graduate Degree | 0 (0.0%) | 0.0 |
| Total | 9 (100.0%) | 36.0 |
Fertility by Education by Marriage Status in Emory
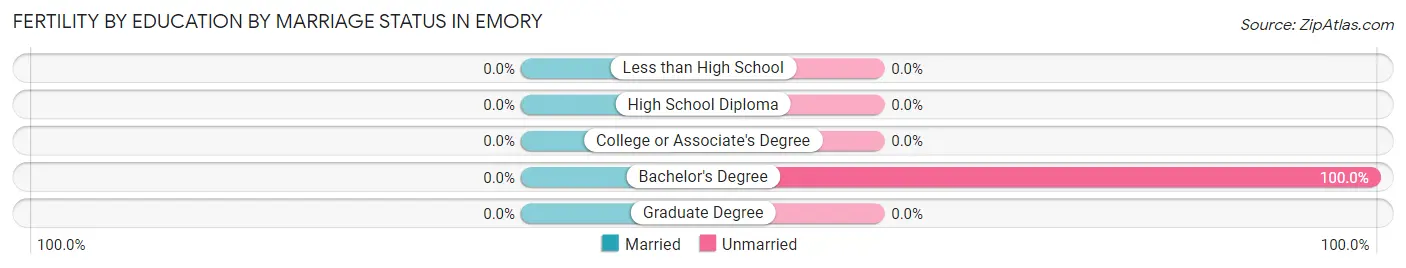
| Educational Attainment | Married | Unmarried |
| Less than High School | 0 (0.0%) | 0 (0.0%) |
| High School Diploma | 0 (0.0%) | 0 (0.0%) |
| College or Associate's Degree | 0 (0.0%) | 0 (0.0%) |
| Bachelor's Degree | 0 (0.0%) | 9 (100.0%) |
| Graduate Degree | 0 (0.0%) | 0 (0.0%) |
| Total | 0 (0.0%) | 9 (100.0%) |
Employment Characteristics in Emory
Employment by Class of Employer in Emory
Among the 628 employed individuals in Emory, private company employees (396 | 63.1%), not-for-profit organizations (68 | 10.8%), and self-employed (not incorporated) (55 | 8.8%) make up the most common classes of employment.
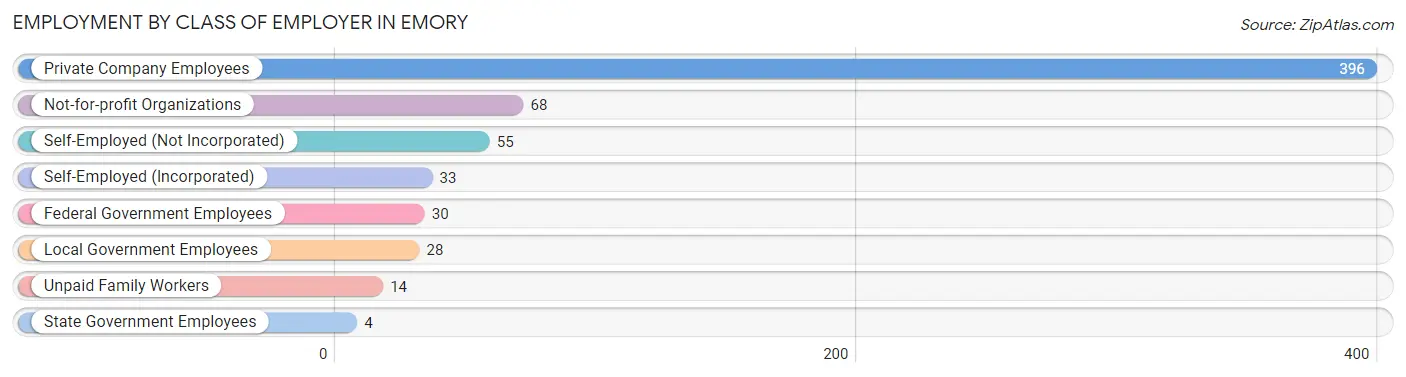
| Employer Class | # Employees | % Employees |
| Private Company Employees | 396 | 63.1% |
| Self-Employed (Incorporated) | 33 | 5.2% |
| Self-Employed (Not Incorporated) | 55 | 8.8% |
| Not-for-profit Organizations | 68 | 10.8% |
| Local Government Employees | 28 | 4.5% |
| State Government Employees | 4 | 0.6% |
| Federal Government Employees | 30 | 4.8% |
| Unpaid Family Workers | 14 | 2.2% |
| Total | 628 | 100.0% |
Employment Status by Age in Emory
According to the labor force statistics for Emory, out of the total population over 16 years of age (1,095), 61.0% or 668 individuals are in the labor force, with 3.0% or 20 of them unemployed. The age group with the highest labor force participation rate is 25 to 29 years, with 89.9% or 134 individuals in the labor force. Within the labor force, the 16 to 19 years age range has the highest percentage of unemployed individuals, with 100.0% or 3 of them being unemployed.
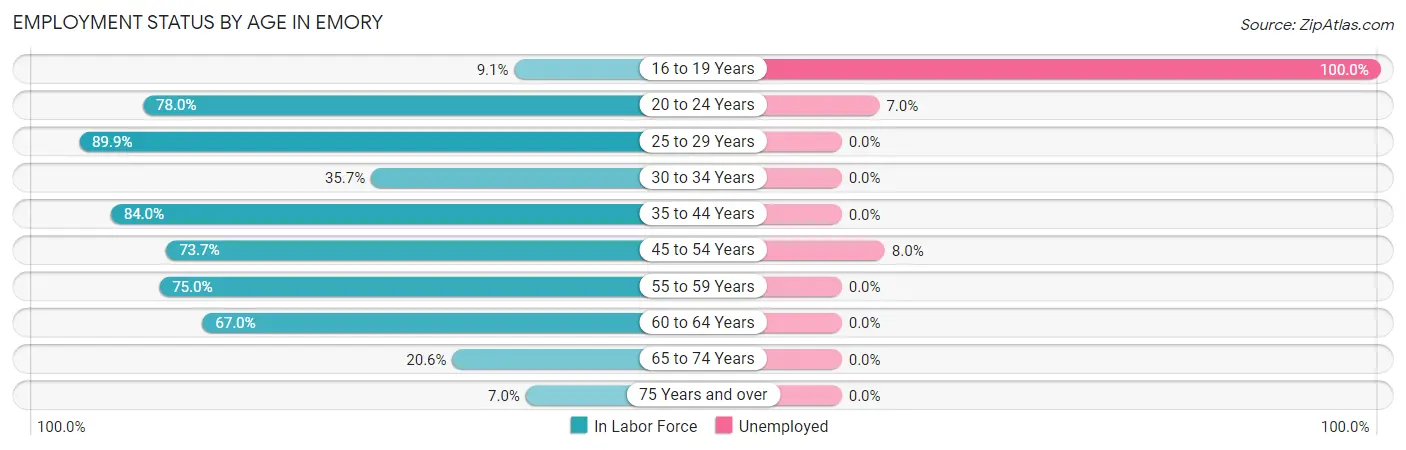
| Age Bracket | In Labor Force | Unemployed |
| 16 to 19 Years | 3 (9.1%) | 3 (100.0%) |
| 20 to 24 Years | 142 (78.0%) | 10 (7.0%) |
| 25 to 29 Years | 134 (89.9%) | 0 (0.0%) |
| 30 to 34 Years | 30 (35.7%) | 0 (0.0%) |
| 35 to 44 Years | 136 (84.0%) | 0 (0.0%) |
| 45 to 54 Years | 87 (73.7%) | 7 (8.0%) |
| 55 to 59 Years | 39 (75.0%) | 0 (0.0%) |
| 60 to 64 Years | 69 (67.0%) | 0 (0.0%) |
| 65 to 74 Years | 20 (20.6%) | 0 (0.0%) |
| 75 Years and over | 8 (7.0%) | 0 (0.0%) |
| Total | 668 (61.0%) | 20 (3.0%) |
Employment Status by Educational Attainment in Emory
According to labor force statistics for Emory, 74.1% of individuals (495) out of the total population between 25 and 64 years of age (668) are in the labor force, with 1.4% or 7 of them being unemployed. The group with the highest labor force participation rate are those with the educational attainment of college / associate degree, with 80.7% or 184 individuals in the labor force. Within the labor force, individuals with less than high school education have the highest percentage of unemployment, with 9.1% or 7 of them being unemployed.
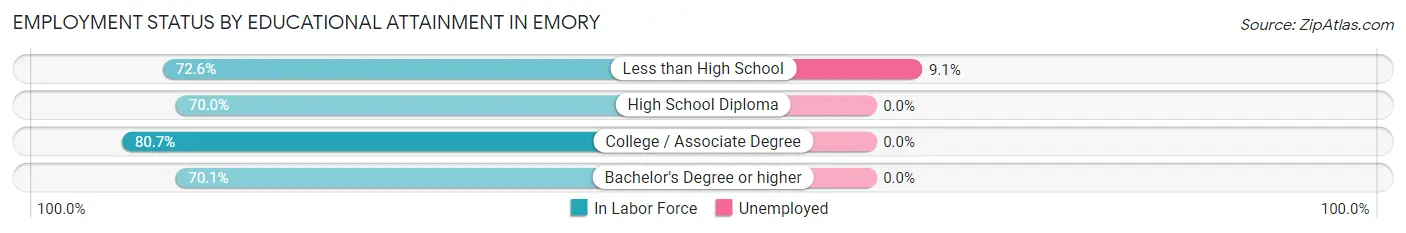
| Educational Attainment | In Labor Force | Unemployed |
| Less than High School | 77 (72.6%) | 10 (9.1%) |
| High School Diploma | 180 (70.0%) | 0 (0.0%) |
| College / Associate Degree | 184 (80.7%) | 0 (0.0%) |
| Bachelor's Degree or higher | 54 (70.1%) | 0 (0.0%) |
| Total | 495 (74.1%) | 9 (1.4%) |
Employment Occupations by Sex in Emory
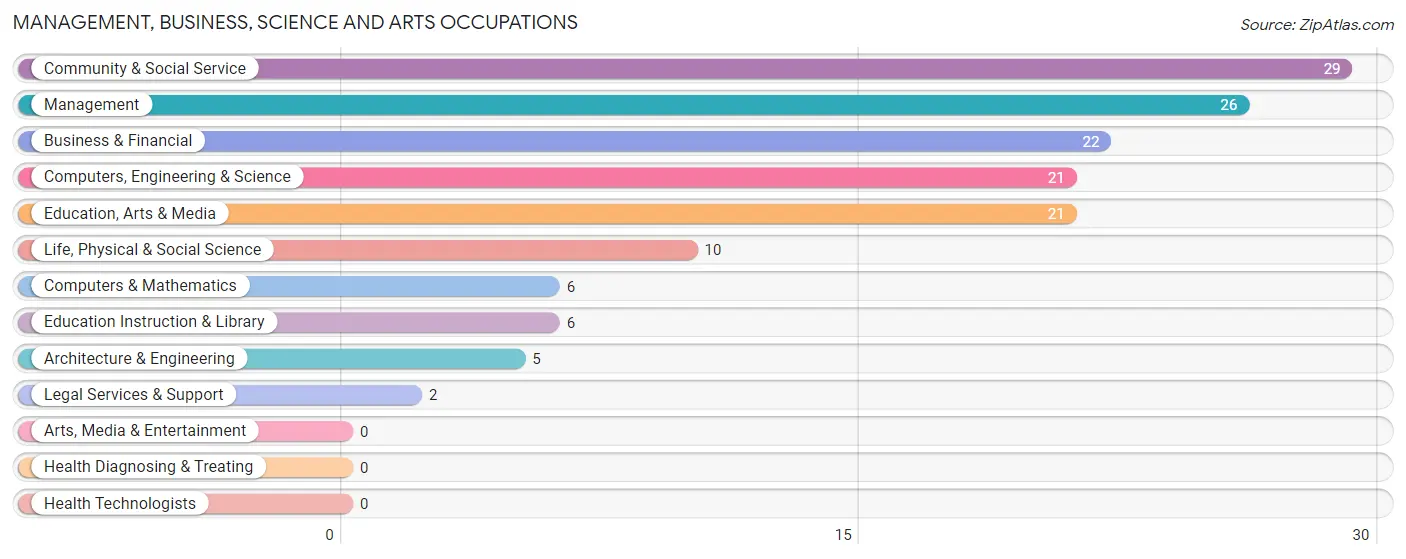
Management, Business, Science and Arts Occupations
The most common Management, Business, Science and Arts occupations in Emory are Community & Social Service (29 | 4.5%), Management (26 | 4.0%), Business & Financial (22 | 3.4%), Computers, Engineering & Science (21 | 3.2%), and Education, Arts & Media (21 | 3.2%).
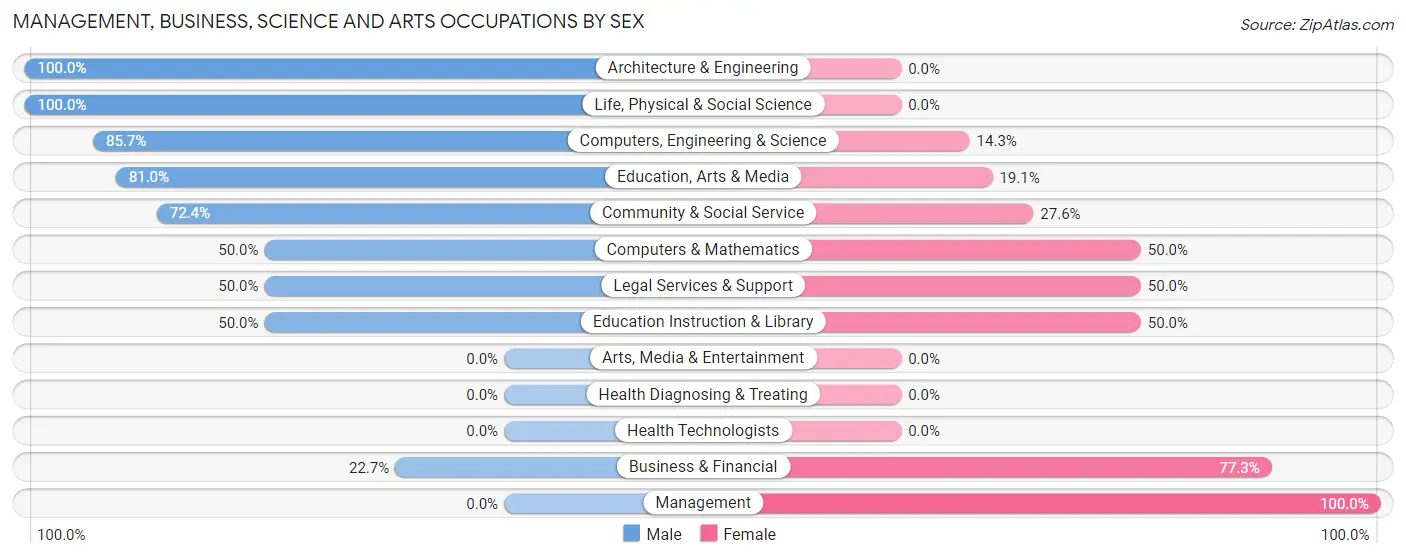
Management, Business, Science and Arts Occupations by Sex
Within the Management, Business, Science and Arts occupations in Emory, the most male-oriented occupations are Architecture & Engineering (100.0%), Life, Physical & Social Science (100.0%), and Computers, Engineering & Science (85.7%), while the most female-oriented occupations are Management (100.0%), Business & Financial (77.3%), and Computers & Mathematics (50.0%).
| Occupation | Male | Female |
| Management | 0 (0.0%) | 26 (100.0%) |
| Business & Financial | 5 (22.7%) | 17 (77.3%) |
| Computers, Engineering & Science | 18 (85.7%) | 3 (14.3%) |
| Computers & Mathematics | 3 (50.0%) | 3 (50.0%) |
| Architecture & Engineering | 5 (100.0%) | 0 (0.0%) |
| Life, Physical & Social Science | 10 (100.0%) | 0 (0.0%) |
| Community & Social Service | 21 (72.4%) | 8 (27.6%) |
| Education, Arts & Media | 17 (80.9%) | 4 (19.1%) |
| Legal Services & Support | 1 (50.0%) | 1 (50.0%) |
| Education Instruction & Library | 3 (50.0%) | 3 (50.0%) |
| Arts, Media & Entertainment | 0 (0.0%) | 0 (0.0%) |
| Health Diagnosing & Treating | 0 (0.0%) | 0 (0.0%) |
| Health Technologists | 0 (0.0%) | 0 (0.0%) |
| Total (Category) | 44 (44.9%) | 54 (55.1%) |
| Total (Overall) | 389 (60.0%) | 259 (40.0%) |
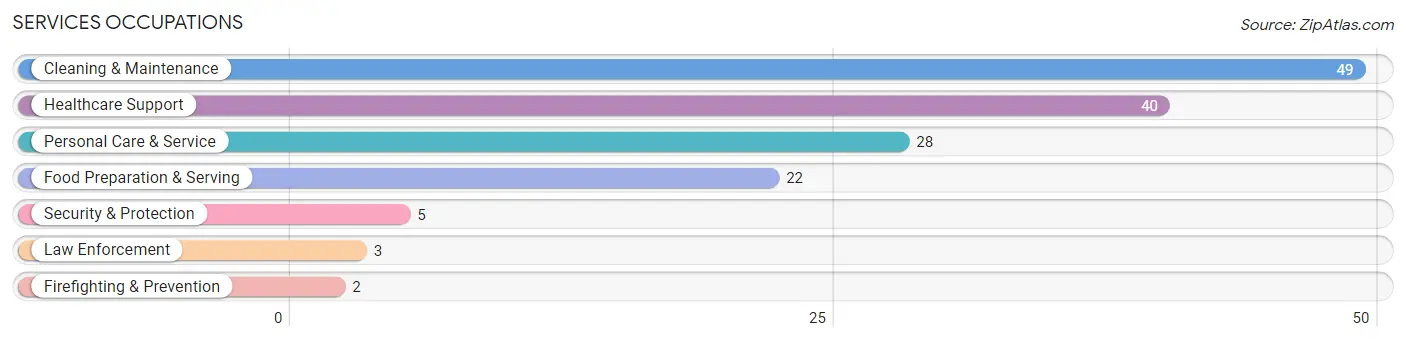
Services Occupations
The most common Services occupations in Emory are Cleaning & Maintenance (49 | 7.6%), Healthcare Support (40 | 6.2%), Personal Care & Service (28 | 4.3%), Food Preparation & Serving (22 | 3.4%), and Security & Protection (5 | 0.8%).
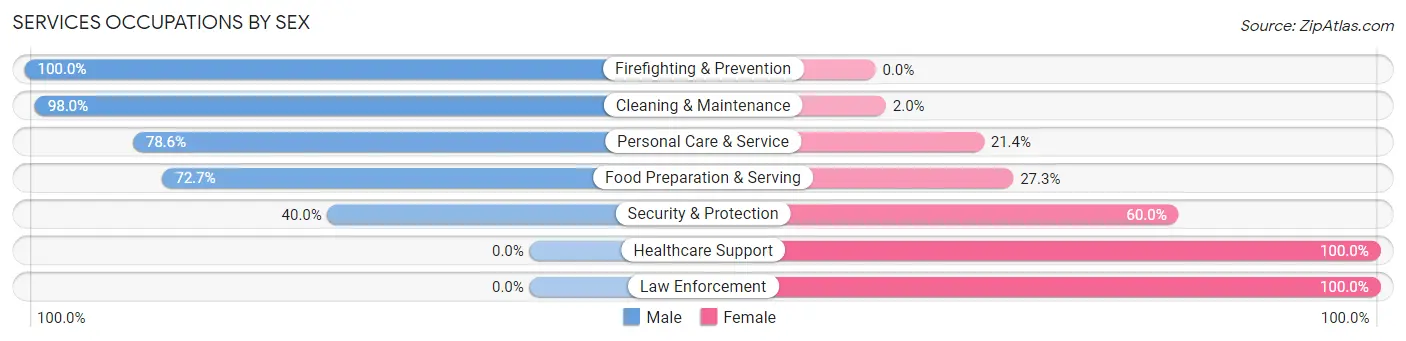
Services Occupations by Sex
Within the Services occupations in Emory, the most male-oriented occupations are Firefighting & Prevention (100.0%), Cleaning & Maintenance (98.0%), and Personal Care & Service (78.6%), while the most female-oriented occupations are Healthcare Support (100.0%), Law Enforcement (100.0%), and Security & Protection (60.0%).
| Occupation | Male | Female |
| Healthcare Support | 0 (0.0%) | 40 (100.0%) |
| Security & Protection | 2 (40.0%) | 3 (60.0%) |
| Firefighting & Prevention | 2 (100.0%) | 0 (0.0%) |
| Law Enforcement | 0 (0.0%) | 3 (100.0%) |
| Food Preparation & Serving | 16 (72.7%) | 6 (27.3%) |
| Cleaning & Maintenance | 48 (98.0%) | 1 (2.0%) |
| Personal Care & Service | 22 (78.6%) | 6 (21.4%) |
| Total (Category) | 88 (61.1%) | 56 (38.9%) |
| Total (Overall) | 389 (60.0%) | 259 (40.0%) |
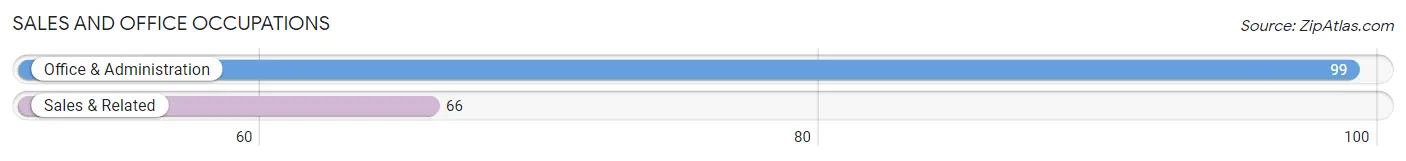
Sales and Office Occupations
The most common Sales and Office occupations in Emory are Office & Administration (99 | 15.3%), and Sales & Related (66 | 10.2%).
Sales and Office Occupations by Sex

| Occupation | Male | Female |
| Sales & Related | 35 (53.0%) | 31 (47.0%) |
| Office & Administration | 16 (16.2%) | 83 (83.8%) |
| Total (Category) | 51 (30.9%) | 114 (69.1%) |
| Total (Overall) | 389 (60.0%) | 259 (40.0%) |
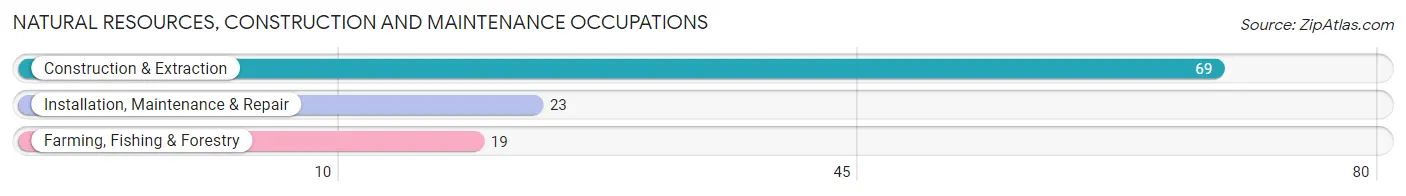
Natural Resources, Construction and Maintenance Occupations
The most common Natural Resources, Construction and Maintenance occupations in Emory are Construction & Extraction (69 | 10.6%), Installation, Maintenance & Repair (23 | 3.5%), and Farming, Fishing & Forestry (19 | 2.9%).
Natural Resources, Construction and Maintenance Occupations by Sex
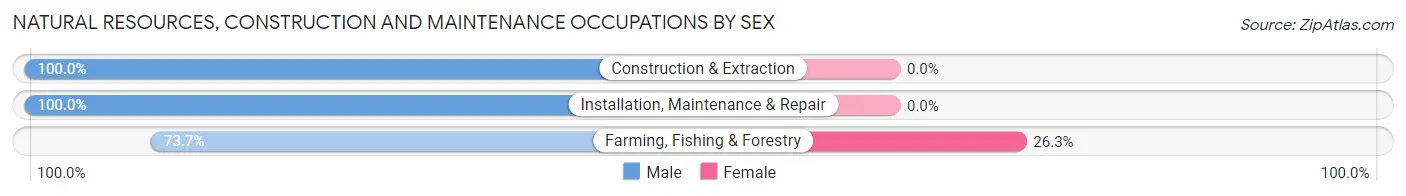
| Occupation | Male | Female |
| Farming, Fishing & Forestry | 14 (73.7%) | 5 (26.3%) |
| Construction & Extraction | 69 (100.0%) | 0 (0.0%) |
| Installation, Maintenance & Repair | 23 (100.0%) | 0 (0.0%) |
| Total (Category) | 106 (95.5%) | 5 (4.5%) |
| Total (Overall) | 389 (60.0%) | 259 (40.0%) |
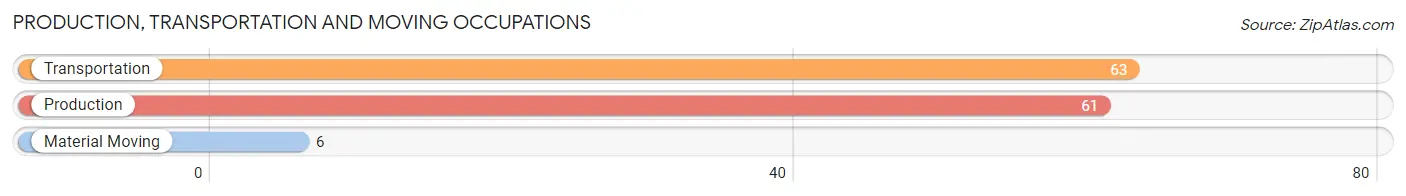
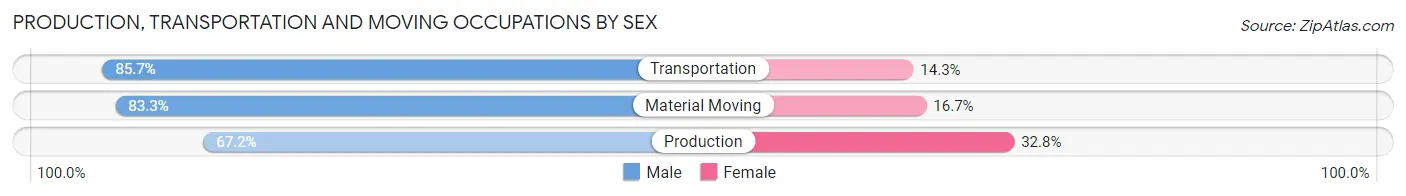
Production, Transportation and Moving Occupations
The most common Production, Transportation and Moving occupations in Emory are Transportation (63 | 9.7%), Production (61 | 9.4%), and Material Moving (6 | 0.9%).
Production, Transportation and Moving Occupations by Sex
| Occupation | Male | Female |
| Production | 41 (67.2%) | 20 (32.8%) |
| Transportation | 54 (85.7%) | 9 (14.3%) |
| Material Moving | 5 (83.3%) | 1 (16.7%) |
| Total (Category) | 100 (76.9%) | 30 (23.1%) |
| Total (Overall) | 389 (60.0%) | 259 (40.0%) |
Employment Industries by Sex in Emory
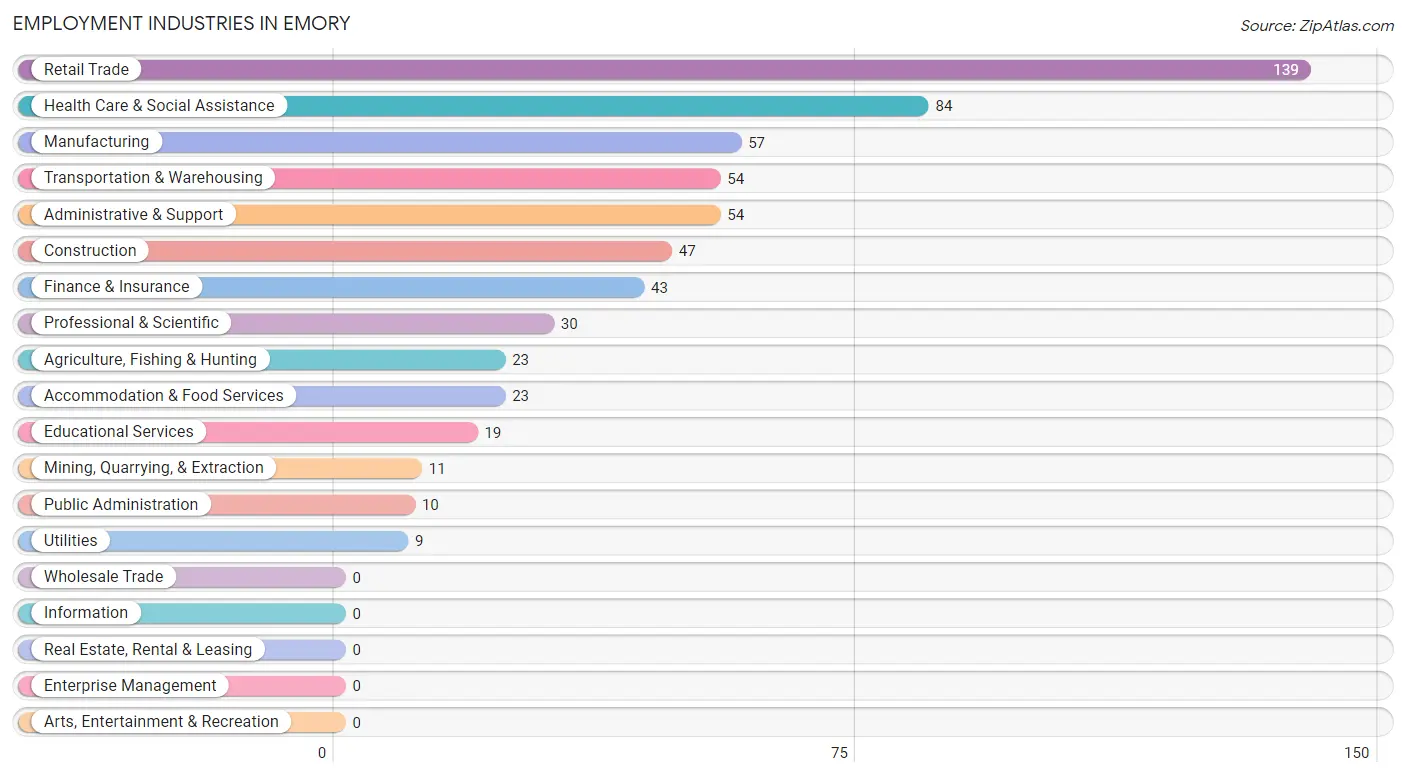
Employment Industries in Emory
The major employment industries in Emory include Retail Trade (139 | 21.4%), Health Care & Social Assistance (84 | 13.0%), Manufacturing (57 | 8.8%), Transportation & Warehousing (54 | 8.3%), and Administrative & Support (54 | 8.3%).
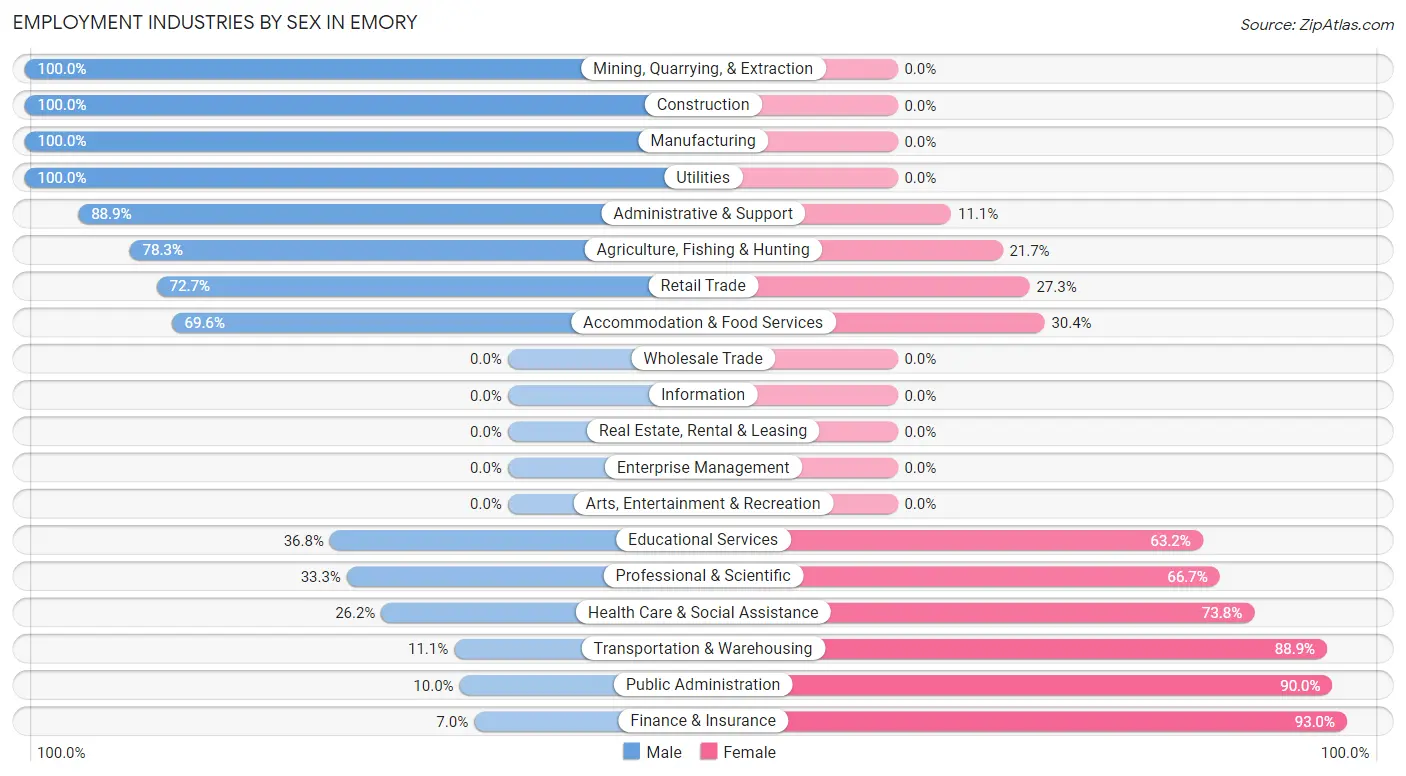
Employment Industries by Sex in Emory
The Emory industries that see more men than women are Mining, Quarrying, & Extraction (100.0%), Construction (100.0%), and Manufacturing (100.0%), whereas the industries that tend to have a higher number of women are Finance & Insurance (93.0%), Public Administration (90.0%), and Transportation & Warehousing (88.9%).
| Industry | Male | Female |
| Agriculture, Fishing & Hunting | 18 (78.3%) | 5 (21.7%) |
| Mining, Quarrying, & Extraction | 11 (100.0%) | 0 (0.0%) |
| Construction | 47 (100.0%) | 0 (0.0%) |
| Manufacturing | 57 (100.0%) | 0 (0.0%) |
| Wholesale Trade | 0 (0.0%) | 0 (0.0%) |
| Retail Trade | 101 (72.7%) | 38 (27.3%) |
| Transportation & Warehousing | 6 (11.1%) | 48 (88.9%) |
| Utilities | 9 (100.0%) | 0 (0.0%) |
| Information | 0 (0.0%) | 0 (0.0%) |
| Finance & Insurance | 3 (7.0%) | 40 (93.0%) |
| Real Estate, Rental & Leasing | 0 (0.0%) | 0 (0.0%) |
| Professional & Scientific | 10 (33.3%) | 20 (66.7%) |
| Enterprise Management | 0 (0.0%) | 0 (0.0%) |
| Administrative & Support | 48 (88.9%) | 6 (11.1%) |
| Educational Services | 7 (36.8%) | 12 (63.2%) |
| Health Care & Social Assistance | 22 (26.2%) | 62 (73.8%) |
| Arts, Entertainment & Recreation | 0 (0.0%) | 0 (0.0%) |
| Accommodation & Food Services | 16 (69.6%) | 7 (30.4%) |
| Public Administration | 1 (10.0%) | 9 (90.0%) |
| Total | 389 (60.0%) | 259 (40.0%) |
Education in Emory
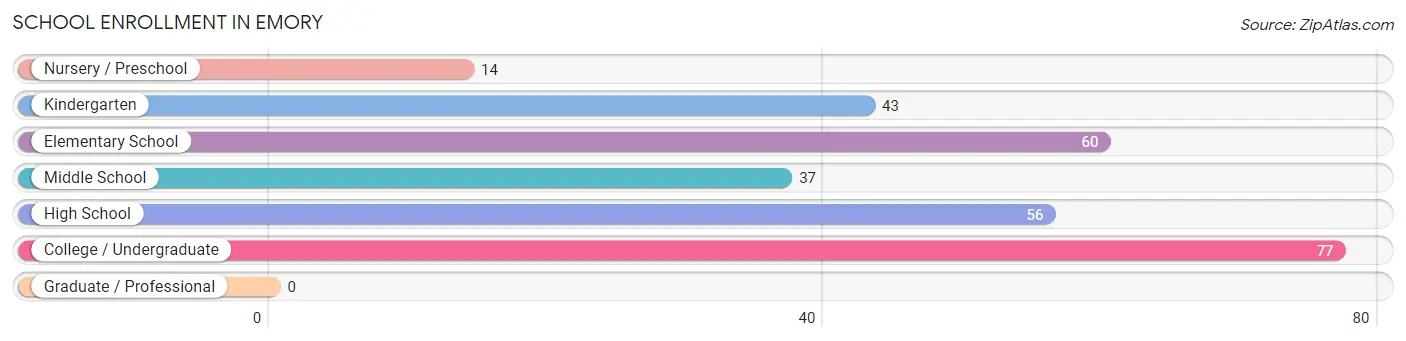
School Enrollment in Emory
The most common levels of schooling among the 287 students in Emory are college / undergraduate (77 | 26.8%), elementary school (60 | 20.9%), and high school (56 | 19.5%).
| School Level | # Students | % Students |
| Nursery / Preschool | 14 | 4.9% |
| Kindergarten | 43 | 15.0% |
| Elementary School | 60 | 20.9% |
| Middle School | 37 | 12.9% |
| High School | 56 | 19.5% |
| College / Undergraduate | 77 | 26.8% |
| Graduate / Professional | 0 | 0.0% |
| Total | 287 | 100.0% |
School Enrollment by Age by Funding Source in Emory
Out of a total of 287 students who are enrolled in schools in Emory, 9 (3.1%) attend a private institution, while the remaining 278 (96.9%) are enrolled in public schools. The age group of 10 to 14 year olds has the highest likelihood of being enrolled in private schools, with 9 (22.0% in the age bracket) enrolled. Conversely, the age group of 3 to 4 year olds has the lowest likelihood of being enrolled in a private school, with 25 (100.0% in the age bracket) attending a public institution.
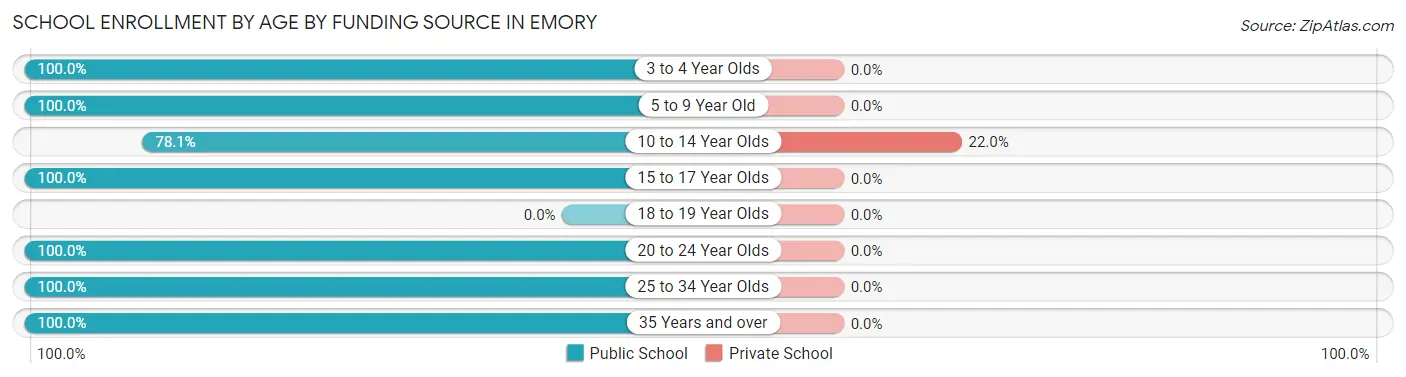
| Age Bracket | Public School | Private School |
| 3 to 4 Year Olds | 25 (100.0%) | 0 (0.0%) |
| 5 to 9 Year Old | 88 (100.0%) | 0 (0.0%) |
| 10 to 14 Year Olds | 32 (78.0%) | 9 (22.0%) |
| 15 to 17 Year Olds | 56 (100.0%) | 0 (0.0%) |
| 18 to 19 Year Olds | 0 (0.0%) | 0 (0.0%) |
| 20 to 24 Year Olds | 33 (100.0%) | 0 (0.0%) |
| 25 to 34 Year Olds | 34 (100.0%) | 0 (0.0%) |
| 35 Years and over | 10 (100.0%) | 0 (0.0%) |
| Total | 278 (96.9%) | 9 (3.1%) |
Educational Attainment by Field of Study in Emory
Science & technology (28 | 24.6%), business (28 | 24.6%), education (16 | 14.0%), arts & humanities (16 | 14.0%), and computers & mathematics (9 | 7.9%) are the most common fields of study among 114 individuals in Emory who have obtained a bachelor's degree or higher.
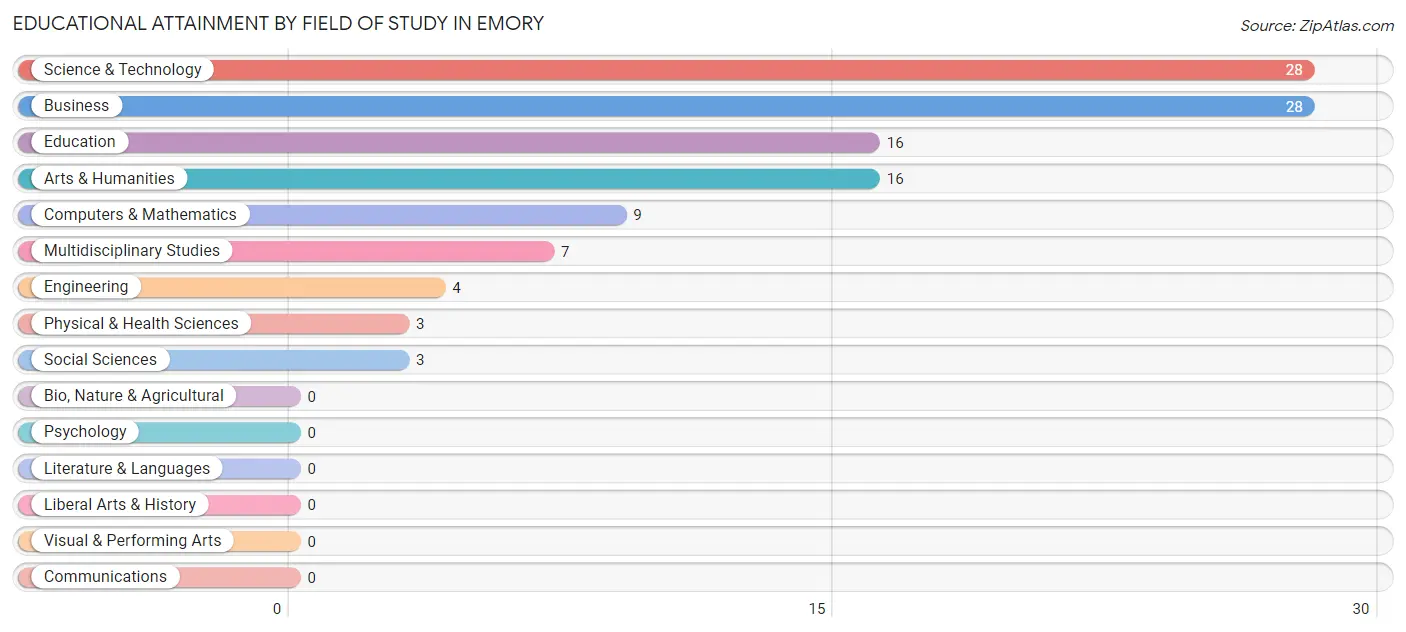
| Field of Study | # Graduates | % Graduates |
| Computers & Mathematics | 9 | 7.9% |
| Bio, Nature & Agricultural | 0 | 0.0% |
| Physical & Health Sciences | 3 | 2.6% |
| Psychology | 0 | 0.0% |
| Social Sciences | 3 | 2.6% |
| Engineering | 4 | 3.5% |
| Multidisciplinary Studies | 7 | 6.1% |
| Science & Technology | 28 | 24.6% |
| Business | 28 | 24.6% |
| Education | 16 | 14.0% |
| Literature & Languages | 0 | 0.0% |
| Liberal Arts & History | 0 | 0.0% |
| Visual & Performing Arts | 0 | 0.0% |
| Communications | 0 | 0.0% |
| Arts & Humanities | 16 | 14.0% |
| Total | 114 | 100.0% |
Transportation & Commute in Emory
Vehicle Availability by Sex in Emory
The most prevalent vehicle ownership categories in Emory are males with 2 vehicles (151, accounting for 40.3%) and females with 2 vehicles (118, making up 59.7%).
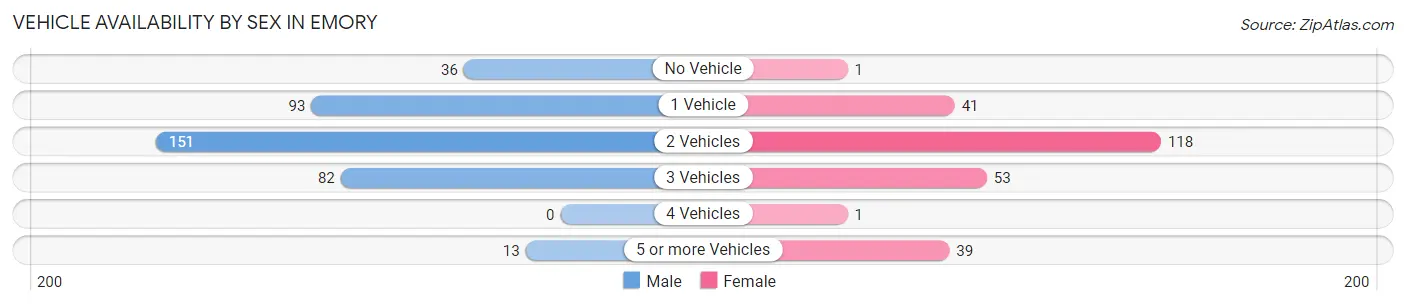
| Vehicles Available | Male | Female |
| No Vehicle | 36 (9.6%) | 1 (0.4%) |
| 1 Vehicle | 93 (24.8%) | 41 (16.2%) |
| 2 Vehicles | 151 (40.3%) | 118 (46.6%) |
| 3 Vehicles | 82 (21.9%) | 53 (20.9%) |
| 4 Vehicles | 0 (0.0%) | 1 (0.4%) |
| 5 or more Vehicles | 13 (3.5%) | 39 (15.4%) |
| Total | 375 (100.0%) | 253 (100.0%) |
Commute Time in Emory
The most frequently occuring commute durations in Emory are 5 to 9 minutes (125 commuters, 21.0%), less than 5 minutes (81 commuters, 13.6%), and 15 to 19 minutes (69 commuters, 11.6%).
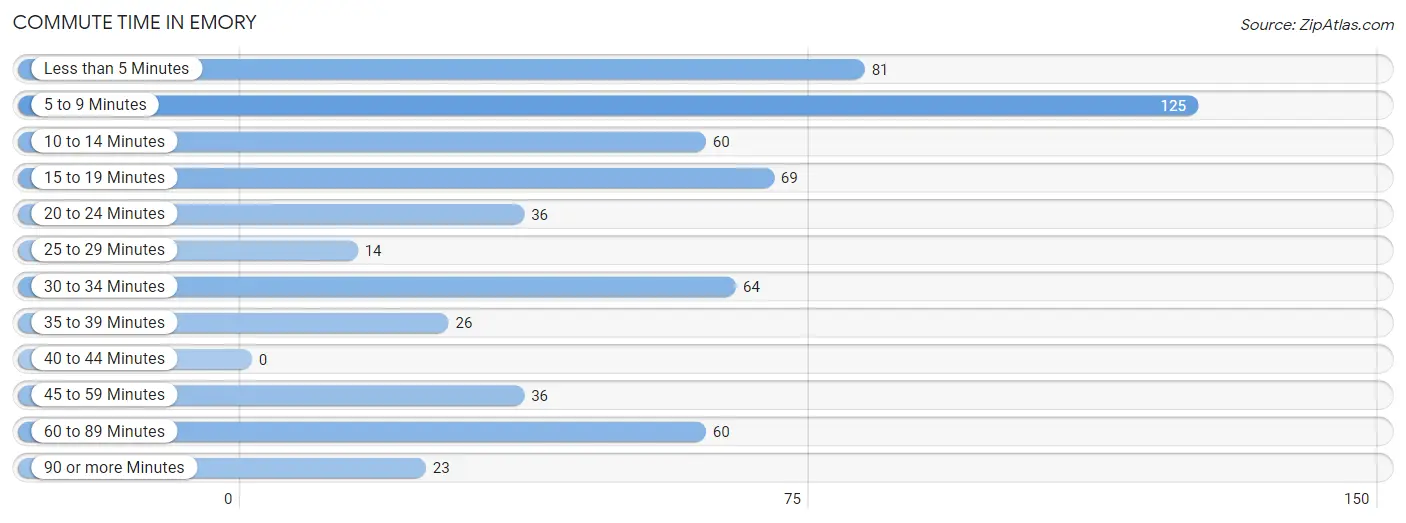
| Commute Time | # Commuters | % Commuters |
| Less than 5 Minutes | 81 | 13.6% |
| 5 to 9 Minutes | 125 | 21.0% |
| 10 to 14 Minutes | 60 | 10.1% |
| 15 to 19 Minutes | 69 | 11.6% |
| 20 to 24 Minutes | 36 | 6.1% |
| 25 to 29 Minutes | 14 | 2.4% |
| 30 to 34 Minutes | 64 | 10.8% |
| 35 to 39 Minutes | 26 | 4.4% |
| 40 to 44 Minutes | 0 | 0.0% |
| 45 to 59 Minutes | 36 | 6.1% |
| 60 to 89 Minutes | 60 | 10.1% |
| 90 or more Minutes | 23 | 3.9% |
Commute Time by Sex in Emory
The most common commute times in Emory are less than 5 minutes (75 commuters, 21.7%) for males and 5 to 9 minutes (64 commuters, 25.8%) for females.
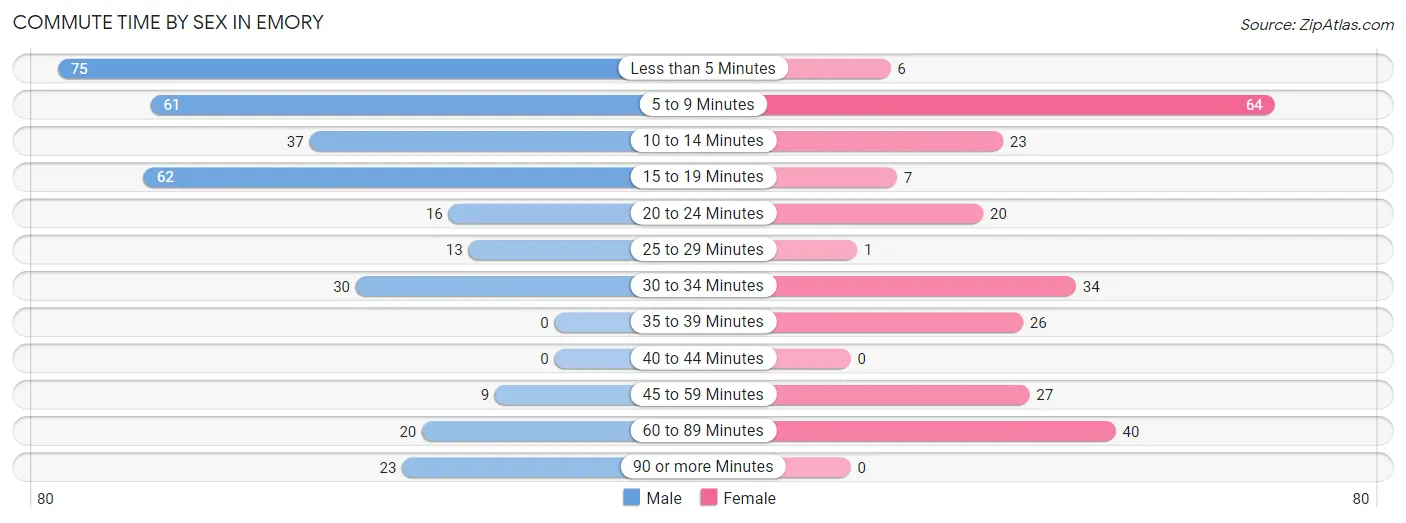
| Commute Time | Male | Female |
| Less than 5 Minutes | 75 (21.7%) | 6 (2.4%) |
| 5 to 9 Minutes | 61 (17.6%) | 64 (25.8%) |
| 10 to 14 Minutes | 37 (10.7%) | 23 (9.3%) |
| 15 to 19 Minutes | 62 (17.9%) | 7 (2.8%) |
| 20 to 24 Minutes | 16 (4.6%) | 20 (8.1%) |
| 25 to 29 Minutes | 13 (3.8%) | 1 (0.4%) |
| 30 to 34 Minutes | 30 (8.7%) | 34 (13.7%) |
| 35 to 39 Minutes | 0 (0.0%) | 26 (10.5%) |
| 40 to 44 Minutes | 0 (0.0%) | 0 (0.0%) |
| 45 to 59 Minutes | 9 (2.6%) | 27 (10.9%) |
| 60 to 89 Minutes | 20 (5.8%) | 40 (16.1%) |
| 90 or more Minutes | 23 (6.7%) | 0 (0.0%) |
Time of Departure to Work by Sex in Emory
The most frequent times of departure to work in Emory are 12:00 AM to 4:59 AM (77, 22.3%) for males and 7:00 AM to 7:29 AM (86, 34.7%) for females.
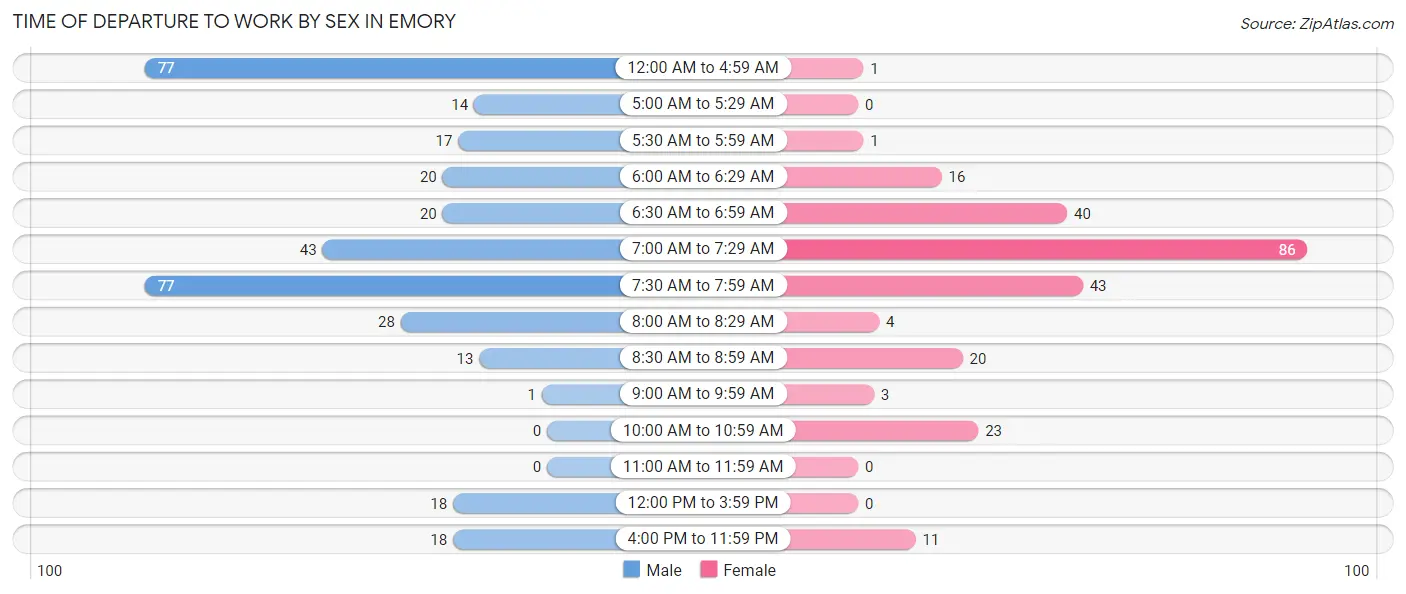
| Time of Departure | Male | Female |
| 12:00 AM to 4:59 AM | 77 (22.3%) | 1 (0.4%) |
| 5:00 AM to 5:29 AM | 14 (4.1%) | 0 (0.0%) |
| 5:30 AM to 5:59 AM | 17 (4.9%) | 1 (0.4%) |
| 6:00 AM to 6:29 AM | 20 (5.8%) | 16 (6.5%) |
| 6:30 AM to 6:59 AM | 20 (5.8%) | 40 (16.1%) |
| 7:00 AM to 7:29 AM | 43 (12.4%) | 86 (34.7%) |
| 7:30 AM to 7:59 AM | 77 (22.3%) | 43 (17.3%) |
| 8:00 AM to 8:29 AM | 28 (8.1%) | 4 (1.6%) |
| 8:30 AM to 8:59 AM | 13 (3.8%) | 20 (8.1%) |
| 9:00 AM to 9:59 AM | 1 (0.3%) | 3 (1.2%) |
| 10:00 AM to 10:59 AM | 0 (0.0%) | 23 (9.3%) |
| 11:00 AM to 11:59 AM | 0 (0.0%) | 0 (0.0%) |
| 12:00 PM to 3:59 PM | 18 (5.2%) | 0 (0.0%) |
| 4:00 PM to 11:59 PM | 18 (5.2%) | 11 (4.4%) |
| Total | 346 (100.0%) | 248 (100.0%) |
Housing Occupancy in Emory
Occupancy by Ownership in Emory
Of the total 410 dwellings in Emory, owner-occupied units account for 185 (45.1%), while renter-occupied units make up 225 (54.9%).
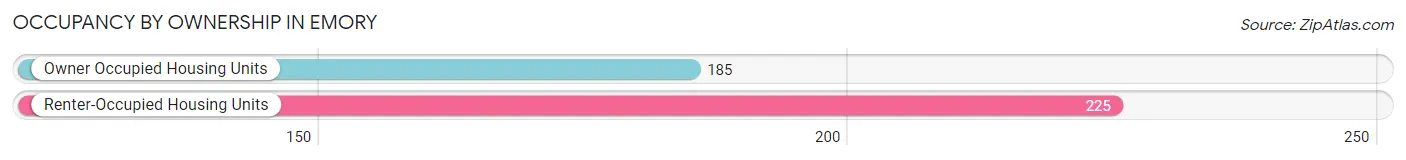
| Occupancy | # Housing Units | % Housing Units |
| Owner Occupied Housing Units | 185 | 45.1% |
| Renter-Occupied Housing Units | 225 | 54.9% |
| Total Occupied Housing Units | 410 | 100.0% |
Occupancy by Household Size in Emory
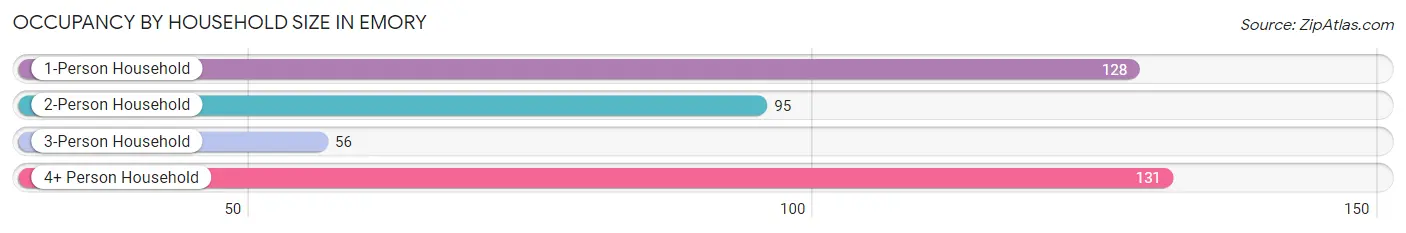
| Household Size | # Housing Units | % Housing Units |
| 1-Person Household | 128 | 31.2% |
| 2-Person Household | 95 | 23.2% |
| 3-Person Household | 56 | 13.7% |
| 4+ Person Household | 131 | 32.0% |
| Total Housing Units | 410 | 100.0% |
Occupancy by Ownership by Household Size in Emory
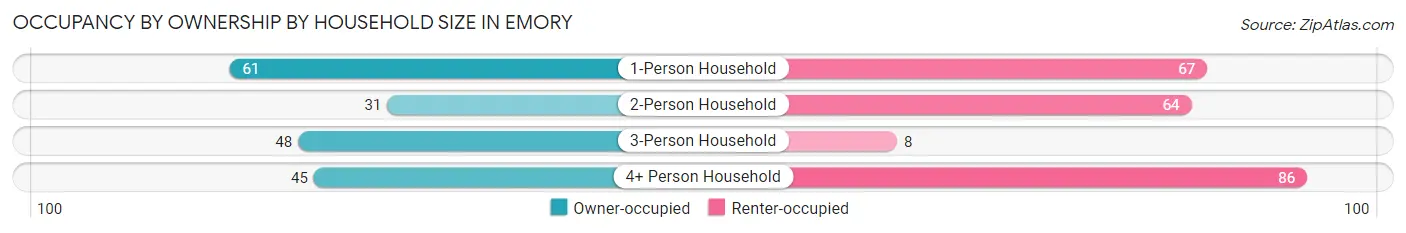
| Household Size | Owner-occupied | Renter-occupied |
| 1-Person Household | 61 (47.7%) | 67 (52.3%) |
| 2-Person Household | 31 (32.6%) | 64 (67.4%) |
| 3-Person Household | 48 (85.7%) | 8 (14.3%) |
| 4+ Person Household | 45 (34.4%) | 86 (65.6%) |
| Total Housing Units | 185 (45.1%) | 225 (54.9%) |
Occupancy by Educational Attainment in Emory
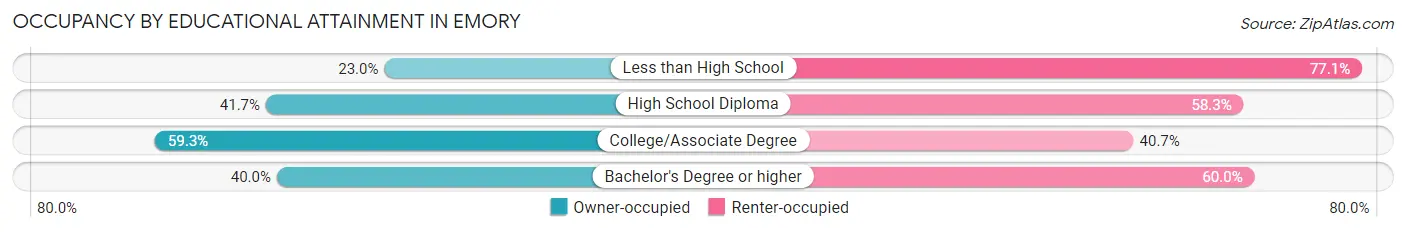
| Household Size | Owner-occupied | Renter-occupied |
| Less than High School | 14 (23.0%) | 47 (77.0%) |
| High School Diploma | 58 (41.7%) | 81 (58.3%) |
| College/Associate Degree | 89 (59.3%) | 61 (40.7%) |
| Bachelor's Degree or higher | 24 (40.0%) | 36 (60.0%) |
Occupancy by Age of Householder in Emory
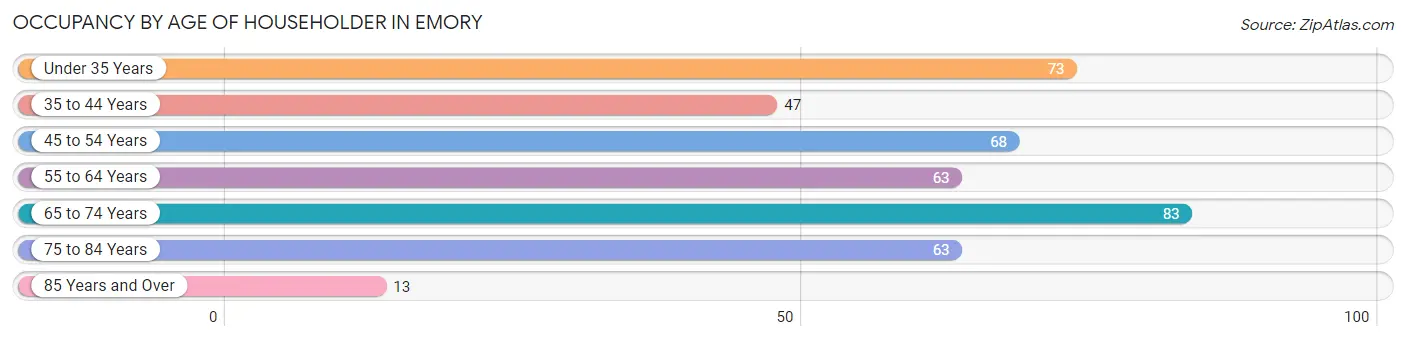
| Age Bracket | # Households | % Households |
| Under 35 Years | 73 | 17.8% |
| 35 to 44 Years | 47 | 11.5% |
| 45 to 54 Years | 68 | 16.6% |
| 55 to 64 Years | 63 | 15.4% |
| 65 to 74 Years | 83 | 20.2% |
| 75 to 84 Years | 63 | 15.4% |
| 85 Years and Over | 13 | 3.2% |
| Total | 410 | 100.0% |
Housing Finances in Emory
Median Income by Occupancy in Emory
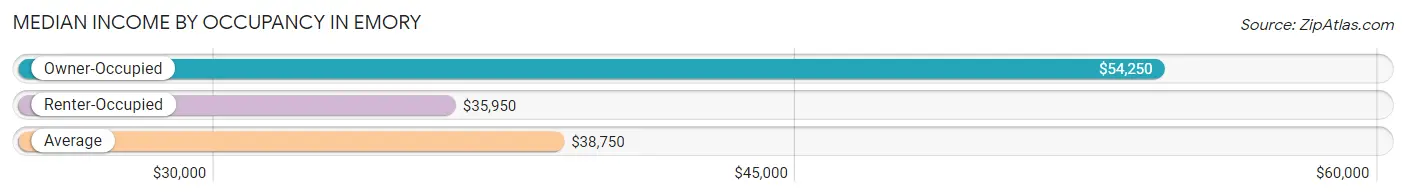
| Occupancy Type | # Households | Median Income |
| Owner-Occupied | 185 (45.1%) | $54,250 |
| Renter-Occupied | 225 (54.9%) | $35,950 |
| Average | 410 (100.0%) | $38,750 |
Occupancy by Householder Income Bracket in Emory
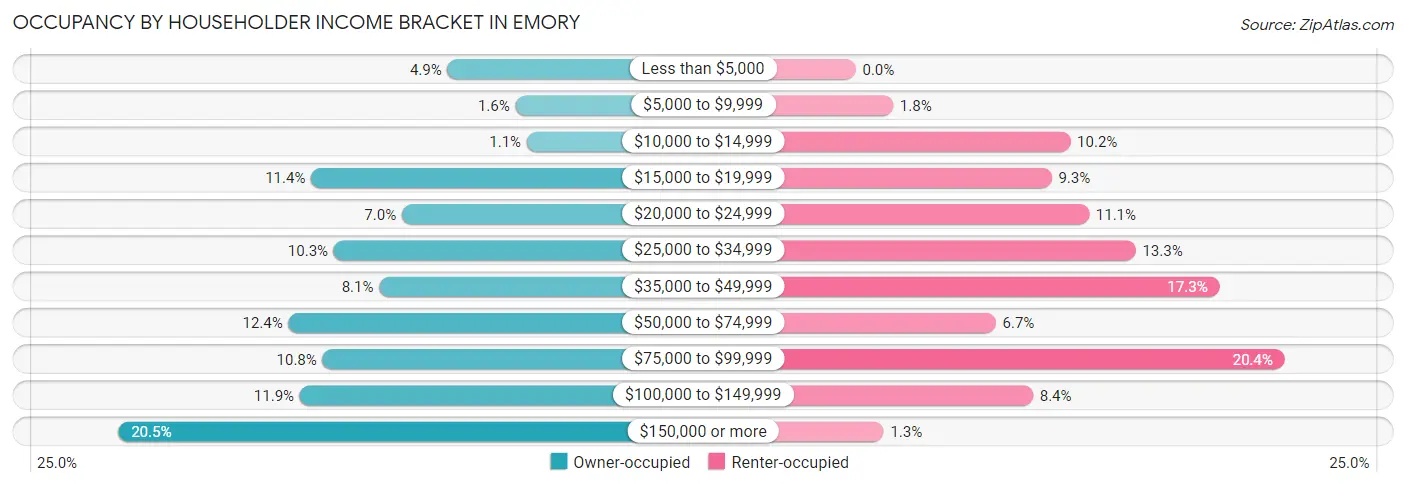
| Income Bracket | Owner-occupied | Renter-occupied |
| Less than $5,000 | 9 (4.9%) | 0 (0.0%) |
| $5,000 to $9,999 | 3 (1.6%) | 4 (1.8%) |
| $10,000 to $14,999 | 2 (1.1%) | 23 (10.2%) |
| $15,000 to $19,999 | 21 (11.4%) | 21 (9.3%) |
| $20,000 to $24,999 | 13 (7.0%) | 25 (11.1%) |
| $25,000 to $34,999 | 19 (10.3%) | 30 (13.3%) |
| $35,000 to $49,999 | 15 (8.1%) | 39 (17.3%) |
| $50,000 to $74,999 | 23 (12.4%) | 15 (6.7%) |
| $75,000 to $99,999 | 20 (10.8%) | 46 (20.4%) |
| $100,000 to $149,999 | 22 (11.9%) | 19 (8.4%) |
| $150,000 or more | 38 (20.5%) | 3 (1.3%) |
| Total | 185 (100.0%) | 225 (100.0%) |
Monthly Housing Cost Tiers in Emory
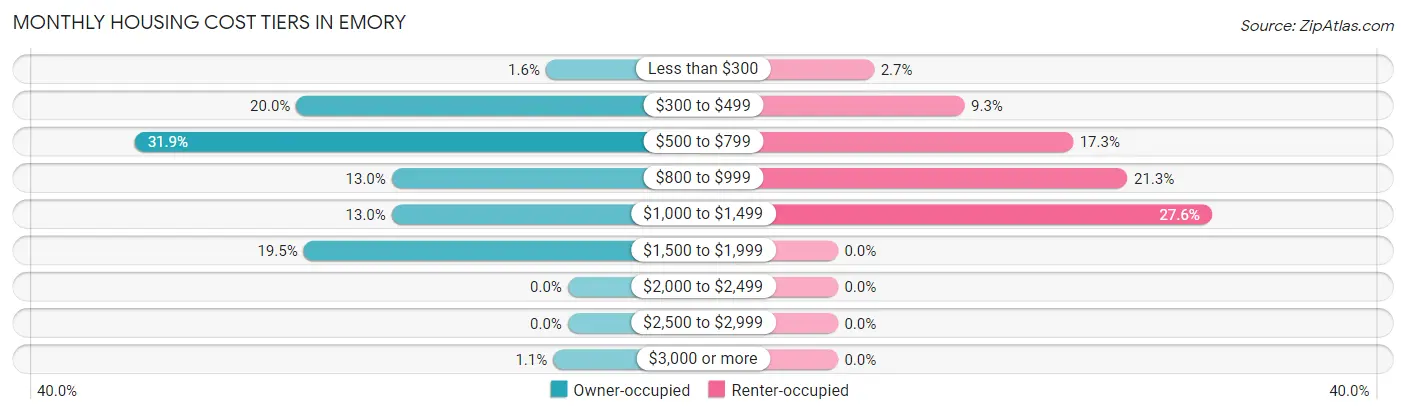
| Monthly Cost | Owner-occupied | Renter-occupied |
| Less than $300 | 3 (1.6%) | 6 (2.7%) |
| $300 to $499 | 37 (20.0%) | 21 (9.3%) |
| $500 to $799 | 59 (31.9%) | 39 (17.3%) |
| $800 to $999 | 24 (13.0%) | 48 (21.3%) |
| $1,000 to $1,499 | 24 (13.0%) | 62 (27.6%) |
| $1,500 to $1,999 | 36 (19.5%) | 0 (0.0%) |
| $2,000 to $2,499 | 0 (0.0%) | 0 (0.0%) |
| $2,500 to $2,999 | 0 (0.0%) | 0 (0.0%) |
| $3,000 or more | 2 (1.1%) | 0 (0.0%) |
| Total | 185 (100.0%) | 225 (100.0%) |
Physical Housing Characteristics in Emory
Housing Structures in Emory
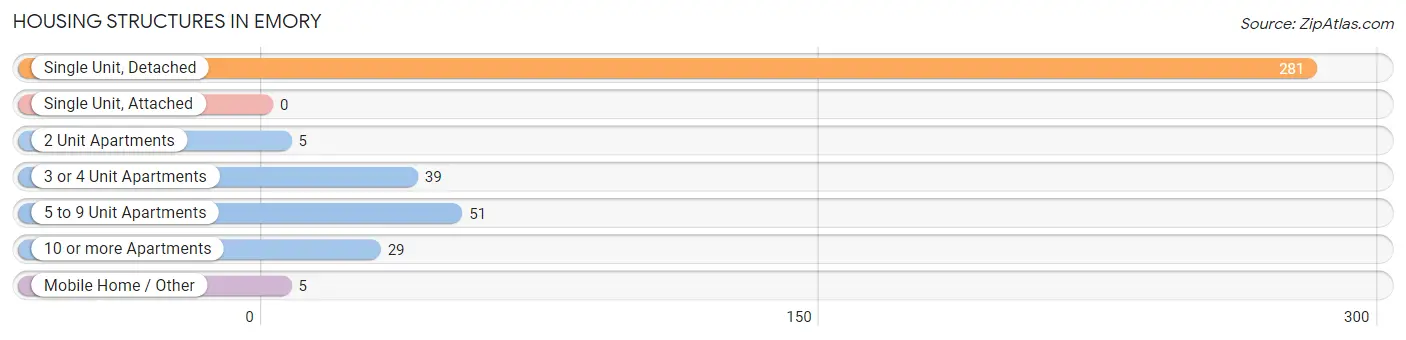
| Structure Type | # Housing Units | % Housing Units |
| Single Unit, Detached | 281 | 68.5% |
| Single Unit, Attached | 0 | 0.0% |
| 2 Unit Apartments | 5 | 1.2% |
| 3 or 4 Unit Apartments | 39 | 9.5% |
| 5 to 9 Unit Apartments | 51 | 12.4% |
| 10 or more Apartments | 29 | 7.1% |
| Mobile Home / Other | 5 | 1.2% |
| Total | 410 | 100.0% |
Housing Structures by Occupancy in Emory
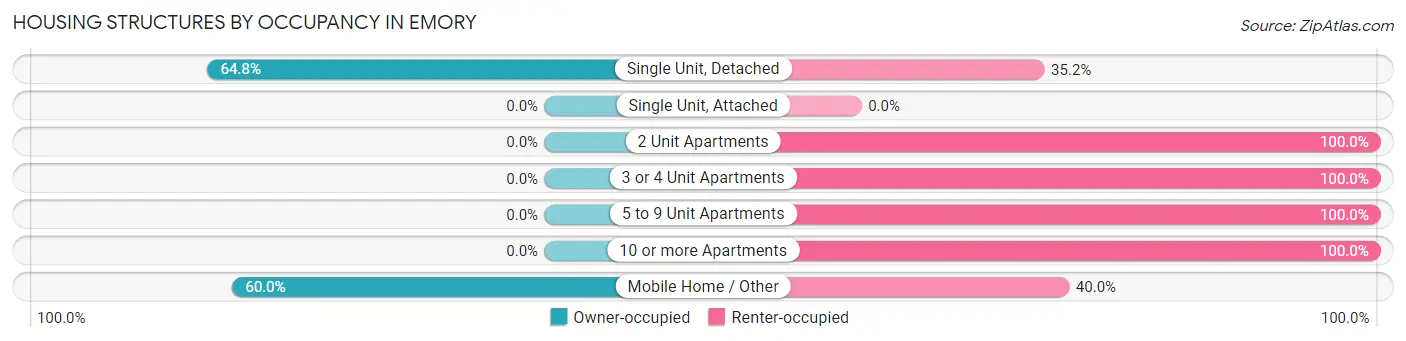
| Structure Type | Owner-occupied | Renter-occupied |
| Single Unit, Detached | 182 (64.8%) | 99 (35.2%) |
| Single Unit, Attached | 0 (0.0%) | 0 (0.0%) |
| 2 Unit Apartments | 0 (0.0%) | 5 (100.0%) |
| 3 or 4 Unit Apartments | 0 (0.0%) | 39 (100.0%) |
| 5 to 9 Unit Apartments | 0 (0.0%) | 51 (100.0%) |
| 10 or more Apartments | 0 (0.0%) | 29 (100.0%) |
| Mobile Home / Other | 3 (60.0%) | 2 (40.0%) |
| Total | 185 (45.1%) | 225 (54.9%) |
Housing Structures by Number of Rooms in Emory
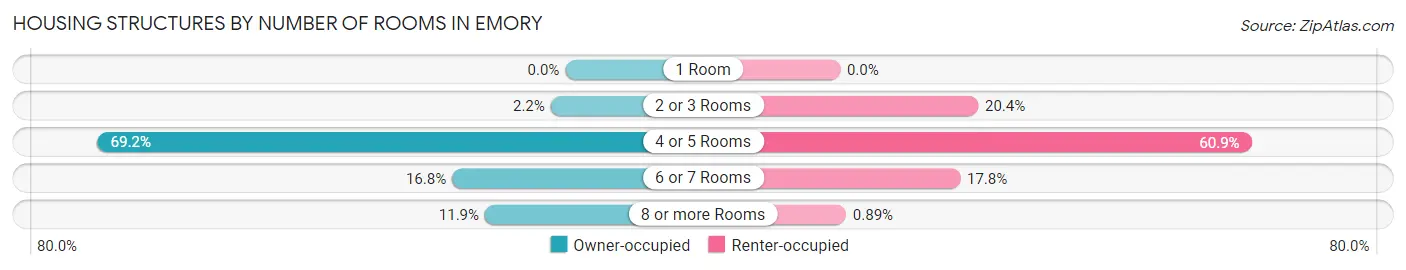
| Number of Rooms | Owner-occupied | Renter-occupied |
| 1 Room | 0 (0.0%) | 0 (0.0%) |
| 2 or 3 Rooms | 4 (2.2%) | 46 (20.4%) |
| 4 or 5 Rooms | 128 (69.2%) | 137 (60.9%) |
| 6 or 7 Rooms | 31 (16.8%) | 40 (17.8%) |
| 8 or more Rooms | 22 (11.9%) | 2 (0.9%) |
| Total | 185 (100.0%) | 225 (100.0%) |
Housing Structure by Heating Type in Emory
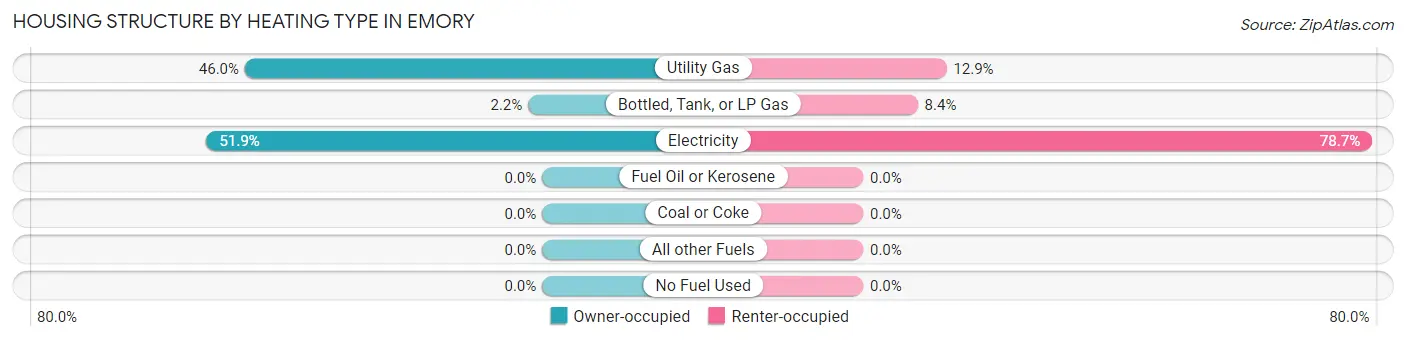
| Heating Type | Owner-occupied | Renter-occupied |
| Utility Gas | 85 (46.0%) | 29 (12.9%) |
| Bottled, Tank, or LP Gas | 4 (2.2%) | 19 (8.4%) |
| Electricity | 96 (51.9%) | 177 (78.7%) |
| Fuel Oil or Kerosene | 0 (0.0%) | 0 (0.0%) |
| Coal or Coke | 0 (0.0%) | 0 (0.0%) |
| All other Fuels | 0 (0.0%) | 0 (0.0%) |
| No Fuel Used | 0 (0.0%) | 0 (0.0%) |
| Total | 185 (100.0%) | 225 (100.0%) |
Household Vehicle Usage in Emory
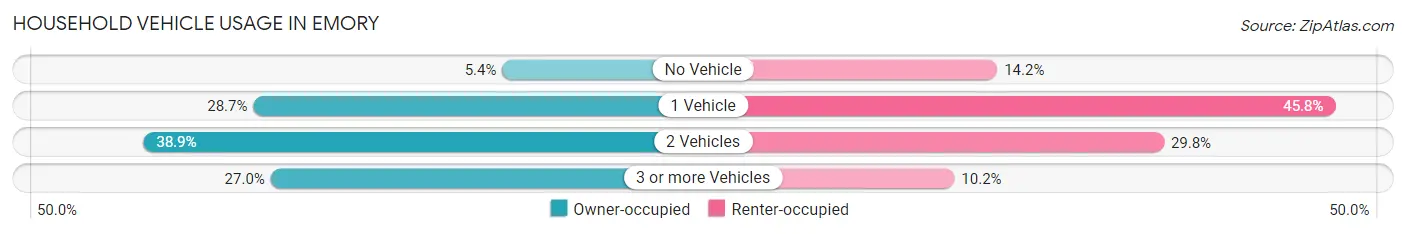
| Vehicles per Household | Owner-occupied | Renter-occupied |
| No Vehicle | 10 (5.4%) | 32 (14.2%) |
| 1 Vehicle | 53 (28.6%) | 103 (45.8%) |
| 2 Vehicles | 72 (38.9%) | 67 (29.8%) |
| 3 or more Vehicles | 50 (27.0%) | 23 (10.2%) |
| Total | 185 (100.0%) | 225 (100.0%) |
Real Estate & Mortgages in Emory
Real Estate and Mortgage Overview in Emory
| Characteristic | Without Mortgage | With Mortgage |
| Housing Units | 107 | 78 |
| Median Property Value | $154,200 | $159,000 |
| Median Household Income | $31,719 | $30 |
| Monthly Housing Costs | $603 | $2 |
| Real Estate Taxes | $1,718 | $0 |
Property Value by Mortgage Status in Emory
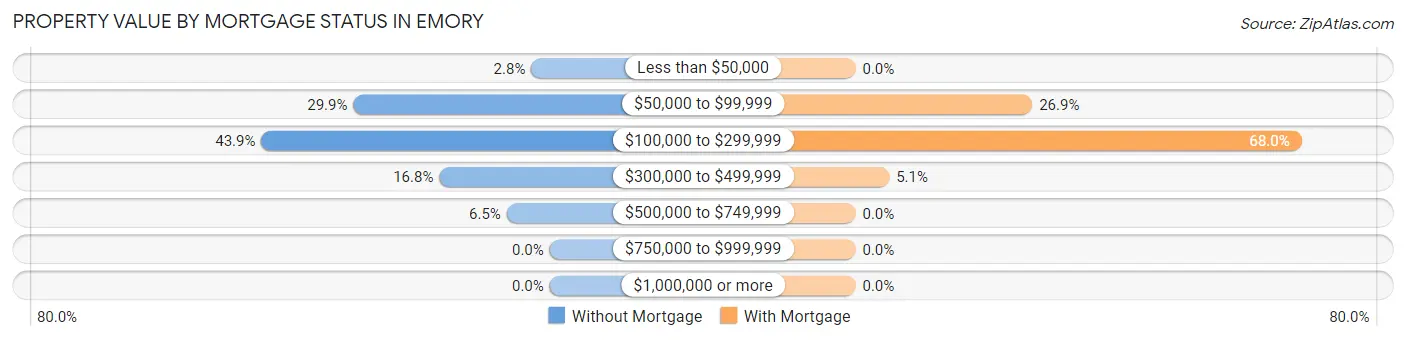
| Property Value | Without Mortgage | With Mortgage |
| Less than $50,000 | 3 (2.8%) | 0 (0.0%) |
| $50,000 to $99,999 | 32 (29.9%) | 21 (26.9%) |
| $100,000 to $299,999 | 47 (43.9%) | 53 (67.9%) |
| $300,000 to $499,999 | 18 (16.8%) | 4 (5.1%) |
| $500,000 to $749,999 | 7 (6.5%) | 0 (0.0%) |
| $750,000 to $999,999 | 0 (0.0%) | 0 (0.0%) |
| $1,000,000 or more | 0 (0.0%) | 0 (0.0%) |
| Total | 107 (100.0%) | 78 (100.0%) |
Household Income by Mortgage Status in Emory
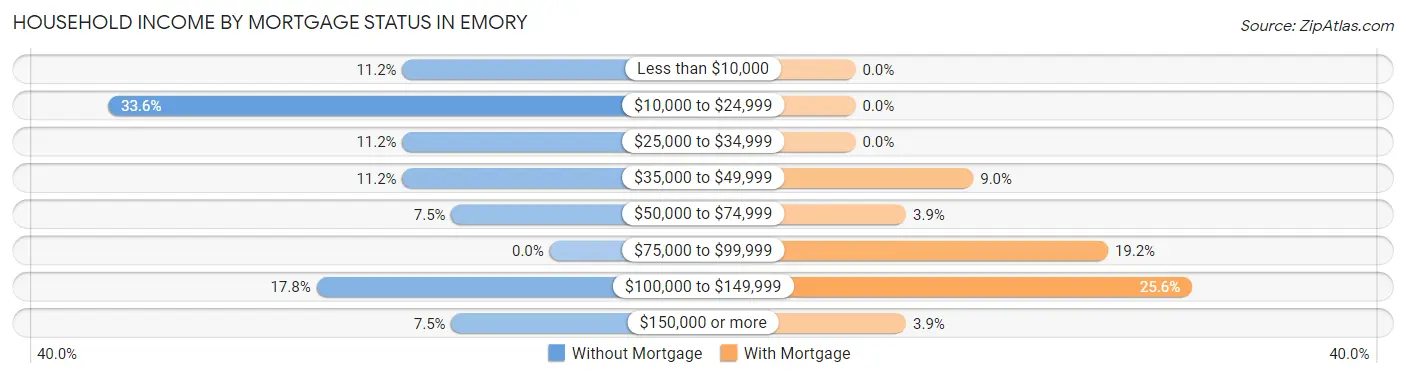
| Household Income | Without Mortgage | With Mortgage |
| Less than $10,000 | 12 (11.2%) | 0 (0.0%) |
| $10,000 to $24,999 | 36 (33.6%) | 0 (0.0%) |
| $25,000 to $34,999 | 12 (11.2%) | 0 (0.0%) |
| $35,000 to $49,999 | 12 (11.2%) | 7 (9.0%) |
| $50,000 to $74,999 | 8 (7.5%) | 3 (3.8%) |
| $75,000 to $99,999 | 0 (0.0%) | 15 (19.2%) |
| $100,000 to $149,999 | 19 (17.8%) | 20 (25.6%) |
| $150,000 or more | 8 (7.5%) | 3 (3.8%) |
| Total | 107 (100.0%) | 78 (100.0%) |
Property Value to Household Income Ratio in Emory
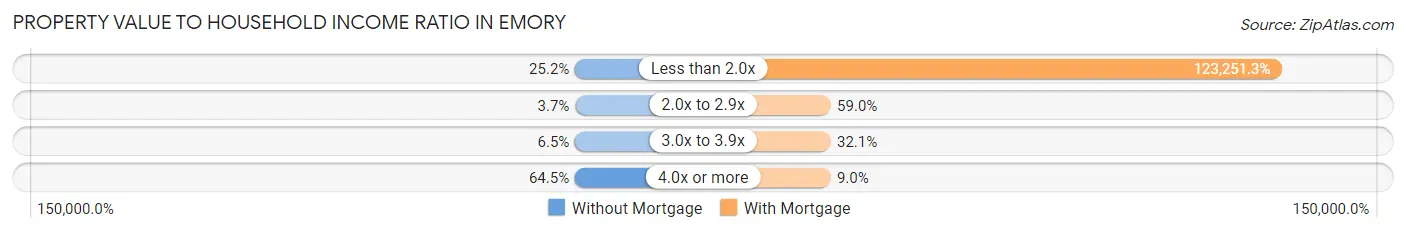
| Value-to-Income Ratio | Without Mortgage | With Mortgage |
| Less than 2.0x | 27 (25.2%) | 96,136 (123,251.3%) |
| 2.0x to 2.9x | 4 (3.7%) | 46 (59.0%) |
| 3.0x to 3.9x | 7 (6.5%) | 25 (32.1%) |
| 4.0x or more | 69 (64.5%) | 7 (9.0%) |
| Total | 107 (100.0%) | 78 (100.0%) |
Real Estate Taxes by Mortgage Status in Emory
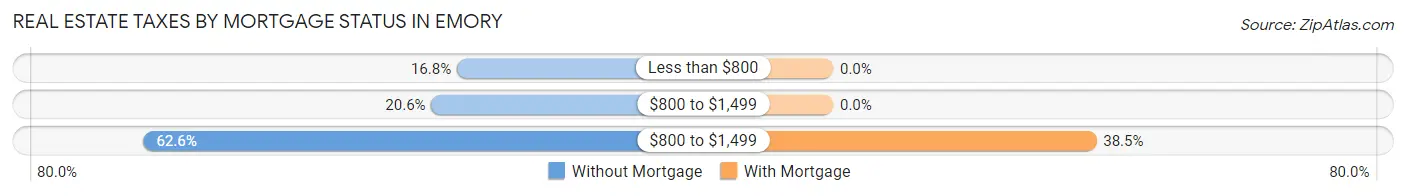
| Property Taxes | Without Mortgage | With Mortgage |
| Less than $800 | 18 (16.8%) | 0 (0.0%) |
| $800 to $1,499 | 22 (20.6%) | 0 (0.0%) |
| $800 to $1,499 | 67 (62.6%) | 30 (38.5%) |
| Total | 107 (100.0%) | 78 (100.0%) |
Health & Disability in Emory
Health Insurance Coverage by Age in Emory
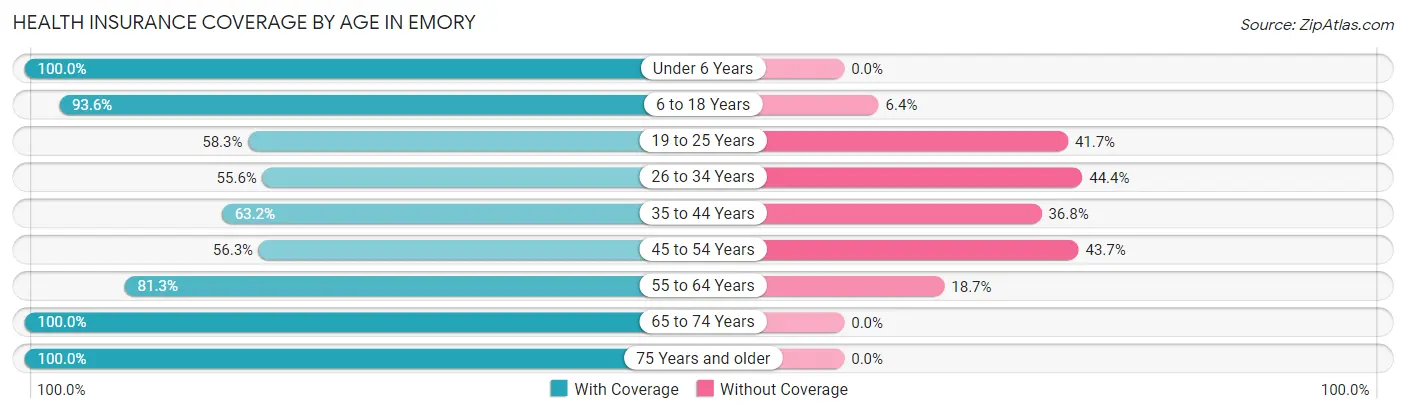
| Age Bracket | With Coverage | Without Coverage |
| Under 6 Years | 155 (100.0%) | 0 (0.0%) |
| 6 to 18 Years | 146 (93.6%) | 10 (6.4%) |
| 19 to 25 Years | 109 (58.3%) | 78 (41.7%) |
| 26 to 34 Years | 124 (55.6%) | 99 (44.4%) |
| 35 to 44 Years | 98 (63.2%) | 57 (36.8%) |
| 45 to 54 Years | 58 (56.3%) | 45 (43.7%) |
| 55 to 64 Years | 109 (81.3%) | 25 (18.7%) |
| 65 to 74 Years | 97 (100.0%) | 0 (0.0%) |
| 75 Years and older | 99 (100.0%) | 0 (0.0%) |
| Total | 995 (76.0%) | 314 (24.0%) |
Health Insurance Coverage by Citizenship Status in Emory
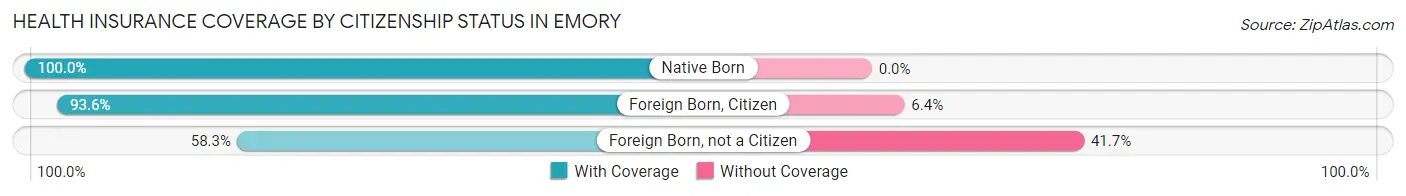
| Citizenship Status | With Coverage | Without Coverage |
| Native Born | 155 (100.0%) | 0 (0.0%) |
| Foreign Born, Citizen | 146 (93.6%) | 10 (6.4%) |
| Foreign Born, not a Citizen | 109 (58.3%) | 78 (41.7%) |
Health Insurance Coverage by Household Income in Emory
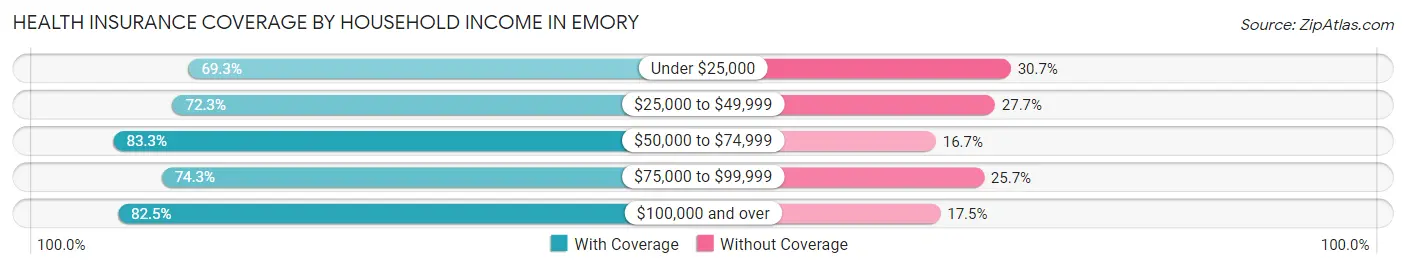
| Household Income | With Coverage | Without Coverage |
| Under $25,000 | 176 (69.3%) | 78 (30.7%) |
| $25,000 to $49,999 | 224 (72.3%) | 86 (27.7%) |
| $50,000 to $74,999 | 115 (83.3%) | 23 (16.7%) |
| $75,000 to $99,999 | 188 (74.3%) | 65 (25.7%) |
| $100,000 and over | 292 (82.5%) | 62 (17.5%) |
Public vs Private Health Insurance Coverage by Age in Emory
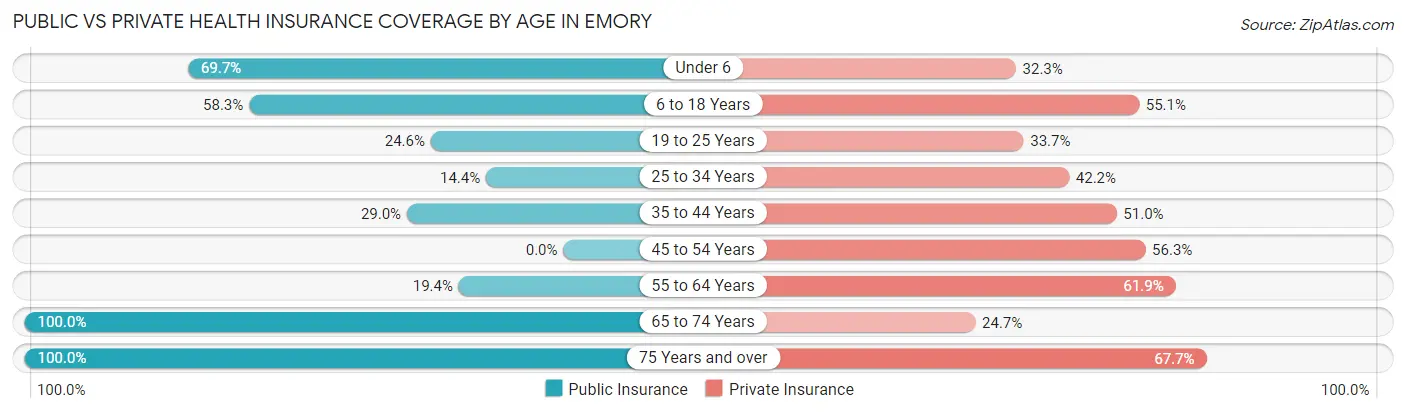
| Age Bracket | Public Insurance | Private Insurance |
| Under 6 | 108 (69.7%) | 50 (32.3%) |
| 6 to 18 Years | 91 (58.3%) | 86 (55.1%) |
| 19 to 25 Years | 46 (24.6%) | 63 (33.7%) |
| 25 to 34 Years | 32 (14.3%) | 94 (42.1%) |
| 35 to 44 Years | 45 (29.0%) | 79 (51.0%) |
| 45 to 54 Years | 0 (0.0%) | 58 (56.3%) |
| 55 to 64 Years | 26 (19.4%) | 83 (61.9%) |
| 65 to 74 Years | 97 (100.0%) | 24 (24.7%) |
| 75 Years and over | 99 (100.0%) | 67 (67.7%) |
| Total | 544 (41.6%) | 604 (46.1%) |
Disability Status by Sex by Age in Emory
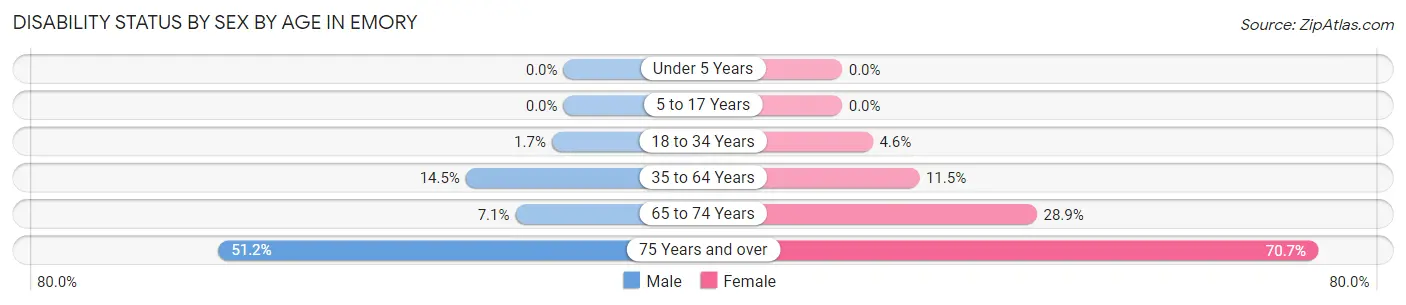
| Age Bracket | Male | Female |
| Under 5 Years | 0 (0.0%) | 0 (0.0%) |
| 5 to 17 Years | 0 (0.0%) | 0 (0.0%) |
| 18 to 34 Years | 5 (1.7%) | 6 (4.5%) |
| 35 to 64 Years | 29 (14.5%) | 22 (11.5%) |
| 65 to 74 Years | 1 (7.1%) | 24 (28.9%) |
| 75 Years and over | 21 (51.2%) | 41 (70.7%) |
Disability Class by Sex by Age in Emory
Disability Class: Hearing Difficulty
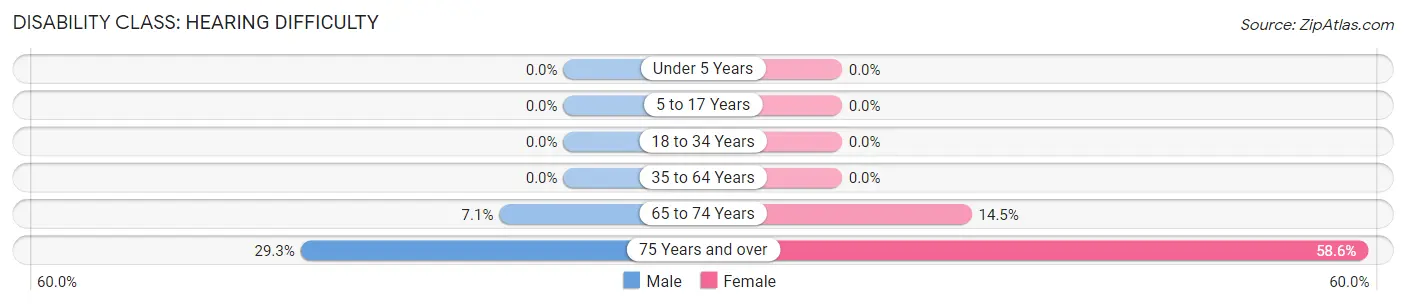
| Age Bracket | Male | Female |
| Under 5 Years | 0 (0.0%) | 0 (0.0%) |
| 5 to 17 Years | 0 (0.0%) | 0 (0.0%) |
| 18 to 34 Years | 0 (0.0%) | 0 (0.0%) |
| 35 to 64 Years | 0 (0.0%) | 0 (0.0%) |
| 65 to 74 Years | 1 (7.1%) | 12 (14.5%) |
| 75 Years and over | 12 (29.3%) | 34 (58.6%) |
Disability Class: Vision Difficulty
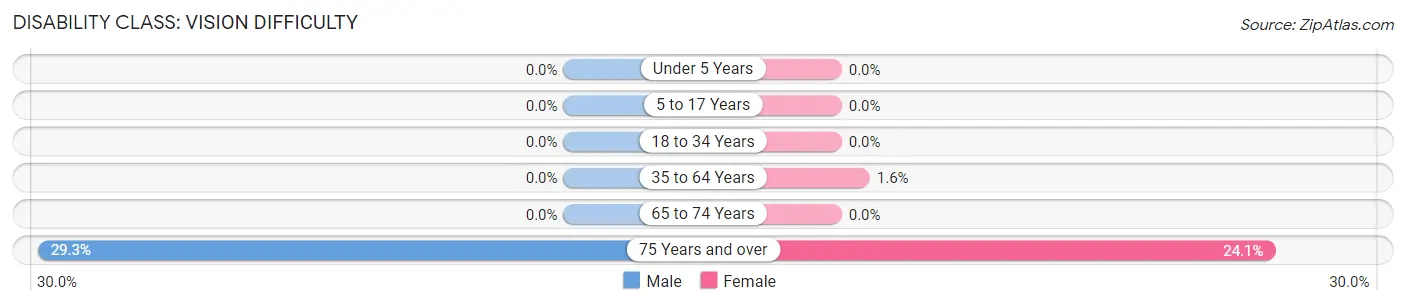
| Age Bracket | Male | Female |
| Under 5 Years | 0 (0.0%) | 0 (0.0%) |
| 5 to 17 Years | 0 (0.0%) | 0 (0.0%) |
| 18 to 34 Years | 0 (0.0%) | 0 (0.0%) |
| 35 to 64 Years | 0 (0.0%) | 3 (1.6%) |
| 65 to 74 Years | 0 (0.0%) | 0 (0.0%) |
| 75 Years and over | 12 (29.3%) | 14 (24.1%) |
Disability Class: Cognitive Difficulty
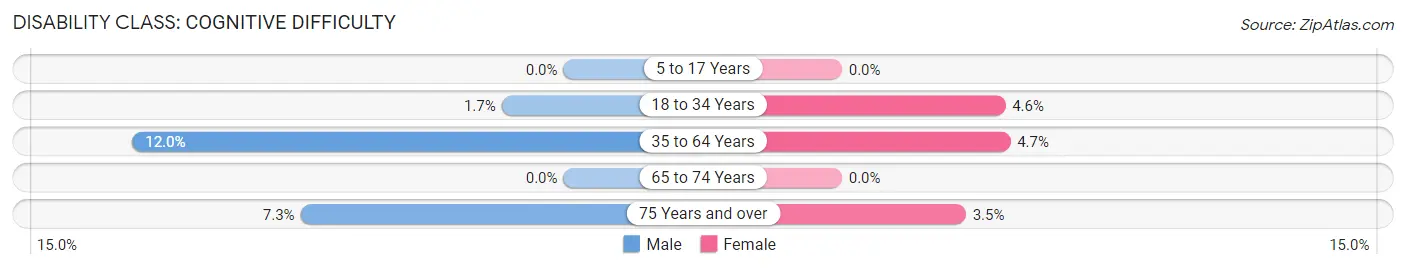
| Age Bracket | Male | Female |
| 5 to 17 Years | 0 (0.0%) | 0 (0.0%) |
| 18 to 34 Years | 5 (1.7%) | 6 (4.5%) |
| 35 to 64 Years | 24 (12.0%) | 9 (4.7%) |
| 65 to 74 Years | 0 (0.0%) | 0 (0.0%) |
| 75 Years and over | 3 (7.3%) | 2 (3.5%) |
Disability Class: Ambulatory Difficulty
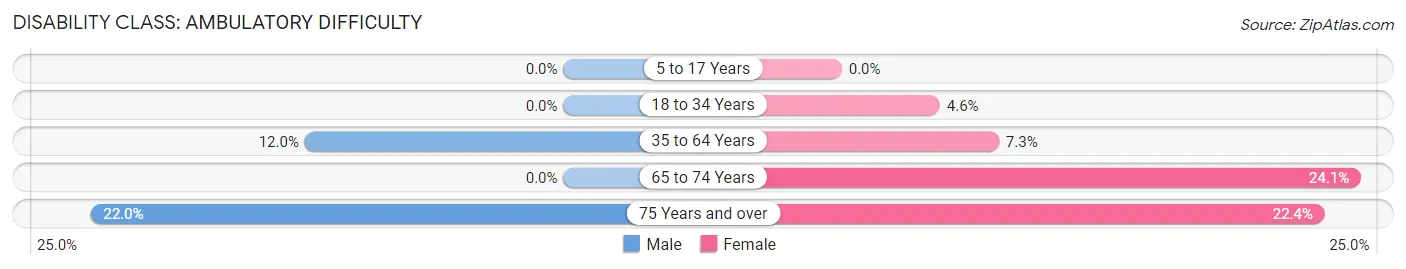
| Age Bracket | Male | Female |
| 5 to 17 Years | 0 (0.0%) | 0 (0.0%) |
| 18 to 34 Years | 0 (0.0%) | 6 (4.5%) |
| 35 to 64 Years | 24 (12.0%) | 14 (7.3%) |
| 65 to 74 Years | 0 (0.0%) | 20 (24.1%) |
| 75 Years and over | 9 (22.0%) | 13 (22.4%) |
Disability Class: Self-Care Difficulty
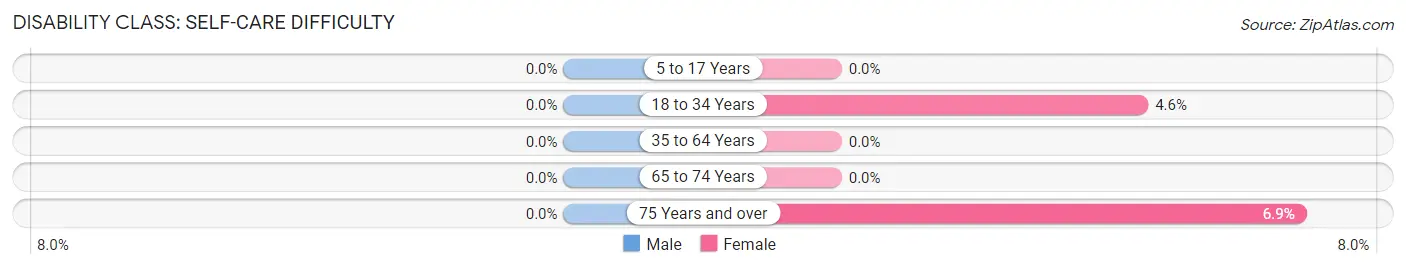
| Age Bracket | Male | Female |
| 5 to 17 Years | 0 (0.0%) | 0 (0.0%) |
| 18 to 34 Years | 0 (0.0%) | 6 (4.5%) |
| 35 to 64 Years | 0 (0.0%) | 0 (0.0%) |
| 65 to 74 Years | 0 (0.0%) | 0 (0.0%) |
| 75 Years and over | 0 (0.0%) | 4 (6.9%) |
Technology Access in Emory
Computing Device Access in Emory
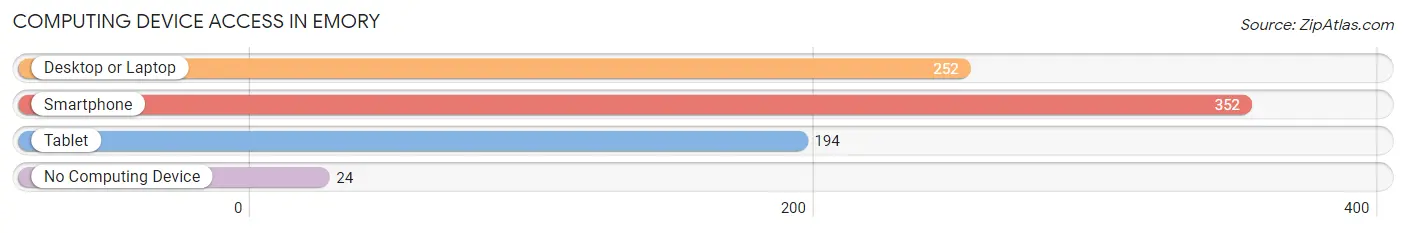
| Device Type | # Households | % Households |
| Desktop or Laptop | 252 | 61.5% |
| Smartphone | 352 | 85.9% |
| Tablet | 194 | 47.3% |
| No Computing Device | 24 | 5.9% |
| Total | 410 | 100.0% |
Internet Access in Emory
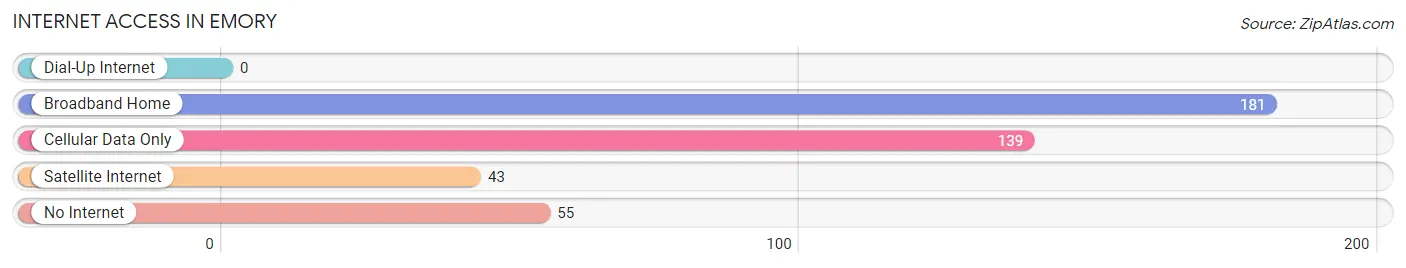
| Internet Type | # Households | % Households |
| Dial-Up Internet | 0 | 0.0% |
| Broadband Home | 181 | 44.2% |
| Cellular Data Only | 139 | 33.9% |
| Satellite Internet | 43 | 10.5% |
| No Internet | 55 | 13.4% |
| Total | 410 | 100.0% |
Emory Summary
Emory, Texas is a small town located in Rains County, Texas, United States. It is situated about 75 miles east of Dallas and is part of the Dallas-Fort Worth Metroplex. The population of Emory was 1,717 at the 2010 census.
History
The area that is now Emory was first settled in the 1840s by a group of settlers from Tennessee. The town was originally known as "Tennessee Colony" and was later renamed "Emory" in honor of Bishop John Emory, a Methodist bishop who had died in 1835.
The town was officially incorporated in 1873 and was the county seat of Rains County until 1884, when the county seat was moved to nearby Point.
Geography
Emory is located at the intersection of State Highway 19 and State Highway 276 in Rains County, Texas. It is situated about 75 miles east of Dallas and is part of the Dallas-Fort Worth Metroplex.
The town has a total area of 1 7 square miles all of which is land
Economy
The economy of Emory is largely based on agriculture and tourism. The town is home to several farms and ranches, as well as a number of small businesses.
Tourism is also an important part of the local economy. The town is home to several popular attractions, including the Emory Railroad Museum, the Emory City Park, and the Emory Public Library.
Demographics
As of the 2010 census, the population of Emory was 1,717. The racial makeup of the town was 87.3% White, 8.2% African American, 0.3% Native American, 0.7% Asian, 0.1% Pacific Islander, 1.7% from other races, and 1.9% from two or more races. Hispanic or Latino of any race were 4.2% of the population.
The median income for a household in Emory was $37,917, and the median income for a family was $45,000. The per capita income for the town was $18,945. About 11.2% of families and 14.2% of the population were below the poverty line, including 18.2% of those under age 18 and 11.2% of those age 65 or over.
Common Questions
What is Per Capita Income in Emory?
Per Capita income in Emory is $23,499.
What is the Median Family Income in Emory?
Median Family Income in Emory is $81,324.
What is the Median Household income in Emory?
Median Household Income in Emory is $38,750.
What is Income or Wage Gap in Emory?
Income or Wage Gap in Emory is 15.9%.
Women in Emory earn 84.1 cents for every dollar earned by a man.
What is Inequality or Gini Index in Emory?
Inequality or Gini Index in Emory is 0.44.
What is the Total Population of Emory?
Total Population of Emory is 1,373.
What is the Total Male Population of Emory?
Total Male Population of Emory is 750.
What is the Total Female Population of Emory?
Total Female Population of Emory is 623.
What is the Ratio of Males per 100 Females in Emory?
There are 120.39 Males per 100 Females in Emory.
What is the Ratio of Females per 100 Males in Emory?
There are 83.07 Females per 100 Males in Emory.
What is the Median Population Age in Emory?
Median Population Age in Emory is 32.7 Years.
What is the Average Family Size in Emory
Average Family Size in Emory is 4.1 People.
What is the Average Household Size in Emory
Average Household Size in Emory is 3.2 People.
How Large is the Labor Force in Emory?
There are 668 People in the Labor Forcein in Emory.
What is the Percentage of People in the Labor Force in Emory?
61.0% of People are in the Labor Force in Emory.
What is the Unemployment Rate in Emory?
Unemployment Rate in Emory is 3.0%.