Zip Codes with the Highest Percentage of Population with a Degree in Education in San Antonio, TX
RELATED REPORTS & OPTIONS
Education
San Antonio
Compare Zip Codes
Map of Zip Codes with the Highest Percentage of Population with a Degree in Education in San Antonio
3.4%
52.5%
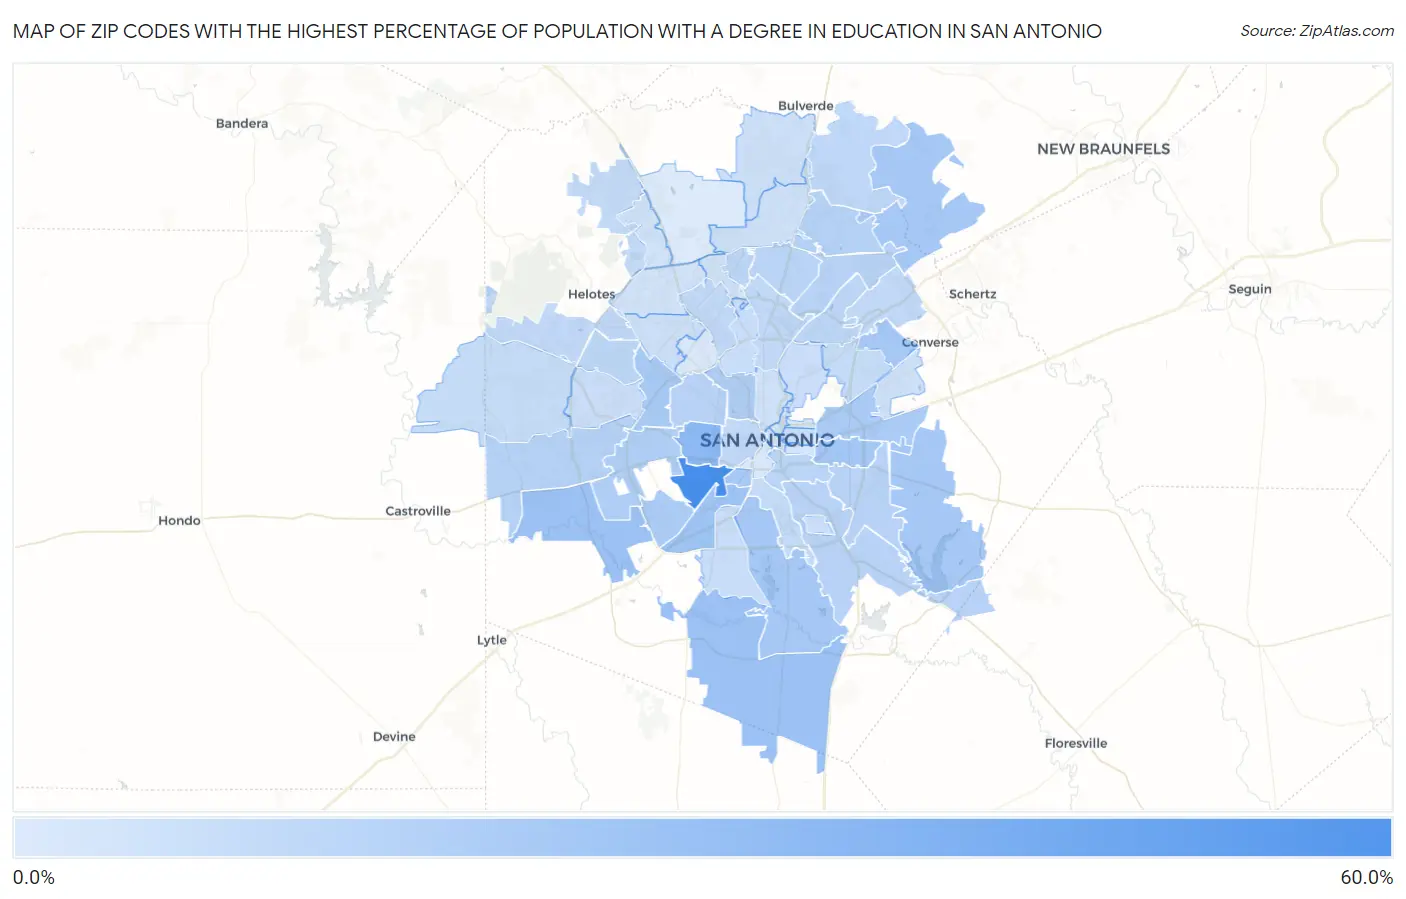
Zip Codes with the Highest Percentage of Population with a Degree in Education in San Antonio, TX
| Zip Code | % Graduates | vs State | vs National | |
| 1. | 78226 | 52.5% | 10.9%(+41.6)#59 | 11.1%(+41.4)#1,035 |
| 2. | 78237 | 27.5% | 10.9%(+16.6)#329 | 11.1%(+16.4)#5,553 |
| 3. | 78264 | 23.2% | 10.9%(+12.3)#460 | 11.1%(+12.1)#8,079 |
| 4. | 78252 | 22.9% | 10.9%(+12.0)#471 | 11.1%(+11.8)#8,287 |
| 5. | 78211 | 21.4% | 10.9%(+10.5)#523 | 11.1%(+10.4)#9,393 |
| 6. | 78220 | 19.9% | 10.9%(+8.99)#606 | 11.1%(+8.83)#10,638 |
| 7. | 78266 | 19.4% | 10.9%(+8.51)#632 | 11.1%(+8.35)#11,076 |
| 8. | 78221 | 19.4% | 10.9%(+8.47)#638 | 11.1%(+8.31)#11,110 |
| 9. | 78263 | 19.3% | 10.9%(+8.41)#639 | 11.1%(+8.25)#11,169 |
| 10. | 78239 | 19.3% | 10.9%(+8.40)#641 | 11.1%(+8.24)#11,173 |
| 11. | 78225 | 19.3% | 10.9%(+8.39)#642 | 11.1%(+8.23)#11,185 |
| 12. | 78238 | 19.0% | 10.9%(+8.10)#662 | 11.1%(+7.94)#11,410 |
| 13. | 78219 | 17.7% | 10.9%(+6.78)#744 | 11.1%(+6.62)#12,692 |
| 14. | 78242 | 17.3% | 10.9%(+6.35)#781 | 11.1%(+6.19)#13,122 |
| 15. | 78201 | 15.8% | 10.9%(+4.91)#889 | 11.1%(+4.75)#14,727 |
| 16. | 78227 | 15.5% | 10.9%(+4.63)#909 | 11.1%(+4.47)#15,037 |
| 17. | 78245 | 14.3% | 10.9%(+3.41)#1,004 | 11.1%(+3.25)#16,579 |
| 18. | 78259 | 14.1% | 10.9%(+3.24)#1,017 | 11.1%(+3.08)#16,851 |
| 19. | 78222 | 13.8% | 10.9%(+2.92)#1,033 | 11.1%(+2.76)#17,237 |
| 20. | 78247 | 13.6% | 10.9%(+2.66)#1,046 | 11.1%(+2.50)#17,566 |
| 21. | 78228 | 13.5% | 10.9%(+2.65)#1,047 | 11.1%(+2.49)#17,589 |
| 22. | 78223 | 13.5% | 10.9%(+2.62)#1,050 | 11.1%(+2.46)#17,620 |
| 23. | 78210 | 13.3% | 10.9%(+2.40)#1,064 | 11.1%(+2.23)#17,897 |
| 24. | 78232 | 13.1% | 10.9%(+2.21)#1,074 | 11.1%(+2.04)#18,121 |
| 25. | 78217 | 12.6% | 10.9%(+1.68)#1,115 | 11.1%(+1.52)#18,800 |
| 26. | 78250 | 12.3% | 10.9%(+1.37)#1,148 | 11.1%(+1.21)#19,238 |
| 27. | 78248 | 12.3% | 10.9%(+1.35)#1,149 | 11.1%(+1.19)#19,261 |
| 28. | 78261 | 11.5% | 10.9%(+0.626)#1,207 | 11.1%(+0.465)#20,259 |
| 29. | 78254 | 11.4% | 10.9%(+0.518)#1,216 | 11.1%(+0.357)#20,399 |
| 30. | 78230 | 11.3% | 10.9%(+0.411)#1,222 | 11.1%(+0.250)#20,537 |
| 31. | 78207 | 11.3% | 10.9%(+0.399)#1,225 | 11.1%(+0.239)#20,556 |
| 32. | 78233 | 11.1% | 10.9%(+0.210)#1,236 | 11.1%(+0.049)#20,850 |
| 33. | 78216 | 11.0% | 10.9%(+0.104)#1,241 | 11.1%(-0.057)#20,965 |
| 34. | 78214 | 10.8% | 10.9%(-0.137)#1,259 | 11.1%(-0.298)#21,280 |
| 35. | 78255 | 10.2% | 10.9%(-0.723)#1,301 | 11.1%(-0.884)#22,094 |
| 36. | 78218 | 9.8% | 10.9%(-1.07)#1,322 | 11.1%(-1.23)#22,589 |
| 37. | 78253 | 9.6% | 10.9%(-1.30)#1,335 | 11.1%(-1.46)#22,876 |
| 38. | 78213 | 9.1% | 10.9%(-1.84)#1,373 | 11.1%(-2.00)#23,628 |
| 39. | 78202 | 9.0% | 10.9%(-1.90)#1,377 | 11.1%(-2.06)#23,688 |
| 40. | 78224 | 8.8% | 10.9%(-2.08)#1,391 | 11.1%(-2.24)#23,916 |
| 41. | 78251 | 8.4% | 10.9%(-2.49)#1,419 | 11.1%(-2.65)#24,398 |
| 42. | 78209 | 8.4% | 10.9%(-2.53)#1,422 | 11.1%(-2.69)#24,429 |
| 43. | 78240 | 8.1% | 10.9%(-2.81)#1,442 | 11.1%(-2.97)#24,762 |
| 44. | 78235 | 7.9% | 10.9%(-3.05)#1,459 | 11.1%(-3.21)#25,039 |
| 45. | 78260 | 7.6% | 10.9%(-3.34)#1,483 | 11.1%(-3.50)#25,318 |
| 46. | 78205 | 7.5% | 10.9%(-3.42)#1,489 | 11.1%(-3.58)#25,410 |
| 47. | 78244 | 7.3% | 10.9%(-3.55)#1,500 | 11.1%(-3.71)#25,549 |
| 48. | 78212 | 7.2% | 10.9%(-3.67)#1,506 | 11.1%(-3.83)#25,673 |
| 49. | 78258 | 7.2% | 10.9%(-3.74)#1,511 | 11.1%(-3.90)#25,738 |
| 50. | 78231 | 6.7% | 10.9%(-4.16)#1,538 | 11.1%(-4.32)#26,176 |
| 51. | 78256 | 6.6% | 10.9%(-4.29)#1,547 | 11.1%(-4.45)#26,303 |
| 52. | 78249 | 6.5% | 10.9%(-4.36)#1,551 | 11.1%(-4.53)#26,362 |
| 53. | 78215 | 5.9% | 10.9%(-4.97)#1,589 | 11.1%(-5.13)#26,879 |
| 54. | 78203 | 5.8% | 10.9%(-5.06)#1,592 | 11.1%(-5.22)#26,946 |
| 55. | 78208 | 4.3% | 10.9%(-6.61)#1,663 | 11.1%(-6.77)#28,010 |
| 56. | 78204 | 3.9% | 10.9%(-6.97)#1,673 | 11.1%(-7.13)#28,238 |
| 57. | 78229 | 3.8% | 10.9%(-7.12)#1,678 | 11.1%(-7.28)#28,323 |
| 58. | 78257 | 3.4% | 10.9%(-7.48)#1,683 | 11.1%(-7.64)#28,513 |
1
Common Questions
What are the Top 10 Zip Codes with the Highest Percentage of Population with a Degree in Education in San Antonio, TX?
Top 10 Zip Codes with the Highest Percentage of Population with a Degree in Education in San Antonio, TX are:
What zip code has the Highest Percentage of Population with a Degree in Education in San Antonio, TX?
78226 has the Highest Percentage of Population with a Degree in Education in San Antonio, TX with 52.5%.
What is the Percentage of Population with a Degree in Education in San Antonio, TX?
Percentage of Population with a Degree in Education in San Antonio is 10.6%.
What is the Percentage of Population with a Degree in Education in Texas?
Percentage of Population with a Degree in Education in Texas is 10.9%.
What is the Percentage of Population with a Degree in Education in the United States?
Percentage of Population with a Degree in Education in the United States is 11.1%.