Zip Codes with the Highest Percentage of Population Employed in Farming, Fishing & Forestry in Georgetown, TX
RELATED REPORTS & OPTIONS
Farming, Fishing & Forestry
Georgetown
Compare Zip Codes
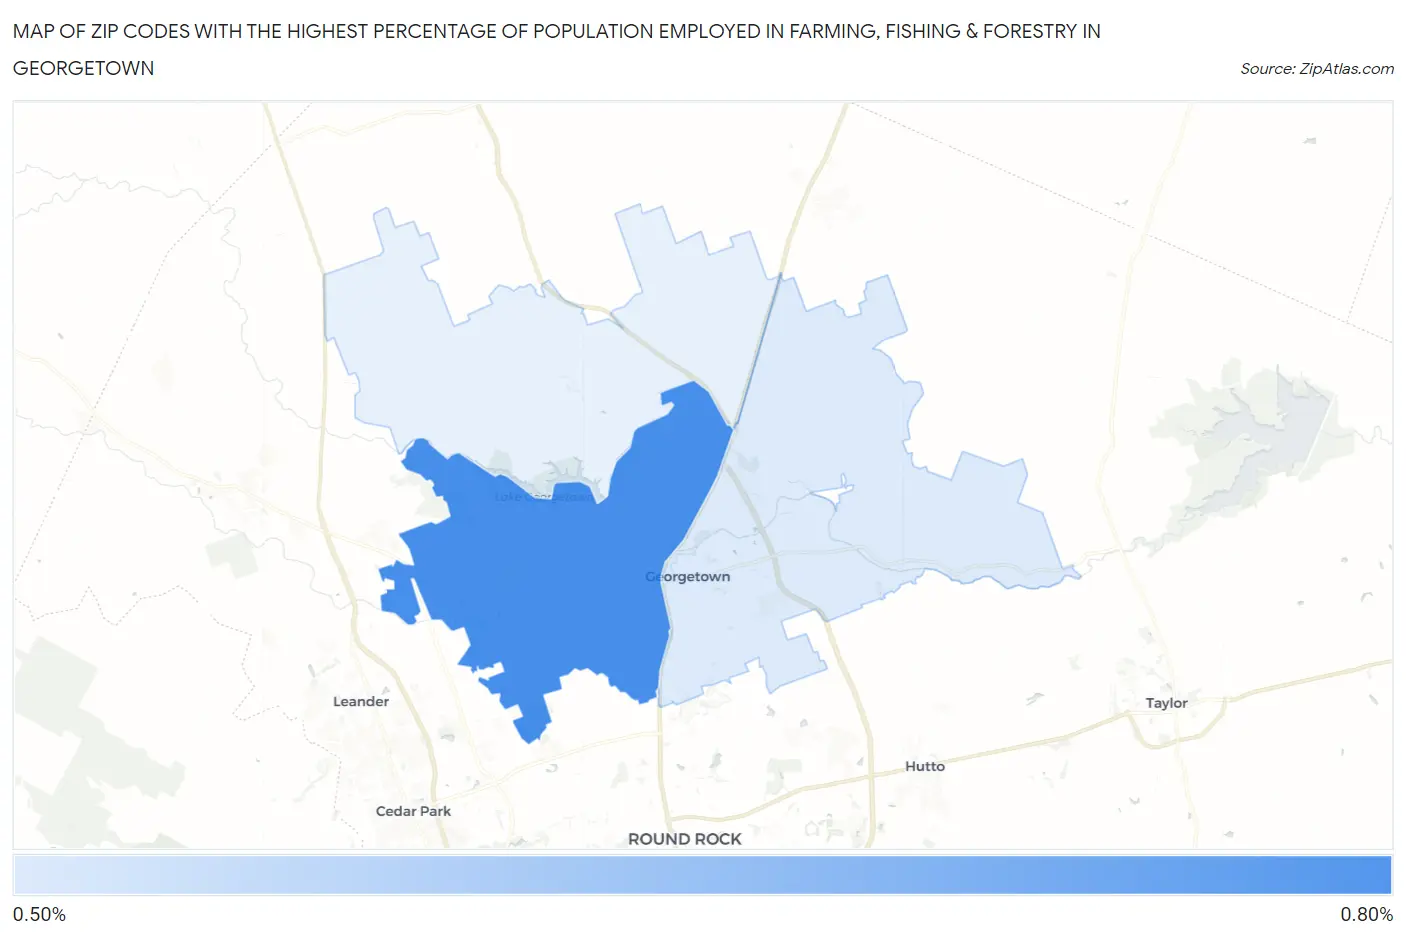
Map of Zip Codes with the Highest Percentage of Population Employed in Farming, Fishing & Forestry in Georgetown
0.54%
0.62%
Zip Codes with the Highest Percentage of Population Employed in Farming, Fishing & Forestry in Georgetown, TX
| Zip Code | % Employed | vs State | vs National | |
| 1. | 78628 | 0.62% | 0.37%(+0.252)#626 | 0.61%(+0.019)#11,858 |
| 2. | 78626 | 0.54% | 0.37%(+0.166)#659 | 0.61%(-0.067)#12,537 |
1
Common Questions
What are the Top Zip Codes with the Highest Percentage of Population Employed in Farming, Fishing & Forestry in Georgetown, TX?
Top Zip Codes with the Highest Percentage of Population Employed in Farming, Fishing & Forestry in Georgetown, TX are:
What zip code has the Highest Percentage of Population Employed in Farming, Fishing & Forestry in Georgetown, TX?
78628 has the Highest Percentage of Population Employed in Farming, Fishing & Forestry in Georgetown, TX with 0.62%.
What is the Percentage of Population Employed in Farming, Fishing & Forestry in Georgetown, TX?
Percentage of Population Employed in Farming, Fishing & Forestry in Georgetown is 0.76%.
What is the Percentage of Population Employed in Farming, Fishing & Forestry in Texas?
Percentage of Population Employed in Farming, Fishing & Forestry in Texas is 0.37%.
What is the Percentage of Population Employed in Farming, Fishing & Forestry in the United States?
Percentage of Population Employed in Farming, Fishing & Forestry in the United States is 0.61%.