Zip Codes with the Highest Percentage of Population Employed in Farming, Fishing & Forestry in Cleveland, TX
RELATED REPORTS & OPTIONS
Farming, Fishing & Forestry
Cleveland
Compare Zip Codes
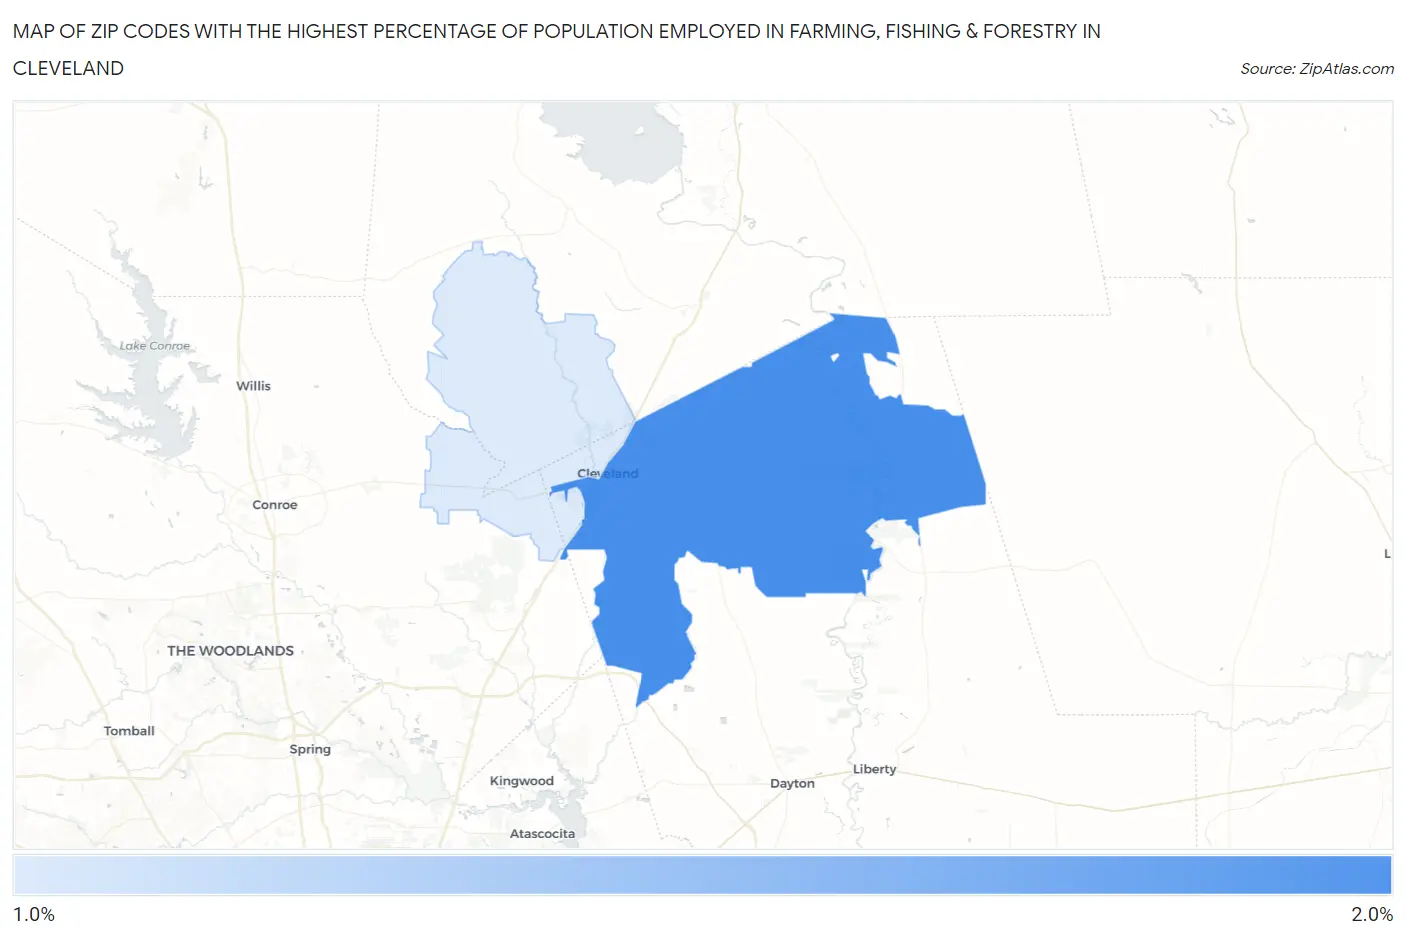
Map of Zip Codes with the Highest Percentage of Population Employed in Farming, Fishing & Forestry in Cleveland
1.4%
1.9%
Zip Codes with the Highest Percentage of Population Employed in Farming, Fishing & Forestry in Cleveland, TX
| Zip Code | % Employed | vs State | vs National | |
| 1. | 77327 | 1.9% | 0.37%(+1.48)#355 | 0.61%(+1.25)#6,877 |
| 2. | 77328 | 1.4% | 0.37%(+1.05)#427 | 0.61%(+0.814)#8,142 |
1
Common Questions
What are the Top Zip Codes with the Highest Percentage of Population Employed in Farming, Fishing & Forestry in Cleveland, TX?
Top Zip Codes with the Highest Percentage of Population Employed in Farming, Fishing & Forestry in Cleveland, TX are:
What zip code has the Highest Percentage of Population Employed in Farming, Fishing & Forestry in Cleveland, TX?
77327 has the Highest Percentage of Population Employed in Farming, Fishing & Forestry in Cleveland, TX with 1.9%.
What is the Percentage of Population Employed in Farming, Fishing & Forestry in Texas?
Percentage of Population Employed in Farming, Fishing & Forestry in Texas is 0.37%.
What is the Percentage of Population Employed in Farming, Fishing & Forestry in the United States?
Percentage of Population Employed in Farming, Fishing & Forestry in the United States is 0.61%.