Zip Codes with the Highest Percentage of Population Employed in Farming, Fishing & Forestry in Edinburg, TX
RELATED REPORTS & OPTIONS
Farming, Fishing & Forestry
Edinburg
Compare Zip Codes
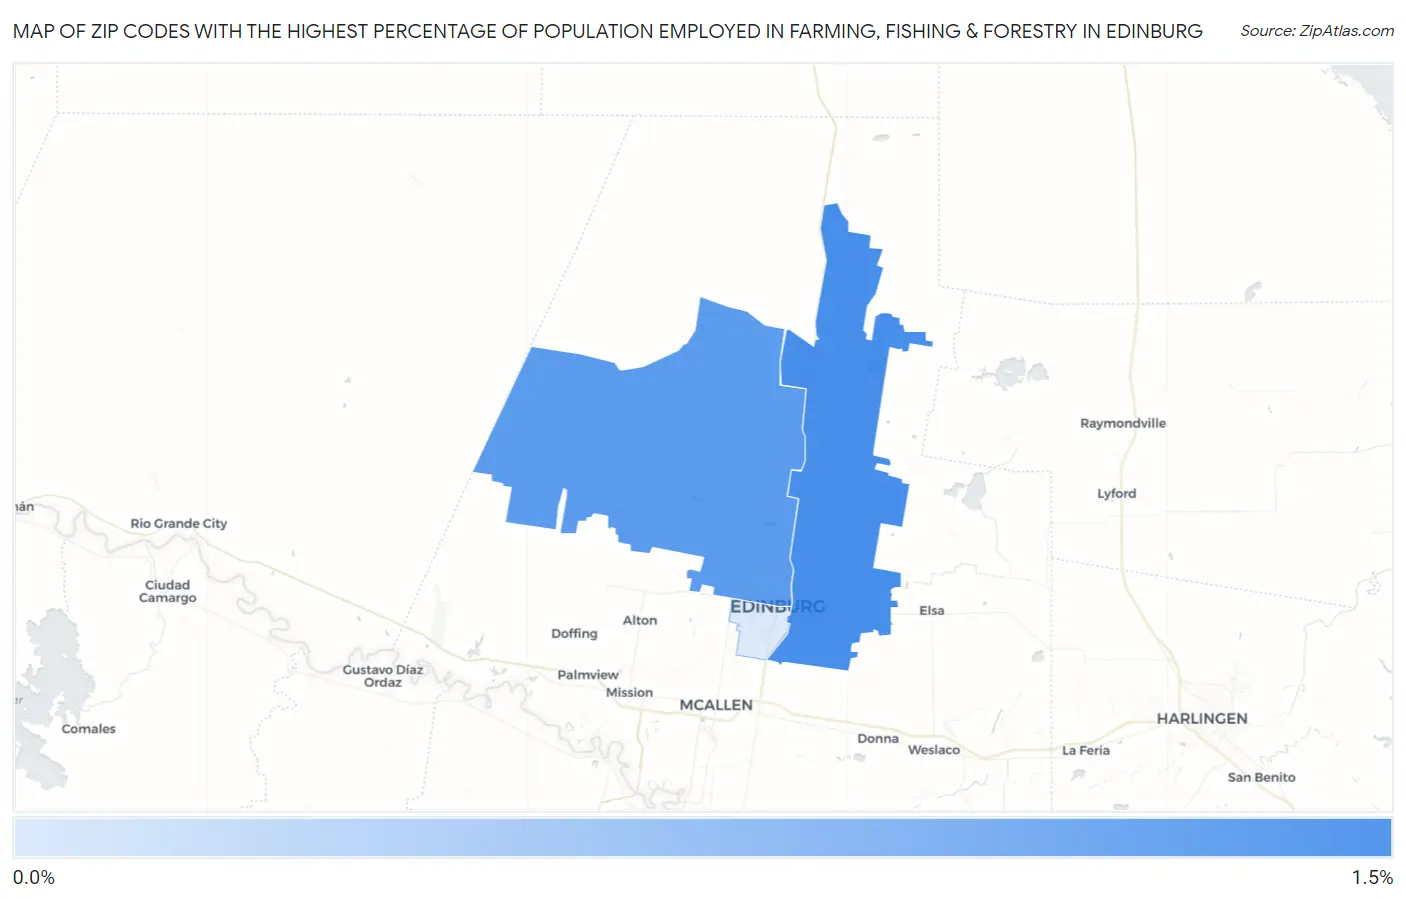
Map of Zip Codes with the Highest Percentage of Population Employed in Farming, Fishing & Forestry in Edinburg
0.14%
1.2%
Zip Codes with the Highest Percentage of Population Employed in Farming, Fishing & Forestry in Edinburg, TX
| Zip Code | % Employed | vs State | vs National | |
| 1. | 78542 | 1.2% | 0.37%(+0.875)#461 | 0.61%(+0.642)#8,771 |
| 2. | 78541 | 1.1% | 0.37%(+0.739)#489 | 0.61%(+0.506)#9,274 |
| 3. | 78539 | 0.14% | 0.37%(-0.228)#940 | 0.61%(-0.461)#17,022 |
1
Common Questions
What are the Top Zip Codes with the Highest Percentage of Population Employed in Farming, Fishing & Forestry in Edinburg, TX?
Top Zip Codes with the Highest Percentage of Population Employed in Farming, Fishing & Forestry in Edinburg, TX are:
What zip code has the Highest Percentage of Population Employed in Farming, Fishing & Forestry in Edinburg, TX?
78542 has the Highest Percentage of Population Employed in Farming, Fishing & Forestry in Edinburg, TX with 1.2%.
What is the Percentage of Population Employed in Farming, Fishing & Forestry in Edinburg, TX?
Percentage of Population Employed in Farming, Fishing & Forestry in Edinburg is 0.26%.
What is the Percentage of Population Employed in Farming, Fishing & Forestry in Texas?
Percentage of Population Employed in Farming, Fishing & Forestry in Texas is 0.37%.
What is the Percentage of Population Employed in Farming, Fishing & Forestry in the United States?
Percentage of Population Employed in Farming, Fishing & Forestry in the United States is 0.61%.