Sarita, TX Map & Demographics
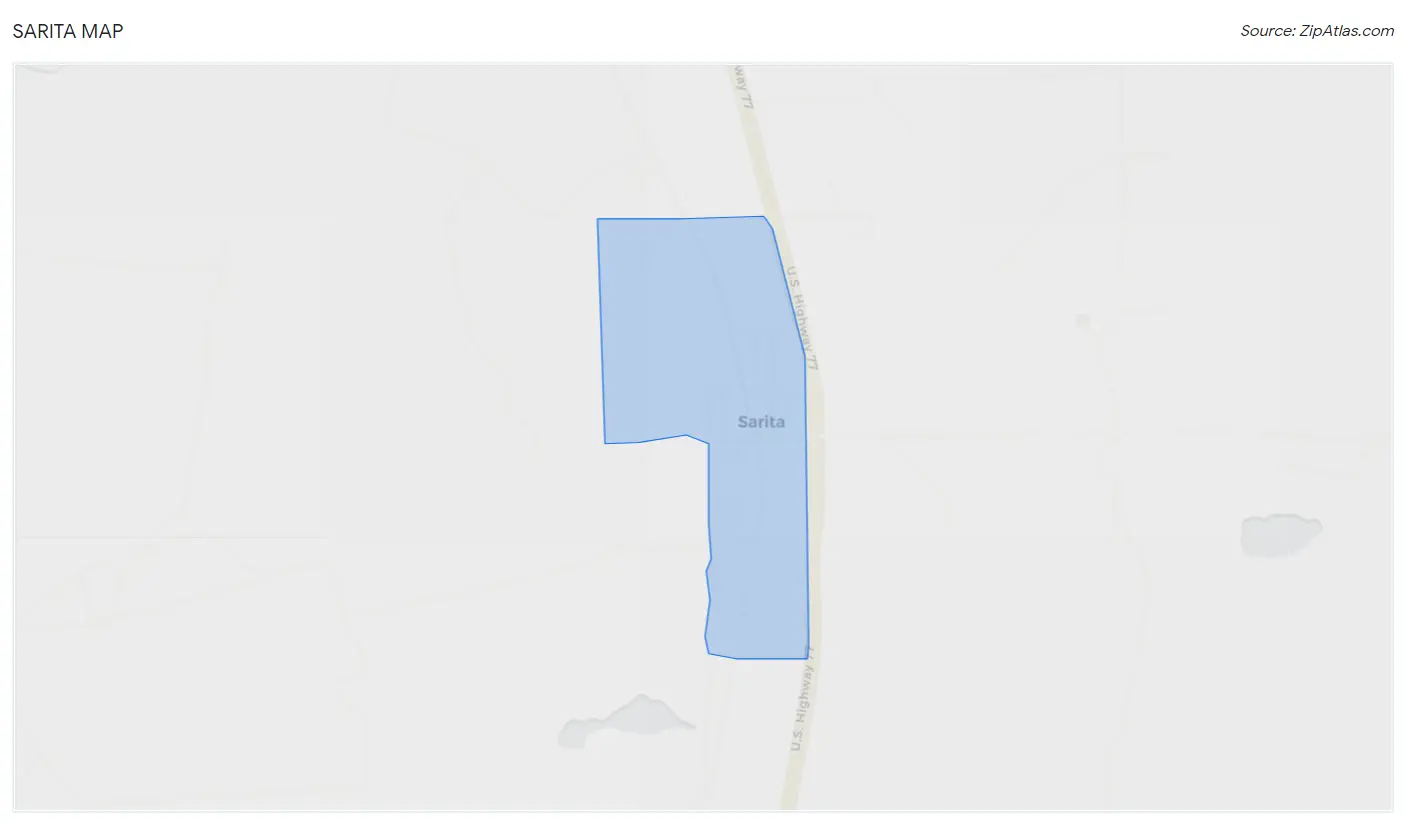
Sarita Map
Sarita Overview
$21,263
PER CAPITA INCOME
$45,455
AVG FAMILY INCOME
$45,455
AVG HOUSEHOLD INCOME
0.30
INEQUALITY / GINI INDEX
111
TOTAL POPULATION
65
MALE POPULATION
46
FEMALE POPULATION
141.30
MALES / 100 FEMALES
70.77
FEMALES / 100 MALES
39.8
MEDIAN AGE
2.9
AVG FAMILY SIZE
2.9
AVG HOUSEHOLD SIZE
43
LABOR FORCE [ PEOPLE ]
51.8%
PERCENT IN LABOR FORCE
Sarita Zip Codes
Sarita Area Codes
Income in Sarita
Income Overview in Sarita
Per Capita Income in Sarita is $21,263, while median incomes of families and households are $45,455 and $45,455 respectively.
| Characteristic | Number | Measure |
| Per Capita Income | 111 | $21,263 |
| Median Family Income | 38 | $45,455 |
| Mean Family Income | 38 | $56,413 |
| Median Household Income | 38 | $45,455 |
| Mean Household Income | 38 | $56,413 |
| Income Deficit | 38 | $0 |
| Wage / Income Gap (%) | 111 | 0.00% |
| Wage / Income Gap ($) | 111 | 100.00¢ per $1 |
| Gini / Inequality Index | 111 | 0.30 |
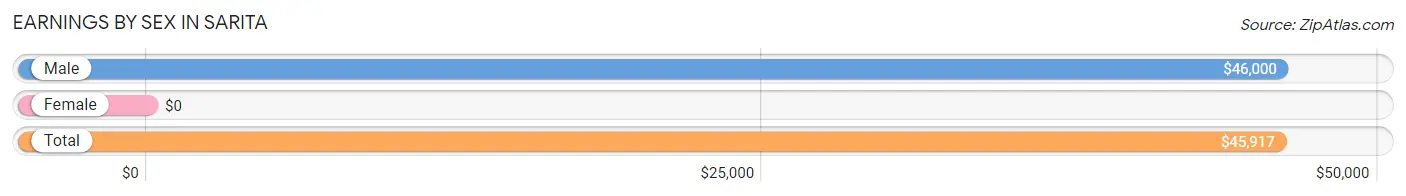
Earnings by Sex in Sarita
| Sex | Number | Average Earnings |
| Male | 36 (83.7%) | $46,000 |
| Female | 7 (16.3%) | $0 |
| Total | 43 (100.0%) | $45,917 |
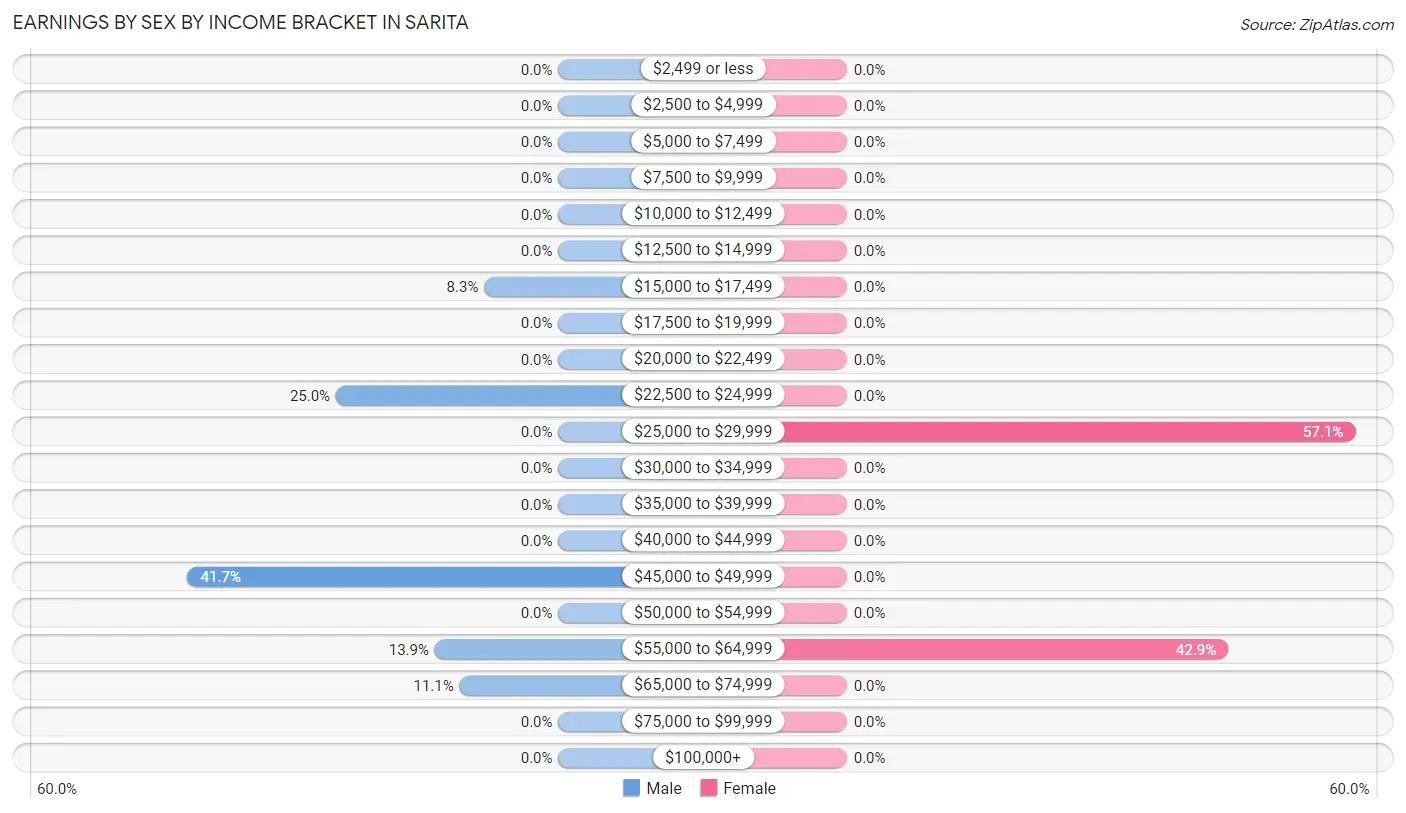
Earnings by Sex by Income Bracket in Sarita
The most common earnings brackets in Sarita are $45,000 to $49,999 for men (15 | 41.7%) and $25,000 to $29,999 for women (4 | 57.1%).
| Income | Male | Female |
| $2,499 or less | 0 (0.0%) | 0 (0.0%) |
| $2,500 to $4,999 | 0 (0.0%) | 0 (0.0%) |
| $5,000 to $7,499 | 0 (0.0%) | 0 (0.0%) |
| $7,500 to $9,999 | 0 (0.0%) | 0 (0.0%) |
| $10,000 to $12,499 | 0 (0.0%) | 0 (0.0%) |
| $12,500 to $14,999 | 0 (0.0%) | 0 (0.0%) |
| $15,000 to $17,499 | 3 (8.3%) | 0 (0.0%) |
| $17,500 to $19,999 | 0 (0.0%) | 0 (0.0%) |
| $20,000 to $22,499 | 0 (0.0%) | 0 (0.0%) |
| $22,500 to $24,999 | 9 (25.0%) | 0 (0.0%) |
| $25,000 to $29,999 | 0 (0.0%) | 4 (57.1%) |
| $30,000 to $34,999 | 0 (0.0%) | 0 (0.0%) |
| $35,000 to $39,999 | 0 (0.0%) | 0 (0.0%) |
| $40,000 to $44,999 | 0 (0.0%) | 0 (0.0%) |
| $45,000 to $49,999 | 15 (41.7%) | 0 (0.0%) |
| $50,000 to $54,999 | 0 (0.0%) | 0 (0.0%) |
| $55,000 to $64,999 | 5 (13.9%) | 3 (42.9%) |
| $65,000 to $74,999 | 4 (11.1%) | 0 (0.0%) |
| $75,000 to $99,999 | 0 (0.0%) | 0 (0.0%) |
| $100,000+ | 0 (0.0%) | 0 (0.0%) |
| Total | 36 (100.0%) | 7 (100.0%) |
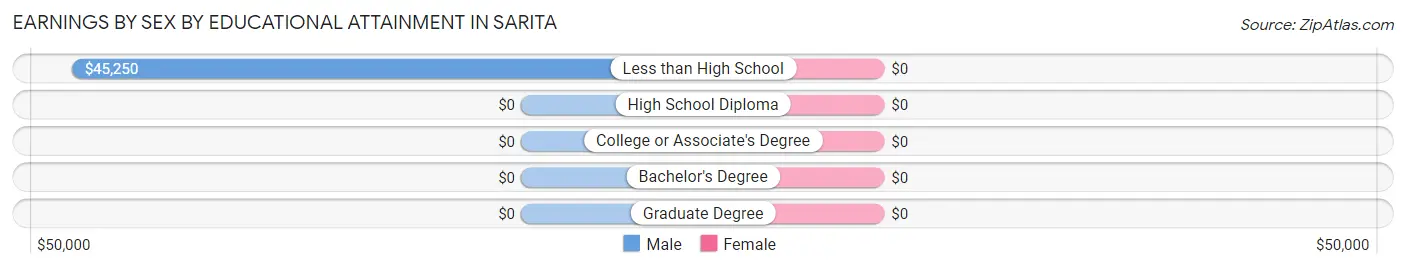
Earnings by Sex by Educational Attainment in Sarita
| Educational Attainment | Male Income | Female Income |
| Less than High School | $45,250 | $0 |
| High School Diploma | - | - |
| College or Associate's Degree | - | - |
| Bachelor's Degree | - | - |
| Graduate Degree | - | - |
| Total | $46,000 | $0 |
Family Income in Sarita
Family Income Brackets in Sarita
According to the Sarita family income data, there are 23 families falling into the $35,000 to $49,999 income range, which is the most common income bracket and makes up 60.5% of all families.
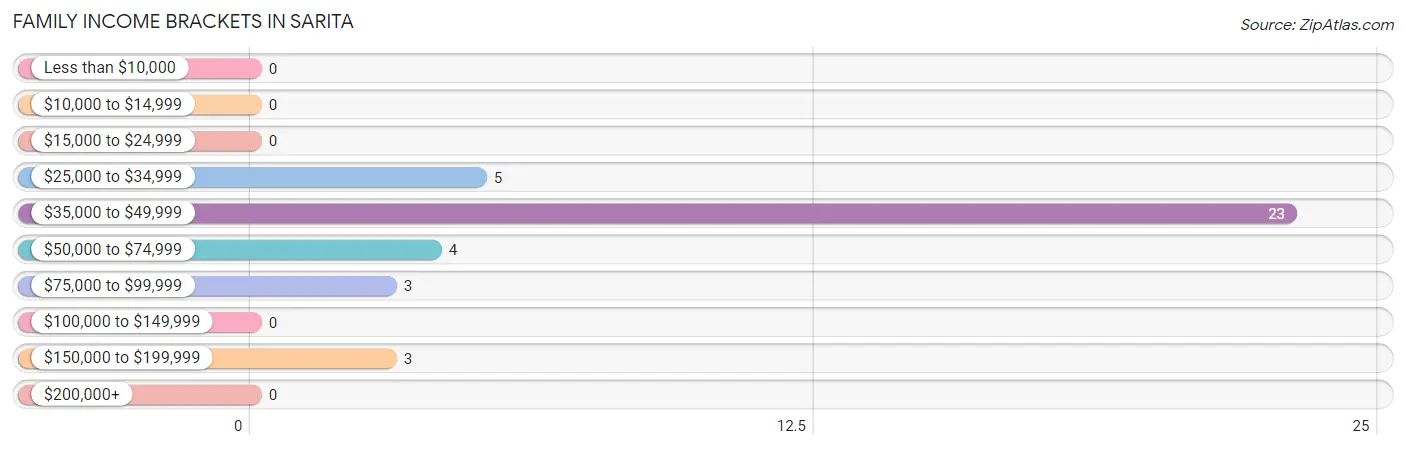
| Income Bracket | # Families | % Families |
| Less than $10,000 | 0 | 0.0% |
| $10,000 to $14,999 | 0 | 0.0% |
| $15,000 to $24,999 | 0 | 0.0% |
| $25,000 to $34,999 | 5 | 13.2% |
| $35,000 to $49,999 | 23 | 60.5% |
| $50,000 to $74,999 | 4 | 10.5% |
| $75,000 to $99,999 | 3 | 7.9% |
| $100,000 to $149,999 | 0 | 0.0% |
| $150,000 to $199,999 | 3 | 7.9% |
| $200,000+ | 0 | 0.0% |
Family Income by Famaliy Size in Sarita
2-person families (24 | 63.2%) account for the highest median family income in Sarita with $36,944 per family, while 2-person families (24 | 63.2%) have the highest median income of $18,472 per family member.
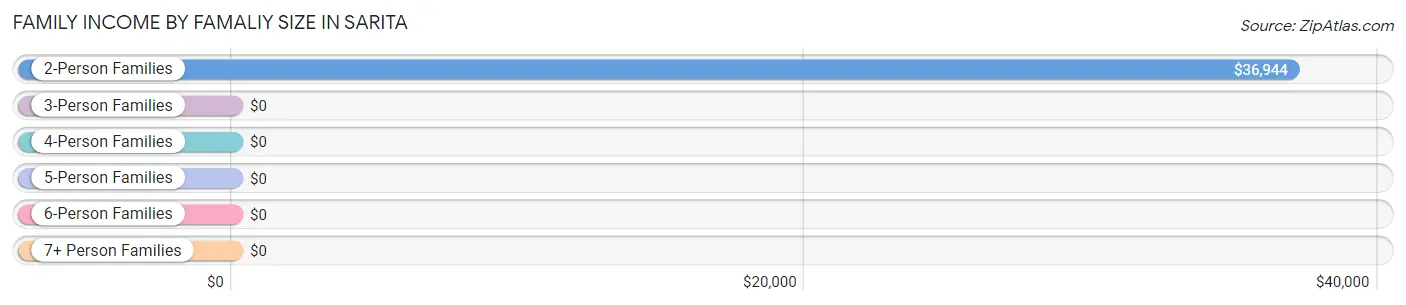
| Income Bracket | # Families | Median Income |
| 2-Person Families | 24 (63.2%) | $36,944 |
| 3-Person Families | 3 (7.9%) | $0 |
| 4-Person Families | 0 (0.0%) | $0 |
| 5-Person Families | 11 (28.9%) | $0 |
| 6-Person Families | 0 (0.0%) | $0 |
| 7+ Person Families | 0 (0.0%) | $0 |
| Total | 38 (100.0%) | $45,455 |
Family Income by Number of Earners in Sarita
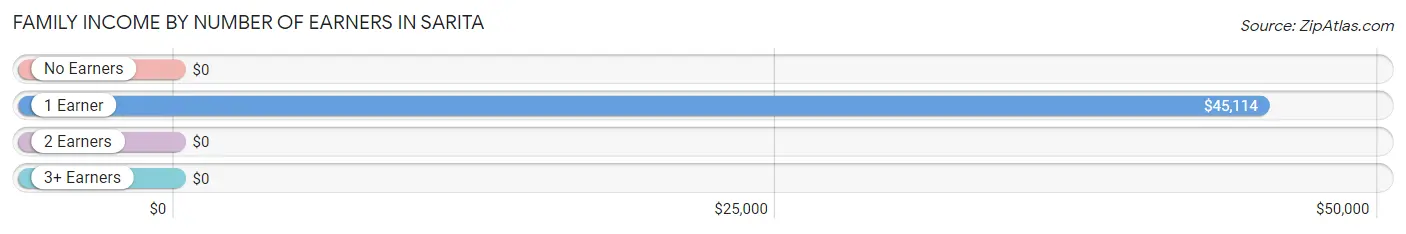
| Number of Earners | # Families | Median Income |
| No Earners | 0 (0.0%) | $0 |
| 1 Earner | 35 (92.1%) | $45,114 |
| 2 Earners | 3 (7.9%) | $0 |
| 3+ Earners | 0 (0.0%) | $0 |
| Total | 38 (100.0%) | $45,455 |
Household Income in Sarita
Household Income Brackets in Sarita
With 23 households falling in the category, the $35,000 to $49,999 income range is the most frequent in Sarita, accounting for 60.5% of all households.
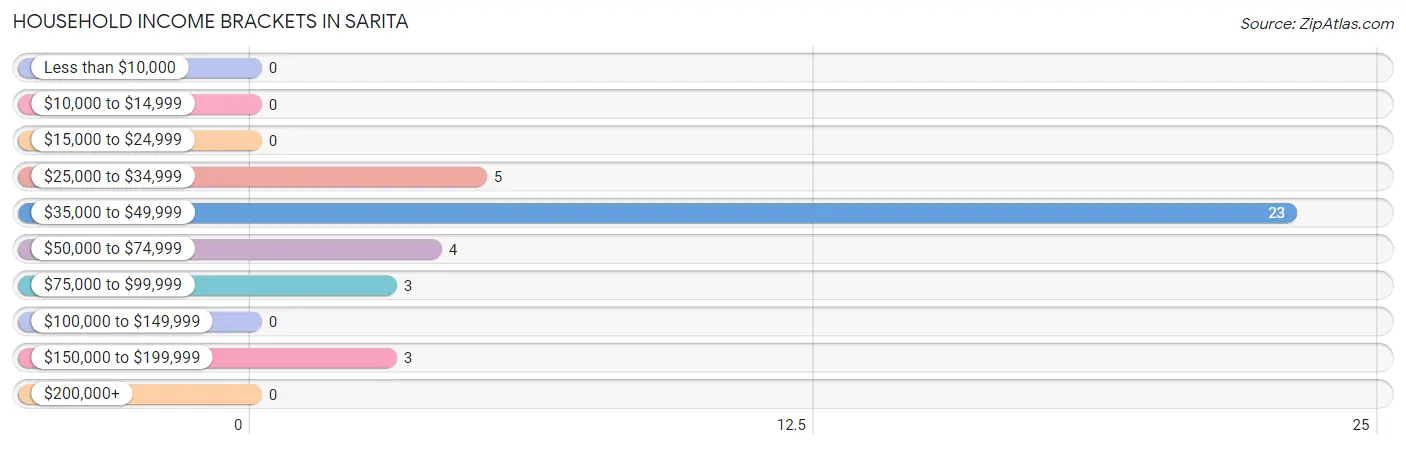
| Income Bracket | # Households | % Households |
| Less than $10,000 | 0 | 0.0% |
| $10,000 to $14,999 | 0 | 0.0% |
| $15,000 to $24,999 | 0 | 0.0% |
| $25,000 to $34,999 | 5 | 13.2% |
| $35,000 to $49,999 | 23 | 60.5% |
| $50,000 to $74,999 | 4 | 10.5% |
| $75,000 to $99,999 | 3 | 7.9% |
| $100,000 to $149,999 | 0 | 0.0% |
| $150,000 to $199,999 | 3 | 7.9% |
| $200,000+ | 0 | 0.0% |
Household Income by Householder Age in Sarita
The median household income in Sarita is $45,455, with the highest median household income of $36,944 found in the 65+ years age bracket for the primary householder. A total of 24 households (63.2%) fall into this category.
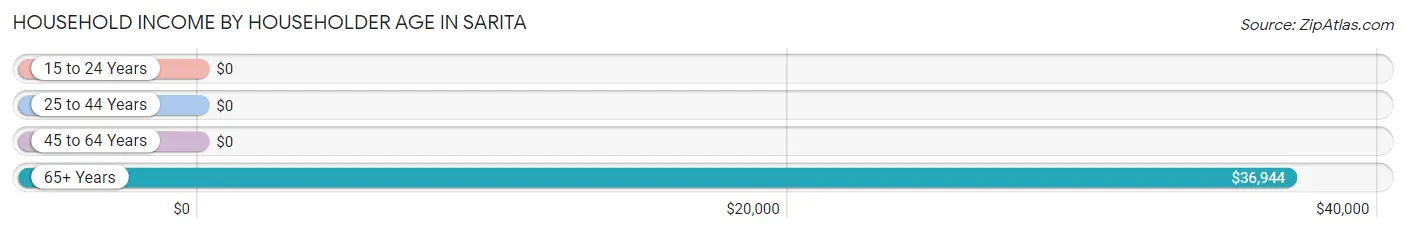
| Income Bracket | # Households | Median Income |
| 15 to 24 Years | 0 (0.0%) | $0 |
| 25 to 44 Years | 11 (28.9%) | $0 |
| 45 to 64 Years | 3 (7.9%) | $0 |
| 65+ Years | 24 (63.2%) | $36,944 |
| Total | 38 (100.0%) | $45,455 |
Poverty in Sarita
Income Below Poverty by Sex and Age in Sarita
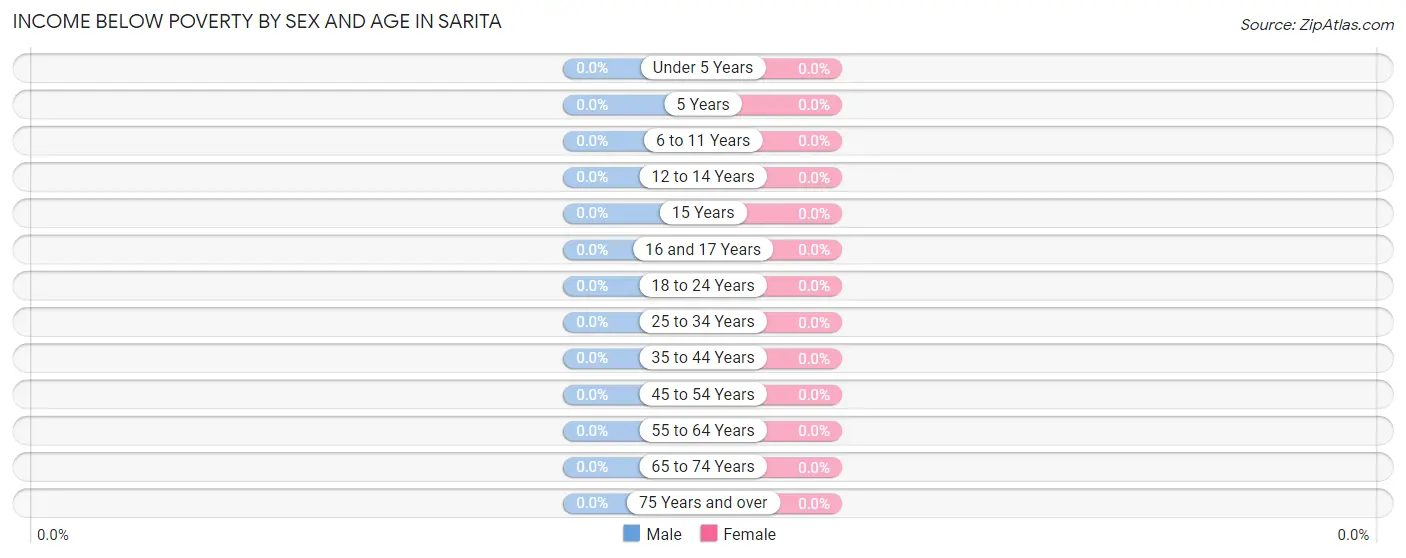
| Age Bracket | Male | Female |
| Under 5 Years | 0 (0.0%) | 0 (0.0%) |
| 5 Years | 0 (0.0%) | 0 (0.0%) |
| 6 to 11 Years | 0 (0.0%) | 0 (0.0%) |
| 12 to 14 Years | 0 (0.0%) | 0 (0.0%) |
| 15 Years | 0 (0.0%) | 0 (0.0%) |
| 16 and 17 Years | 0 (0.0%) | 0 (0.0%) |
| 18 to 24 Years | 0 (0.0%) | 0 (0.0%) |
| 25 to 34 Years | 0 (0.0%) | 0 (0.0%) |
| 35 to 44 Years | 0 (0.0%) | 0 (0.0%) |
| 45 to 54 Years | 0 (0.0%) | 0 (0.0%) |
| 55 to 64 Years | 0 (0.0%) | 0 (0.0%) |
| 65 to 74 Years | 0 (0.0%) | 0 (0.0%) |
| 75 Years and over | 0 (0.0%) | 0 (0.0%) |
| Total | 0 (0.0%) | 0 (0.0%) |
Income Above Poverty by Sex and Age in Sarita
According to the poverty statistics in Sarita, males aged under 5 years and females aged under 5 years are the age groups that are most secure financially, with 100.0% of males and 100.0% of females in these age groups living above the poverty line.
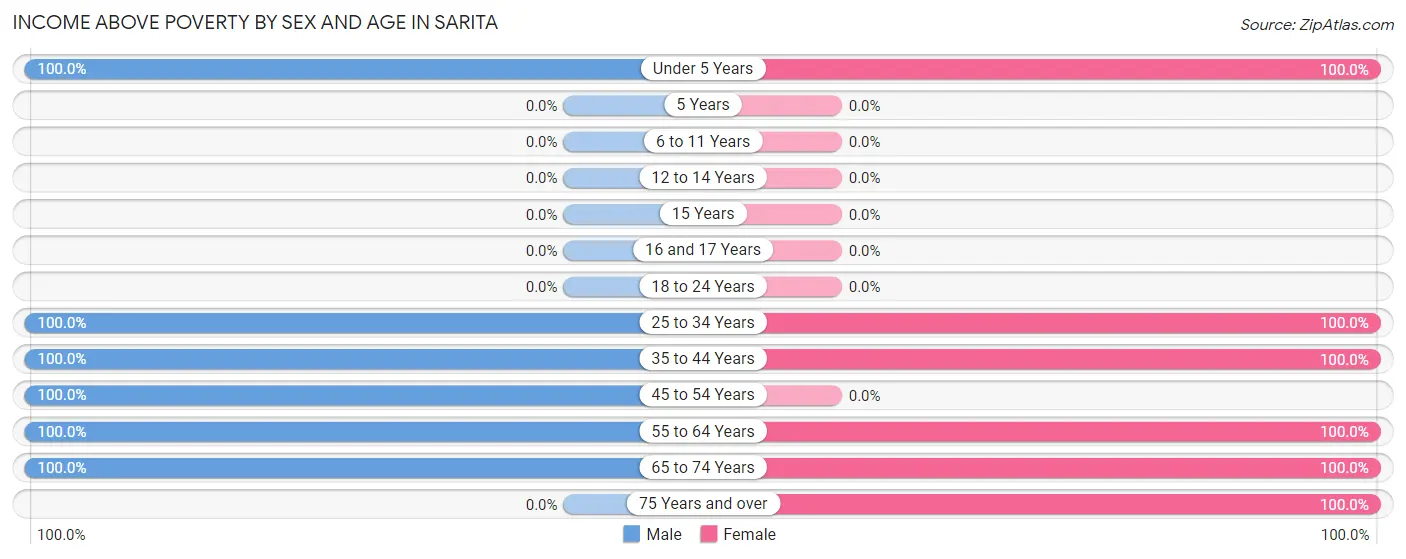
| Age Bracket | Male | Female |
| Under 5 Years | 23 (100.0%) | 5 (100.0%) |
| 5 Years | 0 (0.0%) | 0 (0.0%) |
| 6 to 11 Years | 0 (0.0%) | 0 (0.0%) |
| 12 to 14 Years | 0 (0.0%) | 0 (0.0%) |
| 15 Years | 0 (0.0%) | 0 (0.0%) |
| 16 and 17 Years | 0 (0.0%) | 0 (0.0%) |
| 18 to 24 Years | 0 (0.0%) | 0 (0.0%) |
| 25 to 34 Years | 11 (100.0%) | 10 (100.0%) |
| 35 to 44 Years | 9 (100.0%) | 3 (100.0%) |
| 45 to 54 Years | 4 (100.0%) | 0 (0.0%) |
| 55 to 64 Years | 3 (100.0%) | 4 (100.0%) |
| 65 to 74 Years | 15 (100.0%) | 19 (100.0%) |
| 75 Years and over | 0 (0.0%) | 5 (100.0%) |
| Total | 65 (100.0%) | 46 (100.0%) |
Income Below Poverty Among Married-Couple Families in Sarita
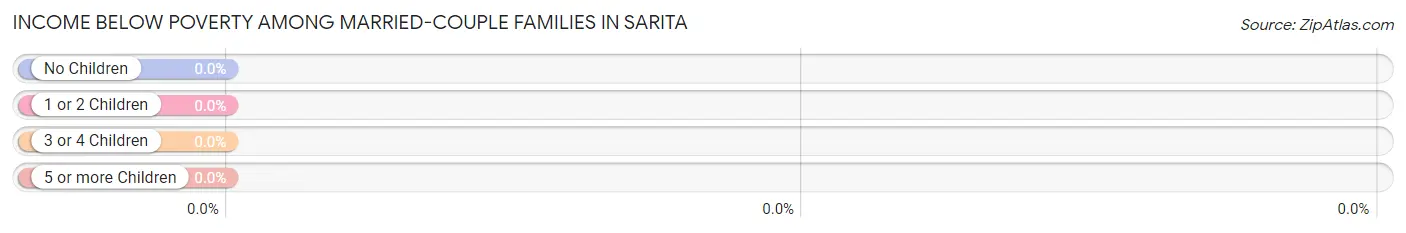
| Children | Above Poverty | Below Poverty |
| No Children | 12 (100.0%) | 0 (0.0%) |
| 1 or 2 Children | 0 (0.0%) | 0 (0.0%) |
| 3 or 4 Children | 11 (100.0%) | 0 (0.0%) |
| 5 or more Children | 0 (0.0%) | 0 (0.0%) |
| Total | 23 (100.0%) | 0 (0.0%) |
Income Below Poverty Among Single-Parent Households in Sarita

| Children | Single Father | Single Mother |
| No Children | 0 (0.0%) | 0 (0.0%) |
| 1 or 2 Children | 0 (0.0%) | 0 (0.0%) |
| 3 or 4 Children | 0 (0.0%) | 0 (0.0%) |
| 5 or more Children | 0 (0.0%) | 0 (0.0%) |
| Total | 0 (0.0%) | 0 (0.0%) |
Income Below Poverty Among Married-Couple vs Single-Parent Households in Sarita
| Children | Married-Couple Families | Single-Parent Households |
| No Children | 0 (0.0%) | 0 (0.0%) |
| 1 or 2 Children | 0 (0.0%) | 0 (0.0%) |
| 3 or 4 Children | 0 (0.0%) | 0 (0.0%) |
| 5 or more Children | 0 (0.0%) | 0 (0.0%) |
| Total | 0 (0.0%) | 0 (0.0%) |
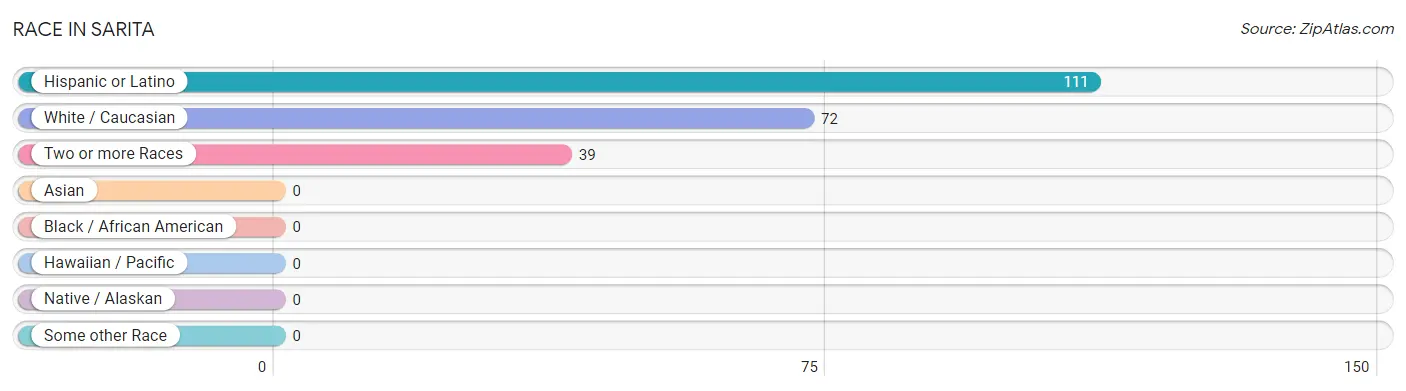
Race in Sarita
The most populous races in Sarita are Hispanic or Latino (111 | 100.0%), White / Caucasian (72 | 64.9%), and Two or more Races (39 | 35.1%).
| Race | # Population | % Population |
| Asian | 0 | 0.0% |
| Black / African American | 0 | 0.0% |
| Hawaiian / Pacific | 0 | 0.0% |
| Hispanic or Latino | 111 | 100.0% |
| Native / Alaskan | 0 | 0.0% |
| White / Caucasian | 72 | 64.9% |
| Two or more Races | 39 | 35.1% |
| Some other Race | 0 | 0.0% |
| Total | 111 | 100.0% |
Ancestry in Sarita
The most populous ancestries reported in Sarita are , and Mexican (111 | 100.0%), together accounting for 100.0% of all Sarita residents.

| Ancestry | # Population | % Population |
| Mexican | 111 | 100.0% | View All 1 Rows |
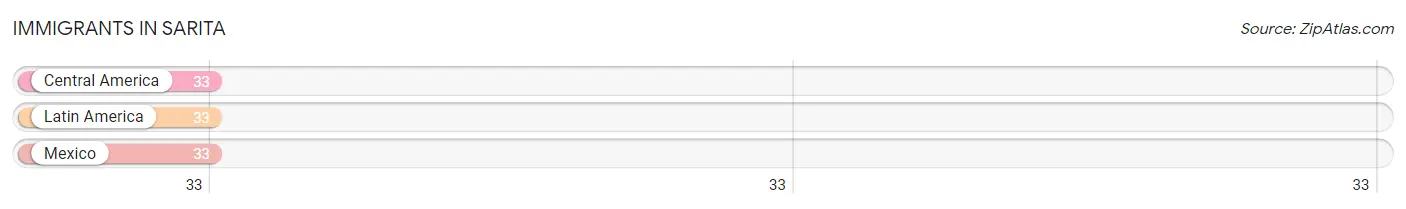
Immigrants in Sarita
The most numerous immigrant groups reported in Sarita came from Central America (33 | 29.7%), Latin America (33 | 29.7%), and Mexico (33 | 29.7%), together accounting for 89.2% of all Sarita residents.
| Immigration Origin | # Population | % Population |
| Central America | 33 | 29.7% |
| Latin America | 33 | 29.7% |
| Mexico | 33 | 29.7% | View All 3 Rows |
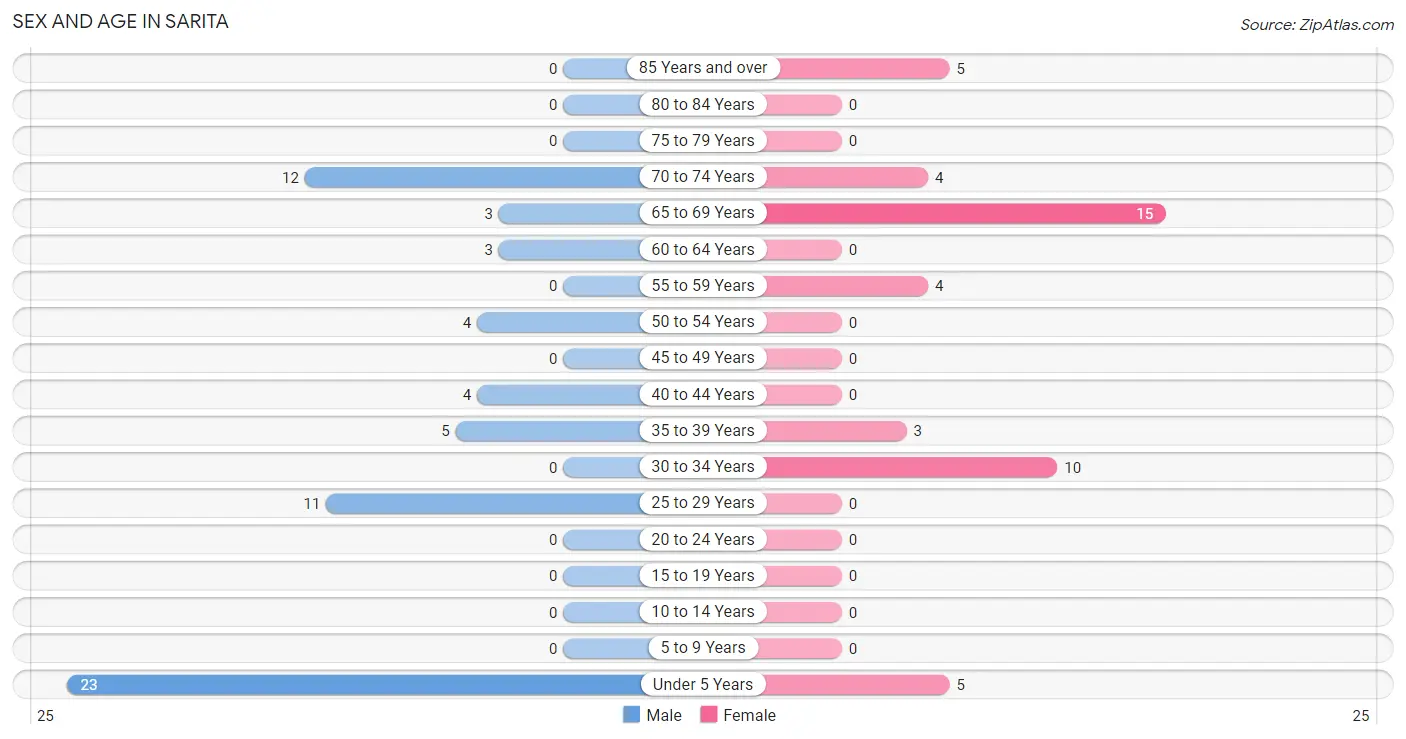
Sex and Age in Sarita
Sex and Age in Sarita
The most populous age groups in Sarita are Under 5 Years (23 | 35.4%) for men and 65 to 69 Years (15 | 32.6%) for women.
| Age Bracket | Male | Female |
| Under 5 Years | 23 (35.4%) | 5 (10.9%) |
| 5 to 9 Years | 0 (0.0%) | 0 (0.0%) |
| 10 to 14 Years | 0 (0.0%) | 0 (0.0%) |
| 15 to 19 Years | 0 (0.0%) | 0 (0.0%) |
| 20 to 24 Years | 0 (0.0%) | 0 (0.0%) |
| 25 to 29 Years | 11 (16.9%) | 0 (0.0%) |
| 30 to 34 Years | 0 (0.0%) | 10 (21.7%) |
| 35 to 39 Years | 5 (7.7%) | 3 (6.5%) |
| 40 to 44 Years | 4 (6.1%) | 0 (0.0%) |
| 45 to 49 Years | 0 (0.0%) | 0 (0.0%) |
| 50 to 54 Years | 4 (6.1%) | 0 (0.0%) |
| 55 to 59 Years | 0 (0.0%) | 4 (8.7%) |
| 60 to 64 Years | 3 (4.6%) | 0 (0.0%) |
| 65 to 69 Years | 3 (4.6%) | 15 (32.6%) |
| 70 to 74 Years | 12 (18.5%) | 4 (8.7%) |
| 75 to 79 Years | 0 (0.0%) | 0 (0.0%) |
| 80 to 84 Years | 0 (0.0%) | 0 (0.0%) |
| 85 Years and over | 0 (0.0%) | 5 (10.9%) |
| Total | 65 (100.0%) | 46 (100.0%) |
Families and Households in Sarita
Median Family Size in Sarita
The median family size in Sarita is 2.92 persons per family, with married-couple families (23 | 60.5%) accounting for the largest median family size of 3.35 persons per family. On the other hand, single female/mother families (12 | 31.6%) represent the smallest median family size with 2.25 persons per family.
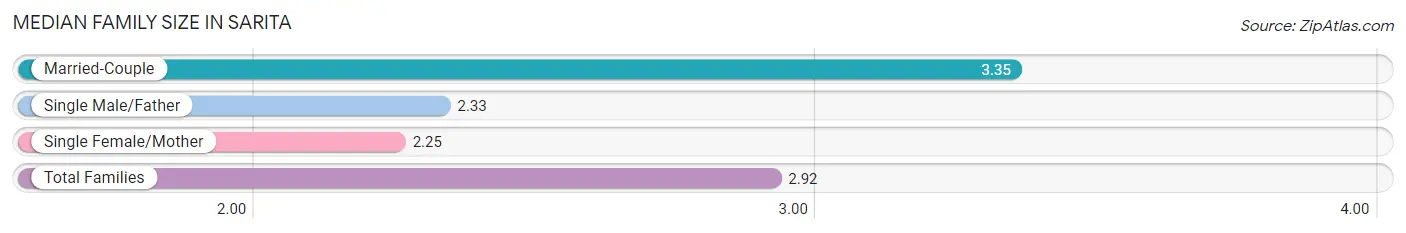
| Family Type | # Families | Family Size |
| Married-Couple | 23 (60.5%) | 3.35 |
| Single Male/Father | 3 (7.9%) | 2.33 |
| Single Female/Mother | 12 (31.6%) | 2.25 |
| Total Families | 38 (100.0%) | 2.92 |
Median Household Size in Sarita
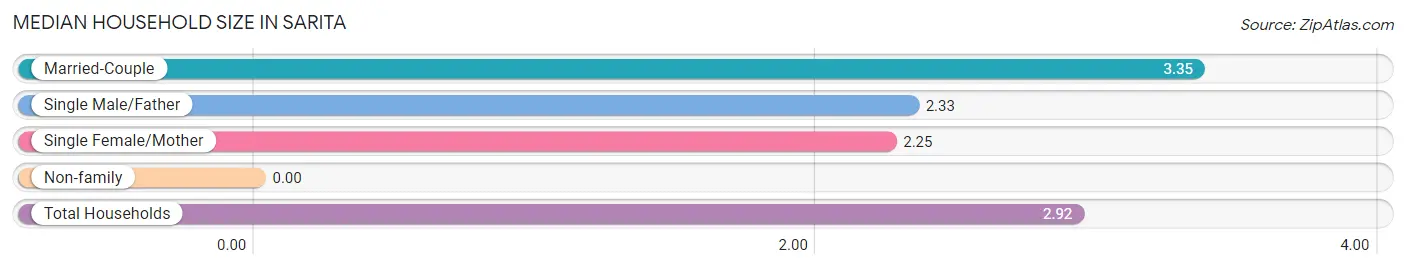
| Household Type | # Households | Household Size |
| Married-Couple | 23 (60.5%) | 3.35 |
| Single Male/Father | 3 (7.9%) | 2.33 |
| Single Female/Mother | 12 (31.6%) | 2.25 |
| Non-family | 0 (0.0%) | - |
| Total Households | 38 (100.0%) | 2.92 |
Household Size by Marriage Status in Sarita
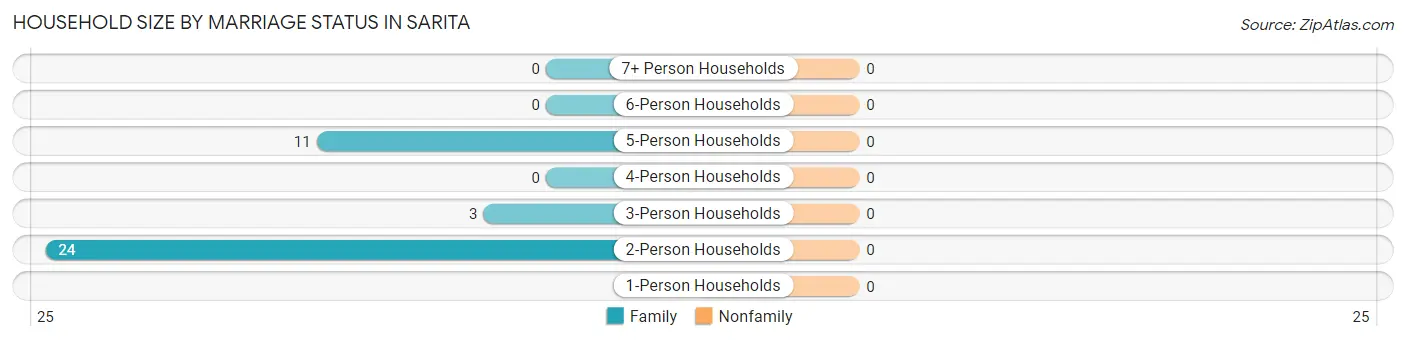
| Household Size | Family Households | Nonfamily Households |
| 1-Person Households | - | 0 (0.0%) |
| 2-Person Households | 24 (63.2%) | 0 (0.0%) |
| 3-Person Households | 3 (7.9%) | 0 (0.0%) |
| 4-Person Households | 0 (0.0%) | 0 (0.0%) |
| 5-Person Households | 11 (28.9%) | 0 (0.0%) |
| 6-Person Households | 0 (0.0%) | 0 (0.0%) |
| 7+ Person Households | 0 (0.0%) | 0 (0.0%) |
| Total | 38 (100.0%) | 0 (0.0%) |
Female Fertility in Sarita
Fertility by Age in Sarita
Average fertility rate in Sarita is 769.0 births per 1,000 women. Women in the age bracket of 20 to 34 years have the highest fertility rate with 1,000.0 births per 1,000 women. Women in the age bracket of 20 to 34 years acount for 100.0% of all women with births.
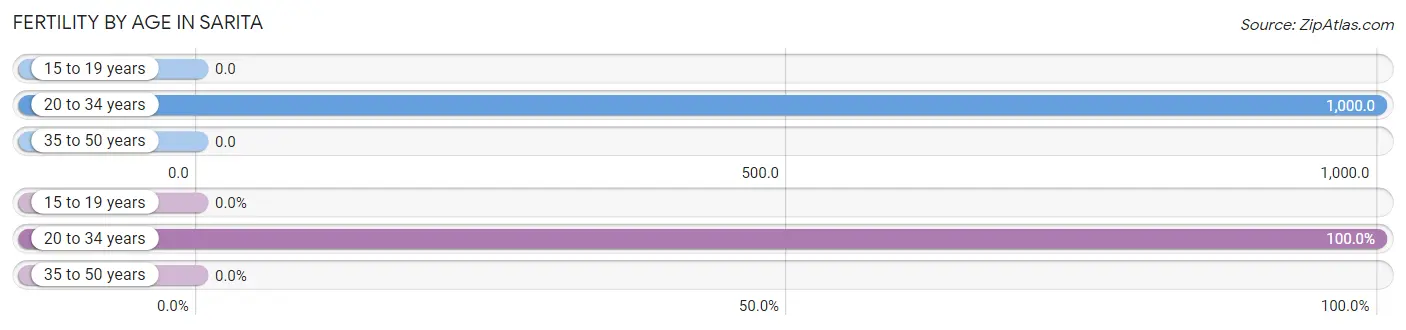
| Age Bracket | Women with Births | Births / 1,000 Women |
| 15 to 19 years | 0 (0.0%) | 0.0 |
| 20 to 34 years | 10 (100.0%) | 1,000.0 |
| 35 to 50 years | 0 (0.0%) | 0.0 |
| Total | 10 (100.0%) | 769.0 |
Fertility by Age by Marriage Status in Sarita
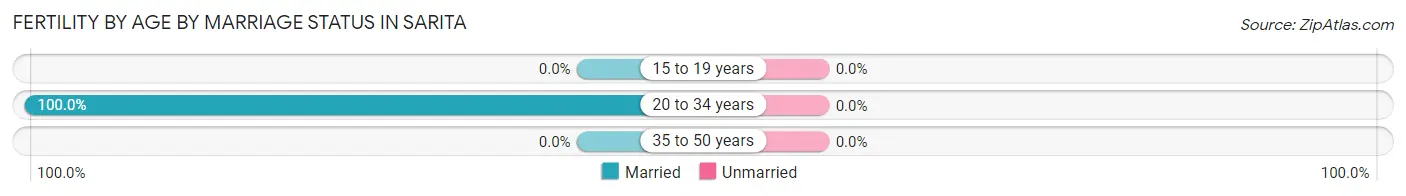
| Age Bracket | Married | Unmarried |
| 15 to 19 years | 0 (0.0%) | 0 (0.0%) |
| 20 to 34 years | 10 (100.0%) | 0 (0.0%) |
| 35 to 50 years | 0 (0.0%) | 0 (0.0%) |
| Total | 10 (100.0%) | 0 (0.0%) |
Fertility by Education in Sarita
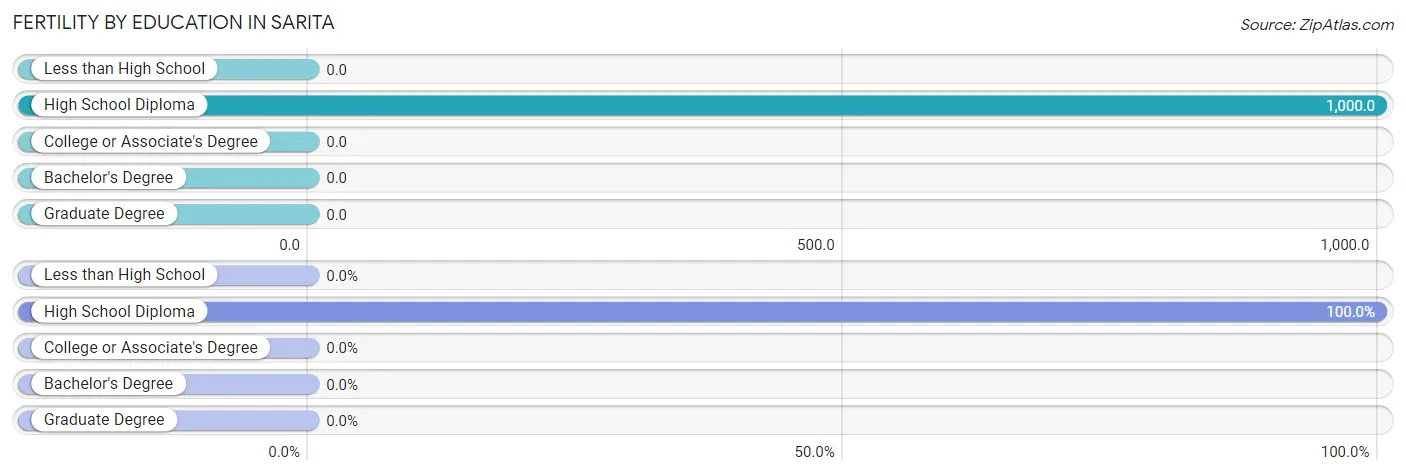
| Educational Attainment | Women with Births | Births / 1,000 Women |
| Less than High School | 0 (0.0%) | 0.0 |
| High School Diploma | 10 (100.0%) | 1,000.0 |
| College or Associate's Degree | 0 (0.0%) | 0.0 |
| Bachelor's Degree | 0 (0.0%) | 0.0 |
| Graduate Degree | 0 (0.0%) | 0.0 |
| Total | 10 (100.0%) | 769.0 |
Fertility by Education by Marriage Status in Sarita
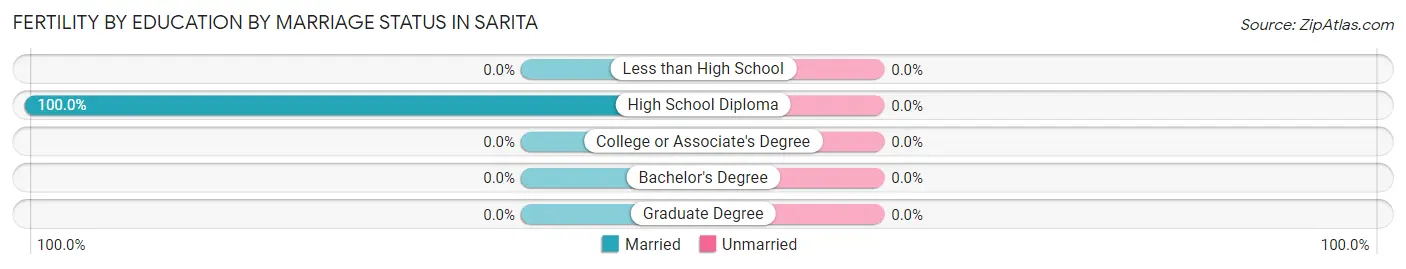
| Educational Attainment | Married | Unmarried |
| Less than High School | 0 (0.0%) | 0 (0.0%) |
| High School Diploma | 10 (100.0%) | 0 (0.0%) |
| College or Associate's Degree | 0 (0.0%) | 0 (0.0%) |
| Bachelor's Degree | 0 (0.0%) | 0 (0.0%) |
| Graduate Degree | 0 (0.0%) | 0 (0.0%) |
| Total | 10 (100.0%) | 0 (0.0%) |
Employment Characteristics in Sarita
Employment by Class of Employer in Sarita
Among the 43 employed individuals in Sarita, private company employees (27 | 62.8%), not-for-profit organizations (9 | 20.9%), and local government employees (7 | 16.3%) make up the most common classes of employment.
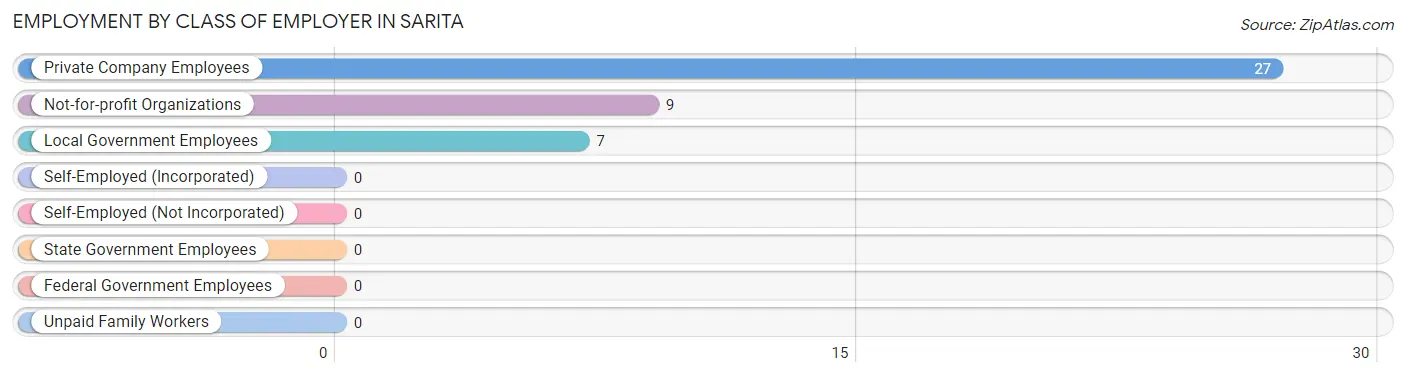
| Employer Class | # Employees | % Employees |
| Private Company Employees | 27 | 62.8% |
| Self-Employed (Incorporated) | 0 | 0.0% |
| Self-Employed (Not Incorporated) | 0 | 0.0% |
| Not-for-profit Organizations | 9 | 20.9% |
| Local Government Employees | 7 | 16.3% |
| State Government Employees | 0 | 0.0% |
| Federal Government Employees | 0 | 0.0% |
| Unpaid Family Workers | 0 | 0.0% |
| Total | 43 | 100.0% |
Employment Status by Age in Sarita
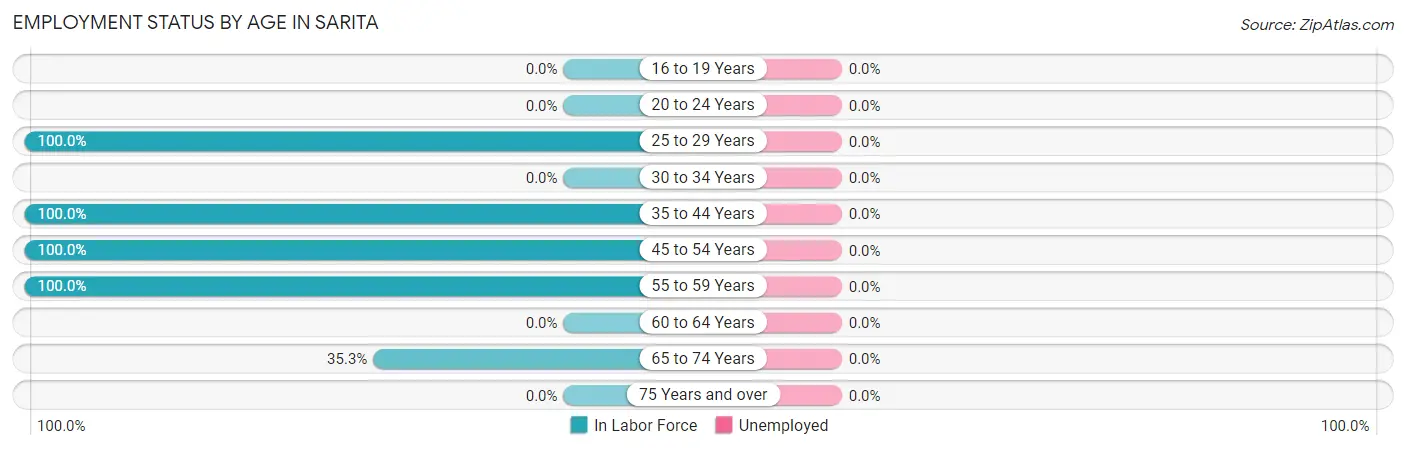
| Age Bracket | In Labor Force | Unemployed |
| 16 to 19 Years | 0 (0.0%) | 0 (0.0%) |
| 20 to 24 Years | 0 (0.0%) | 0 (0.0%) |
| 25 to 29 Years | 11 (100.0%) | 0 (0.0%) |
| 30 to 34 Years | 0 (0.0%) | 0 (0.0%) |
| 35 to 44 Years | 12 (100.0%) | 0 (0.0%) |
| 45 to 54 Years | 4 (100.0%) | 0 (0.0%) |
| 55 to 59 Years | 4 (100.0%) | 0 (0.0%) |
| 60 to 64 Years | 0 (0.0%) | 0 (0.0%) |
| 65 to 74 Years | 12 (35.3%) | 0 (0.0%) |
| 75 Years and over | 0 (0.0%) | 0 (0.0%) |
| Total | 43 (51.8%) | 0 (0.0%) |
Employment Status by Educational Attainment in Sarita
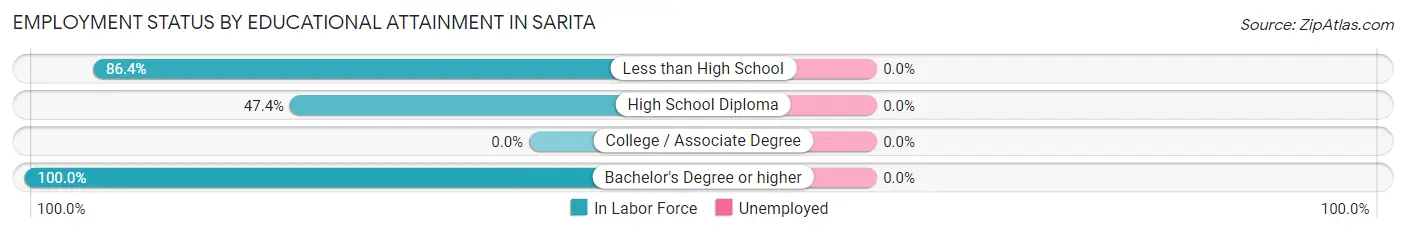
| Educational Attainment | In Labor Force | Unemployed |
| Less than High School | 19 (86.4%) | 0 (0.0%) |
| High School Diploma | 9 (47.4%) | 0 (0.0%) |
| College / Associate Degree | 0 (0.0%) | 0 (0.0%) |
| Bachelor's Degree or higher | 3 (100.0%) | 0 (0.0%) |
| Total | 31 (70.5%) | 0 (0.0%) |
Employment Occupations by Sex in Sarita
Management, Business, Science and Arts Occupations
The most common Management, Business, Science and Arts occupations in Sarita are , and Management (9 | 20.9%).
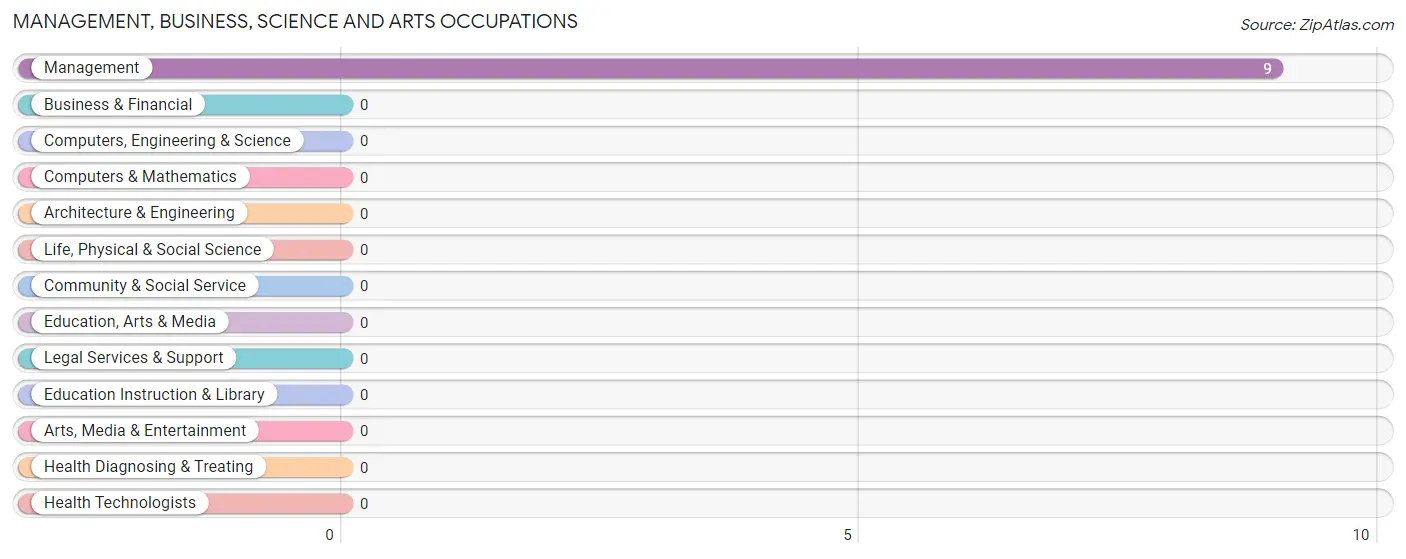
Management, Business, Science and Arts Occupations by Sex
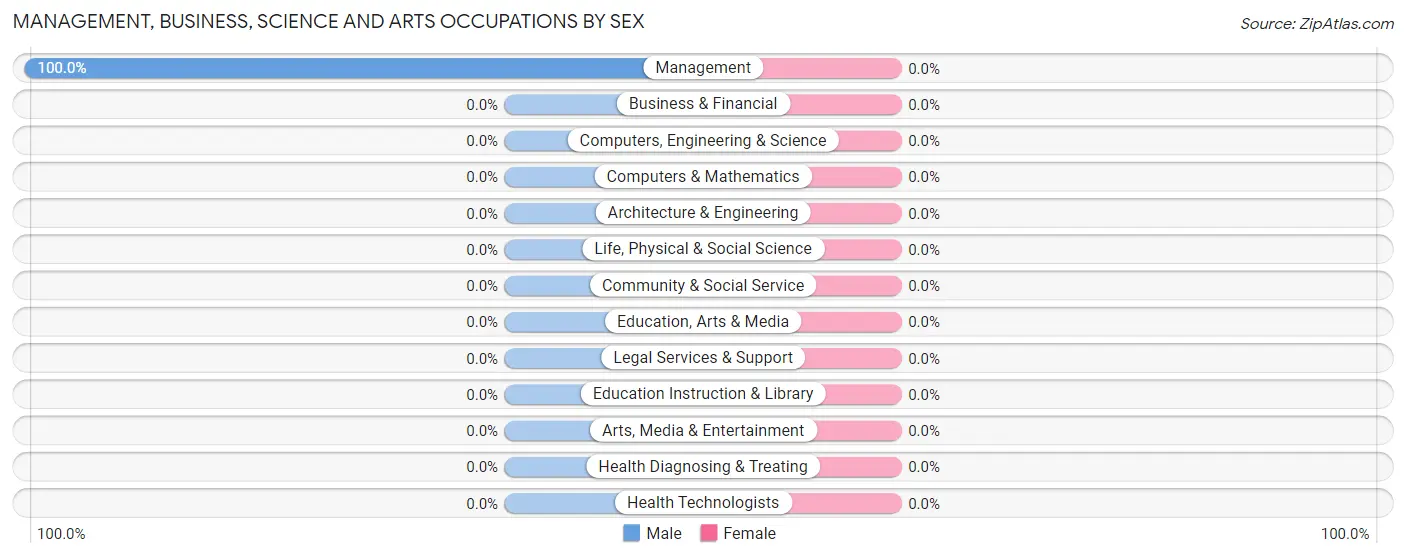
| Occupation | Male | Female |
| Management | 9 (100.0%) | 0 (0.0%) |
| Business & Financial | 0 (0.0%) | 0 (0.0%) |
| Computers, Engineering & Science | 0 (0.0%) | 0 (0.0%) |
| Computers & Mathematics | 0 (0.0%) | 0 (0.0%) |
| Architecture & Engineering | 0 (0.0%) | 0 (0.0%) |
| Life, Physical & Social Science | 0 (0.0%) | 0 (0.0%) |
| Community & Social Service | 0 (0.0%) | 0 (0.0%) |
| Education, Arts & Media | 0 (0.0%) | 0 (0.0%) |
| Legal Services & Support | 0 (0.0%) | 0 (0.0%) |
| Education Instruction & Library | 0 (0.0%) | 0 (0.0%) |
| Arts, Media & Entertainment | 0 (0.0%) | 0 (0.0%) |
| Health Diagnosing & Treating | 0 (0.0%) | 0 (0.0%) |
| Health Technologists | 0 (0.0%) | 0 (0.0%) |
| Total (Category) | 9 (100.0%) | 0 (0.0%) |
| Total (Overall) | 36 (83.7%) | 7 (16.3%) |
Services Occupations
The most common Services occupations in Sarita are , and Cleaning & Maintenance (4 | 9.3%).
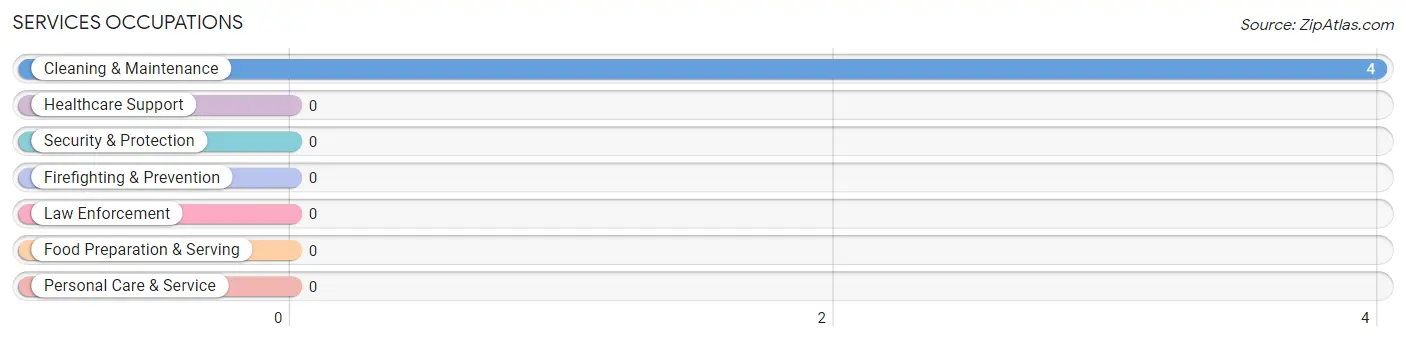
Services Occupations by Sex
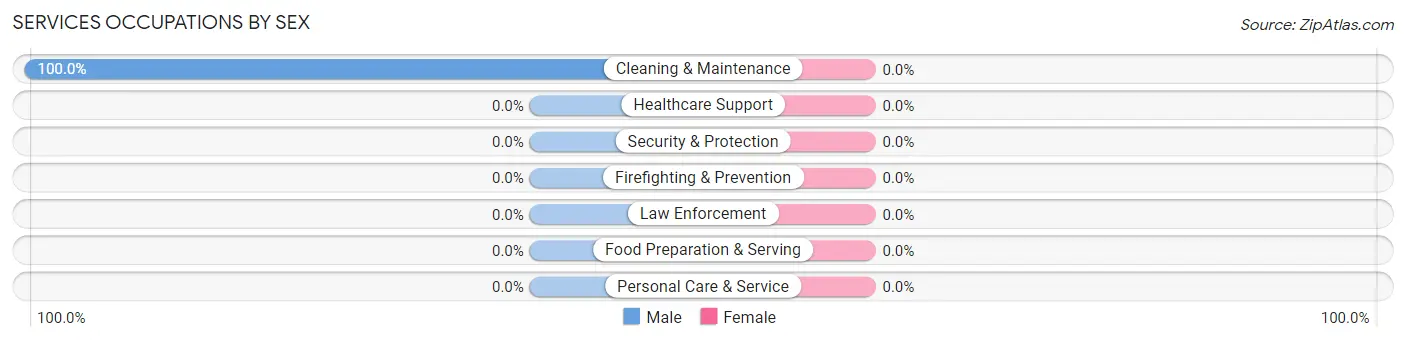
| Occupation | Male | Female |
| Healthcare Support | 0 (0.0%) | 0 (0.0%) |
| Security & Protection | 0 (0.0%) | 0 (0.0%) |
| Firefighting & Prevention | 0 (0.0%) | 0 (0.0%) |
| Law Enforcement | 0 (0.0%) | 0 (0.0%) |
| Food Preparation & Serving | 0 (0.0%) | 0 (0.0%) |
| Cleaning & Maintenance | 4 (100.0%) | 0 (0.0%) |
| Personal Care & Service | 0 (0.0%) | 0 (0.0%) |
| Total (Category) | 4 (100.0%) | 0 (0.0%) |
| Total (Overall) | 36 (83.7%) | 7 (16.3%) |
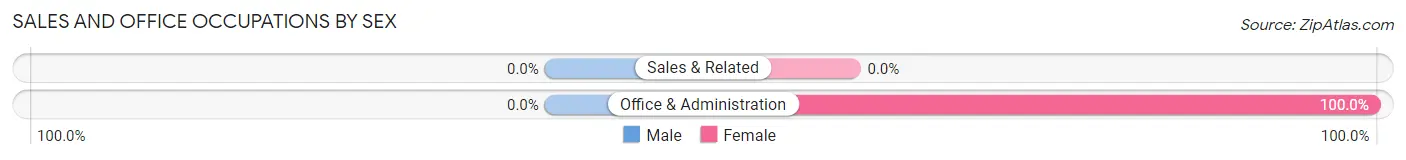
Sales and Office Occupations
The most common Sales and Office occupations in Sarita are , and Office & Administration (3 | 7.0%).
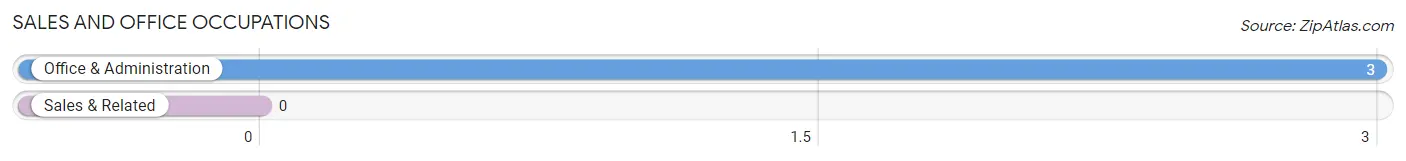
Sales and Office Occupations by Sex
| Occupation | Male | Female |
| Sales & Related | 0 (0.0%) | 0 (0.0%) |
| Office & Administration | 0 (0.0%) | 3 (100.0%) |
| Total (Category) | 0 (0.0%) | 3 (100.0%) |
| Total (Overall) | 36 (83.7%) | 7 (16.3%) |
Natural Resources, Construction and Maintenance Occupations
The most common Natural Resources, Construction and Maintenance occupations in Sarita are , and Farming, Fishing & Forestry (14 | 32.6%).
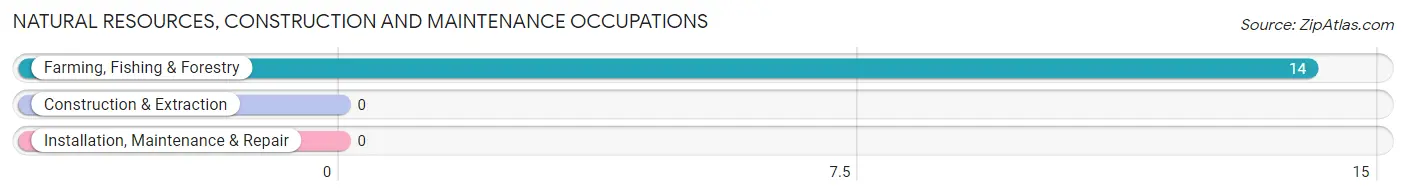
Natural Resources, Construction and Maintenance Occupations by Sex
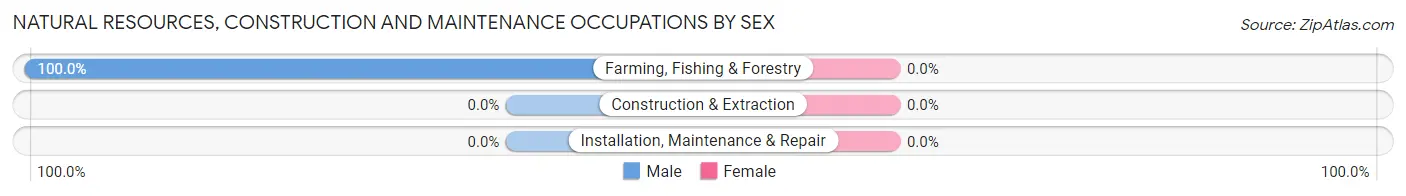
| Occupation | Male | Female |
| Farming, Fishing & Forestry | 14 (100.0%) | 0 (0.0%) |
| Construction & Extraction | 0 (0.0%) | 0 (0.0%) |
| Installation, Maintenance & Repair | 0 (0.0%) | 0 (0.0%) |
| Total (Category) | 14 (100.0%) | 0 (0.0%) |
| Total (Overall) | 36 (83.7%) | 7 (16.3%) |
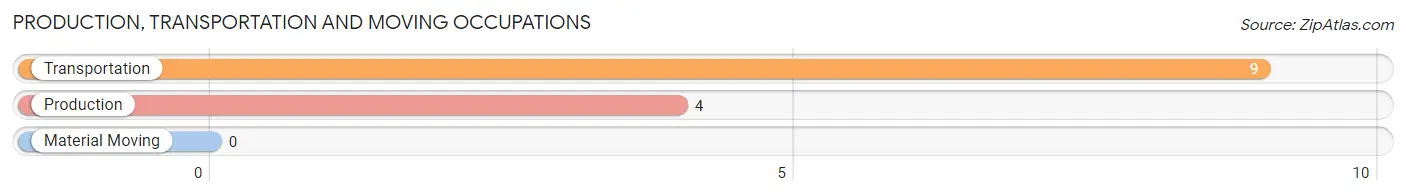
Production, Transportation and Moving Occupations
The most common Production, Transportation and Moving occupations in Sarita are Transportation (9 | 20.9%), and Production (4 | 9.3%).
Production, Transportation and Moving Occupations by Sex
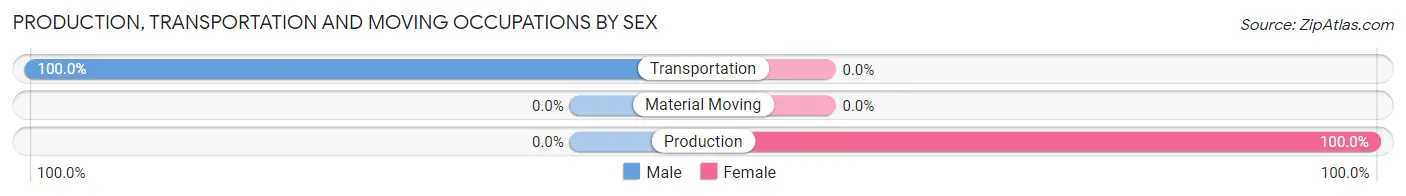
| Occupation | Male | Female |
| Production | 0 (0.0%) | 4 (100.0%) |
| Transportation | 9 (100.0%) | 0 (0.0%) |
| Material Moving | 0 (0.0%) | 0 (0.0%) |
| Total (Category) | 9 (69.2%) | 4 (30.8%) |
| Total (Overall) | 36 (83.7%) | 7 (16.3%) |
Employment Industries by Sex in Sarita
Employment Industries in Sarita
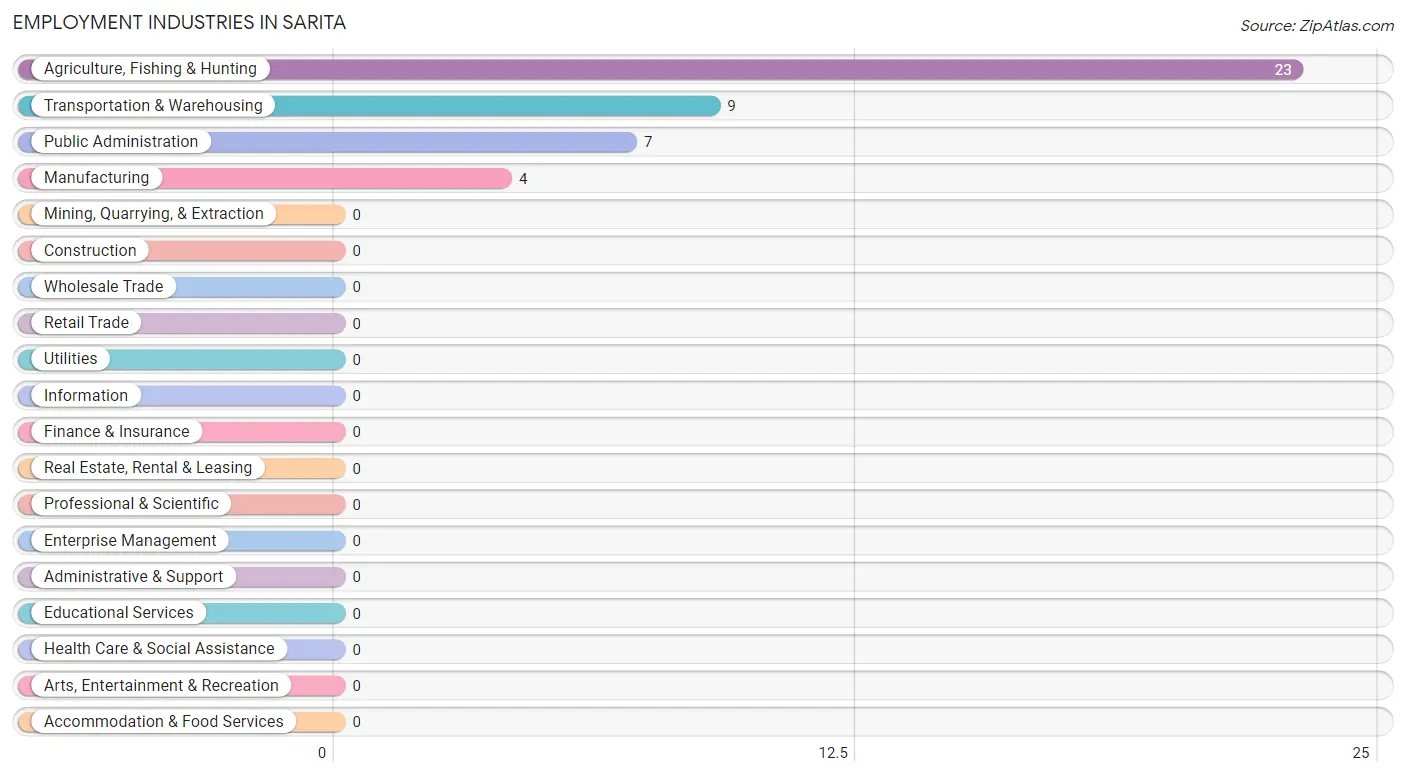
The major employment industries in Sarita include Agriculture, Fishing & Hunting (23 | 53.5%), Transportation & Warehousing (9 | 20.9%), Public Administration (7 | 16.3%), and Manufacturing (4 | 9.3%).
Employment Industries by Sex in Sarita
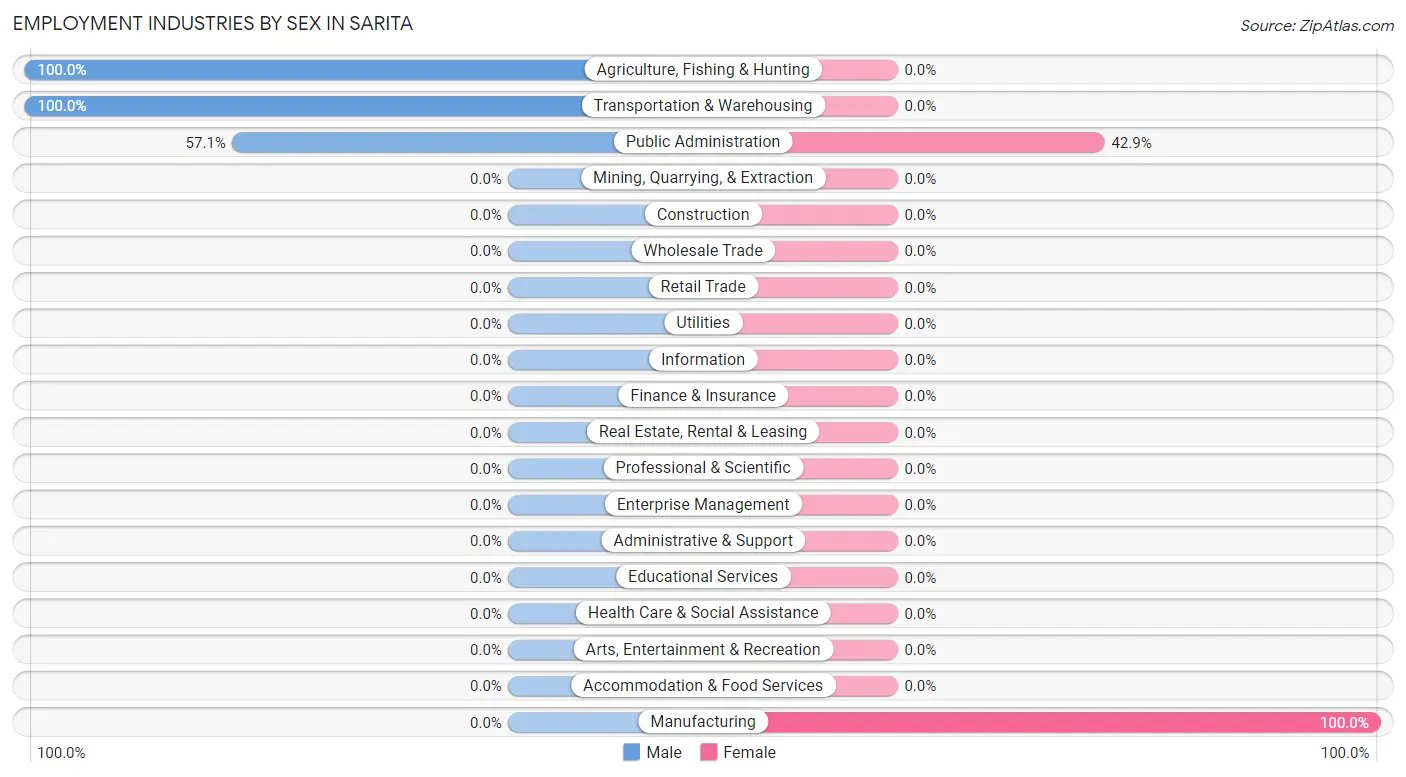
The Sarita industries that see more men than women are Agriculture, Fishing & Hunting (100.0%), Transportation & Warehousing (100.0%), and Public Administration (57.1%), whereas the industries that tend to have a higher number of women are Manufacturing (100.0%), and Public Administration (42.9%).
| Industry | Male | Female |
| Agriculture, Fishing & Hunting | 23 (100.0%) | 0 (0.0%) |
| Mining, Quarrying, & Extraction | 0 (0.0%) | 0 (0.0%) |
| Construction | 0 (0.0%) | 0 (0.0%) |
| Manufacturing | 0 (0.0%) | 4 (100.0%) |
| Wholesale Trade | 0 (0.0%) | 0 (0.0%) |
| Retail Trade | 0 (0.0%) | 0 (0.0%) |
| Transportation & Warehousing | 9 (100.0%) | 0 (0.0%) |
| Utilities | 0 (0.0%) | 0 (0.0%) |
| Information | 0 (0.0%) | 0 (0.0%) |
| Finance & Insurance | 0 (0.0%) | 0 (0.0%) |
| Real Estate, Rental & Leasing | 0 (0.0%) | 0 (0.0%) |
| Professional & Scientific | 0 (0.0%) | 0 (0.0%) |
| Enterprise Management | 0 (0.0%) | 0 (0.0%) |
| Administrative & Support | 0 (0.0%) | 0 (0.0%) |
| Educational Services | 0 (0.0%) | 0 (0.0%) |
| Health Care & Social Assistance | 0 (0.0%) | 0 (0.0%) |
| Arts, Entertainment & Recreation | 0 (0.0%) | 0 (0.0%) |
| Accommodation & Food Services | 0 (0.0%) | 0 (0.0%) |
| Public Administration | 4 (57.1%) | 3 (42.9%) |
| Total | 36 (83.7%) | 7 (16.3%) |
Education in Sarita
School Enrollment in Sarita
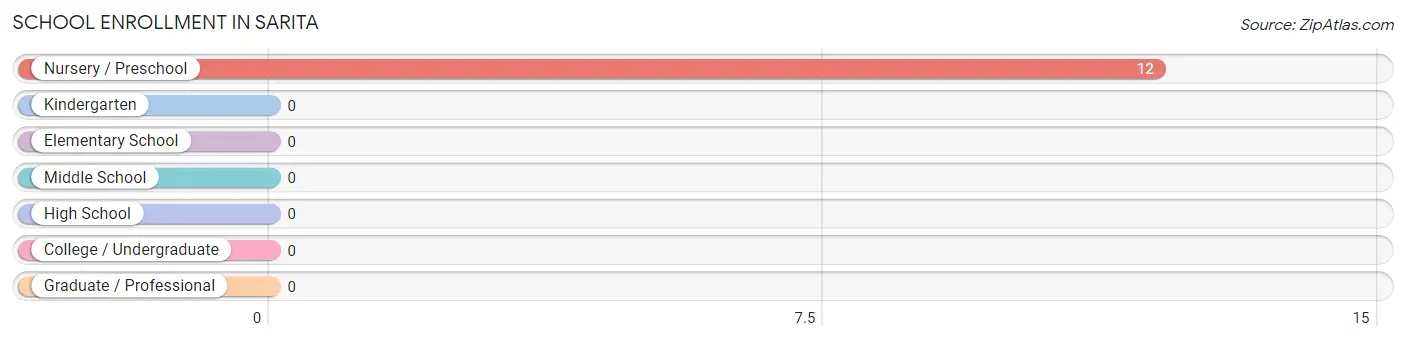
| School Level | # Students | % Students |
| Nursery / Preschool | 12 | 100.0% |
| Kindergarten | 0 | 0.0% |
| Elementary School | 0 | 0.0% |
| Middle School | 0 | 0.0% |
| High School | 0 | 0.0% |
| College / Undergraduate | 0 | 0.0% |
| Graduate / Professional | 0 | 0.0% |
| Total | 12 | 100.0% |
School Enrollment by Age by Funding Source in Sarita
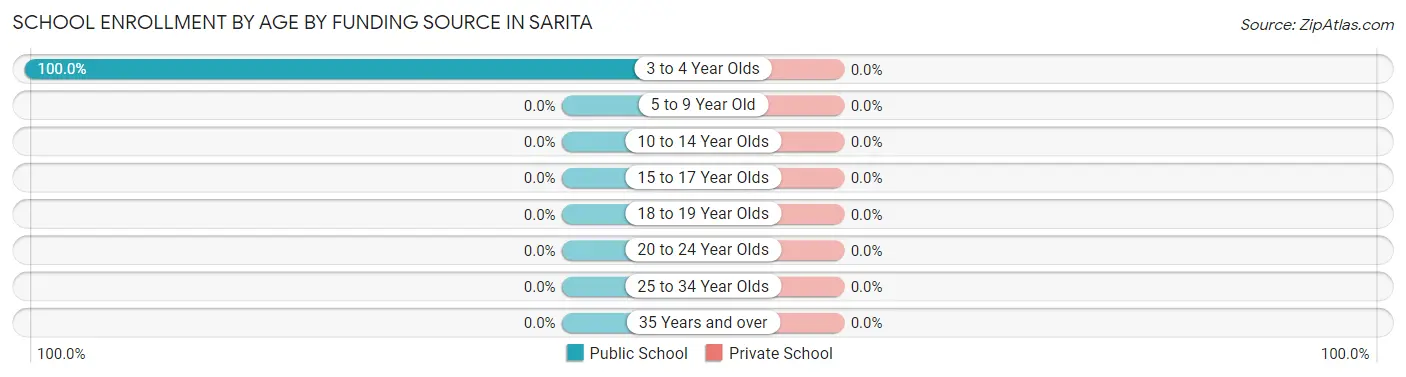
| Age Bracket | Public School | Private School |
| 3 to 4 Year Olds | 12 (100.0%) | 0 (0.0%) |
| 5 to 9 Year Old | 0 (0.0%) | 0 (0.0%) |
| 10 to 14 Year Olds | 0 (0.0%) | 0 (0.0%) |
| 15 to 17 Year Olds | 0 (0.0%) | 0 (0.0%) |
| 18 to 19 Year Olds | 0 (0.0%) | 0 (0.0%) |
| 20 to 24 Year Olds | 0 (0.0%) | 0 (0.0%) |
| 25 to 34 Year Olds | 0 (0.0%) | 0 (0.0%) |
| 35 Years and over | 0 (0.0%) | 0 (0.0%) |
| Total | 12 (100.0%) | 0 (0.0%) |
Educational Attainment by Field of Study in Sarita
, and business (3 | 100.0%) are the most common fields of study among 3 individuals in Sarita who have obtained a bachelor's degree or higher.

| Field of Study | # Graduates | % Graduates |
| Computers & Mathematics | 0 | 0.0% |
| Bio, Nature & Agricultural | 0 | 0.0% |
| Physical & Health Sciences | 0 | 0.0% |
| Psychology | 0 | 0.0% |
| Social Sciences | 0 | 0.0% |
| Engineering | 0 | 0.0% |
| Multidisciplinary Studies | 0 | 0.0% |
| Science & Technology | 0 | 0.0% |
| Business | 3 | 100.0% |
| Education | 0 | 0.0% |
| Literature & Languages | 0 | 0.0% |
| Liberal Arts & History | 0 | 0.0% |
| Visual & Performing Arts | 0 | 0.0% |
| Communications | 0 | 0.0% |
| Arts & Humanities | 0 | 0.0% |
| Total | 3 | 100.0% |
Transportation & Commute in Sarita
Vehicle Availability by Sex in Sarita
The most prevalent vehicle ownership categories in Sarita are males with 1 vehicle (18, accounting for 50.0%) and females with 1 vehicle (0, making up 257.1%).
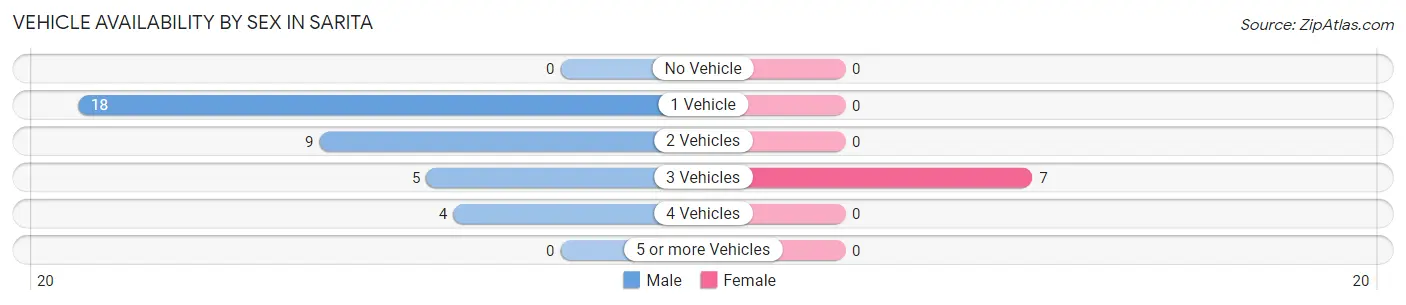
| Vehicles Available | Male | Female |
| No Vehicle | 0 (0.0%) | 0 (0.0%) |
| 1 Vehicle | 18 (50.0%) | 0 (0.0%) |
| 2 Vehicles | 9 (25.0%) | 0 (0.0%) |
| 3 Vehicles | 5 (13.9%) | 7 (100.0%) |
| 4 Vehicles | 4 (11.1%) | 0 (0.0%) |
| 5 or more Vehicles | 0 (0.0%) | 0 (0.0%) |
| Total | 36 (100.0%) | 7 (100.0%) |
Commute Time in Sarita
The most frequently occuring commute durations in Sarita are 5 to 9 minutes (15 commuters, 34.9%), 15 to 19 minutes (9 commuters, 20.9%), and 30 to 34 minutes (8 commuters, 18.6%).
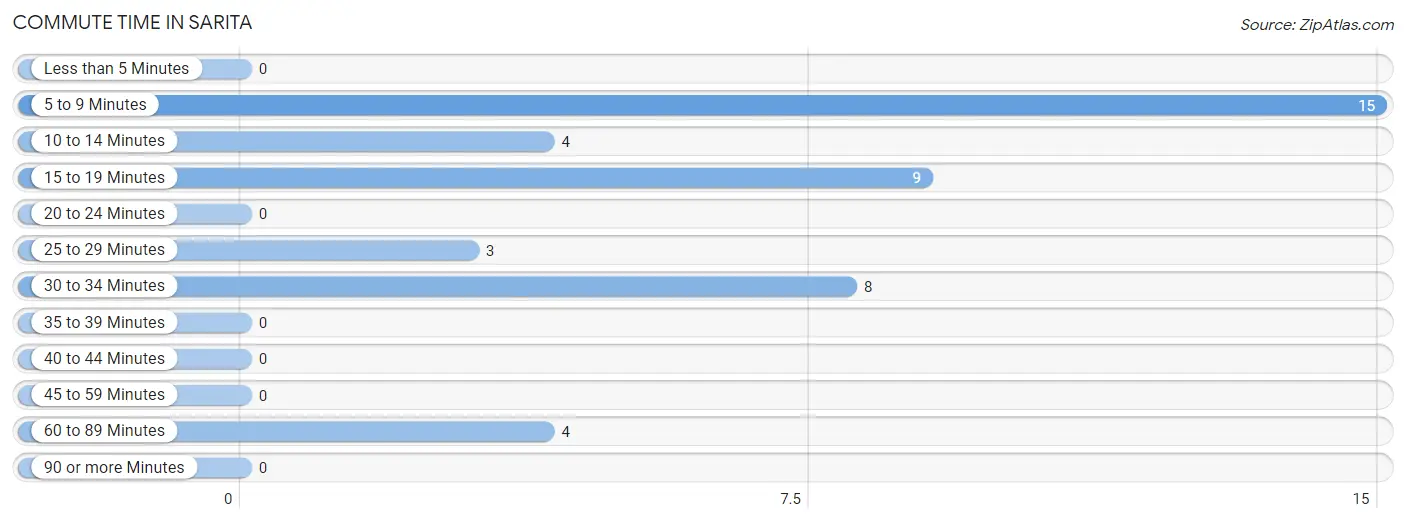
| Commute Time | # Commuters | % Commuters |
| Less than 5 Minutes | 0 | 0.0% |
| 5 to 9 Minutes | 15 | 34.9% |
| 10 to 14 Minutes | 4 | 9.3% |
| 15 to 19 Minutes | 9 | 20.9% |
| 20 to 24 Minutes | 0 | 0.0% |
| 25 to 29 Minutes | 3 | 7.0% |
| 30 to 34 Minutes | 8 | 18.6% |
| 35 to 39 Minutes | 0 | 0.0% |
| 40 to 44 Minutes | 0 | 0.0% |
| 45 to 59 Minutes | 0 | 0.0% |
| 60 to 89 Minutes | 4 | 9.3% |
| 90 or more Minutes | 0 | 0.0% |
Commute Time by Sex in Sarita
The most common commute times in Sarita are 5 to 9 minutes (15 commuters, 41.7%) for males and 10 to 14 minutes (4 commuters, 57.1%) for females.
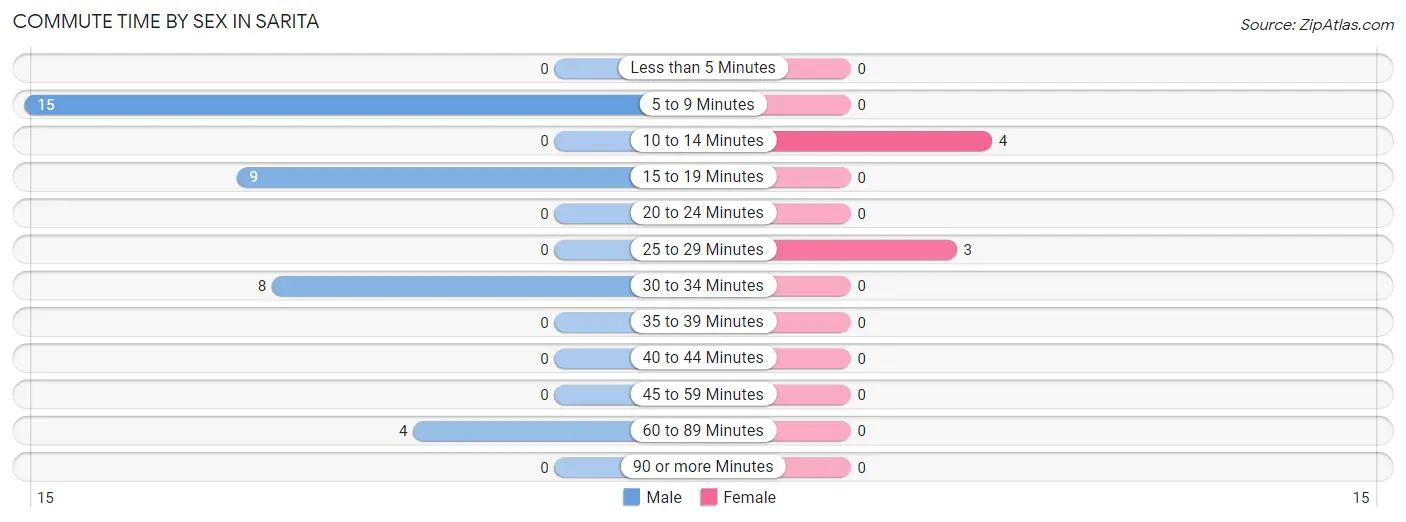
| Commute Time | Male | Female |
| Less than 5 Minutes | 0 (0.0%) | 0 (0.0%) |
| 5 to 9 Minutes | 15 (41.7%) | 0 (0.0%) |
| 10 to 14 Minutes | 0 (0.0%) | 4 (57.1%) |
| 15 to 19 Minutes | 9 (25.0%) | 0 (0.0%) |
| 20 to 24 Minutes | 0 (0.0%) | 0 (0.0%) |
| 25 to 29 Minutes | 0 (0.0%) | 3 (42.9%) |
| 30 to 34 Minutes | 8 (22.2%) | 0 (0.0%) |
| 35 to 39 Minutes | 0 (0.0%) | 0 (0.0%) |
| 40 to 44 Minutes | 0 (0.0%) | 0 (0.0%) |
| 45 to 59 Minutes | 0 (0.0%) | 0 (0.0%) |
| 60 to 89 Minutes | 4 (11.1%) | 0 (0.0%) |
| 90 or more Minutes | 0 (0.0%) | 0 (0.0%) |
Time of Departure to Work by Sex in Sarita
The most frequent times of departure to work in Sarita are 6:30 AM to 6:59 AM (14, 38.9%) for males and 7:30 AM to 7:59 AM (7, 100.0%) for females.
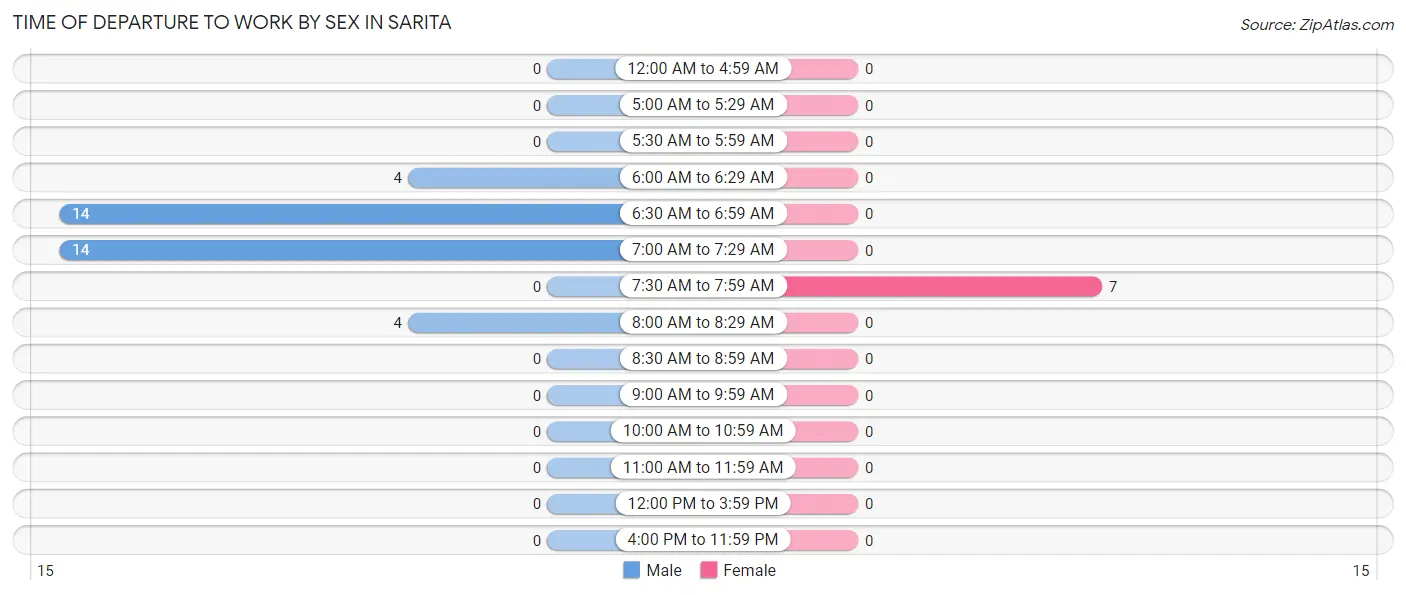
| Time of Departure | Male | Female |
| 12:00 AM to 4:59 AM | 0 (0.0%) | 0 (0.0%) |
| 5:00 AM to 5:29 AM | 0 (0.0%) | 0 (0.0%) |
| 5:30 AM to 5:59 AM | 0 (0.0%) | 0 (0.0%) |
| 6:00 AM to 6:29 AM | 4 (11.1%) | 0 (0.0%) |
| 6:30 AM to 6:59 AM | 14 (38.9%) | 0 (0.0%) |
| 7:00 AM to 7:29 AM | 14 (38.9%) | 0 (0.0%) |
| 7:30 AM to 7:59 AM | 0 (0.0%) | 7 (100.0%) |
| 8:00 AM to 8:29 AM | 4 (11.1%) | 0 (0.0%) |
| 8:30 AM to 8:59 AM | 0 (0.0%) | 0 (0.0%) |
| 9:00 AM to 9:59 AM | 0 (0.0%) | 0 (0.0%) |
| 10:00 AM to 10:59 AM | 0 (0.0%) | 0 (0.0%) |
| 11:00 AM to 11:59 AM | 0 (0.0%) | 0 (0.0%) |
| 12:00 PM to 3:59 PM | 0 (0.0%) | 0 (0.0%) |
| 4:00 PM to 11:59 PM | 0 (0.0%) | 0 (0.0%) |
| Total | 36 (100.0%) | 7 (100.0%) |
Housing Occupancy in Sarita
Occupancy by Ownership in Sarita
Of the total 38 dwellings in Sarita, owner-occupied units account for 6 (15.8%), while renter-occupied units make up 32 (84.2%).
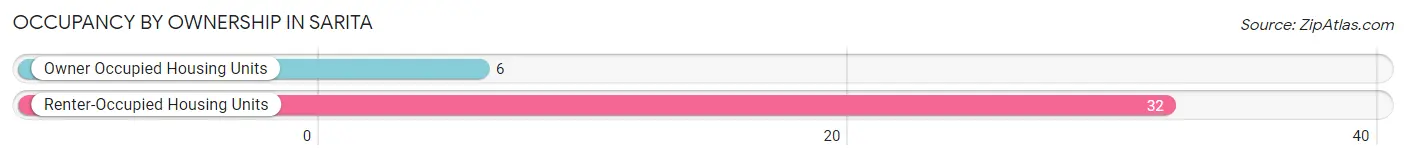
| Occupancy | # Housing Units | % Housing Units |
| Owner Occupied Housing Units | 6 | 15.8% |
| Renter-Occupied Housing Units | 32 | 84.2% |
| Total Occupied Housing Units | 38 | 100.0% |
Occupancy by Household Size in Sarita
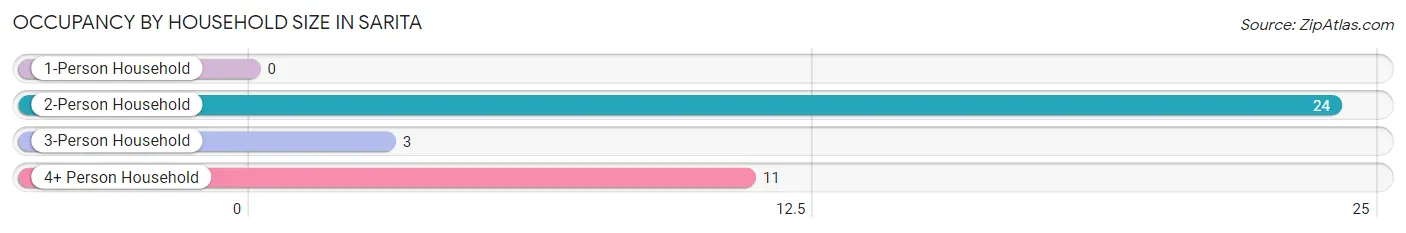
| Household Size | # Housing Units | % Housing Units |
| 1-Person Household | 0 | 0.0% |
| 2-Person Household | 24 | 63.2% |
| 3-Person Household | 3 | 7.9% |
| 4+ Person Household | 11 | 28.9% |
| Total Housing Units | 38 | 100.0% |
Occupancy by Ownership by Household Size in Sarita
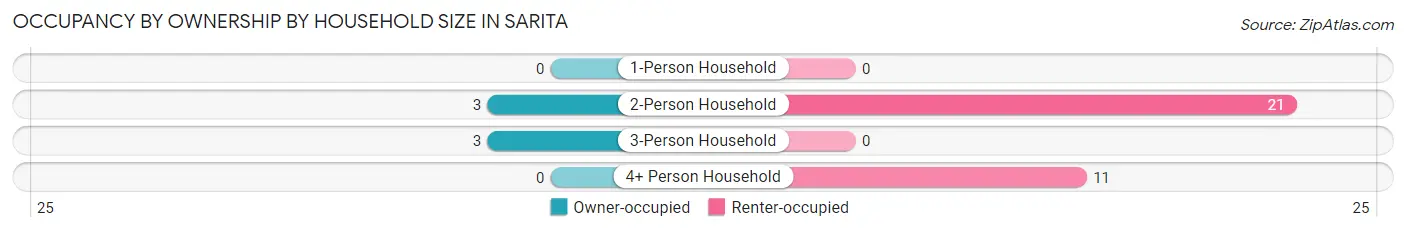
| Household Size | Owner-occupied | Renter-occupied |
| 1-Person Household | 0 (0.0%) | 0 (0.0%) |
| 2-Person Household | 3 (12.5%) | 21 (87.5%) |
| 3-Person Household | 3 (100.0%) | 0 (0.0%) |
| 4+ Person Household | 0 (0.0%) | 11 (100.0%) |
| Total Housing Units | 6 (15.8%) | 32 (84.2%) |
Occupancy by Educational Attainment in Sarita
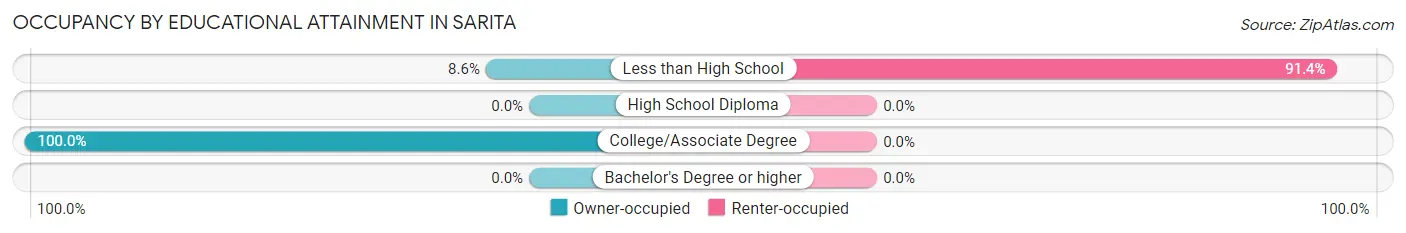
| Household Size | Owner-occupied | Renter-occupied |
| Less than High School | 3 (8.6%) | 32 (91.4%) |
| High School Diploma | 0 (0.0%) | 0 (0.0%) |
| College/Associate Degree | 3 (100.0%) | 0 (0.0%) |
| Bachelor's Degree or higher | 0 (0.0%) | 0 (0.0%) |
Occupancy by Age of Householder in Sarita
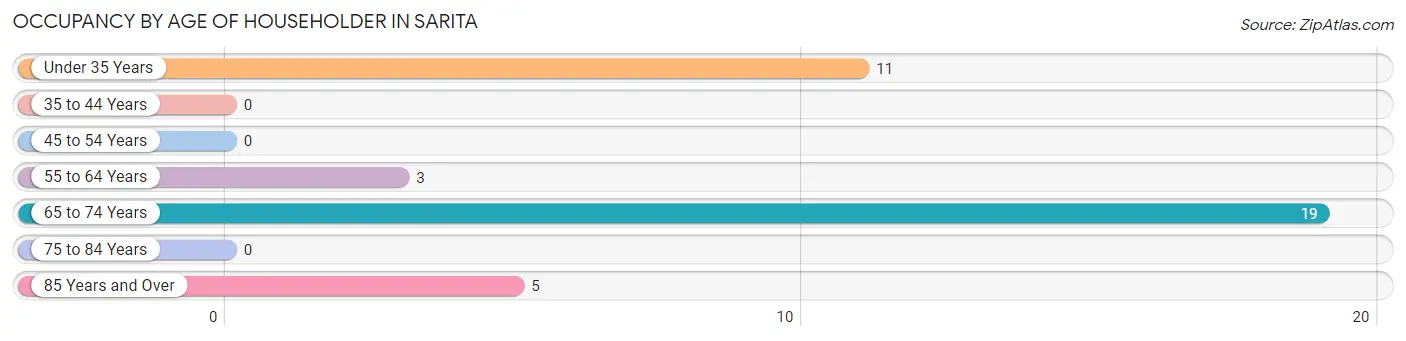
| Age Bracket | # Households | % Households |
| Under 35 Years | 11 | 28.9% |
| 35 to 44 Years | 0 | 0.0% |
| 45 to 54 Years | 0 | 0.0% |
| 55 to 64 Years | 3 | 7.9% |
| 65 to 74 Years | 19 | 50.0% |
| 75 to 84 Years | 0 | 0.0% |
| 85 Years and Over | 5 | 13.2% |
| Total | 38 | 100.0% |
Housing Finances in Sarita
Median Income by Occupancy in Sarita
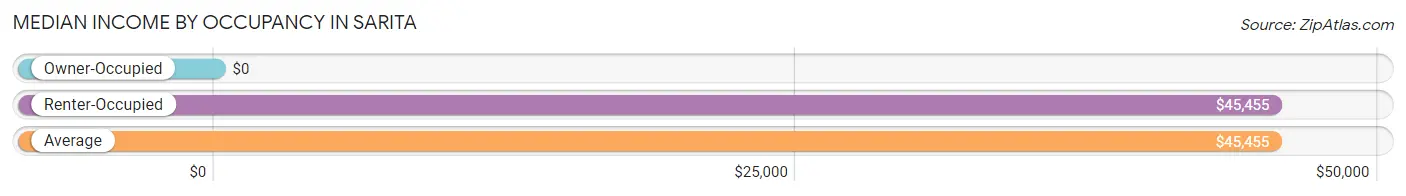
| Occupancy Type | # Households | Median Income |
| Owner-Occupied | 6 (15.8%) | $0 |
| Renter-Occupied | 32 (84.2%) | $45,455 |
| Average | 38 (100.0%) | $45,455 |
Occupancy by Householder Income Bracket in Sarita
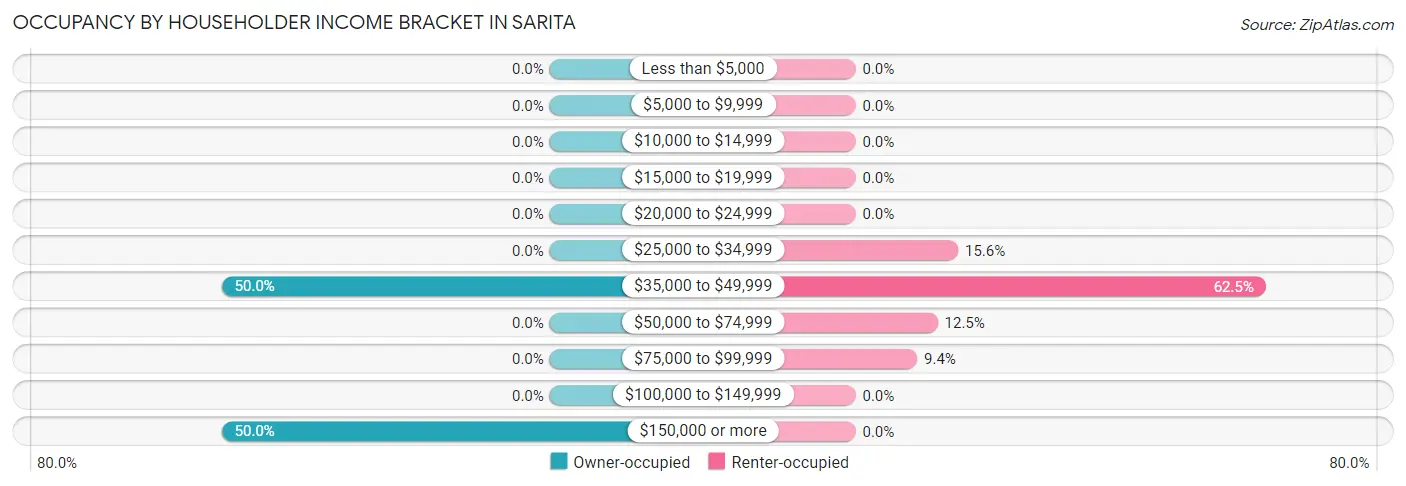
| Income Bracket | Owner-occupied | Renter-occupied |
| Less than $5,000 | 0 (0.0%) | 0 (0.0%) |
| $5,000 to $9,999 | 0 (0.0%) | 0 (0.0%) |
| $10,000 to $14,999 | 0 (0.0%) | 0 (0.0%) |
| $15,000 to $19,999 | 0 (0.0%) | 0 (0.0%) |
| $20,000 to $24,999 | 0 (0.0%) | 0 (0.0%) |
| $25,000 to $34,999 | 0 (0.0%) | 5 (15.6%) |
| $35,000 to $49,999 | 3 (50.0%) | 20 (62.5%) |
| $50,000 to $74,999 | 0 (0.0%) | 4 (12.5%) |
| $75,000 to $99,999 | 0 (0.0%) | 3 (9.4%) |
| $100,000 to $149,999 | 0 (0.0%) | 0 (0.0%) |
| $150,000 or more | 3 (50.0%) | 0 (0.0%) |
| Total | 6 (100.0%) | 32 (100.0%) |
Monthly Housing Cost Tiers in Sarita
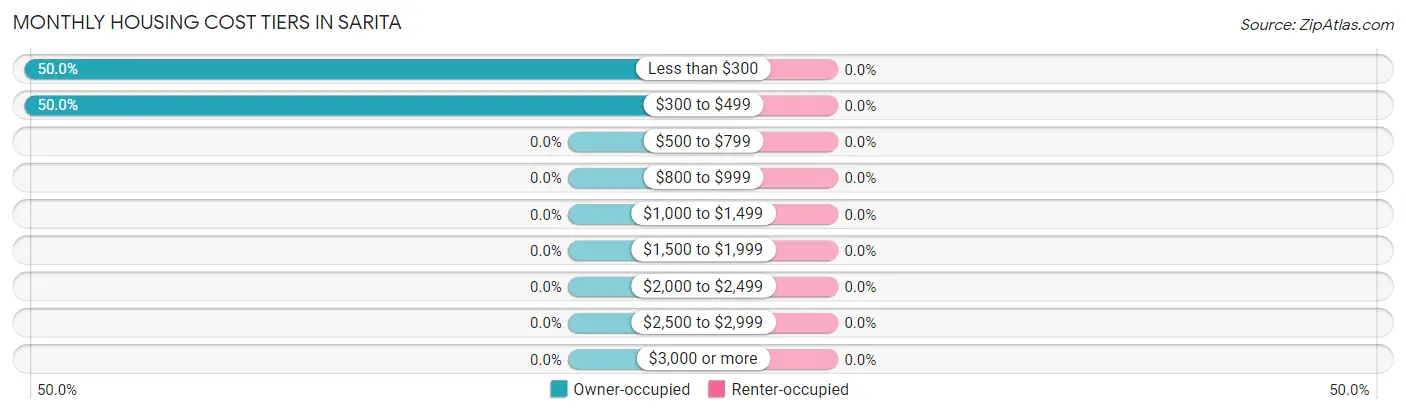
| Monthly Cost | Owner-occupied | Renter-occupied |
| Less than $300 | 3 (50.0%) | 0 (0.0%) |
| $300 to $499 | 3 (50.0%) | 0 (0.0%) |
| $500 to $799 | 0 (0.0%) | 0 (0.0%) |
| $800 to $999 | 0 (0.0%) | 0 (0.0%) |
| $1,000 to $1,499 | 0 (0.0%) | 0 (0.0%) |
| $1,500 to $1,999 | 0 (0.0%) | 0 (0.0%) |
| $2,000 to $2,499 | 0 (0.0%) | 0 (0.0%) |
| $2,500 to $2,999 | 0 (0.0%) | 0 (0.0%) |
| $3,000 or more | 0 (0.0%) | 0 (0.0%) |
| Total | 6 (100.0%) | 32 (100.0%) |
Physical Housing Characteristics in Sarita
Housing Structures in Sarita
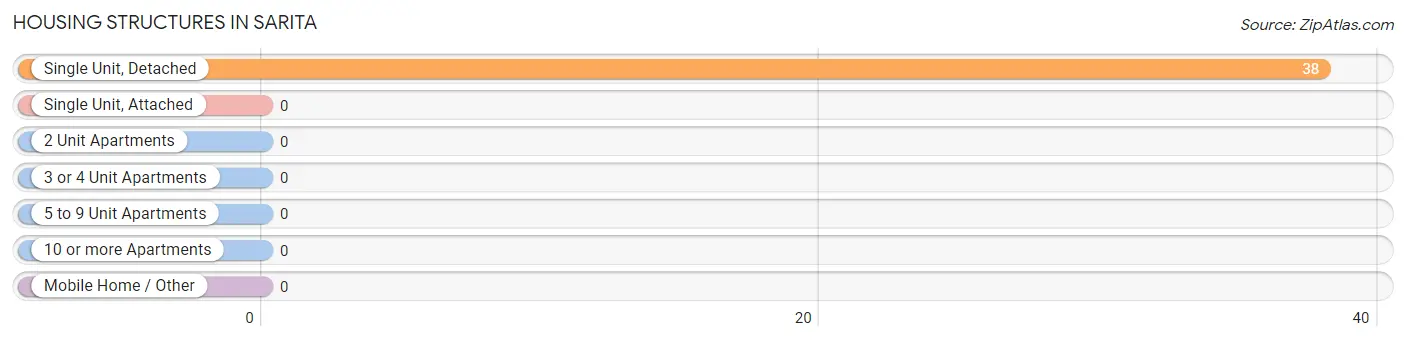
| Structure Type | # Housing Units | % Housing Units |
| Single Unit, Detached | 38 | 100.0% |
| Single Unit, Attached | 0 | 0.0% |
| 2 Unit Apartments | 0 | 0.0% |
| 3 or 4 Unit Apartments | 0 | 0.0% |
| 5 to 9 Unit Apartments | 0 | 0.0% |
| 10 or more Apartments | 0 | 0.0% |
| Mobile Home / Other | 0 | 0.0% |
| Total | 38 | 100.0% |
Housing Structures by Occupancy in Sarita
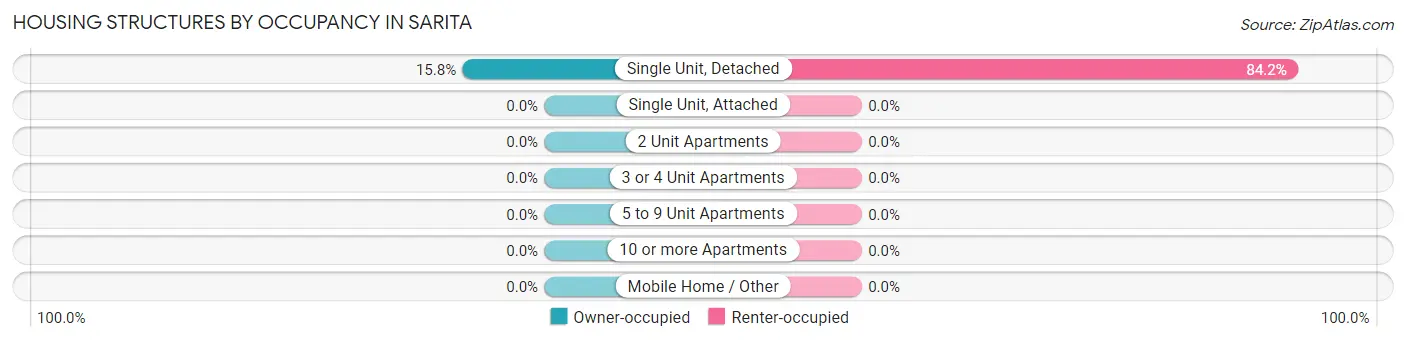
| Structure Type | Owner-occupied | Renter-occupied |
| Single Unit, Detached | 6 (15.8%) | 32 (84.2%) |
| Single Unit, Attached | 0 (0.0%) | 0 (0.0%) |
| 2 Unit Apartments | 0 (0.0%) | 0 (0.0%) |
| 3 or 4 Unit Apartments | 0 (0.0%) | 0 (0.0%) |
| 5 to 9 Unit Apartments | 0 (0.0%) | 0 (0.0%) |
| 10 or more Apartments | 0 (0.0%) | 0 (0.0%) |
| Mobile Home / Other | 0 (0.0%) | 0 (0.0%) |
| Total | 6 (15.8%) | 32 (84.2%) |
Housing Structures by Number of Rooms in Sarita
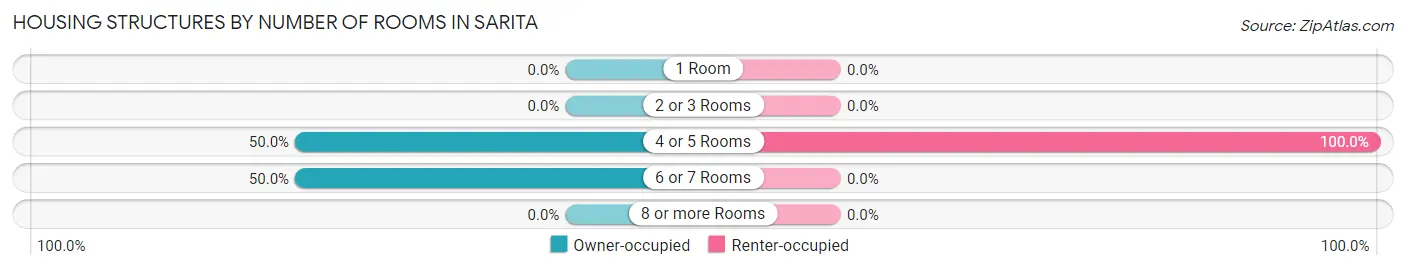
| Number of Rooms | Owner-occupied | Renter-occupied |
| 1 Room | 0 (0.0%) | 0 (0.0%) |
| 2 or 3 Rooms | 0 (0.0%) | 0 (0.0%) |
| 4 or 5 Rooms | 3 (50.0%) | 32 (100.0%) |
| 6 or 7 Rooms | 3 (50.0%) | 0 (0.0%) |
| 8 or more Rooms | 0 (0.0%) | 0 (0.0%) |
| Total | 6 (100.0%) | 32 (100.0%) |
Housing Structure by Heating Type in Sarita
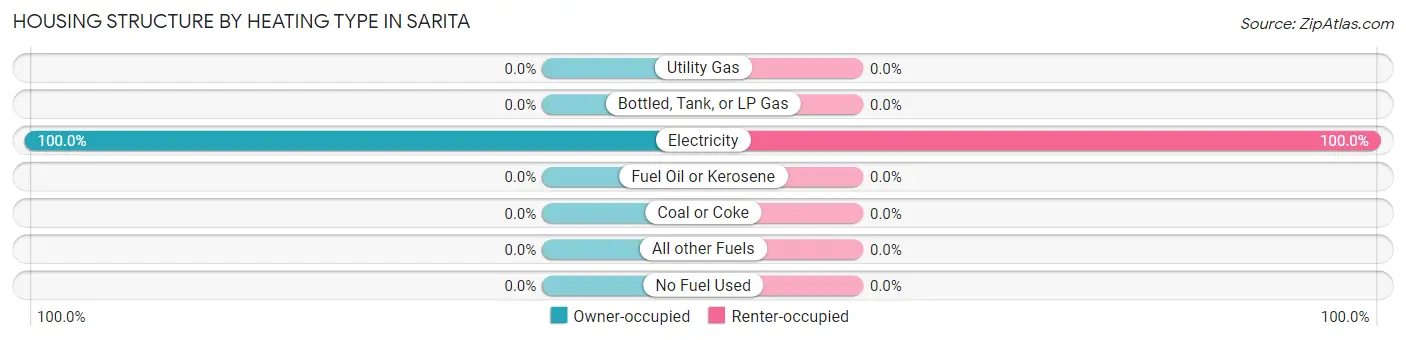
| Heating Type | Owner-occupied | Renter-occupied |
| Utility Gas | 0 (0.0%) | 0 (0.0%) |
| Bottled, Tank, or LP Gas | 0 (0.0%) | 0 (0.0%) |
| Electricity | 6 (100.0%) | 32 (100.0%) |
| Fuel Oil or Kerosene | 0 (0.0%) | 0 (0.0%) |
| Coal or Coke | 0 (0.0%) | 0 (0.0%) |
| All other Fuels | 0 (0.0%) | 0 (0.0%) |
| No Fuel Used | 0 (0.0%) | 0 (0.0%) |
| Total | 6 (100.0%) | 32 (100.0%) |
Household Vehicle Usage in Sarita
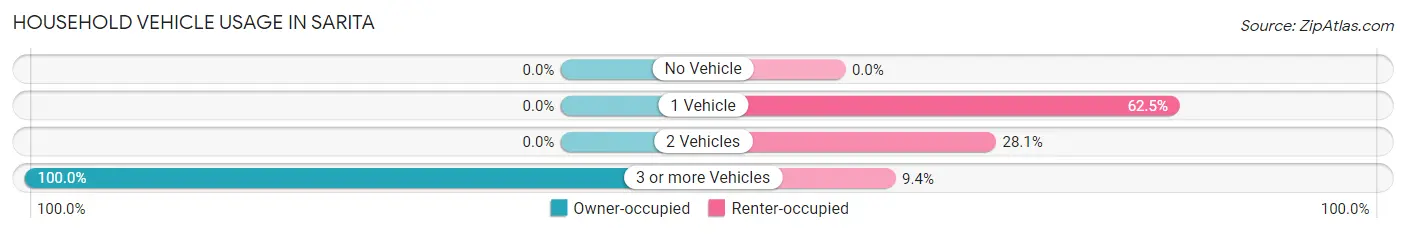
| Vehicles per Household | Owner-occupied | Renter-occupied |
| No Vehicle | 0 (0.0%) | 0 (0.0%) |
| 1 Vehicle | 0 (0.0%) | 20 (62.5%) |
| 2 Vehicles | 0 (0.0%) | 9 (28.1%) |
| 3 or more Vehicles | 6 (100.0%) | 3 (9.4%) |
| Total | 6 (100.0%) | 32 (100.0%) |
Real Estate & Mortgages in Sarita
Real Estate and Mortgage Overview in Sarita
| Characteristic | Without Mortgage | With Mortgage |
| Housing Units | 6 | 0 |
| Median Property Value | - | - |
| Median Household Income | - | - |
| Monthly Housing Costs | - | - |
| Real Estate Taxes | - | - |
Property Value by Mortgage Status in Sarita
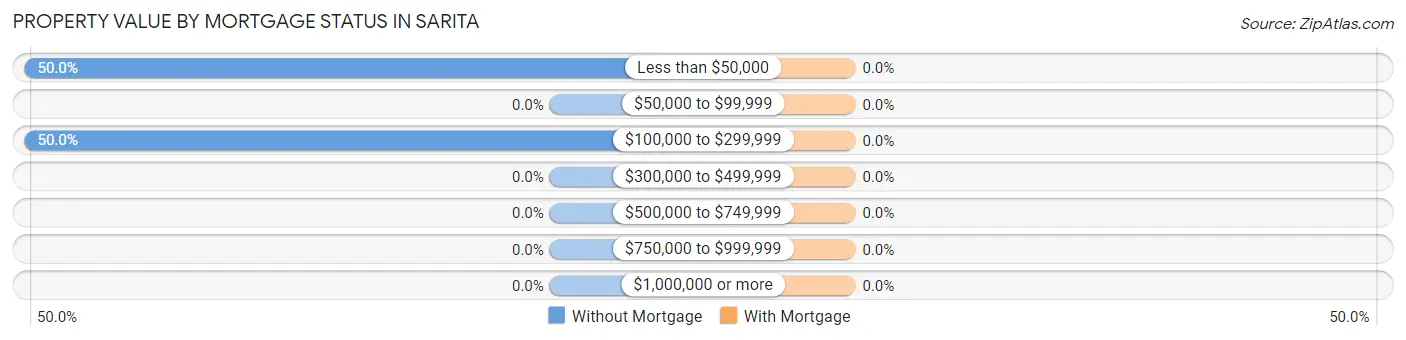
| Property Value | Without Mortgage | With Mortgage |
| Less than $50,000 | 3 (50.0%) | 0 (0.0%) |
| $50,000 to $99,999 | 0 (0.0%) | 0 (0.0%) |
| $100,000 to $299,999 | 3 (50.0%) | 0 (0.0%) |
| $300,000 to $499,999 | 0 (0.0%) | 0 (0.0%) |
| $500,000 to $749,999 | 0 (0.0%) | 0 (0.0%) |
| $750,000 to $999,999 | 0 (0.0%) | 0 (0.0%) |
| $1,000,000 or more | 0 (0.0%) | 0 (0.0%) |
| Total | 6 (100.0%) | 0 (0.0%) |
Household Income by Mortgage Status in Sarita
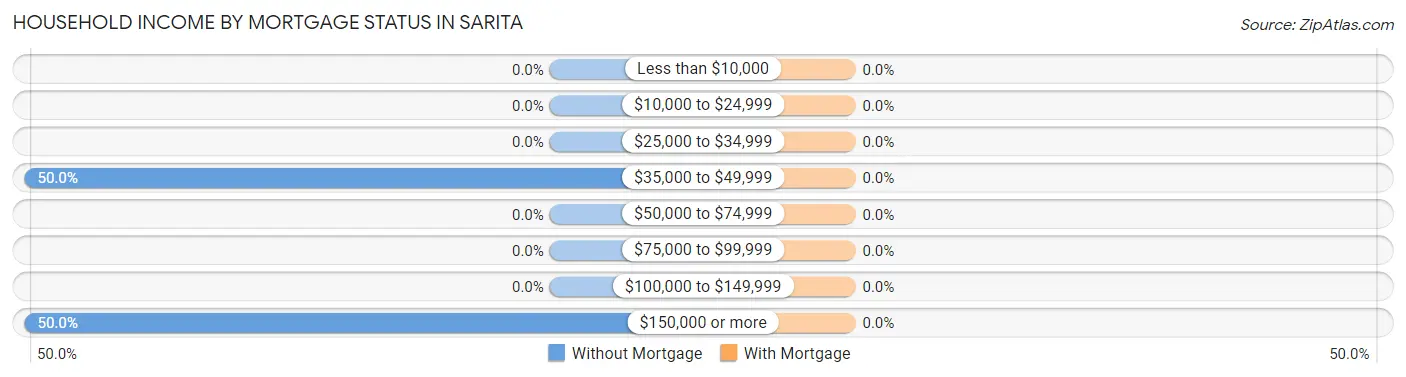
| Household Income | Without Mortgage | With Mortgage |
| Less than $10,000 | 0 (0.0%) | 0 (0.0%) |
| $10,000 to $24,999 | 0 (0.0%) | 0 (0.0%) |
| $25,000 to $34,999 | 0 (0.0%) | 0 (0.0%) |
| $35,000 to $49,999 | 3 (50.0%) | 0 (0.0%) |
| $50,000 to $74,999 | 0 (0.0%) | 0 (0.0%) |
| $75,000 to $99,999 | 0 (0.0%) | 0 (0.0%) |
| $100,000 to $149,999 | 0 (0.0%) | 0 (0.0%) |
| $150,000 or more | 3 (50.0%) | 0 (0.0%) |
| Total | 6 (100.0%) | 0 (0.0%) |
Property Value to Household Income Ratio in Sarita
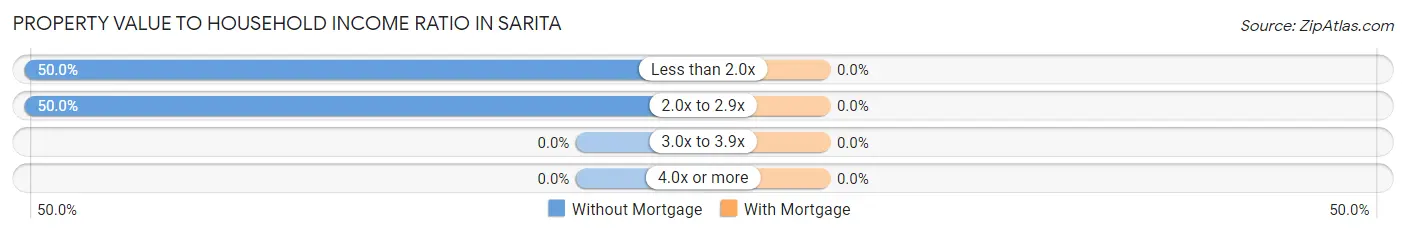
| Value-to-Income Ratio | Without Mortgage | With Mortgage |
| Less than 2.0x | 3 (50.0%) | 0 (0.0%) |
| 2.0x to 2.9x | 3 (50.0%) | 0 (0.0%) |
| 3.0x to 3.9x | 0 (0.0%) | 0 (0.0%) |
| 4.0x or more | 0 (0.0%) | 0 (0.0%) |
| Total | 6 (100.0%) | 0 (0.0%) |
Real Estate Taxes by Mortgage Status in Sarita
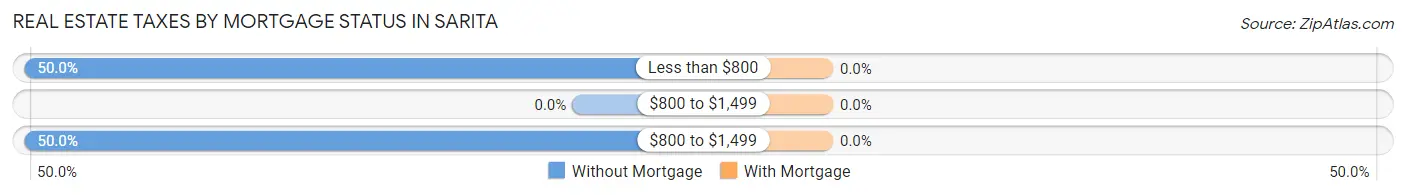
| Property Taxes | Without Mortgage | With Mortgage |
| Less than $800 | 3 (50.0%) | 0 (0.0%) |
| $800 to $1,499 | 0 (0.0%) | 0 (0.0%) |
| $800 to $1,499 | 3 (50.0%) | 0 (0.0%) |
| Total | 6 (100.0%) | 0 (0.0%) |
Health & Disability in Sarita
Health Insurance Coverage by Age in Sarita
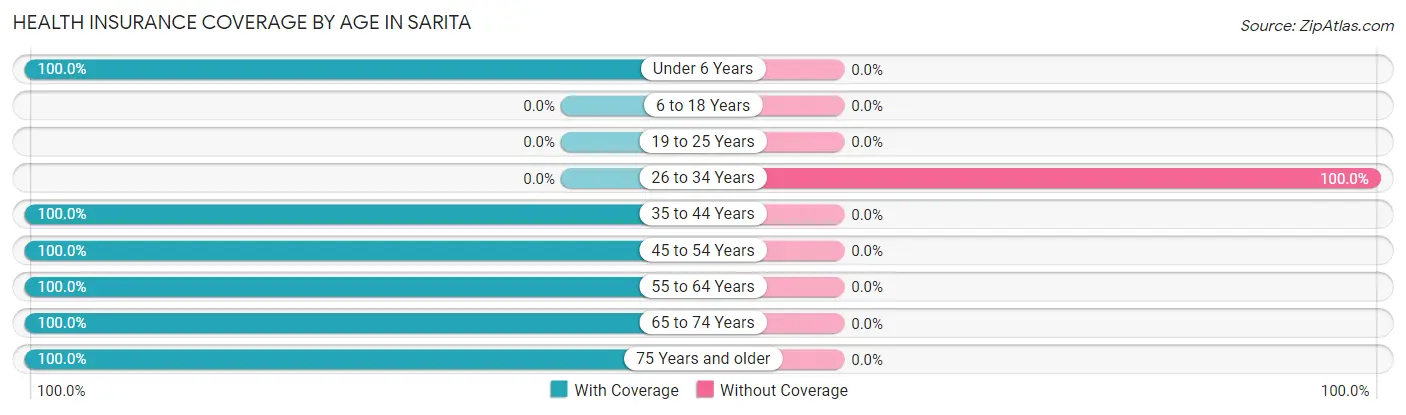
| Age Bracket | With Coverage | Without Coverage |
| Under 6 Years | 28 (100.0%) | 0 (0.0%) |
| 6 to 18 Years | 0 (0.0%) | 0 (0.0%) |
| 19 to 25 Years | 0 (0.0%) | 0 (0.0%) |
| 26 to 34 Years | 0 (0.0%) | 21 (100.0%) |
| 35 to 44 Years | 12 (100.0%) | 0 (0.0%) |
| 45 to 54 Years | 4 (100.0%) | 0 (0.0%) |
| 55 to 64 Years | 7 (100.0%) | 0 (0.0%) |
| 65 to 74 Years | 34 (100.0%) | 0 (0.0%) |
| 75 Years and older | 5 (100.0%) | 0 (0.0%) |
| Total | 90 (81.1%) | 21 (18.9%) |
Health Insurance Coverage by Citizenship Status in Sarita
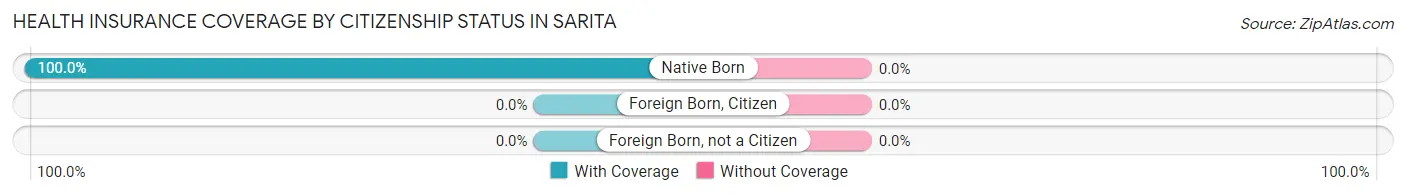
| Citizenship Status | With Coverage | Without Coverage |
| Native Born | 28 (100.0%) | 0 (0.0%) |
| Foreign Born, Citizen | 0 (0.0%) | 0 (0.0%) |
| Foreign Born, not a Citizen | 0 (0.0%) | 0 (0.0%) |
Health Insurance Coverage by Household Income in Sarita
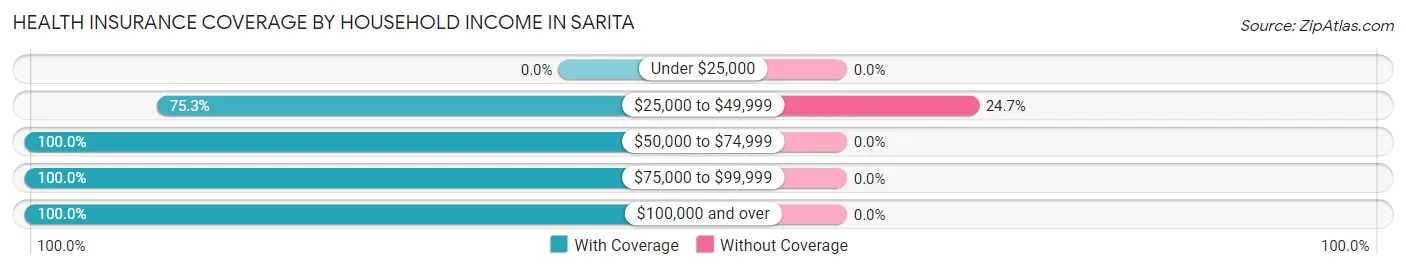
| Household Income | With Coverage | Without Coverage |
| Under $25,000 | 0 (0.0%) | 0 (0.0%) |
| $25,000 to $49,999 | 64 (75.3%) | 21 (24.7%) |
| $50,000 to $74,999 | 8 (100.0%) | 0 (0.0%) |
| $75,000 to $99,999 | 7 (100.0%) | 0 (0.0%) |
| $100,000 and over | 11 (100.0%) | 0 (0.0%) |
Public vs Private Health Insurance Coverage by Age in Sarita
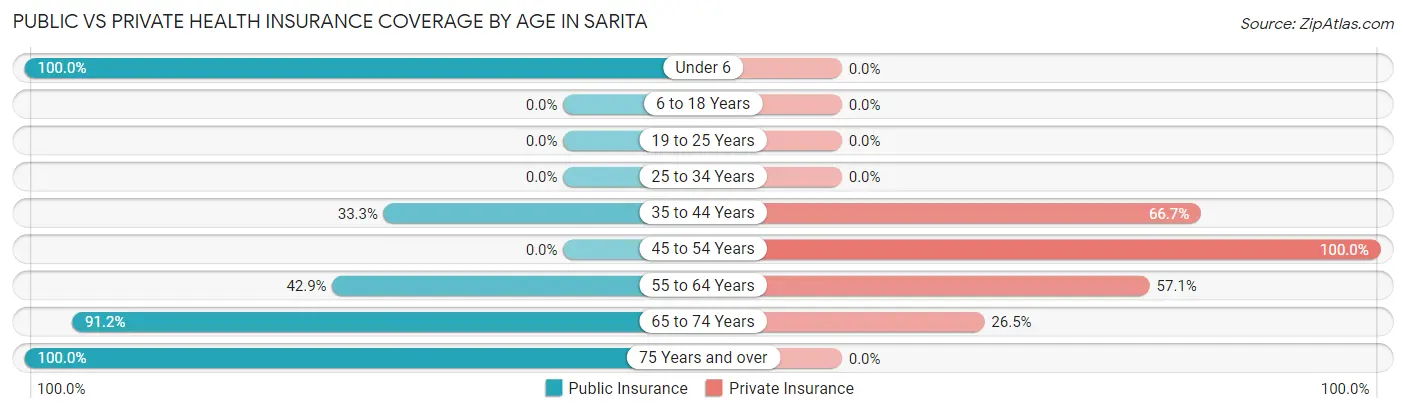
| Age Bracket | Public Insurance | Private Insurance |
| Under 6 | 28 (100.0%) | 0 (0.0%) |
| 6 to 18 Years | 0 (0.0%) | 0 (0.0%) |
| 19 to 25 Years | 0 (0.0%) | 0 (0.0%) |
| 25 to 34 Years | 0 (0.0%) | 0 (0.0%) |
| 35 to 44 Years | 4 (33.3%) | 8 (66.7%) |
| 45 to 54 Years | 0 (0.0%) | 4 (100.0%) |
| 55 to 64 Years | 3 (42.9%) | 4 (57.1%) |
| 65 to 74 Years | 31 (91.2%) | 9 (26.5%) |
| 75 Years and over | 5 (100.0%) | 0 (0.0%) |
| Total | 71 (64.0%) | 25 (22.5%) |
Disability Status by Sex by Age in Sarita
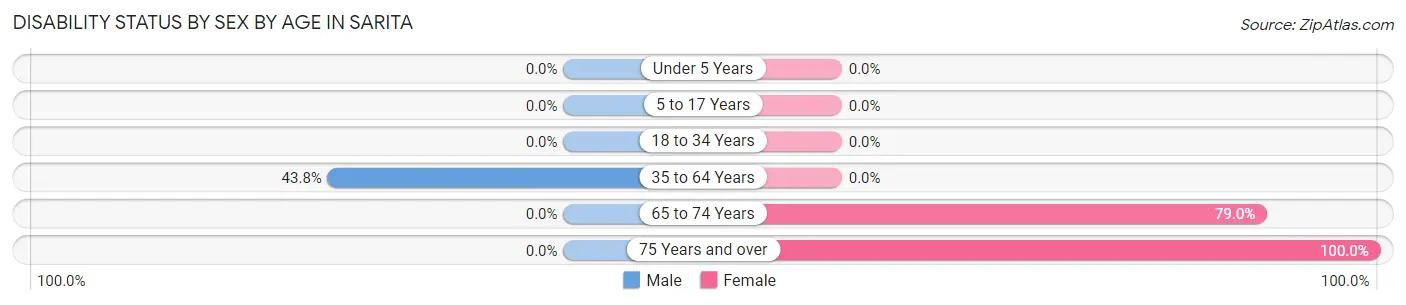
| Age Bracket | Male | Female |
| Under 5 Years | 0 (0.0%) | 0 (0.0%) |
| 5 to 17 Years | 0 (0.0%) | 0 (0.0%) |
| 18 to 34 Years | 0 (0.0%) | 0 (0.0%) |
| 35 to 64 Years | 7 (43.8%) | 0 (0.0%) |
| 65 to 74 Years | 0 (0.0%) | 15 (78.9%) |
| 75 Years and over | 0 (0.0%) | 5 (100.0%) |
Disability Class by Sex by Age in Sarita
Disability Class: Hearing Difficulty
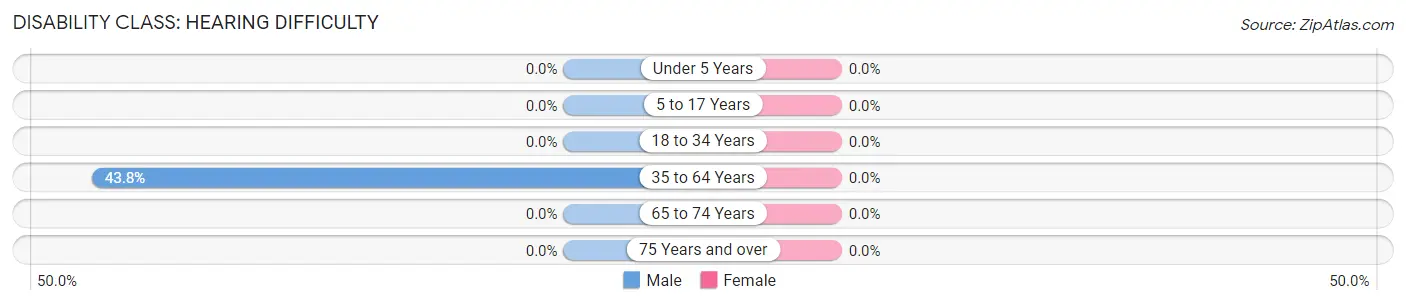
| Age Bracket | Male | Female |
| Under 5 Years | 0 (0.0%) | 0 (0.0%) |
| 5 to 17 Years | 0 (0.0%) | 0 (0.0%) |
| 18 to 34 Years | 0 (0.0%) | 0 (0.0%) |
| 35 to 64 Years | 7 (43.8%) | 0 (0.0%) |
| 65 to 74 Years | 0 (0.0%) | 0 (0.0%) |
| 75 Years and over | 0 (0.0%) | 0 (0.0%) |
Disability Class: Vision Difficulty
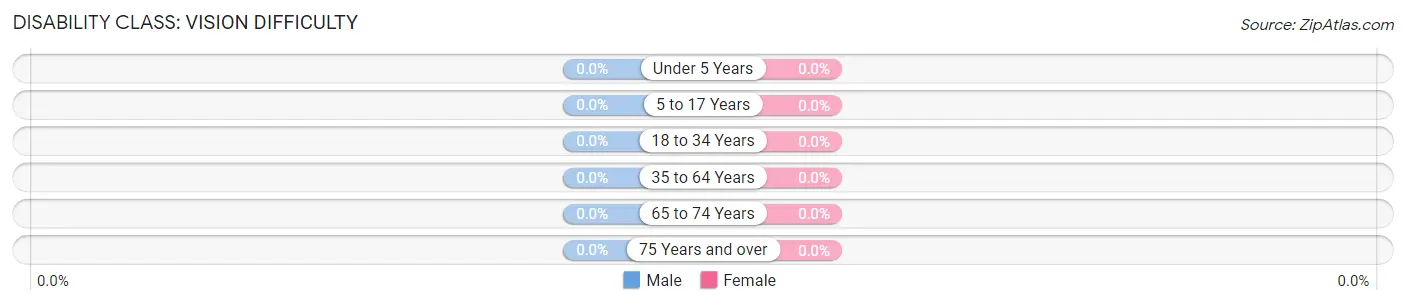
| Age Bracket | Male | Female |
| Under 5 Years | 0 (0.0%) | 0 (0.0%) |
| 5 to 17 Years | 0 (0.0%) | 0 (0.0%) |
| 18 to 34 Years | 0 (0.0%) | 0 (0.0%) |
| 35 to 64 Years | 0 (0.0%) | 0 (0.0%) |
| 65 to 74 Years | 0 (0.0%) | 0 (0.0%) |
| 75 Years and over | 0 (0.0%) | 0 (0.0%) |
Disability Class: Cognitive Difficulty
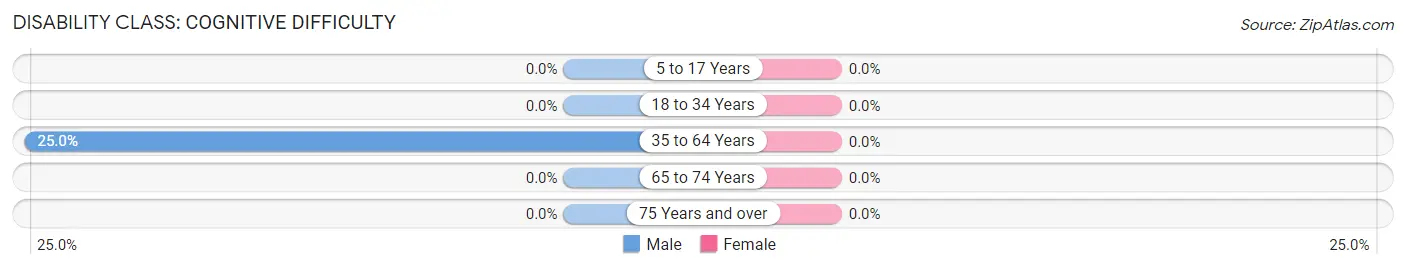
| Age Bracket | Male | Female |
| 5 to 17 Years | 0 (0.0%) | 0 (0.0%) |
| 18 to 34 Years | 0 (0.0%) | 0 (0.0%) |
| 35 to 64 Years | 4 (25.0%) | 0 (0.0%) |
| 65 to 74 Years | 0 (0.0%) | 0 (0.0%) |
| 75 Years and over | 0 (0.0%) | 0 (0.0%) |
Disability Class: Ambulatory Difficulty
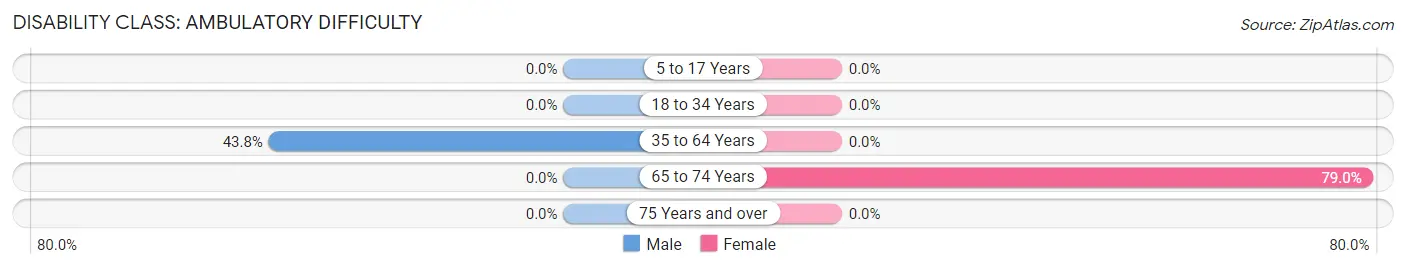
| Age Bracket | Male | Female |
| 5 to 17 Years | 0 (0.0%) | 0 (0.0%) |
| 18 to 34 Years | 0 (0.0%) | 0 (0.0%) |
| 35 to 64 Years | 7 (43.8%) | 0 (0.0%) |
| 65 to 74 Years | 0 (0.0%) | 15 (78.9%) |
| 75 Years and over | 0 (0.0%) | 0 (0.0%) |
Disability Class: Self-Care Difficulty
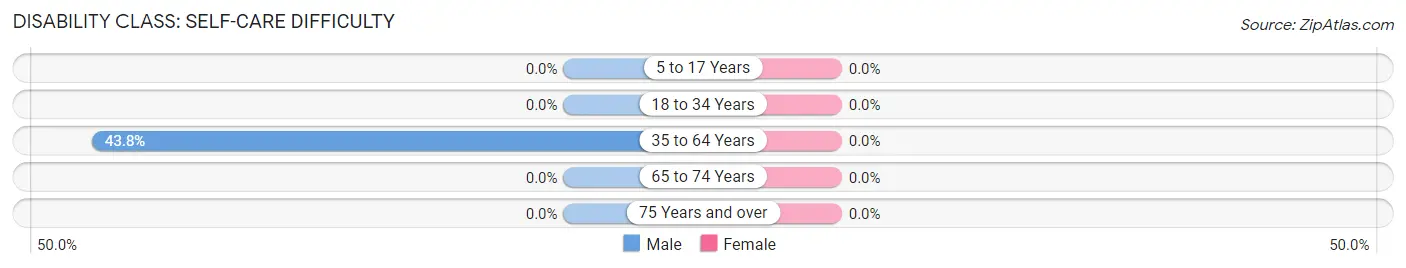
| Age Bracket | Male | Female |
| 5 to 17 Years | 0 (0.0%) | 0 (0.0%) |
| 18 to 34 Years | 0 (0.0%) | 0 (0.0%) |
| 35 to 64 Years | 7 (43.8%) | 0 (0.0%) |
| 65 to 74 Years | 0 (0.0%) | 0 (0.0%) |
| 75 Years and over | 0 (0.0%) | 0 (0.0%) |
Technology Access in Sarita
Computing Device Access in Sarita
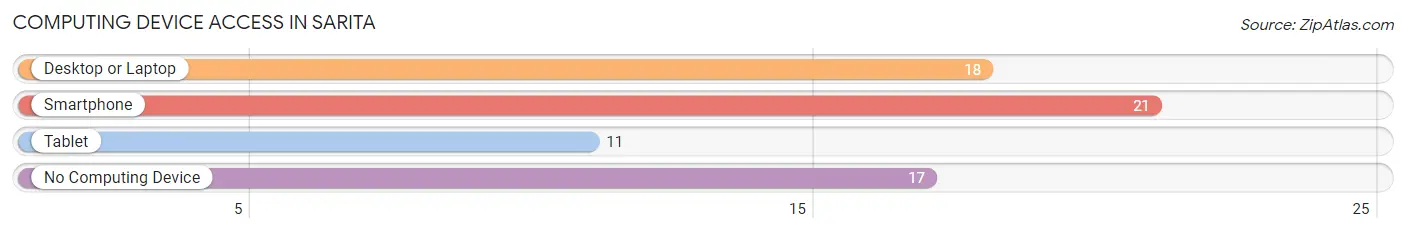
| Device Type | # Households | % Households |
| Desktop or Laptop | 18 | 47.4% |
| Smartphone | 21 | 55.3% |
| Tablet | 11 | 28.9% |
| No Computing Device | 17 | 44.7% |
| Total | 38 | 100.0% |
Internet Access in Sarita
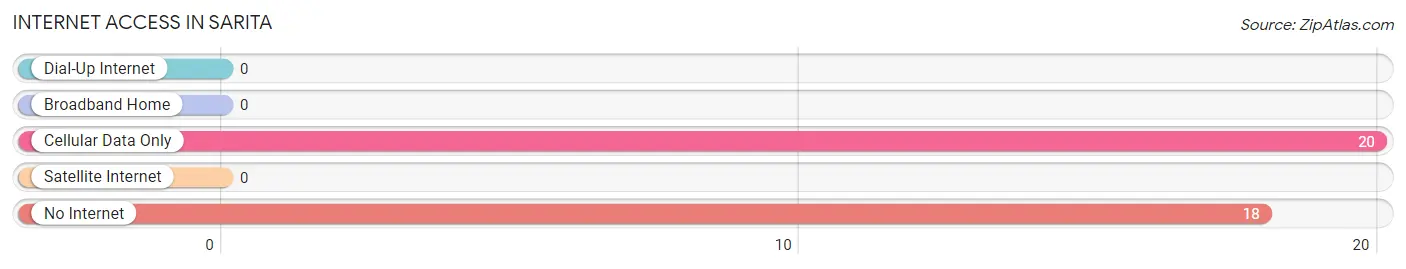
| Internet Type | # Households | % Households |
| Dial-Up Internet | 0 | 0.0% |
| Broadband Home | 0 | 0.0% |
| Cellular Data Only | 20 | 52.6% |
| Satellite Internet | 0 | 0.0% |
| No Internet | 18 | 47.4% |
| Total | 38 | 100.0% |
Sarita Summary
Sarita, Texas is a small unincorporated community located in Kenedy County, Texas. It is situated on the northern edge of the King Ranch, the largest ranch in the United States. Sarita is located approximately 40 miles south of Kingsville, the county seat of Kenedy County. The population of Sarita was estimated to be around 200 people in 2020.
History
Sarita was founded in the late 19th century by a group of ranchers who were looking for a place to settle and raise cattle. The town was named after Sarita Kenedy East, the daughter of Mifflin Kenedy, one of the founders of the King Ranch. The town was officially incorporated in 1909.
In the early 20th century, Sarita was a thriving community with a population of over 1,000 people. The town had a post office, a bank, a hotel, a school, and several stores. The town was also home to a number of ranches, including the King Ranch.
Geography
Sarita is located in Kenedy County, Texas, approximately 40 miles south of Kingsville, the county seat. The town is situated on the northern edge of the King Ranch, the largest ranch in the United States. The town is surrounded by vast expanses of ranch land and is located near the Gulf of Mexico.
The climate in Sarita is hot and humid in the summer months and mild in the winter months. The average temperature in the summer is around 90 degrees Fahrenheit and the average temperature in the winter is around 60 degrees Fahrenheit.
Economy
The economy of Sarita is largely based on ranching and agriculture. The town is home to several ranches, including the King Ranch, which is the largest ranch in the United States. The town is also home to several small businesses, including a grocery store, a gas station, and a few restaurants.
Demographics
The population of Sarita was estimated to be around 200 people in 2020. The town is predominantly Hispanic, with the majority of the population being of Mexican descent. The median household income in Sarita is around $30,000, which is lower than the national average. The poverty rate in Sarita is also higher than the national average, with around 25% of the population living below the poverty line.
Common Questions
What is Per Capita Income in Sarita?
Per Capita income in Sarita is $21,263.
What is the Median Family Income in Sarita?
Median Family Income in Sarita is $45,455.
What is the Median Household income in Sarita?
Median Household Income in Sarita is $45,455.
What is Inequality or Gini Index in Sarita?
Inequality or Gini Index in Sarita is 0.30.
What is the Total Population of Sarita?
Total Population of Sarita is 111.
What is the Total Male Population of Sarita?
Total Male Population of Sarita is 65.
What is the Total Female Population of Sarita?
Total Female Population of Sarita is 46.
What is the Ratio of Males per 100 Females in Sarita?
There are 141.30 Males per 100 Females in Sarita.
What is the Ratio of Females per 100 Males in Sarita?
There are 70.77 Females per 100 Males in Sarita.
What is the Median Population Age in Sarita?
Median Population Age in Sarita is 39.8 Years.
What is the Average Family Size in Sarita
Average Family Size in Sarita is 2.9 People.
What is the Average Household Size in Sarita
Average Household Size in Sarita is 2.9 People.
How Large is the Labor Force in Sarita?
There are 43 People in the Labor Forcein in Sarita.
What is the Percentage of People in the Labor Force in Sarita?
51.8% of People are in the Labor Force in Sarita.