Zip Codes with the Highest Percentage of Population Employed in Farming, Fishing & Forestry in Cleburne, TX
RELATED REPORTS & OPTIONS
Farming, Fishing & Forestry
Cleburne
Compare Zip Codes
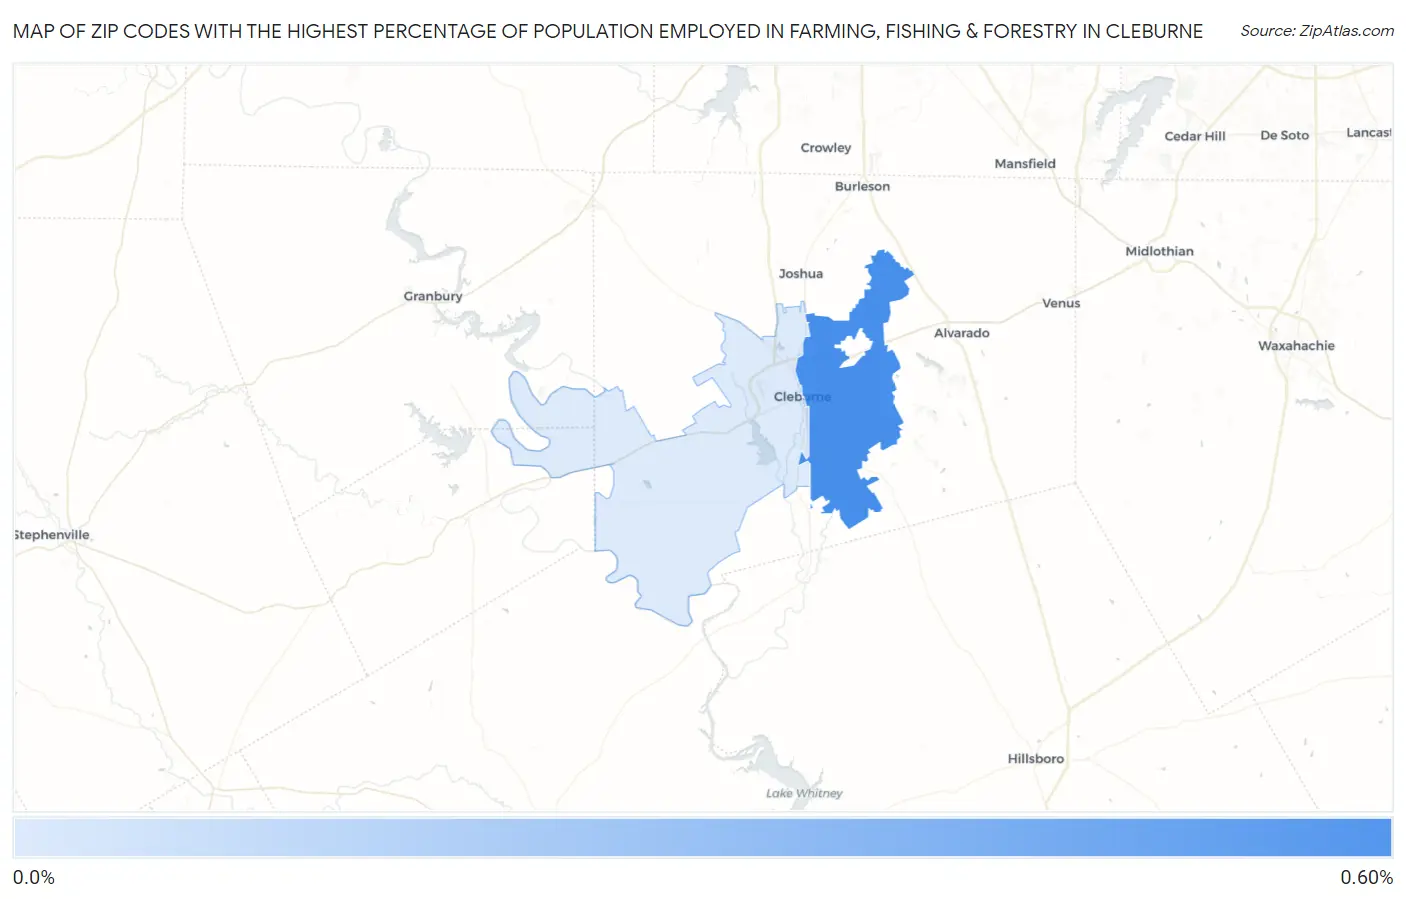
Map of Zip Codes with the Highest Percentage of Population Employed in Farming, Fishing & Forestry in Cleburne
0.054%
0.59%
Zip Codes with the Highest Percentage of Population Employed in Farming, Fishing & Forestry in Cleburne, TX
| Zip Code | % Employed | vs State | vs National | |
| 1. | 76031 | 0.59% | 0.37%(+0.214)#635 | 0.61%(-0.020)#12,153 |
| 2. | 76033 | 0.054% | 0.37%(-0.318)#1,059 | 0.61%(-0.551)#18,589 |
1
Common Questions
What are the Top Zip Codes with the Highest Percentage of Population Employed in Farming, Fishing & Forestry in Cleburne, TX?
Top Zip Codes with the Highest Percentage of Population Employed in Farming, Fishing & Forestry in Cleburne, TX are:
What zip code has the Highest Percentage of Population Employed in Farming, Fishing & Forestry in Cleburne, TX?
76031 has the Highest Percentage of Population Employed in Farming, Fishing & Forestry in Cleburne, TX with 0.59%.
What is the Percentage of Population Employed in Farming, Fishing & Forestry in Cleburne, TX?
Percentage of Population Employed in Farming, Fishing & Forestry in Cleburne is 0.25%.
What is the Percentage of Population Employed in Farming, Fishing & Forestry in Texas?
Percentage of Population Employed in Farming, Fishing & Forestry in Texas is 0.37%.
What is the Percentage of Population Employed in Farming, Fishing & Forestry in the United States?
Percentage of Population Employed in Farming, Fishing & Forestry in the United States is 0.61%.