Zip Codes with the Highest Percentage of Population Employed in Farming, Fishing & Forestry in El Paso, TX

RELATED REPORTS & OPTIONS

Farming, Fishing & Forestry
Population
Families and Households
Female Fertility
Female Fertility (Unmarried)
Race (Community Size)
Race (Percentage)
Ancestry (Community Size)
AfghanAfricanAmericanApacheArabArgentineanArmenianAustrianBarbadianBasqueBelgianBelizeanBhutaneseBlackfeetBolivianBrazilianBritishBurmeseCajunCanadianCentral AmericanCentral American IndianCherokeeCheyenneChickasawChileanChippewaChoctawColombianComancheCosta RicanCreeCreekCroatianCubanCzechCzechoslovakianDanishDominicanDutchEastern EuropeanEcuadorianEgyptianEnglishEthiopianEuropeanFilipinoFinnishFrenchFrench CanadianGermanGerman RussianGhanaianGreekGuamanian / ChamorroGuatemalanHaitianHonduranHopiHungarianIndian (Asian)IndonesianInupiatIranianIrishIroquoisItalianJamaicanJapaneseJordanianKoreanLaotianLebaneseLithuanianLumbeeLuxembourgerMexicanMexican American IndianMongolianMoroccanNative HawaiianNavajoNicaraguanNigerianNorthern EuropeanNorwegianOttawaPakistaniPanamanianPeruvianPimaPolishPortuguesePotawatomiPuebloPuerto RicanRomanianRussianSalvadoranSamoanScandinavianScotch-IrishScottishSenegaleseSiouxSlovakSloveneSouth AmericanSpaniardSpanishSpanish AmericanSpanish American IndianSri LankanSubsaharan AfricanSwedishSwissSyrianThaiTohono O'OdhamTonganTurkishUkrainianVenezuelanWelshWest IndianYaquiYugoslavian
Ancestry (Percentage)
AfghanAfricanAmericanApacheArabArgentineanArmenianAustrianBarbadianBasqueBelgianBelizeanBhutaneseBlackfeetBolivianBrazilianBritishBurmeseCajunCanadianCentral AmericanCentral American IndianCherokeeCheyenneChickasawChileanChippewaChoctawColombianComancheCosta RicanCreeCreekCroatianCubanCzechCzechoslovakianDanishDominicanDutchEastern EuropeanEcuadorianEgyptianEnglishEthiopianEuropeanFilipinoFinnishFrenchFrench CanadianGermanGerman RussianGhanaianGreekGuamanian / ChamorroGuatemalanHaitianHonduranHopiHungarianIndian (Asian)IndonesianInupiatIranianIrishIroquoisItalianJamaicanJapaneseJordanianKoreanLaotianLebaneseLithuanianLumbeeLuxembourgerMexicanMexican American IndianMongolianMoroccanNative HawaiianNavajoNicaraguanNigerianNorthern EuropeanNorwegianOttawaPakistaniPanamanianPeruvianPimaPolishPortuguesePotawatomiPuebloPuerto RicanRomanianRussianSalvadoranSamoanScandinavianScotch-IrishScottishSenegaleseSiouxSlovakSloveneSouth AmericanSpaniardSpanishSpanish AmericanSpanish American IndianSri LankanSubsaharan AfricanSwedishSwissSyrianThaiTohono O'OdhamTonganTurkishUkrainianVenezuelanWelshWest IndianYaquiYugoslavian
Immigrant Origin (Total)
Immigrant Origin (Percentage)
Income
Income (Families)
Income (Households)
Poverty
Poverty (Families)
Unemployment
Employment Occupations
Employment Industries
Employer Class
Commute Time
Commute Means
School Enrollment
Education by Degree Field
Occupancy
Finances
Physical Characteristics
El Paso
Compare Zip Codes
Comparison Subject

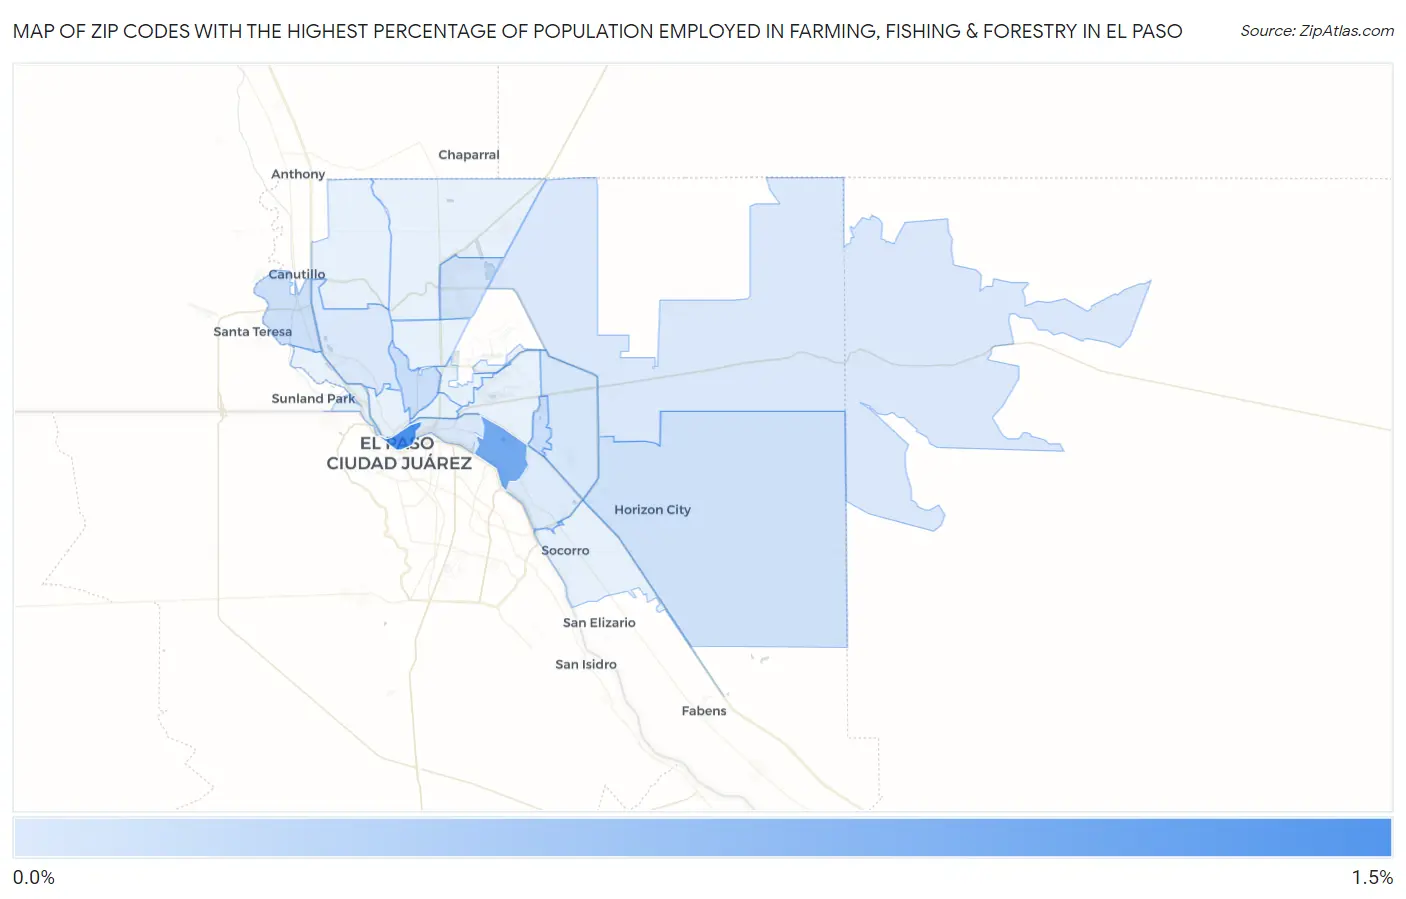
Map of Zip Codes with the Highest Percentage of Population Employed in Farming, Fishing & Forestry in El Paso

0.0%
1.5%
Zip Codes with the Highest Percentage of Population Employed in Farming, Fishing & Forestry in El Paso Map

Zip Codes with the Highest Percentage of Population Employed in Farming, Fishing & Forestry in El Paso, TX

Zip Code % Employed vs State vs National
1.799011.2%0.37%(+0.858)#4650.61%(+0.625)#8,821
2.799150.88%0.37%(+0.505)#5480.61%(+0.271)#10,358
3.799350.20%0.37%(-0.173)#8870.61%(-0.406)#16,140
4.799300.19%0.37%(-0.177)#8920.61%(-0.411)#16,197
5.799320.16%0.37%(-0.212)#9270.61%(-0.445)#16,744
6.799280.14%0.37%(-0.228)#9420.61%(-0.462)#17,029
7.799240.13%0.37%(-0.241)#9610.61%(-0.475)#17,268
8.799360.089%0.37%(-0.284)#1,0020.61%(-0.517)#17,960
9.799050.084%0.37%(-0.288)#1,0140.61%(-0.522)#18,039
10.799380.064%0.37%(-0.308)#1,0410.61%(-0.541)#18,391
11.799120.063%0.37%(-0.309)#1,0450.61%(-0.542)#18,418
12.799070.039%0.37%(-0.333)#1,0790.61%(-0.567)#18,826

Common Questions

What are the Top 10 Zip Codes with the Highest Percentage of Population Employed in Farming, Fishing & Forestry in El Paso, TX?
Top 10 Zip Codes with the Highest Percentage of Population Employed in Farming, Fishing & Forestry in El Paso, TX are:
#1
1.2%
#2
0.88%
#3
0.20%
#4
0.19%
#5
0.16%
#6
0.14%
#7
0.13%
#8
0.089%
#9
0.084%
#10
0.064%
What zip code has the Highest Percentage of Population Employed in Farming, Fishing & Forestry in El Paso, TX?
79901 has the Highest Percentage of Population Employed in Farming, Fishing & Forestry in El Paso, TX with 1.2%.
What is the Percentage of Population Employed in Farming, Fishing & Forestry in El Paso, TX?
Percentage of Population Employed in Farming, Fishing & Forestry in El Paso is 0.11%.
What is the Percentage of Population Employed in Farming, Fishing & Forestry in Texas?
Percentage of Population Employed in Farming, Fishing & Forestry in Texas is 0.37%.
What is the Percentage of Population Employed in Farming, Fishing & Forestry in the United States?
Percentage of Population Employed in Farming, Fishing & Forestry in the United States is 0.61%.