Zip Codes with the Highest Percentage of Population Employed in Farming, Fishing & Forestry in San Angelo, TX
RELATED REPORTS & OPTIONS
Farming, Fishing & Forestry
San Angelo
Compare Zip Codes
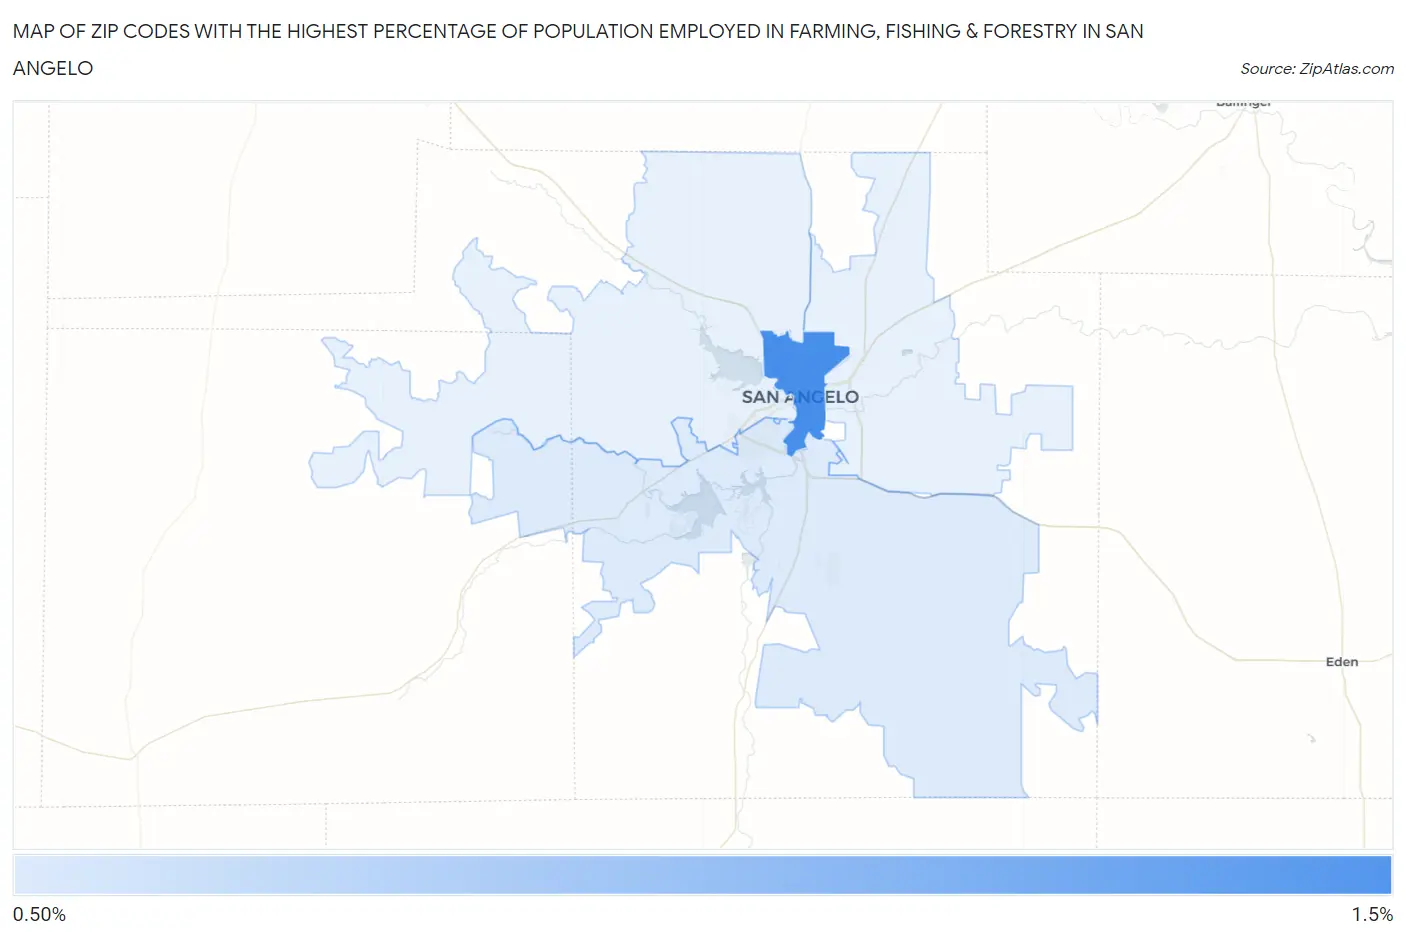
Map of Zip Codes with the Highest Percentage of Population Employed in Farming, Fishing & Forestry in San Angelo
0.73%
1.5%
Zip Codes with the Highest Percentage of Population Employed in Farming, Fishing & Forestry in San Angelo, TX
| Zip Code | % Employed | vs State | vs National | |
| 1. | 76903 | 1.5% | 0.37%(+1.08)#419 | 0.61%(+0.847)#8,024 |
| 2. | 76904 | 0.73% | 0.37%(+0.362)#590 | 0.61%(+0.128)#11,176 |
1
Common Questions
What are the Top 3 Zip Codes with the Highest Percentage of Population Employed in Farming, Fishing & Forestry in San Angelo, TX?
Top 3 Zip Codes with the Highest Percentage of Population Employed in Farming, Fishing & Forestry in San Angelo, TX are:
What zip code has the Highest Percentage of Population Employed in Farming, Fishing & Forestry in San Angelo, TX?
76903 has the Highest Percentage of Population Employed in Farming, Fishing & Forestry in San Angelo, TX with 1.5%.
What is the Percentage of Population Employed in Farming, Fishing & Forestry in San Angelo, TX?
Percentage of Population Employed in Farming, Fishing & Forestry in San Angelo is 0.48%.
What is the Percentage of Population Employed in Farming, Fishing & Forestry in Texas?
Percentage of Population Employed in Farming, Fishing & Forestry in Texas is 0.37%.
What is the Percentage of Population Employed in Farming, Fishing & Forestry in the United States?
Percentage of Population Employed in Farming, Fishing & Forestry in the United States is 0.61%.