Clarendon, TX Map & Demographics
Clarendon Map
Clarendon Overview
$20,057
PER CAPITA INCOME
$73,281
AVG FAMILY INCOME
$47,457
AVG HOUSEHOLD INCOME
13.2%
WAGE / INCOME GAP [ % ]
86.8¢/ $1
WAGE / INCOME GAP [ $ ]
0.39
INEQUALITY / GINI INDEX
1,730
TOTAL POPULATION
867
MALE POPULATION
863
FEMALE POPULATION
100.46
MALES / 100 FEMALES
99.54
FEMALES / 100 MALES
33.7
MEDIAN AGE
3.0
AVG FAMILY SIZE
2.2
AVG HOUSEHOLD SIZE
642
LABOR FORCE [ PEOPLE ]
46.1%
PERCENT IN LABOR FORCE
Clarendon Zip Codes
Clarendon Area Codes
Income in Clarendon
Income Overview in Clarendon
Per Capita Income in Clarendon is $20,057, while median incomes of families and households are $73,281 and $47,457 respectively.
| Characteristic | Number | Measure |
| Per Capita Income | 1,730 | $20,057 |
| Median Family Income | 331 | $73,281 |
| Mean Family Income | 331 | $73,097 |
| Median Household Income | 635 | $47,457 |
| Mean Household Income | 635 | $51,598 |
| Income Deficit | 331 | $0 |
| Wage / Income Gap (%) | 1,730 | 13.24% |
| Wage / Income Gap ($) | 1,730 | 86.76¢ per $1 |
| Gini / Inequality Index | 1,730 | 0.39 |
Earnings by Sex in Clarendon
Average Earnings in Clarendon are $25,833, $27,375 for men and $23,750 for women, a difference of 13.2%.
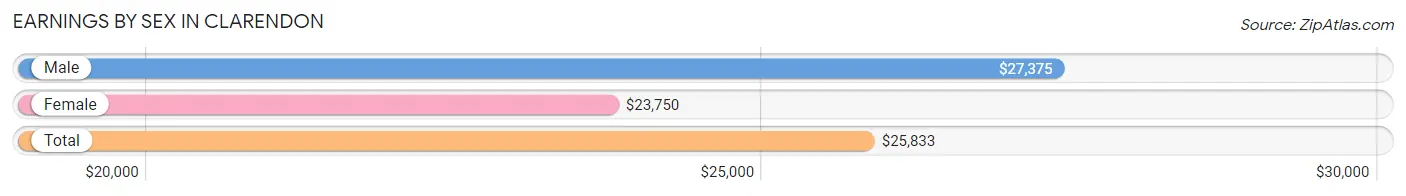
| Sex | Number | Average Earnings |
| Male | 444 (54.7%) | $27,375 |
| Female | 368 (45.3%) | $23,750 |
| Total | 812 (100.0%) | $25,833 |
Earnings by Sex by Income Bracket in Clarendon
The most common earnings brackets in Clarendon are $2,500 to $4,999 for men (59 | 13.3%) and $20,000 to $22,499 for women (53 | 14.4%).
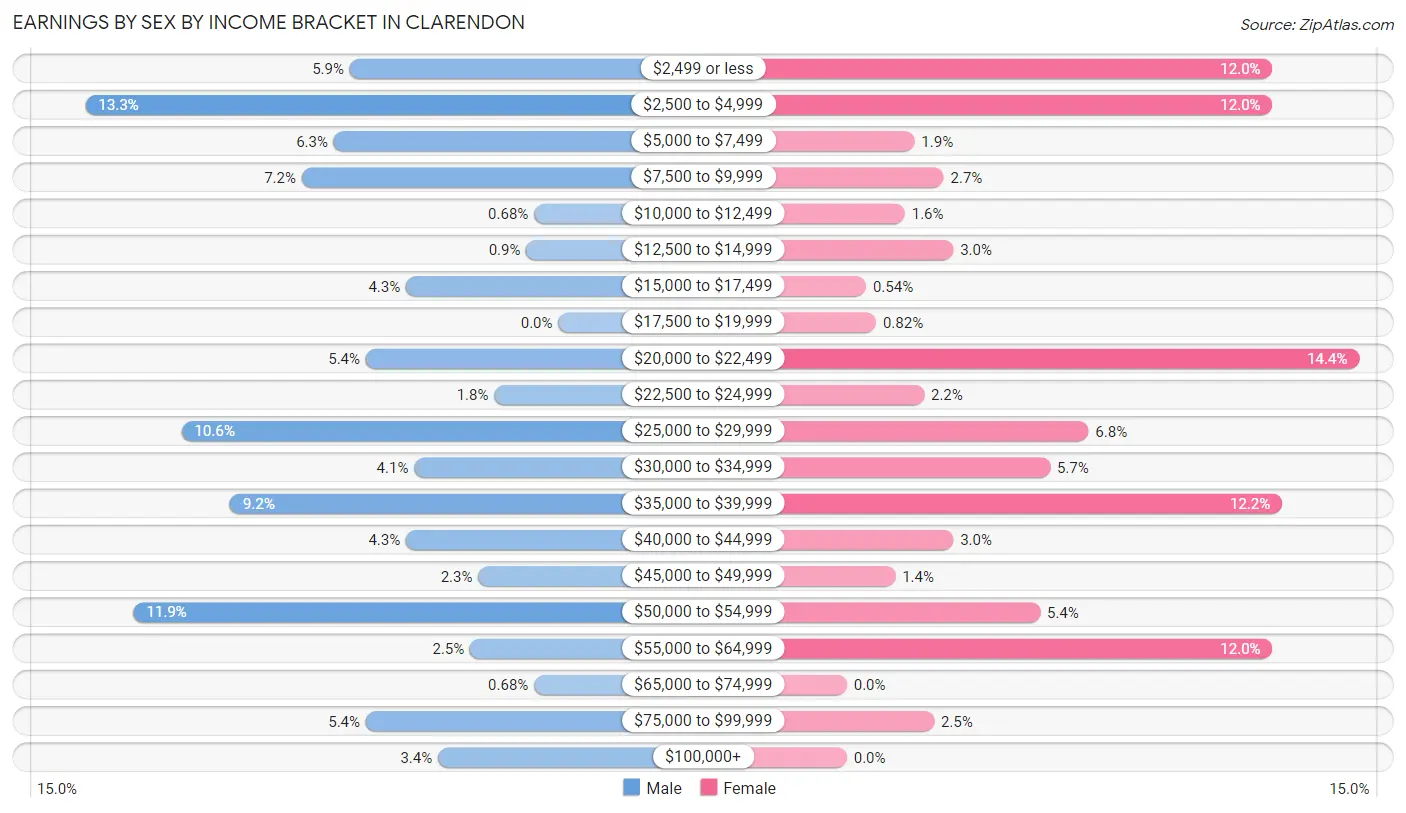
| Income | Male | Female |
| $2,499 or less | 26 (5.9%) | 44 (12.0%) |
| $2,500 to $4,999 | 59 (13.3%) | 44 (12.0%) |
| $5,000 to $7,499 | 28 (6.3%) | 7 (1.9%) |
| $7,500 to $9,999 | 32 (7.2%) | 10 (2.7%) |
| $10,000 to $12,499 | 3 (0.7%) | 6 (1.6%) |
| $12,500 to $14,999 | 4 (0.9%) | 11 (3.0%) |
| $15,000 to $17,499 | 19 (4.3%) | 2 (0.5%) |
| $17,500 to $19,999 | 0 (0.0%) | 3 (0.8%) |
| $20,000 to $22,499 | 24 (5.4%) | 53 (14.4%) |
| $22,500 to $24,999 | 8 (1.8%) | 8 (2.2%) |
| $25,000 to $29,999 | 47 (10.6%) | 25 (6.8%) |
| $30,000 to $34,999 | 18 (4.1%) | 21 (5.7%) |
| $35,000 to $39,999 | 41 (9.2%) | 45 (12.2%) |
| $40,000 to $44,999 | 19 (4.3%) | 11 (3.0%) |
| $45,000 to $49,999 | 10 (2.2%) | 5 (1.4%) |
| $50,000 to $54,999 | 53 (11.9%) | 20 (5.4%) |
| $55,000 to $64,999 | 11 (2.5%) | 44 (12.0%) |
| $65,000 to $74,999 | 3 (0.7%) | 0 (0.0%) |
| $75,000 to $99,999 | 24 (5.4%) | 9 (2.5%) |
| $100,000+ | 15 (3.4%) | 0 (0.0%) |
| Total | 444 (100.0%) | 368 (100.0%) |
Earnings by Sex by Educational Attainment in Clarendon
Average earnings in Clarendon are $37,365 for men and $33,355 for women, a difference of 10.7%. Men with an educational attainment of less than high school enjoy the highest average annual earnings of $50,547, while those with high school diploma education earn the least with $34,659. Women with an educational attainment of graduate degree earn the most with the average annual earnings of $54,500, while those with college or associate's degree education have the smallest earnings of $34,145.
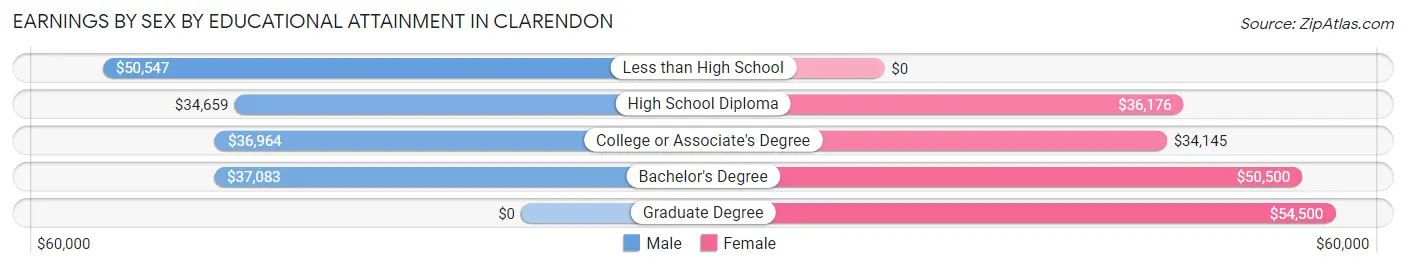
| Educational Attainment | Male Income | Female Income |
| Less than High School | $50,547 | $0 |
| High School Diploma | $34,659 | $36,176 |
| College or Associate's Degree | $36,964 | $34,145 |
| Bachelor's Degree | $37,083 | $50,500 |
| Graduate Degree | - | - |
| Total | $37,365 | $33,355 |
Family Income in Clarendon
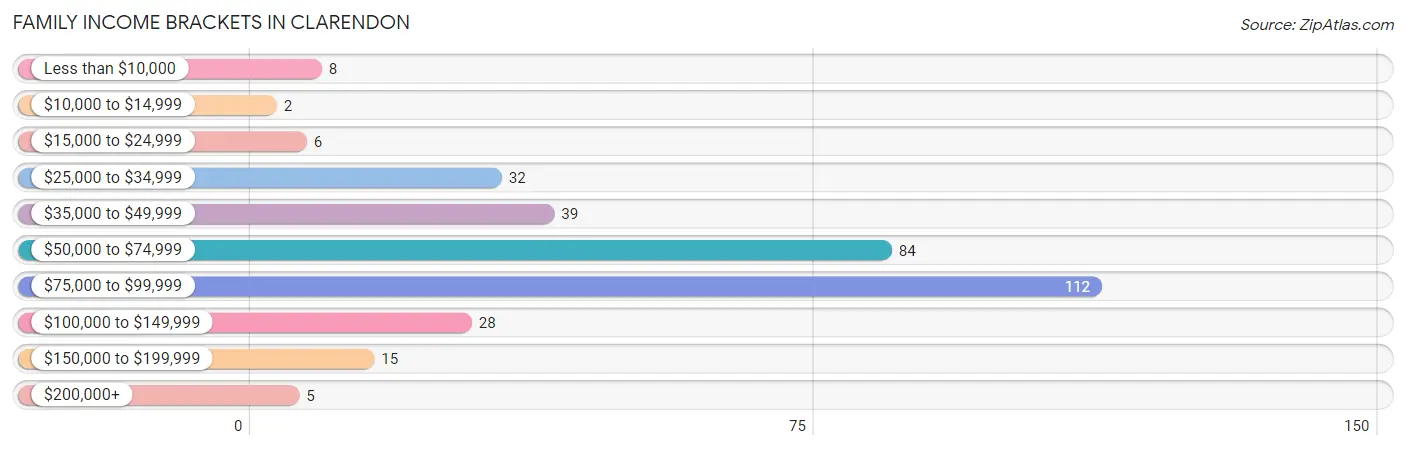
Family Income Brackets in Clarendon
According to the Clarendon family income data, there are 112 families falling into the $75,000 to $99,999 income range, which is the most common income bracket and makes up 33.8% of all families. Conversely, the $10,000 to $14,999 income bracket is the least frequent group with only 2 families (0.6%) belonging to this category.
| Income Bracket | # Families | % Families |
| Less than $10,000 | 8 | 2.4% |
| $10,000 to $14,999 | 2 | 0.6% |
| $15,000 to $24,999 | 6 | 1.8% |
| $25,000 to $34,999 | 32 | 9.7% |
| $35,000 to $49,999 | 39 | 11.8% |
| $50,000 to $74,999 | 84 | 25.4% |
| $75,000 to $99,999 | 112 | 33.8% |
| $100,000 to $149,999 | 28 | 8.5% |
| $150,000 to $199,999 | 15 | 4.5% |
| $200,000+ | 5 | 1.5% |
Family Income by Famaliy Size in Clarendon
2-person families (209 | 63.1%) account for the highest median family income in Clarendon with $75,176 per family, while 2-person families (209 | 63.1%) have the highest median income of $37,588 per family member.
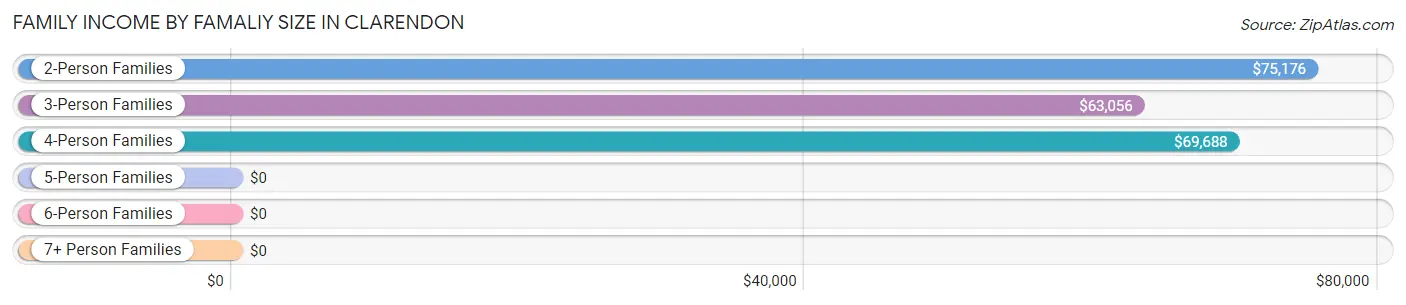
| Income Bracket | # Families | Median Income |
| 2-Person Families | 209 (63.1%) | $75,176 |
| 3-Person Families | 28 (8.5%) | $63,056 |
| 4-Person Families | 52 (15.7%) | $69,688 |
| 5-Person Families | 17 (5.1%) | $0 |
| 6-Person Families | 17 (5.1%) | $0 |
| 7+ Person Families | 8 (2.4%) | $0 |
| Total | 331 (100.0%) | $73,281 |
Family Income by Number of Earners in Clarendon
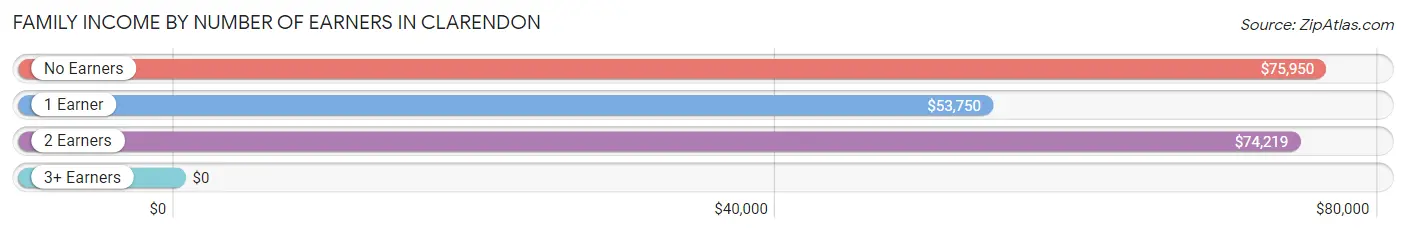
| Number of Earners | # Families | Median Income |
| No Earners | 76 (23.0%) | $75,950 |
| 1 Earner | 134 (40.5%) | $53,750 |
| 2 Earners | 109 (32.9%) | $74,219 |
| 3+ Earners | 12 (3.6%) | $0 |
| Total | 331 (100.0%) | $73,281 |
Household Income in Clarendon
Household Income Brackets in Clarendon
With 141 households falling in the category, the $50,000 to $74,999 income range is the most frequent in Clarendon, accounting for 22.2% of all households. In contrast, only 5 households (0.8%) fall into the $200,000+ income bracket, making it the least populous group.
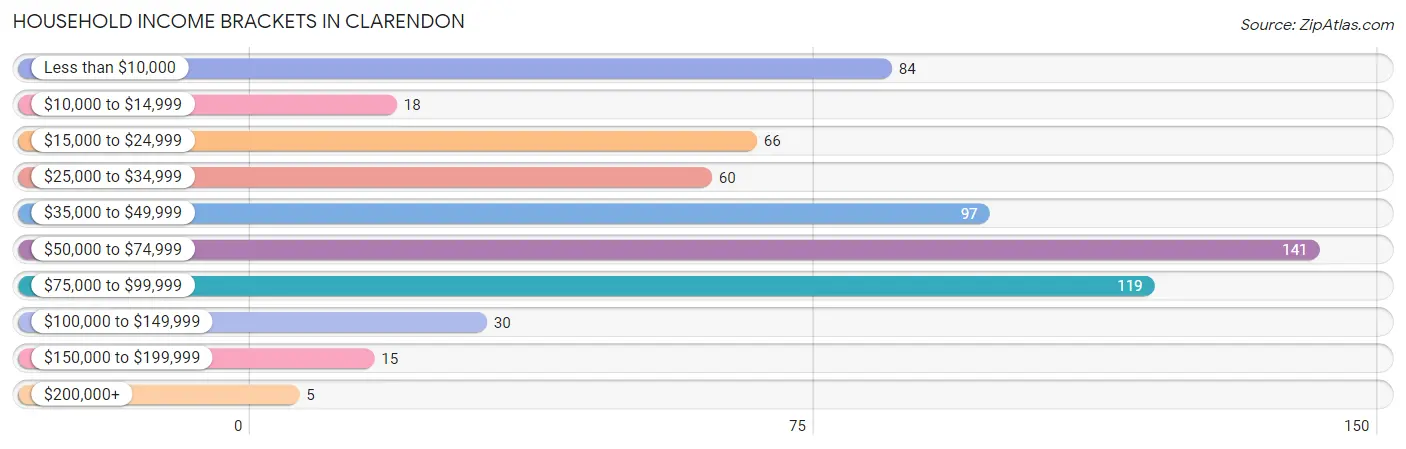
| Income Bracket | # Households | % Households |
| Less than $10,000 | 84 | 13.2% |
| $10,000 to $14,999 | 18 | 2.8% |
| $15,000 to $24,999 | 66 | 10.4% |
| $25,000 to $34,999 | 60 | 9.4% |
| $35,000 to $49,999 | 97 | 15.3% |
| $50,000 to $74,999 | 141 | 22.2% |
| $75,000 to $99,999 | 119 | 18.7% |
| $100,000 to $149,999 | 30 | 4.7% |
| $150,000 to $199,999 | 15 | 2.4% |
| $200,000+ | 5 | 0.8% |
Household Income by Householder Age in Clarendon
The median household income in Clarendon is $47,457, with the highest median household income of $53,929 found in the 25 to 44 years age bracket for the primary householder. A total of 170 households (26.8%) fall into this category. Meanwhile, the 15 to 24 years age bracket for the primary householder has the lowest median household income of $41,078, with 37 households (5.8%) in this group.
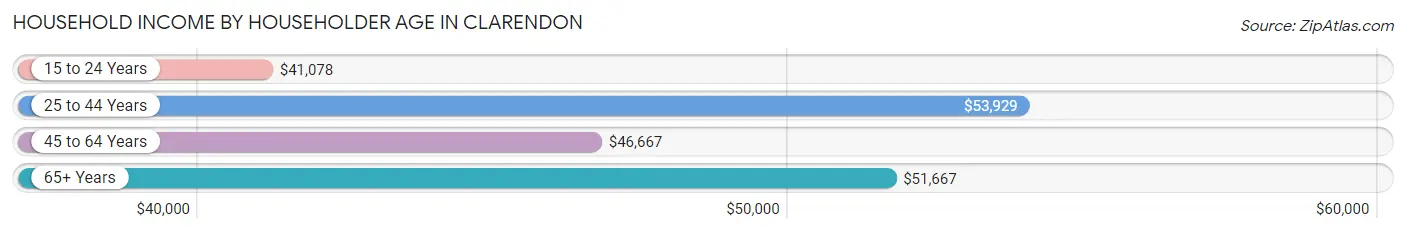
| Income Bracket | # Households | Median Income |
| 15 to 24 Years | 37 (5.8%) | $41,078 |
| 25 to 44 Years | 170 (26.8%) | $53,929 |
| 45 to 64 Years | 194 (30.5%) | $46,667 |
| 65+ Years | 234 (36.8%) | $51,667 |
| Total | 635 (100.0%) | $47,457 |
Poverty in Clarendon
Income Below Poverty by Sex and Age in Clarendon
With 7.7% poverty level for males and 21.3% for females among the residents of Clarendon, 65 to 74 year old males and 25 to 34 year old females are the most vulnerable to poverty, with 24 males (22.2%) and 53 females (58.2%) in their respective age groups living below the poverty level.
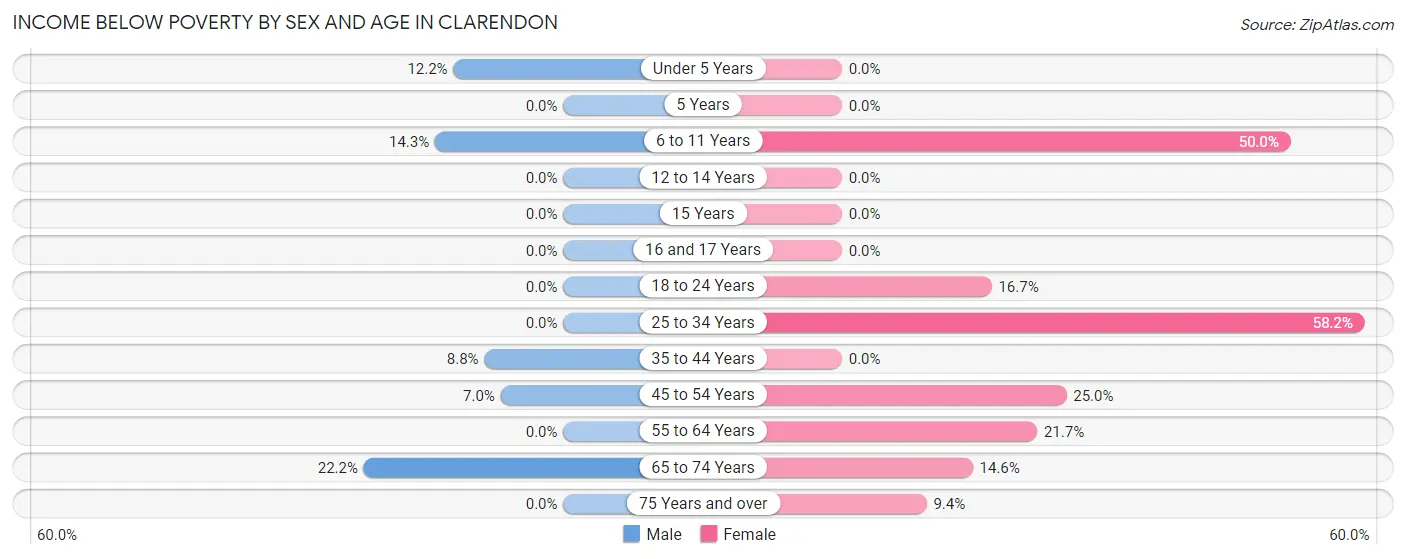
| Age Bracket | Male | Female |
| Under 5 Years | 6 (12.2%) | 0 (0.0%) |
| 5 Years | 0 (0.0%) | 0 (0.0%) |
| 6 to 11 Years | 13 (14.3%) | 39 (50.0%) |
| 12 to 14 Years | 0 (0.0%) | 0 (0.0%) |
| 15 Years | 0 (0.0%) | 0 (0.0%) |
| 16 and 17 Years | 0 (0.0%) | 0 (0.0%) |
| 18 to 24 Years | 0 (0.0%) | 3 (16.7%) |
| 25 to 34 Years | 0 (0.0%) | 53 (58.2%) |
| 35 to 44 Years | 8 (8.8%) | 0 (0.0%) |
| 45 to 54 Years | 3 (7.0%) | 18 (25.0%) |
| 55 to 64 Years | 0 (0.0%) | 10 (21.7%) |
| 65 to 74 Years | 24 (22.2%) | 22 (14.6%) |
| 75 Years and over | 0 (0.0%) | 5 (9.4%) |
| Total | 54 (7.7%) | 150 (21.3%) |
Income Above Poverty by Sex and Age in Clarendon
According to the poverty statistics in Clarendon, males aged 5 years and females aged under 5 years are the age groups that are most secure financially, with 100.0% of males and 100.0% of females in these age groups living above the poverty line.
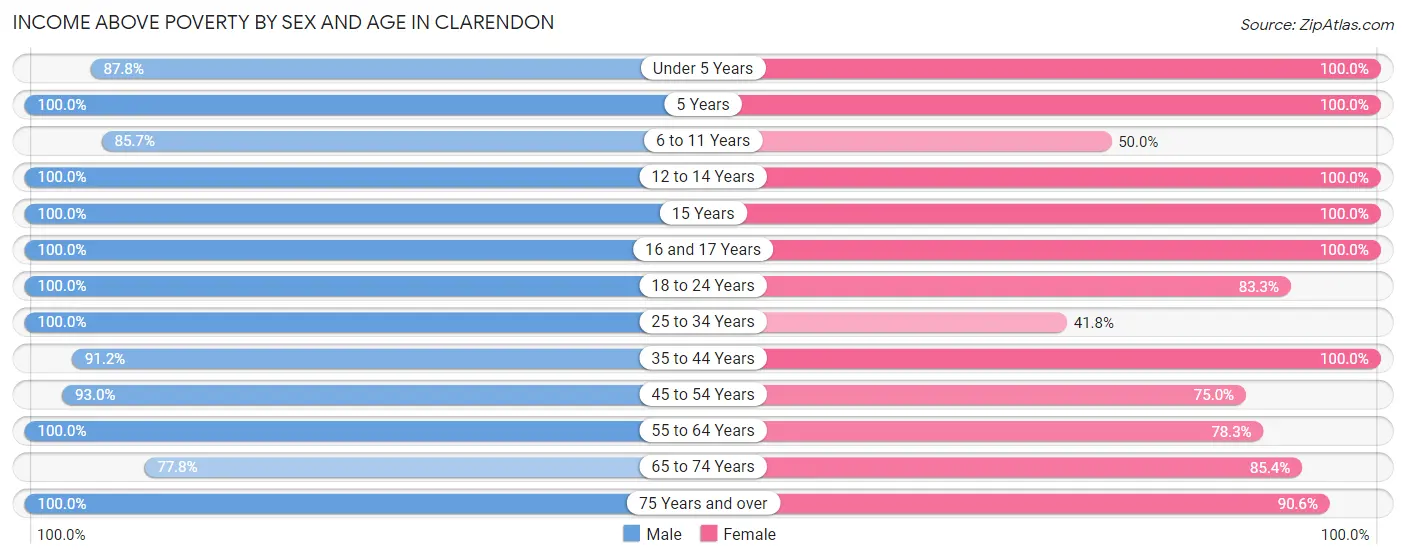
| Age Bracket | Male | Female |
| Under 5 Years | 43 (87.8%) | 14 (100.0%) |
| 5 Years | 1 (100.0%) | 21 (100.0%) |
| 6 to 11 Years | 78 (85.7%) | 39 (50.0%) |
| 12 to 14 Years | 19 (100.0%) | 29 (100.0%) |
| 15 Years | 26 (100.0%) | 9 (100.0%) |
| 16 and 17 Years | 9 (100.0%) | 19 (100.0%) |
| 18 to 24 Years | 98 (100.0%) | 15 (83.3%) |
| 25 to 34 Years | 29 (100.0%) | 38 (41.8%) |
| 35 to 44 Years | 83 (91.2%) | 102 (100.0%) |
| 45 to 54 Years | 40 (93.0%) | 54 (75.0%) |
| 55 to 64 Years | 105 (100.0%) | 36 (78.3%) |
| 65 to 74 Years | 84 (77.8%) | 129 (85.4%) |
| 75 Years and over | 36 (100.0%) | 48 (90.6%) |
| Total | 651 (92.3%) | 553 (78.7%) |
Income Below Poverty Among Married-Couple Families in Clarendon
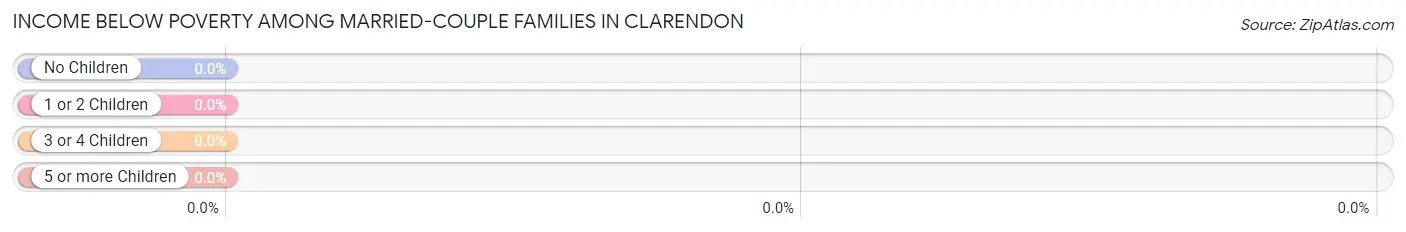
| Children | Above Poverty | Below Poverty |
| No Children | 158 (100.0%) | 0 (0.0%) |
| 1 or 2 Children | 52 (100.0%) | 0 (0.0%) |
| 3 or 4 Children | 16 (100.0%) | 0 (0.0%) |
| 5 or more Children | 8 (100.0%) | 0 (0.0%) |
| Total | 234 (100.0%) | 0 (0.0%) |
Income Below Poverty Among Single-Parent Households in Clarendon
According to the poverty data in Clarendon, 40.0% or 8 single-father households and 2.6% or 2 single-mother households are living below the poverty line. Among single-father households, those with 5 or more children have the highest poverty rate, with 8 households (100.0%) experiencing poverty. Likewise, among single-mother households, those with 1 or 2 children have the highest poverty rate, with 2 households (5.1%) falling below the poverty line.
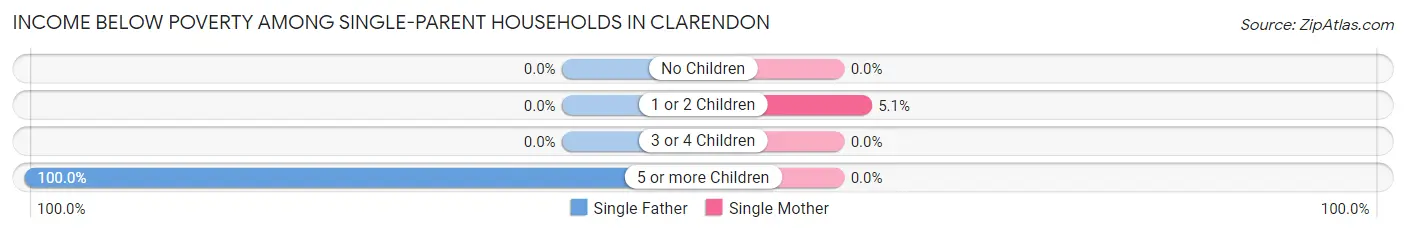
| Children | Single Father | Single Mother |
| No Children | 0 (0.0%) | 0 (0.0%) |
| 1 or 2 Children | 0 (0.0%) | 2 (5.1%) |
| 3 or 4 Children | 0 (0.0%) | 0 (0.0%) |
| 5 or more Children | 8 (100.0%) | 0 (0.0%) |
| Total | 8 (40.0%) | 2 (2.6%) |
Income Below Poverty Among Married-Couple vs Single-Parent Households in Clarendon
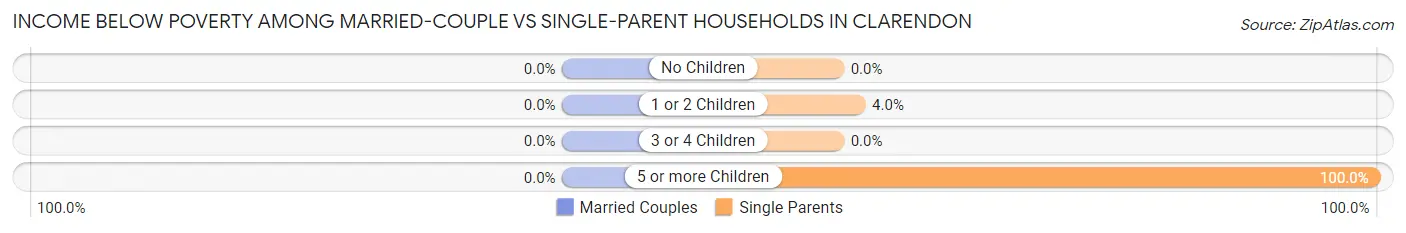
| Children | Married-Couple Families | Single-Parent Households |
| No Children | 0 (0.0%) | 0 (0.0%) |
| 1 or 2 Children | 0 (0.0%) | 2 (4.0%) |
| 3 or 4 Children | 0 (0.0%) | 0 (0.0%) |
| 5 or more Children | 0 (0.0%) | 8 (100.0%) |
| Total | 0 (0.0%) | 10 (10.3%) |
Race in Clarendon
The most populous races in Clarendon are White / Caucasian (1,369 | 79.1%), Black / African American (217 | 12.5%), and Hispanic or Latino (117 | 6.8%).
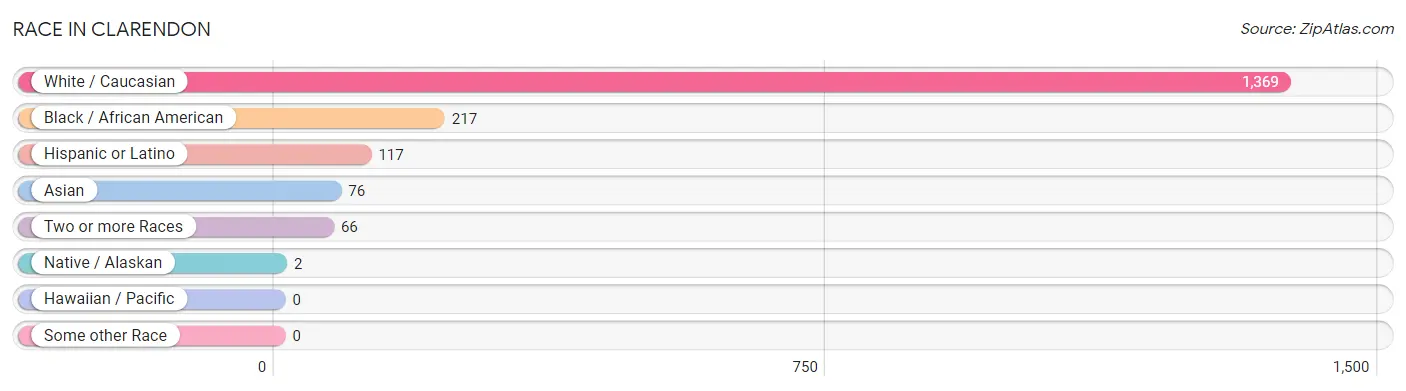
| Race | # Population | % Population |
| Asian | 76 | 4.4% |
| Black / African American | 217 | 12.5% |
| Hawaiian / Pacific | 0 | 0.0% |
| Hispanic or Latino | 117 | 6.8% |
| Native / Alaskan | 2 | 0.1% |
| White / Caucasian | 1,369 | 79.1% |
| Two or more Races | 66 | 3.8% |
| Some other Race | 0 | 0.0% |
| Total | 1,730 | 100.0% |
Ancestry in Clarendon
The most populous ancestries reported in Clarendon are German (243 | 14.1%), Irish (156 | 9.0%), English (123 | 7.1%), Mexican (115 | 6.7%), and Dutch (95 | 5.5%), together accounting for 42.3% of all Clarendon residents.
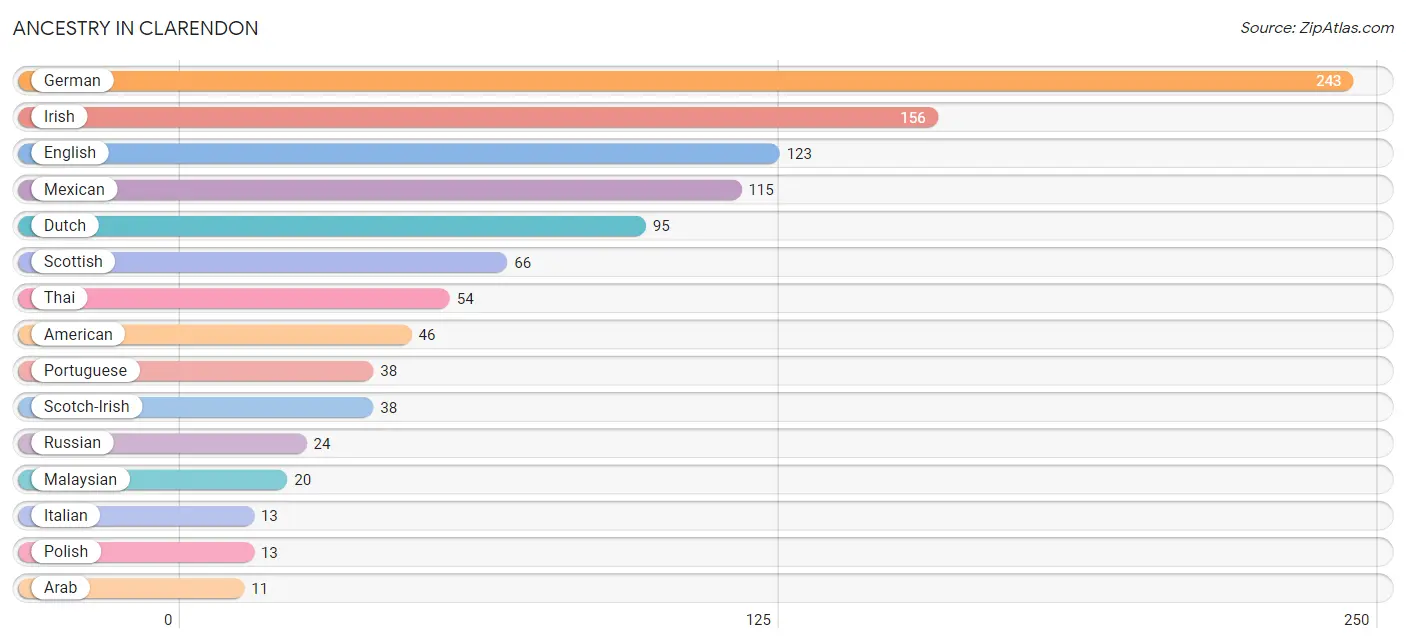
| Ancestry | # Population | % Population |
| African | 1 | 0.1% |
| American | 46 | 2.7% |
| Arab | 11 | 0.6% |
| Cajun | 3 | 0.2% |
| Central American | 1 | 0.1% |
| Central American Indian | 2 | 0.1% |
| Cherokee | 10 | 0.6% |
| Danish | 1 | 0.1% |
| Dutch | 95 | 5.5% |
| English | 123 | 7.1% |
| European | 11 | 0.6% |
| German | 243 | 14.1% |
| Irish | 156 | 9.0% |
| Italian | 13 | 0.7% |
| Korean | 2 | 0.1% |
| Lebanese | 11 | 0.6% |
| Macedonian | 1 | 0.1% |
| Malaysian | 20 | 1.2% |
| Mexican | 115 | 6.7% |
| Panamanian | 1 | 0.1% |
| Polish | 13 | 0.7% |
| Portuguese | 38 | 2.2% |
| Puerto Rican | 1 | 0.1% |
| Russian | 24 | 1.4% |
| Scotch-Irish | 38 | 2.2% |
| Scottish | 66 | 3.8% |
| Subsaharan African | 1 | 0.1% |
| Thai | 54 | 3.1% |
| West Indian | 1 | 0.1% |
| Yugoslavian | 3 | 0.2% | View All 30 Rows |
Immigrants in Clarendon
The most numerous immigrant groups reported in Clarendon came from Asia (50 | 2.9%), Central America (36 | 2.1%), Latin America (36 | 2.1%), Mexico (36 | 2.1%), and India (28 | 1.6%), together accounting for 10.7% of all Clarendon residents.
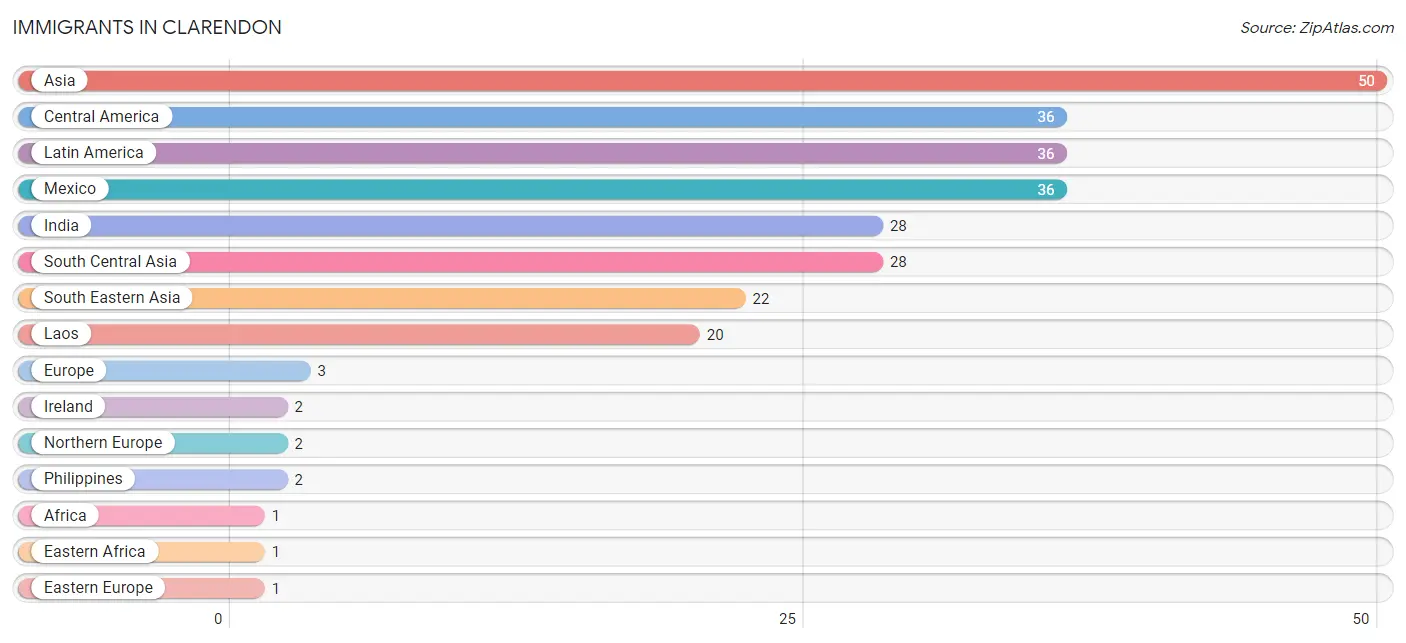
| Immigration Origin | # Population | % Population |
| Africa | 1 | 0.1% |
| Asia | 50 | 2.9% |
| Central America | 36 | 2.1% |
| Eastern Africa | 1 | 0.1% |
| Eastern Europe | 1 | 0.1% |
| Ethiopia | 1 | 0.1% |
| Europe | 3 | 0.2% |
| India | 28 | 1.6% |
| Ireland | 2 | 0.1% |
| Laos | 20 | 1.2% |
| Latin America | 36 | 2.1% |
| Mexico | 36 | 2.1% |
| North Macedonia | 1 | 0.1% |
| Northern Europe | 2 | 0.1% |
| Philippines | 2 | 0.1% |
| South Central Asia | 28 | 1.6% |
| South Eastern Asia | 22 | 1.3% | View All 17 Rows |
Sex and Age in Clarendon
Sex and Age in Clarendon
The most populous age groups in Clarendon are 15 to 19 Years (219 | 25.3%) for men and 10 to 14 Years (87 | 10.1%) for women.
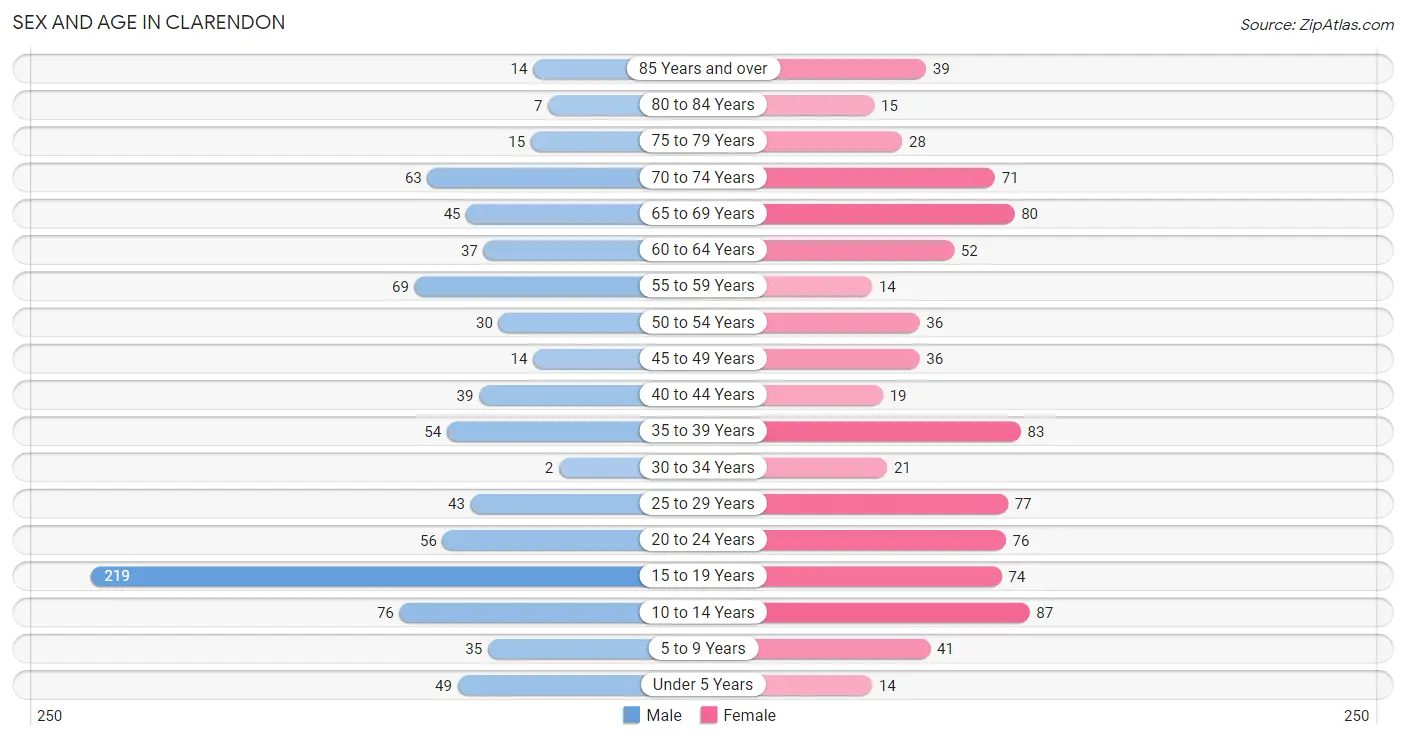
| Age Bracket | Male | Female |
| Under 5 Years | 49 (5.7%) | 14 (1.6%) |
| 5 to 9 Years | 35 (4.0%) | 41 (4.8%) |
| 10 to 14 Years | 76 (8.8%) | 87 (10.1%) |
| 15 to 19 Years | 219 (25.3%) | 74 (8.6%) |
| 20 to 24 Years | 56 (6.5%) | 76 (8.8%) |
| 25 to 29 Years | 43 (5.0%) | 77 (8.9%) |
| 30 to 34 Years | 2 (0.2%) | 21 (2.4%) |
| 35 to 39 Years | 54 (6.2%) | 83 (9.6%) |
| 40 to 44 Years | 39 (4.5%) | 19 (2.2%) |
| 45 to 49 Years | 14 (1.6%) | 36 (4.2%) |
| 50 to 54 Years | 30 (3.5%) | 36 (4.2%) |
| 55 to 59 Years | 69 (8.0%) | 14 (1.6%) |
| 60 to 64 Years | 37 (4.3%) | 52 (6.0%) |
| 65 to 69 Years | 45 (5.2%) | 80 (9.3%) |
| 70 to 74 Years | 63 (7.3%) | 71 (8.2%) |
| 75 to 79 Years | 15 (1.7%) | 28 (3.2%) |
| 80 to 84 Years | 7 (0.8%) | 15 (1.7%) |
| 85 Years and over | 14 (1.6%) | 39 (4.5%) |
| Total | 867 (100.0%) | 863 (100.0%) |
Families and Households in Clarendon
Median Family Size in Clarendon
The median family size in Clarendon is 3.05 persons per family, with single male/father families (20 | 6.0%) accounting for the largest median family size of 5.5 persons per family. On the other hand, married-couple families (234 | 70.7%) represent the smallest median family size with 2.89 persons per family.
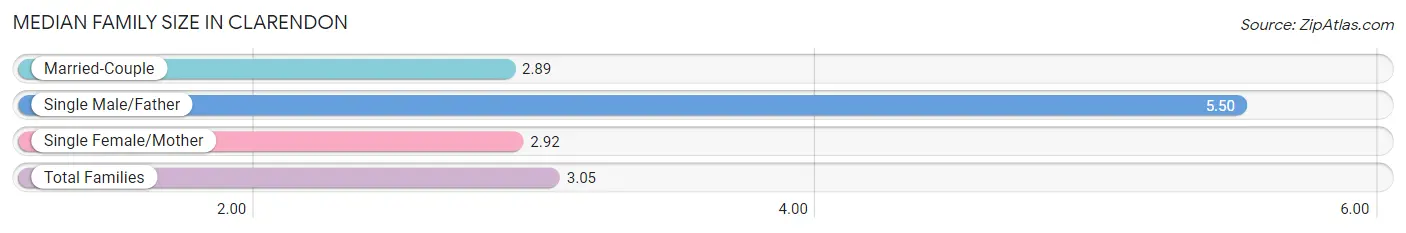
| Family Type | # Families | Family Size |
| Married-Couple | 234 (70.7%) | 2.89 |
| Single Male/Father | 20 (6.0%) | 5.50 |
| Single Female/Mother | 77 (23.3%) | 2.92 |
| Total Families | 331 (100.0%) | 3.05 |
Median Household Size in Clarendon
The median household size in Clarendon is 2.20 persons per household, with single male/father households (20 | 3.2%) accounting for the largest median household size of 6.35 persons per household. non-family households (304 | 47.9%) represent the smallest median household size with 1.22 persons per household.
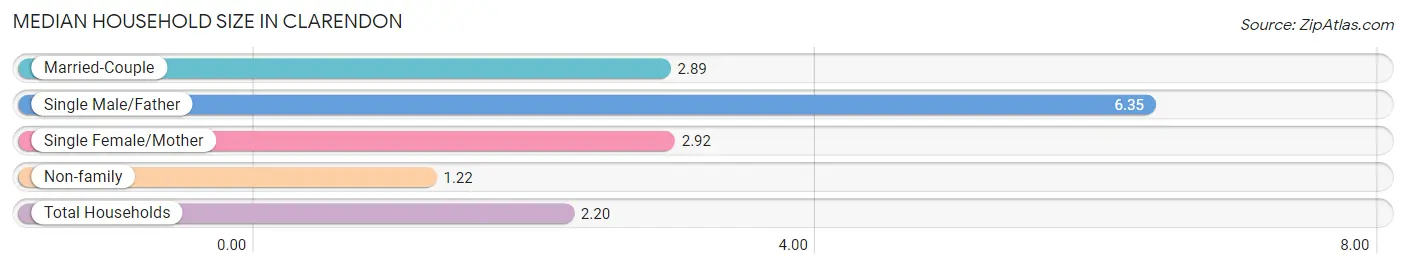
| Household Type | # Households | Household Size |
| Married-Couple | 234 (36.8%) | 2.89 |
| Single Male/Father | 20 (3.2%) | 6.35 |
| Single Female/Mother | 77 (12.1%) | 2.92 |
| Non-family | 304 (47.9%) | 1.22 |
| Total Households | 635 (100.0%) | 2.20 |
Household Size by Marriage Status in Clarendon
Out of a total of 635 households in Clarendon, 331 (52.1%) are family households, while 304 (47.9%) are nonfamily households. The most numerous type of family households are 2-person households, comprising 209, and the most common type of nonfamily households are 1-person households, comprising 264.
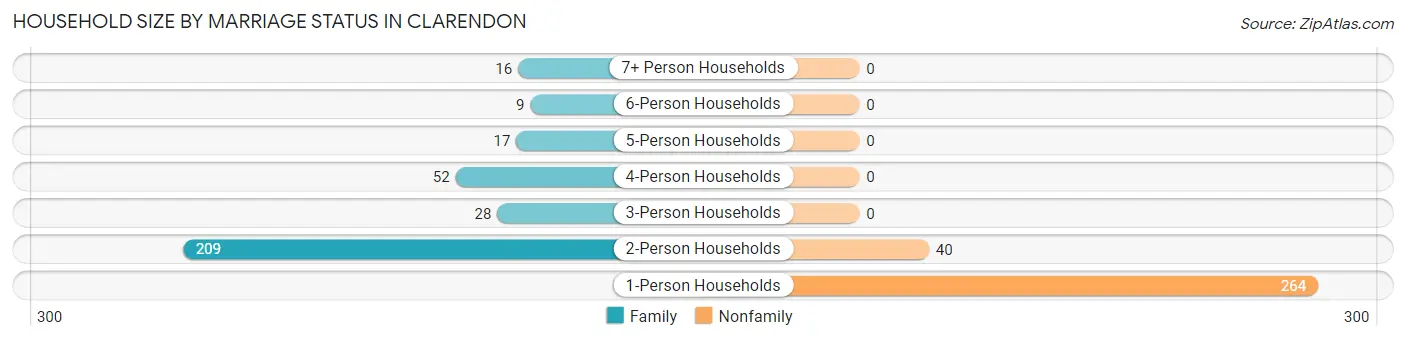
| Household Size | Family Households | Nonfamily Households |
| 1-Person Households | - | 264 (41.6%) |
| 2-Person Households | 209 (32.9%) | 40 (6.3%) |
| 3-Person Households | 28 (4.4%) | 0 (0.0%) |
| 4-Person Households | 52 (8.2%) | 0 (0.0%) |
| 5-Person Households | 17 (2.7%) | 0 (0.0%) |
| 6-Person Households | 9 (1.4%) | 0 (0.0%) |
| 7+ Person Households | 16 (2.5%) | 0 (0.0%) |
| Total | 331 (52.1%) | 304 (47.9%) |
Female Fertility in Clarendon
Fertility by Age in Clarendon
Average fertility rate in Clarendon is 30.0 births per 1,000 women. Women in the age bracket of 35 to 50 years have the highest fertility rate with 55.0 births per 1,000 women. Women in the age bracket of 35 to 50 years acount for 66.7% of all women with births.
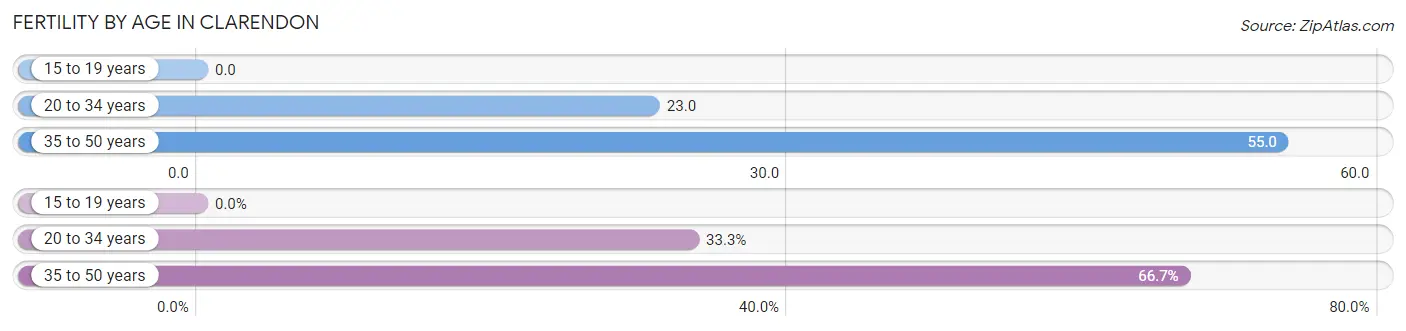
| Age Bracket | Women with Births | Births / 1,000 Women |
| 15 to 19 years | 0 (0.0%) | 0.0 |
| 20 to 34 years | 4 (33.3%) | 23.0 |
| 35 to 50 years | 8 (66.7%) | 55.0 |
| Total | 12 (100.0%) | 30.0 |
Fertility by Age by Marriage Status in Clarendon
83.3% of women with births (12) in Clarendon are married. The highest percentage of unmarried women with births falls into 20 to 34 years age bracket with 50.0% of them unmarried at the time of birth, while the lowest percentage of unmarried women with births belong to 35 to 50 years age bracket with 0.0% of them unmarried.
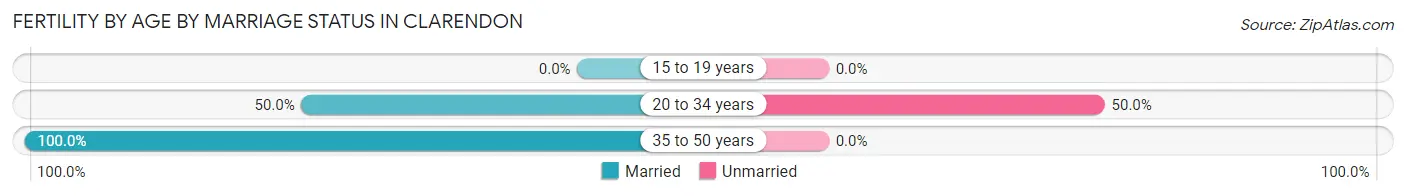
| Age Bracket | Married | Unmarried |
| 15 to 19 years | 0 (0.0%) | 0 (0.0%) |
| 20 to 34 years | 2 (50.0%) | 2 (50.0%) |
| 35 to 50 years | 8 (100.0%) | 0 (0.0%) |
| Total | 10 (83.3%) | 2 (16.7%) |
Fertility by Education in Clarendon
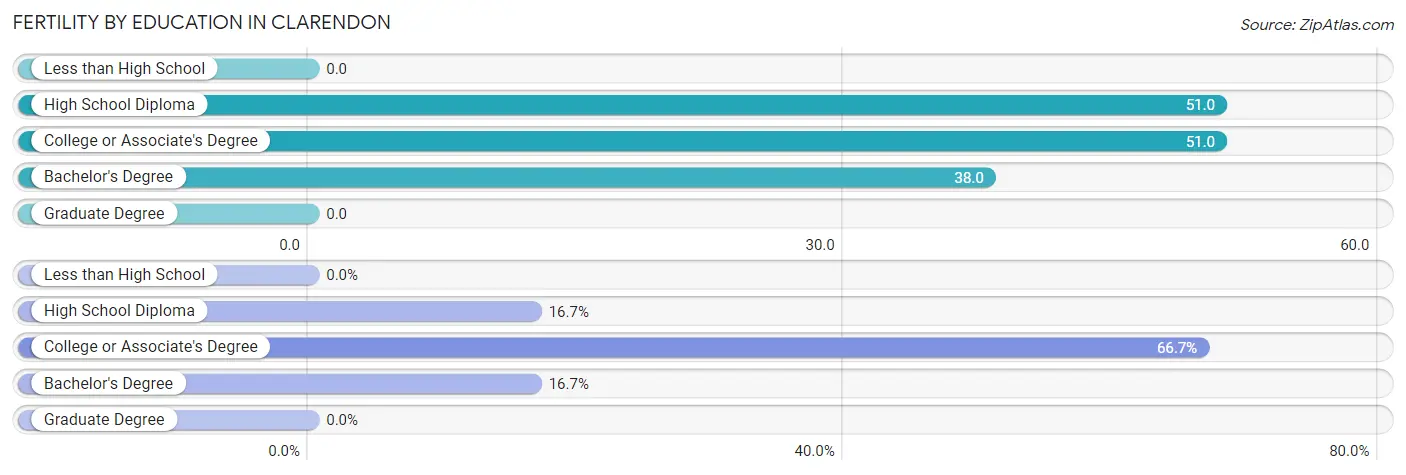
| Educational Attainment | Women with Births | Births / 1,000 Women |
| Less than High School | 0 (0.0%) | 0.0 |
| High School Diploma | 2 (16.7%) | 51.0 |
| College or Associate's Degree | 8 (66.7%) | 51.0 |
| Bachelor's Degree | 2 (16.7%) | 38.0 |
| Graduate Degree | 0 (0.0%) | 0.0 |
| Total | 12 (100.0%) | 30.0 |
Fertility by Education by Marriage Status in Clarendon
16.7% of women with births in Clarendon are unmarried. Women with the educational attainment of college or associate's degree are most likely to be married with 100.0% of them married at childbirth, while women with the educational attainment of high school diploma are least likely to be married with 100.0% of them unmarried at childbirth.
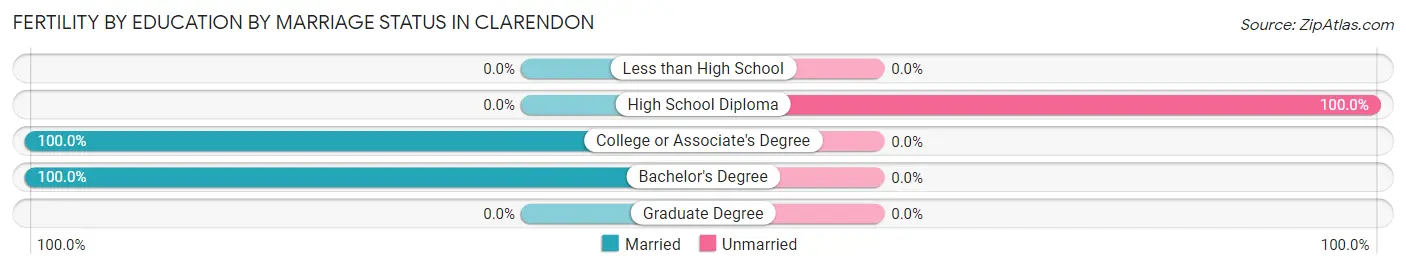
| Educational Attainment | Married | Unmarried |
| Less than High School | 0 (0.0%) | 0 (0.0%) |
| High School Diploma | 0 (0.0%) | 2 (100.0%) |
| College or Associate's Degree | 8 (100.0%) | 0 (0.0%) |
| Bachelor's Degree | 2 (100.0%) | 0 (0.0%) |
| Graduate Degree | 0 (0.0%) | 0 (0.0%) |
| Total | 10 (83.3%) | 2 (16.7%) |
Employment Characteristics in Clarendon
Employment by Class of Employer in Clarendon
Among the 640 employed individuals in Clarendon, private company employees (378 | 59.1%), state government employees (83 | 13.0%), and self-employed (not incorporated) (69 | 10.8%) make up the most common classes of employment.
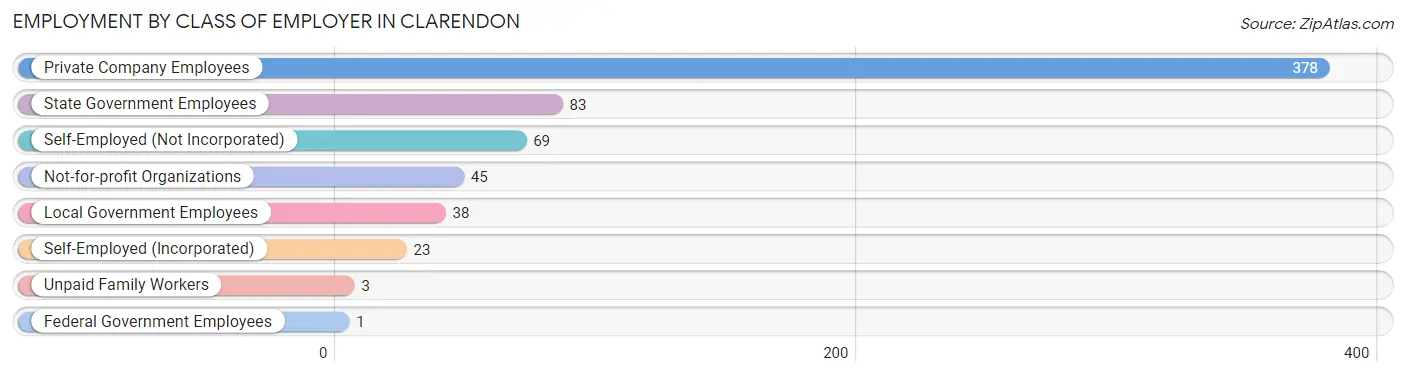
| Employer Class | # Employees | % Employees |
| Private Company Employees | 378 | 59.1% |
| Self-Employed (Incorporated) | 23 | 3.6% |
| Self-Employed (Not Incorporated) | 69 | 10.8% |
| Not-for-profit Organizations | 45 | 7.0% |
| Local Government Employees | 38 | 5.9% |
| State Government Employees | 83 | 13.0% |
| Federal Government Employees | 1 | 0.2% |
| Unpaid Family Workers | 3 | 0.5% |
| Total | 640 | 100.0% |
Employment Status by Age in Clarendon
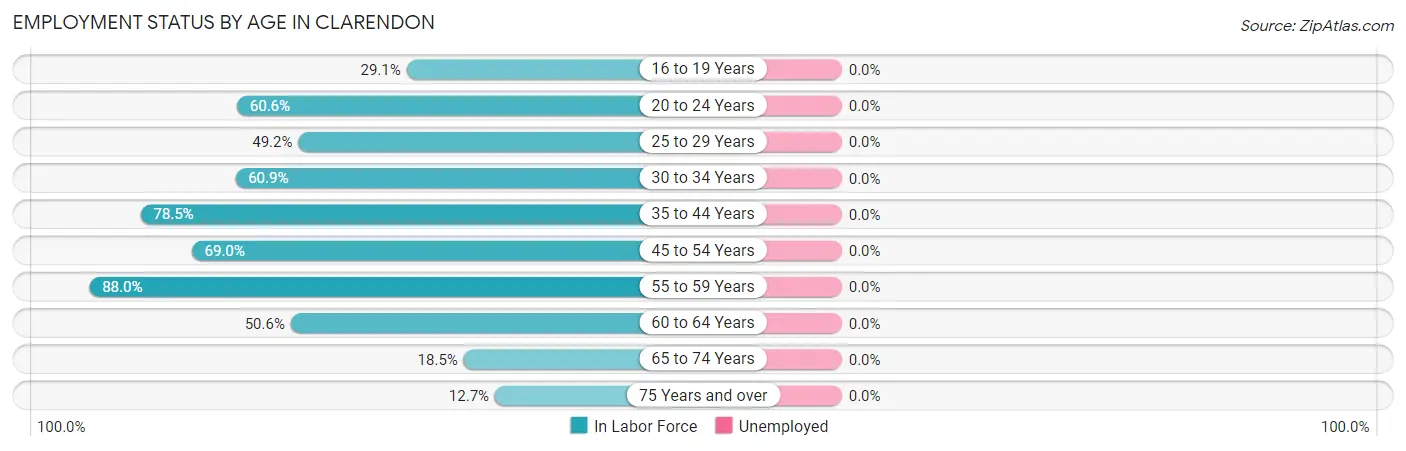
| Age Bracket | In Labor Force | Unemployed |
| 16 to 19 Years | 75 (29.1%) | 0 (0.0%) |
| 20 to 24 Years | 80 (60.6%) | 0 (0.0%) |
| 25 to 29 Years | 59 (49.2%) | 0 (0.0%) |
| 30 to 34 Years | 14 (60.9%) | 0 (0.0%) |
| 35 to 44 Years | 153 (78.5%) | 0 (0.0%) |
| 45 to 54 Years | 80 (69.0%) | 0 (0.0%) |
| 55 to 59 Years | 73 (88.0%) | 0 (0.0%) |
| 60 to 64 Years | 45 (50.6%) | 0 (0.0%) |
| 65 to 74 Years | 48 (18.5%) | 0 (0.0%) |
| 75 Years and over | 15 (12.7%) | 0 (0.0%) |
| Total | 642 (46.1%) | 0 (0.0%) |
Employment Status by Educational Attainment in Clarendon
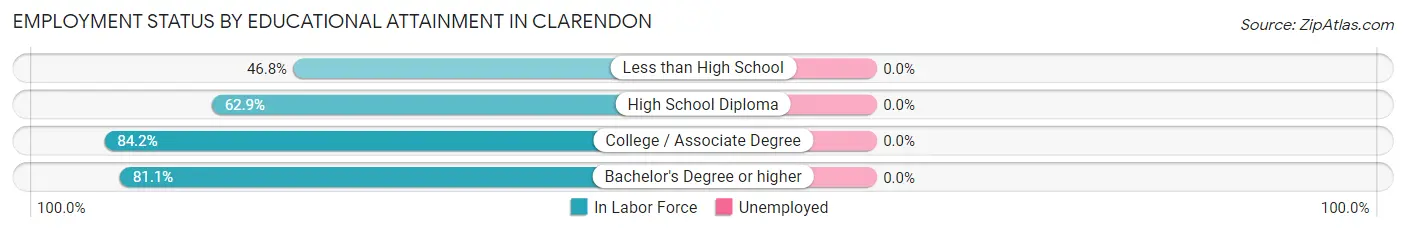
| Educational Attainment | In Labor Force | Unemployed |
| Less than High School | 74 (46.8%) | 0 (0.0%) |
| High School Diploma | 122 (62.9%) | 0 (0.0%) |
| College / Associate Degree | 155 (84.2%) | 0 (0.0%) |
| Bachelor's Degree or higher | 73 (81.1%) | 0 (0.0%) |
| Total | 424 (67.7%) | 0 (0.0%) |
Employment Occupations by Sex in Clarendon
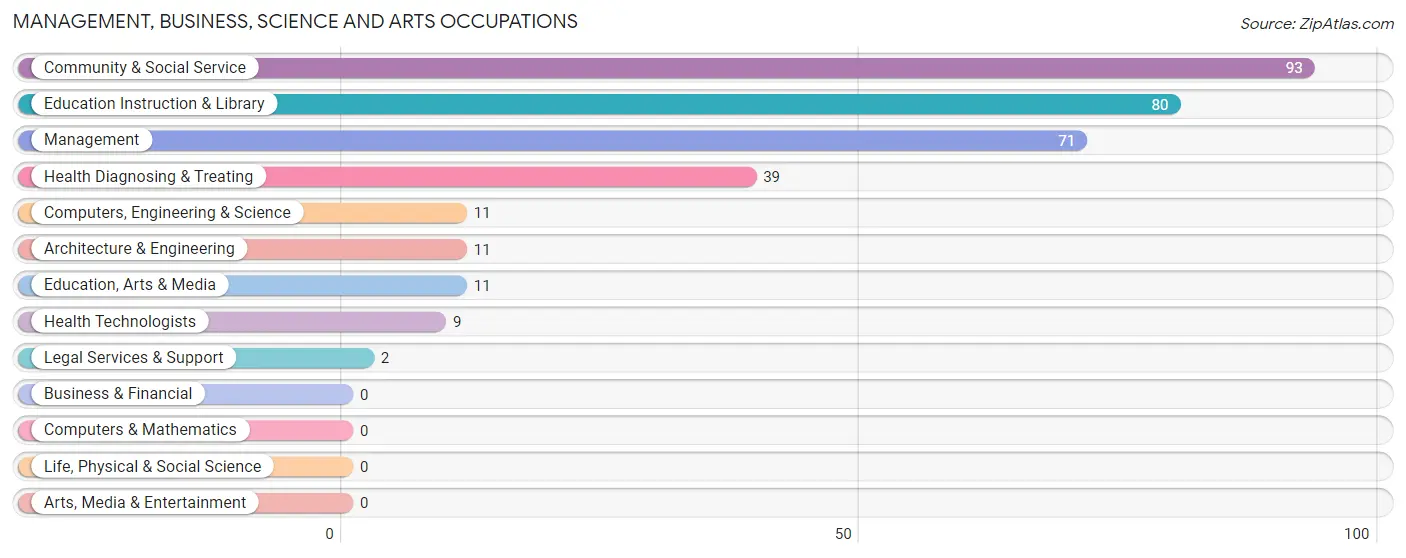
Management, Business, Science and Arts Occupations
The most common Management, Business, Science and Arts occupations in Clarendon are Community & Social Service (93 | 14.5%), Education Instruction & Library (80 | 12.5%), Management (71 | 11.1%), Health Diagnosing & Treating (39 | 6.1%), and Computers, Engineering & Science (11 | 1.7%).
Management, Business, Science and Arts Occupations by Sex
Within the Management, Business, Science and Arts occupations in Clarendon, the most male-oriented occupations are Computers, Engineering & Science (100.0%), Architecture & Engineering (100.0%), and Management (67.6%), while the most female-oriented occupations are Education, Arts & Media (100.0%), Legal Services & Support (100.0%), and Health Technologists (100.0%).
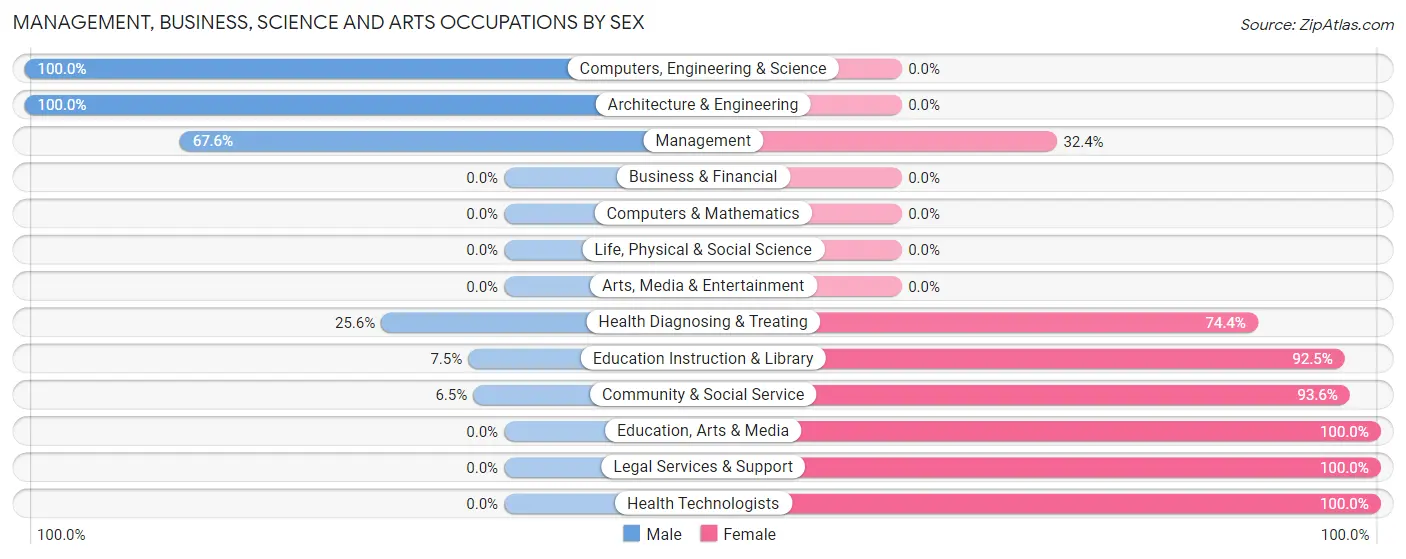
| Occupation | Male | Female |
| Management | 48 (67.6%) | 23 (32.4%) |
| Business & Financial | 0 (0.0%) | 0 (0.0%) |
| Computers, Engineering & Science | 11 (100.0%) | 0 (0.0%) |
| Computers & Mathematics | 0 (0.0%) | 0 (0.0%) |
| Architecture & Engineering | 11 (100.0%) | 0 (0.0%) |
| Life, Physical & Social Science | 0 (0.0%) | 0 (0.0%) |
| Community & Social Service | 6 (6.5%) | 87 (93.5%) |
| Education, Arts & Media | 0 (0.0%) | 11 (100.0%) |
| Legal Services & Support | 0 (0.0%) | 2 (100.0%) |
| Education Instruction & Library | 6 (7.5%) | 74 (92.5%) |
| Arts, Media & Entertainment | 0 (0.0%) | 0 (0.0%) |
| Health Diagnosing & Treating | 10 (25.6%) | 29 (74.4%) |
| Health Technologists | 0 (0.0%) | 9 (100.0%) |
| Total (Category) | 75 (35.0%) | 139 (64.9%) |
| Total (Overall) | 348 (54.2%) | 294 (45.8%) |
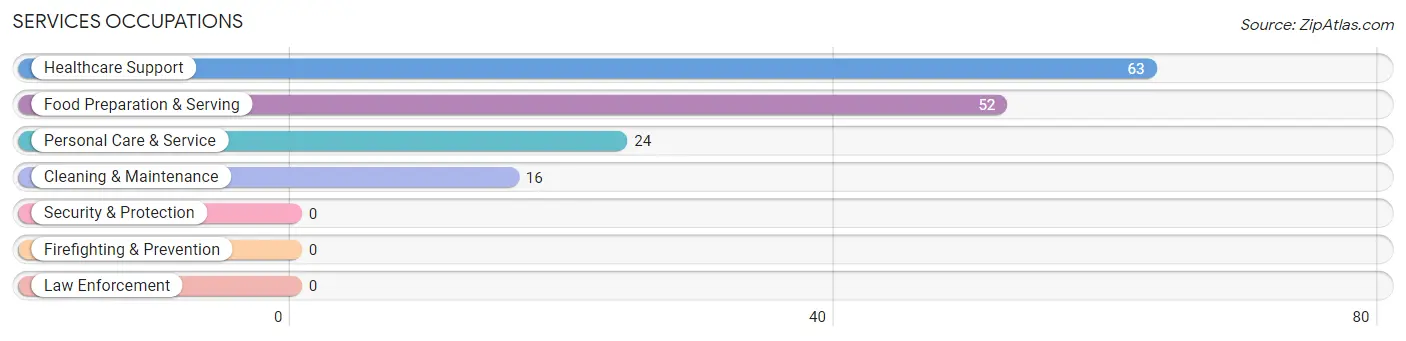
Services Occupations
The most common Services occupations in Clarendon are Healthcare Support (63 | 9.8%), Food Preparation & Serving (52 | 8.1%), Personal Care & Service (24 | 3.7%), and Cleaning & Maintenance (16 | 2.5%).
Services Occupations by Sex
Within the Services occupations in Clarendon, the most male-oriented occupations are Cleaning & Maintenance (68.8%), Food Preparation & Serving (53.8%), and Healthcare Support (42.9%), while the most female-oriented occupations are Personal Care & Service (62.5%), Healthcare Support (57.1%), and Food Preparation & Serving (46.2%).
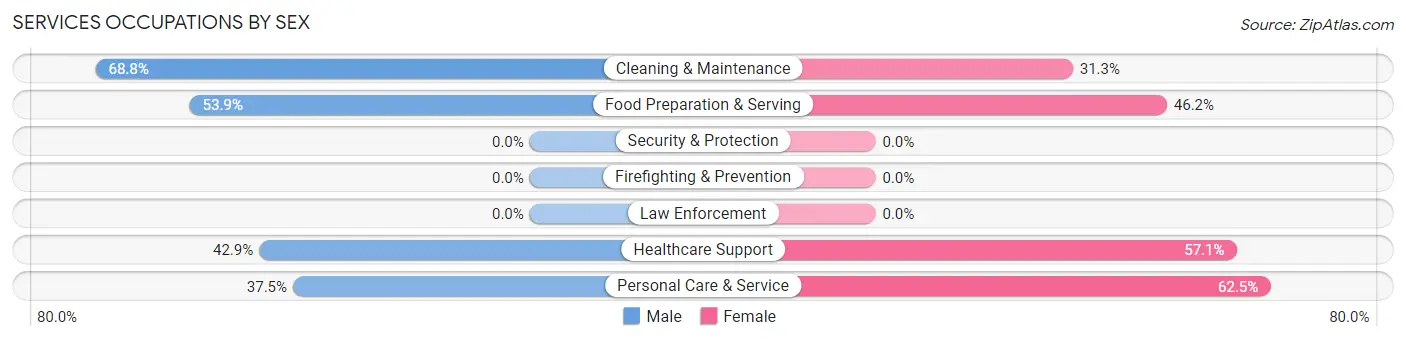
| Occupation | Male | Female |
| Healthcare Support | 27 (42.9%) | 36 (57.1%) |
| Security & Protection | 0 (0.0%) | 0 (0.0%) |
| Firefighting & Prevention | 0 (0.0%) | 0 (0.0%) |
| Law Enforcement | 0 (0.0%) | 0 (0.0%) |
| Food Preparation & Serving | 28 (53.8%) | 24 (46.2%) |
| Cleaning & Maintenance | 11 (68.8%) | 5 (31.2%) |
| Personal Care & Service | 9 (37.5%) | 15 (62.5%) |
| Total (Category) | 75 (48.4%) | 80 (51.6%) |
| Total (Overall) | 348 (54.2%) | 294 (45.8%) |
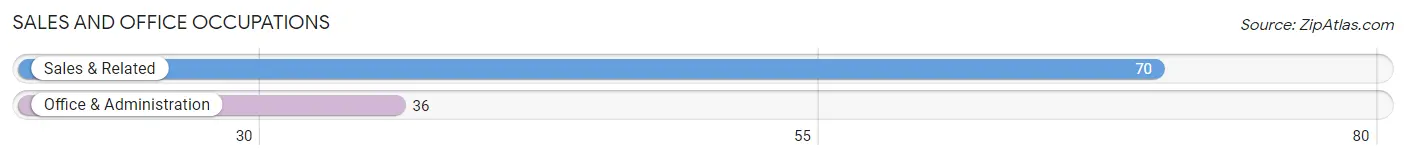
Sales and Office Occupations
The most common Sales and Office occupations in Clarendon are Sales & Related (70 | 10.9%), and Office & Administration (36 | 5.6%).
Sales and Office Occupations by Sex
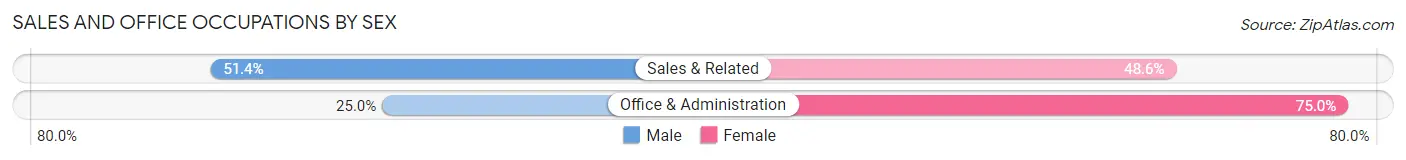
| Occupation | Male | Female |
| Sales & Related | 36 (51.4%) | 34 (48.6%) |
| Office & Administration | 9 (25.0%) | 27 (75.0%) |
| Total (Category) | 45 (42.4%) | 61 (57.6%) |
| Total (Overall) | 348 (54.2%) | 294 (45.8%) |
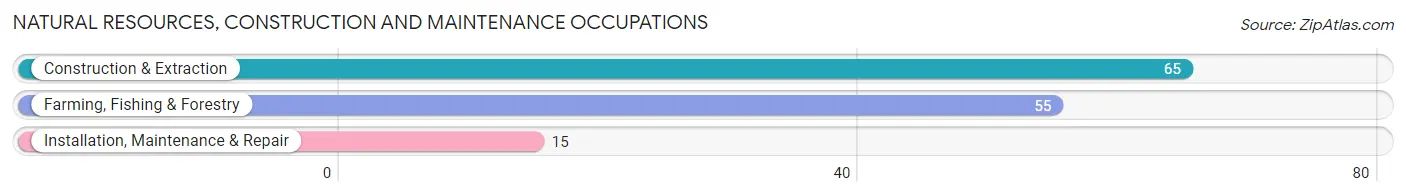
Natural Resources, Construction and Maintenance Occupations
The most common Natural Resources, Construction and Maintenance occupations in Clarendon are Construction & Extraction (65 | 10.1%), Farming, Fishing & Forestry (55 | 8.6%), and Installation, Maintenance & Repair (15 | 2.3%).
Natural Resources, Construction and Maintenance Occupations by Sex
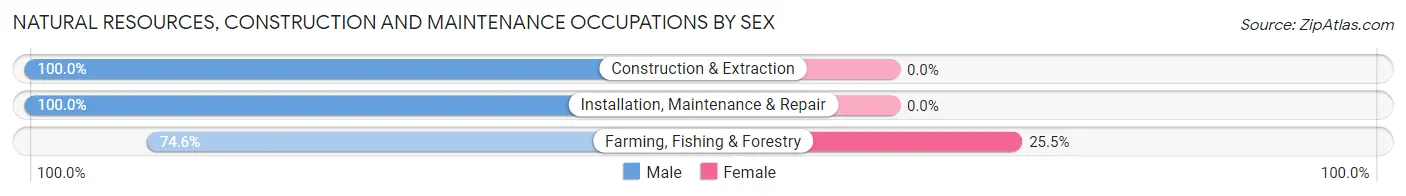
| Occupation | Male | Female |
| Farming, Fishing & Forestry | 41 (74.6%) | 14 (25.5%) |
| Construction & Extraction | 65 (100.0%) | 0 (0.0%) |
| Installation, Maintenance & Repair | 15 (100.0%) | 0 (0.0%) |
| Total (Category) | 121 (89.6%) | 14 (10.4%) |
| Total (Overall) | 348 (54.2%) | 294 (45.8%) |
Production, Transportation and Moving Occupations
The most common Production, Transportation and Moving occupations in Clarendon are Production (16 | 2.5%), Transportation (8 | 1.3%), and Material Moving (8 | 1.3%).
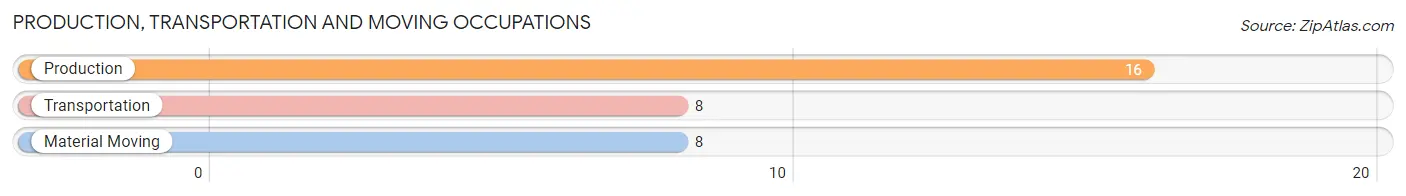
Production, Transportation and Moving Occupations by Sex
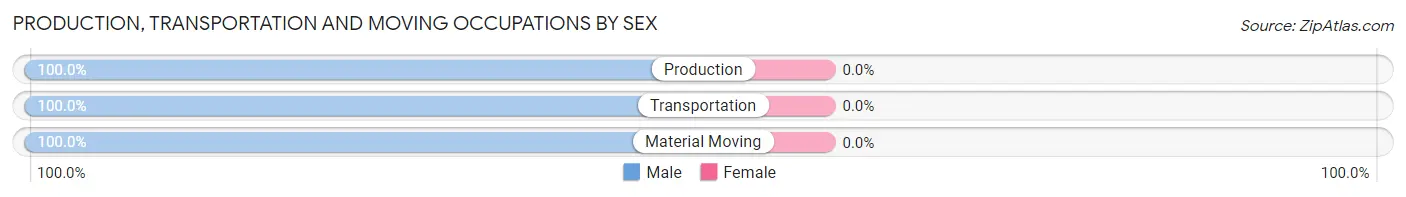
| Occupation | Male | Female |
| Production | 16 (100.0%) | 0 (0.0%) |
| Transportation | 8 (100.0%) | 0 (0.0%) |
| Material Moving | 8 (100.0%) | 0 (0.0%) |
| Total (Category) | 32 (100.0%) | 0 (0.0%) |
| Total (Overall) | 348 (54.2%) | 294 (45.8%) |
Employment Industries by Sex in Clarendon
Employment Industries in Clarendon
The major employment industries in Clarendon include Educational Services (121 | 18.9%), Health Care & Social Assistance (106 | 16.5%), Agriculture, Fishing & Hunting (79 | 12.3%), Construction (77 | 12.0%), and Retail Trade (68 | 10.6%).
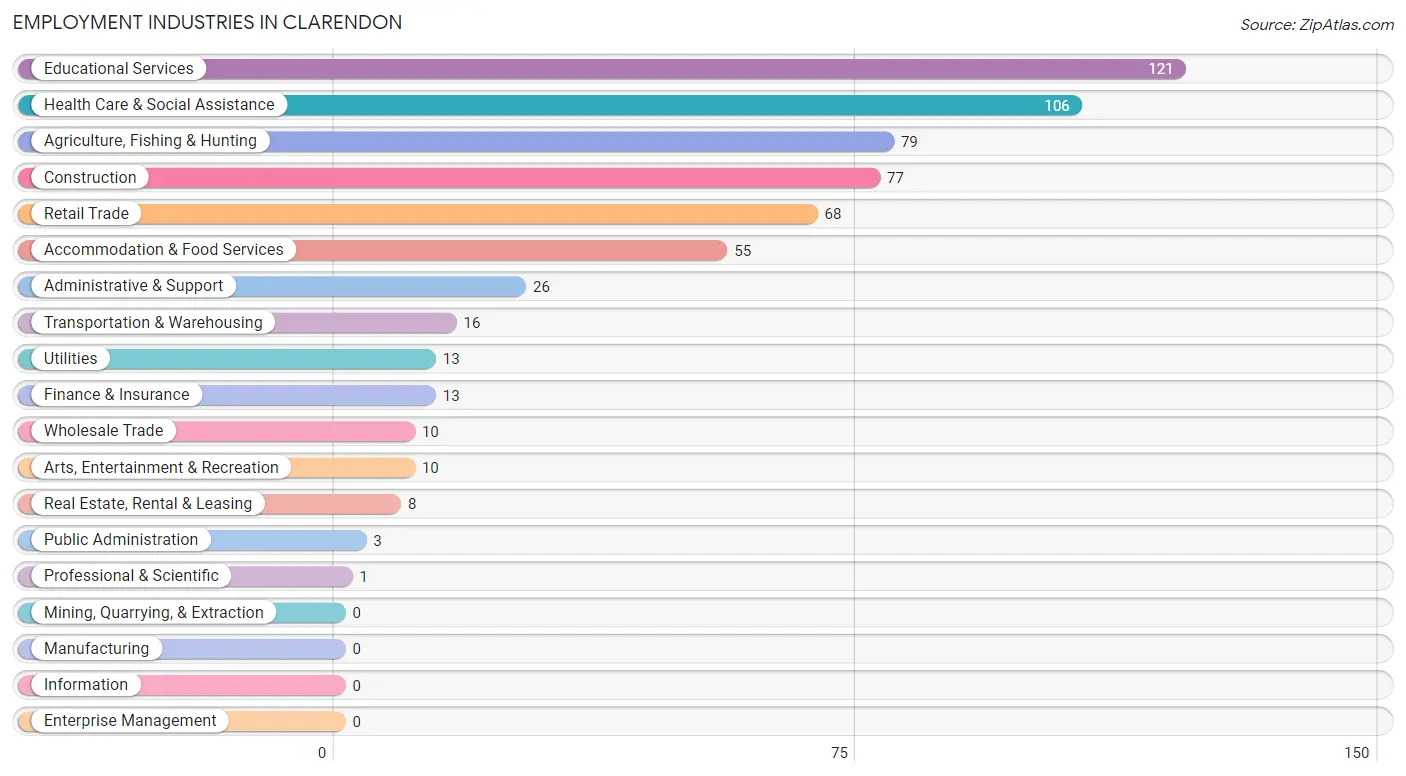
Employment Industries by Sex in Clarendon
The Clarendon industries that see more men than women are Construction (100.0%), Wholesale Trade (100.0%), and Transportation & Warehousing (100.0%), whereas the industries that tend to have a higher number of women are Public Administration (100.0%), Educational Services (84.3%), and Retail Trade (72.1%).

| Industry | Male | Female |
| Agriculture, Fishing & Hunting | 60 (75.9%) | 19 (24.0%) |
| Mining, Quarrying, & Extraction | 0 (0.0%) | 0 (0.0%) |
| Construction | 77 (100.0%) | 0 (0.0%) |
| Manufacturing | 0 (0.0%) | 0 (0.0%) |
| Wholesale Trade | 10 (100.0%) | 0 (0.0%) |
| Retail Trade | 19 (27.9%) | 49 (72.1%) |
| Transportation & Warehousing | 16 (100.0%) | 0 (0.0%) |
| Utilities | 13 (100.0%) | 0 (0.0%) |
| Information | 0 (0.0%) | 0 (0.0%) |
| Finance & Insurance | 10 (76.9%) | 3 (23.1%) |
| Real Estate, Rental & Leasing | 8 (100.0%) | 0 (0.0%) |
| Professional & Scientific | 1 (100.0%) | 0 (0.0%) |
| Enterprise Management | 0 (0.0%) | 0 (0.0%) |
| Administrative & Support | 21 (80.8%) | 5 (19.2%) |
| Educational Services | 19 (15.7%) | 102 (84.3%) |
| Health Care & Social Assistance | 37 (34.9%) | 69 (65.1%) |
| Arts, Entertainment & Recreation | 10 (100.0%) | 0 (0.0%) |
| Accommodation & Food Services | 18 (32.7%) | 37 (67.3%) |
| Public Administration | 0 (0.0%) | 3 (100.0%) |
| Total | 348 (54.2%) | 294 (45.8%) |
Education in Clarendon
School Enrollment in Clarendon
The most common levels of schooling among the 620 students in Clarendon are college / undergraduate (280 | 45.2%), middle school (135 | 21.8%), and elementary school (70 | 11.3%).
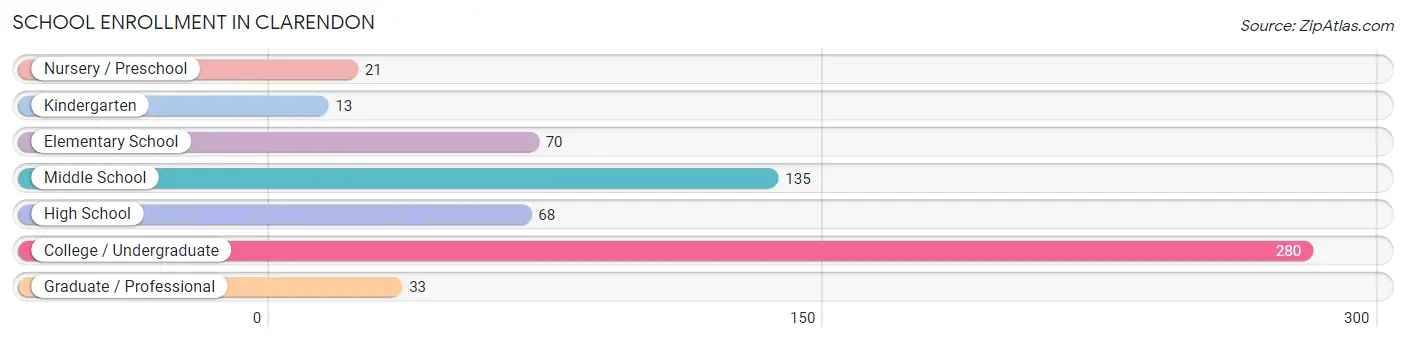
| School Level | # Students | % Students |
| Nursery / Preschool | 21 | 3.4% |
| Kindergarten | 13 | 2.1% |
| Elementary School | 70 | 11.3% |
| Middle School | 135 | 21.8% |
| High School | 68 | 11.0% |
| College / Undergraduate | 280 | 45.2% |
| Graduate / Professional | 33 | 5.3% |
| Total | 620 | 100.0% |
School Enrollment by Age by Funding Source in Clarendon
Out of a total of 620 students who are enrolled in schools in Clarendon, 72 (11.6%) attend a private institution, while the remaining 548 (88.4%) are enrolled in public schools. The age group of 35 years and over has the highest likelihood of being enrolled in private schools, with 18 (100.0% in the age bracket) enrolled. Conversely, the age group of 10 to 14 year olds has the lowest likelihood of being enrolled in a private school, with 163 (100.0% in the age bracket) attending a public institution.
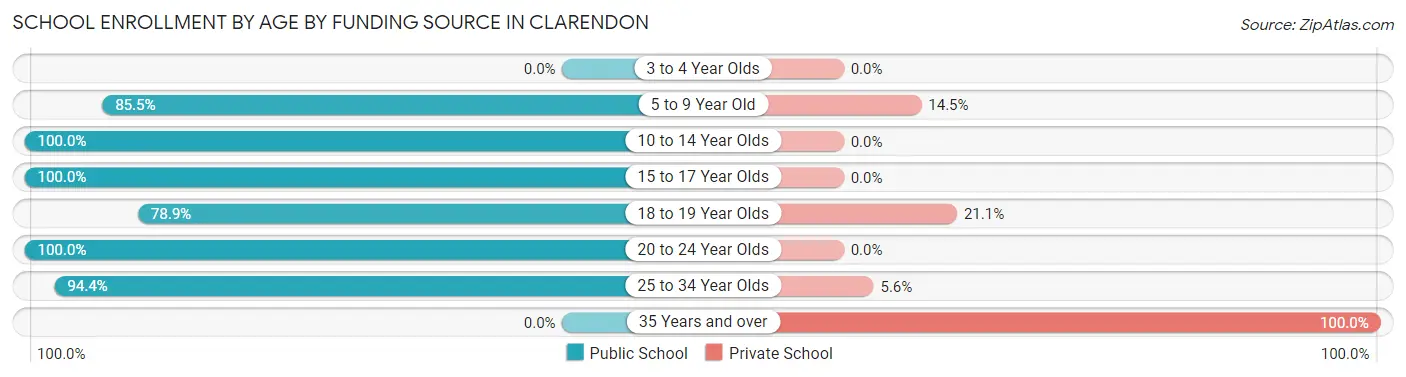
| Age Bracket | Public School | Private School |
| 3 to 4 Year Olds | 0 (0.0%) | 0 (0.0%) |
| 5 to 9 Year Old | 65 (85.5%) | 11 (14.5%) |
| 10 to 14 Year Olds | 163 (100.0%) | 0 (0.0%) |
| 15 to 17 Year Olds | 63 (100.0%) | 0 (0.0%) |
| 18 to 19 Year Olds | 157 (78.9%) | 42 (21.1%) |
| 20 to 24 Year Olds | 83 (100.0%) | 0 (0.0%) |
| 25 to 34 Year Olds | 17 (94.4%) | 1 (5.6%) |
| 35 Years and over | 0 (0.0%) | 18 (100.0%) |
| Total | 548 (88.4%) | 72 (11.6%) |
Educational Attainment by Field of Study in Clarendon
Education (42 | 29.6%), business (27 | 19.0%), arts & humanities (23 | 16.2%), physical & health sciences (15 | 10.6%), and liberal arts & history (14 | 9.9%) are the most common fields of study among 142 individuals in Clarendon who have obtained a bachelor's degree or higher.
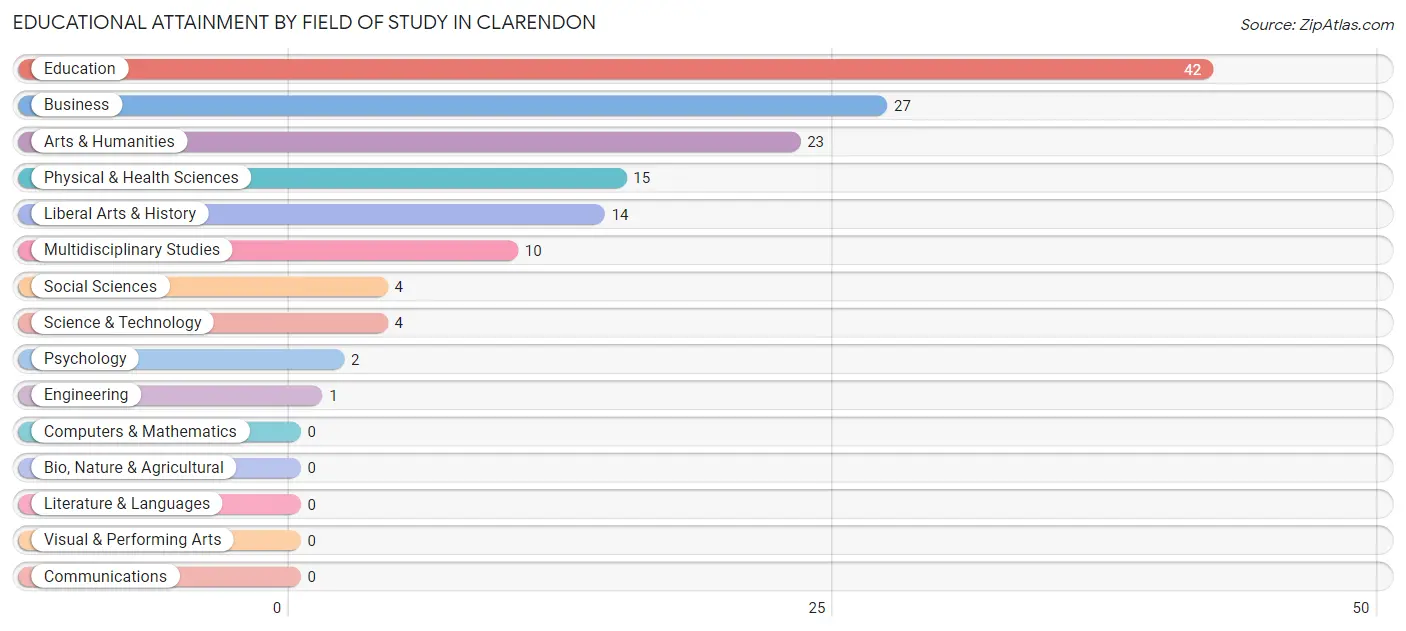
| Field of Study | # Graduates | % Graduates |
| Computers & Mathematics | 0 | 0.0% |
| Bio, Nature & Agricultural | 0 | 0.0% |
| Physical & Health Sciences | 15 | 10.6% |
| Psychology | 2 | 1.4% |
| Social Sciences | 4 | 2.8% |
| Engineering | 1 | 0.7% |
| Multidisciplinary Studies | 10 | 7.0% |
| Science & Technology | 4 | 2.8% |
| Business | 27 | 19.0% |
| Education | 42 | 29.6% |
| Literature & Languages | 0 | 0.0% |
| Liberal Arts & History | 14 | 9.9% |
| Visual & Performing Arts | 0 | 0.0% |
| Communications | 0 | 0.0% |
| Arts & Humanities | 23 | 16.2% |
| Total | 142 | 100.0% |
Transportation & Commute in Clarendon
Vehicle Availability by Sex in Clarendon
The most prevalent vehicle ownership categories in Clarendon are males with 2 vehicles (133, accounting for 39.0%) and females with 2 vehicles (96, making up 54.5%).
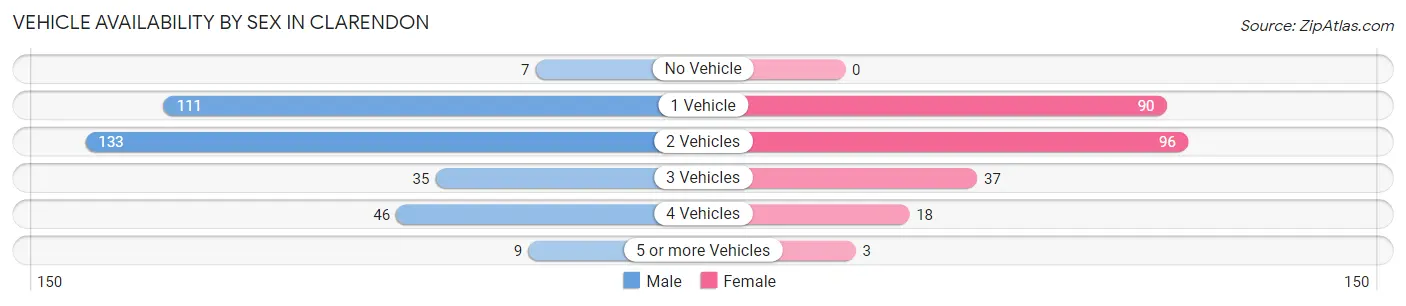
| Vehicles Available | Male | Female |
| No Vehicle | 7 (2.1%) | 0 (0.0%) |
| 1 Vehicle | 111 (32.6%) | 90 (36.9%) |
| 2 Vehicles | 133 (39.0%) | 96 (39.3%) |
| 3 Vehicles | 35 (10.3%) | 37 (15.2%) |
| 4 Vehicles | 46 (13.5%) | 18 (7.4%) |
| 5 or more Vehicles | 9 (2.6%) | 3 (1.2%) |
| Total | 341 (100.0%) | 244 (100.0%) |
Commute Time in Clarendon
The most frequently occuring commute durations in Clarendon are less than 5 minutes (215 commuters, 35.9%), 5 to 9 minutes (104 commuters, 17.4%), and 20 to 24 minutes (63 commuters, 10.5%).
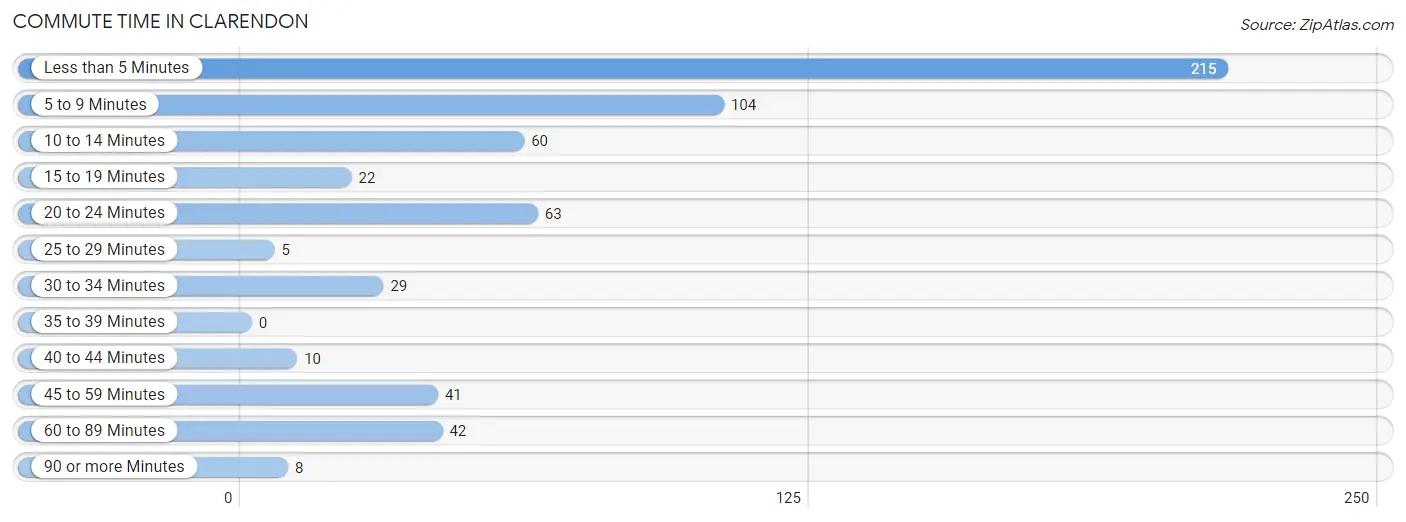
| Commute Time | # Commuters | % Commuters |
| Less than 5 Minutes | 215 | 35.9% |
| 5 to 9 Minutes | 104 | 17.4% |
| 10 to 14 Minutes | 60 | 10.0% |
| 15 to 19 Minutes | 22 | 3.7% |
| 20 to 24 Minutes | 63 | 10.5% |
| 25 to 29 Minutes | 5 | 0.8% |
| 30 to 34 Minutes | 29 | 4.8% |
| 35 to 39 Minutes | 0 | 0.0% |
| 40 to 44 Minutes | 10 | 1.7% |
| 45 to 59 Minutes | 41 | 6.8% |
| 60 to 89 Minutes | 42 | 7.0% |
| 90 or more Minutes | 8 | 1.3% |
Commute Time by Sex in Clarendon
The most common commute times in Clarendon are less than 5 minutes (96 commuters, 28.6%) for males and less than 5 minutes (119 commuters, 45.3%) for females.
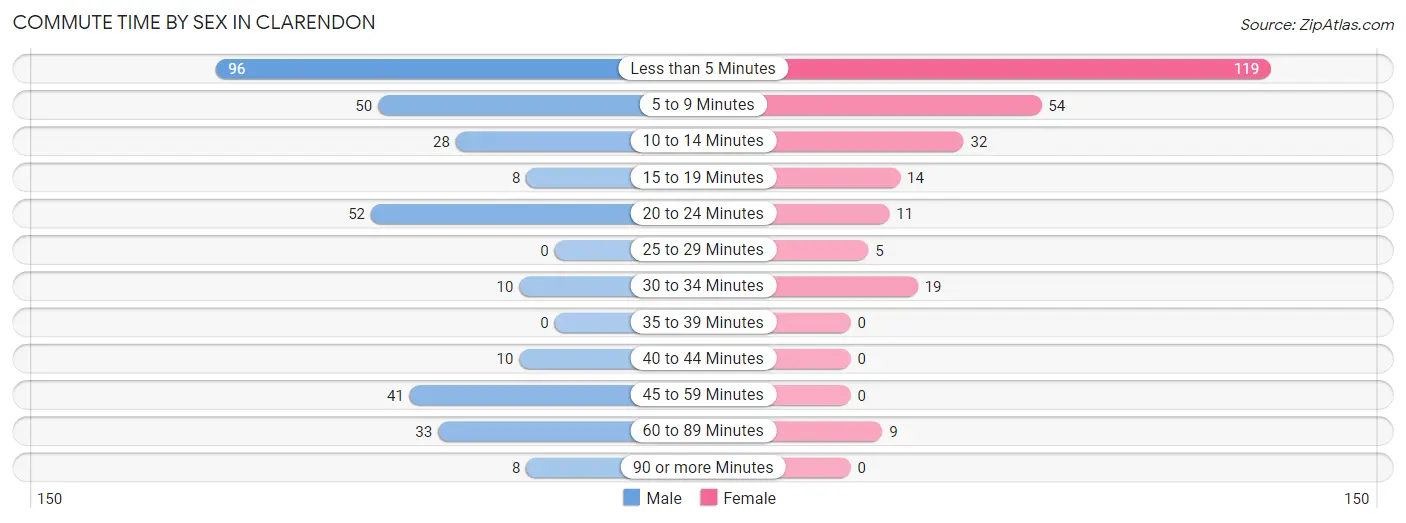
| Commute Time | Male | Female |
| Less than 5 Minutes | 96 (28.6%) | 119 (45.3%) |
| 5 to 9 Minutes | 50 (14.9%) | 54 (20.5%) |
| 10 to 14 Minutes | 28 (8.3%) | 32 (12.2%) |
| 15 to 19 Minutes | 8 (2.4%) | 14 (5.3%) |
| 20 to 24 Minutes | 52 (15.5%) | 11 (4.2%) |
| 25 to 29 Minutes | 0 (0.0%) | 5 (1.9%) |
| 30 to 34 Minutes | 10 (3.0%) | 19 (7.2%) |
| 35 to 39 Minutes | 0 (0.0%) | 0 (0.0%) |
| 40 to 44 Minutes | 10 (3.0%) | 0 (0.0%) |
| 45 to 59 Minutes | 41 (12.2%) | 0 (0.0%) |
| 60 to 89 Minutes | 33 (9.8%) | 9 (3.4%) |
| 90 or more Minutes | 8 (2.4%) | 0 (0.0%) |
Time of Departure to Work by Sex in Clarendon
The most frequent times of departure to work in Clarendon are 6:00 AM to 6:29 AM (73, 21.7%) for males and 7:30 AM to 7:59 AM (64, 24.3%) for females.
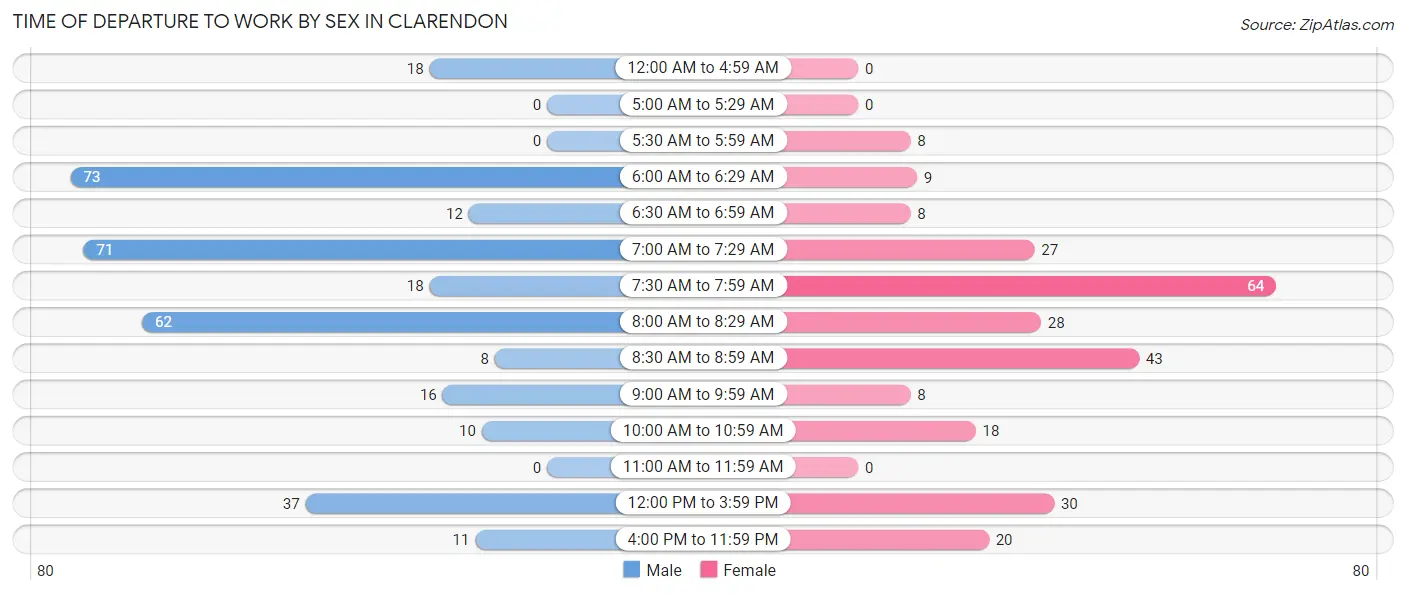
| Time of Departure | Male | Female |
| 12:00 AM to 4:59 AM | 18 (5.4%) | 0 (0.0%) |
| 5:00 AM to 5:29 AM | 0 (0.0%) | 0 (0.0%) |
| 5:30 AM to 5:59 AM | 0 (0.0%) | 8 (3.0%) |
| 6:00 AM to 6:29 AM | 73 (21.7%) | 9 (3.4%) |
| 6:30 AM to 6:59 AM | 12 (3.6%) | 8 (3.0%) |
| 7:00 AM to 7:29 AM | 71 (21.1%) | 27 (10.3%) |
| 7:30 AM to 7:59 AM | 18 (5.4%) | 64 (24.3%) |
| 8:00 AM to 8:29 AM | 62 (18.4%) | 28 (10.6%) |
| 8:30 AM to 8:59 AM | 8 (2.4%) | 43 (16.4%) |
| 9:00 AM to 9:59 AM | 16 (4.8%) | 8 (3.0%) |
| 10:00 AM to 10:59 AM | 10 (3.0%) | 18 (6.8%) |
| 11:00 AM to 11:59 AM | 0 (0.0%) | 0 (0.0%) |
| 12:00 PM to 3:59 PM | 37 (11.0%) | 30 (11.4%) |
| 4:00 PM to 11:59 PM | 11 (3.3%) | 20 (7.6%) |
| Total | 336 (100.0%) | 263 (100.0%) |
Housing Occupancy in Clarendon
Occupancy by Ownership in Clarendon
Of the total 635 dwellings in Clarendon, owner-occupied units account for 386 (60.8%), while renter-occupied units make up 249 (39.2%).
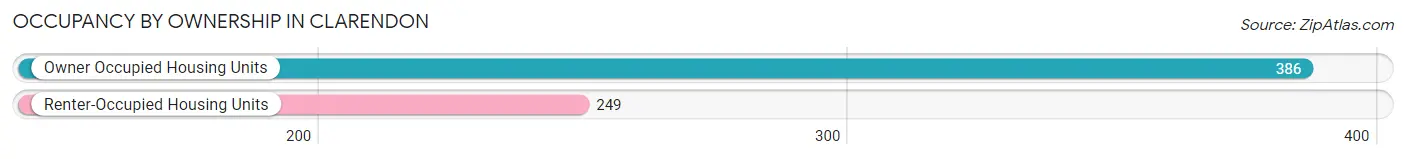
| Occupancy | # Housing Units | % Housing Units |
| Owner Occupied Housing Units | 386 | 60.8% |
| Renter-Occupied Housing Units | 249 | 39.2% |
| Total Occupied Housing Units | 635 | 100.0% |
Occupancy by Household Size in Clarendon
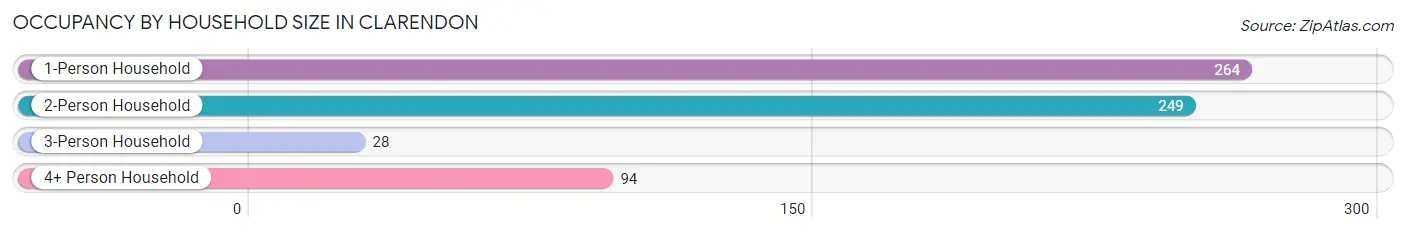
| Household Size | # Housing Units | % Housing Units |
| 1-Person Household | 264 | 41.6% |
| 2-Person Household | 249 | 39.2% |
| 3-Person Household | 28 | 4.4% |
| 4+ Person Household | 94 | 14.8% |
| Total Housing Units | 635 | 100.0% |
Occupancy by Ownership by Household Size in Clarendon
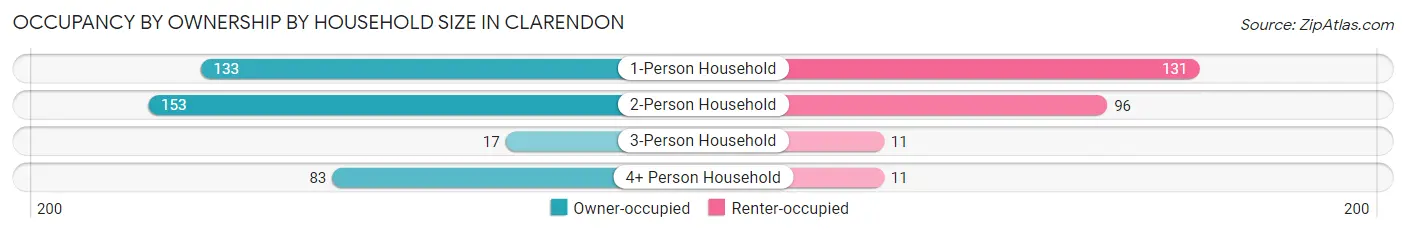
| Household Size | Owner-occupied | Renter-occupied |
| 1-Person Household | 133 (50.4%) | 131 (49.6%) |
| 2-Person Household | 153 (61.5%) | 96 (38.6%) |
| 3-Person Household | 17 (60.7%) | 11 (39.3%) |
| 4+ Person Household | 83 (88.3%) | 11 (11.7%) |
| Total Housing Units | 386 (60.8%) | 249 (39.2%) |
Occupancy by Educational Attainment in Clarendon
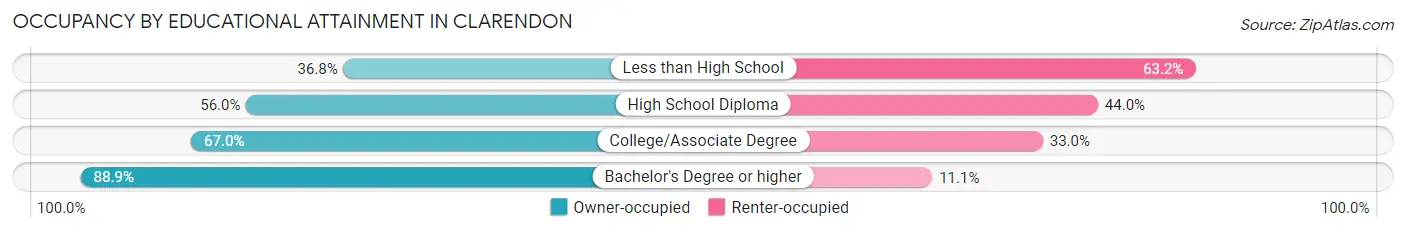
| Household Size | Owner-occupied | Renter-occupied |
| Less than High School | 50 (36.8%) | 86 (63.2%) |
| High School Diploma | 102 (56.0%) | 80 (44.0%) |
| College/Associate Degree | 146 (67.0%) | 72 (33.0%) |
| Bachelor's Degree or higher | 88 (88.9%) | 11 (11.1%) |
Occupancy by Age of Householder in Clarendon
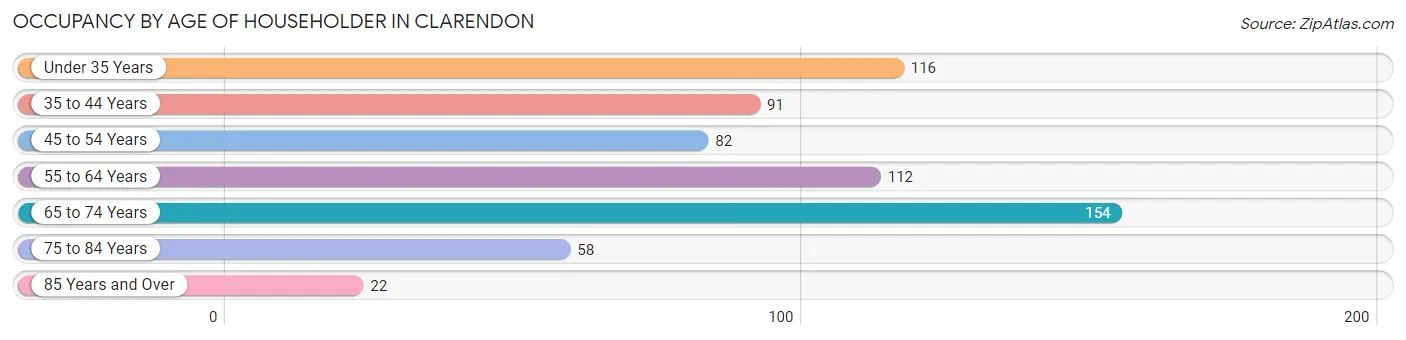
| Age Bracket | # Households | % Households |
| Under 35 Years | 116 | 18.3% |
| 35 to 44 Years | 91 | 14.3% |
| 45 to 54 Years | 82 | 12.9% |
| 55 to 64 Years | 112 | 17.6% |
| 65 to 74 Years | 154 | 24.2% |
| 75 to 84 Years | 58 | 9.1% |
| 85 Years and Over | 22 | 3.5% |
| Total | 635 | 100.0% |
Housing Finances in Clarendon
Median Income by Occupancy in Clarendon
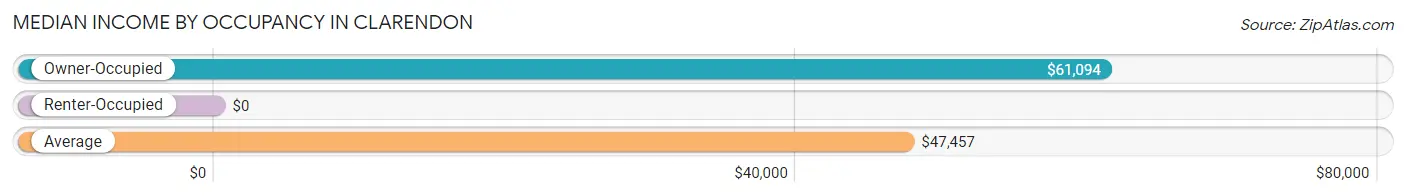
| Occupancy Type | # Households | Median Income |
| Owner-Occupied | 386 (60.8%) | $61,094 |
| Renter-Occupied | 249 (39.2%) | $0 |
| Average | 635 (100.0%) | $47,457 |
Occupancy by Householder Income Bracket in Clarendon
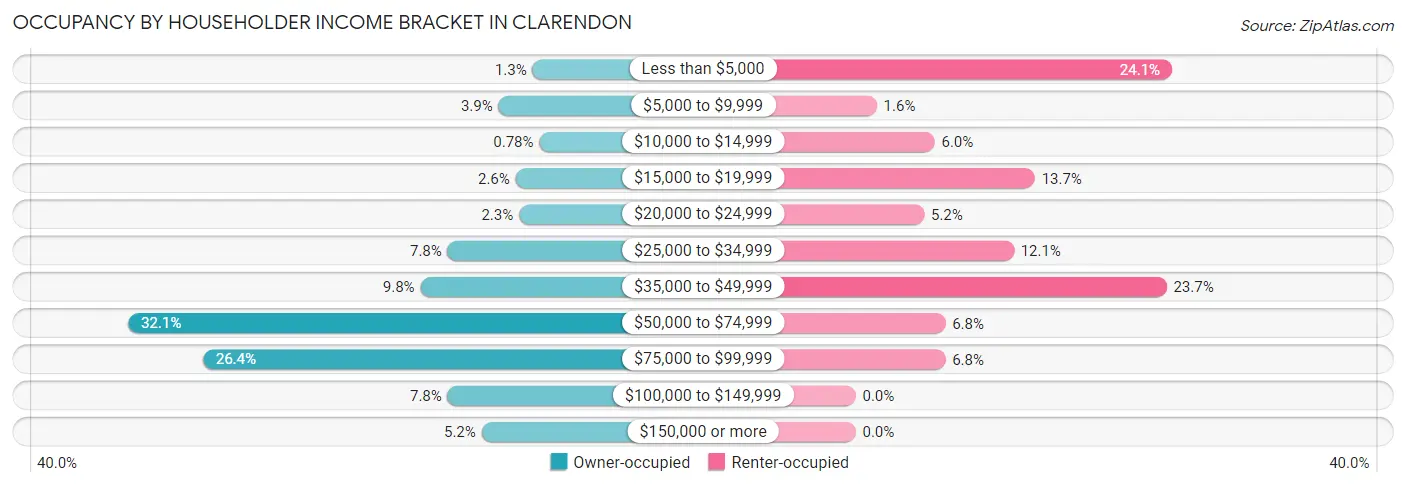
| Income Bracket | Owner-occupied | Renter-occupied |
| Less than $5,000 | 5 (1.3%) | 60 (24.1%) |
| $5,000 to $9,999 | 15 (3.9%) | 4 (1.6%) |
| $10,000 to $14,999 | 3 (0.8%) | 15 (6.0%) |
| $15,000 to $19,999 | 10 (2.6%) | 34 (13.7%) |
| $20,000 to $24,999 | 9 (2.3%) | 13 (5.2%) |
| $25,000 to $34,999 | 30 (7.8%) | 30 (12.0%) |
| $35,000 to $49,999 | 38 (9.8%) | 59 (23.7%) |
| $50,000 to $74,999 | 124 (32.1%) | 17 (6.8%) |
| $75,000 to $99,999 | 102 (26.4%) | 17 (6.8%) |
| $100,000 to $149,999 | 30 (7.8%) | 0 (0.0%) |
| $150,000 or more | 20 (5.2%) | 0 (0.0%) |
| Total | 386 (100.0%) | 249 (100.0%) |
Monthly Housing Cost Tiers in Clarendon
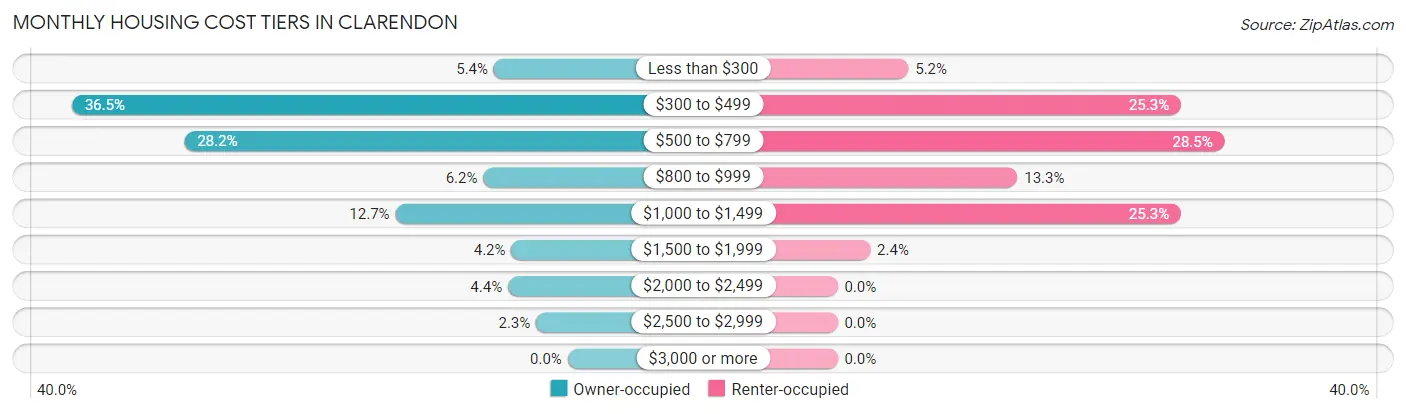
| Monthly Cost | Owner-occupied | Renter-occupied |
| Less than $300 | 21 (5.4%) | 13 (5.2%) |
| $300 to $499 | 141 (36.5%) | 63 (25.3%) |
| $500 to $799 | 109 (28.2%) | 71 (28.5%) |
| $800 to $999 | 24 (6.2%) | 33 (13.3%) |
| $1,000 to $1,499 | 49 (12.7%) | 63 (25.3%) |
| $1,500 to $1,999 | 16 (4.2%) | 6 (2.4%) |
| $2,000 to $2,499 | 17 (4.4%) | 0 (0.0%) |
| $2,500 to $2,999 | 9 (2.3%) | 0 (0.0%) |
| $3,000 or more | 0 (0.0%) | 0 (0.0%) |
| Total | 386 (100.0%) | 249 (100.0%) |
Physical Housing Characteristics in Clarendon
Housing Structures in Clarendon
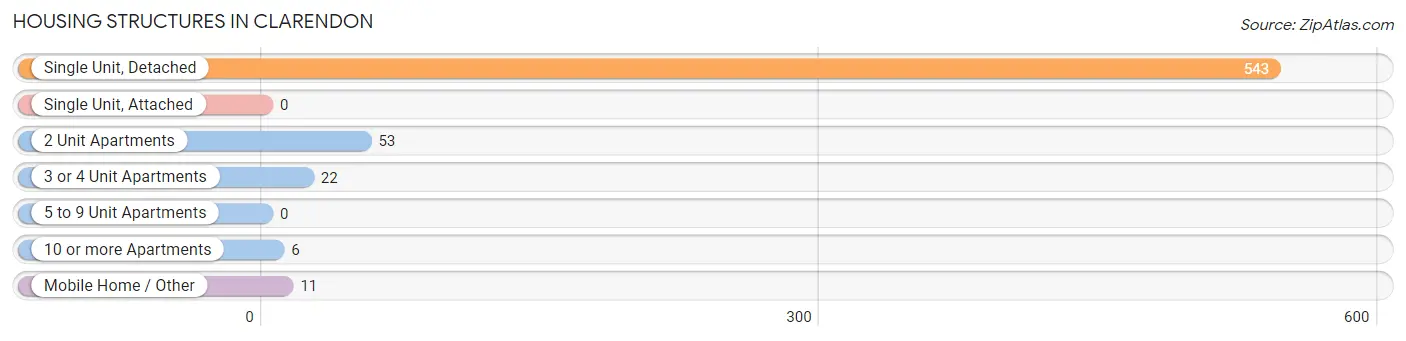
| Structure Type | # Housing Units | % Housing Units |
| Single Unit, Detached | 543 | 85.5% |
| Single Unit, Attached | 0 | 0.0% |
| 2 Unit Apartments | 53 | 8.4% |
| 3 or 4 Unit Apartments | 22 | 3.5% |
| 5 to 9 Unit Apartments | 0 | 0.0% |
| 10 or more Apartments | 6 | 0.9% |
| Mobile Home / Other | 11 | 1.7% |
| Total | 635 | 100.0% |
Housing Structures by Occupancy in Clarendon
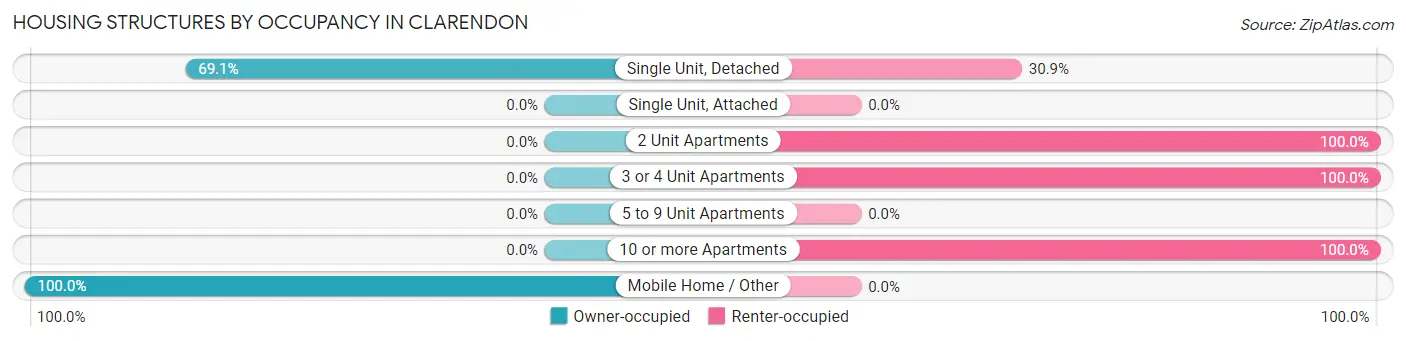
| Structure Type | Owner-occupied | Renter-occupied |
| Single Unit, Detached | 375 (69.1%) | 168 (30.9%) |
| Single Unit, Attached | 0 (0.0%) | 0 (0.0%) |
| 2 Unit Apartments | 0 (0.0%) | 53 (100.0%) |
| 3 or 4 Unit Apartments | 0 (0.0%) | 22 (100.0%) |
| 5 to 9 Unit Apartments | 0 (0.0%) | 0 (0.0%) |
| 10 or more Apartments | 0 (0.0%) | 6 (100.0%) |
| Mobile Home / Other | 11 (100.0%) | 0 (0.0%) |
| Total | 386 (60.8%) | 249 (39.2%) |
Housing Structures by Number of Rooms in Clarendon
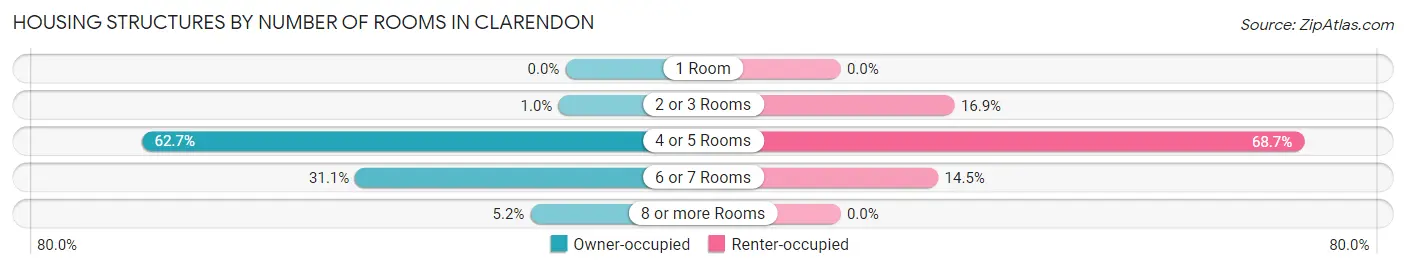
| Number of Rooms | Owner-occupied | Renter-occupied |
| 1 Room | 0 (0.0%) | 0 (0.0%) |
| 2 or 3 Rooms | 4 (1.0%) | 42 (16.9%) |
| 4 or 5 Rooms | 242 (62.7%) | 171 (68.7%) |
| 6 or 7 Rooms | 120 (31.1%) | 36 (14.5%) |
| 8 or more Rooms | 20 (5.2%) | 0 (0.0%) |
| Total | 386 (100.0%) | 249 (100.0%) |
Housing Structure by Heating Type in Clarendon
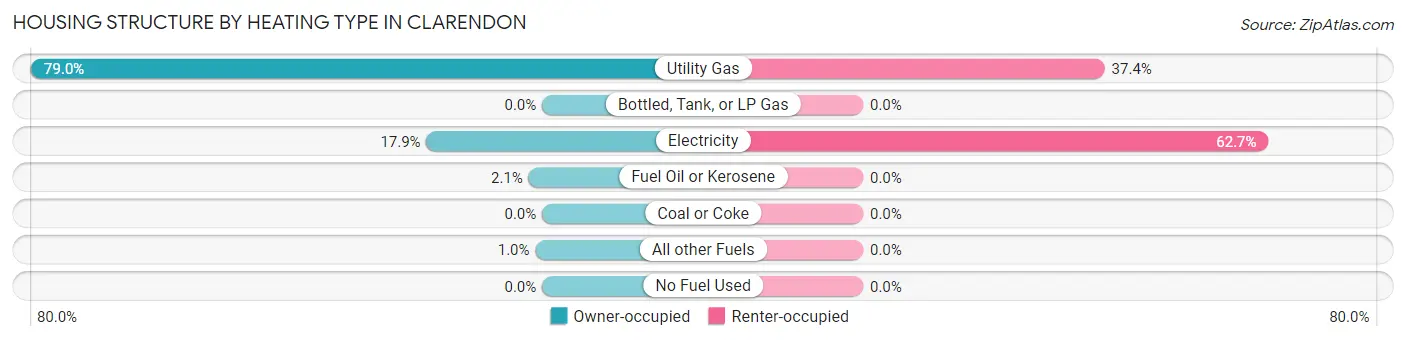
| Heating Type | Owner-occupied | Renter-occupied |
| Utility Gas | 305 (79.0%) | 93 (37.3%) |
| Bottled, Tank, or LP Gas | 0 (0.0%) | 0 (0.0%) |
| Electricity | 69 (17.9%) | 156 (62.6%) |
| Fuel Oil or Kerosene | 8 (2.1%) | 0 (0.0%) |
| Coal or Coke | 0 (0.0%) | 0 (0.0%) |
| All other Fuels | 4 (1.0%) | 0 (0.0%) |
| No Fuel Used | 0 (0.0%) | 0 (0.0%) |
| Total | 386 (100.0%) | 249 (100.0%) |
Household Vehicle Usage in Clarendon
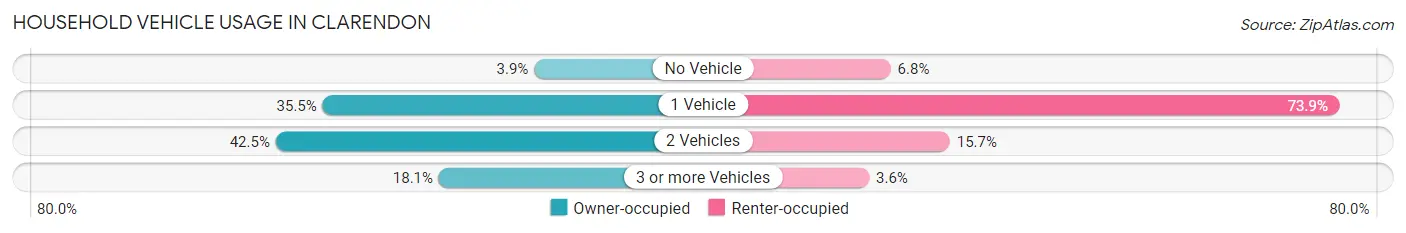
| Vehicles per Household | Owner-occupied | Renter-occupied |
| No Vehicle | 15 (3.9%) | 17 (6.8%) |
| 1 Vehicle | 137 (35.5%) | 184 (73.9%) |
| 2 Vehicles | 164 (42.5%) | 39 (15.7%) |
| 3 or more Vehicles | 70 (18.1%) | 9 (3.6%) |
| Total | 386 (100.0%) | 249 (100.0%) |
Real Estate & Mortgages in Clarendon
Real Estate and Mortgage Overview in Clarendon
| Characteristic | Without Mortgage | With Mortgage |
| Housing Units | 272 | 114 |
| Median Property Value | $58,200 | $141,300 |
| Median Household Income | $52,157 | $15 |
| Monthly Housing Costs | $486 | $0 |
| Real Estate Taxes | $1,065 | $0 |
Property Value by Mortgage Status in Clarendon
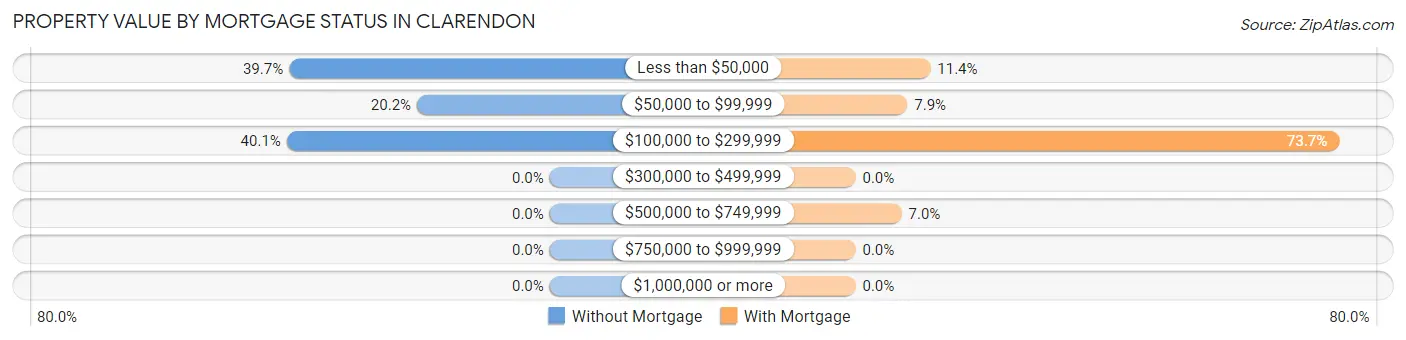
| Property Value | Without Mortgage | With Mortgage |
| Less than $50,000 | 108 (39.7%) | 13 (11.4%) |
| $50,000 to $99,999 | 55 (20.2%) | 9 (7.9%) |
| $100,000 to $299,999 | 109 (40.1%) | 84 (73.7%) |
| $300,000 to $499,999 | 0 (0.0%) | 0 (0.0%) |
| $500,000 to $749,999 | 0 (0.0%) | 8 (7.0%) |
| $750,000 to $999,999 | 0 (0.0%) | 0 (0.0%) |
| $1,000,000 or more | 0 (0.0%) | 0 (0.0%) |
| Total | 272 (100.0%) | 114 (100.0%) |
Household Income by Mortgage Status in Clarendon
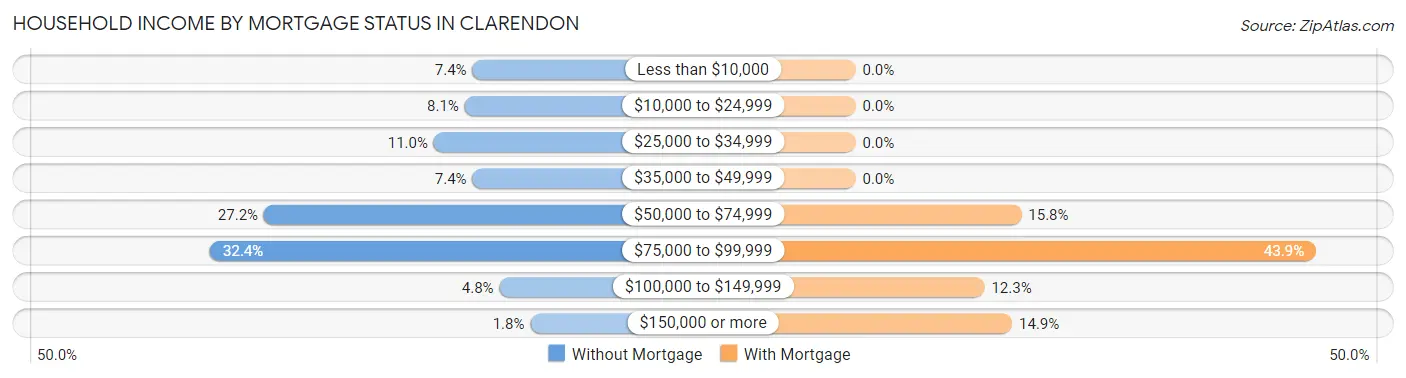
| Household Income | Without Mortgage | With Mortgage |
| Less than $10,000 | 20 (7.3%) | 0 (0.0%) |
| $10,000 to $24,999 | 22 (8.1%) | 0 (0.0%) |
| $25,000 to $34,999 | 30 (11.0%) | 0 (0.0%) |
| $35,000 to $49,999 | 20 (7.3%) | 0 (0.0%) |
| $50,000 to $74,999 | 74 (27.2%) | 18 (15.8%) |
| $75,000 to $99,999 | 88 (32.4%) | 50 (43.9%) |
| $100,000 to $149,999 | 13 (4.8%) | 14 (12.3%) |
| $150,000 or more | 5 (1.8%) | 17 (14.9%) |
| Total | 272 (100.0%) | 114 (100.0%) |
Property Value to Household Income Ratio in Clarendon
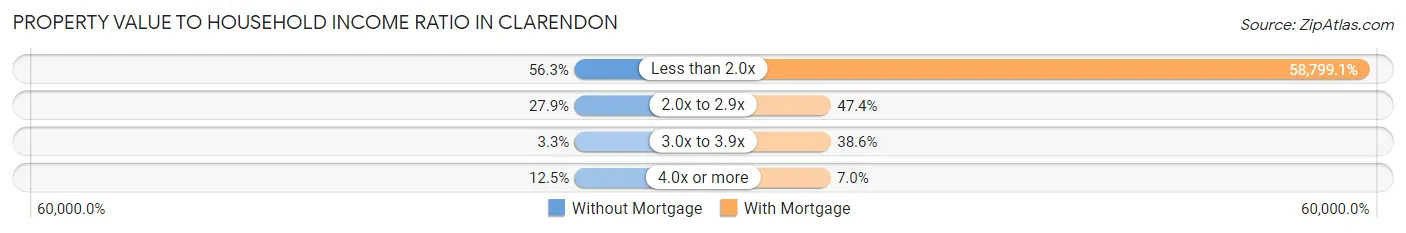
| Value-to-Income Ratio | Without Mortgage | With Mortgage |
| Less than 2.0x | 153 (56.2%) | 67,031 (58,799.1%) |
| 2.0x to 2.9x | 76 (27.9%) | 54 (47.4%) |
| 3.0x to 3.9x | 9 (3.3%) | 44 (38.6%) |
| 4.0x or more | 34 (12.5%) | 8 (7.0%) |
| Total | 272 (100.0%) | 114 (100.0%) |
Real Estate Taxes by Mortgage Status in Clarendon
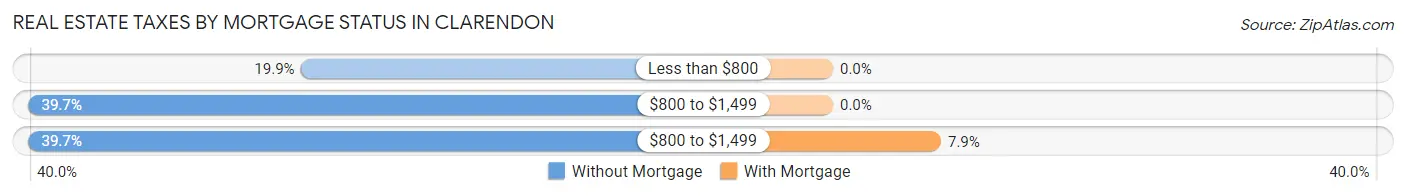
| Property Taxes | Without Mortgage | With Mortgage |
| Less than $800 | 54 (19.9%) | 0 (0.0%) |
| $800 to $1,499 | 108 (39.7%) | 0 (0.0%) |
| $800 to $1,499 | 108 (39.7%) | 9 (7.9%) |
| Total | 272 (100.0%) | 114 (100.0%) |
Health & Disability in Clarendon
Health Insurance Coverage by Age in Clarendon
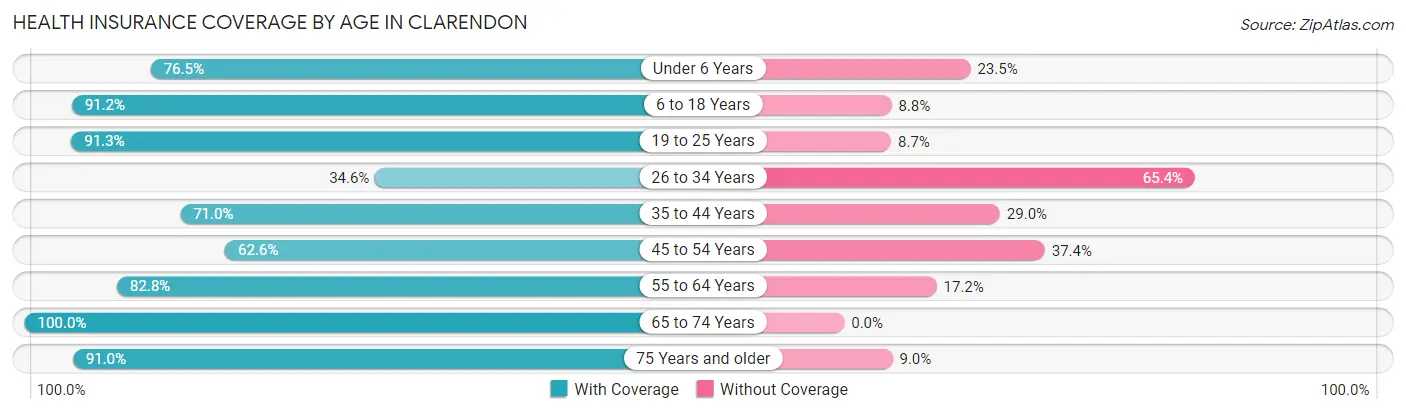
| Age Bracket | With Coverage | Without Coverage |
| Under 6 Years | 65 (76.5%) | 20 (23.5%) |
| 6 to 18 Years | 332 (91.2%) | 32 (8.8%) |
| 19 to 25 Years | 272 (91.3%) | 26 (8.7%) |
| 26 to 34 Years | 36 (34.6%) | 68 (65.4%) |
| 35 to 44 Years | 137 (71.0%) | 56 (29.0%) |
| 45 to 54 Years | 72 (62.6%) | 43 (37.4%) |
| 55 to 64 Years | 125 (82.8%) | 26 (17.2%) |
| 65 to 74 Years | 259 (100.0%) | 0 (0.0%) |
| 75 Years and older | 81 (91.0%) | 8 (9.0%) |
| Total | 1,379 (83.2%) | 279 (16.8%) |
Health Insurance Coverage by Citizenship Status in Clarendon
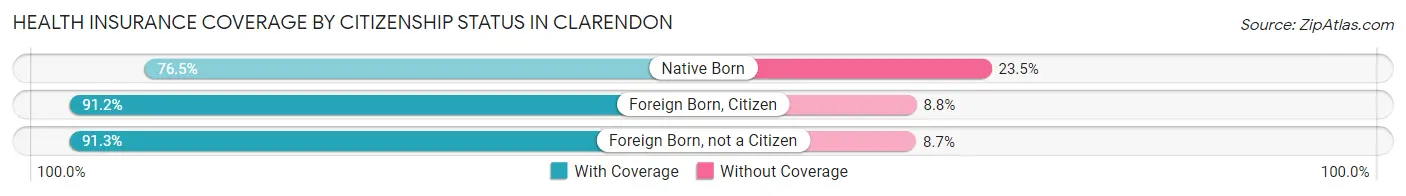
| Citizenship Status | With Coverage | Without Coverage |
| Native Born | 65 (76.5%) | 20 (23.5%) |
| Foreign Born, Citizen | 332 (91.2%) | 32 (8.8%) |
| Foreign Born, not a Citizen | 272 (91.3%) | 26 (8.7%) |
Health Insurance Coverage by Household Income in Clarendon
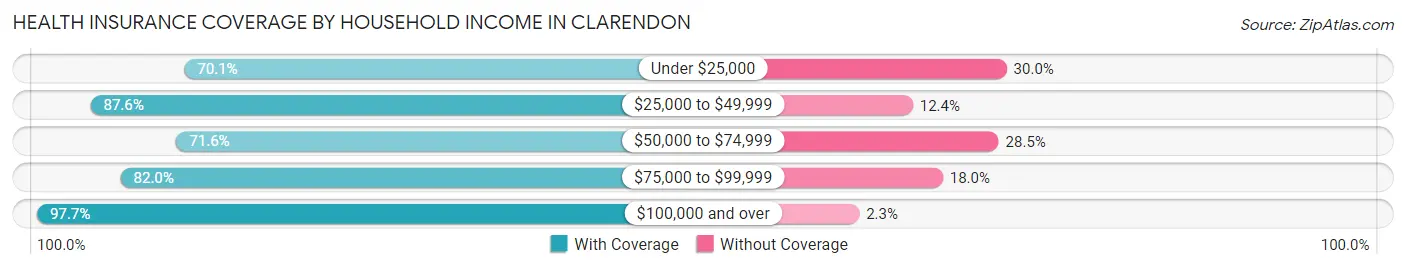
| Household Income | With Coverage | Without Coverage |
| Under $25,000 | 145 (70.1%) | 62 (29.9%) |
| $25,000 to $49,999 | 305 (87.6%) | 43 (12.4%) |
| $50,000 to $74,999 | 244 (71.6%) | 97 (28.4%) |
| $75,000 to $99,999 | 237 (82.0%) | 52 (18.0%) |
| $100,000 and over | 210 (97.7%) | 5 (2.3%) |
Public vs Private Health Insurance Coverage by Age in Clarendon
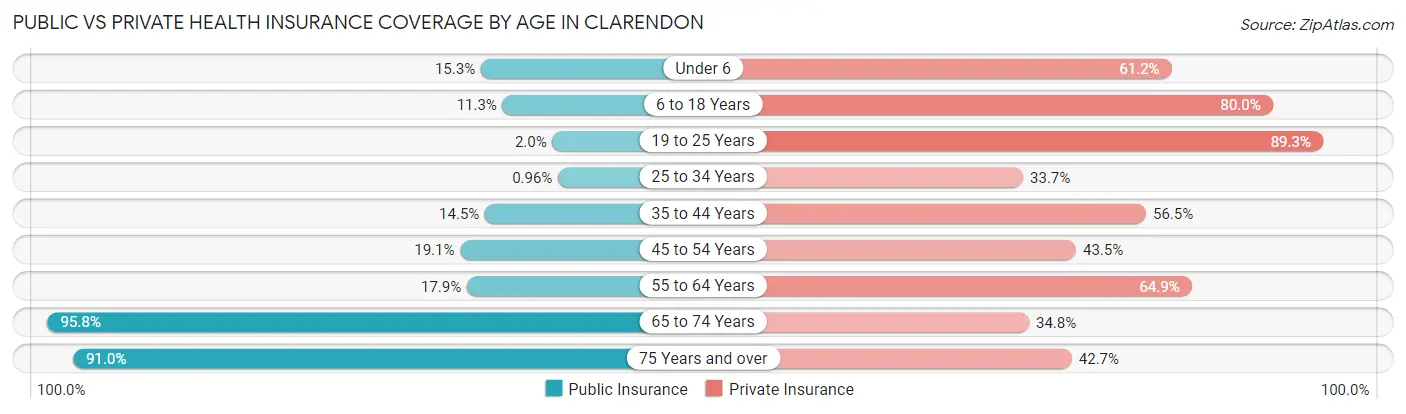
| Age Bracket | Public Insurance | Private Insurance |
| Under 6 | 13 (15.3%) | 52 (61.2%) |
| 6 to 18 Years | 41 (11.3%) | 291 (79.9%) |
| 19 to 25 Years | 6 (2.0%) | 266 (89.3%) |
| 25 to 34 Years | 1 (1.0%) | 35 (33.7%) |
| 35 to 44 Years | 28 (14.5%) | 109 (56.5%) |
| 45 to 54 Years | 22 (19.1%) | 50 (43.5%) |
| 55 to 64 Years | 27 (17.9%) | 98 (64.9%) |
| 65 to 74 Years | 248 (95.8%) | 90 (34.7%) |
| 75 Years and over | 81 (91.0%) | 38 (42.7%) |
| Total | 467 (28.2%) | 1,029 (62.1%) |
Disability Status by Sex by Age in Clarendon
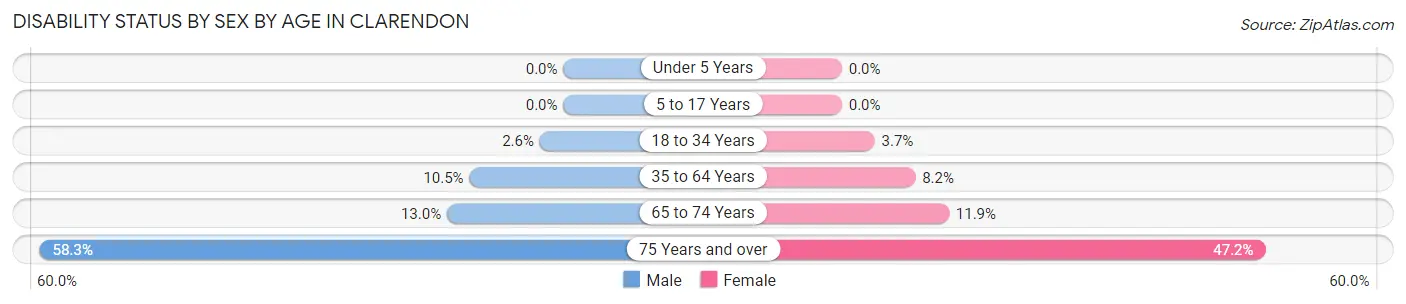
| Age Bracket | Male | Female |
| Under 5 Years | 0 (0.0%) | 0 (0.0%) |
| 5 to 17 Years | 0 (0.0%) | 0 (0.0%) |
| 18 to 34 Years | 7 (2.6%) | 8 (3.6%) |
| 35 to 64 Years | 25 (10.5%) | 18 (8.2%) |
| 65 to 74 Years | 14 (13.0%) | 18 (11.9%) |
| 75 Years and over | 21 (58.3%) | 25 (47.2%) |
Disability Class by Sex by Age in Clarendon
Disability Class: Hearing Difficulty
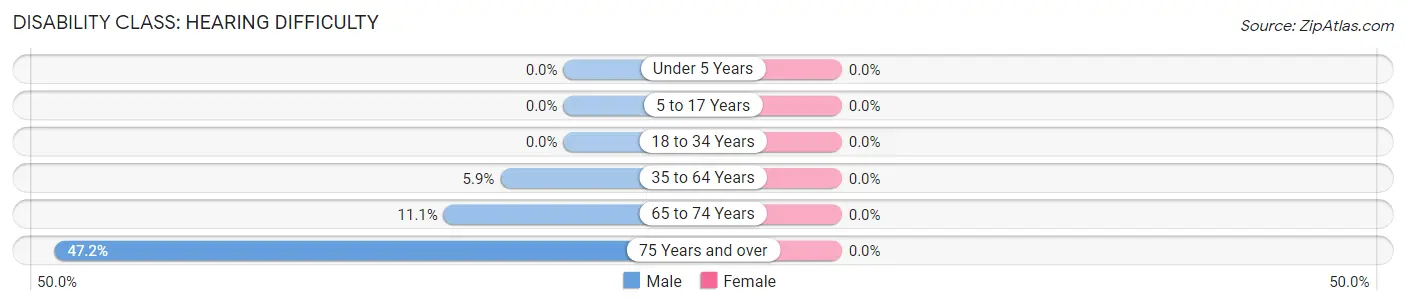
| Age Bracket | Male | Female |
| Under 5 Years | 0 (0.0%) | 0 (0.0%) |
| 5 to 17 Years | 0 (0.0%) | 0 (0.0%) |
| 18 to 34 Years | 0 (0.0%) | 0 (0.0%) |
| 35 to 64 Years | 14 (5.9%) | 0 (0.0%) |
| 65 to 74 Years | 12 (11.1%) | 0 (0.0%) |
| 75 Years and over | 17 (47.2%) | 0 (0.0%) |
Disability Class: Vision Difficulty
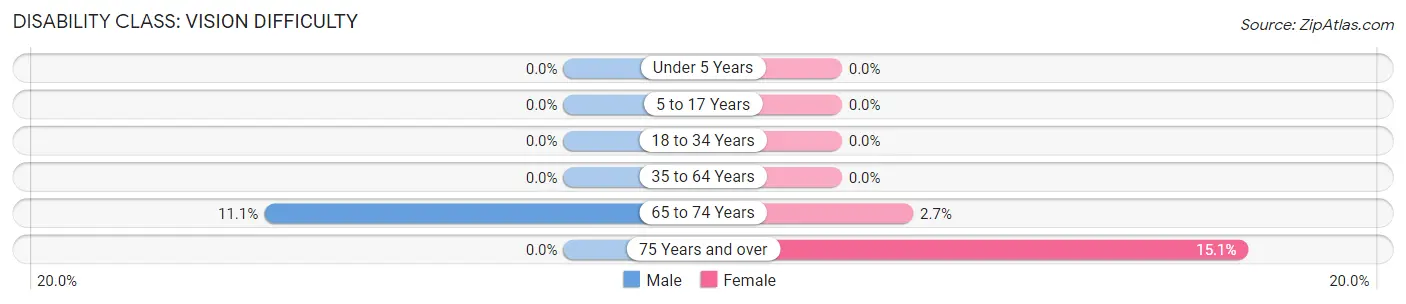
| Age Bracket | Male | Female |
| Under 5 Years | 0 (0.0%) | 0 (0.0%) |
| 5 to 17 Years | 0 (0.0%) | 0 (0.0%) |
| 18 to 34 Years | 0 (0.0%) | 0 (0.0%) |
| 35 to 64 Years | 0 (0.0%) | 0 (0.0%) |
| 65 to 74 Years | 12 (11.1%) | 4 (2.6%) |
| 75 Years and over | 0 (0.0%) | 8 (15.1%) |
Disability Class: Cognitive Difficulty
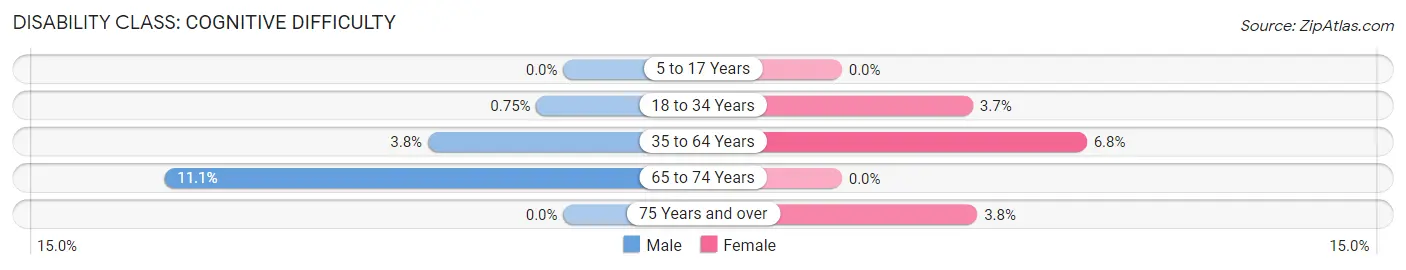
| Age Bracket | Male | Female |
| 5 to 17 Years | 0 (0.0%) | 0 (0.0%) |
| 18 to 34 Years | 2 (0.7%) | 8 (3.6%) |
| 35 to 64 Years | 9 (3.8%) | 15 (6.8%) |
| 65 to 74 Years | 12 (11.1%) | 0 (0.0%) |
| 75 Years and over | 0 (0.0%) | 2 (3.8%) |
Disability Class: Ambulatory Difficulty
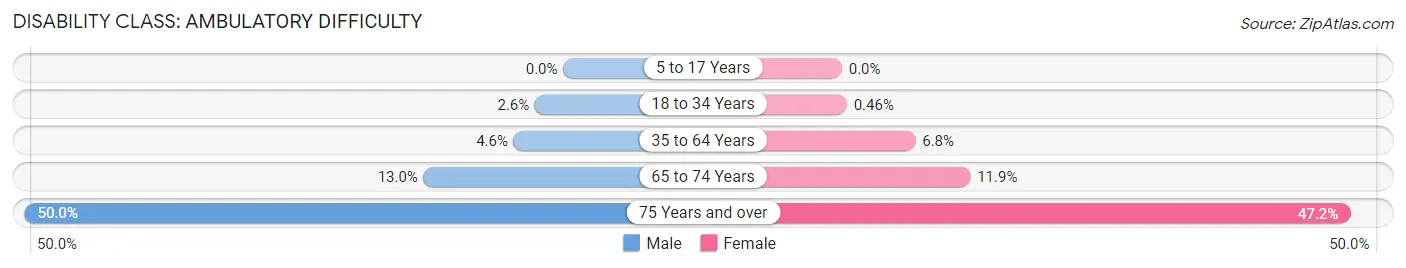
| Age Bracket | Male | Female |
| 5 to 17 Years | 0 (0.0%) | 0 (0.0%) |
| 18 to 34 Years | 7 (2.6%) | 1 (0.5%) |
| 35 to 64 Years | 11 (4.6%) | 15 (6.8%) |
| 65 to 74 Years | 14 (13.0%) | 18 (11.9%) |
| 75 Years and over | 18 (50.0%) | 25 (47.2%) |
Disability Class: Self-Care Difficulty
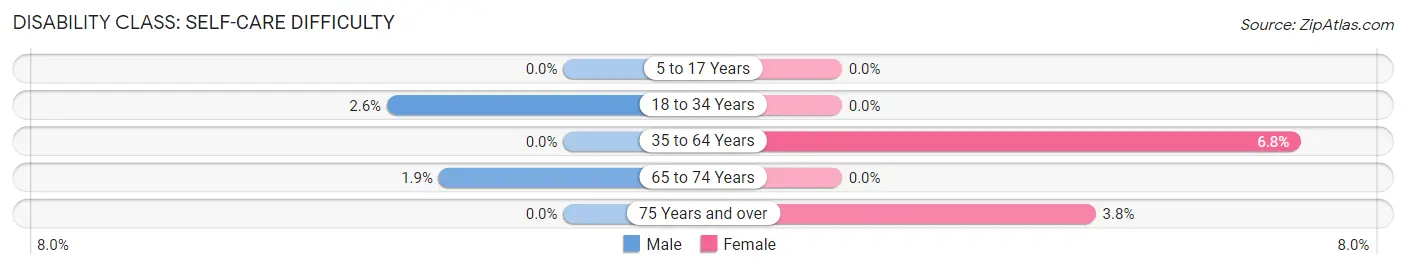
| Age Bracket | Male | Female |
| 5 to 17 Years | 0 (0.0%) | 0 (0.0%) |
| 18 to 34 Years | 7 (2.6%) | 0 (0.0%) |
| 35 to 64 Years | 0 (0.0%) | 15 (6.8%) |
| 65 to 74 Years | 2 (1.8%) | 0 (0.0%) |
| 75 Years and over | 0 (0.0%) | 2 (3.8%) |
Technology Access in Clarendon
Computing Device Access in Clarendon
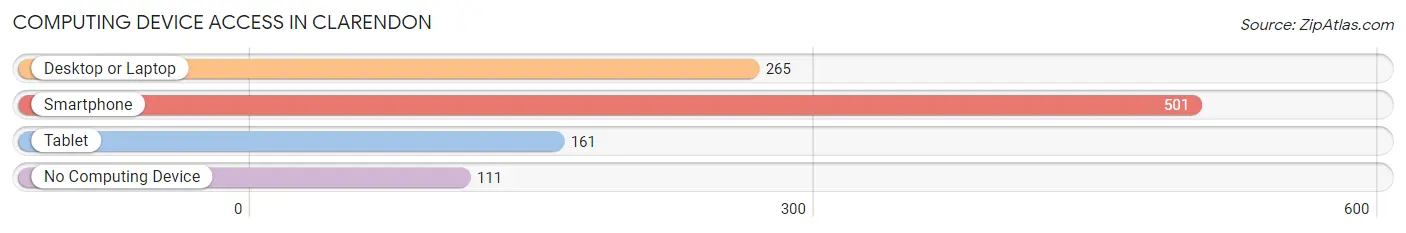
| Device Type | # Households | % Households |
| Desktop or Laptop | 265 | 41.7% |
| Smartphone | 501 | 78.9% |
| Tablet | 161 | 25.4% |
| No Computing Device | 111 | 17.5% |
| Total | 635 | 100.0% |
Internet Access in Clarendon
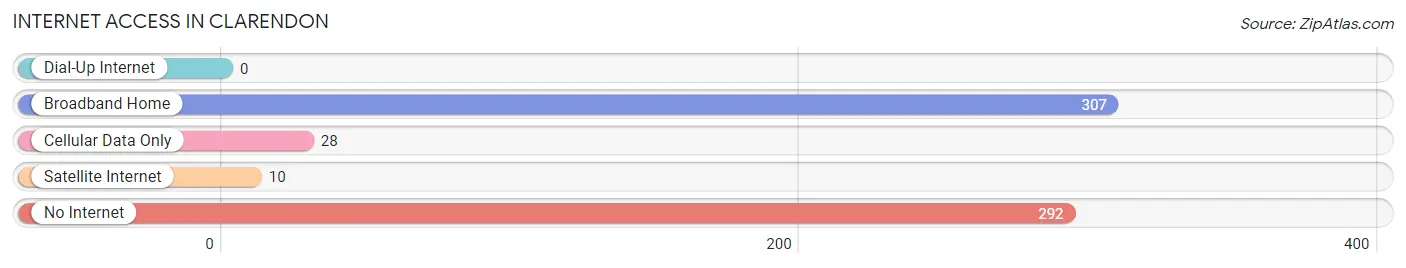
| Internet Type | # Households | % Households |
| Dial-Up Internet | 0 | 0.0% |
| Broadband Home | 307 | 48.3% |
| Cellular Data Only | 28 | 4.4% |
| Satellite Internet | 10 | 1.6% |
| No Internet | 292 | 46.0% |
| Total | 635 | 100.0% |
Clarendon Summary
Clarendon is a small town located in Donley County, Texas, United States. It is situated on the banks of the Salt Fork of the Red River, approximately 25 miles east of Amarillo. The town was founded in 1878 and named after Edward Hyde, Earl of Clarendon. As of the 2010 census, the population of Clarendon was 1,973.
History
Clarendon was founded in 1878 by a group of settlers from Missouri. The town was named after Edward Hyde, Earl of Clarendon, who was a prominent English statesman during the reign of Charles II. The town was originally located on the banks of the Salt Fork of the Red River, but was moved to its current location in 1882.
The town was an important stop on the Fort Worth and Denver City Railway, which was built in 1887. The railway brought new settlers to the area and helped to spur the growth of the town. The town was incorporated in 1890 and by 1900, the population had grown to 1,000.
Clarendon was a major center for the cattle industry in the early 20th century. The town was home to several large ranches, including the JA Ranch, which was founded by Charles Goodnight and John Adair in 1876. The town also had several large stockyards and a number of meatpacking plants.
The town was also home to a number of educational institutions, including Clarendon College, which was founded in 1905. The college was closed in the 1950s, but the town still has a number of schools, including Clarendon High School.
Geography
Clarendon is located in Donley County, Texas, approximately 25 miles east of Amarillo. The town is situated on the banks of the Salt Fork of the Red River. The town has a total area of 2.2 square miles, all of which is land.
The town has a semi-arid climate, with hot summers and mild winters. The average temperature in July is 91°F and the average temperature in January is 37°F. The average annual precipitation is 19.5 inches.
Economy
The economy of Clarendon is largely based on agriculture and ranching. The town is home to several large ranches, including the JA Ranch, which was founded by Charles Goodnight and John Adair in 1876. The town also has a number of meatpacking plants and stockyards.
The town is also home to a number of small businesses, including restaurants, retail stores, and service providers. The town is also home to a number of educational institutions, including Clarendon College, which was founded in 1905.
Demographics
As of the 2010 census, the population of Clarendon was 1,973. The racial makeup of the town was 79.3% White, 0.2% African American, 0.7% Native American, 0.2% Asian, 0.1% Pacific Islander, 17.3% from other races, and 2.4% from two or more races. Hispanic or Latino of any race were 33.2% of the population.
The median income for a household in the town was $31,250 and the median income for a family was $37,500. The per capita income for the town was $17,845. About 17.3% of families and 20.3% of the population were below the poverty line, including 28.3% of those under age 18 and 11.2% of those age 65 or over.
Common Questions
What is Per Capita Income in Clarendon?
Per Capita income in Clarendon is $20,057.
What is the Median Family Income in Clarendon?
Median Family Income in Clarendon is $73,281.
What is the Median Household income in Clarendon?
Median Household Income in Clarendon is $47,457.
What is Income or Wage Gap in Clarendon?
Income or Wage Gap in Clarendon is 13.2%.
Women in Clarendon earn 86.8 cents for every dollar earned by a man.
What is Inequality or Gini Index in Clarendon?
Inequality or Gini Index in Clarendon is 0.39.
What is the Total Population of Clarendon?
Total Population of Clarendon is 1,730.
What is the Total Male Population of Clarendon?
Total Male Population of Clarendon is 867.
What is the Total Female Population of Clarendon?
Total Female Population of Clarendon is 863.
What is the Ratio of Males per 100 Females in Clarendon?
There are 100.46 Males per 100 Females in Clarendon.
What is the Ratio of Females per 100 Males in Clarendon?
There are 99.54 Females per 100 Males in Clarendon.
What is the Median Population Age in Clarendon?
Median Population Age in Clarendon is 33.7 Years.
What is the Average Family Size in Clarendon
Average Family Size in Clarendon is 3.0 People.
What is the Average Household Size in Clarendon
Average Household Size in Clarendon is 2.2 People.
How Large is the Labor Force in Clarendon?
There are 642 People in the Labor Forcein in Clarendon.
What is the Percentage of People in the Labor Force in Clarendon?
46.1% of People are in the Labor Force in Clarendon.