Zip Codes with the Highest Percentage of Population Employed in Farming, Fishing & Forestry in Houston, TX

RELATED REPORTS & OPTIONS

Farming, Fishing & Forestry
Population
Families and Households
Female Fertility
Female Fertility (Unmarried)
Race (Community Size)
Race (Percentage)
Ancestry (Community Size)
AfghanAfricanAlaska NativeAlaskan AthabascanAlbanianAlsatianAmericanApacheArabArgentineanArmenianAssyrian / Chaldean / SyriacAustralianAustrianBahamianBangladeshiBarbadianBasqueBelgianBelizeanBermudanBhutaneseBlackfeetBolivianBrazilianBritishBritish West IndianBulgarianBurmeseCajunCambodianCanadianCape VerdeanCelticCentral AmericanCentral American IndianCherokeeChickasawChileanChippewaChoctawColombianComancheCosta RicanCreekCroatianCubanCypriotCzechCzechoslovakianDanishDelawareDominicanDutchDutch West IndianEastern EuropeanEcuadorianEgyptianEnglishEstonianEthiopianEuropeanFilipinoFinnishFrenchFrench American IndianFrench CanadianGermanGhanaianGreekGuamanian / ChamorroGuatemalanGuyaneseHaitianHonduranHoumaHungarianIcelanderIndian (Asian)IndonesianInupiatIranianIraqiIrishIroquoisIsraeliItalianJamaicanJapaneseJordanianKenyanKiowaKoreanLaotianLatvianLebaneseLiberianLithuanianLumbeeLuxembourgerMacedonianMalaysianMalteseMexicanMexican American IndianMongolianMoroccanNative HawaiianNavajoNew ZealanderNicaraguanNigerianNorthern EuropeanNorwegianOkinawanOsagePakistaniPalestinianPanamanianParaguayanPennsylvania GermanPeruvianPolishPortuguesePotawatomiPuebloPuerto RicanRomanianRussianSalvadoranSamoanScandinavianScotch-IrishScottishSeminoleSenegaleseSerbianSierra LeoneanSiouxSlavicSlovakSloveneSomaliSouth AfricanSouth AmericanSouth American IndianSoviet UnionSpaniardSpanishSpanish AmericanSpanish American IndianSri LankanSubsaharan AfricanSudaneseSwedishSwissSyrianThaiTrinidadian and TobagonianTurkishU.S. Virgin IslanderUgandanUkrainianUruguayanUteVenezuelanVietnameseWelshWest IndianYaquiYugoslavian
Ancestry (Percentage)
AfghanAfricanAlaska NativeAlaskan AthabascanAlbanianAlsatianAmericanApacheArabArgentineanArmenianAssyrian / Chaldean / SyriacAustralianAustrianBahamianBangladeshiBarbadianBasqueBelgianBelizeanBermudanBhutaneseBlackfeetBolivianBrazilianBritishBritish West IndianBulgarianBurmeseCajunCambodianCanadianCape VerdeanCelticCentral AmericanCentral American IndianCherokeeChickasawChileanChippewaChoctawColombianComancheCosta RicanCreekCroatianCubanCypriotCzechCzechoslovakianDanishDelawareDominicanDutchDutch West IndianEastern EuropeanEcuadorianEgyptianEnglishEstonianEthiopianEuropeanFilipinoFinnishFrenchFrench American IndianFrench CanadianGermanGhanaianGreekGuamanian / ChamorroGuatemalanGuyaneseHaitianHonduranHoumaHungarianIcelanderIndian (Asian)IndonesianInupiatIranianIraqiIrishIroquoisIsraeliItalianJamaicanJapaneseJordanianKenyanKiowaKoreanLaotianLatvianLebaneseLiberianLithuanianLumbeeLuxembourgerMacedonianMalaysianMalteseMexicanMexican American IndianMongolianMoroccanNative HawaiianNavajoNew ZealanderNicaraguanNigerianNorthern EuropeanNorwegianOkinawanOsagePakistaniPalestinianPanamanianParaguayanPennsylvania GermanPeruvianPolishPortuguesePotawatomiPuebloPuerto RicanRomanianRussianSalvadoranSamoanScandinavianScotch-IrishScottishSeminoleSenegaleseSerbianSierra LeoneanSiouxSlavicSlovakSloveneSomaliSouth AfricanSouth AmericanSouth American IndianSoviet UnionSpaniardSpanishSpanish AmericanSpanish American IndianSri LankanSubsaharan AfricanSudaneseSwedishSwissSyrianThaiTrinidadian and TobagonianTurkishU.S. Virgin IslanderUgandanUkrainianUruguayanUteVenezuelanVietnameseWelshWest IndianYaquiYugoslavian
Immigrant Origin (Total)
AfghanistanAfricaAlbaniaArgentinaArmeniaAsiaAustraliaAustriaBahamasBangladeshBarbadosBelarusBelgiumBelizeBoliviaBosnia and HerzegovinaBrazilBulgariaBurma / MyanmarCambodiaCameroonCanadaCaribbeanCentral AmericaChileChinaColombiaCongoCosta RicaCroatiaCubaCzechoslovakiaDenmarkDominicaDominican RepublicEastern AfricaEastern AsiaEastern EuropeEcuadorEgyptEl SalvadorEnglandEritreaEthiopiaEuropeFranceGermanyGhanaGreeceGrenadaGuatemalaGuyanaHaitiHondurasHong KongHungaryIndiaIndonesiaIranIraqIrelandIsraelItalyJamaicaJapanJordanKazakhstanKenyaKoreaKuwaitLaosLatin AmericaLatviaLebanonLiberiaMalaysiaMexicoMicronesiaMiddle AfricaMoroccoNepalNetherlandsNicaraguaNigeriaNorth MacedoniaNorthern AfricaNorthern EuropeNorwayOceaniaPakistanPanamaPeruPhilippinesPolandPortugalRomaniaRussiaSaudi ArabiaScotlandSenegalSerbiaSierra LeoneSingaporeSomaliaSouth AfricaSouth AmericaSouth Central AsiaSouth Eastern AsiaSouthern EuropeSpainSri LankaSt. Vincent and the GrenadinesSudanSwedenSwitzerlandSyriaTaiwanThailandTrinidad and TobagoTurkeyUgandaUkraineUruguayUzbekistanVenezuelaVietnamWest IndiesWestern AfricaWestern AsiaWestern EuropeYemenZaireZimbabwe
Immigrant Origin (Percentage)
AfghanistanAfricaAlbaniaArgentinaArmeniaAsiaAustraliaAustriaBahamasBangladeshBarbadosBelarusBelgiumBelizeBoliviaBosnia and HerzegovinaBrazilBulgariaBurma / MyanmarCambodiaCameroonCanadaCaribbeanCentral AmericaChileChinaColombiaCongoCosta RicaCroatiaCubaCzechoslovakiaDenmarkDominicaDominican RepublicEastern AfricaEastern AsiaEastern EuropeEcuadorEgyptEl SalvadorEnglandEritreaEthiopiaEuropeFranceGermanyGhanaGreeceGrenadaGuatemalaGuyanaHaitiHondurasHong KongHungaryIndiaIndonesiaIranIraqIrelandIsraelItalyJamaicaJapanJordanKazakhstanKenyaKoreaKuwaitLaosLatin AmericaLatviaLebanonLiberiaMalaysiaMexicoMicronesiaMiddle AfricaMoroccoNepalNetherlandsNicaraguaNigeriaNorth MacedoniaNorthern AfricaNorthern EuropeNorwayOceaniaPakistanPanamaPeruPhilippinesPolandPortugalRomaniaRussiaSaudi ArabiaScotlandSenegalSerbiaSierra LeoneSingaporeSomaliaSouth AfricaSouth AmericaSouth Central AsiaSouth Eastern AsiaSouthern EuropeSpainSri LankaSt. Vincent and the GrenadinesSudanSwedenSwitzerlandSyriaTaiwanThailandTrinidad and TobagoTurkeyUgandaUkraineUruguayUzbekistanVenezuelaVietnamWest IndiesWestern AfricaWestern AsiaWestern EuropeYemenZaireZimbabwe
Income
Income (Families)
Income (Households)
Poverty
Poverty (Families)
Unemployment
Employment Occupations
Employment Industries
Employer Class
Commute Time
Commute Means
School Enrollment
Education by Degree Field
Occupancy
Finances
Physical Characteristics
Houston
Compare Zip Codes
Comparison Subject

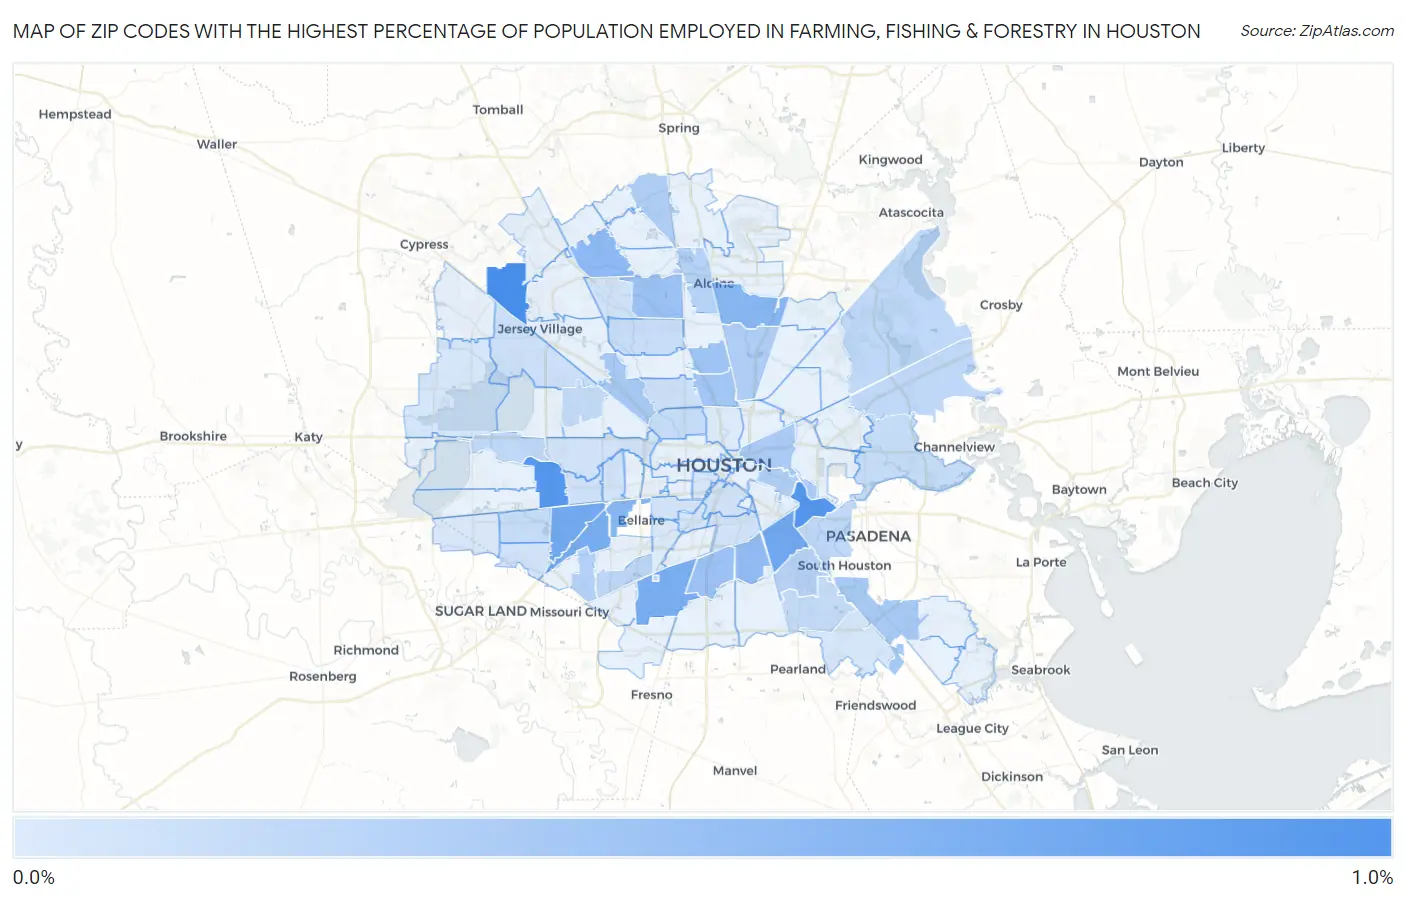
Map of Zip Codes with the Highest Percentage of Population Employed in Farming, Fishing & Forestry in Houston

0.0%
1.0%
Zip Codes with the Highest Percentage of Population Employed in Farming, Fishing & Forestry in Houston Map

Zip Codes with the Highest Percentage of Population Employed in Farming, Fishing & Forestry in Houston, TX

Zip Code % Employed vs State vs National
1.770650.80%0.37%(+0.432)#5660.61%(+0.199)#10,753
2.770420.73%0.37%(+0.359)#5910.61%(+0.126)#11,196
3.770120.73%0.37%(+0.356)#5930.61%(+0.122)#11,218
4.770870.58%0.37%(+0.211)#6370.61%(-0.023)#12,179
5.770360.57%0.37%(+0.202)#6410.61%(-0.031)#12,255
6.770740.54%0.37%(+0.172)#6540.61%(-0.061)#12,490
7.770450.54%0.37%(+0.165)#6600.61%(-0.068)#12,542
8.770810.46%0.37%(+0.093)#6850.61%(-0.141)#13,141
9.770390.46%0.37%(+0.087)#6930.61%(-0.146)#13,206
10.770660.42%0.37%(+0.046)#7160.61%(-0.187)#13,603
11.770330.41%0.37%(+0.033)#7220.61%(-0.200)#13,703
12.770510.36%0.37%(-0.012)#7480.61%(-0.246)#14,158
13.770380.36%0.37%(-0.014)#7510.61%(-0.248)#14,179
14.770760.34%0.37%(-0.034)#7620.61%(-0.267)#14,389
15.770220.31%0.37%(-0.064)#7820.61%(-0.298)#14,737
16.770920.29%0.37%(-0.081)#7950.61%(-0.314)#14,938
17.770340.29%0.37%(-0.086)#7970.61%(-0.319)#14,988
18.770200.27%0.37%(-0.099)#8030.61%(-0.332)#15,134
19.770930.26%0.37%(-0.117)#8210.61%(-0.351)#15,345
20.770900.25%0.37%(-0.123)#8280.61%(-0.357)#15,433
21.770110.24%0.37%(-0.127)#8350.61%(-0.361)#15,482
22.770710.22%0.37%(-0.149)#8560.61%(-0.382)#15,794
23.770600.22%0.37%(-0.157)#8670.61%(-0.390)#15,910
24.770610.20%0.37%(-0.174)#8880.61%(-0.408)#16,169
25.770350.18%0.37%(-0.191)#9000.61%(-0.425)#16,414
26.770170.17%0.37%(-0.202)#9130.61%(-0.436)#16,576
27.770490.17%0.37%(-0.202)#9140.61%(-0.436)#16,577
28.770790.16%0.37%(-0.208)#9200.61%(-0.441)#16,673
29.770440.16%0.37%(-0.211)#9240.61%(-0.445)#16,735
30.770800.15%0.37%(-0.226)#9360.61%(-0.459)#16,985
31.770750.14%0.37%(-0.227)#9390.61%(-0.461)#17,016
32.770080.13%0.37%(-0.238)#9530.61%(-0.471)#17,201
33.770150.13%0.37%(-0.240)#9600.61%(-0.474)#17,246
34.770720.13%0.37%(-0.245)#9630.61%(-0.479)#17,312
35.770880.12%0.37%(-0.256)#9690.61%(-0.490)#17,494
36.770180.098%0.37%(-0.275)#9930.61%(-0.508)#17,812
37.770410.092%0.37%(-0.281)#9960.61%(-0.514)#17,900
38.770630.085%0.37%(-0.287)#1,0110.61%(-0.520)#18,016
39.770570.073%0.37%(-0.299)#1,0290.61%(-0.533)#18,251
40.770050.072%0.37%(-0.300)#1,0310.61%(-0.533)#18,264
41.770210.071%0.37%(-0.301)#1,0320.61%(-0.534)#18,272
42.770860.066%0.37%(-0.306)#1,0380.61%(-0.539)#18,362
43.770990.065%0.37%(-0.307)#1,0400.61%(-0.540)#18,377
44.770040.063%0.37%(-0.309)#1,0460.61%(-0.542)#18,419
45.770240.063%0.37%(-0.310)#1,0480.61%(-0.543)#18,429
46.770300.060%0.37%(-0.312)#1,0520.61%(-0.546)#18,487
47.770060.041%0.37%(-0.331)#1,0750.61%(-0.564)#18,793
48.770890.039%0.37%(-0.333)#1,0760.61%(-0.566)#18,815
49.770840.039%0.37%(-0.333)#1,0770.61%(-0.566)#18,821
50.770830.031%0.37%(-0.342)#1,0870.61%(-0.575)#18,954
51.770090.010%0.37%(-0.362)#1,1030.61%(-0.595)#19,164
52.770250.0065%0.37%(-0.366)#1,1050.61%(-0.599)#19,192

Common Questions

What are the Top 10 Zip Codes with the Highest Percentage of Population Employed in Farming, Fishing & Forestry in Houston, TX?
Top 10 Zip Codes with the Highest Percentage of Population Employed in Farming, Fishing & Forestry in Houston, TX are:
#1
0.80%
#2
0.73%
#3
0.73%
#4
0.58%
#5
0.57%
#6
0.54%
#7
0.54%
#8
0.46%
#9
0.46%
#10
0.42%
What zip code has the Highest Percentage of Population Employed in Farming, Fishing & Forestry in Houston, TX?
77065 has the Highest Percentage of Population Employed in Farming, Fishing & Forestry in Houston, TX with 0.80%.
What is the Percentage of Population Employed in Farming, Fishing & Forestry in Houston, TX?
Percentage of Population Employed in Farming, Fishing & Forestry in Houston is 0.15%.
What is the Percentage of Population Employed in Farming, Fishing & Forestry in Texas?
Percentage of Population Employed in Farming, Fishing & Forestry in Texas is 0.37%.
What is the Percentage of Population Employed in Farming, Fishing & Forestry in the United States?
Percentage of Population Employed in Farming, Fishing & Forestry in the United States is 0.61%.