Zip Codes with the Highest Percentage of Population Employed in Farming, Fishing & Forestry in Marshall, TX
RELATED REPORTS & OPTIONS
Farming, Fishing & Forestry
Marshall
Compare Zip Codes
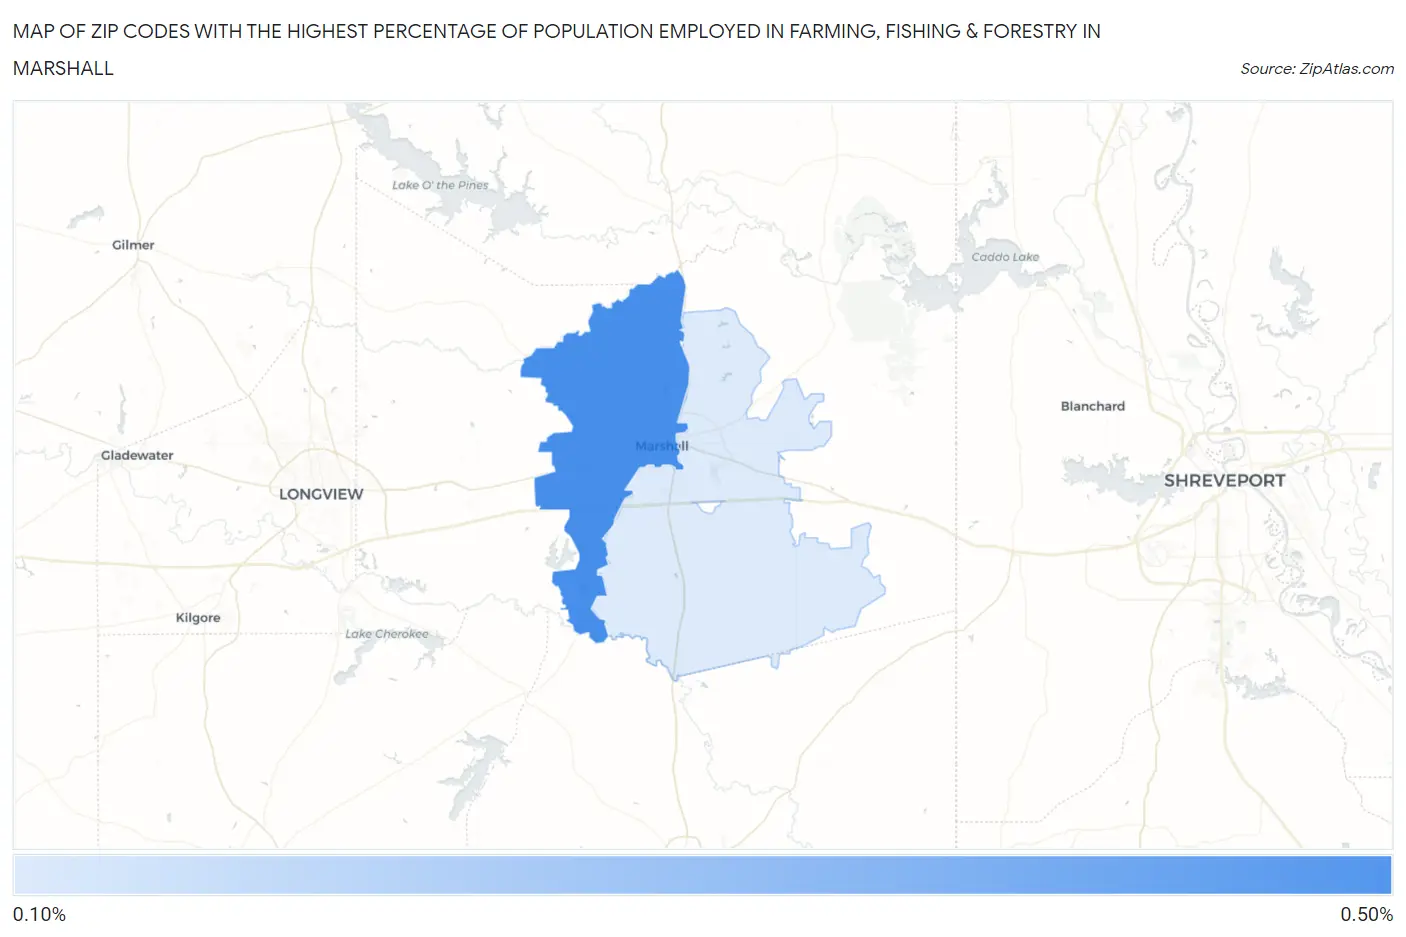
Map of Zip Codes with the Highest Percentage of Population Employed in Farming, Fishing & Forestry in Marshall
0.18%
0.40%
Zip Codes with the Highest Percentage of Population Employed in Farming, Fishing & Forestry in Marshall, TX
| Zip Code | % Employed | vs State | vs National | |
| 1. | 75670 | 0.40% | 0.37%(+0.032)#723 | 0.61%(-0.202)#13,718 |
| 2. | 75672 | 0.18% | 0.37%(-0.196)#903 | 0.61%(-0.429)#16,474 |
1
Common Questions
What are the Top Zip Codes with the Highest Percentage of Population Employed in Farming, Fishing & Forestry in Marshall, TX?
Top Zip Codes with the Highest Percentage of Population Employed in Farming, Fishing & Forestry in Marshall, TX are:
What zip code has the Highest Percentage of Population Employed in Farming, Fishing & Forestry in Marshall, TX?
75670 has the Highest Percentage of Population Employed in Farming, Fishing & Forestry in Marshall, TX with 0.40%.
What is the Percentage of Population Employed in Farming, Fishing & Forestry in Marshall, TX?
Percentage of Population Employed in Farming, Fishing & Forestry in Marshall is 0.13%.
What is the Percentage of Population Employed in Farming, Fishing & Forestry in Texas?
Percentage of Population Employed in Farming, Fishing & Forestry in Texas is 0.37%.
What is the Percentage of Population Employed in Farming, Fishing & Forestry in the United States?
Percentage of Population Employed in Farming, Fishing & Forestry in the United States is 0.61%.