Zip Codes with the Highest Percentage of Population Employed in Farming, Fishing & Forestry in Port Arthur, TX
RELATED REPORTS & OPTIONS
Farming, Fishing & Forestry
Port Arthur
Compare Zip Codes
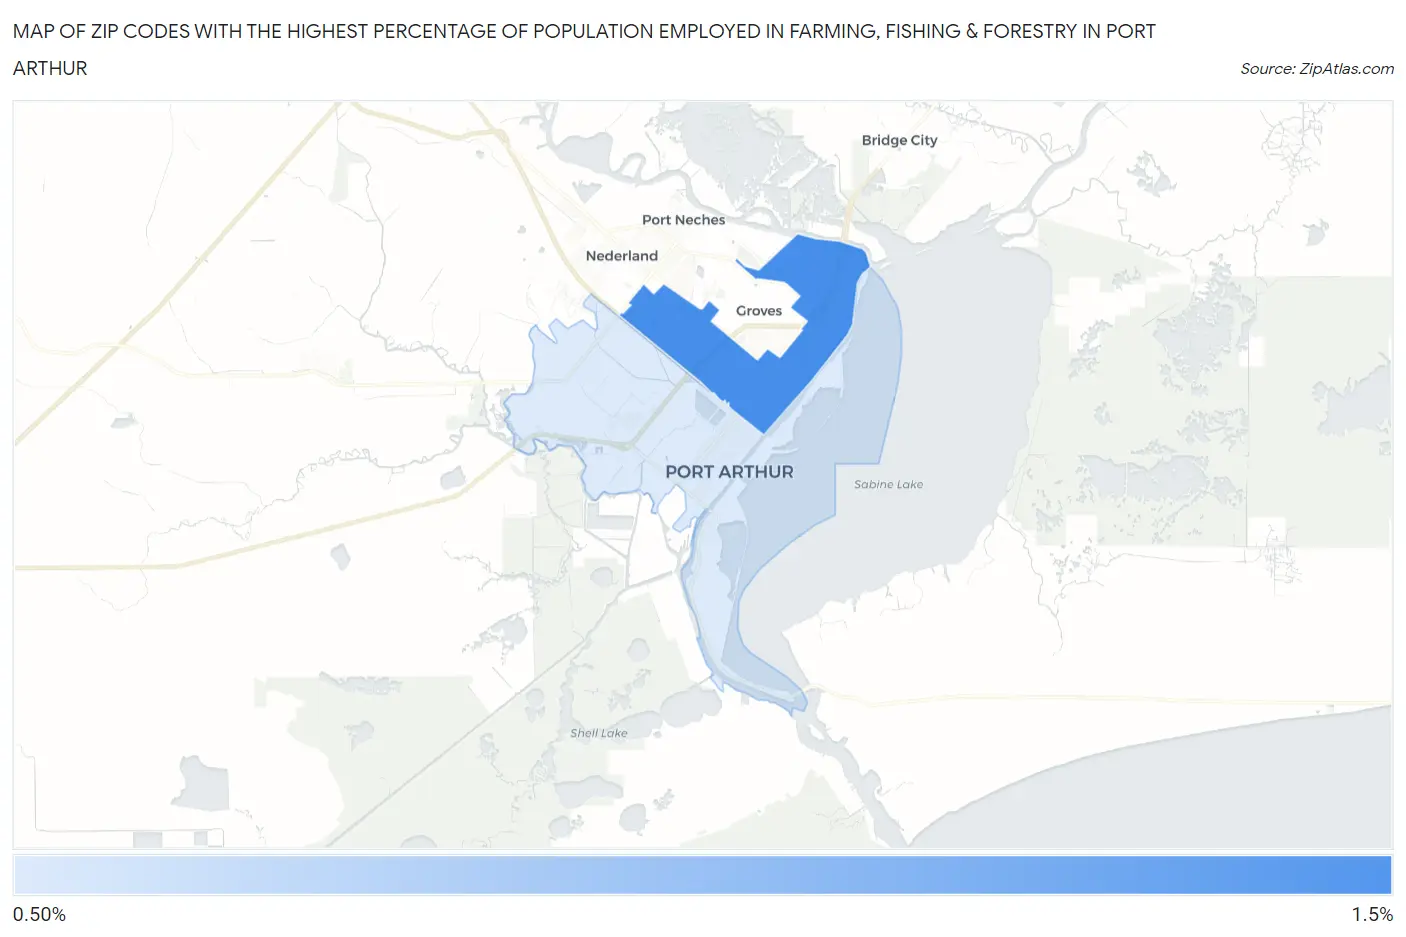
Map of Zip Codes with the Highest Percentage of Population Employed in Farming, Fishing & Forestry in Port Arthur
0.58%
1.1%
Zip Codes with the Highest Percentage of Population Employed in Farming, Fishing & Forestry in Port Arthur, TX
| Zip Code | % Employed | vs State | vs National | |
| 1. | 77642 | 1.1% | 0.37%(+0.727)#491 | 0.61%(+0.493)#9,315 |
| 2. | 77640 | 0.58% | 0.37%(+0.210)#639 | 0.61%(-0.024)#12,190 |
1
Common Questions
What are the Top Zip Codes with the Highest Percentage of Population Employed in Farming, Fishing & Forestry in Port Arthur, TX?
Top Zip Codes with the Highest Percentage of Population Employed in Farming, Fishing & Forestry in Port Arthur, TX are:
What zip code has the Highest Percentage of Population Employed in Farming, Fishing & Forestry in Port Arthur, TX?
77642 has the Highest Percentage of Population Employed in Farming, Fishing & Forestry in Port Arthur, TX with 1.1%.
What is the Percentage of Population Employed in Farming, Fishing & Forestry in Port Arthur, TX?
Percentage of Population Employed in Farming, Fishing & Forestry in Port Arthur is 0.94%.
What is the Percentage of Population Employed in Farming, Fishing & Forestry in Texas?
Percentage of Population Employed in Farming, Fishing & Forestry in Texas is 0.37%.
What is the Percentage of Population Employed in Farming, Fishing & Forestry in the United States?
Percentage of Population Employed in Farming, Fishing & Forestry in the United States is 0.61%.