Zip Codes with the Highest Percentage of Population Employed in Farming, Fishing & Forestry in Grand Prairie, TX
RELATED REPORTS & OPTIONS
Farming, Fishing & Forestry
Grand Prairie
Compare Zip Codes
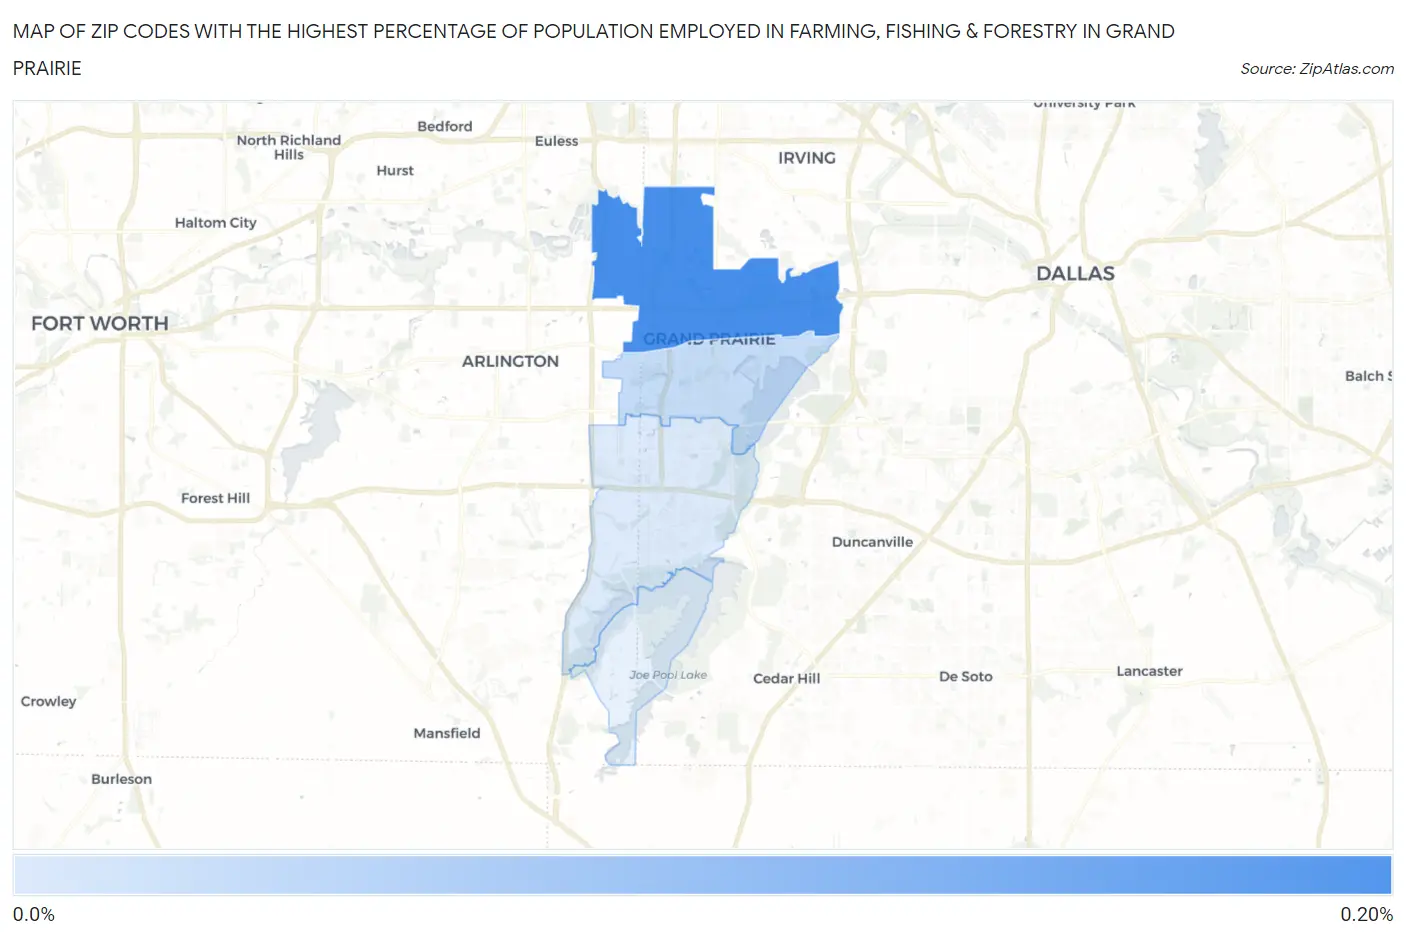
Map of Zip Codes with the Highest Percentage of Population Employed in Farming, Fishing & Forestry in Grand Prairie
0.033%
0.17%
Zip Codes with the Highest Percentage of Population Employed in Farming, Fishing & Forestry in Grand Prairie, TX
| Zip Code | % Employed | vs State | vs National | |
| 1. | 75050 | 0.17% | 0.37%(-0.202)#912 | 0.61%(-0.435)#16,573 |
| 2. | 75051 | 0.055% | 0.37%(-0.317)#1,057 | 0.61%(-0.551)#18,578 |
| 3. | 75052 | 0.033% | 0.37%(-0.339)#1,084 | 0.61%(-0.573)#18,925 |
1
Common Questions
What are the Top 3 Zip Codes with the Highest Percentage of Population Employed in Farming, Fishing & Forestry in Grand Prairie, TX?
Top 3 Zip Codes with the Highest Percentage of Population Employed in Farming, Fishing & Forestry in Grand Prairie, TX are:
What zip code has the Highest Percentage of Population Employed in Farming, Fishing & Forestry in Grand Prairie, TX?
75050 has the Highest Percentage of Population Employed in Farming, Fishing & Forestry in Grand Prairie, TX with 0.17%.
What is the Percentage of Population Employed in Farming, Fishing & Forestry in Grand Prairie, TX?
Percentage of Population Employed in Farming, Fishing & Forestry in Grand Prairie is 0.066%.
What is the Percentage of Population Employed in Farming, Fishing & Forestry in Texas?
Percentage of Population Employed in Farming, Fishing & Forestry in Texas is 0.37%.
What is the Percentage of Population Employed in Farming, Fishing & Forestry in the United States?
Percentage of Population Employed in Farming, Fishing & Forestry in the United States is 0.61%.