Big Lake, TX Map & Demographics
Big Lake Map
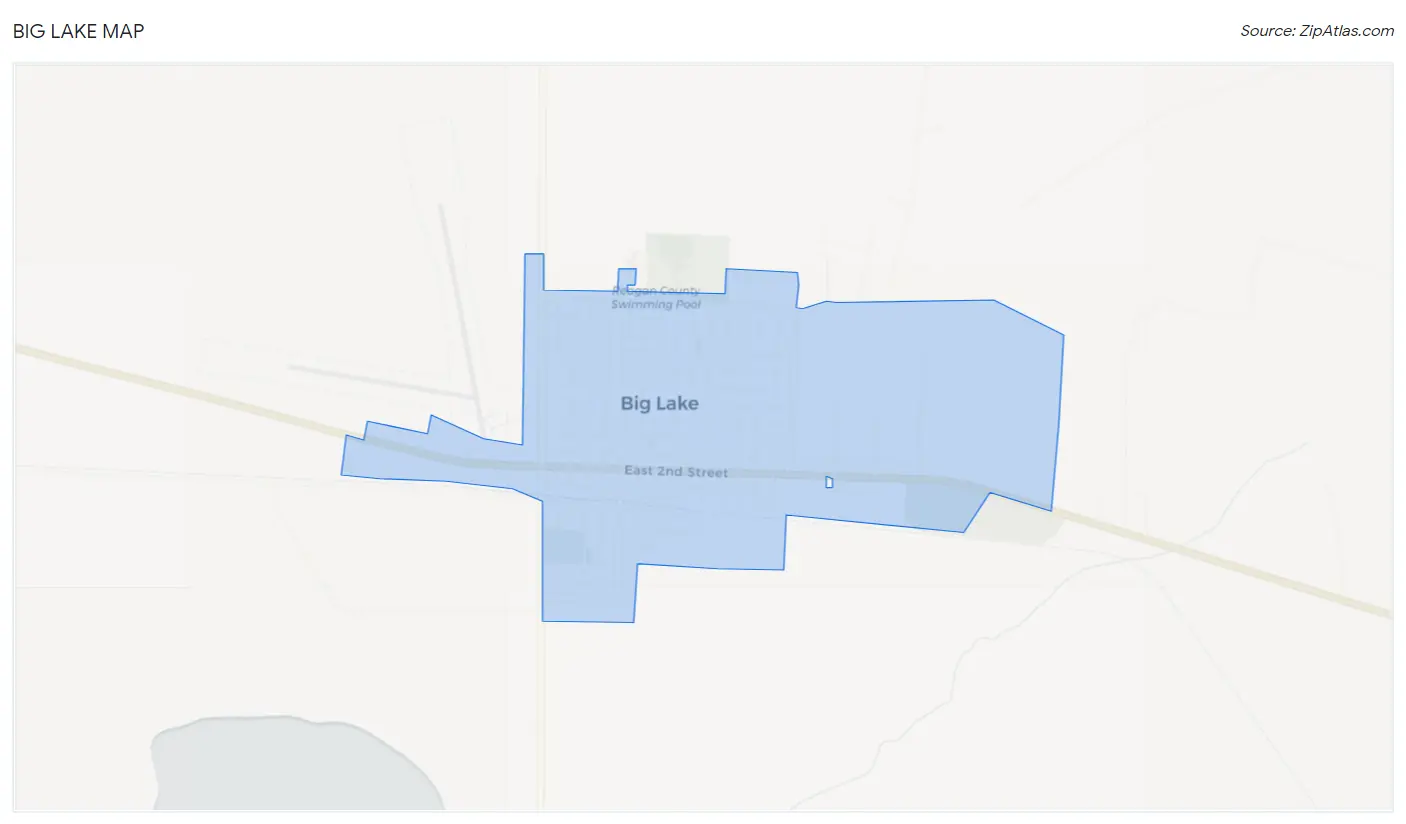
Big Lake Overview
$28,458
PER CAPITA INCOME
$80,500
AVG FAMILY INCOME
$70,160
AVG HOUSEHOLD INCOME
35.6%
WAGE / INCOME GAP [ % ]
64.4¢/ $1
WAGE / INCOME GAP [ $ ]
$5,960
FAMILY INCOME DEFICIT
0.37
INEQUALITY / GINI INDEX
2,977
TOTAL POPULATION
1,542
MALE POPULATION
1,435
FEMALE POPULATION
107.46
MALES / 100 FEMALES
93.06
FEMALES / 100 MALES
30.0
MEDIAN AGE
3.5
AVG FAMILY SIZE
3.1
AVG HOUSEHOLD SIZE
1,451
LABOR FORCE [ PEOPLE ]
69.4%
PERCENT IN LABOR FORCE
7.9%
UNEMPLOYMENT RATE
Big Lake Zip Codes
Big Lake Area Codes
Income in Big Lake
Income Overview in Big Lake
Per Capita Income in Big Lake is $28,458, while median incomes of families and households are $80,500 and $70,160 respectively.
| Characteristic | Number | Measure |
| Per Capita Income | 2,977 | $28,458 |
| Median Family Income | 784 | $80,500 |
| Mean Family Income | 784 | $94,027 |
| Median Household Income | 956 | $70,160 |
| Mean Household Income | 956 | $83,816 |
| Income Deficit | 784 | $5,960 |
| Wage / Income Gap (%) | 2,977 | 35.63% |
| Wage / Income Gap ($) | 2,977 | 64.37¢ per $1 |
| Gini / Inequality Index | 2,977 | 0.37 |
Earnings by Sex in Big Lake
Average Earnings in Big Lake are $46,179, $51,500 for men and $33,152 for women, a difference of 35.6%.
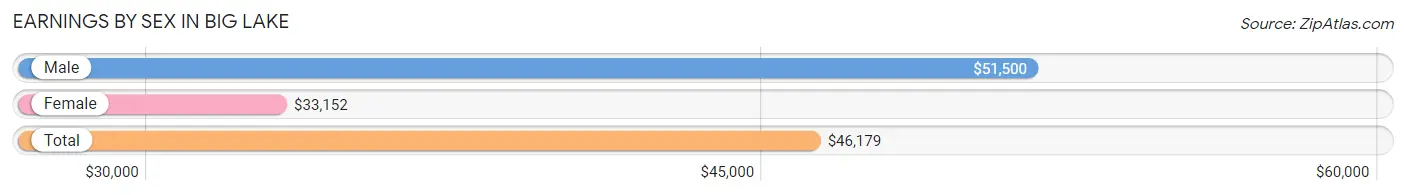
| Sex | Number | Average Earnings |
| Male | 924 (62.5%) | $51,500 |
| Female | 554 (37.5%) | $33,152 |
| Total | 1,478 (100.0%) | $46,179 |
Earnings by Sex by Income Bracket in Big Lake
The most common earnings brackets in Big Lake are $100,000+ for men (149 | 16.1%) and $55,000 to $64,999 for women (99 | 17.9%).
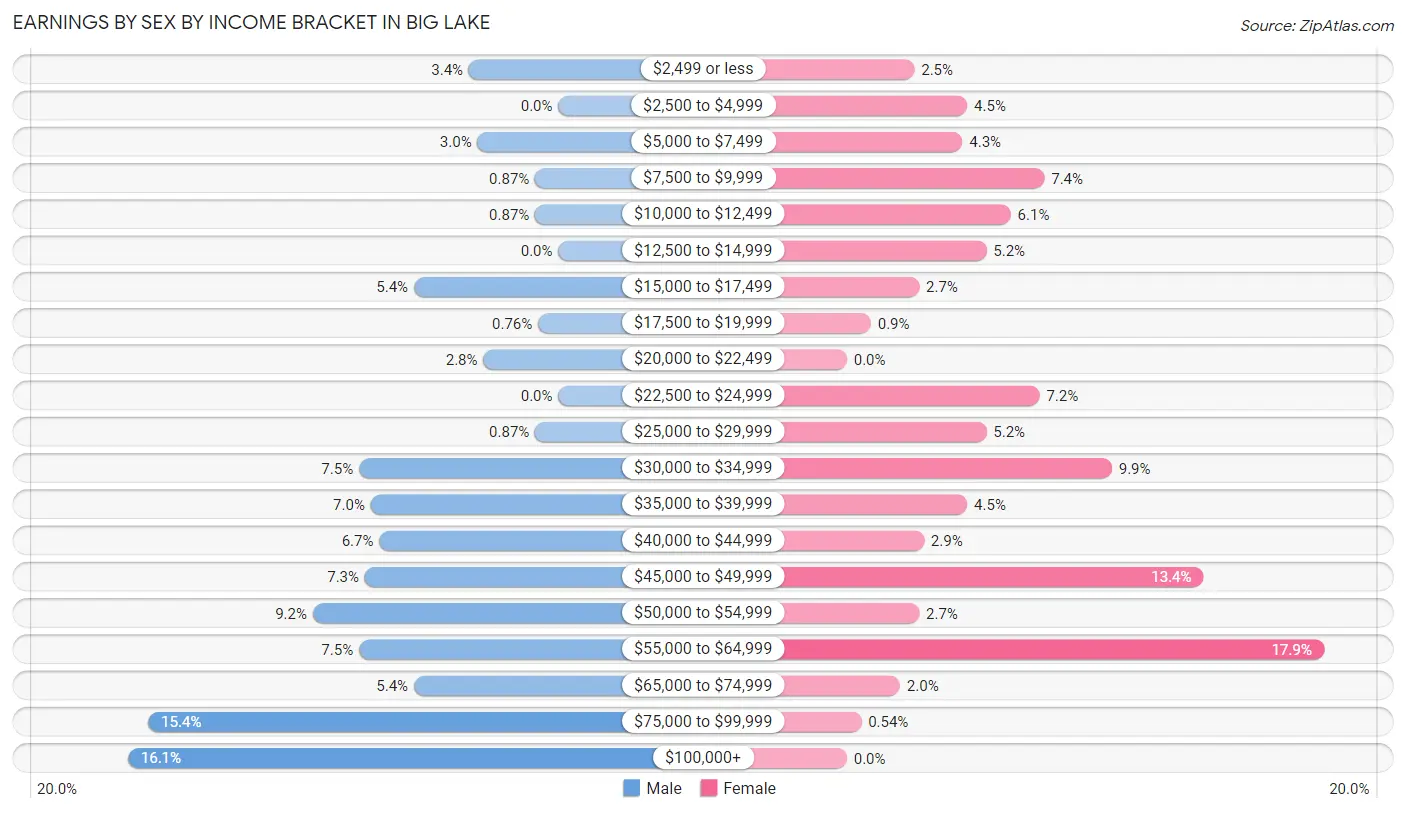
| Income | Male | Female |
| $2,499 or less | 31 (3.4%) | 14 (2.5%) |
| $2,500 to $4,999 | 0 (0.0%) | 25 (4.5%) |
| $5,000 to $7,499 | 28 (3.0%) | 24 (4.3%) |
| $7,500 to $9,999 | 8 (0.9%) | 41 (7.4%) |
| $10,000 to $12,499 | 8 (0.9%) | 34 (6.1%) |
| $12,500 to $14,999 | 0 (0.0%) | 29 (5.2%) |
| $15,000 to $17,499 | 50 (5.4%) | 15 (2.7%) |
| $17,500 to $19,999 | 7 (0.8%) | 5 (0.9%) |
| $20,000 to $22,499 | 26 (2.8%) | 0 (0.0%) |
| $22,500 to $24,999 | 0 (0.0%) | 40 (7.2%) |
| $25,000 to $29,999 | 8 (0.9%) | 29 (5.2%) |
| $30,000 to $34,999 | 69 (7.5%) | 55 (9.9%) |
| $35,000 to $39,999 | 65 (7.0%) | 25 (4.5%) |
| $40,000 to $44,999 | 62 (6.7%) | 16 (2.9%) |
| $45,000 to $49,999 | 67 (7.2%) | 74 (13.4%) |
| $50,000 to $54,999 | 85 (9.2%) | 15 (2.7%) |
| $55,000 to $64,999 | 69 (7.5%) | 99 (17.9%) |
| $65,000 to $74,999 | 50 (5.4%) | 11 (2.0%) |
| $75,000 to $99,999 | 142 (15.4%) | 3 (0.5%) |
| $100,000+ | 149 (16.1%) | 0 (0.0%) |
| Total | 924 (100.0%) | 554 (100.0%) |
Earnings by Sex by Educational Attainment in Big Lake
Average earnings in Big Lake are $55,536 for men and $34,565 for women, a difference of 37.8%. Men with an educational attainment of bachelor's degree enjoy the highest average annual earnings of $120,385, while those with college or associate's degree education earn the least with $42,361. Women with an educational attainment of bachelor's degree earn the most with the average annual earnings of $62,784, while those with high school diploma education have the smallest earnings of $24,261.
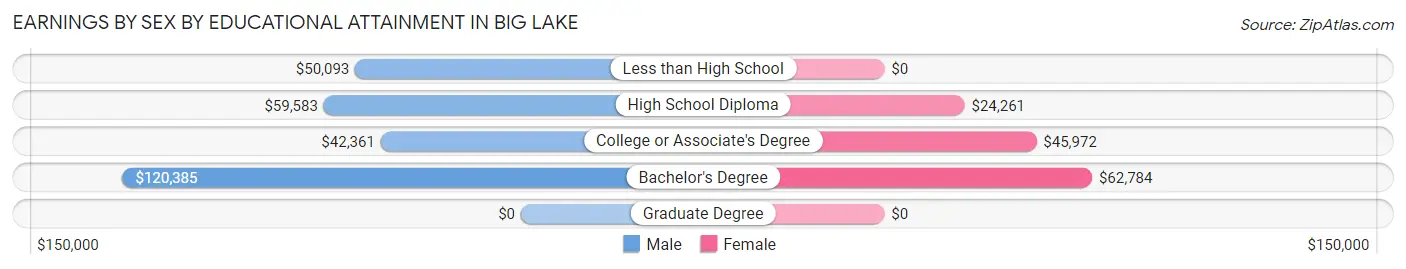
| Educational Attainment | Male Income | Female Income |
| Less than High School | $50,093 | $0 |
| High School Diploma | $59,583 | $24,261 |
| College or Associate's Degree | $42,361 | $45,972 |
| Bachelor's Degree | $120,385 | $62,784 |
| Graduate Degree | - | - |
| Total | $55,536 | $34,565 |
Family Income in Big Lake
Family Income Brackets in Big Lake
According to the Big Lake family income data, there are 223 families falling into the $50,000 to $74,999 income range, which is the most common income bracket and makes up 28.4% of all families.
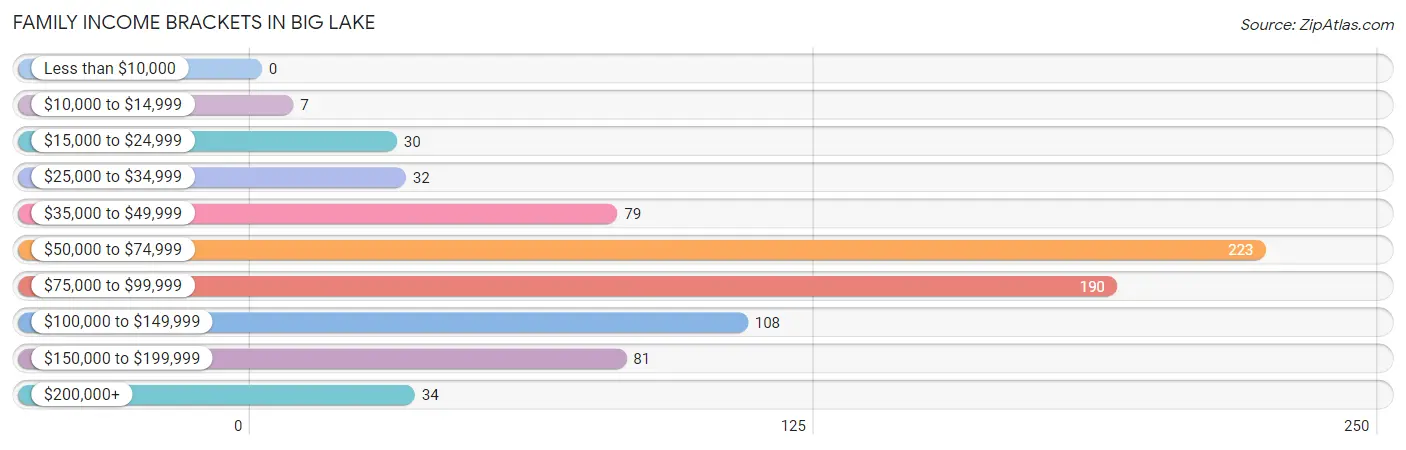
| Income Bracket | # Families | % Families |
| Less than $10,000 | 0 | 0.0% |
| $10,000 to $14,999 | 7 | 0.9% |
| $15,000 to $24,999 | 30 | 3.8% |
| $25,000 to $34,999 | 32 | 4.1% |
| $35,000 to $49,999 | 79 | 10.1% |
| $50,000 to $74,999 | 223 | 28.4% |
| $75,000 to $99,999 | 190 | 24.2% |
| $100,000 to $149,999 | 108 | 13.8% |
| $150,000 to $199,999 | 81 | 10.3% |
| $200,000+ | 34 | 4.3% |
Family Income by Famaliy Size in Big Lake
2-person families (291 | 37.1%) account for the highest median family income in Big Lake with $95,341 per family, while 2-person families (291 | 37.1%) have the highest median income of $47,670 per family member.
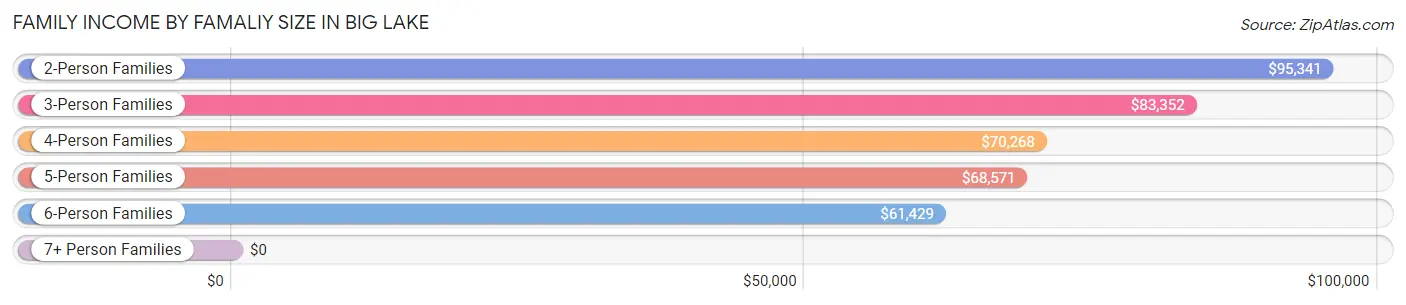
| Income Bracket | # Families | Median Income |
| 2-Person Families | 291 (37.1%) | $95,341 |
| 3-Person Families | 133 (17.0%) | $83,352 |
| 4-Person Families | 246 (31.4%) | $70,268 |
| 5-Person Families | 52 (6.6%) | $68,571 |
| 6-Person Families | 60 (7.6%) | $61,429 |
| 7+ Person Families | 2 (0.3%) | $0 |
| Total | 784 (100.0%) | $80,500 |
Family Income by Number of Earners in Big Lake
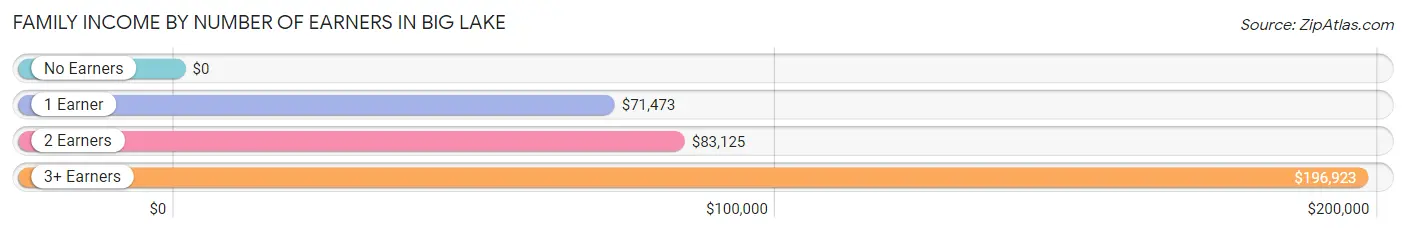
| Number of Earners | # Families | Median Income |
| No Earners | 42 (5.4%) | $0 |
| 1 Earner | 311 (39.7%) | $71,473 |
| 2 Earners | 371 (47.3%) | $83,125 |
| 3+ Earners | 60 (7.6%) | $196,923 |
| Total | 784 (100.0%) | $80,500 |
Household Income in Big Lake
Household Income Brackets in Big Lake
With 235 households falling in the category, the $50,000 to $74,999 income range is the most frequent in Big Lake, accounting for 24.6% of all households. In contrast, only 7 households (0.7%) fall into the $10,000 to $14,999 income bracket, making it the least populous group.
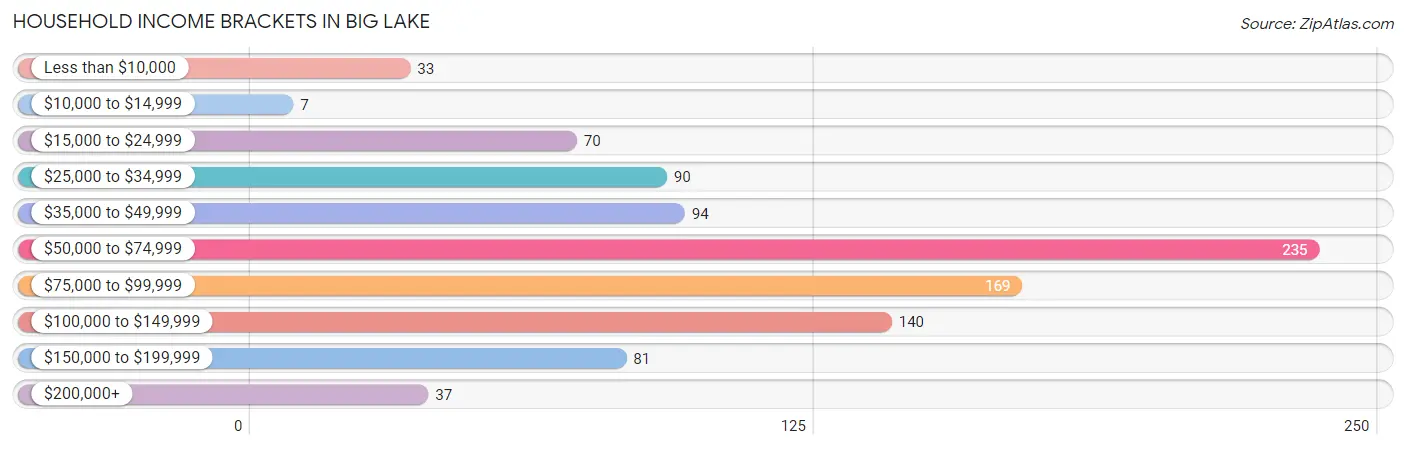
| Income Bracket | # Households | % Households |
| Less than $10,000 | 33 | 3.5% |
| $10,000 to $14,999 | 7 | 0.7% |
| $15,000 to $24,999 | 70 | 7.3% |
| $25,000 to $34,999 | 90 | 9.4% |
| $35,000 to $49,999 | 94 | 9.8% |
| $50,000 to $74,999 | 235 | 24.6% |
| $75,000 to $99,999 | 169 | 17.7% |
| $100,000 to $149,999 | 140 | 14.6% |
| $150,000 to $199,999 | 81 | 8.5% |
| $200,000+ | 37 | 3.9% |
Household Income by Householder Age in Big Lake
The median household income in Big Lake is $70,160, with the highest median household income of $94,868 found in the 45 to 64 years age bracket for the primary householder. A total of 304 households (31.8%) fall into this category. Meanwhile, the 15 to 24 years age bracket for the primary householder has the lowest median household income of $42,727, with 48 households (5.0%) in this group.
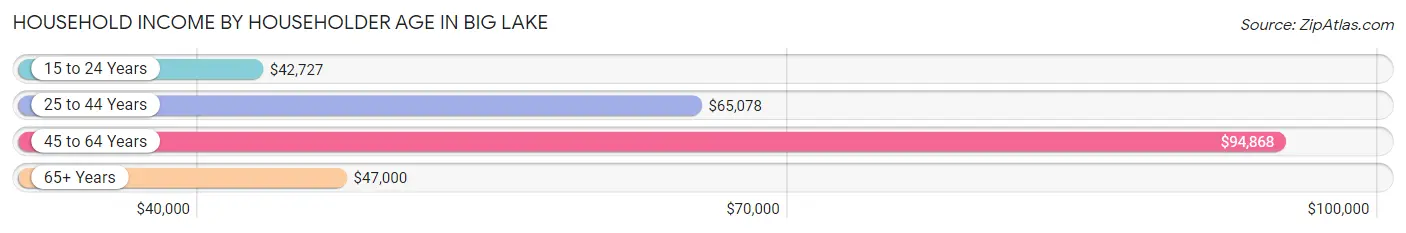
| Income Bracket | # Households | Median Income |
| 15 to 24 Years | 48 (5.0%) | $42,727 |
| 25 to 44 Years | 468 (48.9%) | $65,078 |
| 45 to 64 Years | 304 (31.8%) | $94,868 |
| 65+ Years | 136 (14.2%) | $47,000 |
| Total | 956 (100.0%) | $70,160 |
Poverty in Big Lake
Income Below Poverty by Sex and Age in Big Lake
With 7.9% poverty level for males and 8.1% for females among the residents of Big Lake, under 5 year old males and 65 to 74 year old females are the most vulnerable to poverty, with 19 males (16.8%) and 17 females (37.0%) in their respective age groups living below the poverty level.
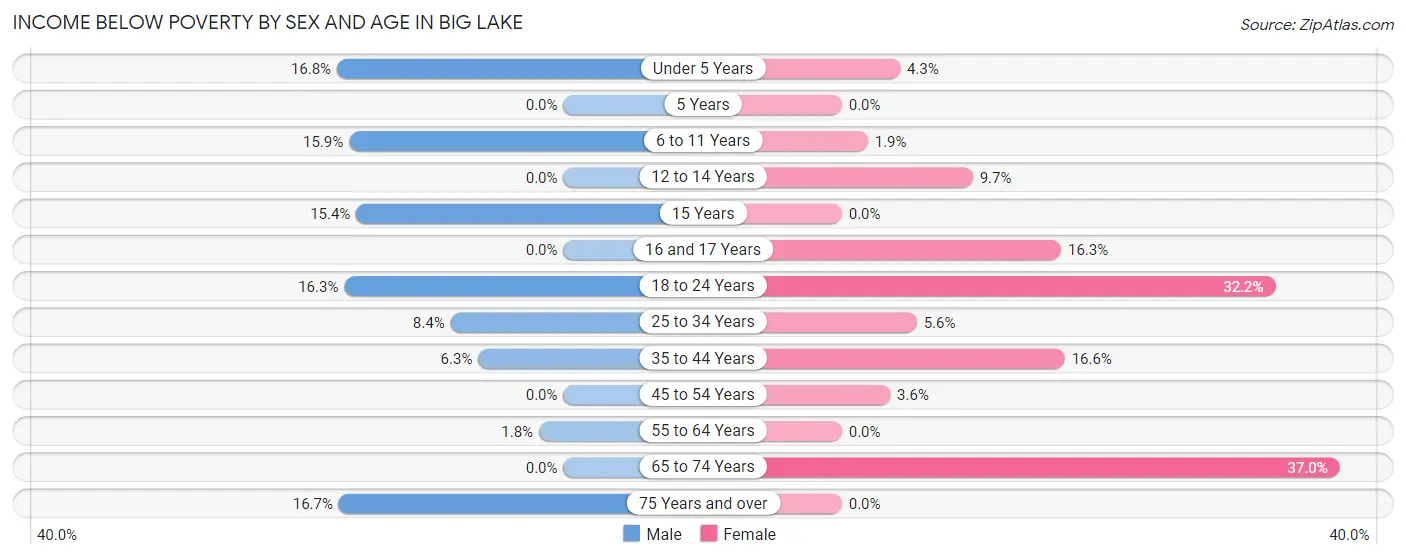
| Age Bracket | Male | Female |
| Under 5 Years | 19 (16.8%) | 8 (4.3%) |
| 5 Years | 0 (0.0%) | 0 (0.0%) |
| 6 to 11 Years | 21 (15.9%) | 4 (1.9%) |
| 12 to 14 Years | 0 (0.0%) | 7 (9.7%) |
| 15 Years | 4 (15.4%) | 0 (0.0%) |
| 16 and 17 Years | 0 (0.0%) | 7 (16.3%) |
| 18 to 24 Years | 34 (16.3%) | 28 (32.2%) |
| 25 to 34 Years | 14 (8.4%) | 15 (5.6%) |
| 35 to 44 Years | 18 (6.3%) | 23 (16.6%) |
| 45 to 54 Years | 0 (0.0%) | 6 (3.6%) |
| 55 to 64 Years | 3 (1.8%) | 0 (0.0%) |
| 65 to 74 Years | 0 (0.0%) | 17 (37.0%) |
| 75 Years and over | 8 (16.7%) | 0 (0.0%) |
| Total | 121 (7.9%) | 115 (8.1%) |
Income Above Poverty by Sex and Age in Big Lake
According to the poverty statistics in Big Lake, males aged 5 years and females aged 5 years are the age groups that are most secure financially, with 100.0% of males and 100.0% of females in these age groups living above the poverty line.
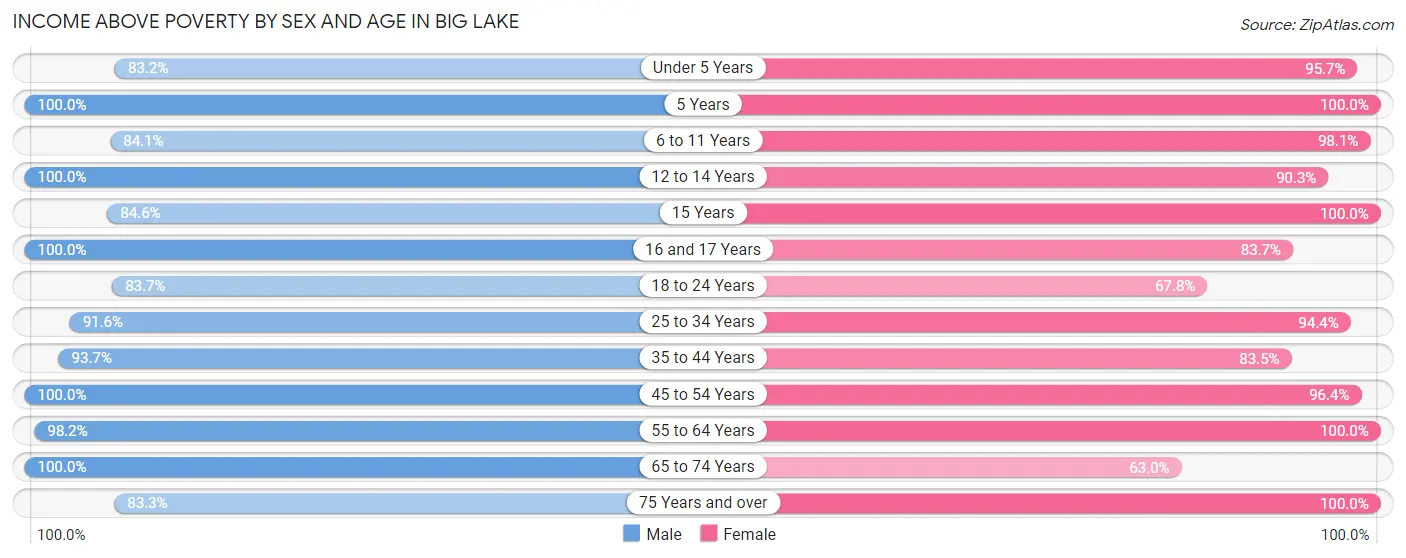
| Age Bracket | Male | Female |
| Under 5 Years | 94 (83.2%) | 177 (95.7%) |
| 5 Years | 10 (100.0%) | 4 (100.0%) |
| 6 to 11 Years | 111 (84.1%) | 203 (98.1%) |
| 12 to 14 Years | 122 (100.0%) | 65 (90.3%) |
| 15 Years | 22 (84.6%) | 15 (100.0%) |
| 16 and 17 Years | 8 (100.0%) | 36 (83.7%) |
| 18 to 24 Years | 175 (83.7%) | 59 (67.8%) |
| 25 to 34 Years | 153 (91.6%) | 255 (94.4%) |
| 35 to 44 Years | 267 (93.7%) | 116 (83.5%) |
| 45 to 54 Years | 155 (100.0%) | 161 (96.4%) |
| 55 to 64 Years | 163 (98.2%) | 159 (100.0%) |
| 65 to 74 Years | 93 (100.0%) | 29 (63.0%) |
| 75 Years and over | 40 (83.3%) | 25 (100.0%) |
| Total | 1,413 (92.1%) | 1,304 (91.9%) |
Income Below Poverty Among Married-Couple Families in Big Lake
The poverty statistics for married-couple families in Big Lake show that 4.4% or 27 of the total 615 families live below the poverty line. Families with 3 or 4 children have the highest poverty rate of 16.7%, comprising of 10 families. On the other hand, families with 5 or more children have the lowest poverty rate of 0.0%, which includes 0 families.
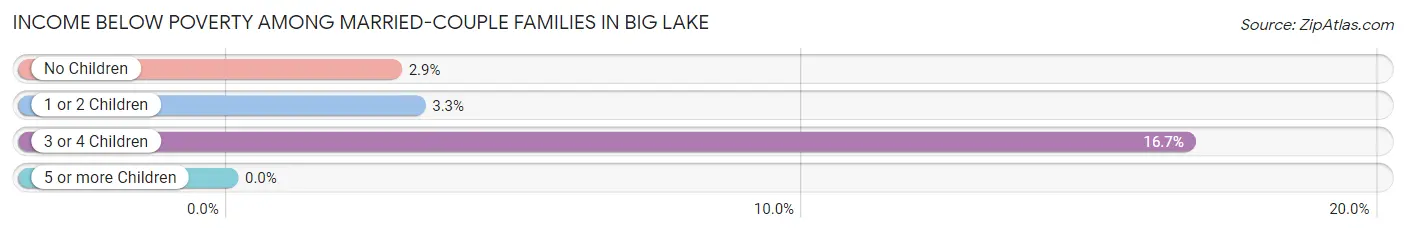
| Children | Above Poverty | Below Poverty |
| No Children | 239 (97.2%) | 7 (2.9%) |
| 1 or 2 Children | 297 (96.7%) | 10 (3.3%) |
| 3 or 4 Children | 50 (83.3%) | 10 (16.7%) |
| 5 or more Children | 2 (100.0%) | 0 (0.0%) |
| Total | 588 (95.6%) | 27 (4.4%) |
Income Below Poverty Among Single-Parent Households in Big Lake
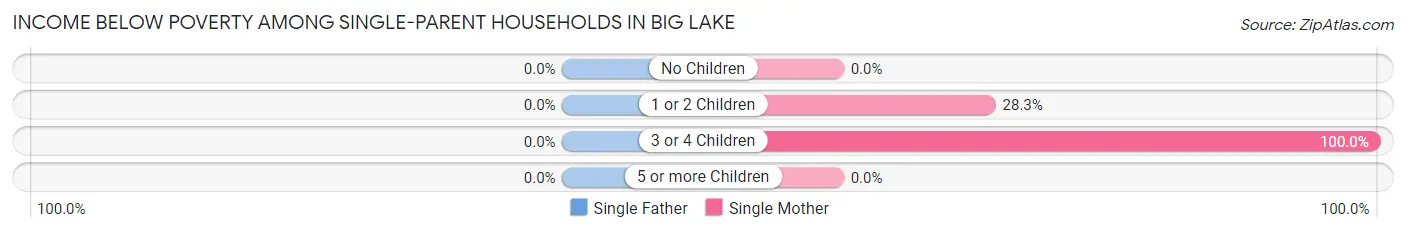
| Children | Single Father | Single Mother |
| No Children | 0 (0.0%) | 0 (0.0%) |
| 1 or 2 Children | 0 (0.0%) | 15 (28.3%) |
| 3 or 4 Children | 0 (0.0%) | 5 (100.0%) |
| 5 or more Children | 0 (0.0%) | 0 (0.0%) |
| Total | 0 (0.0%) | 20 (25.0%) |
Income Below Poverty Among Married-Couple vs Single-Parent Households in Big Lake
The poverty data for Big Lake shows that 27 of the married-couple family households (4.4%) and 20 of the single-parent households (11.8%) are living below the poverty level. Within the married-couple family households, those with 3 or 4 children have the highest poverty rate, with 10 households (16.7%) falling below the poverty line. Among the single-parent households, those with 3 or 4 children have the highest poverty rate, with 5 household (100.0%) living below poverty.
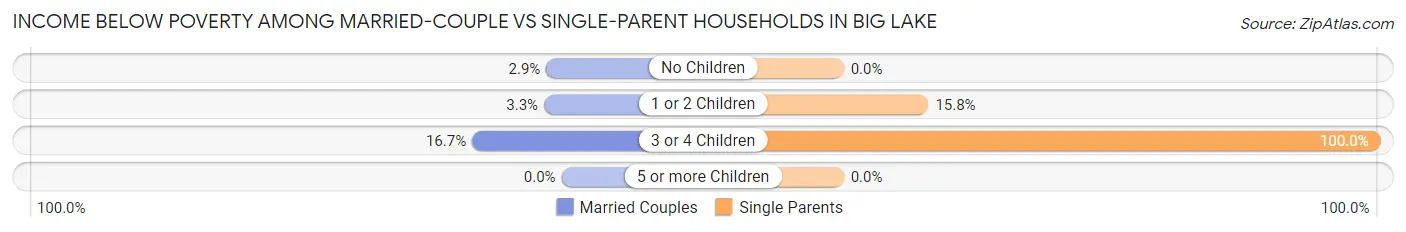
| Children | Married-Couple Families | Single-Parent Households |
| No Children | 7 (2.9%) | 0 (0.0%) |
| 1 or 2 Children | 10 (3.3%) | 15 (15.8%) |
| 3 or 4 Children | 10 (16.7%) | 5 (100.0%) |
| 5 or more Children | 0 (0.0%) | 0 (0.0%) |
| Total | 27 (4.4%) | 20 (11.8%) |
Race in Big Lake
The most populous races in Big Lake are Hispanic or Latino (2,124 | 71.4%), White / Caucasian (1,407 | 47.3%), and Some other Race (906 | 30.4%).
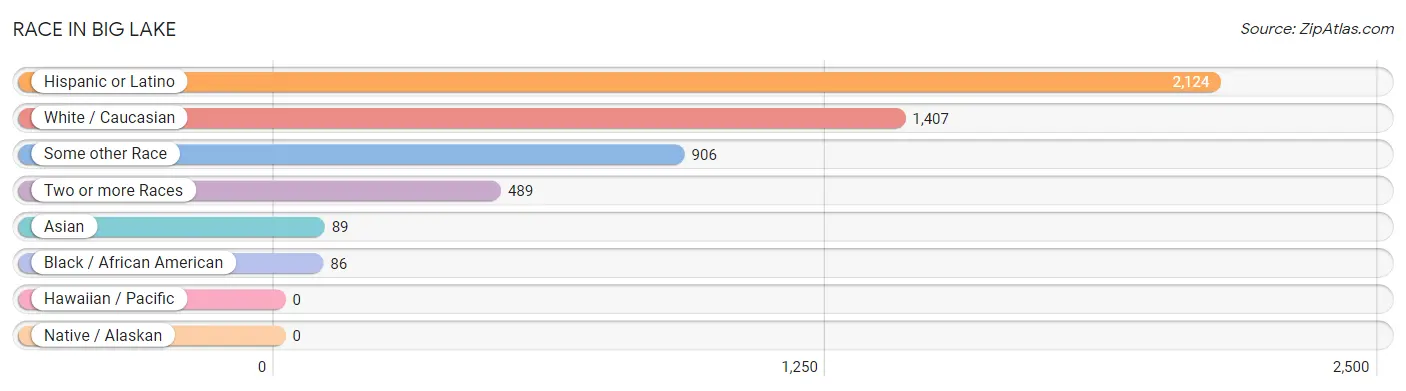
| Race | # Population | % Population |
| Asian | 89 | 3.0% |
| Black / African American | 86 | 2.9% |
| Hawaiian / Pacific | 0 | 0.0% |
| Hispanic or Latino | 2,124 | 71.4% |
| Native / Alaskan | 0 | 0.0% |
| White / Caucasian | 1,407 | 47.3% |
| Two or more Races | 489 | 16.4% |
| Some other Race | 906 | 30.4% |
| Total | 2,977 | 100.0% |
Ancestry in Big Lake
The most populous ancestries reported in Big Lake are Mexican (2,009 | 67.5%), English (105 | 3.5%), American (62 | 2.1%), Irish (40 | 1.3%), and Korean (39 | 1.3%), together accounting for 75.7% of all Big Lake residents.
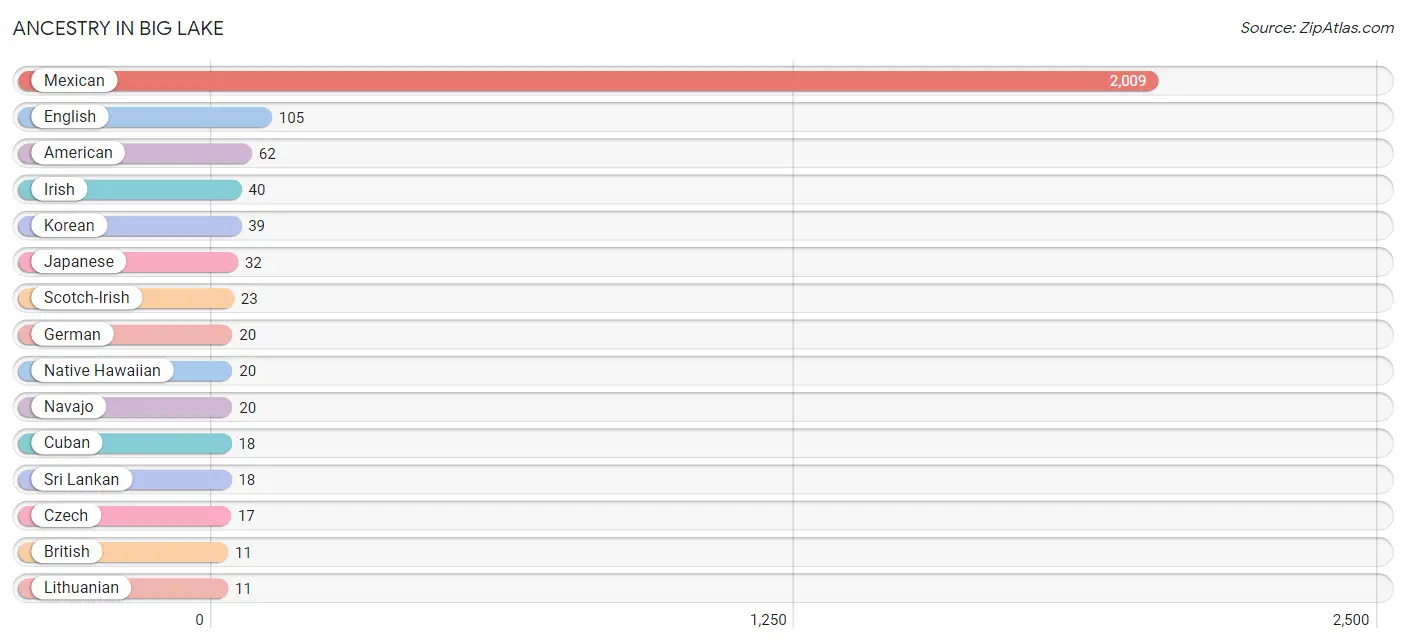
| Ancestry | # Population | % Population |
| American | 62 | 2.1% |
| British | 11 | 0.4% |
| Cuban | 18 | 0.6% |
| Czech | 17 | 0.6% |
| Dutch | 8 | 0.3% |
| English | 105 | 3.5% |
| European | 5 | 0.2% |
| Finnish | 4 | 0.1% |
| German | 20 | 0.7% |
| Irish | 40 | 1.3% |
| Japanese | 32 | 1.1% |
| Korean | 39 | 1.3% |
| Lithuanian | 11 | 0.4% |
| Mexican | 2,009 | 67.5% |
| Native Hawaiian | 20 | 0.7% |
| Navajo | 20 | 0.7% |
| Scotch-Irish | 23 | 0.8% |
| Scottish | 3 | 0.1% |
| Sri Lankan | 18 | 0.6% | View All 19 Rows |
Immigrants in Big Lake
The most numerous immigrant groups reported in Big Lake came from Latin America (272 | 9.1%), Central America (252 | 8.5%), Mexico (231 | 7.8%), Asia (71 | 2.4%), and South Eastern Asia (71 | 2.4%), together accounting for 30.1% of all Big Lake residents.
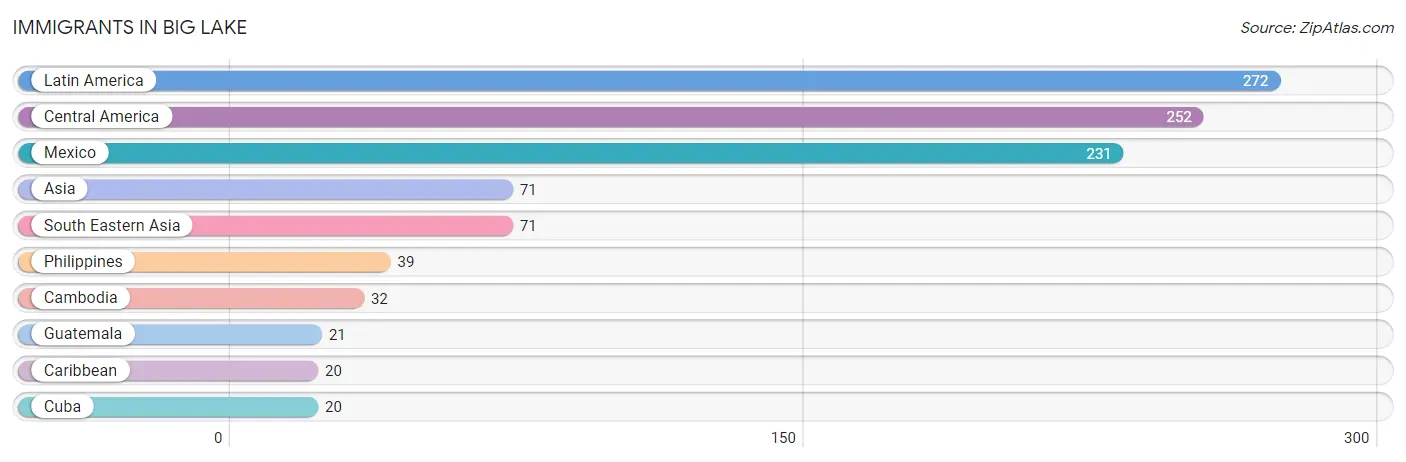
| Immigration Origin | # Population | % Population |
| Asia | 71 | 2.4% |
| Cambodia | 32 | 1.1% |
| Caribbean | 20 | 0.7% |
| Central America | 252 | 8.5% |
| Cuba | 20 | 0.7% |
| Guatemala | 21 | 0.7% |
| Latin America | 272 | 9.1% |
| Mexico | 231 | 7.8% |
| Philippines | 39 | 1.3% |
| South Eastern Asia | 71 | 2.4% | View All 10 Rows |
Sex and Age in Big Lake
Sex and Age in Big Lake
The most populous age groups in Big Lake are 40 to 44 Years (239 | 15.5%) for men and Under 5 Years (185 | 12.9%) for women.
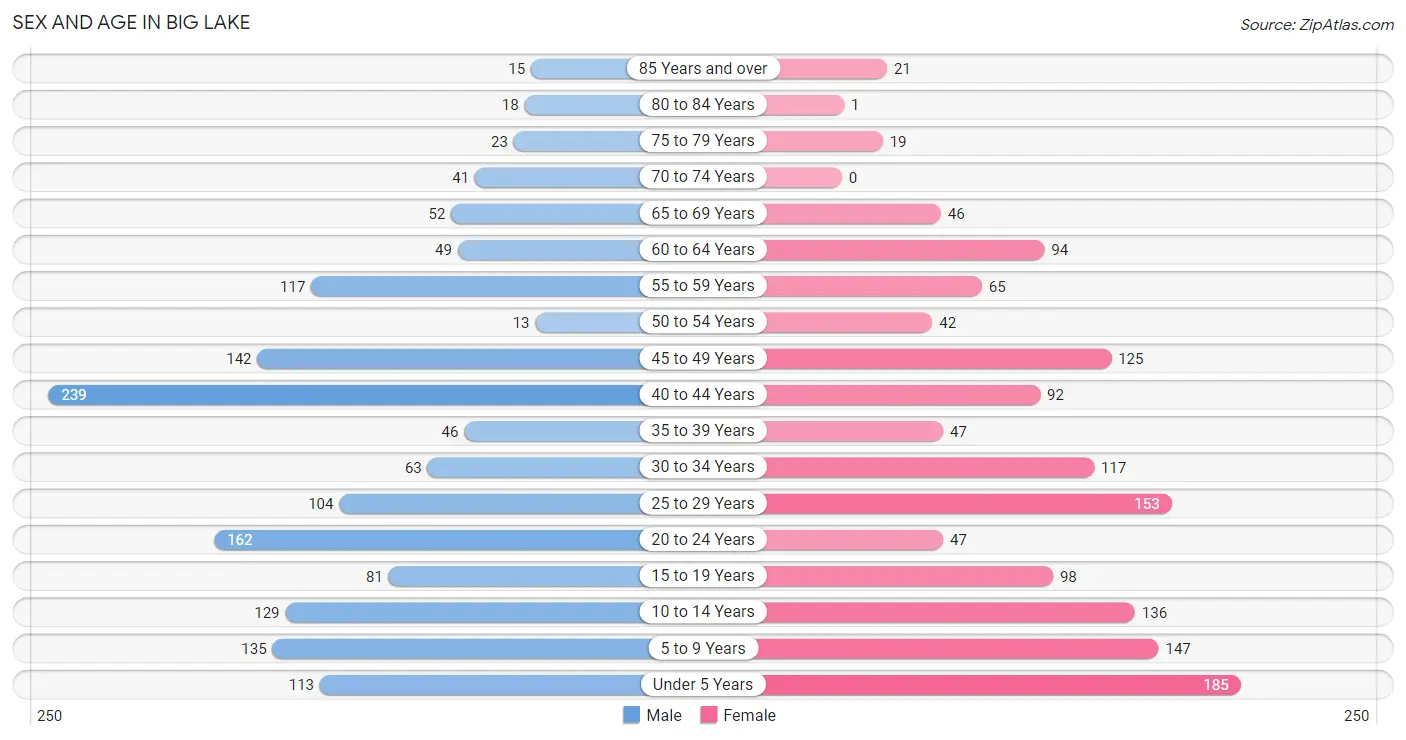
| Age Bracket | Male | Female |
| Under 5 Years | 113 (7.3%) | 185 (12.9%) |
| 5 to 9 Years | 135 (8.7%) | 147 (10.2%) |
| 10 to 14 Years | 129 (8.4%) | 136 (9.5%) |
| 15 to 19 Years | 81 (5.2%) | 98 (6.8%) |
| 20 to 24 Years | 162 (10.5%) | 47 (3.3%) |
| 25 to 29 Years | 104 (6.7%) | 153 (10.7%) |
| 30 to 34 Years | 63 (4.1%) | 117 (8.2%) |
| 35 to 39 Years | 46 (3.0%) | 47 (3.3%) |
| 40 to 44 Years | 239 (15.5%) | 92 (6.4%) |
| 45 to 49 Years | 142 (9.2%) | 125 (8.7%) |
| 50 to 54 Years | 13 (0.8%) | 42 (2.9%) |
| 55 to 59 Years | 117 (7.6%) | 65 (4.5%) |
| 60 to 64 Years | 49 (3.2%) | 94 (6.6%) |
| 65 to 69 Years | 52 (3.4%) | 46 (3.2%) |
| 70 to 74 Years | 41 (2.7%) | 0 (0.0%) |
| 75 to 79 Years | 23 (1.5%) | 19 (1.3%) |
| 80 to 84 Years | 18 (1.2%) | 1 (0.1%) |
| 85 Years and over | 15 (1.0%) | 21 (1.5%) |
| Total | 1,542 (100.0%) | 1,435 (100.0%) |
Families and Households in Big Lake
Median Family Size in Big Lake
The median family size in Big Lake is 3.51 persons per family, with married-couple families (615 | 78.4%) accounting for the largest median family size of 3.73 persons per family. On the other hand, single male/father families (89 | 11.4%) represent the smallest median family size with 2.67 persons per family.
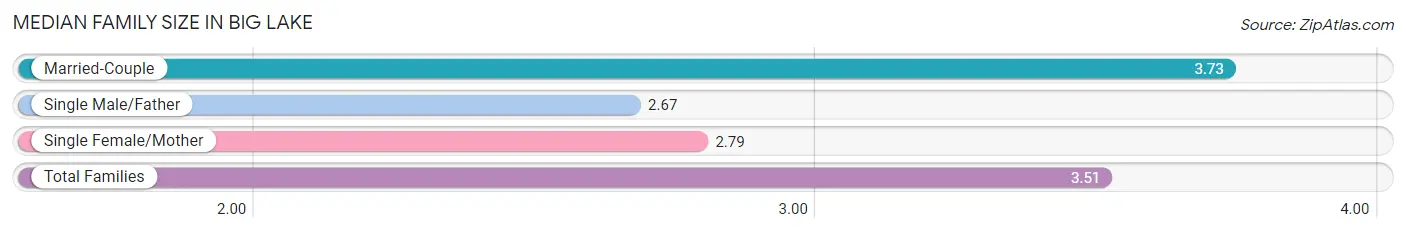
| Family Type | # Families | Family Size |
| Married-Couple | 615 (78.4%) | 3.73 |
| Single Male/Father | 89 (11.4%) | 2.67 |
| Single Female/Mother | 80 (10.2%) | 2.79 |
| Total Families | 784 (100.0%) | 3.51 |
Median Household Size in Big Lake
The median household size in Big Lake is 3.09 persons per household, with married-couple households (615 | 64.3%) accounting for the largest median household size of 3.73 persons per household. non-family households (172 | 18.0%) represent the smallest median household size with 1.02 persons per household.
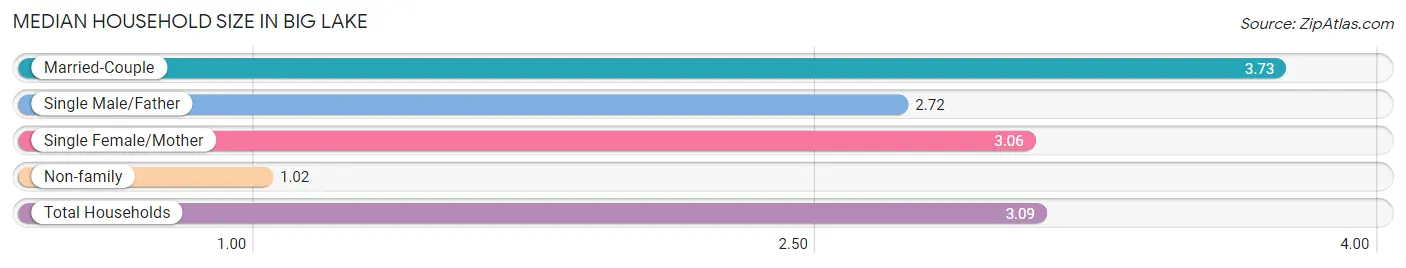
| Household Type | # Households | Household Size |
| Married-Couple | 615 (64.3%) | 3.73 |
| Single Male/Father | 89 (9.3%) | 2.72 |
| Single Female/Mother | 80 (8.4%) | 3.06 |
| Non-family | 172 (18.0%) | 1.02 |
| Total Households | 956 (100.0%) | 3.09 |
Household Size by Marriage Status in Big Lake
Out of a total of 956 households in Big Lake, 784 (82.0%) are family households, while 172 (18.0%) are nonfamily households. The most numerous type of family households are 2-person households, comprising 262, and the most common type of nonfamily households are 1-person households, comprising 169.
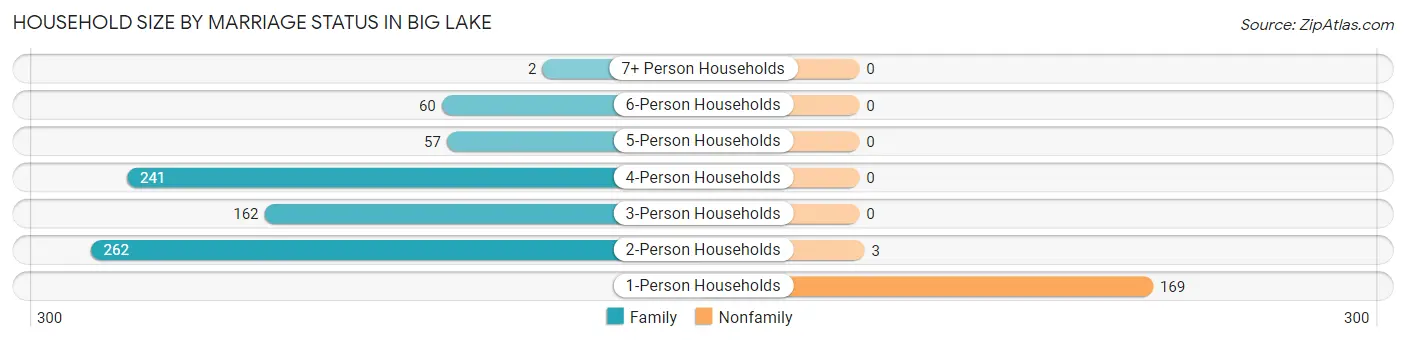
| Household Size | Family Households | Nonfamily Households |
| 1-Person Households | - | 169 (17.7%) |
| 2-Person Households | 262 (27.4%) | 3 (0.3%) |
| 3-Person Households | 162 (17.0%) | 0 (0.0%) |
| 4-Person Households | 241 (25.2%) | 0 (0.0%) |
| 5-Person Households | 57 (6.0%) | 0 (0.0%) |
| 6-Person Households | 60 (6.3%) | 0 (0.0%) |
| 7+ Person Households | 2 (0.2%) | 0 (0.0%) |
| Total | 784 (82.0%) | 172 (18.0%) |
Female Fertility in Big Lake
Fertility by Age in Big Lake
Average fertility rate in Big Lake is 88.0 births per 1,000 women. Women in the age bracket of 15 to 19 years have the highest fertility rate with 133.0 births per 1,000 women. Women in the age bracket of 20 to 34 years acount for 52.5% of all women with births.
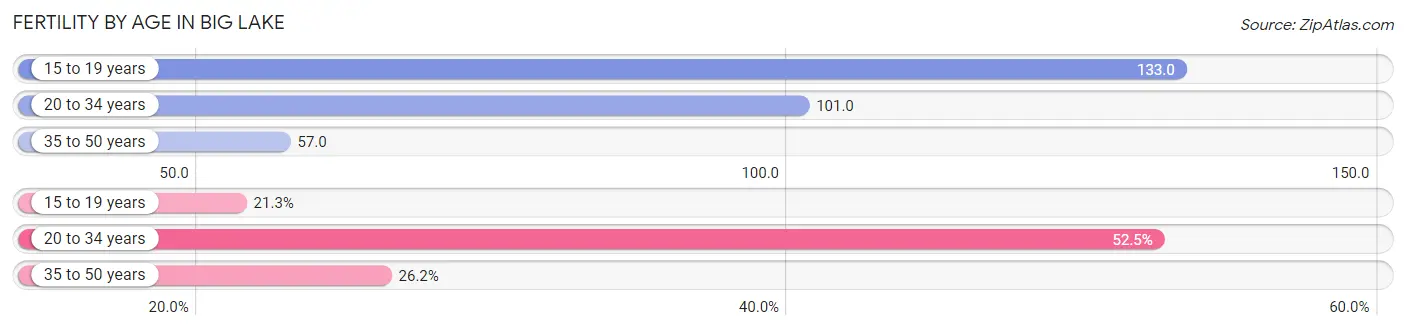
| Age Bracket | Women with Births | Births / 1,000 Women |
| 15 to 19 years | 13 (21.3%) | 133.0 |
| 20 to 34 years | 32 (52.5%) | 101.0 |
| 35 to 50 years | 16 (26.2%) | 57.0 |
| Total | 61 (100.0%) | 88.0 |
Fertility by Age by Marriage Status in Big Lake
78.7% of women with births (61) in Big Lake are married. The highest percentage of unmarried women with births falls into 15 to 19 years age bracket with 100.0% of them unmarried at the time of birth, while the lowest percentage of unmarried women with births belong to 20 to 34 years age bracket with 0.0% of them unmarried.
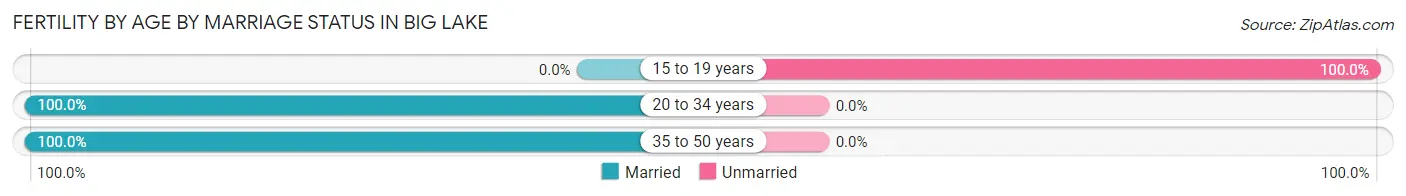
| Age Bracket | Married | Unmarried |
| 15 to 19 years | 0 (0.0%) | 13 (100.0%) |
| 20 to 34 years | 32 (100.0%) | 0 (0.0%) |
| 35 to 50 years | 16 (100.0%) | 0 (0.0%) |
| Total | 48 (78.7%) | 13 (21.3%) |
Fertility by Education in Big Lake
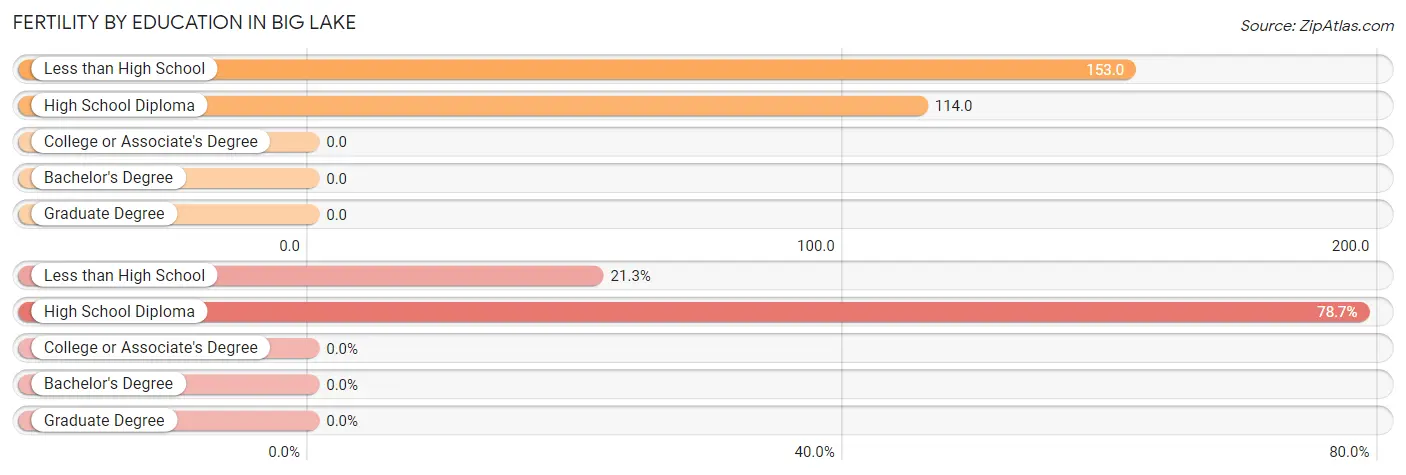
| Educational Attainment | Women with Births | Births / 1,000 Women |
| Less than High School | 13 (21.3%) | 153.0 |
| High School Diploma | 48 (78.7%) | 114.0 |
| College or Associate's Degree | 0 (0.0%) | 0.0 |
| Bachelor's Degree | 0 (0.0%) | 0.0 |
| Graduate Degree | 0 (0.0%) | 0.0 |
| Total | 61 (100.0%) | 88.0 |
Fertility by Education by Marriage Status in Big Lake
21.3% of women with births in Big Lake are unmarried. Women with the educational attainment of high school diploma are most likely to be married with 100.0% of them married at childbirth, while women with the educational attainment of less than high school are least likely to be married with 100.0% of them unmarried at childbirth.
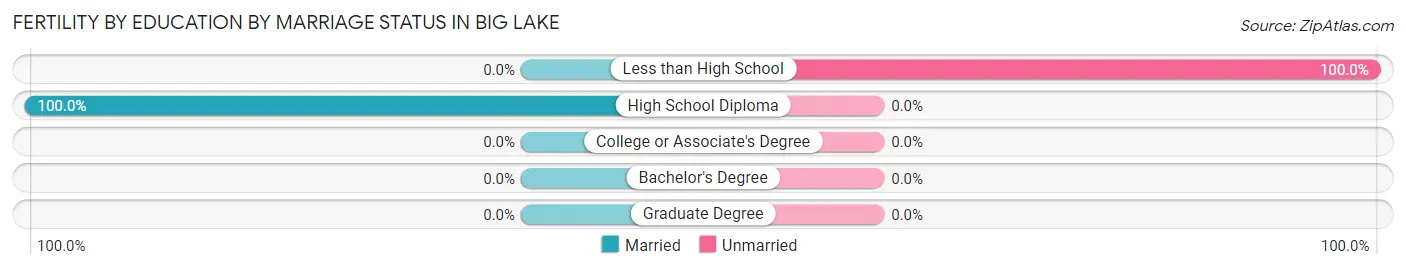
| Educational Attainment | Married | Unmarried |
| Less than High School | 0 (0.0%) | 13 (100.0%) |
| High School Diploma | 48 (100.0%) | 0 (0.0%) |
| College or Associate's Degree | 0 (0.0%) | 0 (0.0%) |
| Bachelor's Degree | 0 (0.0%) | 0 (0.0%) |
| Graduate Degree | 0 (0.0%) | 0 (0.0%) |
| Total | 48 (78.7%) | 13 (21.3%) |
Employment Characteristics in Big Lake
Employment by Class of Employer in Big Lake
Among the 1,334 employed individuals in Big Lake, private company employees (847 | 63.5%), local government employees (168 | 12.6%), and self-employed (incorporated) (121 | 9.1%) make up the most common classes of employment.
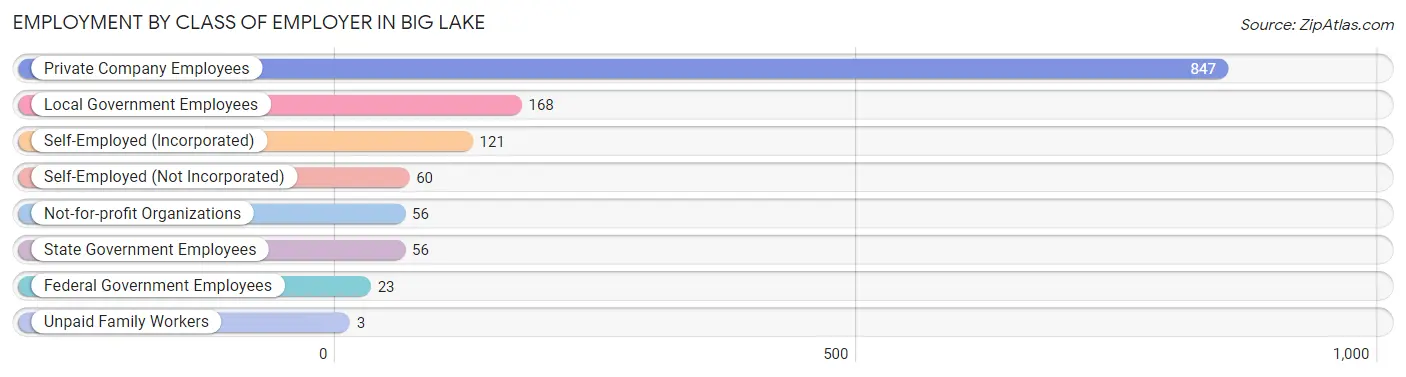
| Employer Class | # Employees | % Employees |
| Private Company Employees | 847 | 63.5% |
| Self-Employed (Incorporated) | 121 | 9.1% |
| Self-Employed (Not Incorporated) | 60 | 4.5% |
| Not-for-profit Organizations | 56 | 4.2% |
| Local Government Employees | 168 | 12.6% |
| State Government Employees | 56 | 4.2% |
| Federal Government Employees | 23 | 1.7% |
| Unpaid Family Workers | 3 | 0.2% |
| Total | 1,334 | 100.0% |
Employment Status by Age in Big Lake
According to the labor force statistics for Big Lake, out of the total population over 16 years of age (2,091), 69.4% or 1,451 individuals are in the labor force, with 7.9% or 115 of them unemployed. The age group with the highest labor force participation rate is 55 to 59 years, with 94.0% or 171 individuals in the labor force. Within the labor force, the 60 to 64 years age range has the highest percentage of unemployed individuals, with 26.5% or 27 of them being unemployed.
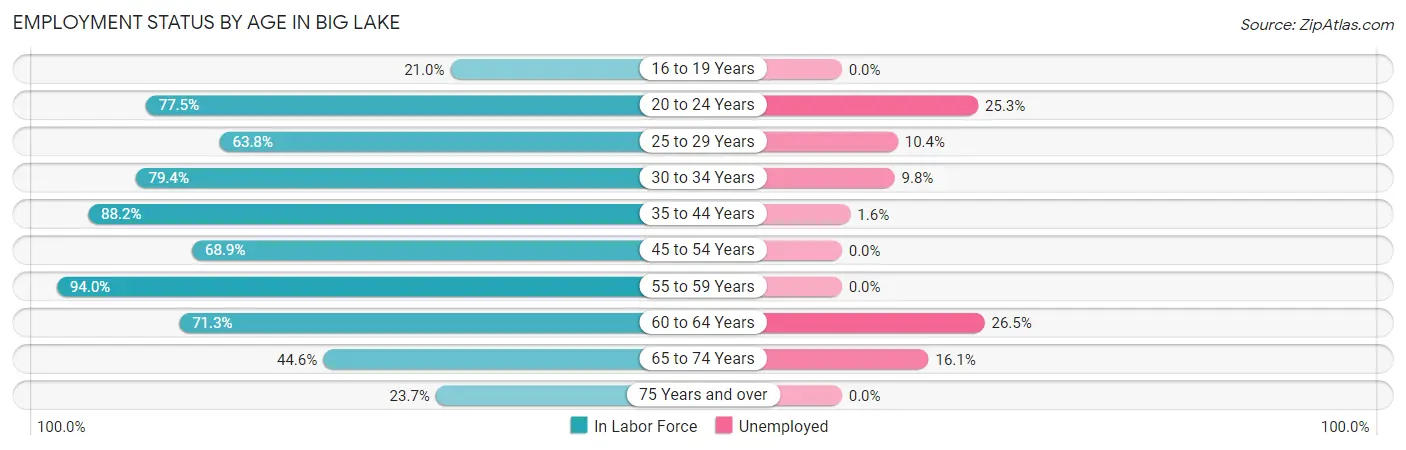
| Age Bracket | In Labor Force | Unemployed |
| 16 to 19 Years | 29 (21.0%) | 0 (0.0%) |
| 20 to 24 Years | 162 (77.5%) | 41 (25.3%) |
| 25 to 29 Years | 164 (63.8%) | 17 (10.4%) |
| 30 to 34 Years | 143 (79.4%) | 14 (9.8%) |
| 35 to 44 Years | 374 (88.2%) | 6 (1.6%) |
| 45 to 54 Years | 222 (68.9%) | 0 (0.0%) |
| 55 to 59 Years | 171 (94.0%) | 0 (0.0%) |
| 60 to 64 Years | 102 (71.3%) | 27 (26.5%) |
| 65 to 74 Years | 62 (44.6%) | 10 (16.1%) |
| 75 Years and over | 23 (23.7%) | 0 (0.0%) |
| Total | 1,451 (69.4%) | 115 (7.9%) |
Employment Status by Educational Attainment in Big Lake
According to labor force statistics for Big Lake, 78.0% of individuals (1,176) out of the total population between 25 and 64 years of age (1,508) are in the labor force, with 5.4% or 64 of them being unemployed. The group with the highest labor force participation rate are those with the educational attainment of less than high school, with 89.7% or 140 individuals in the labor force. Within the labor force, individuals with college / associate degree education have the highest percentage of unemployment, with 14.2% or 33 of them being unemployed.
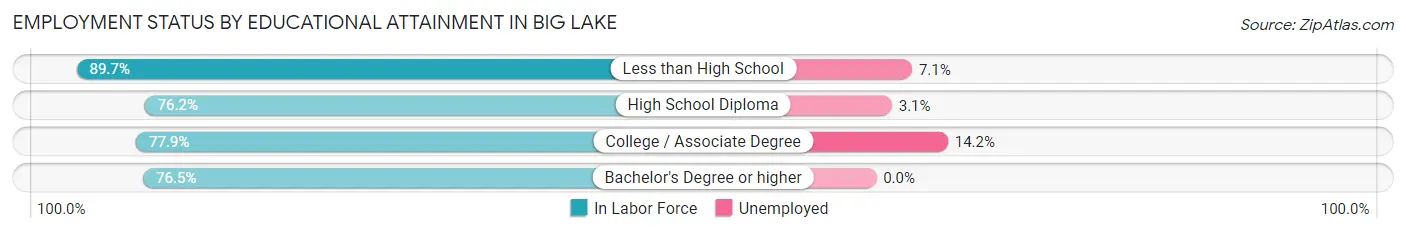
| Educational Attainment | In Labor Force | Unemployed |
| Less than High School | 140 (89.7%) | 11 (7.1%) |
| High School Diploma | 677 (76.2%) | 28 (3.1%) |
| College / Associate Degree | 232 (77.9%) | 42 (14.2%) |
| Bachelor's Degree or higher | 127 (76.5%) | 0 (0.0%) |
| Total | 1,176 (78.0%) | 81 (5.4%) |
Employment Occupations by Sex in Big Lake
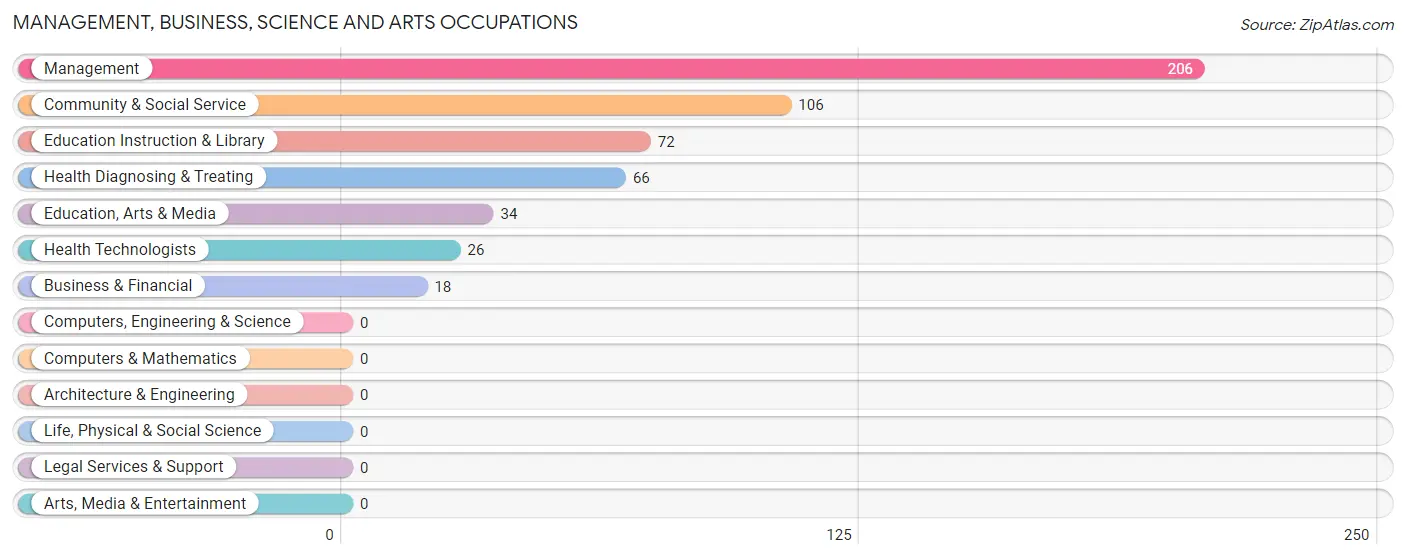
Management, Business, Science and Arts Occupations
The most common Management, Business, Science and Arts occupations in Big Lake are Management (206 | 15.4%), Community & Social Service (106 | 7.9%), Education Instruction & Library (72 | 5.4%), Health Diagnosing & Treating (66 | 4.9%), and Education, Arts & Media (34 | 2.5%).
Management, Business, Science and Arts Occupations by Sex
Within the Management, Business, Science and Arts occupations in Big Lake, the most male-oriented occupations are Management (69.9%), Health Technologists (69.2%), and Education, Arts & Media (67.6%), while the most female-oriented occupations are Education Instruction & Library (98.6%), Community & Social Service (77.4%), and Health Diagnosing & Treating (72.7%).
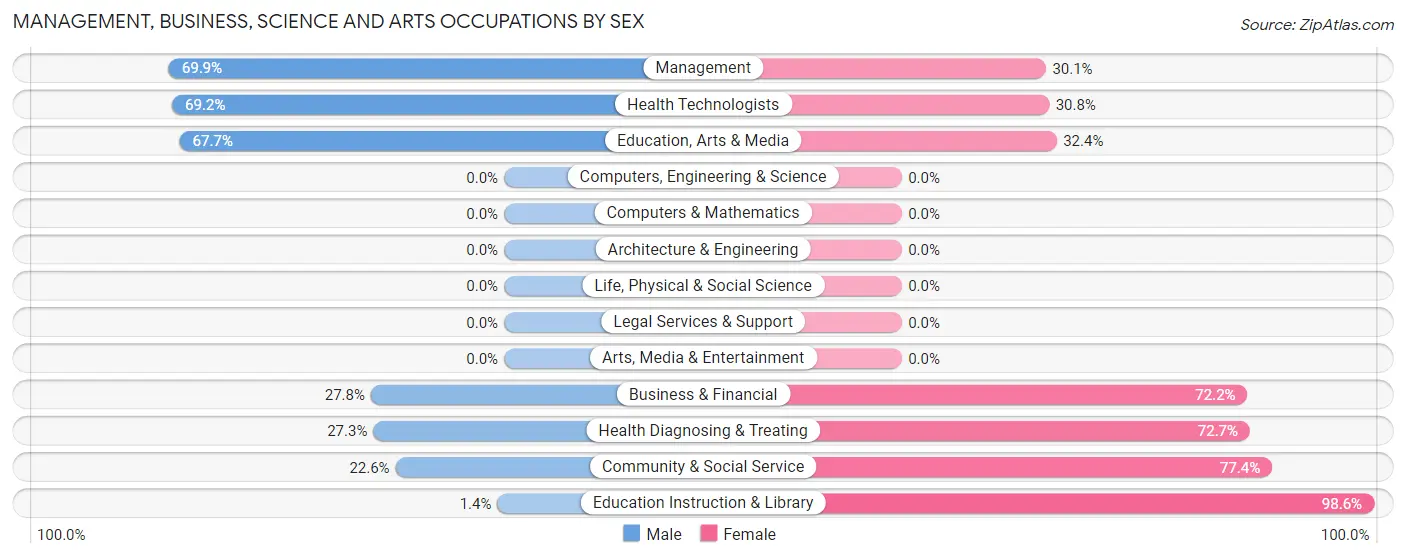
| Occupation | Male | Female |
| Management | 144 (69.9%) | 62 (30.1%) |
| Business & Financial | 5 (27.8%) | 13 (72.2%) |
| Computers, Engineering & Science | 0 (0.0%) | 0 (0.0%) |
| Computers & Mathematics | 0 (0.0%) | 0 (0.0%) |
| Architecture & Engineering | 0 (0.0%) | 0 (0.0%) |
| Life, Physical & Social Science | 0 (0.0%) | 0 (0.0%) |
| Community & Social Service | 24 (22.6%) | 82 (77.4%) |
| Education, Arts & Media | 23 (67.6%) | 11 (32.4%) |
| Legal Services & Support | 0 (0.0%) | 0 (0.0%) |
| Education Instruction & Library | 1 (1.4%) | 71 (98.6%) |
| Arts, Media & Entertainment | 0 (0.0%) | 0 (0.0%) |
| Health Diagnosing & Treating | 18 (27.3%) | 48 (72.7%) |
| Health Technologists | 18 (69.2%) | 8 (30.8%) |
| Total (Category) | 191 (48.2%) | 205 (51.8%) |
| Total (Overall) | 859 (64.2%) | 478 (35.7%) |
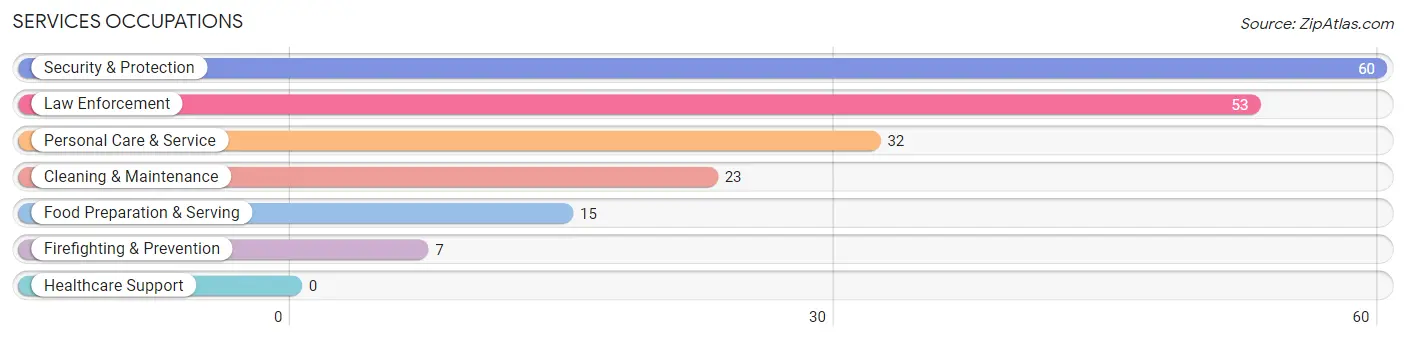
Services Occupations
The most common Services occupations in Big Lake are Security & Protection (60 | 4.5%), Law Enforcement (53 | 4.0%), Personal Care & Service (32 | 2.4%), Cleaning & Maintenance (23 | 1.7%), and Food Preparation & Serving (15 | 1.1%).
Services Occupations by Sex
Within the Services occupations in Big Lake, the most male-oriented occupations are Firefighting & Prevention (100.0%), Security & Protection (88.3%), and Law Enforcement (86.8%), while the most female-oriented occupations are Food Preparation & Serving (100.0%), Personal Care & Service (100.0%), and Cleaning & Maintenance (65.2%).
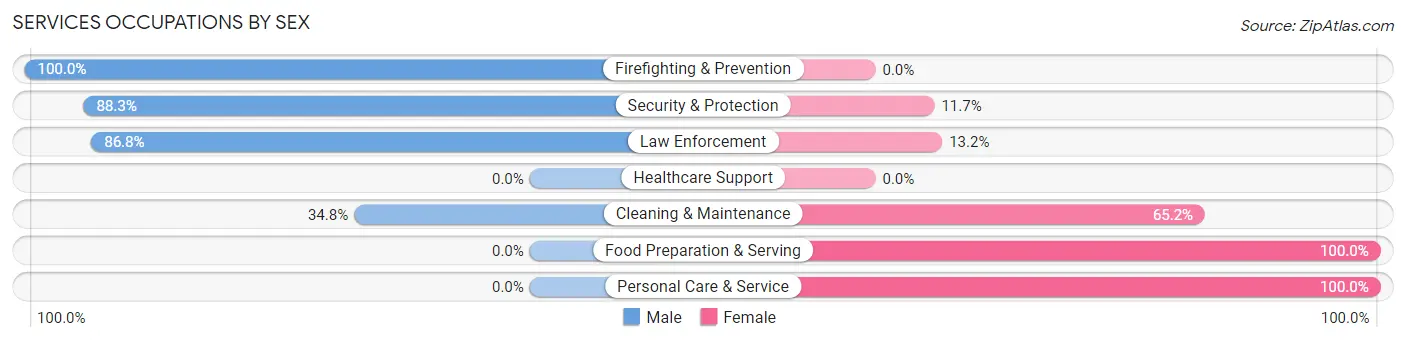
| Occupation | Male | Female |
| Healthcare Support | 0 (0.0%) | 0 (0.0%) |
| Security & Protection | 53 (88.3%) | 7 (11.7%) |
| Firefighting & Prevention | 7 (100.0%) | 0 (0.0%) |
| Law Enforcement | 46 (86.8%) | 7 (13.2%) |
| Food Preparation & Serving | 0 (0.0%) | 15 (100.0%) |
| Cleaning & Maintenance | 8 (34.8%) | 15 (65.2%) |
| Personal Care & Service | 0 (0.0%) | 32 (100.0%) |
| Total (Category) | 61 (46.9%) | 69 (53.1%) |
| Total (Overall) | 859 (64.2%) | 478 (35.7%) |
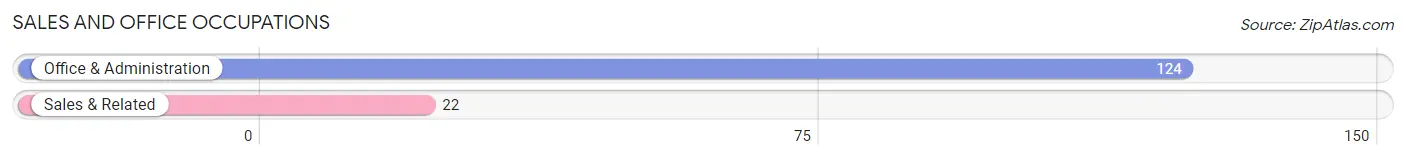
Sales and Office Occupations
The most common Sales and Office occupations in Big Lake are Office & Administration (124 | 9.3%), and Sales & Related (22 | 1.7%).
Sales and Office Occupations by Sex
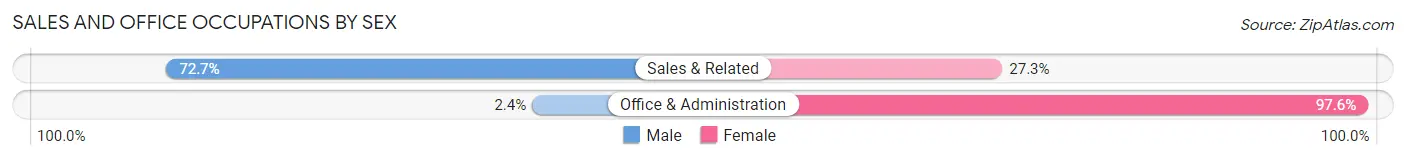
| Occupation | Male | Female |
| Sales & Related | 16 (72.7%) | 6 (27.3%) |
| Office & Administration | 3 (2.4%) | 121 (97.6%) |
| Total (Category) | 19 (13.0%) | 127 (87.0%) |
| Total (Overall) | 859 (64.2%) | 478 (35.7%) |
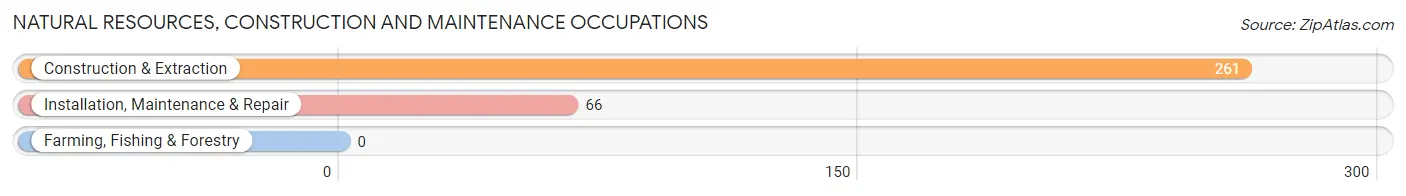
Natural Resources, Construction and Maintenance Occupations
The most common Natural Resources, Construction and Maintenance occupations in Big Lake are Construction & Extraction (261 | 19.5%), and Installation, Maintenance & Repair (66 | 4.9%).
Natural Resources, Construction and Maintenance Occupations by Sex
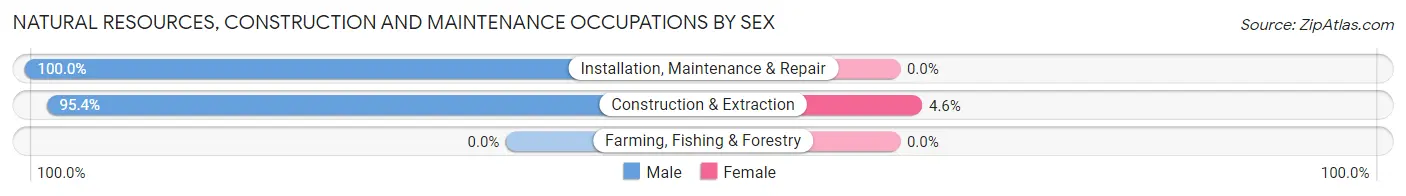
| Occupation | Male | Female |
| Farming, Fishing & Forestry | 0 (0.0%) | 0 (0.0%) |
| Construction & Extraction | 249 (95.4%) | 12 (4.6%) |
| Installation, Maintenance & Repair | 66 (100.0%) | 0 (0.0%) |
| Total (Category) | 315 (96.3%) | 12 (3.7%) |
| Total (Overall) | 859 (64.2%) | 478 (35.7%) |
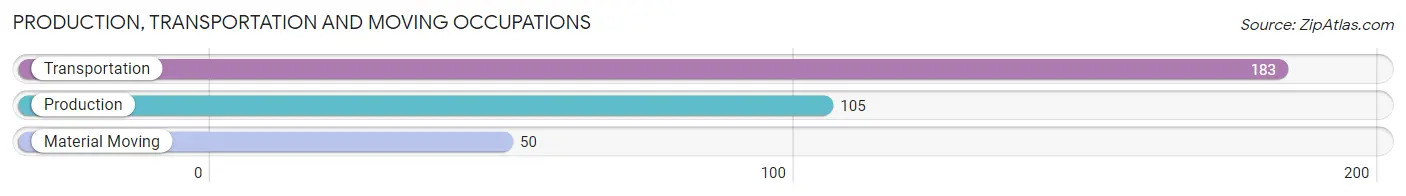
Production, Transportation and Moving Occupations
The most common Production, Transportation and Moving occupations in Big Lake are Transportation (183 | 13.7%), Production (105 | 7.9%), and Material Moving (50 | 3.7%).
Production, Transportation and Moving Occupations by Sex
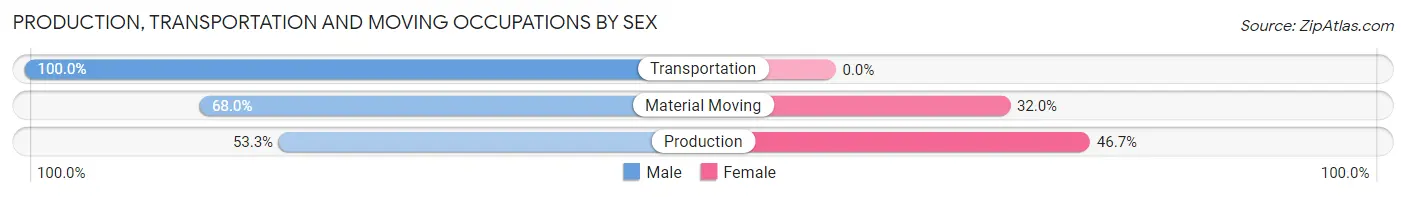
| Occupation | Male | Female |
| Production | 56 (53.3%) | 49 (46.7%) |
| Transportation | 183 (100.0%) | 0 (0.0%) |
| Material Moving | 34 (68.0%) | 16 (32.0%) |
| Total (Category) | 273 (80.8%) | 65 (19.2%) |
| Total (Overall) | 859 (64.2%) | 478 (35.7%) |
Employment Industries by Sex in Big Lake
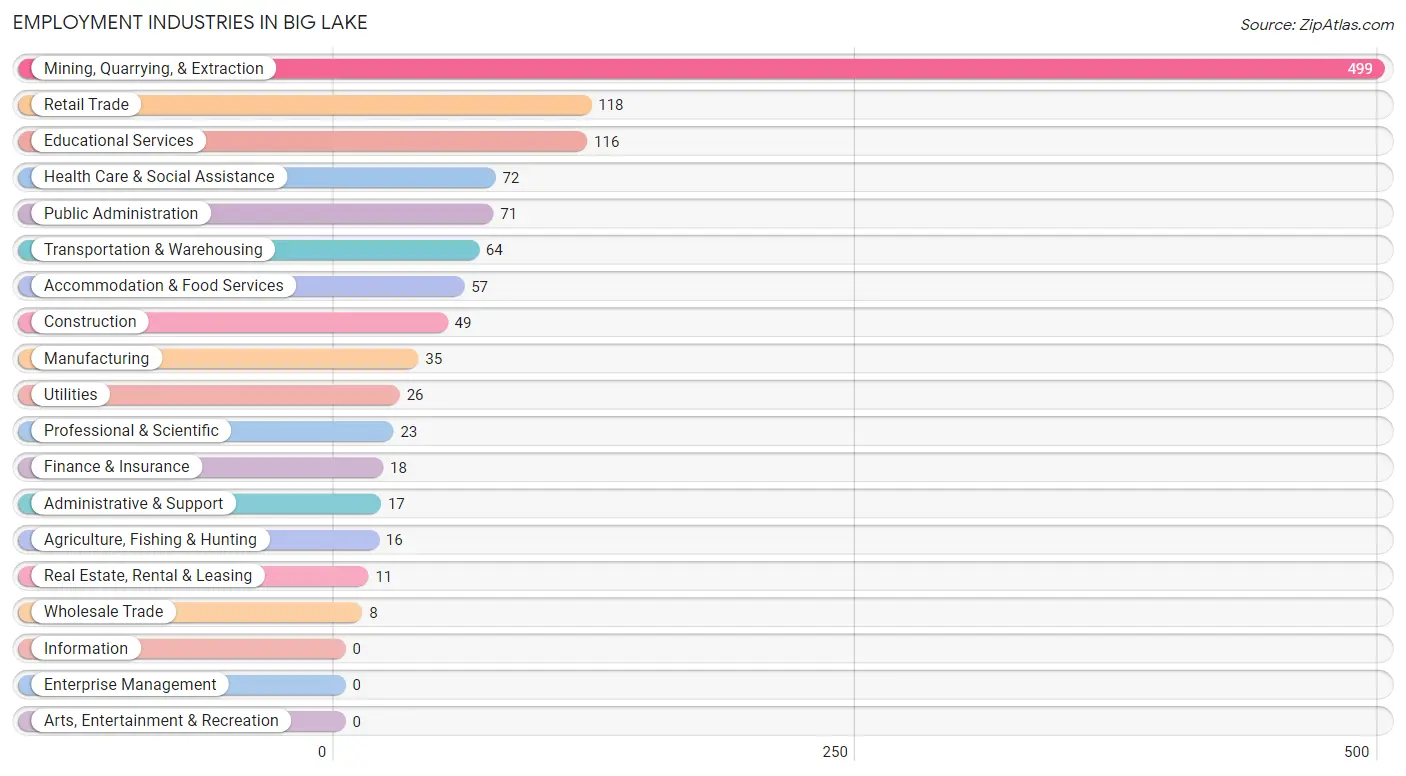
Employment Industries in Big Lake
The major employment industries in Big Lake include Mining, Quarrying, & Extraction (499 | 37.3%), Retail Trade (118 | 8.8%), Educational Services (116 | 8.7%), Health Care & Social Assistance (72 | 5.4%), and Public Administration (71 | 5.3%).
Employment Industries by Sex in Big Lake
The Big Lake industries that see more men than women are Agriculture, Fishing & Hunting (100.0%), Construction (100.0%), and Wholesale Trade (100.0%), whereas the industries that tend to have a higher number of women are Finance & Insurance (100.0%), Health Care & Social Assistance (93.1%), and Manufacturing (85.7%).
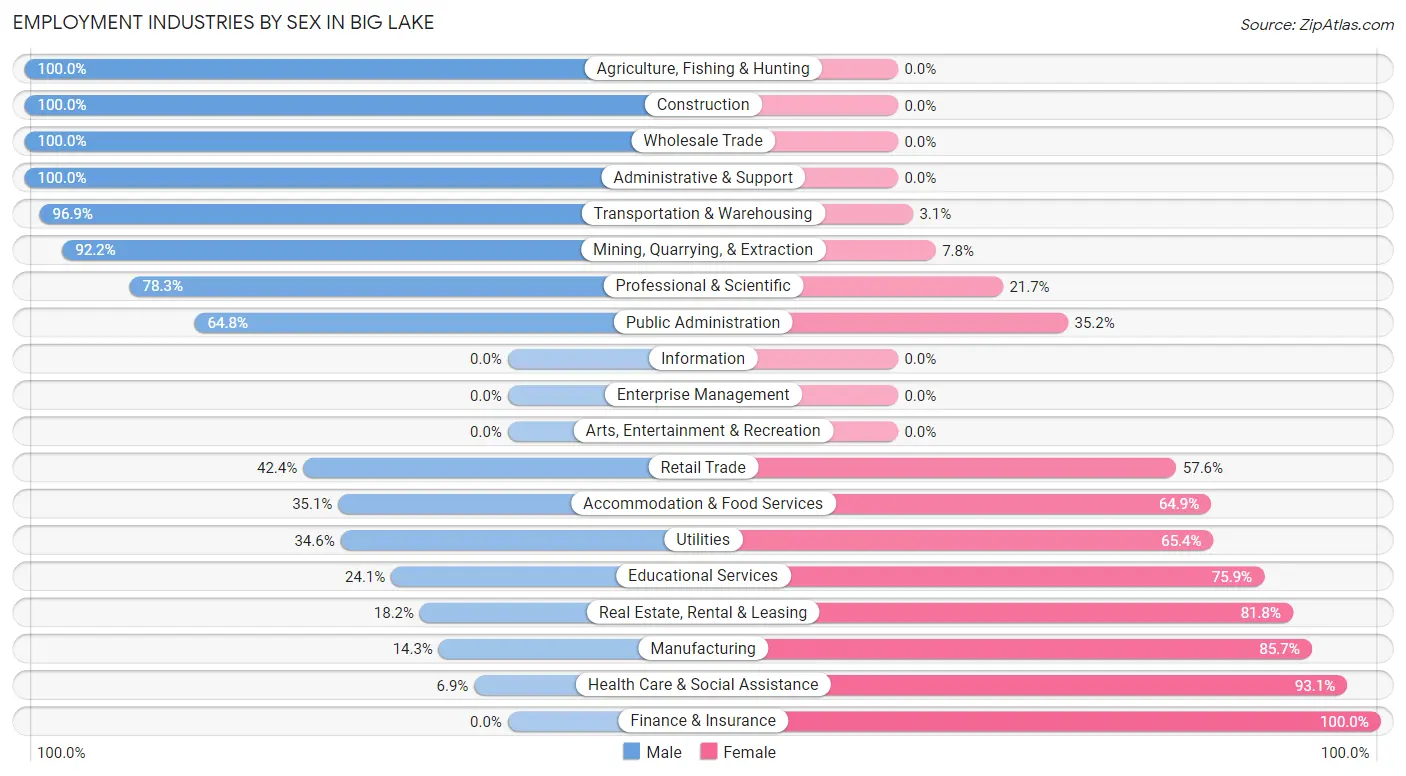
| Industry | Male | Female |
| Agriculture, Fishing & Hunting | 16 (100.0%) | 0 (0.0%) |
| Mining, Quarrying, & Extraction | 460 (92.2%) | 39 (7.8%) |
| Construction | 49 (100.0%) | 0 (0.0%) |
| Manufacturing | 5 (14.3%) | 30 (85.7%) |
| Wholesale Trade | 8 (100.0%) | 0 (0.0%) |
| Retail Trade | 50 (42.4%) | 68 (57.6%) |
| Transportation & Warehousing | 62 (96.9%) | 2 (3.1%) |
| Utilities | 9 (34.6%) | 17 (65.4%) |
| Information | 0 (0.0%) | 0 (0.0%) |
| Finance & Insurance | 0 (0.0%) | 18 (100.0%) |
| Real Estate, Rental & Leasing | 2 (18.2%) | 9 (81.8%) |
| Professional & Scientific | 18 (78.3%) | 5 (21.7%) |
| Enterprise Management | 0 (0.0%) | 0 (0.0%) |
| Administrative & Support | 17 (100.0%) | 0 (0.0%) |
| Educational Services | 28 (24.1%) | 88 (75.9%) |
| Health Care & Social Assistance | 5 (6.9%) | 67 (93.1%) |
| Arts, Entertainment & Recreation | 0 (0.0%) | 0 (0.0%) |
| Accommodation & Food Services | 20 (35.1%) | 37 (64.9%) |
| Public Administration | 46 (64.8%) | 25 (35.2%) |
| Total | 859 (64.2%) | 478 (35.7%) |
Education in Big Lake
School Enrollment in Big Lake
The most common levels of schooling among the 759 students in Big Lake are elementary school (216 | 28.5%), middle school (200 | 26.4%), and high school (159 | 20.9%).
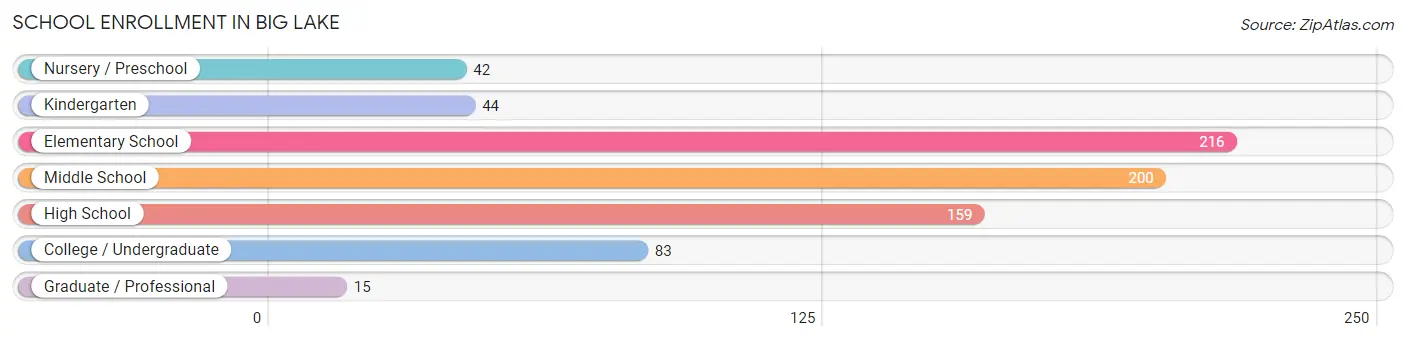
| School Level | # Students | % Students |
| Nursery / Preschool | 42 | 5.5% |
| Kindergarten | 44 | 5.8% |
| Elementary School | 216 | 28.5% |
| Middle School | 200 | 26.4% |
| High School | 159 | 20.9% |
| College / Undergraduate | 83 | 10.9% |
| Graduate / Professional | 15 | 2.0% |
| Total | 759 | 100.0% |
School Enrollment by Age by Funding Source in Big Lake
Out of a total of 759 students who are enrolled in schools in Big Lake, 36 (4.7%) attend a private institution, while the remaining 723 (95.3%) are enrolled in public schools. The age group of 3 to 4 year olds has the highest likelihood of being enrolled in private schools, with 13 (34.2% in the age bracket) enrolled. Conversely, the age group of 18 to 19 year olds has the lowest likelihood of being enrolled in a private school, with 35 (100.0% in the age bracket) attending a public institution.
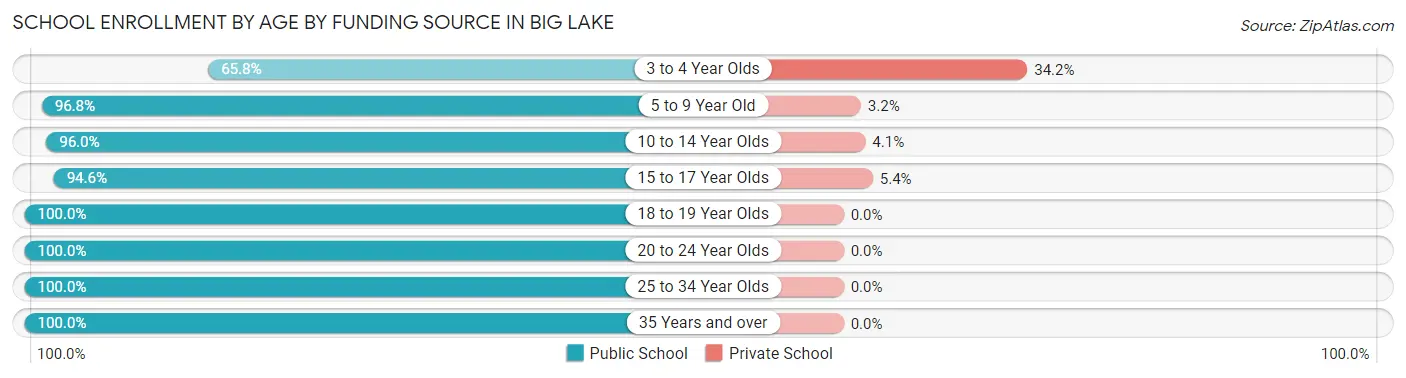
| Age Bracket | Public School | Private School |
| 3 to 4 Year Olds | 25 (65.8%) | 13 (34.2%) |
| 5 to 9 Year Old | 241 (96.8%) | 8 (3.2%) |
| 10 to 14 Year Olds | 237 (96.0%) | 10 (4.1%) |
| 15 to 17 Year Olds | 87 (94.6%) | 5 (5.4%) |
| 18 to 19 Year Olds | 35 (100.0%) | 0 (0.0%) |
| 20 to 24 Year Olds | 54 (100.0%) | 0 (0.0%) |
| 25 to 34 Year Olds | 29 (100.0%) | 0 (0.0%) |
| 35 Years and over | 15 (100.0%) | 0 (0.0%) |
| Total | 723 (95.3%) | 36 (4.7%) |
Educational Attainment by Field of Study in Big Lake
Education (65 | 31.1%), liberal arts & history (33 | 15.8%), business (29 | 13.9%), computers & mathematics (26 | 12.4%), and science & technology (17 | 8.1%) are the most common fields of study among 209 individuals in Big Lake who have obtained a bachelor's degree or higher.
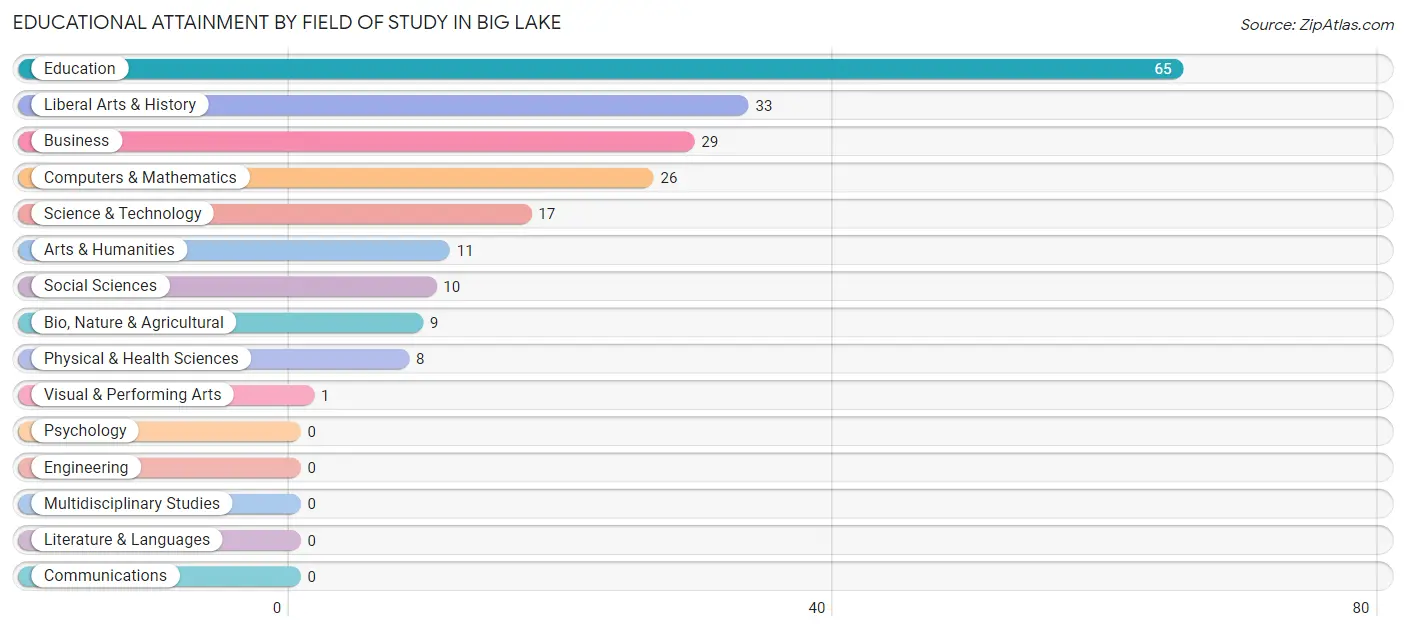
| Field of Study | # Graduates | % Graduates |
| Computers & Mathematics | 26 | 12.4% |
| Bio, Nature & Agricultural | 9 | 4.3% |
| Physical & Health Sciences | 8 | 3.8% |
| Psychology | 0 | 0.0% |
| Social Sciences | 10 | 4.8% |
| Engineering | 0 | 0.0% |
| Multidisciplinary Studies | 0 | 0.0% |
| Science & Technology | 17 | 8.1% |
| Business | 29 | 13.9% |
| Education | 65 | 31.1% |
| Literature & Languages | 0 | 0.0% |
| Liberal Arts & History | 33 | 15.8% |
| Visual & Performing Arts | 1 | 0.5% |
| Communications | 0 | 0.0% |
| Arts & Humanities | 11 | 5.3% |
| Total | 209 | 100.0% |
Transportation & Commute in Big Lake
Vehicle Availability by Sex in Big Lake
The most prevalent vehicle ownership categories in Big Lake are males with 2 vehicles (264, accounting for 30.8%) and females with 2 vehicles (142, making up 55.2%).
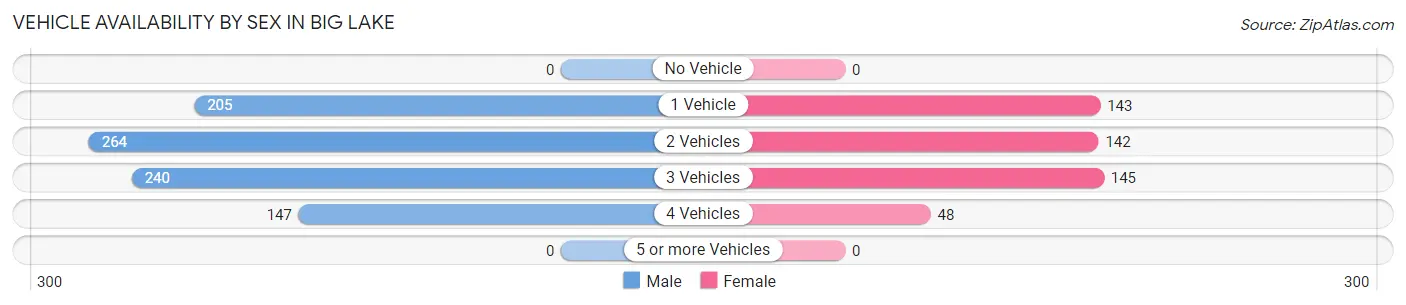
| Vehicles Available | Male | Female |
| No Vehicle | 0 (0.0%) | 0 (0.0%) |
| 1 Vehicle | 205 (23.9%) | 143 (29.9%) |
| 2 Vehicles | 264 (30.8%) | 142 (29.7%) |
| 3 Vehicles | 240 (28.0%) | 145 (30.3%) |
| 4 Vehicles | 147 (17.2%) | 48 (10.0%) |
| 5 or more Vehicles | 0 (0.0%) | 0 (0.0%) |
| Total | 856 (100.0%) | 478 (100.0%) |
Commute Time in Big Lake
The most frequently occuring commute durations in Big Lake are 5 to 9 minutes (376 commuters, 29.1%), less than 5 minutes (259 commuters, 20.1%), and 10 to 14 minutes (167 commuters, 12.9%).
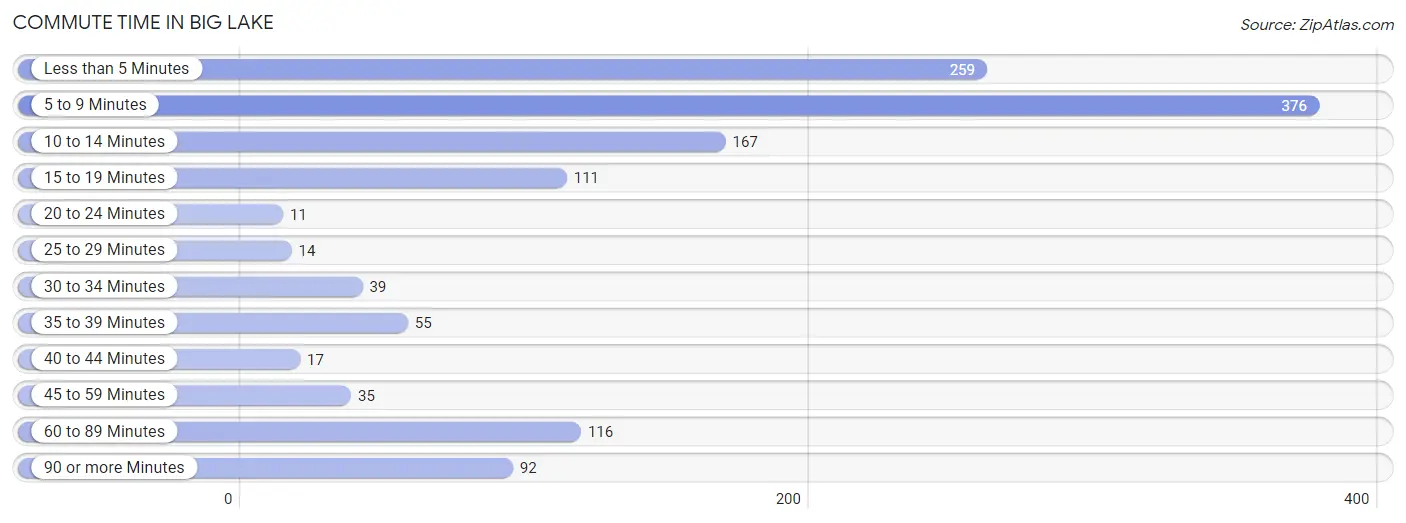
| Commute Time | # Commuters | % Commuters |
| Less than 5 Minutes | 259 | 20.1% |
| 5 to 9 Minutes | 376 | 29.1% |
| 10 to 14 Minutes | 167 | 12.9% |
| 15 to 19 Minutes | 111 | 8.6% |
| 20 to 24 Minutes | 11 | 0.9% |
| 25 to 29 Minutes | 14 | 1.1% |
| 30 to 34 Minutes | 39 | 3.0% |
| 35 to 39 Minutes | 55 | 4.3% |
| 40 to 44 Minutes | 17 | 1.3% |
| 45 to 59 Minutes | 35 | 2.7% |
| 60 to 89 Minutes | 116 | 9.0% |
| 90 or more Minutes | 92 | 7.1% |
Commute Time by Sex in Big Lake
The most common commute times in Big Lake are 5 to 9 minutes (201 commuters, 23.6%) for males and 5 to 9 minutes (175 commuters, 39.6%) for females.
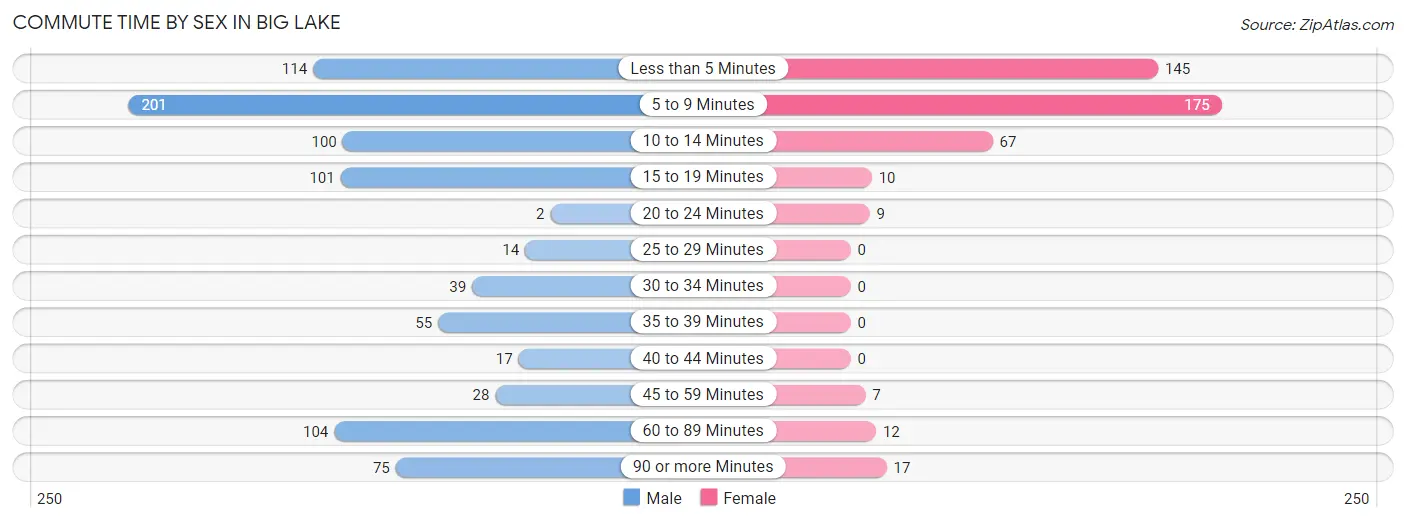
| Commute Time | Male | Female |
| Less than 5 Minutes | 114 (13.4%) | 145 (32.8%) |
| 5 to 9 Minutes | 201 (23.6%) | 175 (39.6%) |
| 10 to 14 Minutes | 100 (11.8%) | 67 (15.2%) |
| 15 to 19 Minutes | 101 (11.9%) | 10 (2.3%) |
| 20 to 24 Minutes | 2 (0.2%) | 9 (2.0%) |
| 25 to 29 Minutes | 14 (1.7%) | 0 (0.0%) |
| 30 to 34 Minutes | 39 (4.6%) | 0 (0.0%) |
| 35 to 39 Minutes | 55 (6.5%) | 0 (0.0%) |
| 40 to 44 Minutes | 17 (2.0%) | 0 (0.0%) |
| 45 to 59 Minutes | 28 (3.3%) | 7 (1.6%) |
| 60 to 89 Minutes | 104 (12.2%) | 12 (2.7%) |
| 90 or more Minutes | 75 (8.8%) | 17 (3.8%) |
Time of Departure to Work by Sex in Big Lake
The most frequent times of departure to work in Big Lake are 6:00 AM to 6:29 AM (234, 27.5%) for males and 7:30 AM to 7:59 AM (110, 24.9%) for females.
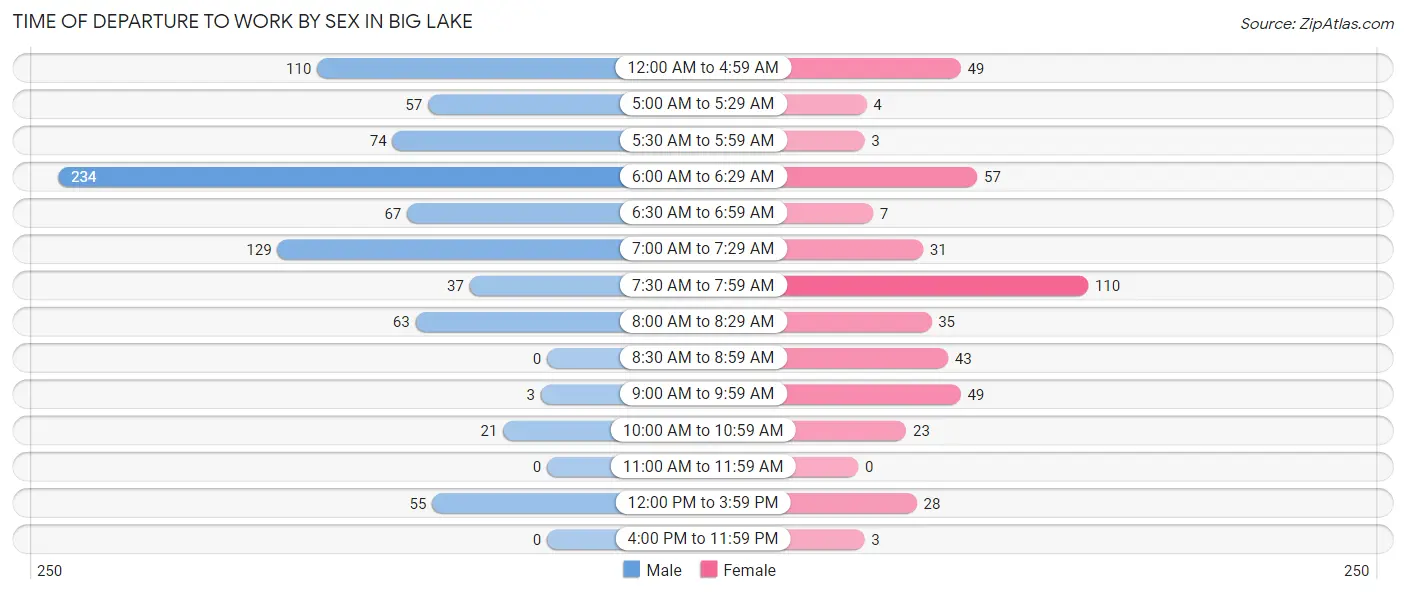
| Time of Departure | Male | Female |
| 12:00 AM to 4:59 AM | 110 (12.9%) | 49 (11.1%) |
| 5:00 AM to 5:29 AM | 57 (6.7%) | 4 (0.9%) |
| 5:30 AM to 5:59 AM | 74 (8.7%) | 3 (0.7%) |
| 6:00 AM to 6:29 AM | 234 (27.5%) | 57 (12.9%) |
| 6:30 AM to 6:59 AM | 67 (7.9%) | 7 (1.6%) |
| 7:00 AM to 7:29 AM | 129 (15.2%) | 31 (7.0%) |
| 7:30 AM to 7:59 AM | 37 (4.3%) | 110 (24.9%) |
| 8:00 AM to 8:29 AM | 63 (7.4%) | 35 (7.9%) |
| 8:30 AM to 8:59 AM | 0 (0.0%) | 43 (9.7%) |
| 9:00 AM to 9:59 AM | 3 (0.4%) | 49 (11.1%) |
| 10:00 AM to 10:59 AM | 21 (2.5%) | 23 (5.2%) |
| 11:00 AM to 11:59 AM | 0 (0.0%) | 0 (0.0%) |
| 12:00 PM to 3:59 PM | 55 (6.5%) | 28 (6.3%) |
| 4:00 PM to 11:59 PM | 0 (0.0%) | 3 (0.7%) |
| Total | 850 (100.0%) | 442 (100.0%) |
Housing Occupancy in Big Lake
Occupancy by Ownership in Big Lake
Of the total 956 dwellings in Big Lake, owner-occupied units account for 674 (70.5%), while renter-occupied units make up 282 (29.5%).
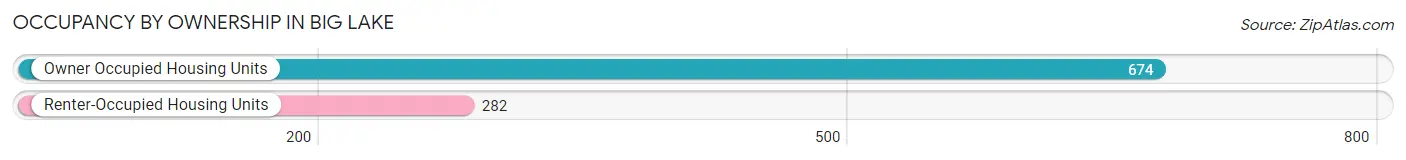
| Occupancy | # Housing Units | % Housing Units |
| Owner Occupied Housing Units | 674 | 70.5% |
| Renter-Occupied Housing Units | 282 | 29.5% |
| Total Occupied Housing Units | 956 | 100.0% |
Occupancy by Household Size in Big Lake
| Household Size | # Housing Units | % Housing Units |
| 1-Person Household | 169 | 17.7% |
| 2-Person Household | 265 | 27.7% |
| 3-Person Household | 162 | 17.0% |
| 4+ Person Household | 360 | 37.7% |
| Total Housing Units | 956 | 100.0% |
Occupancy by Ownership by Household Size in Big Lake
| Household Size | Owner-occupied | Renter-occupied |
| 1-Person Household | 87 (51.5%) | 82 (48.5%) |
| 2-Person Household | 186 (70.2%) | 79 (29.8%) |
| 3-Person Household | 96 (59.3%) | 66 (40.7%) |
| 4+ Person Household | 305 (84.7%) | 55 (15.3%) |
| Total Housing Units | 674 (70.5%) | 282 (29.5%) |
Occupancy by Educational Attainment in Big Lake
| Household Size | Owner-occupied | Renter-occupied |
| Less than High School | 94 (67.6%) | 45 (32.4%) |
| High School Diploma | 343 (67.4%) | 166 (32.6%) |
| College/Associate Degree | 162 (86.2%) | 26 (13.8%) |
| Bachelor's Degree or higher | 75 (62.5%) | 45 (37.5%) |
Occupancy by Age of Householder in Big Lake
| Age Bracket | # Households | % Households |
| Under 35 Years | 276 | 28.9% |
| 35 to 44 Years | 240 | 25.1% |
| 45 to 54 Years | 131 | 13.7% |
| 55 to 64 Years | 173 | 18.1% |
| 65 to 74 Years | 87 | 9.1% |
| 75 to 84 Years | 36 | 3.8% |
| 85 Years and Over | 13 | 1.4% |
| Total | 956 | 100.0% |
Housing Finances in Big Lake
Median Income by Occupancy in Big Lake
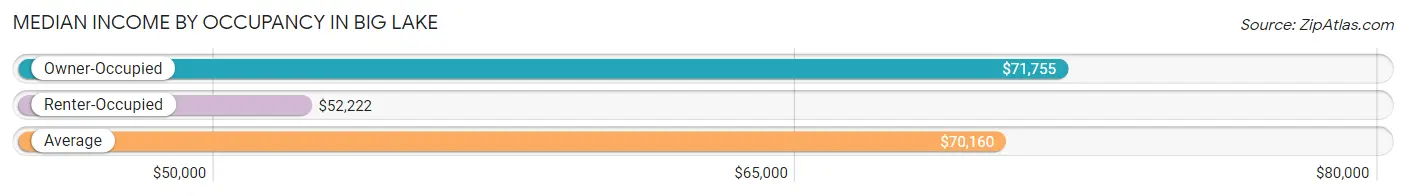
| Occupancy Type | # Households | Median Income |
| Owner-Occupied | 674 (70.5%) | $71,755 |
| Renter-Occupied | 282 (29.5%) | $52,222 |
| Average | 956 (100.0%) | $70,160 |
Occupancy by Householder Income Bracket in Big Lake
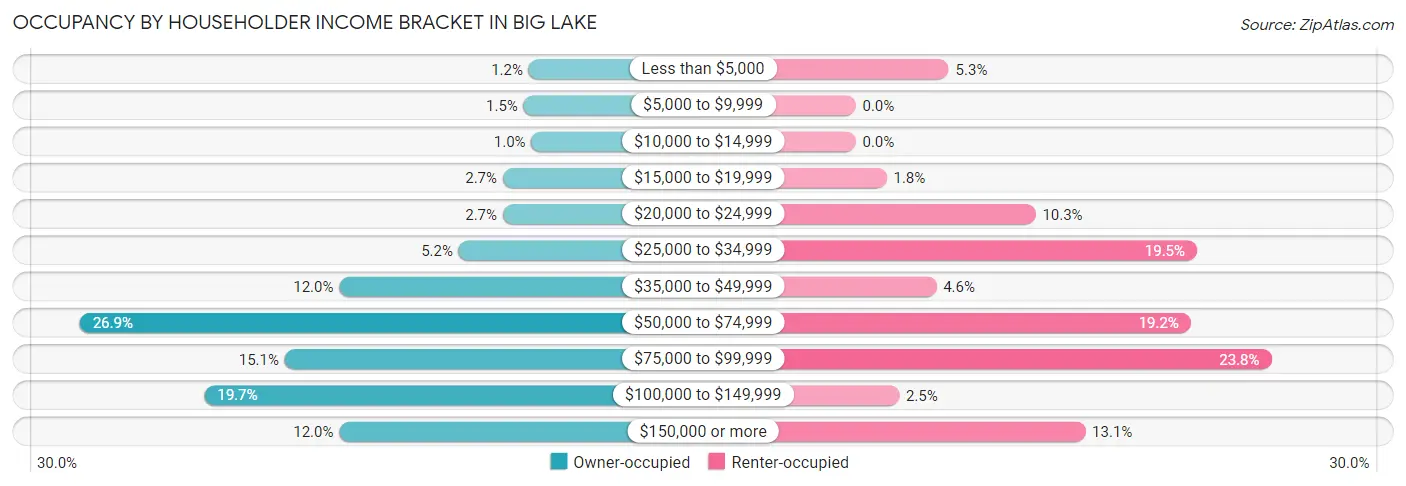
| Income Bracket | Owner-occupied | Renter-occupied |
| Less than $5,000 | 8 (1.2%) | 15 (5.3%) |
| $5,000 to $9,999 | 10 (1.5%) | 0 (0.0%) |
| $10,000 to $14,999 | 7 (1.0%) | 0 (0.0%) |
| $15,000 to $19,999 | 18 (2.7%) | 5 (1.8%) |
| $20,000 to $24,999 | 18 (2.7%) | 29 (10.3%) |
| $25,000 to $34,999 | 35 (5.2%) | 55 (19.5%) |
| $35,000 to $49,999 | 81 (12.0%) | 13 (4.6%) |
| $50,000 to $74,999 | 181 (26.9%) | 54 (19.2%) |
| $75,000 to $99,999 | 102 (15.1%) | 67 (23.8%) |
| $100,000 to $149,999 | 133 (19.7%) | 7 (2.5%) |
| $150,000 or more | 81 (12.0%) | 37 (13.1%) |
| Total | 674 (100.0%) | 282 (100.0%) |
Monthly Housing Cost Tiers in Big Lake
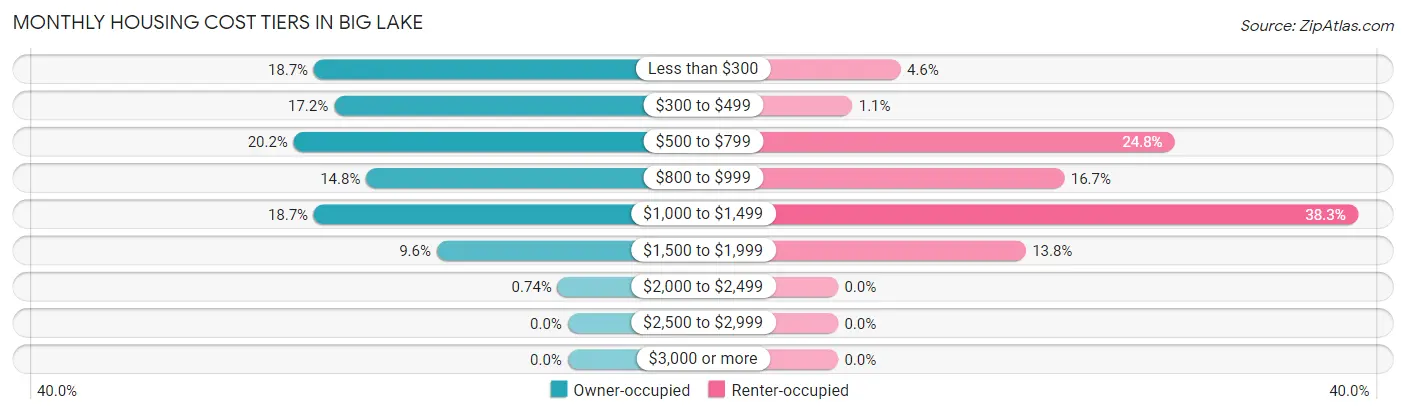
| Monthly Cost | Owner-occupied | Renter-occupied |
| Less than $300 | 126 (18.7%) | 13 (4.6%) |
| $300 to $499 | 116 (17.2%) | 3 (1.1%) |
| $500 to $799 | 136 (20.2%) | 70 (24.8%) |
| $800 to $999 | 100 (14.8%) | 47 (16.7%) |
| $1,000 to $1,499 | 126 (18.7%) | 108 (38.3%) |
| $1,500 to $1,999 | 65 (9.6%) | 39 (13.8%) |
| $2,000 to $2,499 | 5 (0.7%) | 0 (0.0%) |
| $2,500 to $2,999 | 0 (0.0%) | 0 (0.0%) |
| $3,000 or more | 0 (0.0%) | 0 (0.0%) |
| Total | 674 (100.0%) | 282 (100.0%) |
Physical Housing Characteristics in Big Lake
Housing Structures in Big Lake
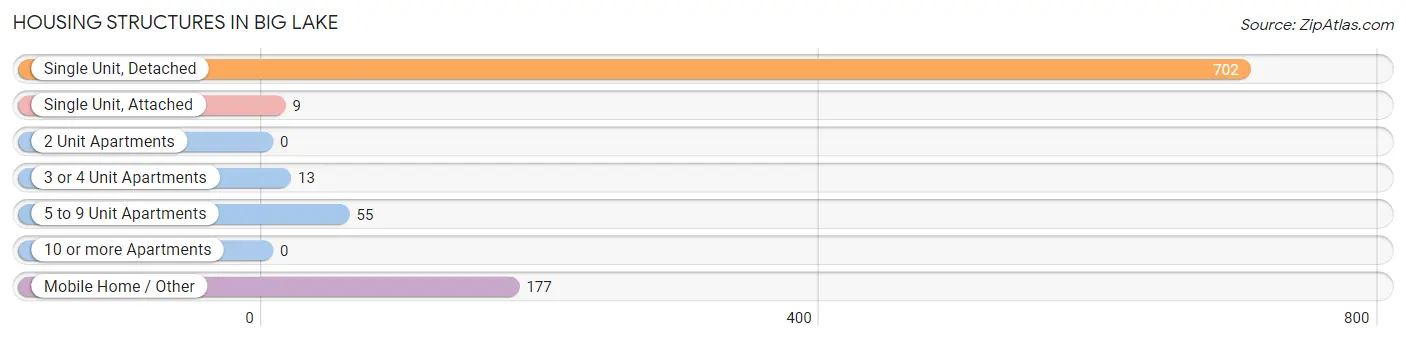
| Structure Type | # Housing Units | % Housing Units |
| Single Unit, Detached | 702 | 73.4% |
| Single Unit, Attached | 9 | 0.9% |
| 2 Unit Apartments | 0 | 0.0% |
| 3 or 4 Unit Apartments | 13 | 1.4% |
| 5 to 9 Unit Apartments | 55 | 5.8% |
| 10 or more Apartments | 0 | 0.0% |
| Mobile Home / Other | 177 | 18.5% |
| Total | 956 | 100.0% |
Housing Structures by Occupancy in Big Lake
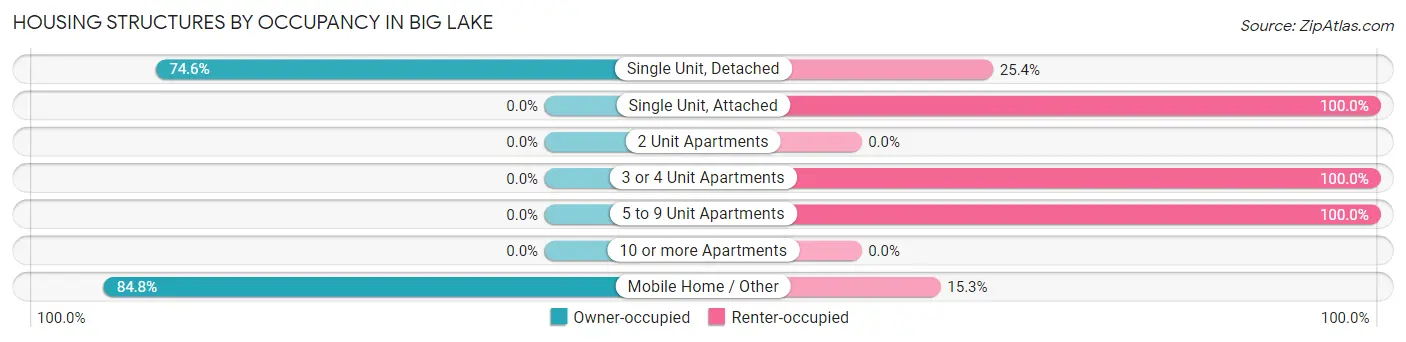
| Structure Type | Owner-occupied | Renter-occupied |
| Single Unit, Detached | 524 (74.6%) | 178 (25.4%) |
| Single Unit, Attached | 0 (0.0%) | 9 (100.0%) |
| 2 Unit Apartments | 0 (0.0%) | 0 (0.0%) |
| 3 or 4 Unit Apartments | 0 (0.0%) | 13 (100.0%) |
| 5 to 9 Unit Apartments | 0 (0.0%) | 55 (100.0%) |
| 10 or more Apartments | 0 (0.0%) | 0 (0.0%) |
| Mobile Home / Other | 150 (84.8%) | 27 (15.2%) |
| Total | 674 (70.5%) | 282 (29.5%) |
Housing Structures by Number of Rooms in Big Lake
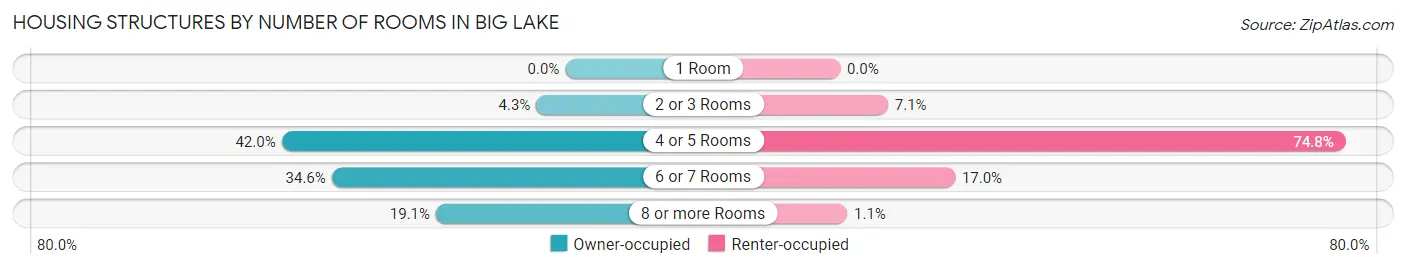
| Number of Rooms | Owner-occupied | Renter-occupied |
| 1 Room | 0 (0.0%) | 0 (0.0%) |
| 2 or 3 Rooms | 29 (4.3%) | 20 (7.1%) |
| 4 or 5 Rooms | 283 (42.0%) | 211 (74.8%) |
| 6 or 7 Rooms | 233 (34.6%) | 48 (17.0%) |
| 8 or more Rooms | 129 (19.1%) | 3 (1.1%) |
| Total | 674 (100.0%) | 282 (100.0%) |
Housing Structure by Heating Type in Big Lake
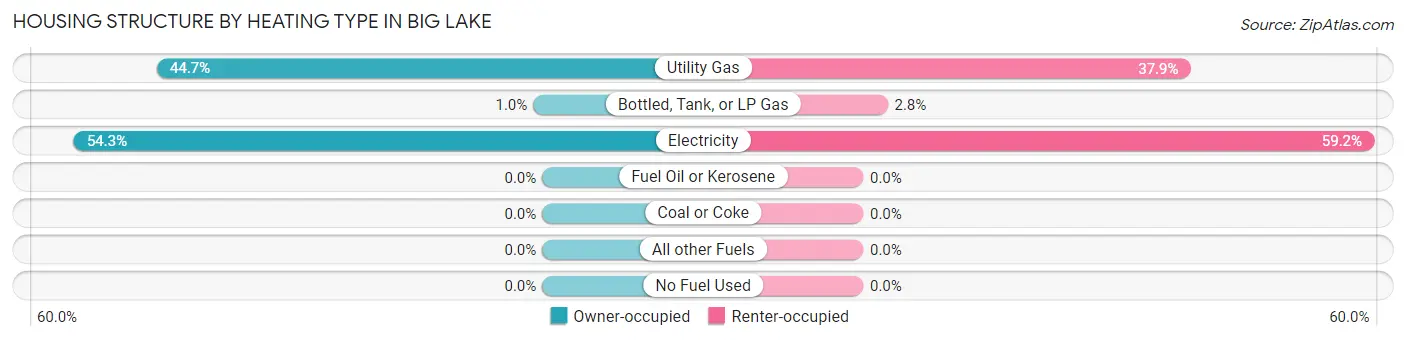
| Heating Type | Owner-occupied | Renter-occupied |
| Utility Gas | 301 (44.7%) | 107 (37.9%) |
| Bottled, Tank, or LP Gas | 7 (1.0%) | 8 (2.8%) |
| Electricity | 366 (54.3%) | 167 (59.2%) |
| Fuel Oil or Kerosene | 0 (0.0%) | 0 (0.0%) |
| Coal or Coke | 0 (0.0%) | 0 (0.0%) |
| All other Fuels | 0 (0.0%) | 0 (0.0%) |
| No Fuel Used | 0 (0.0%) | 0 (0.0%) |
| Total | 674 (100.0%) | 282 (100.0%) |
Household Vehicle Usage in Big Lake
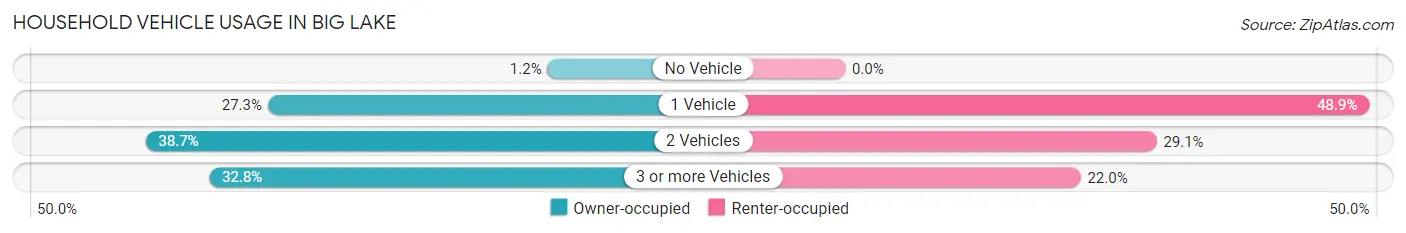
| Vehicles per Household | Owner-occupied | Renter-occupied |
| No Vehicle | 8 (1.2%) | 0 (0.0%) |
| 1 Vehicle | 184 (27.3%) | 138 (48.9%) |
| 2 Vehicles | 261 (38.7%) | 82 (29.1%) |
| 3 or more Vehicles | 221 (32.8%) | 62 (22.0%) |
| Total | 674 (100.0%) | 282 (100.0%) |
Real Estate & Mortgages in Big Lake
Real Estate and Mortgage Overview in Big Lake
| Characteristic | Without Mortgage | With Mortgage |
| Housing Units | 493 | 181 |
| Median Property Value | $113,600 | $120,300 |
| Median Household Income | $68,125 | $16 |
| Monthly Housing Costs | $511 | $0 |
| Real Estate Taxes | $1,335 | $0 |
Property Value by Mortgage Status in Big Lake
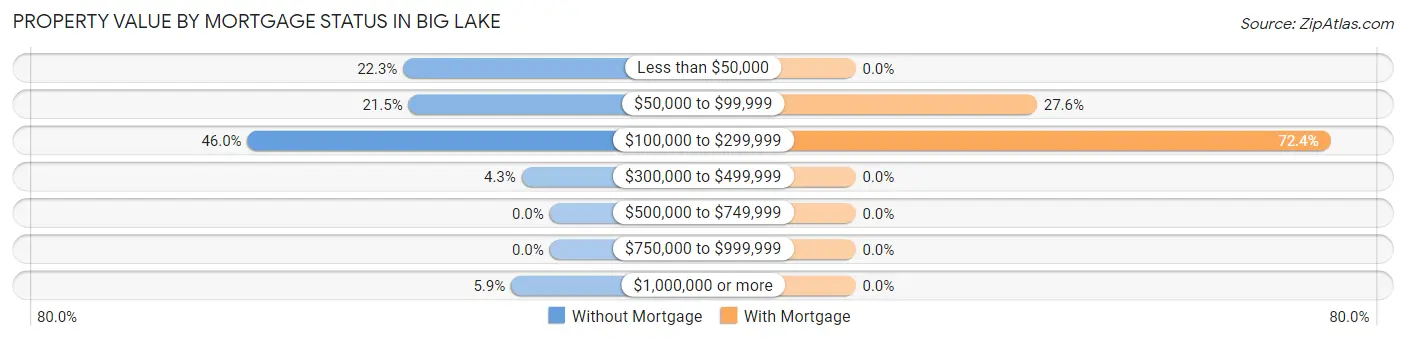
| Property Value | Without Mortgage | With Mortgage |
| Less than $50,000 | 110 (22.3%) | 0 (0.0%) |
| $50,000 to $99,999 | 106 (21.5%) | 50 (27.6%) |
| $100,000 to $299,999 | 227 (46.0%) | 131 (72.4%) |
| $300,000 to $499,999 | 21 (4.3%) | 0 (0.0%) |
| $500,000 to $749,999 | 0 (0.0%) | 0 (0.0%) |
| $750,000 to $999,999 | 0 (0.0%) | 0 (0.0%) |
| $1,000,000 or more | 29 (5.9%) | 0 (0.0%) |
| Total | 493 (100.0%) | 181 (100.0%) |
Household Income by Mortgage Status in Big Lake
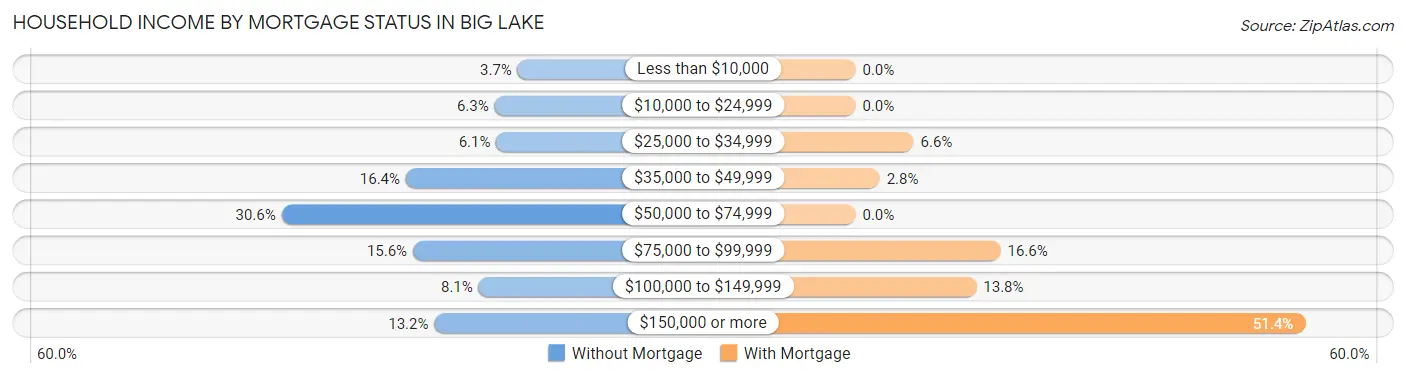
| Household Income | Without Mortgage | With Mortgage |
| Less than $10,000 | 18 (3.6%) | 0 (0.0%) |
| $10,000 to $24,999 | 31 (6.3%) | 0 (0.0%) |
| $25,000 to $34,999 | 30 (6.1%) | 12 (6.6%) |
| $35,000 to $49,999 | 81 (16.4%) | 5 (2.8%) |
| $50,000 to $74,999 | 151 (30.6%) | 0 (0.0%) |
| $75,000 to $99,999 | 77 (15.6%) | 30 (16.6%) |
| $100,000 to $149,999 | 40 (8.1%) | 25 (13.8%) |
| $150,000 or more | 65 (13.2%) | 93 (51.4%) |
| Total | 493 (100.0%) | 181 (100.0%) |
Property Value to Household Income Ratio in Big Lake
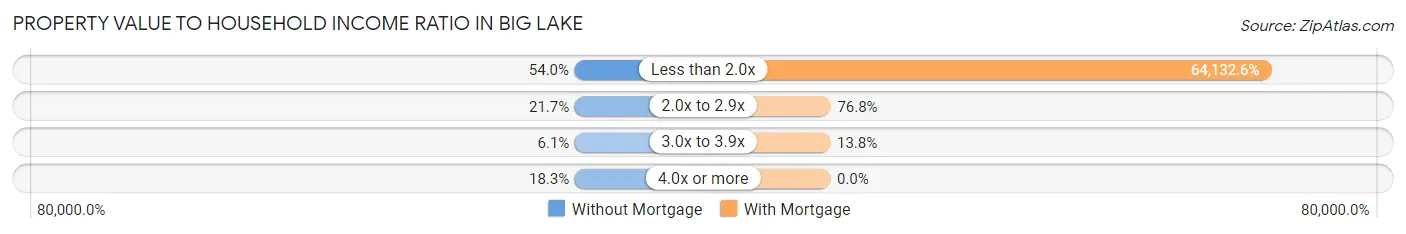
| Value-to-Income Ratio | Without Mortgage | With Mortgage |
| Less than 2.0x | 266 (54.0%) | 116,080 (64,132.6%) |
| 2.0x to 2.9x | 107 (21.7%) | 139 (76.8%) |
| 3.0x to 3.9x | 30 (6.1%) | 25 (13.8%) |
| 4.0x or more | 90 (18.3%) | 0 (0.0%) |
| Total | 493 (100.0%) | 181 (100.0%) |
Real Estate Taxes by Mortgage Status in Big Lake
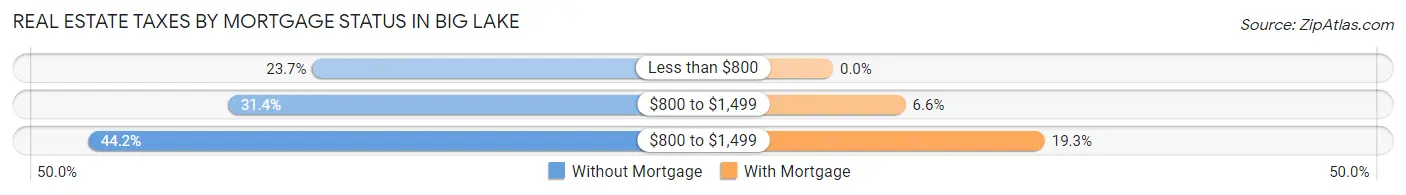
| Property Taxes | Without Mortgage | With Mortgage |
| Less than $800 | 117 (23.7%) | 0 (0.0%) |
| $800 to $1,499 | 155 (31.4%) | 12 (6.6%) |
| $800 to $1,499 | 218 (44.2%) | 35 (19.3%) |
| Total | 493 (100.0%) | 181 (100.0%) |
Health & Disability in Big Lake
Health Insurance Coverage by Age in Big Lake
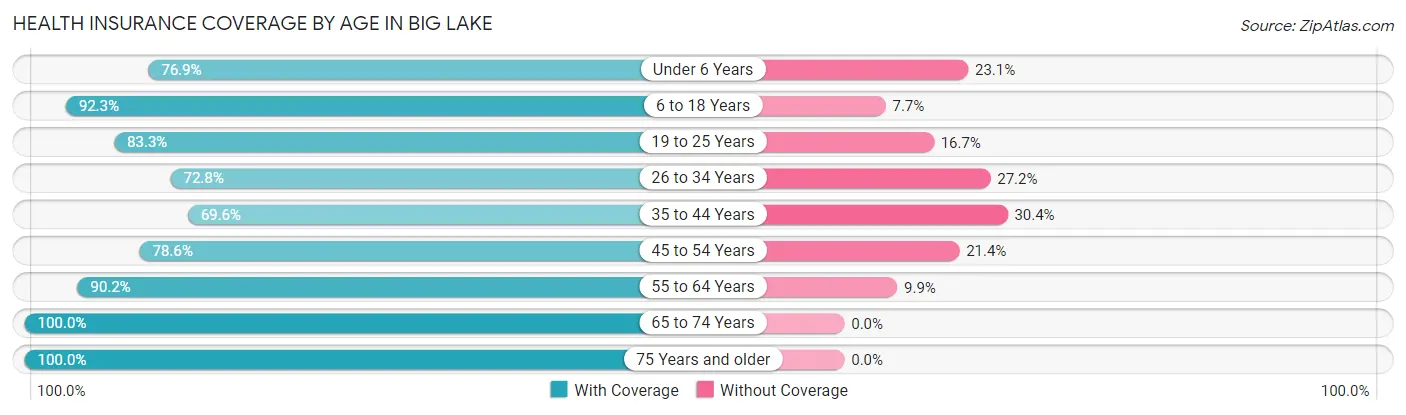
| Age Bracket | With Coverage | Without Coverage |
| Under 6 Years | 240 (76.9%) | 72 (23.1%) |
| 6 to 18 Years | 636 (92.3%) | 53 (7.7%) |
| 19 to 25 Years | 285 (83.3%) | 57 (16.7%) |
| 26 to 34 Years | 238 (72.8%) | 89 (27.2%) |
| 35 to 44 Years | 295 (69.6%) | 129 (30.4%) |
| 45 to 54 Years | 253 (78.6%) | 69 (21.4%) |
| 55 to 64 Years | 293 (90.1%) | 32 (9.9%) |
| 65 to 74 Years | 139 (100.0%) | 0 (0.0%) |
| 75 Years and older | 73 (100.0%) | 0 (0.0%) |
| Total | 2,452 (83.0%) | 501 (17.0%) |
Health Insurance Coverage by Citizenship Status in Big Lake
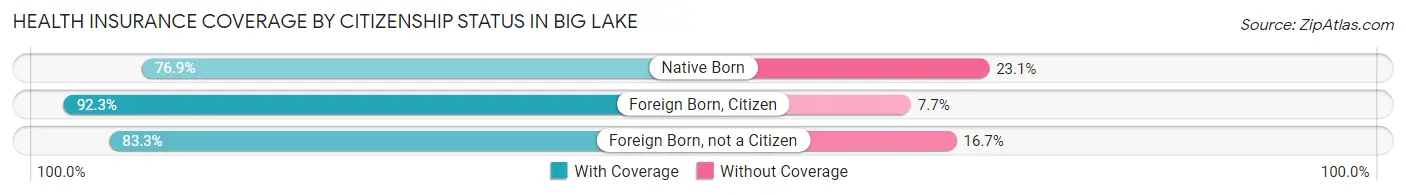
| Citizenship Status | With Coverage | Without Coverage |
| Native Born | 240 (76.9%) | 72 (23.1%) |
| Foreign Born, Citizen | 636 (92.3%) | 53 (7.7%) |
| Foreign Born, not a Citizen | 285 (83.3%) | 57 (16.7%) |
Health Insurance Coverage by Household Income in Big Lake
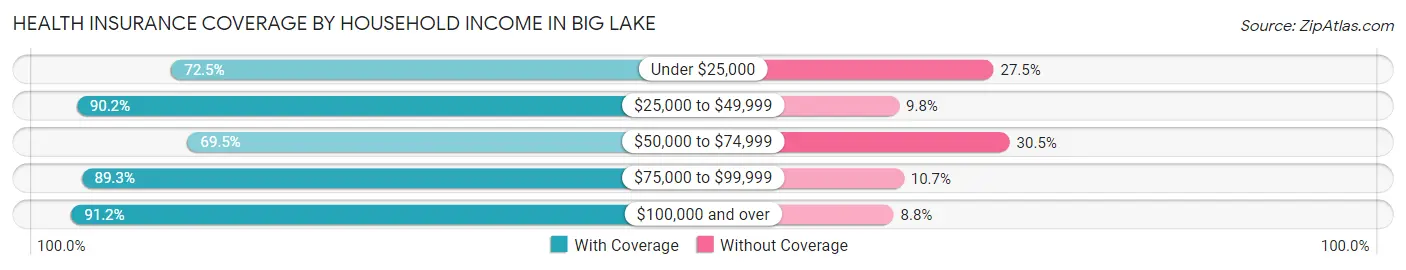
| Household Income | With Coverage | Without Coverage |
| Under $25,000 | 153 (72.5%) | 58 (27.5%) |
| $25,000 to $49,999 | 460 (90.2%) | 50 (9.8%) |
| $50,000 to $74,999 | 599 (69.5%) | 263 (30.5%) |
| $75,000 to $99,999 | 460 (89.3%) | 55 (10.7%) |
| $100,000 and over | 780 (91.2%) | 75 (8.8%) |
Public vs Private Health Insurance Coverage by Age in Big Lake
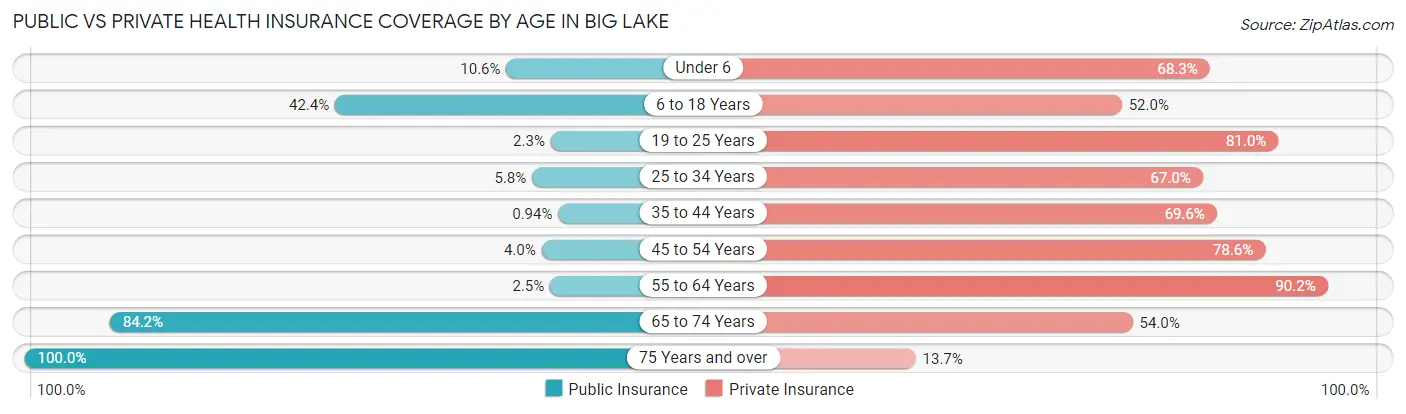
| Age Bracket | Public Insurance | Private Insurance |
| Under 6 | 33 (10.6%) | 213 (68.3%) |
| 6 to 18 Years | 292 (42.4%) | 358 (52.0%) |
| 19 to 25 Years | 8 (2.3%) | 277 (81.0%) |
| 25 to 34 Years | 19 (5.8%) | 219 (67.0%) |
| 35 to 44 Years | 4 (0.9%) | 295 (69.6%) |
| 45 to 54 Years | 13 (4.0%) | 253 (78.6%) |
| 55 to 64 Years | 8 (2.5%) | 293 (90.1%) |
| 65 to 74 Years | 117 (84.2%) | 75 (54.0%) |
| 75 Years and over | 73 (100.0%) | 10 (13.7%) |
| Total | 567 (19.2%) | 1,993 (67.5%) |
Disability Status by Sex by Age in Big Lake
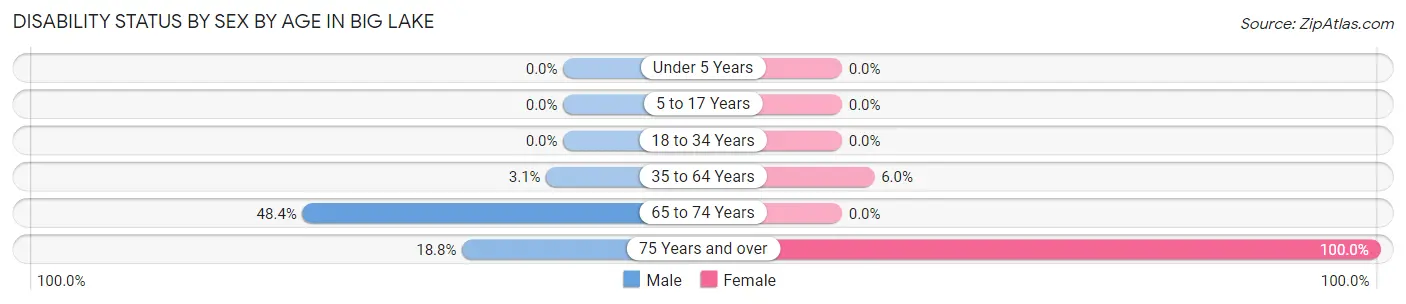
| Age Bracket | Male | Female |
| Under 5 Years | 0 (0.0%) | 0 (0.0%) |
| 5 to 17 Years | 0 (0.0%) | 0 (0.0%) |
| 18 to 34 Years | 0 (0.0%) | 0 (0.0%) |
| 35 to 64 Years | 19 (3.1%) | 28 (6.0%) |
| 65 to 74 Years | 45 (48.4%) | 0 (0.0%) |
| 75 Years and over | 9 (18.8%) | 25 (100.0%) |
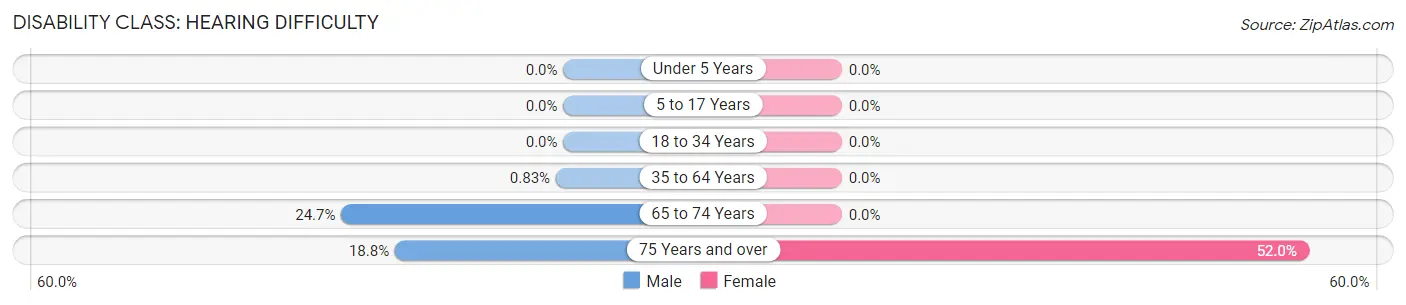
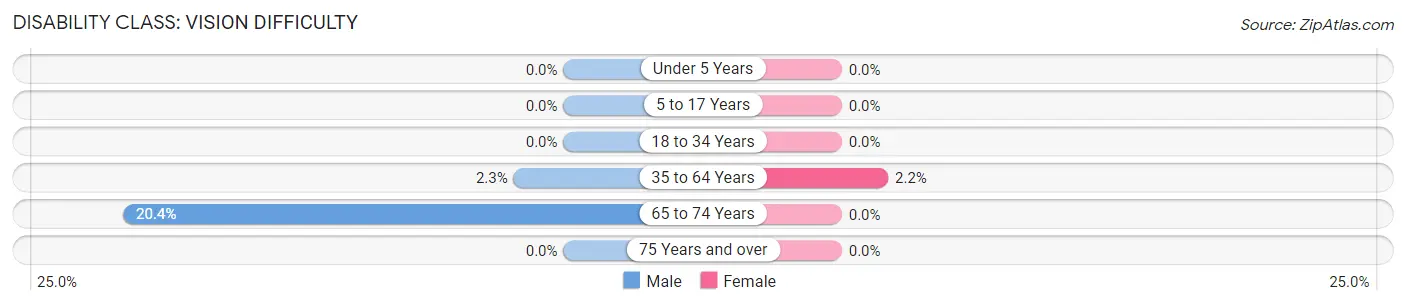
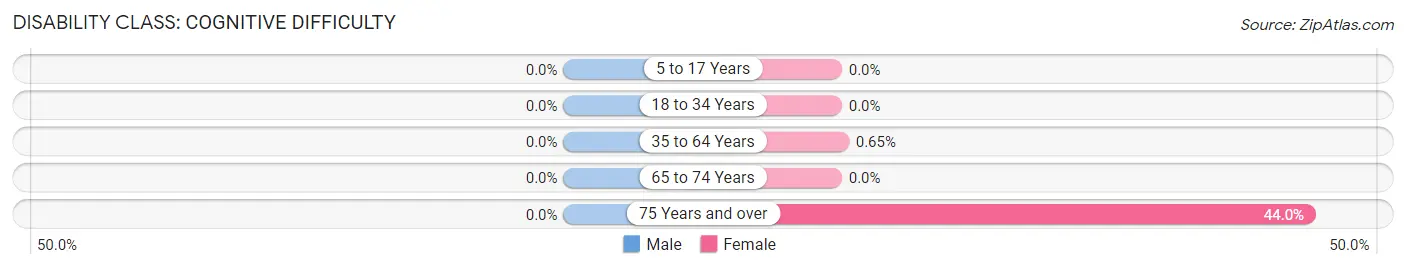
Disability Class by Sex by Age in Big Lake
Disability Class: Hearing Difficulty
| Age Bracket | Male | Female |
| Under 5 Years | 0 (0.0%) | 0 (0.0%) |
| 5 to 17 Years | 0 (0.0%) | 0 (0.0%) |
| 18 to 34 Years | 0 (0.0%) | 0 (0.0%) |
| 35 to 64 Years | 5 (0.8%) | 0 (0.0%) |
| 65 to 74 Years | 23 (24.7%) | 0 (0.0%) |
| 75 Years and over | 9 (18.8%) | 13 (52.0%) |
Disability Class: Vision Difficulty
| Age Bracket | Male | Female |
| Under 5 Years | 0 (0.0%) | 0 (0.0%) |
| 5 to 17 Years | 0 (0.0%) | 0 (0.0%) |
| 18 to 34 Years | 0 (0.0%) | 0 (0.0%) |
| 35 to 64 Years | 14 (2.3%) | 10 (2.1%) |
| 65 to 74 Years | 19 (20.4%) | 0 (0.0%) |
| 75 Years and over | 0 (0.0%) | 0 (0.0%) |
Disability Class: Cognitive Difficulty
| Age Bracket | Male | Female |
| 5 to 17 Years | 0 (0.0%) | 0 (0.0%) |
| 18 to 34 Years | 0 (0.0%) | 0 (0.0%) |
| 35 to 64 Years | 0 (0.0%) | 3 (0.6%) |
| 65 to 74 Years | 0 (0.0%) | 0 (0.0%) |
| 75 Years and over | 0 (0.0%) | 11 (44.0%) |
Disability Class: Ambulatory Difficulty
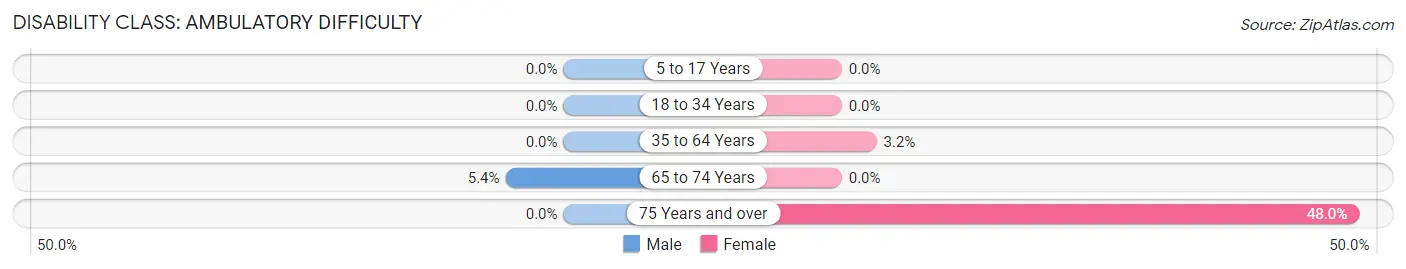
| Age Bracket | Male | Female |
| 5 to 17 Years | 0 (0.0%) | 0 (0.0%) |
| 18 to 34 Years | 0 (0.0%) | 0 (0.0%) |
| 35 to 64 Years | 0 (0.0%) | 15 (3.2%) |
| 65 to 74 Years | 5 (5.4%) | 0 (0.0%) |
| 75 Years and over | 0 (0.0%) | 12 (48.0%) |
Disability Class: Self-Care Difficulty
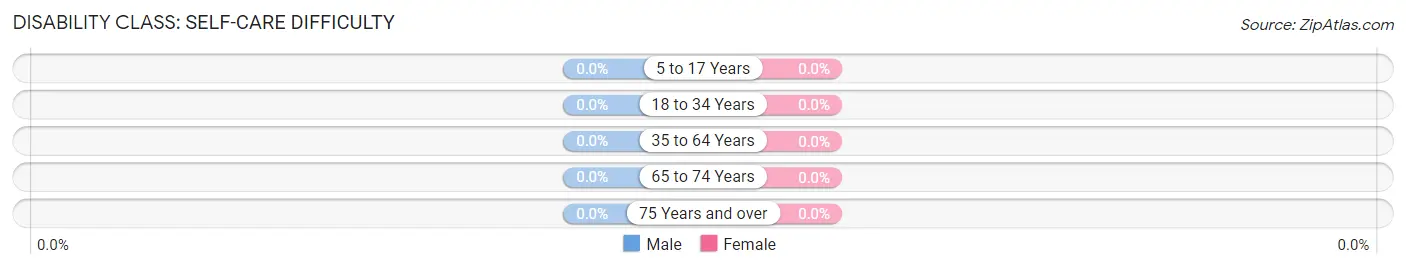
| Age Bracket | Male | Female |
| 5 to 17 Years | 0 (0.0%) | 0 (0.0%) |
| 18 to 34 Years | 0 (0.0%) | 0 (0.0%) |
| 35 to 64 Years | 0 (0.0%) | 0 (0.0%) |
| 65 to 74 Years | 0 (0.0%) | 0 (0.0%) |
| 75 Years and over | 0 (0.0%) | 0 (0.0%) |
Technology Access in Big Lake
Computing Device Access in Big Lake
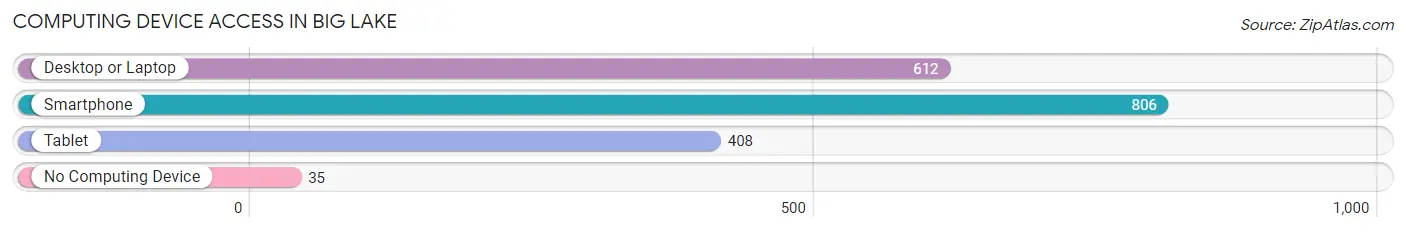
| Device Type | # Households | % Households |
| Desktop or Laptop | 612 | 64.0% |
| Smartphone | 806 | 84.3% |
| Tablet | 408 | 42.7% |
| No Computing Device | 35 | 3.7% |
| Total | 956 | 100.0% |
Internet Access in Big Lake
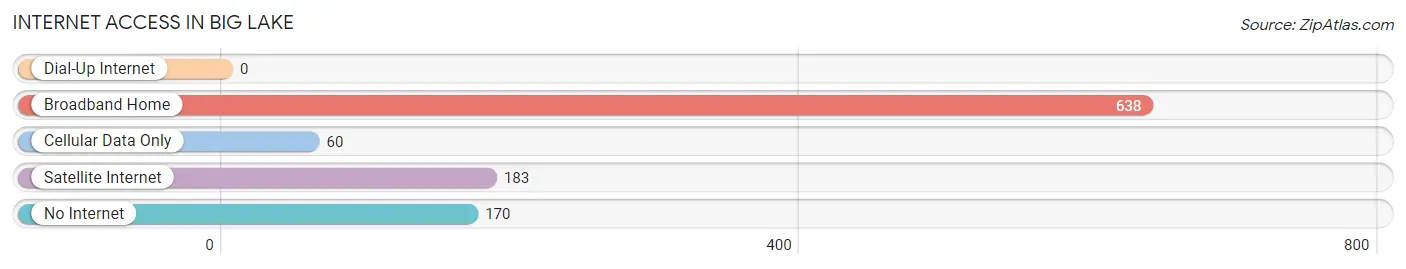
| Internet Type | # Households | % Households |
| Dial-Up Internet | 0 | 0.0% |
| Broadband Home | 638 | 66.7% |
| Cellular Data Only | 60 | 6.3% |
| Satellite Internet | 183 | 19.1% |
| No Internet | 170 | 17.8% |
| Total | 956 | 100.0% |
Big Lake Summary
Big Lake is a small city located in Reagan County, Texas, United States. It is situated on the northern edge of the Edwards Plateau, approximately 90 miles southwest of San Angelo and 120 miles northwest of Del Rio. The city is the county seat of Reagan County and has a population of approximately 2,000 people.
History
Big Lake was founded in 1881 by ranchers and farmers who were attracted to the area by the abundance of water and grass. The town was originally called “Big Lake Station” and was a stop on the Texas and Pacific Railway. The name was changed to Big Lake in 1883.
In the early 1900s, Big Lake was a thriving community with a population of over 1,000 people. The town had several stores, a hotel, a bank, a post office, a school, and a newspaper. The town was also home to a number of churches, including the First Baptist Church, which was established in 1883.
In the 1920s, the discovery of oil in the area brought a new wave of prosperity to Big Lake. The town became a center for oil production and related industries. The population of Big Lake grew to over 3,000 people by the mid-1930s.
Geography
Big Lake is located in the northern part of Reagan County, Texas. The city is situated on the northern edge of the Edwards Plateau, approximately 90 miles southwest of San Angelo and 120 miles northwest of Del Rio. The terrain around Big Lake is mostly flat, with some rolling hills. The area is known for its abundant wildlife, including deer, quail, and dove.
The climate in Big Lake is semi-arid, with hot summers and mild winters. The average annual temperature is 68°F (20°C). The average annual precipitation is 17.5 inches (44.5 cm).
Economy
The economy of Big Lake is largely based on agriculture and oil production. The area is known for its production of cotton, sorghum, and wheat. Oil production is also an important part of the local economy.
The city is home to several businesses, including a grocery store, a hardware store, a bank, and a number of restaurants. The city also has a hospital and a number of churches.
Demographics
As of the 2010 census, the population of Big Lake was 2,039. The racial makeup of the city was 79.3% White, 0.3% African American, 0.2% Native American, 0.2% Asian, 0.1% Pacific Islander, 18.3% from other races, and 1.7% from two or more races. Hispanic or Latino of any race were 37.2% of the population.
The median income for a household in Big Lake was $31,250, and the median income for a family was $35,417. The per capita income for the city was $14,945. About 18.3% of families and 22.2% of the population were below the poverty line, including 28.3% of those under age 18 and 15.2% of those age 65 or over.
Common Questions
What is Per Capita Income in Big Lake?
Per Capita income in Big Lake is $28,458.
What is the Median Family Income in Big Lake?
Median Family Income in Big Lake is $80,500.
What is the Median Household income in Big Lake?
Median Household Income in Big Lake is $70,160.
What is Income or Wage Gap in Big Lake?
Income or Wage Gap in Big Lake is 35.6%.
Women in Big Lake earn 64.4 cents for every dollar earned by a man.
What is Family Income Deficit in Big Lake?
Family Income Deficit in Big Lake is $5,960.
Families that are below poverty line in Big Lake earn $5,960 less on average than the poverty threshold level.
What is Inequality or Gini Index in Big Lake?
Inequality or Gini Index in Big Lake is 0.37.
What is the Total Population of Big Lake?
Total Population of Big Lake is 2,977.
What is the Total Male Population of Big Lake?
Total Male Population of Big Lake is 1,542.
What is the Total Female Population of Big Lake?
Total Female Population of Big Lake is 1,435.
What is the Ratio of Males per 100 Females in Big Lake?
There are 107.46 Males per 100 Females in Big Lake.
What is the Ratio of Females per 100 Males in Big Lake?
There are 93.06 Females per 100 Males in Big Lake.
What is the Median Population Age in Big Lake?
Median Population Age in Big Lake is 30.0 Years.
What is the Average Family Size in Big Lake
Average Family Size in Big Lake is 3.5 People.
What is the Average Household Size in Big Lake
Average Household Size in Big Lake is 3.1 People.
How Large is the Labor Force in Big Lake?
There are 1,451 People in the Labor Forcein in Big Lake.
What is the Percentage of People in the Labor Force in Big Lake?
69.4% of People are in the Labor Force in Big Lake.
What is the Unemployment Rate in Big Lake?
Unemployment Rate in Big Lake is 7.9%.