Anna, TX Map & Demographics
Anna Map
Anna Overview
$36,340
PER CAPITA INCOME
$98,389
AVG FAMILY INCOME
$93,785
AVG HOUSEHOLD INCOME
31.0%
WAGE / INCOME GAP [ % ]
69.0¢/ $1
WAGE / INCOME GAP [ $ ]
0.39
INEQUALITY / GINI INDEX
18,585
TOTAL POPULATION
8,968
MALE POPULATION
9,617
FEMALE POPULATION
93.25
MALES / 100 FEMALES
107.24
FEMALES / 100 MALES
32.2
MEDIAN AGE
3.3
AVG FAMILY SIZE
3.0
AVG HOUSEHOLD SIZE
10,049
LABOR FORCE [ PEOPLE ]
71.0%
PERCENT IN LABOR FORCE
3.4%
UNEMPLOYMENT RATE
Anna Zip Codes
Income in Anna
Income Overview in Anna
Per Capita Income in Anna is $36,340, while median incomes of families and households are $98,389 and $93,785 respectively.
| Characteristic | Number | Measure |
| Per Capita Income | 18,585 | $36,340 |
| Median Family Income | 5,133 | $98,389 |
| Mean Family Income | 5,133 | $114,206 |
| Median Household Income | 6,161 | $93,785 |
| Mean Household Income | 6,161 | $107,060 |
| Income Deficit | 5,133 | $0 |
| Wage / Income Gap (%) | 18,585 | 31.03% |
| Wage / Income Gap ($) | 18,585 | 68.97¢ per $1 |
| Gini / Inequality Index | 18,585 | 0.39 |
Earnings by Sex in Anna
Average Earnings in Anna are $47,204, $56,688 for men and $39,097 for women, a difference of 31.0%.
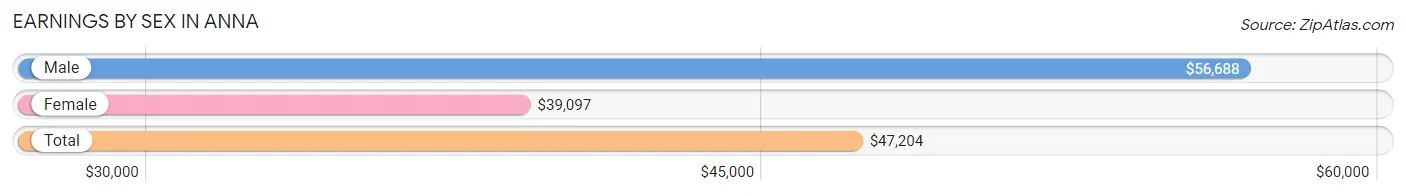
| Sex | Number | Average Earnings |
| Male | 5,318 (50.3%) | $56,688 |
| Female | 5,255 (49.7%) | $39,097 |
| Total | 10,573 (100.0%) | $47,204 |
Earnings by Sex by Income Bracket in Anna
The most common earnings brackets in Anna are $75,000 to $99,999 for men (1,262 | 23.7%) and $75,000 to $99,999 for women (552 | 10.5%).
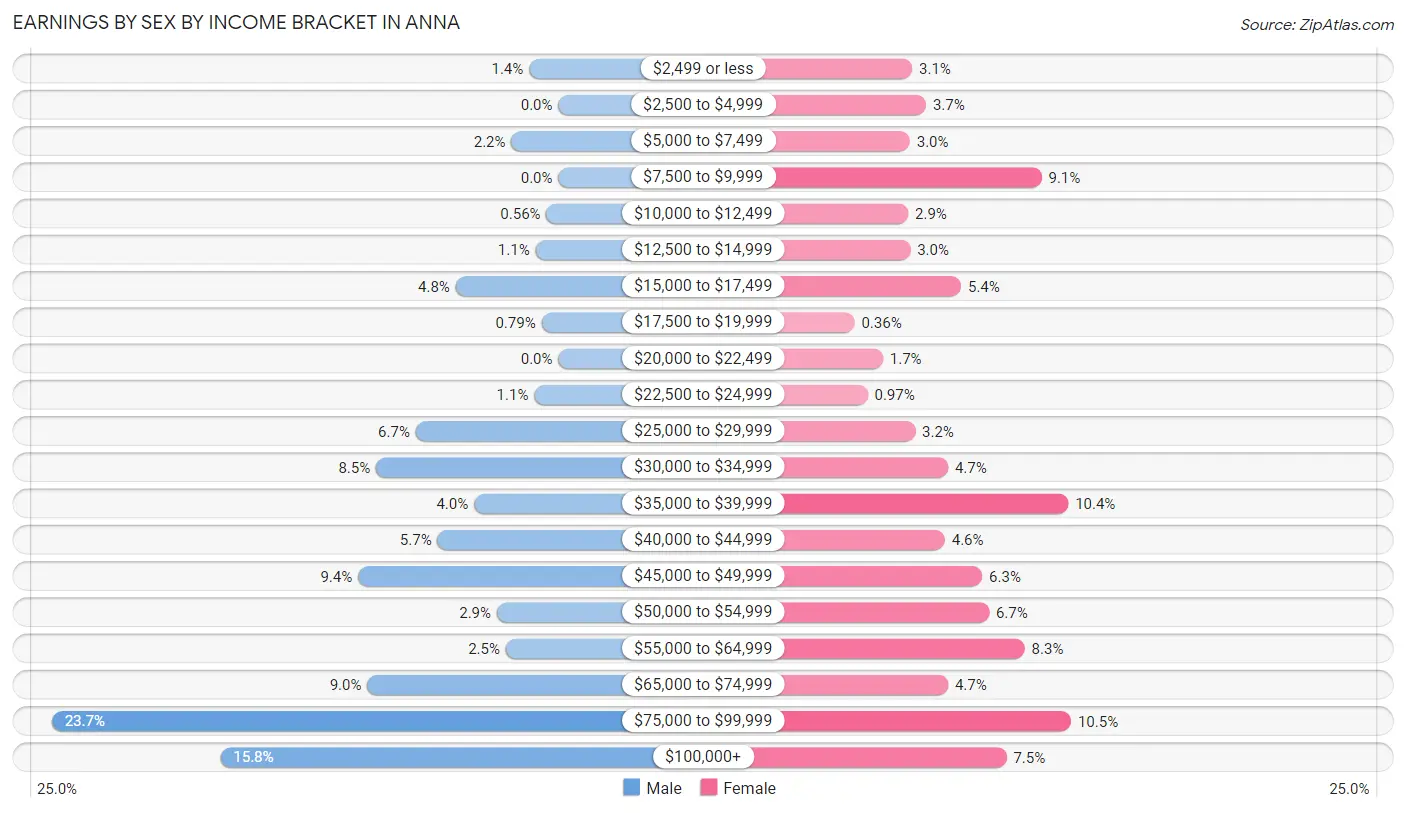
| Income | Male | Female |
| $2,499 or less | 73 (1.4%) | 161 (3.1%) |
| $2,500 to $4,999 | 0 (0.0%) | 195 (3.7%) |
| $5,000 to $7,499 | 117 (2.2%) | 155 (2.9%) |
| $7,500 to $9,999 | 0 (0.0%) | 479 (9.1%) |
| $10,000 to $12,499 | 30 (0.6%) | 151 (2.9%) |
| $12,500 to $14,999 | 57 (1.1%) | 156 (3.0%) |
| $15,000 to $17,499 | 256 (4.8%) | 281 (5.3%) |
| $17,500 to $19,999 | 42 (0.8%) | 19 (0.4%) |
| $20,000 to $22,499 | 0 (0.0%) | 89 (1.7%) |
| $22,500 to $24,999 | 60 (1.1%) | 51 (1.0%) |
| $25,000 to $29,999 | 355 (6.7%) | 168 (3.2%) |
| $30,000 to $34,999 | 454 (8.5%) | 249 (4.7%) |
| $35,000 to $39,999 | 210 (4.0%) | 545 (10.4%) |
| $40,000 to $44,999 | 301 (5.7%) | 241 (4.6%) |
| $45,000 to $49,999 | 499 (9.4%) | 333 (6.3%) |
| $50,000 to $54,999 | 153 (2.9%) | 350 (6.7%) |
| $55,000 to $64,999 | 131 (2.5%) | 438 (8.3%) |
| $65,000 to $74,999 | 476 (8.9%) | 249 (4.7%) |
| $75,000 to $99,999 | 1,262 (23.7%) | 552 (10.5%) |
| $100,000+ | 842 (15.8%) | 393 (7.5%) |
| Total | 5,318 (100.0%) | 5,255 (100.0%) |
Earnings by Sex by Educational Attainment in Anna
Average earnings in Anna are $67,728 for men and $46,003 for women, a difference of 32.1%. Men with an educational attainment of bachelor's degree enjoy the highest average annual earnings of $85,953, while those with high school diploma education earn the least with $36,726. Women with an educational attainment of graduate degree earn the most with the average annual earnings of $79,365, while those with high school diploma education have the smallest earnings of $39,375.
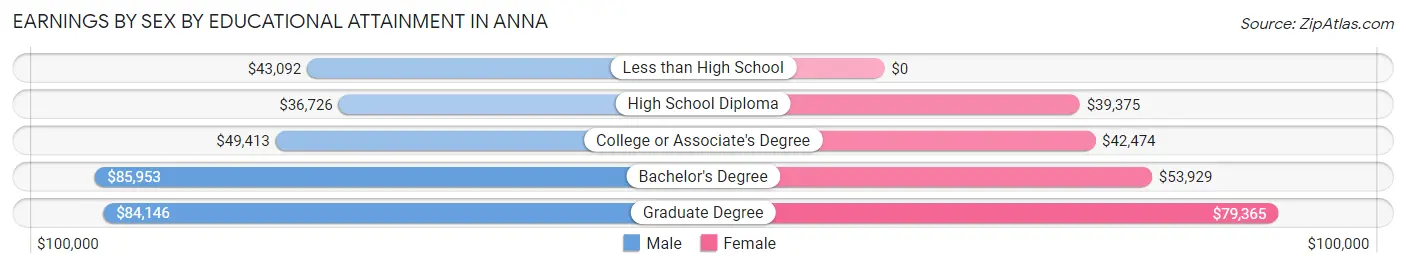
| Educational Attainment | Male Income | Female Income |
| Less than High School | $43,092 | $0 |
| High School Diploma | $36,726 | $39,375 |
| College or Associate's Degree | $49,413 | $42,474 |
| Bachelor's Degree | $85,953 | $53,929 |
| Graduate Degree | $84,146 | $79,365 |
| Total | $67,728 | $46,003 |
Family Income in Anna
Family Income Brackets in Anna
According to the Anna family income data, there are 1,386 families falling into the $100,000 to $149,999 income range, which is the most common income bracket and makes up 27.0% of all families.
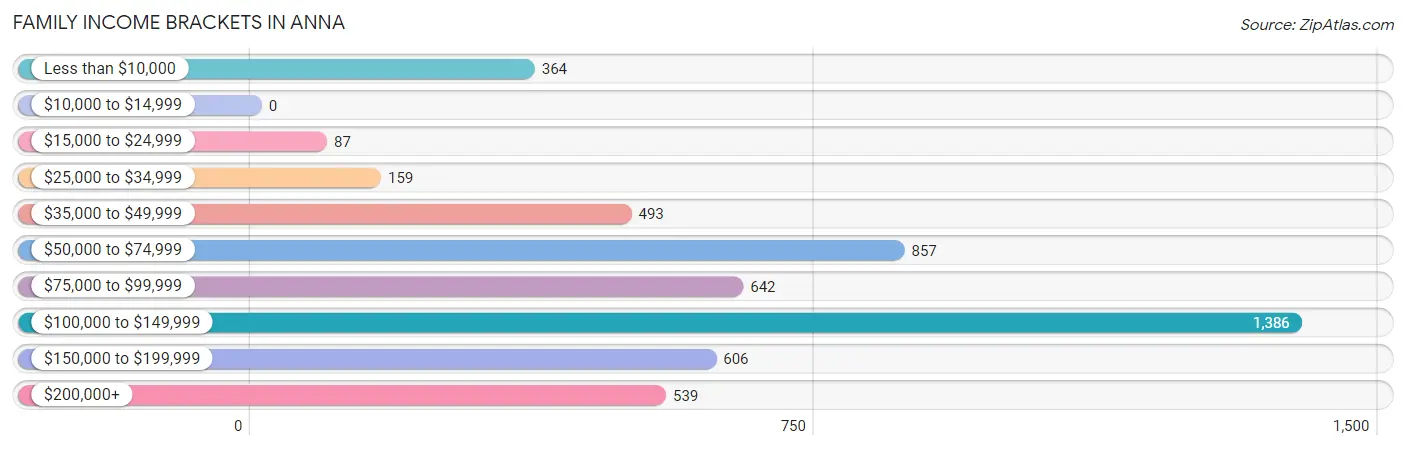
| Income Bracket | # Families | % Families |
| Less than $10,000 | 364 | 7.1% |
| $10,000 to $14,999 | 0 | 0.0% |
| $15,000 to $24,999 | 87 | 1.7% |
| $25,000 to $34,999 | 159 | 3.1% |
| $35,000 to $49,999 | 493 | 9.6% |
| $50,000 to $74,999 | 857 | 16.7% |
| $75,000 to $99,999 | 642 | 12.5% |
| $100,000 to $149,999 | 1,386 | 27.0% |
| $150,000 to $199,999 | 606 | 11.8% |
| $200,000+ | 539 | 10.5% |
Family Income by Famaliy Size in Anna
7+ person families (52 | 1.0%) account for the highest median family income in Anna with $173,173 per family, while 2-person families (2,051 | 40.0%) have the highest median income of $51,722 per family member.
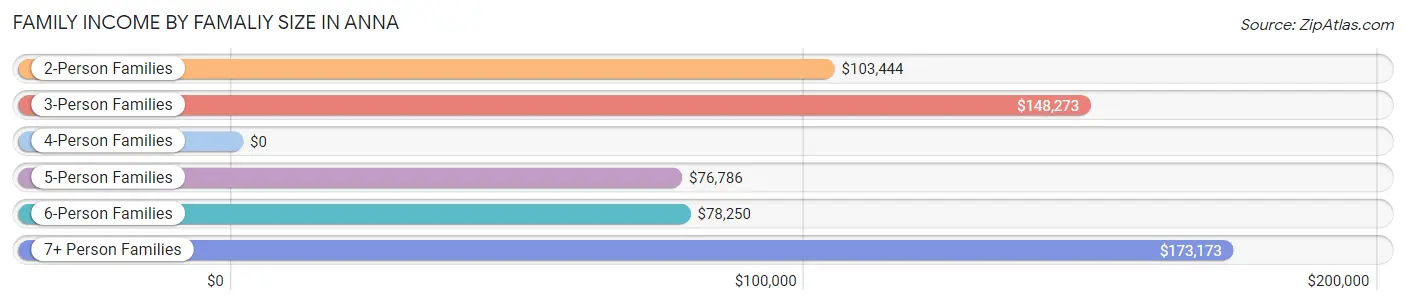
| Income Bracket | # Families | Median Income |
| 2-Person Families | 2,051 (40.0%) | $103,444 |
| 3-Person Families | 789 (15.4%) | $148,273 |
| 4-Person Families | 1,293 (25.2%) | $0 |
| 5-Person Families | 838 (16.3%) | $76,786 |
| 6-Person Families | 110 (2.1%) | $78,250 |
| 7+ Person Families | 52 (1.0%) | $173,173 |
| Total | 5,133 (100.0%) | $98,389 |
Family Income by Number of Earners in Anna
The median family income in Anna is $98,389, with families comprising 3+ earners (784) having the highest median family income of $158,919, while families with no earners (230) have the lowest median family income of $2,499, accounting for 15.3% and 4.5% of families, respectively.
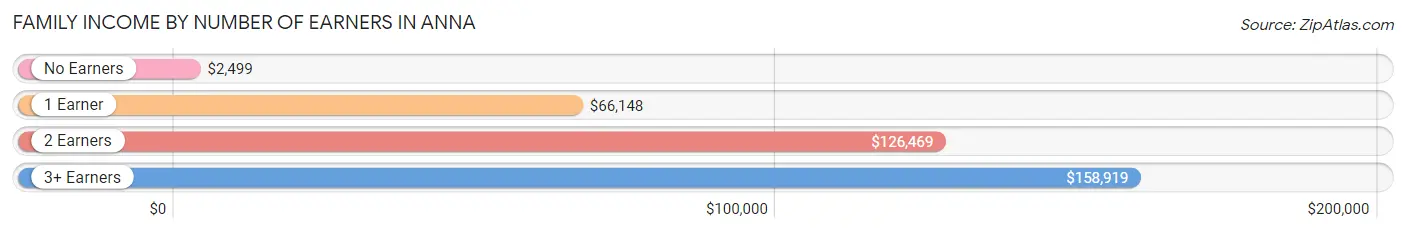
| Number of Earners | # Families | Median Income |
| No Earners | 230 (4.5%) | $2,499 |
| 1 Earner | 1,873 (36.5%) | $66,148 |
| 2 Earners | 2,246 (43.8%) | $126,469 |
| 3+ Earners | 784 (15.3%) | $158,919 |
| Total | 5,133 (100.0%) | $98,389 |
Household Income in Anna
Household Income Brackets in Anna
With 1,694 households falling in the category, the $100,000 to $149,999 income range is the most frequent in Anna, accounting for 27.5% of all households.
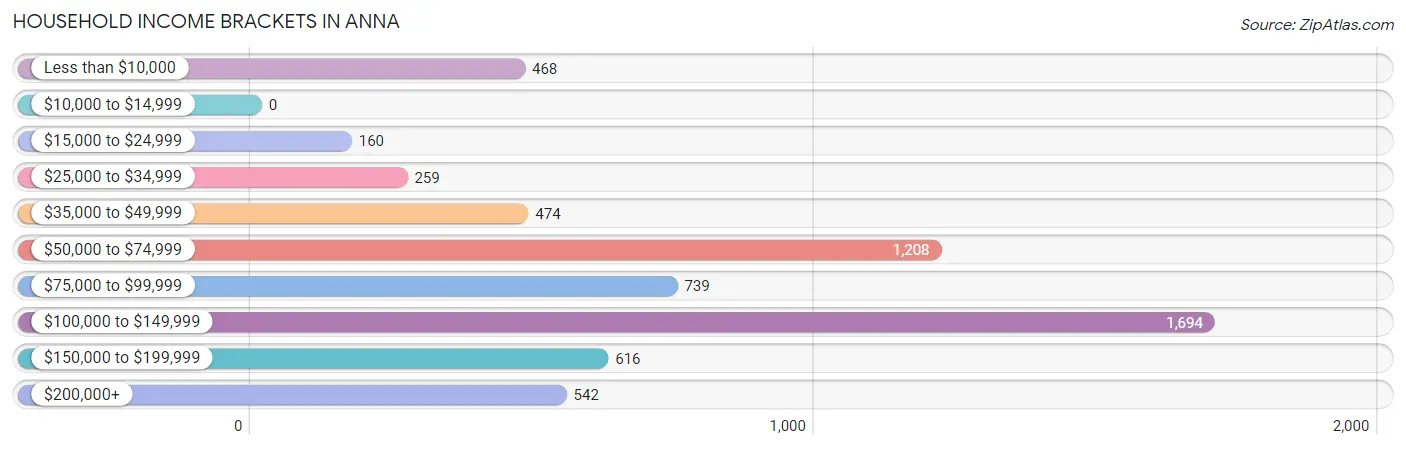
| Income Bracket | # Households | % Households |
| Less than $10,000 | 468 | 7.6% |
| $10,000 to $14,999 | 0 | 0.0% |
| $15,000 to $24,999 | 160 | 2.6% |
| $25,000 to $34,999 | 259 | 4.2% |
| $35,000 to $49,999 | 474 | 7.7% |
| $50,000 to $74,999 | 1,208 | 19.6% |
| $75,000 to $99,999 | 739 | 12.0% |
| $100,000 to $149,999 | 1,694 | 27.5% |
| $150,000 to $199,999 | 616 | 10.0% |
| $200,000+ | 542 | 8.8% |
Household Income by Householder Age in Anna
The median household income in Anna is $93,785, with the highest median household income of $103,585 found in the 15 to 24 years age bracket for the primary householder. A total of 161 households (2.6%) fall into this category. Meanwhile, the 65+ years age bracket for the primary householder has the lowest median household income of $31,648, with 655 households (10.6%) in this group.
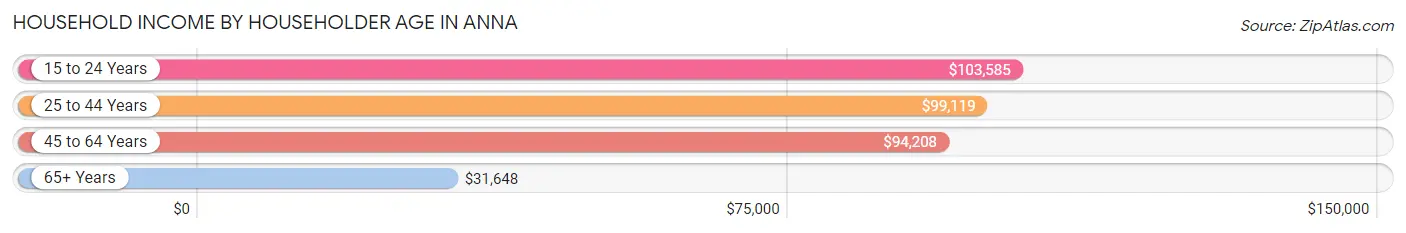
| Income Bracket | # Households | Median Income |
| 15 to 24 Years | 161 (2.6%) | $103,585 |
| 25 to 44 Years | 3,141 (51.0%) | $99,119 |
| 45 to 64 Years | 2,204 (35.8%) | $94,208 |
| 65+ Years | 655 (10.6%) | $31,648 |
| Total | 6,161 (100.0%) | $93,785 |
Poverty in Anna
Income Below Poverty by Sex and Age in Anna
With 11.0% poverty level for males and 7.0% for females among the residents of Anna, 16 and 17 year old males and 15 year old females are the most vulnerable to poverty, with 187 males (79.9%) and 50 females (56.2%) in their respective age groups living below the poverty level.
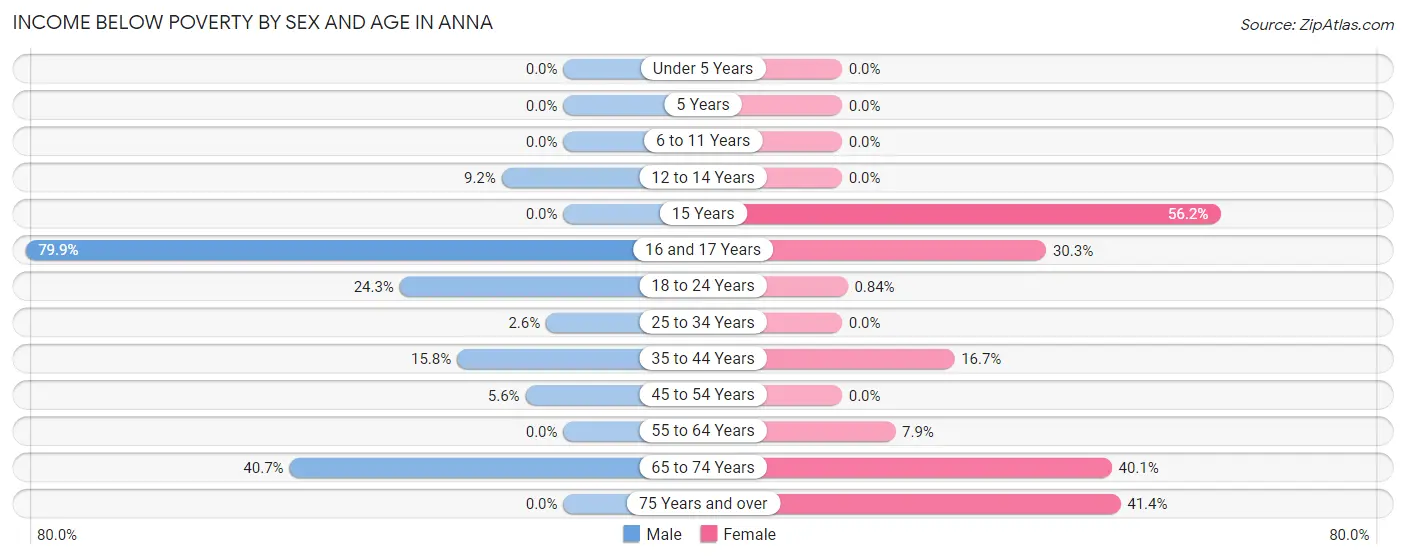
| Age Bracket | Male | Female |
| Under 5 Years | 0 (0.0%) | 0 (0.0%) |
| 5 Years | 0 (0.0%) | 0 (0.0%) |
| 6 to 11 Years | 0 (0.0%) | 0 (0.0%) |
| 12 to 14 Years | 55 (9.2%) | 0 (0.0%) |
| 15 Years | 0 (0.0%) | 50 (56.2%) |
| 16 and 17 Years | 187 (79.9%) | 114 (30.3%) |
| 18 to 24 Years | 262 (24.3%) | 7 (0.8%) |
| 25 to 34 Years | 40 (2.6%) | 0 (0.0%) |
| 35 to 44 Years | 228 (15.8%) | 236 (16.7%) |
| 45 to 54 Years | 62 (5.6%) | 0 (0.0%) |
| 55 to 64 Years | 0 (0.0%) | 75 (7.9%) |
| 65 to 74 Years | 155 (40.7%) | 131 (40.1%) |
| 75 Years and over | 0 (0.0%) | 55 (41.3%) |
| Total | 989 (11.0%) | 668 (7.0%) |
Income Above Poverty by Sex and Age in Anna
According to the poverty statistics in Anna, males aged under 5 years and females aged under 5 years are the age groups that are most secure financially, with 100.0% of males and 100.0% of females in these age groups living above the poverty line.
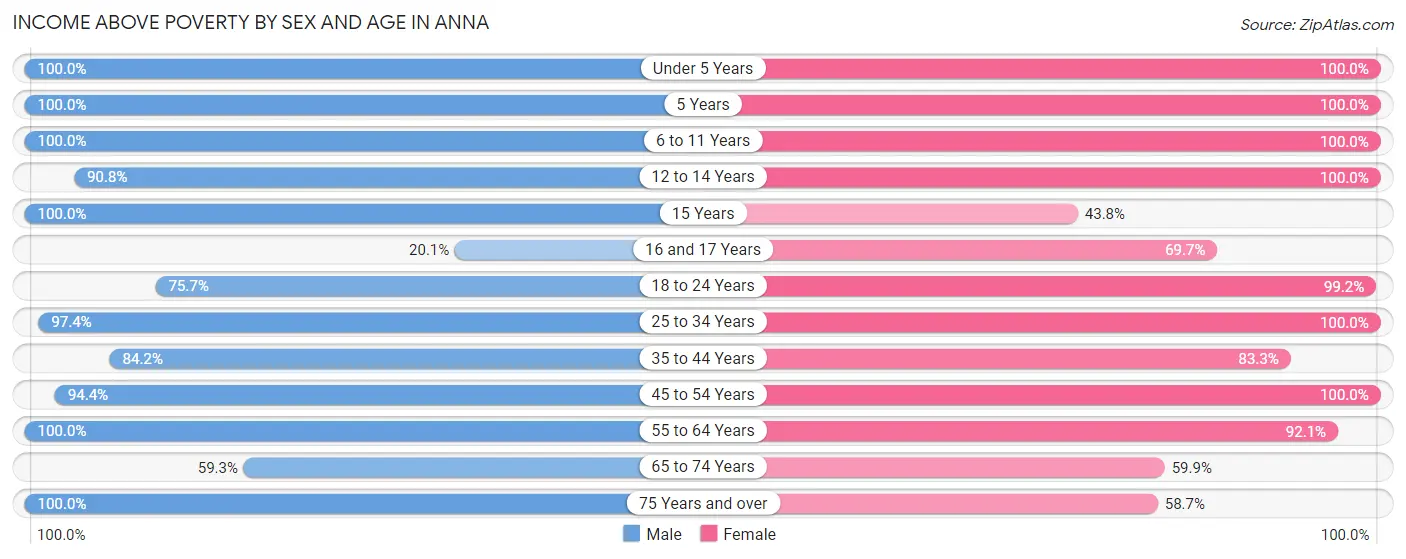
| Age Bracket | Male | Female |
| Under 5 Years | 807 (100.0%) | 652 (100.0%) |
| 5 Years | 93 (100.0%) | 50 (100.0%) |
| 6 to 11 Years | 502 (100.0%) | 991 (100.0%) |
| 12 to 14 Years | 545 (90.8%) | 418 (100.0%) |
| 15 Years | 230 (100.0%) | 39 (43.8%) |
| 16 and 17 Years | 47 (20.1%) | 262 (69.7%) |
| 18 to 24 Years | 816 (75.7%) | 830 (99.2%) |
| 25 to 34 Years | 1,517 (97.4%) | 2,177 (100.0%) |
| 35 to 44 Years | 1,216 (84.2%) | 1,178 (83.3%) |
| 45 to 54 Years | 1,040 (94.4%) | 1,206 (100.0%) |
| 55 to 64 Years | 811 (100.0%) | 872 (92.1%) |
| 65 to 74 Years | 226 (59.3%) | 196 (59.9%) |
| 75 Years and over | 129 (100.0%) | 78 (58.7%) |
| Total | 7,979 (89.0%) | 8,949 (93.0%) |
Income Below Poverty Among Married-Couple Families in Anna
The poverty statistics for married-couple families in Anna show that 8.8% or 373 of the total 4,223 families live below the poverty line. Families with 1 or 2 children have the highest poverty rate of 13.3%, comprising of 236 families. On the other hand, families with 3 or 4 children have the lowest poverty rate of 0.0%, which includes 0 families.
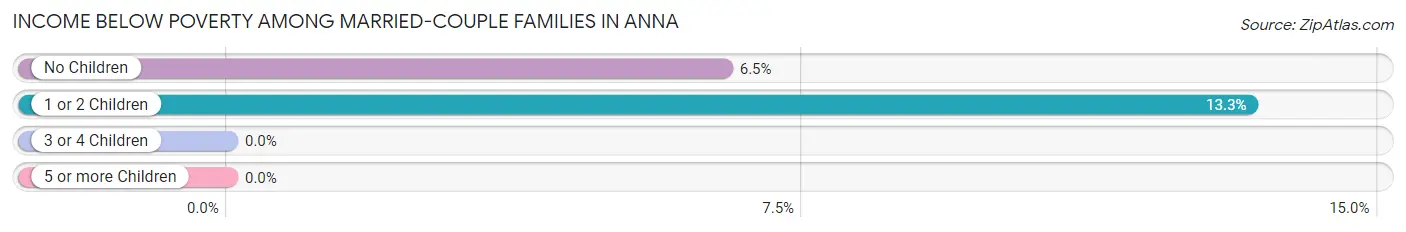
| Children | Above Poverty | Below Poverty |
| No Children | 1,984 (93.5%) | 137 (6.5%) |
| 1 or 2 Children | 1,536 (86.7%) | 236 (13.3%) |
| 3 or 4 Children | 304 (100.0%) | 0 (0.0%) |
| 5 or more Children | 26 (100.0%) | 0 (0.0%) |
| Total | 3,850 (91.2%) | 373 (8.8%) |
Income Below Poverty Among Single-Parent Households in Anna
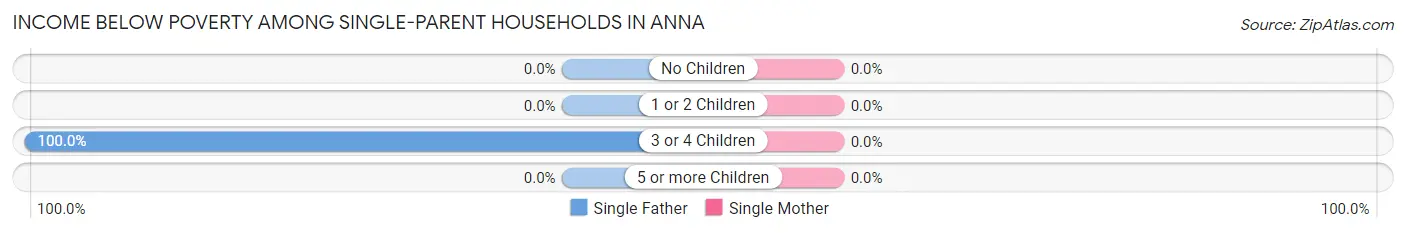
| Children | Single Father | Single Mother |
| No Children | 0 (0.0%) | 0 (0.0%) |
| 1 or 2 Children | 0 (0.0%) | 0 (0.0%) |
| 3 or 4 Children | 62 (100.0%) | 0 (0.0%) |
| 5 or more Children | 0 (0.0%) | 0 (0.0%) |
| Total | 62 (36.3%) | 0 (0.0%) |
Income Below Poverty Among Married-Couple vs Single-Parent Households in Anna
The poverty data for Anna shows that 373 of the married-couple family households (8.8%) and 62 of the single-parent households (6.8%) are living below the poverty level. Within the married-couple family households, those with 1 or 2 children have the highest poverty rate, with 236 households (13.3%) falling below the poverty line. Among the single-parent households, those with 3 or 4 children have the highest poverty rate, with 62 household (100.0%) living below poverty.
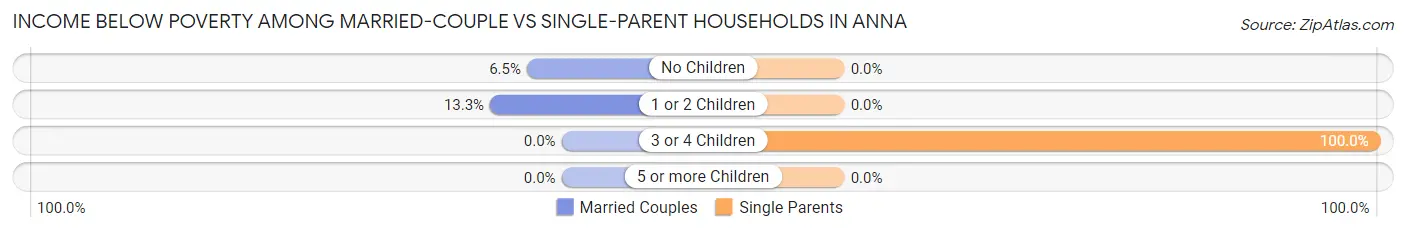
| Children | Married-Couple Families | Single-Parent Households |
| No Children | 137 (6.5%) | 0 (0.0%) |
| 1 or 2 Children | 236 (13.3%) | 0 (0.0%) |
| 3 or 4 Children | 0 (0.0%) | 62 (100.0%) |
| 5 or more Children | 0 (0.0%) | 0 (0.0%) |
| Total | 373 (8.8%) | 62 (6.8%) |
Race in Anna
The most populous races in Anna are White / Caucasian (13,772 | 74.1%), Hispanic or Latino (3,672 | 19.8%), and Black / African American (3,075 | 16.6%).
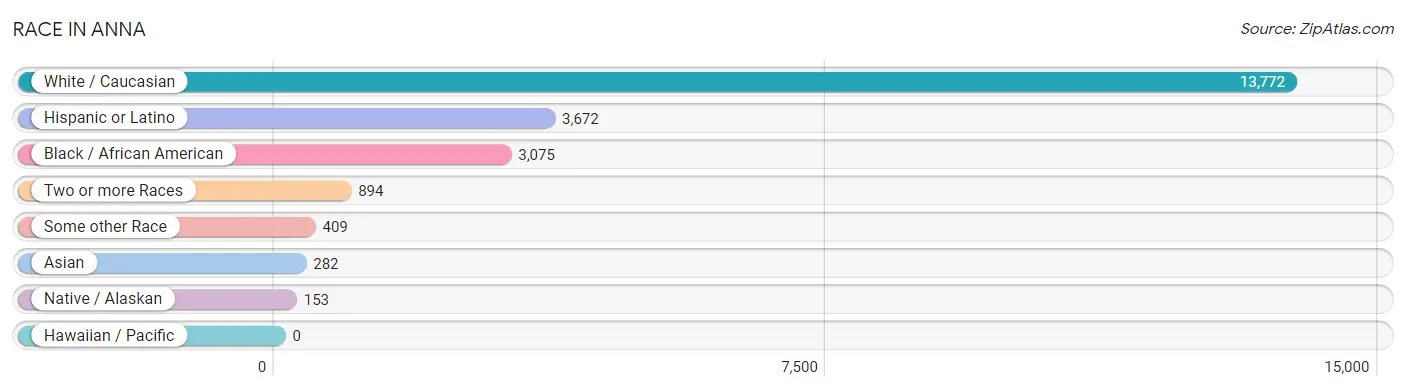
| Race | # Population | % Population |
| Asian | 282 | 1.5% |
| Black / African American | 3,075 | 16.6% |
| Hawaiian / Pacific | 0 | 0.0% |
| Hispanic or Latino | 3,672 | 19.8% |
| Native / Alaskan | 153 | 0.8% |
| White / Caucasian | 13,772 | 74.1% |
| Two or more Races | 894 | 4.8% |
| Some other Race | 409 | 2.2% |
| Total | 18,585 | 100.0% |
Ancestry in Anna
The most populous ancestries reported in Anna are Mexican (3,365 | 18.1%), American (3,158 | 17.0%), Irish (1,352 | 7.3%), English (1,274 | 6.9%), and German (1,166 | 6.3%), together accounting for 55.5% of all Anna residents.
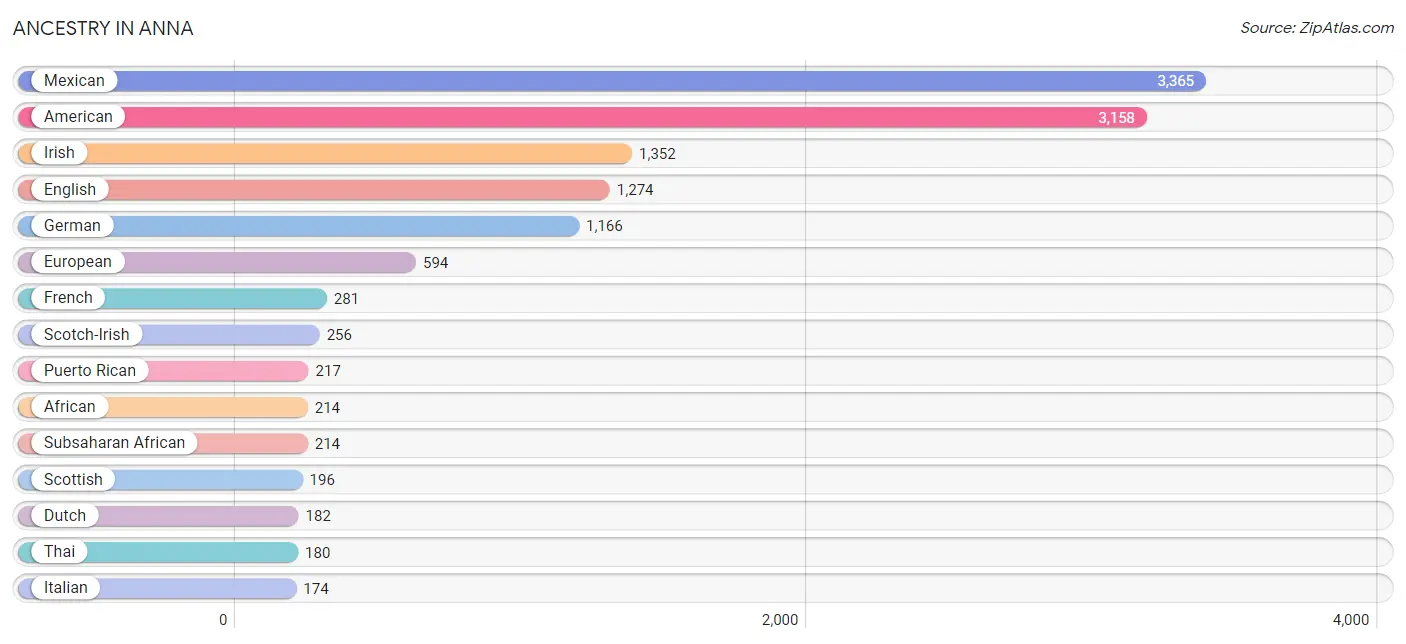
| Ancestry | # Population | % Population |
| African | 214 | 1.1% |
| American | 3,158 | 17.0% |
| Bhutanese | 79 | 0.4% |
| Brazilian | 27 | 0.2% |
| Burmese | 164 | 0.9% |
| Central American | 21 | 0.1% |
| Central American Indian | 16 | 0.1% |
| Cherokee | 52 | 0.3% |
| Choctaw | 24 | 0.1% |
| Croatian | 23 | 0.1% |
| Czech | 17 | 0.1% |
| Czechoslovakian | 32 | 0.2% |
| Danish | 74 | 0.4% |
| Dutch | 182 | 1.0% |
| Dutch West Indian | 48 | 0.3% |
| Eastern European | 47 | 0.3% |
| English | 1,274 | 6.9% |
| European | 594 | 3.2% |
| French | 281 | 1.5% |
| French Canadian | 29 | 0.2% |
| German | 1,166 | 6.3% |
| Greek | 8 | 0.0% |
| Haitian | 62 | 0.3% |
| Indian (Asian) | 29 | 0.2% |
| Irish | 1,352 | 7.3% |
| Italian | 174 | 0.9% |
| Korean | 44 | 0.2% |
| Mexican | 3,365 | 18.1% |
| Mexican American Indian | 125 | 0.7% |
| Navajo | 92 | 0.5% |
| Norwegian | 170 | 0.9% |
| Osage | 37 | 0.2% |
| Polish | 33 | 0.2% |
| Portuguese | 32 | 0.2% |
| Puerto Rican | 217 | 1.2% |
| Russian | 17 | 0.1% |
| Salvadoran | 21 | 0.1% |
| Scotch-Irish | 256 | 1.4% |
| Scottish | 196 | 1.1% |
| Serbian | 23 | 0.1% |
| Spaniard | 51 | 0.3% |
| Subsaharan African | 214 | 1.1% |
| Swedish | 36 | 0.2% |
| Thai | 180 | 1.0% |
| Turkish | 84 | 0.4% |
| Welsh | 144 | 0.8% | View All 46 Rows |
Immigrants in Anna
The most numerous immigrant groups reported in Anna came from Central America (1,508 | 8.1%), Latin America (1,508 | 8.1%), Mexico (1,487 | 8.0%), Asia (152 | 0.8%), and Europe (102 | 0.5%), together accounting for 25.6% of all Anna residents.
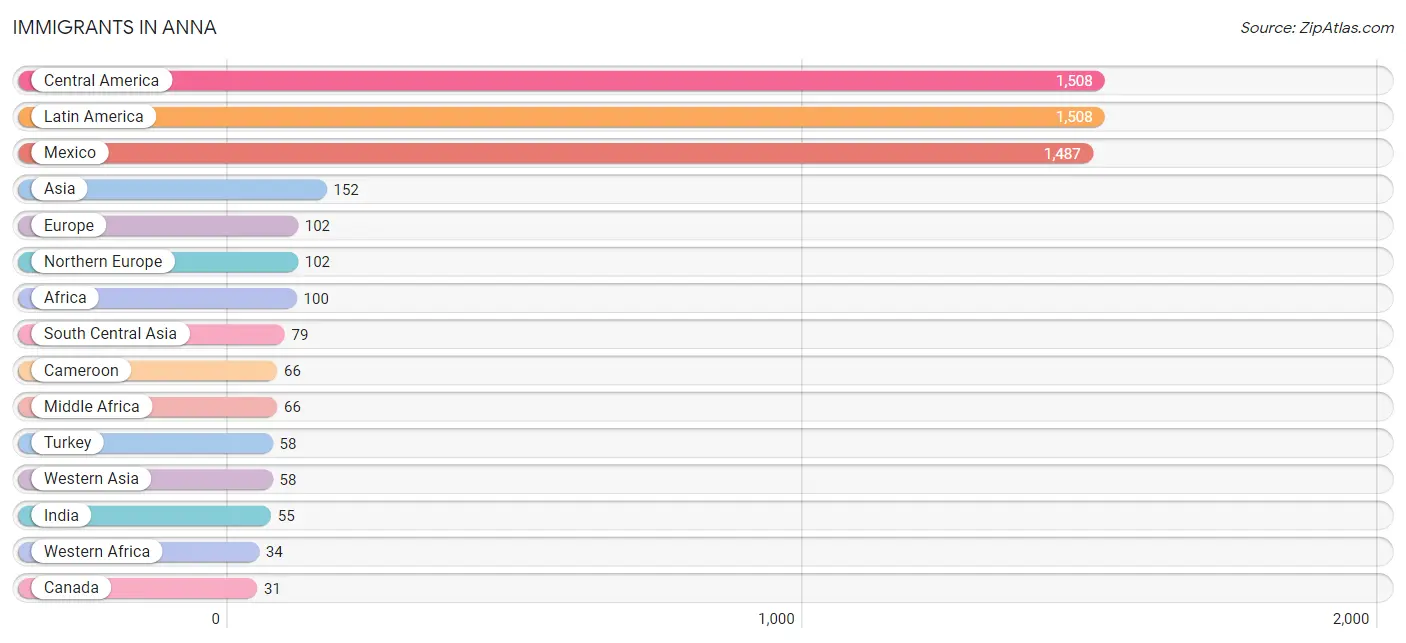
| Immigration Origin | # Population | % Population |
| Africa | 100 | 0.5% |
| Asia | 152 | 0.8% |
| Cameroon | 66 | 0.4% |
| Canada | 31 | 0.2% |
| Central America | 1,508 | 8.1% |
| El Salvador | 21 | 0.1% |
| Europe | 102 | 0.5% |
| India | 55 | 0.3% |
| Latin America | 1,508 | 8.1% |
| Mexico | 1,487 | 8.0% |
| Middle Africa | 66 | 0.4% |
| Nepal | 24 | 0.1% |
| Northern Europe | 102 | 0.5% |
| Philippines | 15 | 0.1% |
| South Central Asia | 79 | 0.4% |
| South Eastern Asia | 15 | 0.1% |
| Turkey | 58 | 0.3% |
| Western Africa | 34 | 0.2% |
| Western Asia | 58 | 0.3% | View All 19 Rows |
Sex and Age in Anna
Sex and Age in Anna
The most populous age groups in Anna are 20 to 24 Years (1,050 | 11.7%) for men and 30 to 34 Years (1,203 | 12.5%) for women.
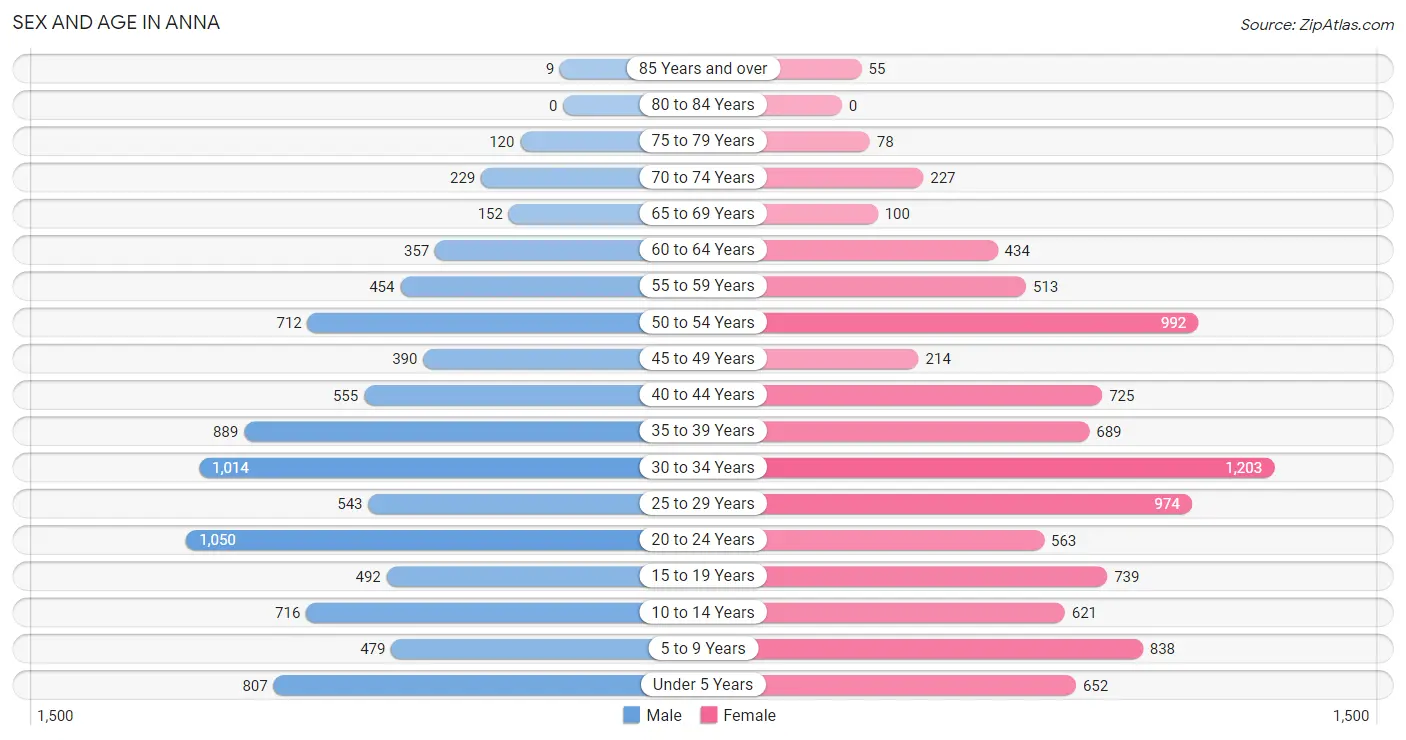
| Age Bracket | Male | Female |
| Under 5 Years | 807 (9.0%) | 652 (6.8%) |
| 5 to 9 Years | 479 (5.3%) | 838 (8.7%) |
| 10 to 14 Years | 716 (8.0%) | 621 (6.5%) |
| 15 to 19 Years | 492 (5.5%) | 739 (7.7%) |
| 20 to 24 Years | 1,050 (11.7%) | 563 (5.9%) |
| 25 to 29 Years | 543 (6.0%) | 974 (10.1%) |
| 30 to 34 Years | 1,014 (11.3%) | 1,203 (12.5%) |
| 35 to 39 Years | 889 (9.9%) | 689 (7.2%) |
| 40 to 44 Years | 555 (6.2%) | 725 (7.5%) |
| 45 to 49 Years | 390 (4.3%) | 214 (2.2%) |
| 50 to 54 Years | 712 (7.9%) | 992 (10.3%) |
| 55 to 59 Years | 454 (5.1%) | 513 (5.3%) |
| 60 to 64 Years | 357 (4.0%) | 434 (4.5%) |
| 65 to 69 Years | 152 (1.7%) | 100 (1.0%) |
| 70 to 74 Years | 229 (2.5%) | 227 (2.4%) |
| 75 to 79 Years | 120 (1.3%) | 78 (0.8%) |
| 80 to 84 Years | 0 (0.0%) | 0 (0.0%) |
| 85 Years and over | 9 (0.1%) | 55 (0.6%) |
| Total | 8,968 (100.0%) | 9,617 (100.0%) |
Families and Households in Anna
Median Family Size in Anna
The median family size in Anna is 3.33 persons per family, with single female/mother families (739 | 14.4%) accounting for the largest median family size of 3.62 persons per family. On the other hand, single male/father families (171 | 3.3%) represent the smallest median family size with 3.05 persons per family.
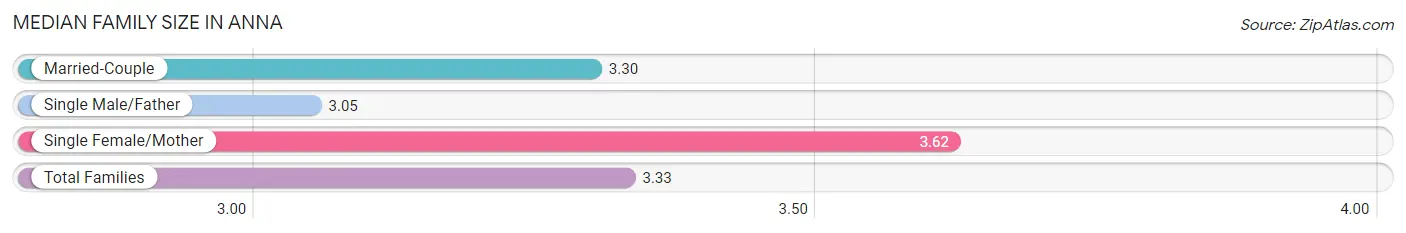
| Family Type | # Families | Family Size |
| Married-Couple | 4,223 (82.3%) | 3.30 |
| Single Male/Father | 171 (3.3%) | 3.05 |
| Single Female/Mother | 739 (14.4%) | 3.62 |
| Total Families | 5,133 (100.0%) | 3.33 |
Median Household Size in Anna
The median household size in Anna is 3.02 persons per household, with single female/mother households (739 | 12.0%) accounting for the largest median household size of 3.85 persons per household. non-family households (1,028 | 16.7%) represent the smallest median household size with 1.22 persons per household.
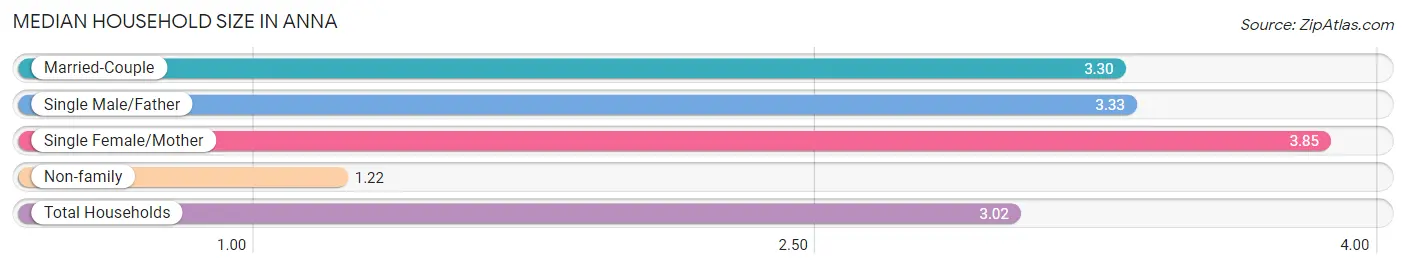
| Household Type | # Households | Household Size |
| Married-Couple | 4,223 (68.5%) | 3.30 |
| Single Male/Father | 171 (2.8%) | 3.33 |
| Single Female/Mother | 739 (12.0%) | 3.85 |
| Non-family | 1,028 (16.7%) | 1.22 |
| Total Households | 6,161 (100.0%) | 3.02 |
Household Size by Marriage Status in Anna
Out of a total of 6,161 households in Anna, 5,133 (83.3%) are family households, while 1,028 (16.7%) are nonfamily households. The most numerous type of family households are 2-person households, comprising 1,914, and the most common type of nonfamily households are 1-person households, comprising 834.
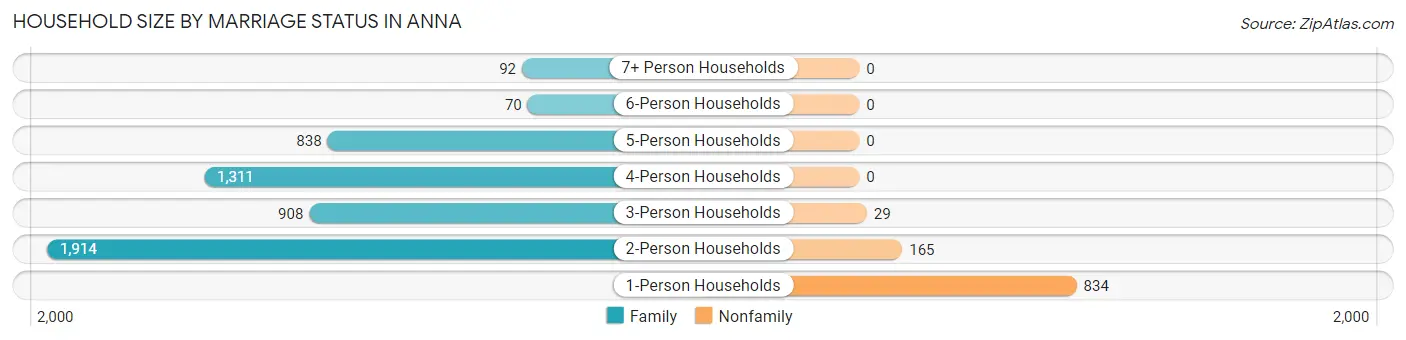
| Household Size | Family Households | Nonfamily Households |
| 1-Person Households | - | 834 (13.5%) |
| 2-Person Households | 1,914 (31.1%) | 165 (2.7%) |
| 3-Person Households | 908 (14.7%) | 29 (0.5%) |
| 4-Person Households | 1,311 (21.3%) | 0 (0.0%) |
| 5-Person Households | 838 (13.6%) | 0 (0.0%) |
| 6-Person Households | 70 (1.1%) | 0 (0.0%) |
| 7+ Person Households | 92 (1.5%) | 0 (0.0%) |
| Total | 5,133 (83.3%) | 1,028 (16.7%) |
Female Fertility in Anna
Fertility by Age in Anna
Average fertility rate in Anna is 38.0 births per 1,000 women. Women in the age bracket of 35 to 50 years have the highest fertility rate with 57.0 births per 1,000 women. Women in the age bracket of 35 to 50 years acount for 50.7% of all women with births.
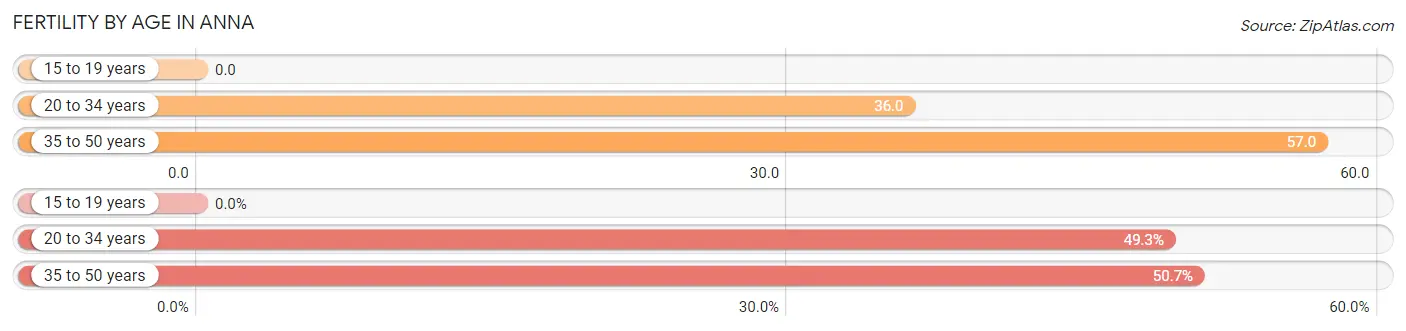
| Age Bracket | Women with Births | Births / 1,000 Women |
| 15 to 19 years | 0 (0.0%) | 0.0 |
| 20 to 34 years | 100 (49.3%) | 36.0 |
| 35 to 50 years | 103 (50.7%) | 57.0 |
| Total | 203 (100.0%) | 38.0 |
Fertility by Age by Marriage Status in Anna
67.5% of women with births (203) in Anna are married. The highest percentage of unmarried women with births falls into 20 to 34 years age bracket with 66.0% of them unmarried at the time of birth, while the lowest percentage of unmarried women with births belong to 35 to 50 years age bracket with 0.0% of them unmarried.
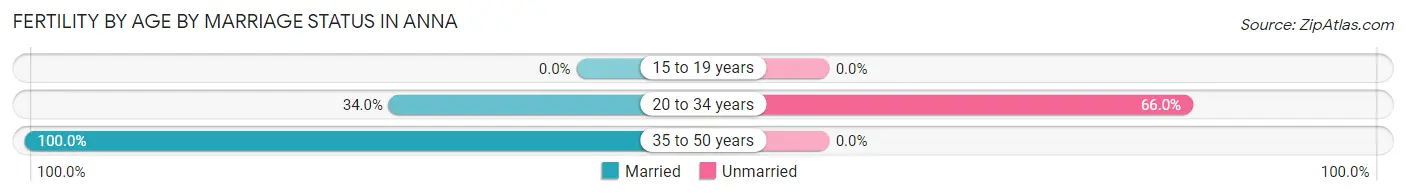
| Age Bracket | Married | Unmarried |
| 15 to 19 years | 0 (0.0%) | 0 (0.0%) |
| 20 to 34 years | 34 (34.0%) | 66 (66.0%) |
| 35 to 50 years | 103 (100.0%) | 0 (0.0%) |
| Total | 137 (67.5%) | 66 (32.5%) |
Fertility by Education in Anna
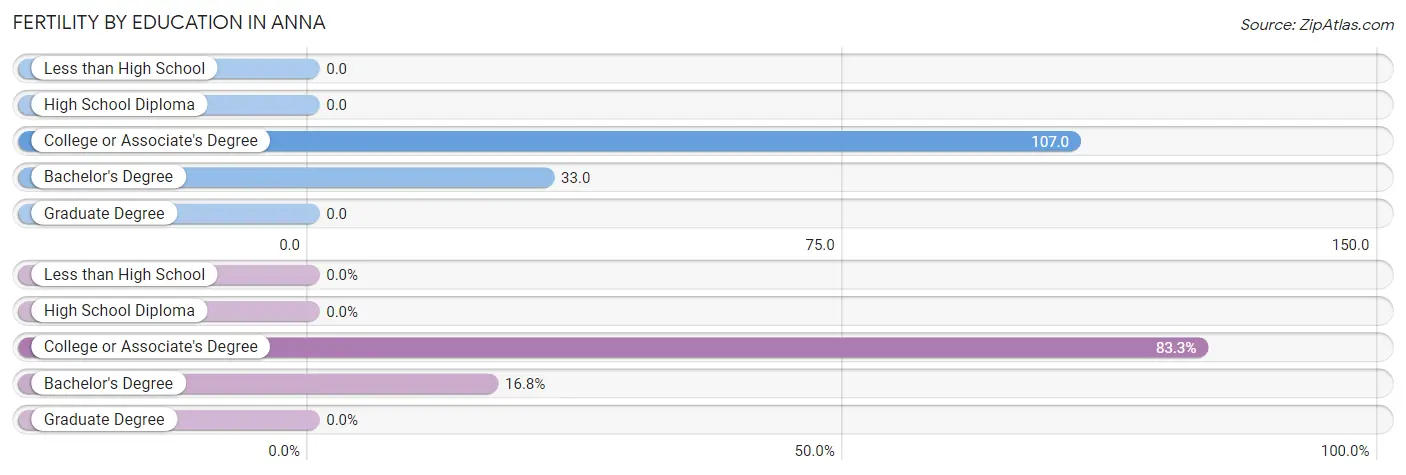
| Educational Attainment | Women with Births | Births / 1,000 Women |
| Less than High School | 0 (0.0%) | 0.0 |
| High School Diploma | 0 (0.0%) | 0.0 |
| College or Associate's Degree | 169 (83.3%) | 107.0 |
| Bachelor's Degree | 34 (16.8%) | 33.0 |
| Graduate Degree | 0 (0.0%) | 0.0 |
| Total | 203 (100.0%) | 38.0 |
Fertility by Education by Marriage Status in Anna
32.5% of women with births in Anna are unmarried. Women with the educational attainment of bachelor's degree are most likely to be married with 100.0% of them married at childbirth, while women with the educational attainment of college or associate's degree are least likely to be married with 39.1% of them unmarried at childbirth.
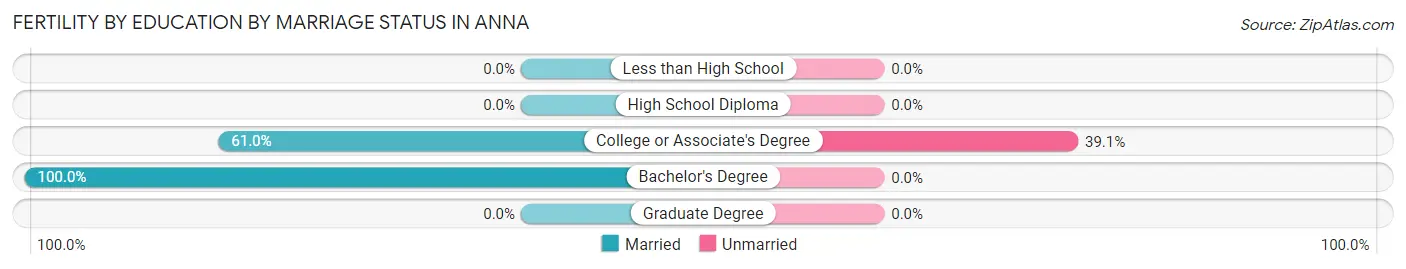
| Educational Attainment | Married | Unmarried |
| Less than High School | 0 (0.0%) | 0 (0.0%) |
| High School Diploma | 0 (0.0%) | 0 (0.0%) |
| College or Associate's Degree | 103 (61.0%) | 66 (39.1%) |
| Bachelor's Degree | 34 (100.0%) | 0 (0.0%) |
| Graduate Degree | 0 (0.0%) | 0 (0.0%) |
| Total | 137 (67.5%) | 66 (32.5%) |
Employment Characteristics in Anna
Employment by Class of Employer in Anna
Among the 9,651 employed individuals in Anna, private company employees (7,152 | 74.1%), local government employees (1,112 | 11.5%), and state government employees (477 | 4.9%) make up the most common classes of employment.
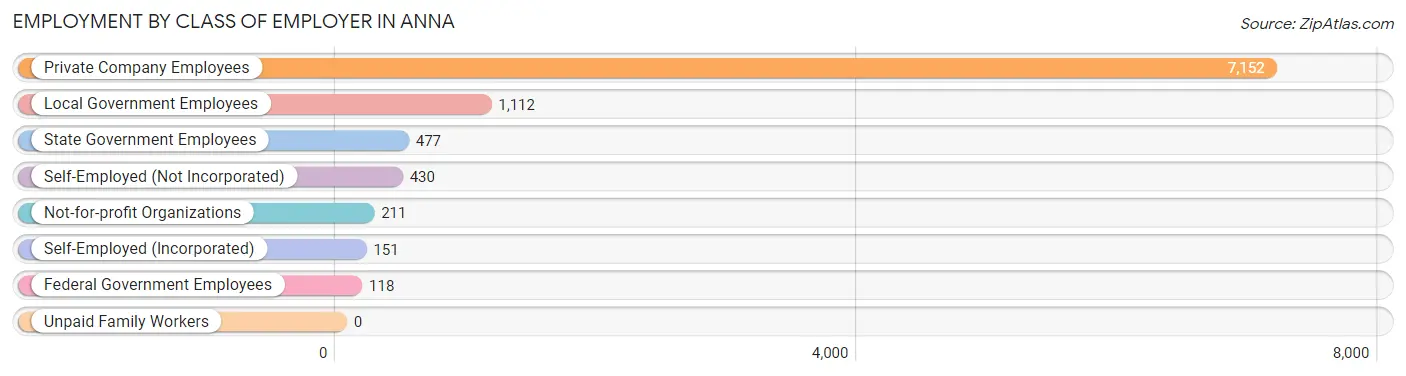
| Employer Class | # Employees | % Employees |
| Private Company Employees | 7,152 | 74.1% |
| Self-Employed (Incorporated) | 151 | 1.6% |
| Self-Employed (Not Incorporated) | 430 | 4.5% |
| Not-for-profit Organizations | 211 | 2.2% |
| Local Government Employees | 1,112 | 11.5% |
| State Government Employees | 477 | 4.9% |
| Federal Government Employees | 118 | 1.2% |
| Unpaid Family Workers | 0 | 0.0% |
| Total | 9,651 | 100.0% |
Employment Status by Age in Anna
According to the labor force statistics for Anna, out of the total population over 16 years of age (14,153), 71.0% or 10,049 individuals are in the labor force, with 3.4% or 342 of them unemployed. The age group with the highest labor force participation rate is 55 to 59 years, with 86.0% or 832 individuals in the labor force. Within the labor force, the 65 to 74 years age range has the highest percentage of unemployed individuals, with 44.6% or 74 of them being unemployed.
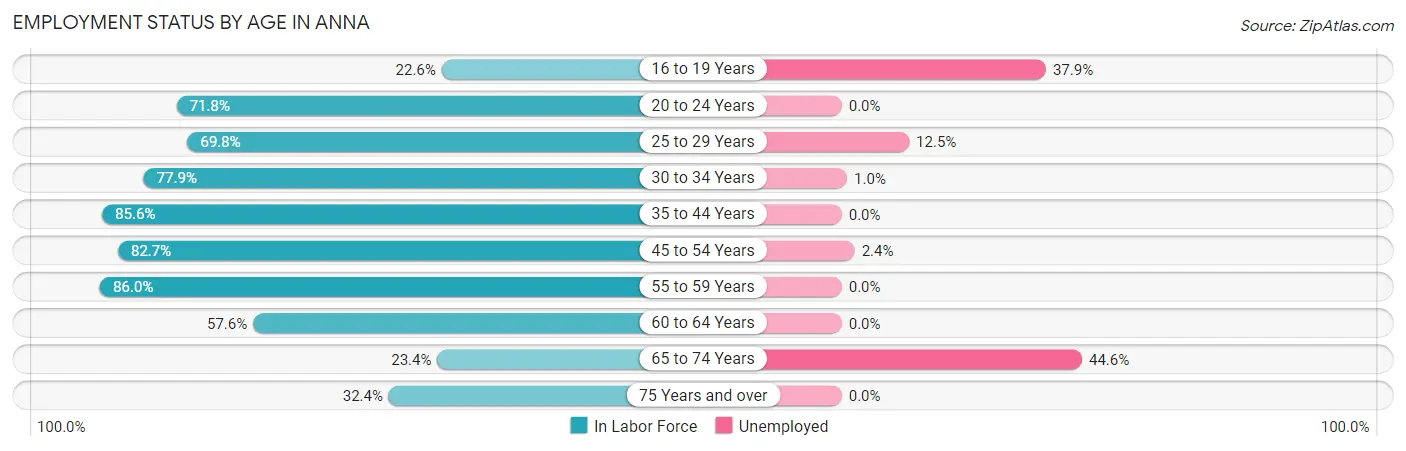
| Age Bracket | In Labor Force | Unemployed |
| 16 to 19 Years | 206 (22.6%) | 78 (37.9%) |
| 20 to 24 Years | 1,158 (71.8%) | 0 (0.0%) |
| 25 to 29 Years | 1,059 (69.8%) | 132 (12.5%) |
| 30 to 34 Years | 1,727 (77.9%) | 17 (1.0%) |
| 35 to 44 Years | 2,446 (85.6%) | 0 (0.0%) |
| 45 to 54 Years | 1,909 (82.7%) | 46 (2.4%) |
| 55 to 59 Years | 832 (86.0%) | 0 (0.0%) |
| 60 to 64 Years | 456 (57.6%) | 0 (0.0%) |
| 65 to 74 Years | 166 (23.4%) | 74 (44.6%) |
| 75 Years and over | 85 (32.4%) | 0 (0.0%) |
| Total | 10,049 (71.0%) | 342 (3.4%) |
Employment Status by Educational Attainment in Anna
According to labor force statistics for Anna, 79.1% of individuals (8,430) out of the total population between 25 and 64 years of age (10,658) are in the labor force, with 2.3% or 194 of them being unemployed. The group with the highest labor force participation rate are those with the educational attainment of college / associate degree, with 87.8% or 2,613 individuals in the labor force. Within the labor force, individuals with less than high school education have the highest percentage of unemployment, with 8.1% or 51 of them being unemployed.
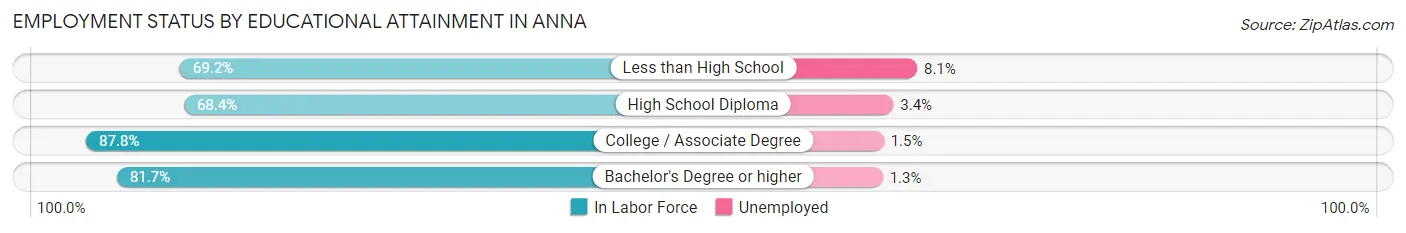
| Educational Attainment | In Labor Force | Unemployed |
| Less than High School | 632 (69.2%) | 74 (8.1%) |
| High School Diploma | 1,778 (68.4%) | 88 (3.4%) |
| College / Associate Degree | 2,613 (87.8%) | 45 (1.5%) |
| Bachelor's Degree or higher | 3,407 (81.7%) | 54 (1.3%) |
| Total | 8,430 (79.1%) | 245 (2.3%) |
Employment Occupations by Sex in Anna
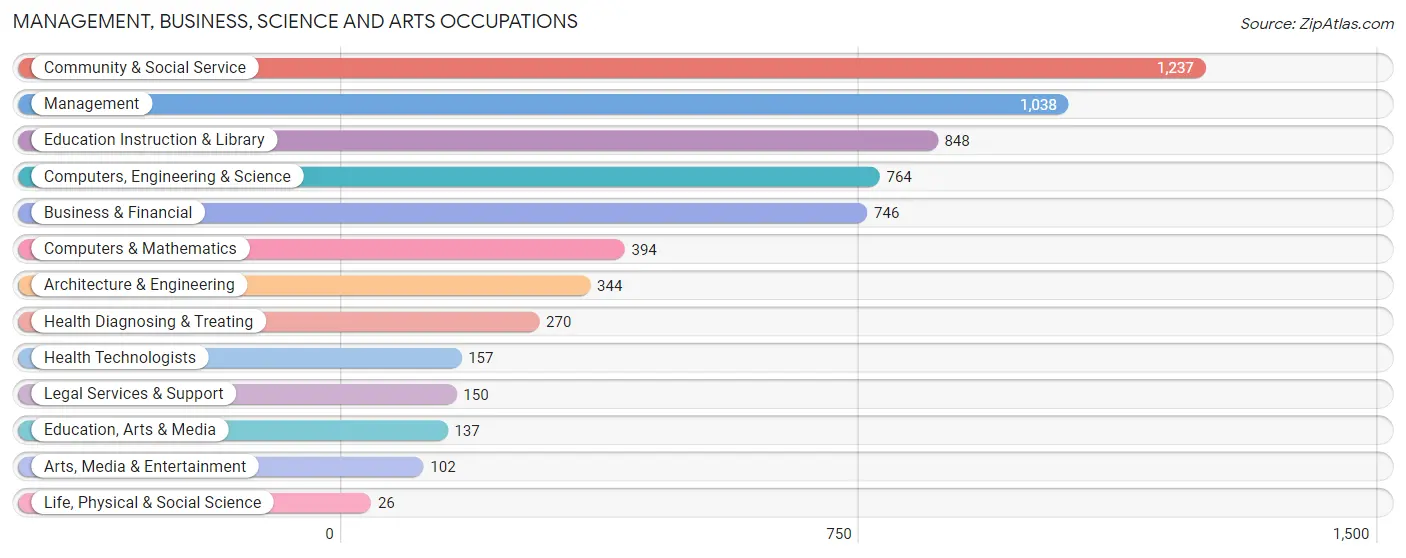
Management, Business, Science and Arts Occupations
The most common Management, Business, Science and Arts occupations in Anna are Community & Social Service (1,237 | 12.8%), Management (1,038 | 10.7%), Education Instruction & Library (848 | 8.7%), Computers, Engineering & Science (764 | 7.9%), and Business & Financial (746 | 7.7%).
Management, Business, Science and Arts Occupations by Sex
Within the Management, Business, Science and Arts occupations in Anna, the most male-oriented occupations are Architecture & Engineering (95.1%), Computers, Engineering & Science (83.5%), and Computers & Mathematics (78.9%), while the most female-oriented occupations are Life, Physical & Social Science (100.0%), Education, Arts & Media (100.0%), and Arts, Media & Entertainment (81.4%).
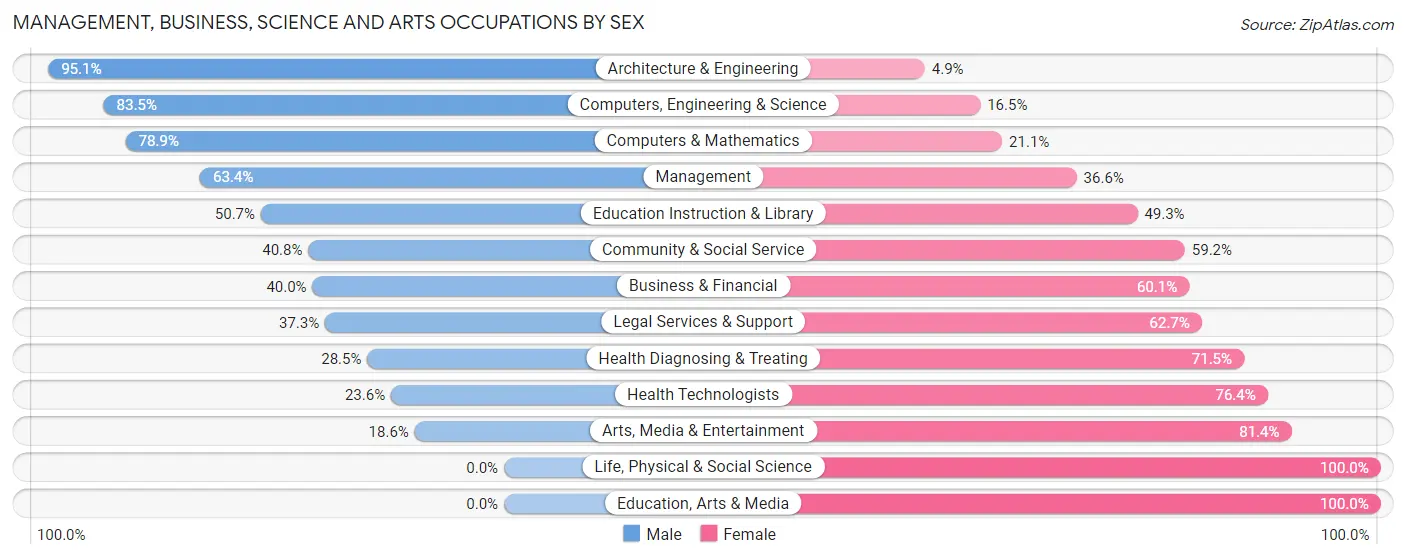
| Occupation | Male | Female |
| Management | 658 (63.4%) | 380 (36.6%) |
| Business & Financial | 298 (40.0%) | 448 (60.1%) |
| Computers, Engineering & Science | 638 (83.5%) | 126 (16.5%) |
| Computers & Mathematics | 311 (78.9%) | 83 (21.1%) |
| Architecture & Engineering | 327 (95.1%) | 17 (4.9%) |
| Life, Physical & Social Science | 0 (0.0%) | 26 (100.0%) |
| Community & Social Service | 505 (40.8%) | 732 (59.2%) |
| Education, Arts & Media | 0 (0.0%) | 137 (100.0%) |
| Legal Services & Support | 56 (37.3%) | 94 (62.7%) |
| Education Instruction & Library | 430 (50.7%) | 418 (49.3%) |
| Arts, Media & Entertainment | 19 (18.6%) | 83 (81.4%) |
| Health Diagnosing & Treating | 77 (28.5%) | 193 (71.5%) |
| Health Technologists | 37 (23.6%) | 120 (76.4%) |
| Total (Category) | 2,176 (53.7%) | 1,879 (46.3%) |
| Total (Overall) | 4,966 (51.2%) | 4,733 (48.8%) |
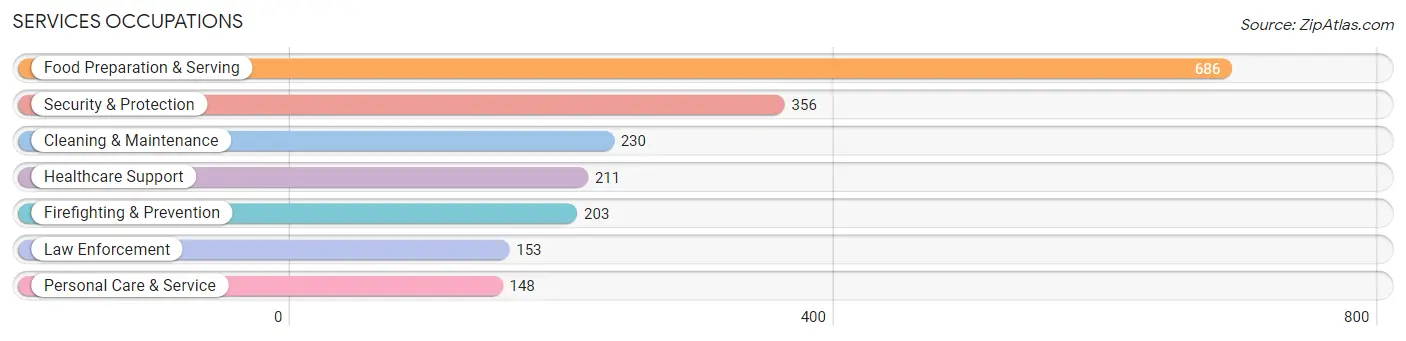
Services Occupations
The most common Services occupations in Anna are Food Preparation & Serving (686 | 7.1%), Security & Protection (356 | 3.7%), Cleaning & Maintenance (230 | 2.4%), Healthcare Support (211 | 2.2%), and Firefighting & Prevention (203 | 2.1%).
Services Occupations by Sex
Within the Services occupations in Anna, the most male-oriented occupations are Law Enforcement (38.6%), Cleaning & Maintenance (33.5%), and Security & Protection (30.9%), while the most female-oriented occupations are Personal Care & Service (100.0%), Food Preparation & Serving (84.6%), and Healthcare Support (82.0%).
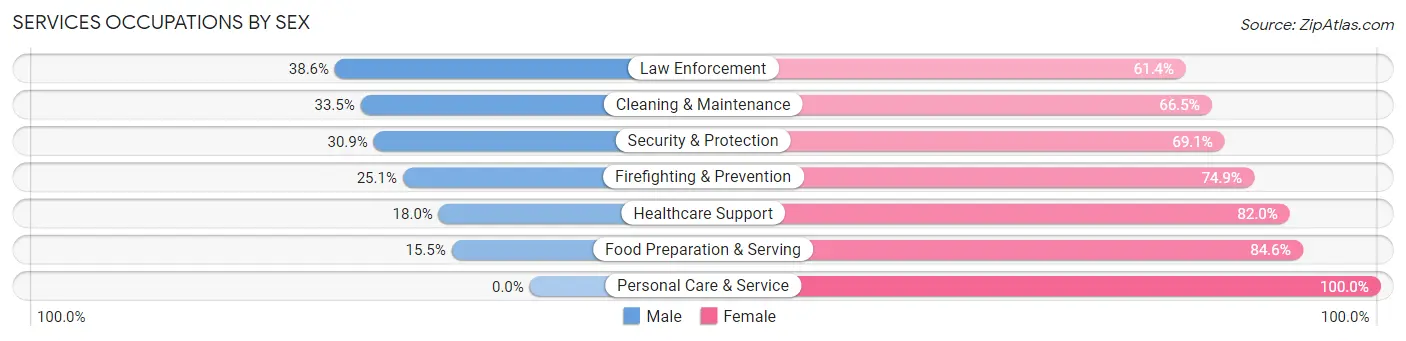
| Occupation | Male | Female |
| Healthcare Support | 38 (18.0%) | 173 (82.0%) |
| Security & Protection | 110 (30.9%) | 246 (69.1%) |
| Firefighting & Prevention | 51 (25.1%) | 152 (74.9%) |
| Law Enforcement | 59 (38.6%) | 94 (61.4%) |
| Food Preparation & Serving | 106 (15.4%) | 580 (84.6%) |
| Cleaning & Maintenance | 77 (33.5%) | 153 (66.5%) |
| Personal Care & Service | 0 (0.0%) | 148 (100.0%) |
| Total (Category) | 331 (20.3%) | 1,300 (79.7%) |
| Total (Overall) | 4,966 (51.2%) | 4,733 (48.8%) |
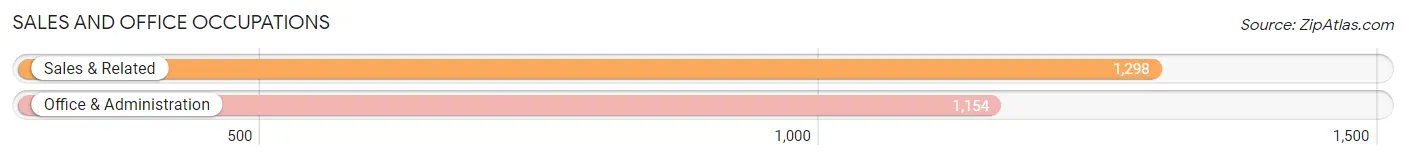
Sales and Office Occupations
The most common Sales and Office occupations in Anna are Sales & Related (1,298 | 13.4%), and Office & Administration (1,154 | 11.9%).
Sales and Office Occupations by Sex
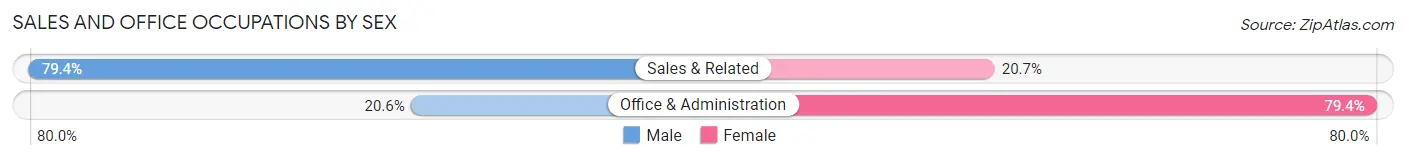
| Occupation | Male | Female |
| Sales & Related | 1,030 (79.3%) | 268 (20.6%) |
| Office & Administration | 238 (20.6%) | 916 (79.4%) |
| Total (Category) | 1,268 (51.7%) | 1,184 (48.3%) |
| Total (Overall) | 4,966 (51.2%) | 4,733 (48.8%) |
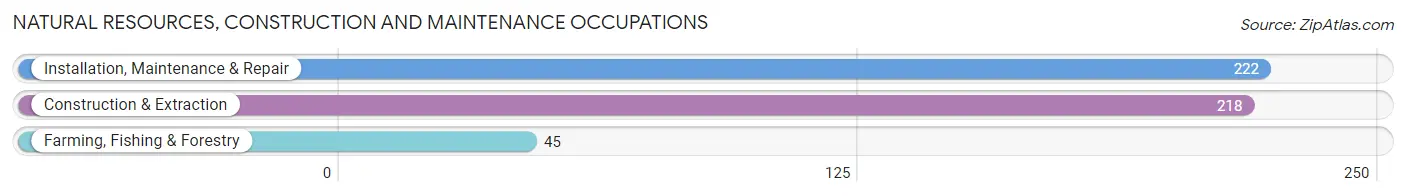
Natural Resources, Construction and Maintenance Occupations
The most common Natural Resources, Construction and Maintenance occupations in Anna are Installation, Maintenance & Repair (222 | 2.3%), Construction & Extraction (218 | 2.2%), and Farming, Fishing & Forestry (45 | 0.5%).
Natural Resources, Construction and Maintenance Occupations by Sex
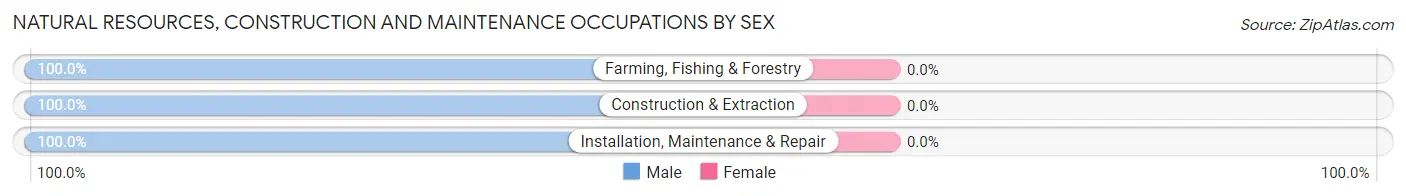
| Occupation | Male | Female |
| Farming, Fishing & Forestry | 45 (100.0%) | 0 (0.0%) |
| Construction & Extraction | 218 (100.0%) | 0 (0.0%) |
| Installation, Maintenance & Repair | 222 (100.0%) | 0 (0.0%) |
| Total (Category) | 485 (100.0%) | 0 (0.0%) |
| Total (Overall) | 4,966 (51.2%) | 4,733 (48.8%) |
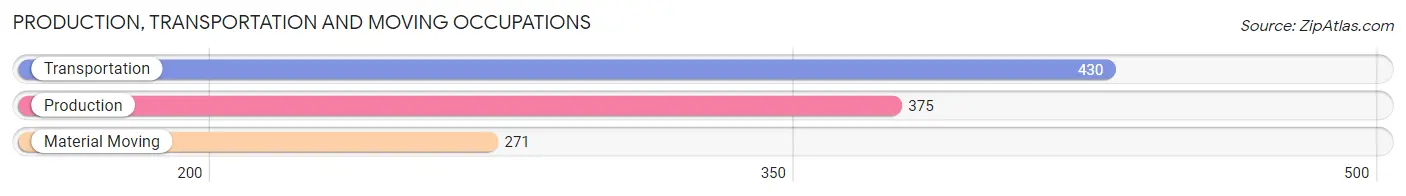
Production, Transportation and Moving Occupations
The most common Production, Transportation and Moving occupations in Anna are Transportation (430 | 4.4%), Production (375 | 3.9%), and Material Moving (271 | 2.8%).
Production, Transportation and Moving Occupations by Sex
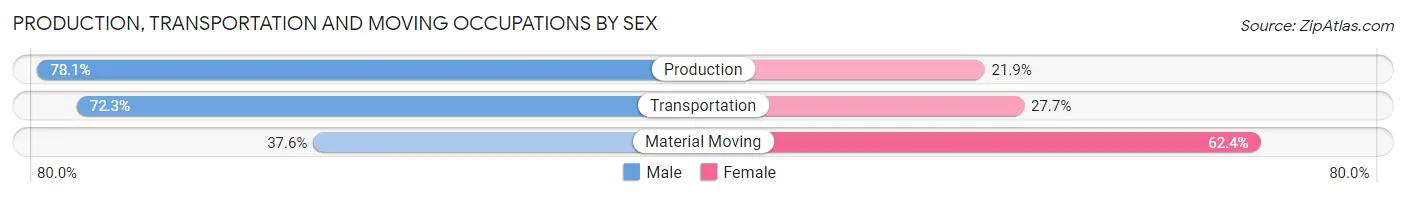
| Occupation | Male | Female |
| Production | 293 (78.1%) | 82 (21.9%) |
| Transportation | 311 (72.3%) | 119 (27.7%) |
| Material Moving | 102 (37.6%) | 169 (62.4%) |
| Total (Category) | 706 (65.6%) | 370 (34.4%) |
| Total (Overall) | 4,966 (51.2%) | 4,733 (48.8%) |
Employment Industries by Sex in Anna
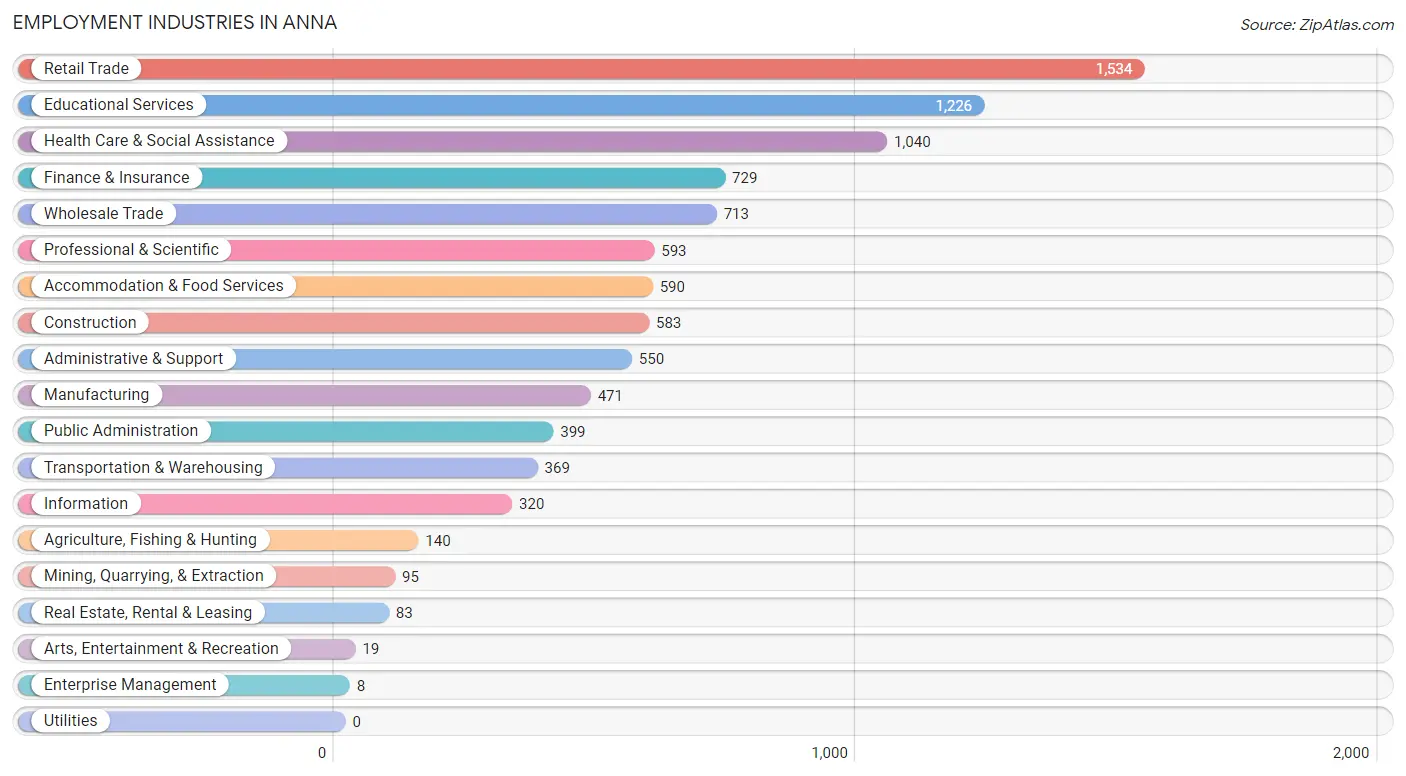
Employment Industries in Anna
The major employment industries in Anna include Retail Trade (1,534 | 15.8%), Educational Services (1,226 | 12.6%), Health Care & Social Assistance (1,040 | 10.7%), Finance & Insurance (729 | 7.5%), and Wholesale Trade (713 | 7.3%).
Employment Industries by Sex in Anna
The Anna industries that see more men than women are Agriculture, Fishing & Hunting (100.0%), Mining, Quarrying, & Extraction (100.0%), and Arts, Entertainment & Recreation (100.0%), whereas the industries that tend to have a higher number of women are Real Estate, Rental & Leasing (100.0%), Enterprise Management (100.0%), and Accommodation & Food Services (79.1%).
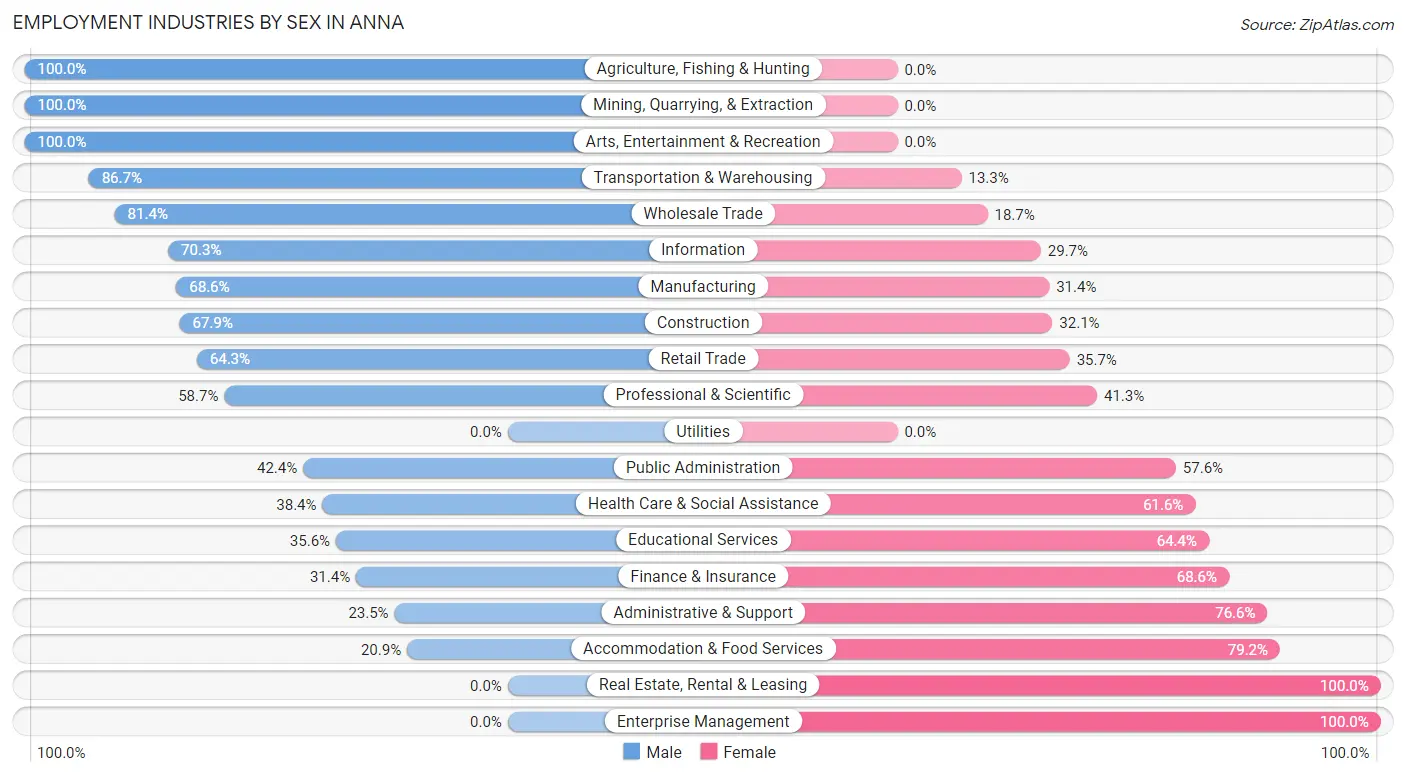
| Industry | Male | Female |
| Agriculture, Fishing & Hunting | 140 (100.0%) | 0 (0.0%) |
| Mining, Quarrying, & Extraction | 95 (100.0%) | 0 (0.0%) |
| Construction | 396 (67.9%) | 187 (32.1%) |
| Manufacturing | 323 (68.6%) | 148 (31.4%) |
| Wholesale Trade | 580 (81.4%) | 133 (18.6%) |
| Retail Trade | 987 (64.3%) | 547 (35.7%) |
| Transportation & Warehousing | 320 (86.7%) | 49 (13.3%) |
| Utilities | 0 (0.0%) | 0 (0.0%) |
| Information | 225 (70.3%) | 95 (29.7%) |
| Finance & Insurance | 229 (31.4%) | 500 (68.6%) |
| Real Estate, Rental & Leasing | 0 (0.0%) | 83 (100.0%) |
| Professional & Scientific | 348 (58.7%) | 245 (41.3%) |
| Enterprise Management | 0 (0.0%) | 8 (100.0%) |
| Administrative & Support | 129 (23.4%) | 421 (76.5%) |
| Educational Services | 436 (35.6%) | 790 (64.4%) |
| Health Care & Social Assistance | 399 (38.4%) | 641 (61.6%) |
| Arts, Entertainment & Recreation | 19 (100.0%) | 0 (0.0%) |
| Accommodation & Food Services | 123 (20.8%) | 467 (79.1%) |
| Public Administration | 169 (42.4%) | 230 (57.6%) |
| Total | 4,966 (51.2%) | 4,733 (48.8%) |
Education in Anna
School Enrollment in Anna
The most common levels of schooling among the 4,878 students in Anna are high school (1,409 | 28.9%), elementary school (1,234 | 25.3%), and middle school (1,058 | 21.7%).
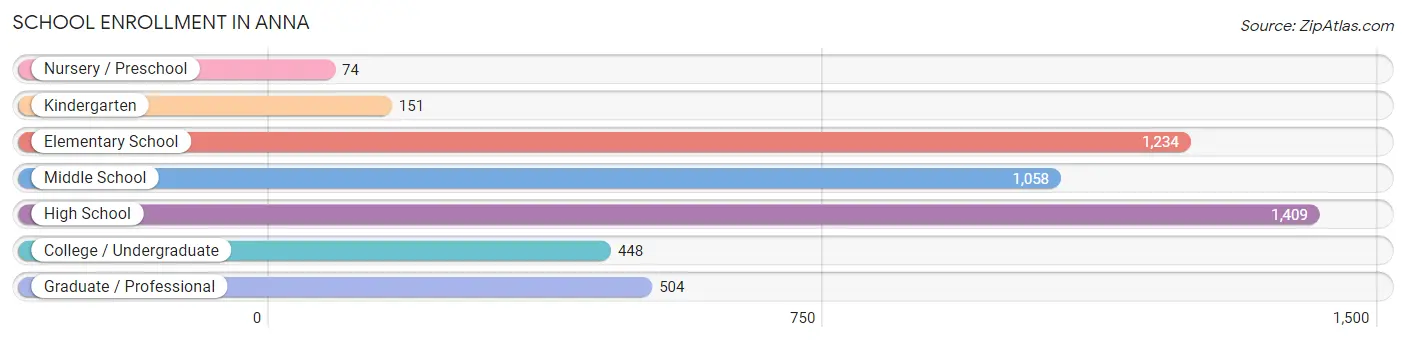
| School Level | # Students | % Students |
| Nursery / Preschool | 74 | 1.5% |
| Kindergarten | 151 | 3.1% |
| Elementary School | 1,234 | 25.3% |
| Middle School | 1,058 | 21.7% |
| High School | 1,409 | 28.9% |
| College / Undergraduate | 448 | 9.2% |
| Graduate / Professional | 504 | 10.3% |
| Total | 4,878 | 100.0% |
School Enrollment by Age by Funding Source in Anna
Out of a total of 4,878 students who are enrolled in schools in Anna, 395 (8.1%) attend a private institution, while the remaining 4,483 (91.9%) are enrolled in public schools. The age group of 3 to 4 year olds has the highest likelihood of being enrolled in private schools, with 50 (100.0% in the age bracket) enrolled. Conversely, the age group of 15 to 17 year olds has the lowest likelihood of being enrolled in a private school, with 918 (98.8% in the age bracket) attending a public institution.
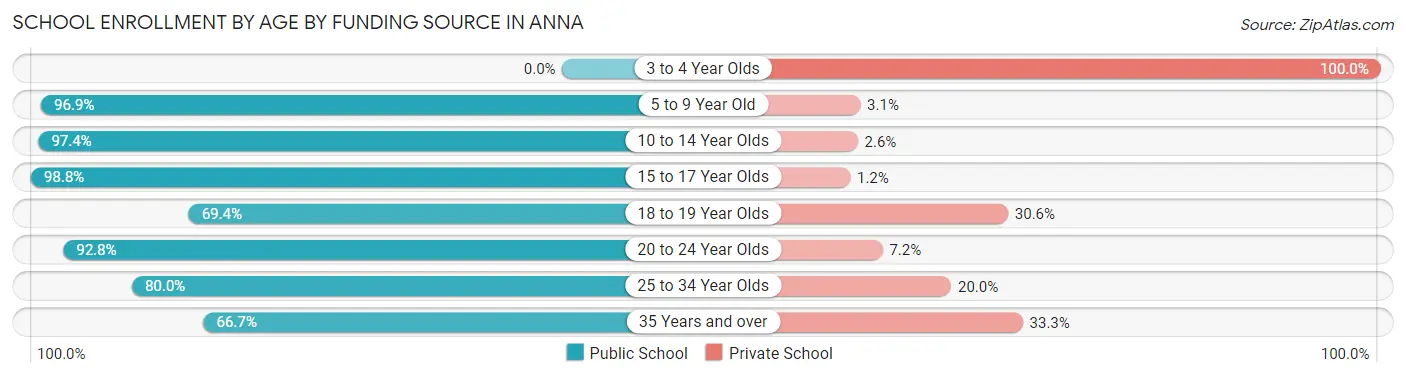
| Age Bracket | Public School | Private School |
| 3 to 4 Year Olds | 0 (0.0%) | 50 (100.0%) |
| 5 to 9 Year Old | 1,262 (96.9%) | 40 (3.1%) |
| 10 to 14 Year Olds | 1,281 (97.4%) | 34 (2.6%) |
| 15 to 17 Year Olds | 918 (98.8%) | 11 (1.2%) |
| 18 to 19 Year Olds | 168 (69.4%) | 74 (30.6%) |
| 20 to 24 Year Olds | 347 (92.8%) | 27 (7.2%) |
| 25 to 34 Year Olds | 384 (80.0%) | 96 (20.0%) |
| 35 Years and over | 124 (66.7%) | 62 (33.3%) |
| Total | 4,483 (91.9%) | 395 (8.1%) |
Educational Attainment by Field of Study in Anna
Business (1,324 | 28.1%), education (1,024 | 21.8%), science & technology (679 | 14.4%), arts & humanities (318 | 6.8%), and psychology (268 | 5.7%) are the most common fields of study among 4,705 individuals in Anna who have obtained a bachelor's degree or higher.
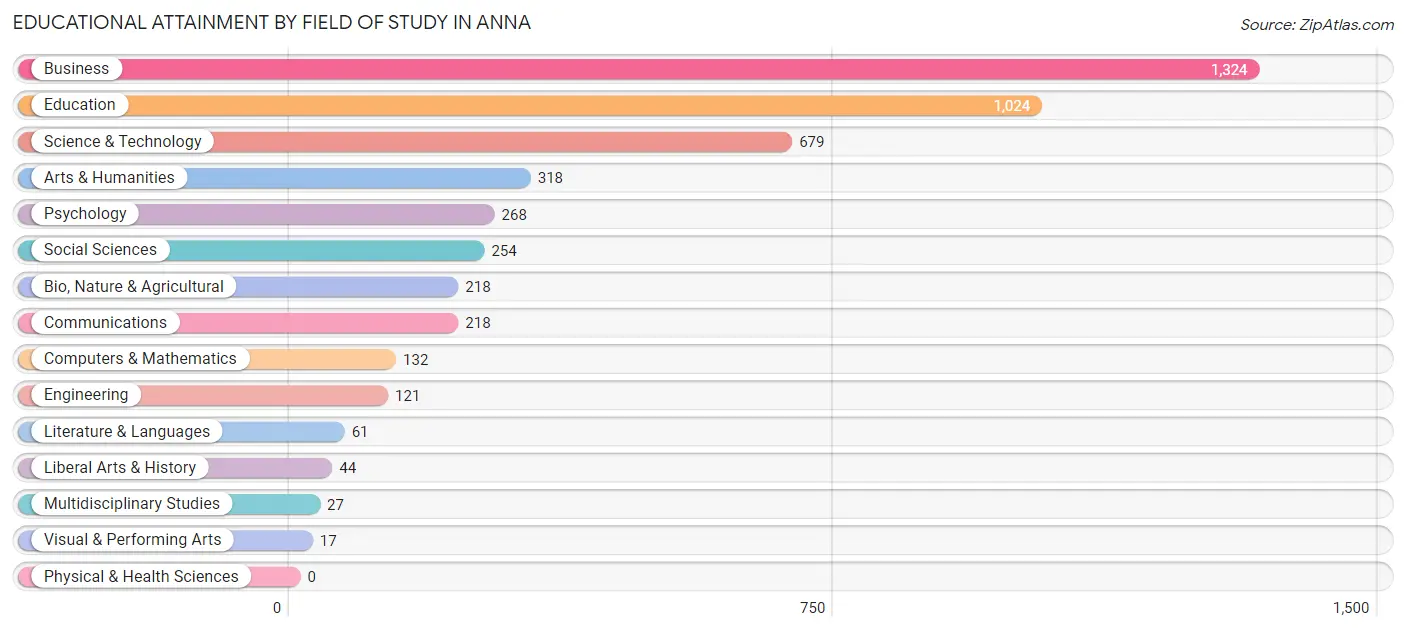
| Field of Study | # Graduates | % Graduates |
| Computers & Mathematics | 132 | 2.8% |
| Bio, Nature & Agricultural | 218 | 4.6% |
| Physical & Health Sciences | 0 | 0.0% |
| Psychology | 268 | 5.7% |
| Social Sciences | 254 | 5.4% |
| Engineering | 121 | 2.6% |
| Multidisciplinary Studies | 27 | 0.6% |
| Science & Technology | 679 | 14.4% |
| Business | 1,324 | 28.1% |
| Education | 1,024 | 21.8% |
| Literature & Languages | 61 | 1.3% |
| Liberal Arts & History | 44 | 0.9% |
| Visual & Performing Arts | 17 | 0.4% |
| Communications | 218 | 4.6% |
| Arts & Humanities | 318 | 6.8% |
| Total | 4,705 | 100.0% |
Transportation & Commute in Anna
Vehicle Availability by Sex in Anna
The most prevalent vehicle ownership categories in Anna are males with 2 vehicles (2,296, accounting for 46.7%) and females with 2 vehicles (2,073, making up 48.5%).
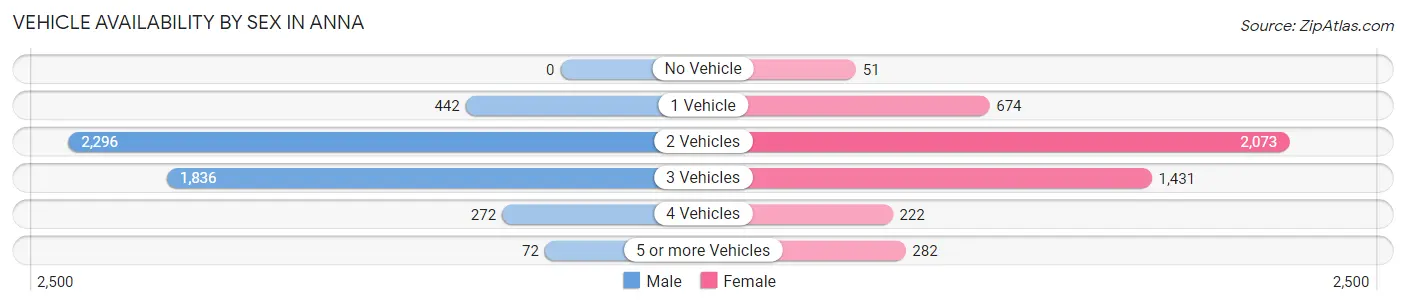
| Vehicles Available | Male | Female |
| No Vehicle | 0 (0.0%) | 51 (1.1%) |
| 1 Vehicle | 442 (9.0%) | 674 (14.2%) |
| 2 Vehicles | 2,296 (46.7%) | 2,073 (43.8%) |
| 3 Vehicles | 1,836 (37.3%) | 1,431 (30.2%) |
| 4 Vehicles | 272 (5.5%) | 222 (4.7%) |
| 5 or more Vehicles | 72 (1.5%) | 282 (6.0%) |
| Total | 4,918 (100.0%) | 4,733 (100.0%) |
Commute Time in Anna
The most frequently occuring commute durations in Anna are 20 to 24 minutes (1,342 commuters, 16.2%), 30 to 34 minutes (1,221 commuters, 14.7%), and 40 to 44 minutes (945 commuters, 11.4%).
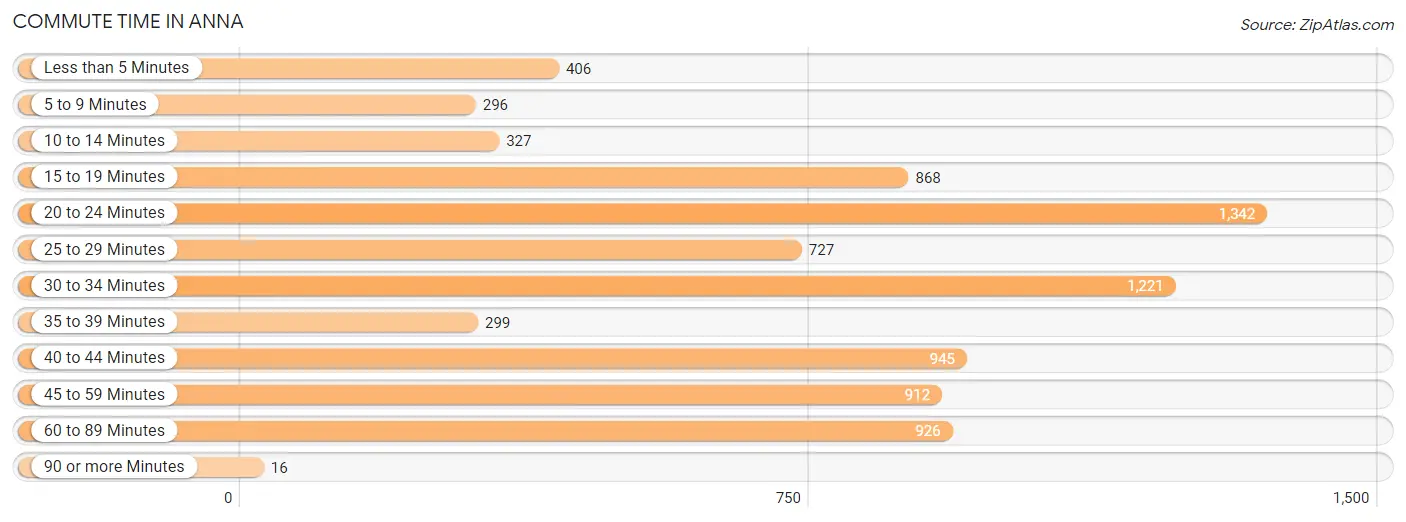
| Commute Time | # Commuters | % Commuters |
| Less than 5 Minutes | 406 | 4.9% |
| 5 to 9 Minutes | 296 | 3.6% |
| 10 to 14 Minutes | 327 | 4.0% |
| 15 to 19 Minutes | 868 | 10.5% |
| 20 to 24 Minutes | 1,342 | 16.2% |
| 25 to 29 Minutes | 727 | 8.8% |
| 30 to 34 Minutes | 1,221 | 14.7% |
| 35 to 39 Minutes | 299 | 3.6% |
| 40 to 44 Minutes | 945 | 11.4% |
| 45 to 59 Minutes | 912 | 11.0% |
| 60 to 89 Minutes | 926 | 11.2% |
| 90 or more Minutes | 16 | 0.2% |
Commute Time by Sex in Anna
The most common commute times in Anna are 60 to 89 minutes (752 commuters, 16.6%) for males and 15 to 19 minutes (677 commuters, 18.0%) for females.
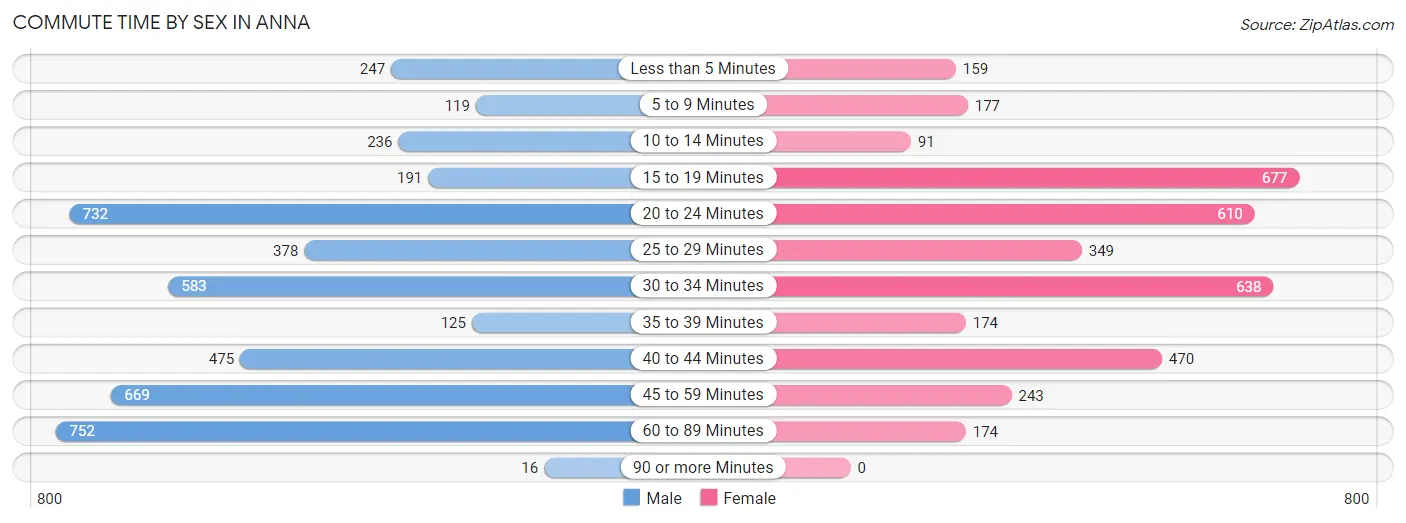
| Commute Time | Male | Female |
| Less than 5 Minutes | 247 (5.5%) | 159 (4.2%) |
| 5 to 9 Minutes | 119 (2.6%) | 177 (4.7%) |
| 10 to 14 Minutes | 236 (5.2%) | 91 (2.4%) |
| 15 to 19 Minutes | 191 (4.2%) | 677 (18.0%) |
| 20 to 24 Minutes | 732 (16.2%) | 610 (16.2%) |
| 25 to 29 Minutes | 378 (8.4%) | 349 (9.3%) |
| 30 to 34 Minutes | 583 (12.9%) | 638 (17.0%) |
| 35 to 39 Minutes | 125 (2.8%) | 174 (4.6%) |
| 40 to 44 Minutes | 475 (10.5%) | 470 (12.5%) |
| 45 to 59 Minutes | 669 (14.8%) | 243 (6.5%) |
| 60 to 89 Minutes | 752 (16.6%) | 174 (4.6%) |
| 90 or more Minutes | 16 (0.4%) | 0 (0.0%) |
Time of Departure to Work by Sex in Anna
The most frequent times of departure to work in Anna are 7:00 AM to 7:29 AM (1,231, 27.2%) for males and 7:30 AM to 7:59 AM (900, 23.9%) for females.
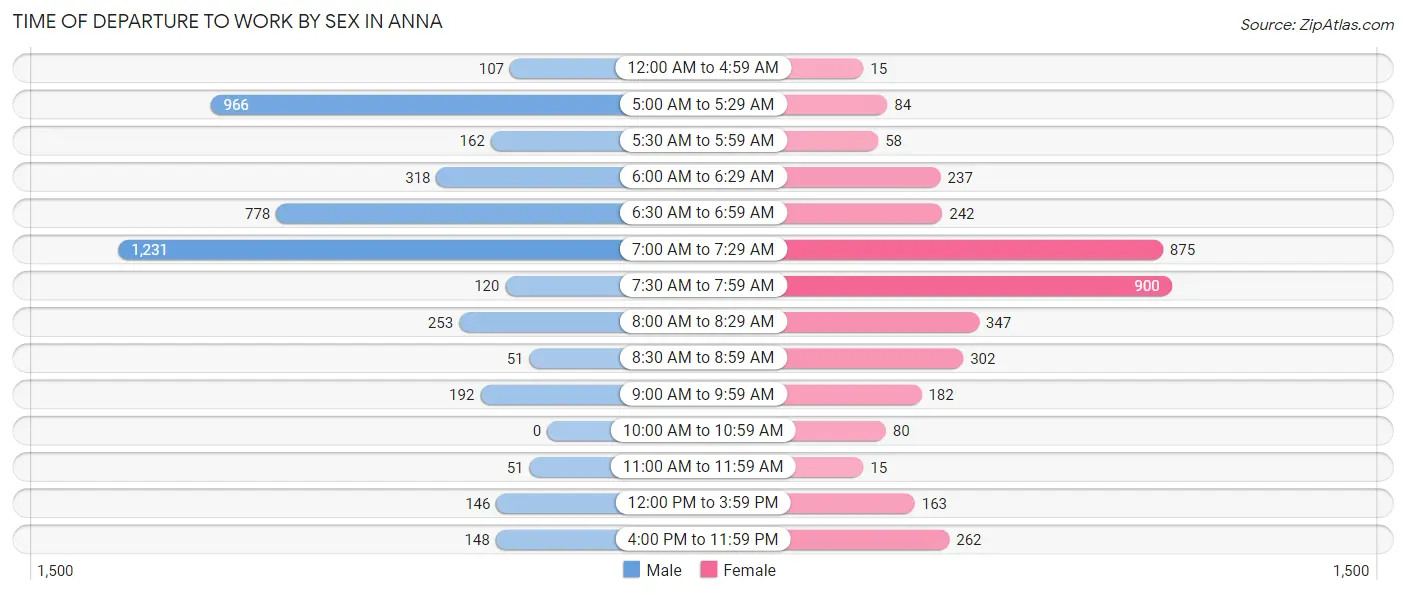
| Time of Departure | Male | Female |
| 12:00 AM to 4:59 AM | 107 (2.4%) | 15 (0.4%) |
| 5:00 AM to 5:29 AM | 966 (21.4%) | 84 (2.2%) |
| 5:30 AM to 5:59 AM | 162 (3.6%) | 58 (1.5%) |
| 6:00 AM to 6:29 AM | 318 (7.0%) | 237 (6.3%) |
| 6:30 AM to 6:59 AM | 778 (17.2%) | 242 (6.4%) |
| 7:00 AM to 7:29 AM | 1,231 (27.2%) | 875 (23.3%) |
| 7:30 AM to 7:59 AM | 120 (2.6%) | 900 (23.9%) |
| 8:00 AM to 8:29 AM | 253 (5.6%) | 347 (9.2%) |
| 8:30 AM to 8:59 AM | 51 (1.1%) | 302 (8.0%) |
| 9:00 AM to 9:59 AM | 192 (4.2%) | 182 (4.8%) |
| 10:00 AM to 10:59 AM | 0 (0.0%) | 80 (2.1%) |
| 11:00 AM to 11:59 AM | 51 (1.1%) | 15 (0.4%) |
| 12:00 PM to 3:59 PM | 146 (3.2%) | 163 (4.3%) |
| 4:00 PM to 11:59 PM | 148 (3.3%) | 262 (7.0%) |
| Total | 4,523 (100.0%) | 3,762 (100.0%) |
Housing Occupancy in Anna
Occupancy by Ownership in Anna
Of the total 6,161 dwellings in Anna, owner-occupied units account for 4,936 (80.1%), while renter-occupied units make up 1,225 (19.9%).
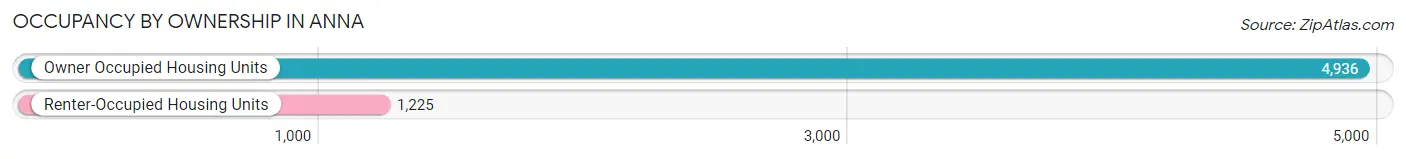
| Occupancy | # Housing Units | % Housing Units |
| Owner Occupied Housing Units | 4,936 | 80.1% |
| Renter-Occupied Housing Units | 1,225 | 19.9% |
| Total Occupied Housing Units | 6,161 | 100.0% |
Occupancy by Household Size in Anna
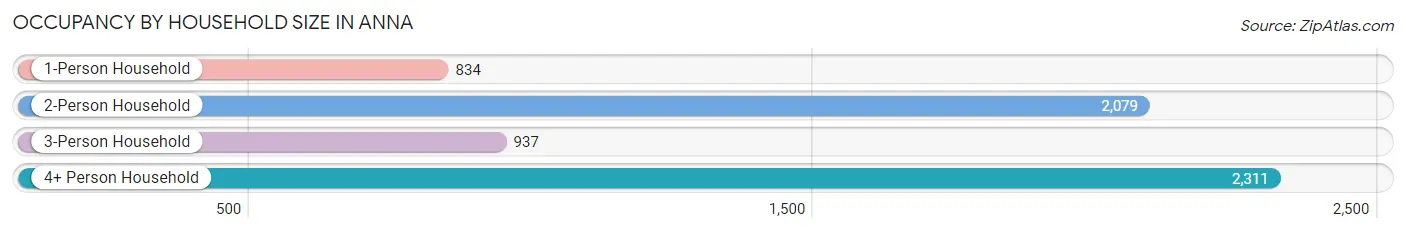
| Household Size | # Housing Units | % Housing Units |
| 1-Person Household | 834 | 13.5% |
| 2-Person Household | 2,079 | 33.7% |
| 3-Person Household | 937 | 15.2% |
| 4+ Person Household | 2,311 | 37.5% |
| Total Housing Units | 6,161 | 100.0% |
Occupancy by Ownership by Household Size in Anna
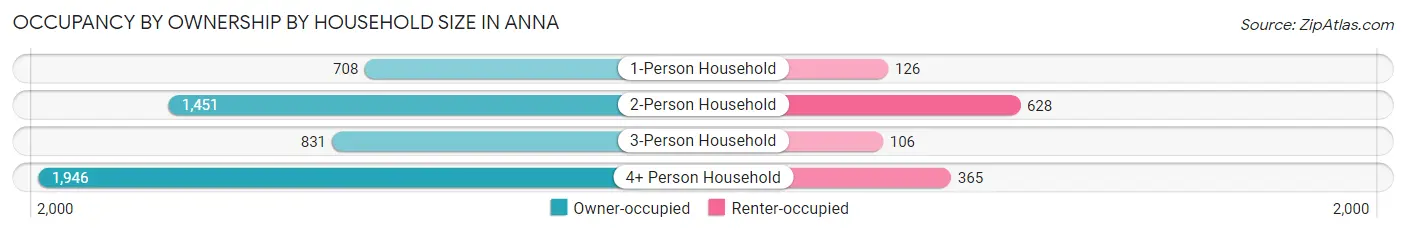
| Household Size | Owner-occupied | Renter-occupied |
| 1-Person Household | 708 (84.9%) | 126 (15.1%) |
| 2-Person Household | 1,451 (69.8%) | 628 (30.2%) |
| 3-Person Household | 831 (88.7%) | 106 (11.3%) |
| 4+ Person Household | 1,946 (84.2%) | 365 (15.8%) |
| Total Housing Units | 4,936 (80.1%) | 1,225 (19.9%) |
Occupancy by Educational Attainment in Anna
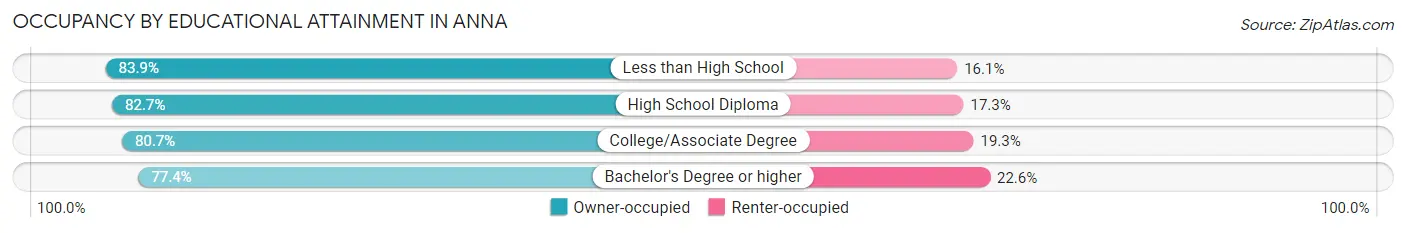
| Household Size | Owner-occupied | Renter-occupied |
| Less than High School | 559 (83.9%) | 107 (16.1%) |
| High School Diploma | 959 (82.7%) | 201 (17.3%) |
| College/Associate Degree | 1,517 (80.7%) | 363 (19.3%) |
| Bachelor's Degree or higher | 1,901 (77.4%) | 554 (22.6%) |
Occupancy by Age of Householder in Anna
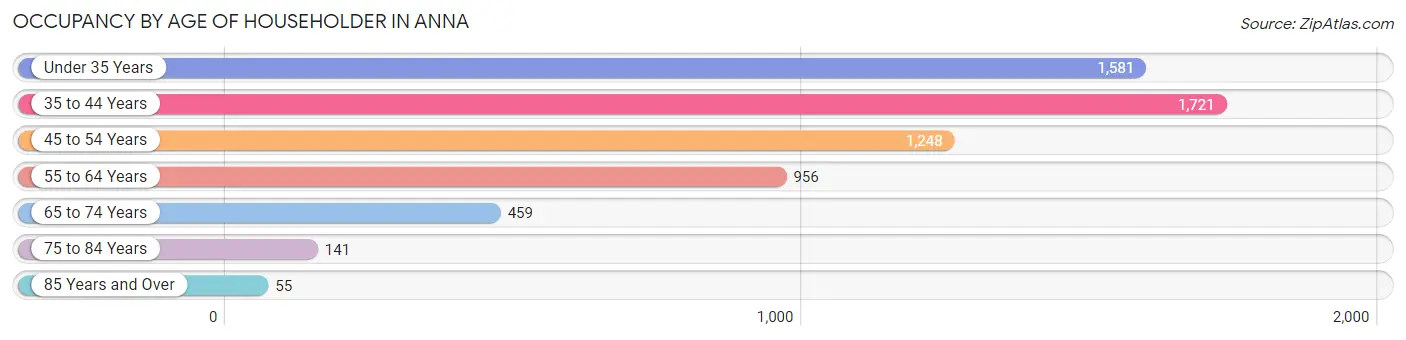
| Age Bracket | # Households | % Households |
| Under 35 Years | 1,581 | 25.7% |
| 35 to 44 Years | 1,721 | 27.9% |
| 45 to 54 Years | 1,248 | 20.3% |
| 55 to 64 Years | 956 | 15.5% |
| 65 to 74 Years | 459 | 7.4% |
| 75 to 84 Years | 141 | 2.3% |
| 85 Years and Over | 55 | 0.9% |
| Total | 6,161 | 100.0% |
Housing Finances in Anna
Median Income by Occupancy in Anna
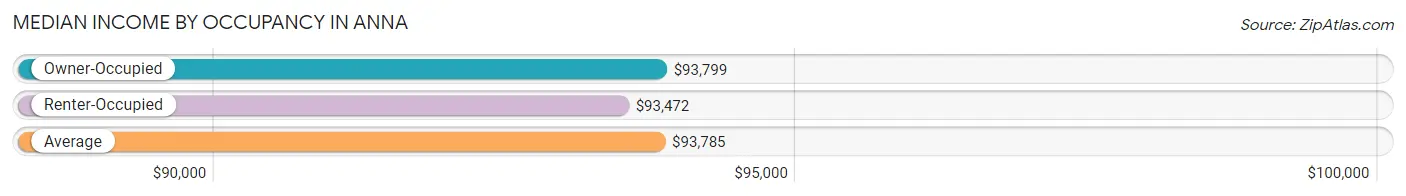
| Occupancy Type | # Households | Median Income |
| Owner-Occupied | 4,936 (80.1%) | $93,799 |
| Renter-Occupied | 1,225 (19.9%) | $93,472 |
| Average | 6,161 (100.0%) | $93,785 |
Occupancy by Householder Income Bracket in Anna
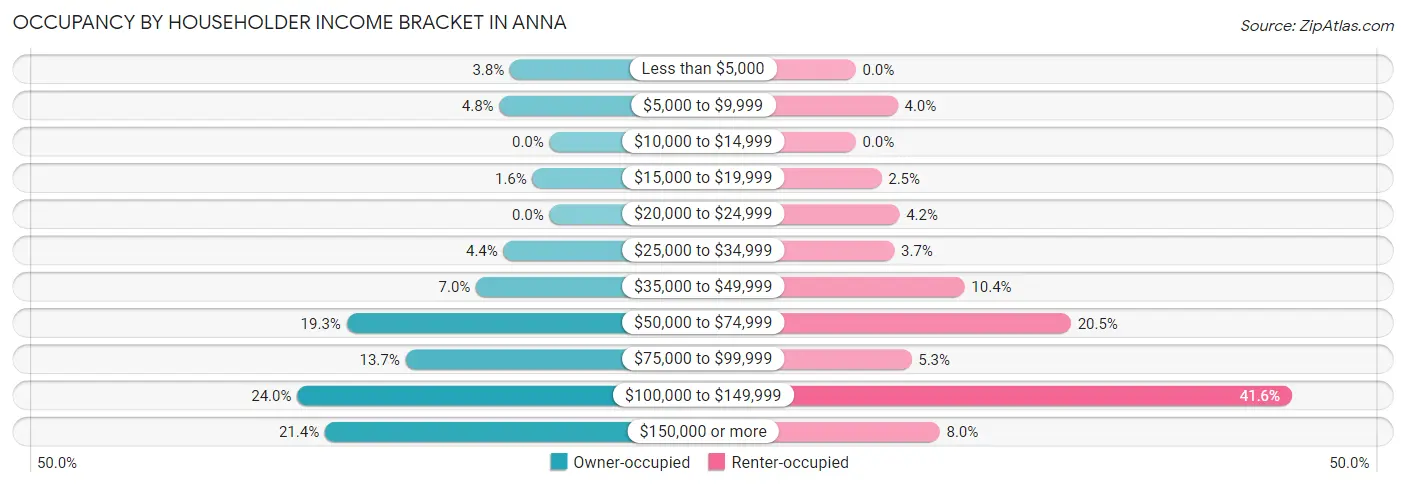
| Income Bracket | Owner-occupied | Renter-occupied |
| Less than $5,000 | 186 (3.8%) | 0 (0.0%) |
| $5,000 to $9,999 | 236 (4.8%) | 49 (4.0%) |
| $10,000 to $14,999 | 0 (0.0%) | 0 (0.0%) |
| $15,000 to $19,999 | 80 (1.6%) | 30 (2.5%) |
| $20,000 to $24,999 | 0 (0.0%) | 51 (4.2%) |
| $25,000 to $34,999 | 216 (4.4%) | 45 (3.7%) |
| $35,000 to $49,999 | 345 (7.0%) | 127 (10.4%) |
| $50,000 to $74,999 | 954 (19.3%) | 251 (20.5%) |
| $75,000 to $99,999 | 677 (13.7%) | 65 (5.3%) |
| $100,000 to $149,999 | 1,186 (24.0%) | 509 (41.5%) |
| $150,000 or more | 1,056 (21.4%) | 98 (8.0%) |
| Total | 4,936 (100.0%) | 1,225 (100.0%) |
Monthly Housing Cost Tiers in Anna
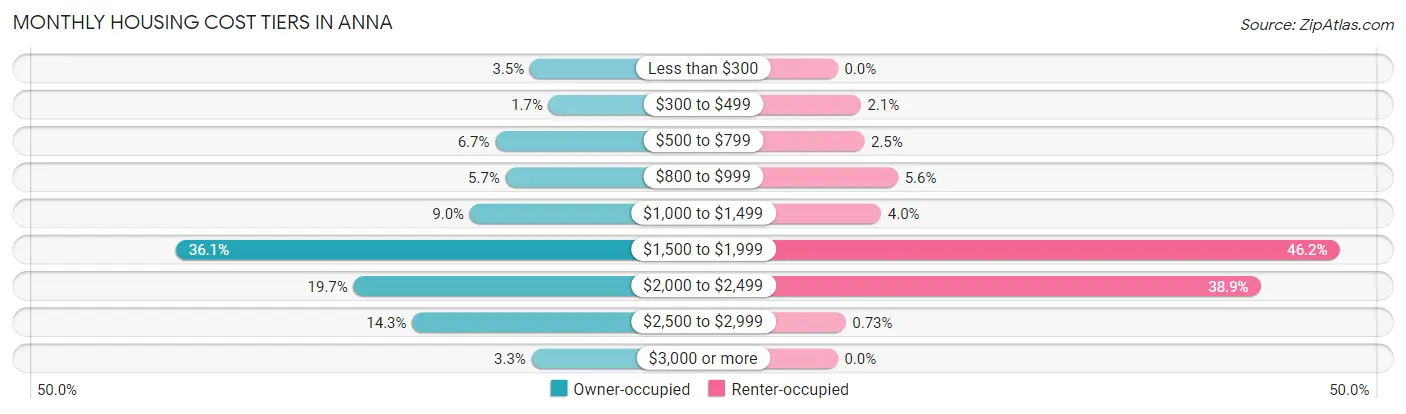
| Monthly Cost | Owner-occupied | Renter-occupied |
| Less than $300 | 171 (3.5%) | 0 (0.0%) |
| $300 to $499 | 86 (1.7%) | 26 (2.1%) |
| $500 to $799 | 329 (6.7%) | 30 (2.5%) |
| $800 to $999 | 282 (5.7%) | 68 (5.6%) |
| $1,000 to $1,499 | 444 (9.0%) | 49 (4.0%) |
| $1,500 to $1,999 | 1,781 (36.1%) | 566 (46.2%) |
| $2,000 to $2,499 | 973 (19.7%) | 477 (38.9%) |
| $2,500 to $2,999 | 706 (14.3%) | 9 (0.7%) |
| $3,000 or more | 164 (3.3%) | 0 (0.0%) |
| Total | 4,936 (100.0%) | 1,225 (100.0%) |
Physical Housing Characteristics in Anna
Housing Structures in Anna
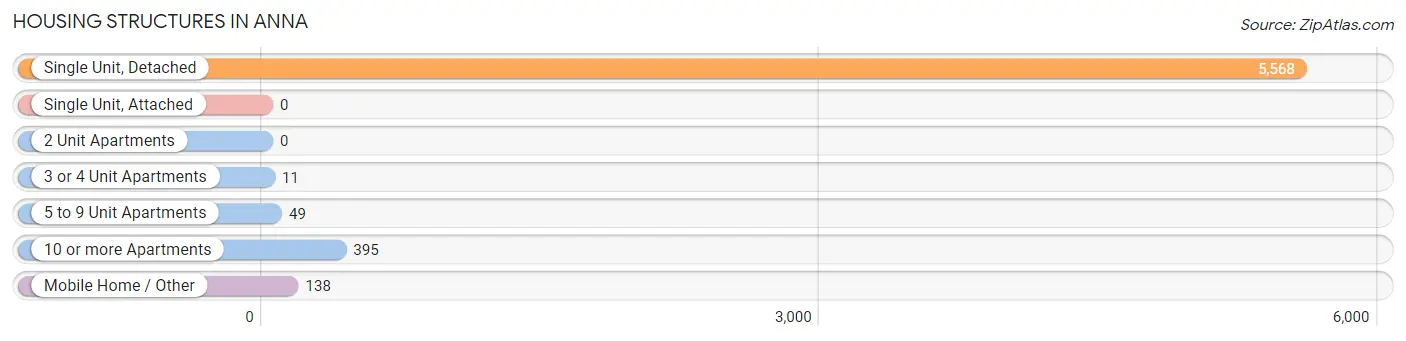
| Structure Type | # Housing Units | % Housing Units |
| Single Unit, Detached | 5,568 | 90.4% |
| Single Unit, Attached | 0 | 0.0% |
| 2 Unit Apartments | 0 | 0.0% |
| 3 or 4 Unit Apartments | 11 | 0.2% |
| 5 to 9 Unit Apartments | 49 | 0.8% |
| 10 or more Apartments | 395 | 6.4% |
| Mobile Home / Other | 138 | 2.2% |
| Total | 6,161 | 100.0% |
Housing Structures by Occupancy in Anna
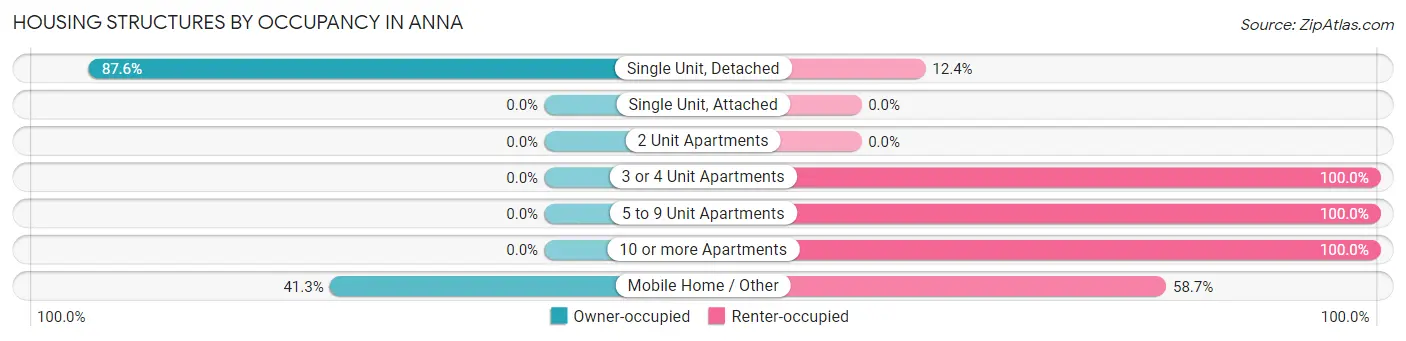
| Structure Type | Owner-occupied | Renter-occupied |
| Single Unit, Detached | 4,879 (87.6%) | 689 (12.4%) |
| Single Unit, Attached | 0 (0.0%) | 0 (0.0%) |
| 2 Unit Apartments | 0 (0.0%) | 0 (0.0%) |
| 3 or 4 Unit Apartments | 0 (0.0%) | 11 (100.0%) |
| 5 to 9 Unit Apartments | 0 (0.0%) | 49 (100.0%) |
| 10 or more Apartments | 0 (0.0%) | 395 (100.0%) |
| Mobile Home / Other | 57 (41.3%) | 81 (58.7%) |
| Total | 4,936 (80.1%) | 1,225 (19.9%) |
Housing Structures by Number of Rooms in Anna
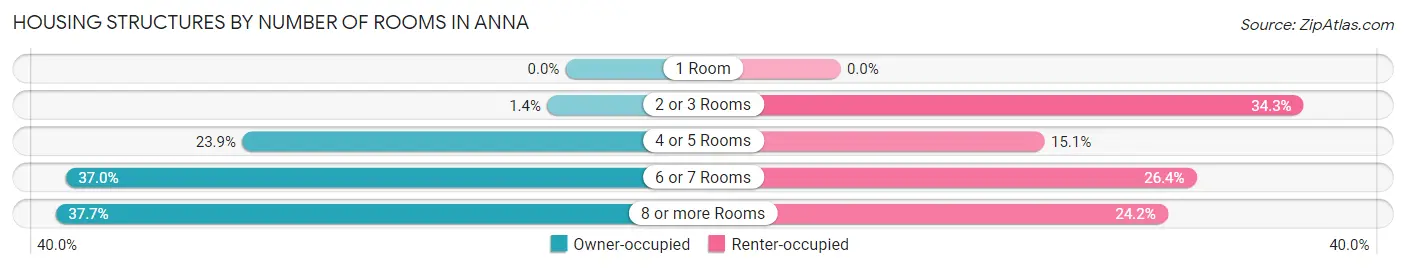
| Number of Rooms | Owner-occupied | Renter-occupied |
| 1 Room | 0 (0.0%) | 0 (0.0%) |
| 2 or 3 Rooms | 67 (1.4%) | 420 (34.3%) |
| 4 or 5 Rooms | 1,181 (23.9%) | 185 (15.1%) |
| 6 or 7 Rooms | 1,826 (37.0%) | 323 (26.4%) |
| 8 or more Rooms | 1,862 (37.7%) | 297 (24.2%) |
| Total | 4,936 (100.0%) | 1,225 (100.0%) |
Housing Structure by Heating Type in Anna
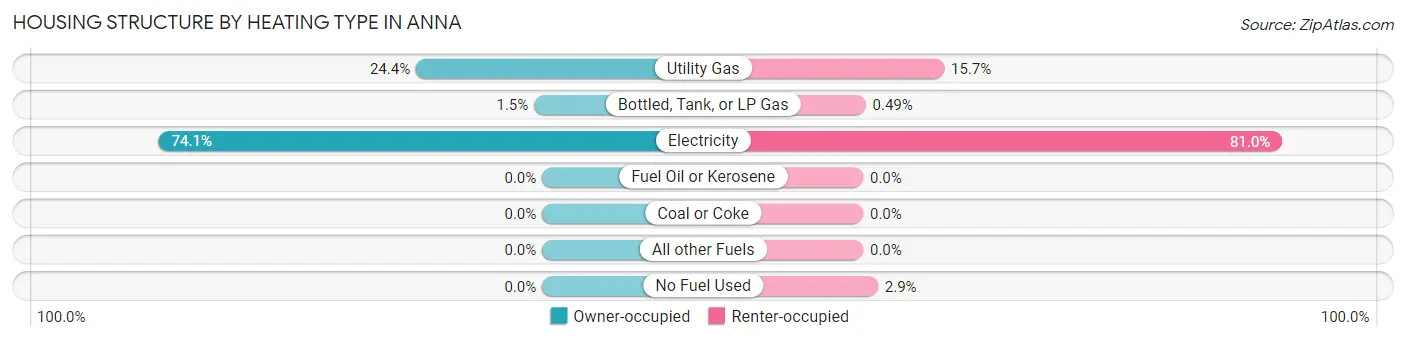
| Heating Type | Owner-occupied | Renter-occupied |
| Utility Gas | 1,203 (24.4%) | 192 (15.7%) |
| Bottled, Tank, or LP Gas | 76 (1.5%) | 6 (0.5%) |
| Electricity | 3,657 (74.1%) | 992 (81.0%) |
| Fuel Oil or Kerosene | 0 (0.0%) | 0 (0.0%) |
| Coal or Coke | 0 (0.0%) | 0 (0.0%) |
| All other Fuels | 0 (0.0%) | 0 (0.0%) |
| No Fuel Used | 0 (0.0%) | 35 (2.9%) |
| Total | 4,936 (100.0%) | 1,225 (100.0%) |
Household Vehicle Usage in Anna
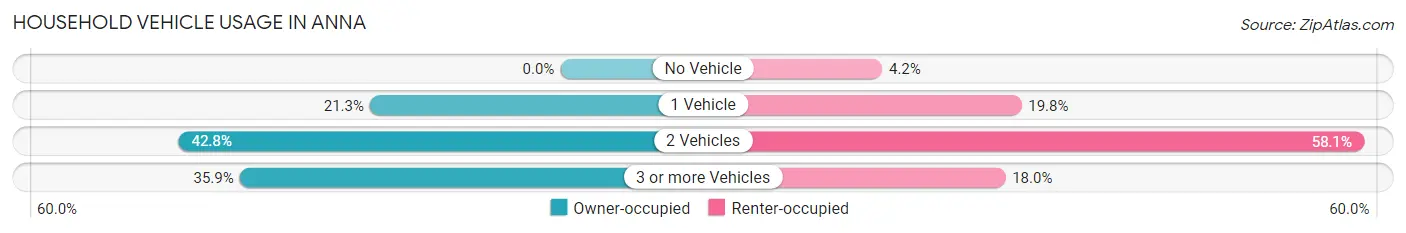
| Vehicles per Household | Owner-occupied | Renter-occupied |
| No Vehicle | 0 (0.0%) | 51 (4.2%) |
| 1 Vehicle | 1,053 (21.3%) | 242 (19.8%) |
| 2 Vehicles | 2,110 (42.7%) | 712 (58.1%) |
| 3 or more Vehicles | 1,773 (35.9%) | 220 (18.0%) |
| Total | 4,936 (100.0%) | 1,225 (100.0%) |
Real Estate & Mortgages in Anna
Real Estate and Mortgage Overview in Anna
| Characteristic | Without Mortgage | With Mortgage |
| Housing Units | 966 | 3,970 |
| Median Property Value | $248,300 | $275,100 |
| Median Household Income | - | - |
| Monthly Housing Costs | $702 | $164 |
| Real Estate Taxes | $5,032 | $176 |
Property Value by Mortgage Status in Anna
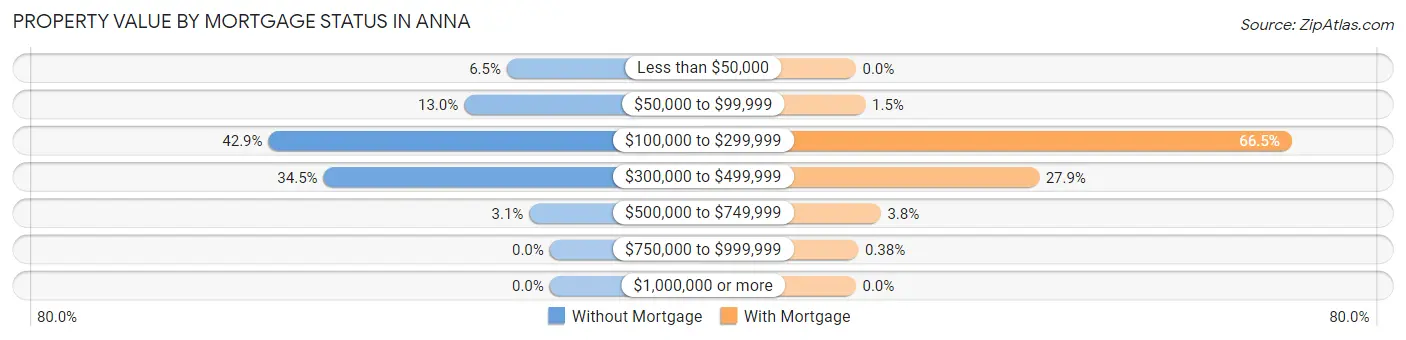
| Property Value | Without Mortgage | With Mortgage |
| Less than $50,000 | 63 (6.5%) | 0 (0.0%) |
| $50,000 to $99,999 | 126 (13.0%) | 58 (1.5%) |
| $100,000 to $299,999 | 414 (42.9%) | 2,638 (66.4%) |
| $300,000 to $499,999 | 333 (34.5%) | 1,108 (27.9%) |
| $500,000 to $749,999 | 30 (3.1%) | 151 (3.8%) |
| $750,000 to $999,999 | 0 (0.0%) | 15 (0.4%) |
| $1,000,000 or more | 0 (0.0%) | 0 (0.0%) |
| Total | 966 (100.0%) | 3,970 (100.0%) |
Household Income by Mortgage Status in Anna
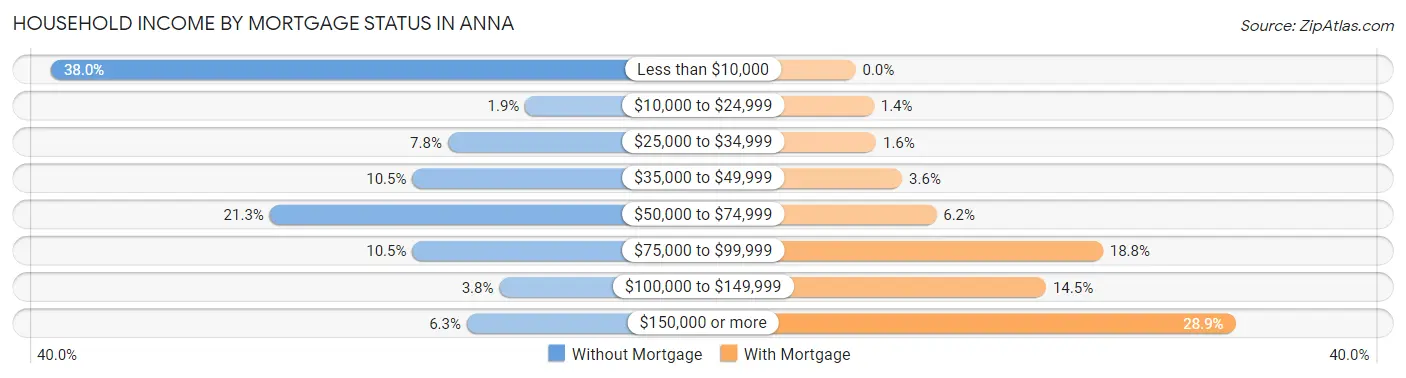
| Household Income | Without Mortgage | With Mortgage |
| Less than $10,000 | 367 (38.0%) | 0 (0.0%) |
| $10,000 to $24,999 | 18 (1.9%) | 55 (1.4%) |
| $25,000 to $34,999 | 75 (7.8%) | 62 (1.6%) |
| $35,000 to $49,999 | 101 (10.5%) | 141 (3.5%) |
| $50,000 to $74,999 | 206 (21.3%) | 244 (6.1%) |
| $75,000 to $99,999 | 101 (10.5%) | 748 (18.8%) |
| $100,000 to $149,999 | 37 (3.8%) | 576 (14.5%) |
| $150,000 or more | 61 (6.3%) | 1,149 (28.9%) |
| Total | 966 (100.0%) | 3,970 (100.0%) |
Property Value to Household Income Ratio in Anna
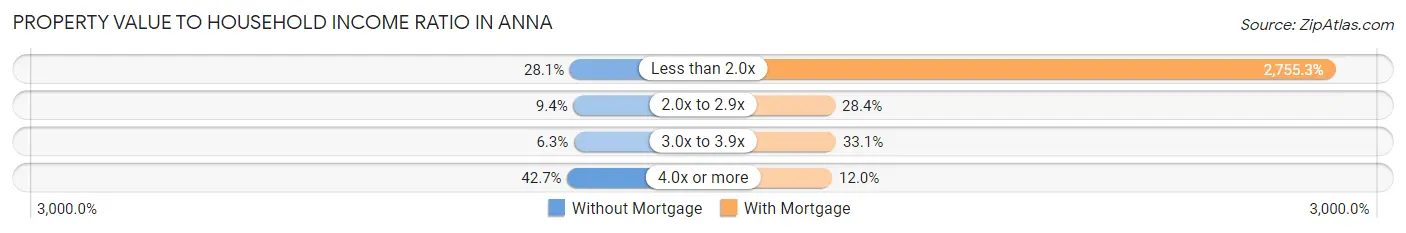
| Value-to-Income Ratio | Without Mortgage | With Mortgage |
| Less than 2.0x | 271 (28.1%) | 109,385 (2,755.3%) |
| 2.0x to 2.9x | 91 (9.4%) | 1,129 (28.4%) |
| 3.0x to 3.9x | 61 (6.3%) | 1,315 (33.1%) |
| 4.0x or more | 412 (42.6%) | 477 (12.0%) |
| Total | 966 (100.0%) | 3,970 (100.0%) |
Real Estate Taxes by Mortgage Status in Anna
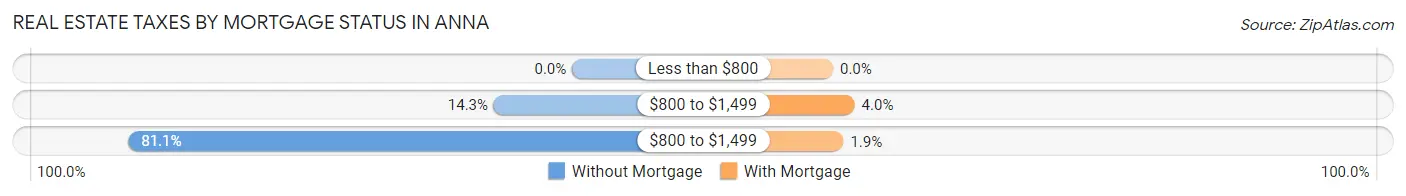
| Property Taxes | Without Mortgage | With Mortgage |
| Less than $800 | 0 (0.0%) | 0 (0.0%) |
| $800 to $1,499 | 138 (14.3%) | 157 (4.0%) |
| $800 to $1,499 | 783 (81.1%) | 76 (1.9%) |
| Total | 966 (100.0%) | 3,970 (100.0%) |
Health & Disability in Anna
Health Insurance Coverage by Age in Anna
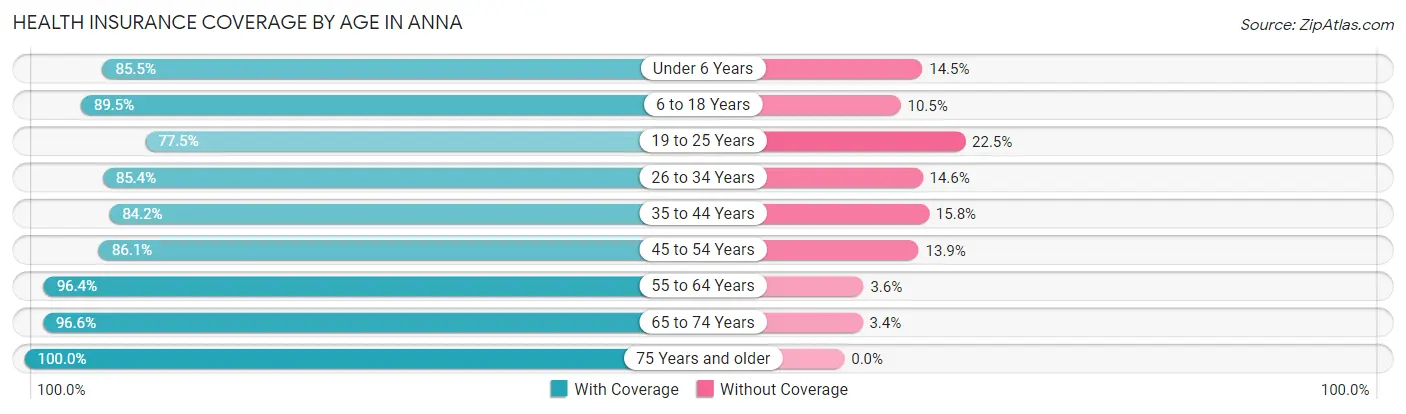
| Age Bracket | With Coverage | Without Coverage |
| Under 6 Years | 1,369 (85.5%) | 233 (14.5%) |
| 6 to 18 Years | 3,310 (89.5%) | 388 (10.5%) |
| 19 to 25 Years | 1,448 (77.5%) | 421 (22.5%) |
| 26 to 34 Years | 3,008 (85.4%) | 514 (14.6%) |
| 35 to 44 Years | 2,407 (84.2%) | 451 (15.8%) |
| 45 to 54 Years | 1,988 (86.1%) | 320 (13.9%) |
| 55 to 64 Years | 1,695 (96.4%) | 63 (3.6%) |
| 65 to 74 Years | 684 (96.6%) | 24 (3.4%) |
| 75 Years and older | 262 (100.0%) | 0 (0.0%) |
| Total | 16,171 (87.0%) | 2,414 (13.0%) |
Health Insurance Coverage by Citizenship Status in Anna
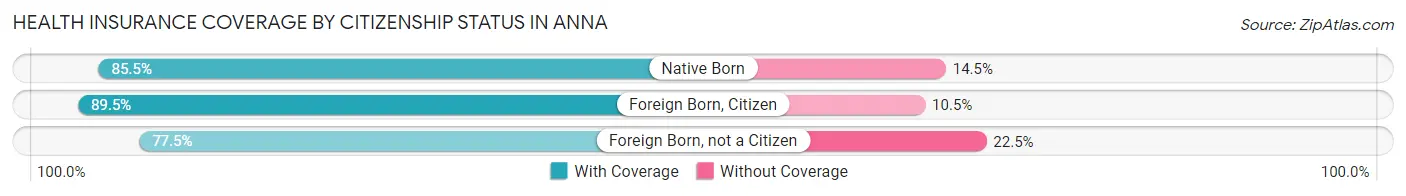
| Citizenship Status | With Coverage | Without Coverage |
| Native Born | 1,369 (85.5%) | 233 (14.5%) |
| Foreign Born, Citizen | 3,310 (89.5%) | 388 (10.5%) |
| Foreign Born, not a Citizen | 1,448 (77.5%) | 421 (22.5%) |
Health Insurance Coverage by Household Income in Anna
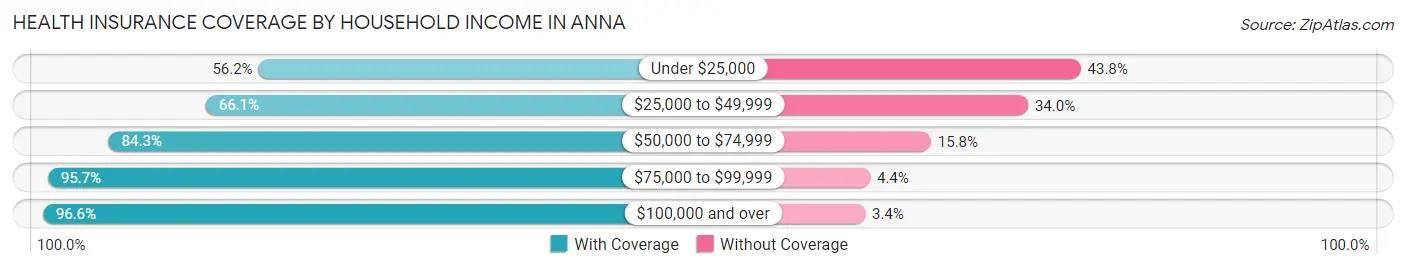
| Household Income | With Coverage | Without Coverage |
| Under $25,000 | 957 (56.2%) | 746 (43.8%) |
| $25,000 to $49,999 | 1,360 (66.0%) | 699 (34.0%) |
| $50,000 to $74,999 | 3,018 (84.3%) | 564 (15.8%) |
| $75,000 to $99,999 | 2,155 (95.7%) | 98 (4.3%) |
| $100,000 and over | 8,681 (96.6%) | 307 (3.4%) |
Public vs Private Health Insurance Coverage by Age in Anna
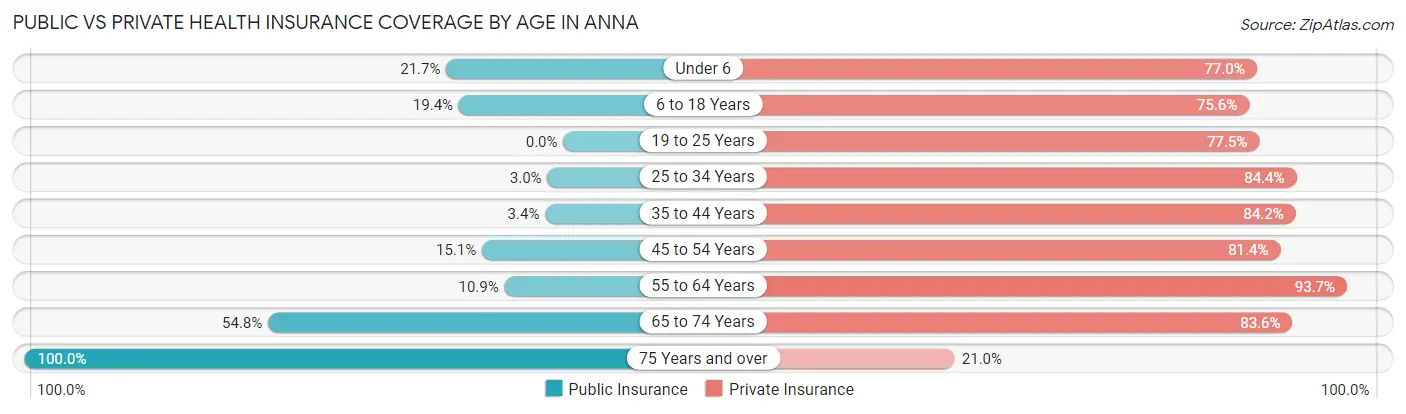
| Age Bracket | Public Insurance | Private Insurance |
| Under 6 | 348 (21.7%) | 1,233 (77.0%) |
| 6 to 18 Years | 717 (19.4%) | 2,795 (75.6%) |
| 19 to 25 Years | 0 (0.0%) | 1,448 (77.5%) |
| 25 to 34 Years | 104 (2.9%) | 2,971 (84.4%) |
| 35 to 44 Years | 96 (3.4%) | 2,407 (84.2%) |
| 45 to 54 Years | 348 (15.1%) | 1,878 (81.4%) |
| 55 to 64 Years | 192 (10.9%) | 1,648 (93.7%) |
| 65 to 74 Years | 388 (54.8%) | 592 (83.6%) |
| 75 Years and over | 262 (100.0%) | 55 (21.0%) |
| Total | 2,455 (13.2%) | 15,027 (80.9%) |
Disability Status by Sex by Age in Anna
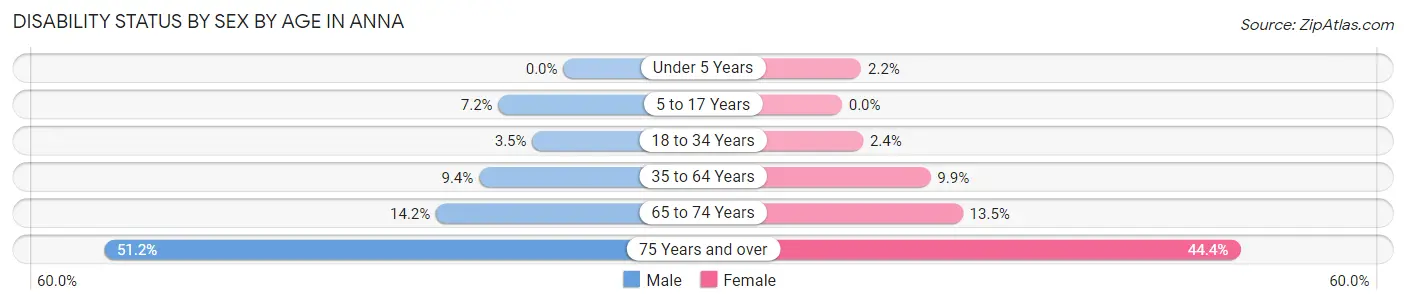
| Age Bracket | Male | Female |
| Under 5 Years | 0 (0.0%) | 14 (2.1%) |
| 5 to 17 Years | 120 (7.2%) | 0 (0.0%) |
| 18 to 34 Years | 91 (3.5%) | 71 (2.4%) |
| 35 to 64 Years | 315 (9.4%) | 352 (9.9%) |
| 65 to 74 Years | 54 (14.2%) | 44 (13.5%) |
| 75 Years and over | 66 (51.2%) | 59 (44.4%) |
Disability Class by Sex by Age in Anna
Disability Class: Hearing Difficulty
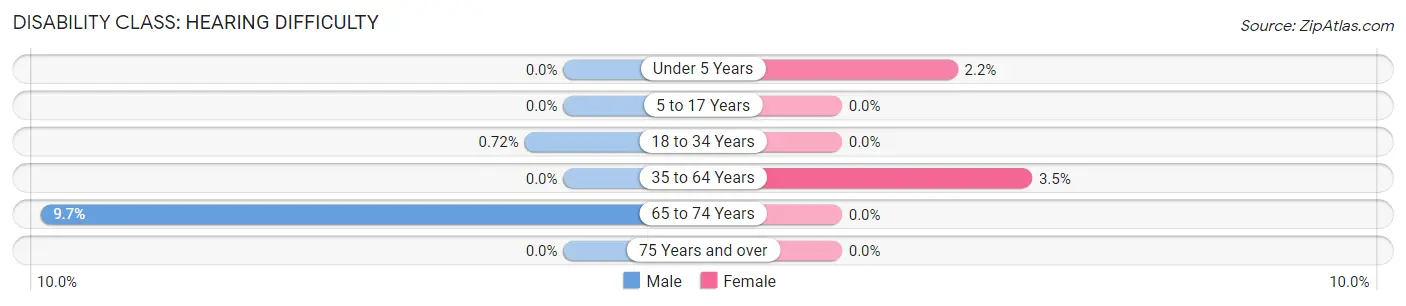
| Age Bracket | Male | Female |
| Under 5 Years | 0 (0.0%) | 14 (2.1%) |
| 5 to 17 Years | 0 (0.0%) | 0 (0.0%) |
| 18 to 34 Years | 19 (0.7%) | 0 (0.0%) |
| 35 to 64 Years | 0 (0.0%) | 126 (3.5%) |
| 65 to 74 Years | 37 (9.7%) | 0 (0.0%) |
| 75 Years and over | 0 (0.0%) | 0 (0.0%) |
Disability Class: Vision Difficulty
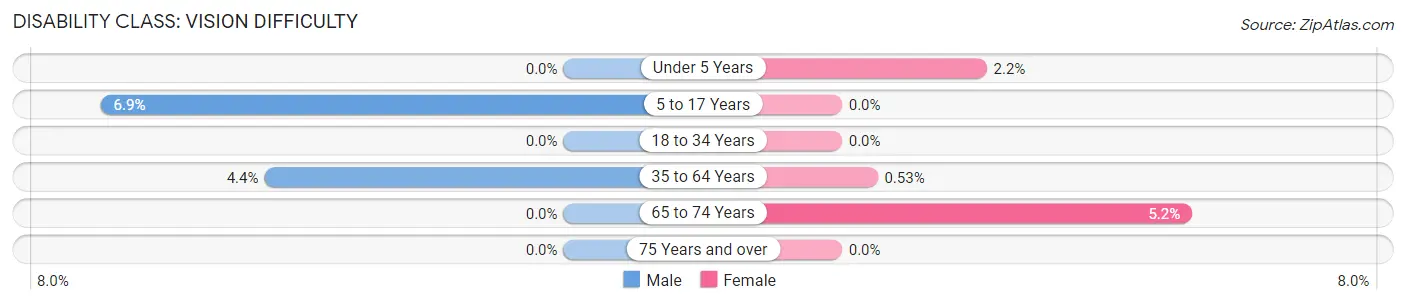
| Age Bracket | Male | Female |
| Under 5 Years | 0 (0.0%) | 14 (2.1%) |
| 5 to 17 Years | 114 (6.9%) | 0 (0.0%) |
| 18 to 34 Years | 0 (0.0%) | 0 (0.0%) |
| 35 to 64 Years | 149 (4.4%) | 19 (0.5%) |
| 65 to 74 Years | 0 (0.0%) | 17 (5.2%) |
| 75 Years and over | 0 (0.0%) | 0 (0.0%) |
Disability Class: Cognitive Difficulty
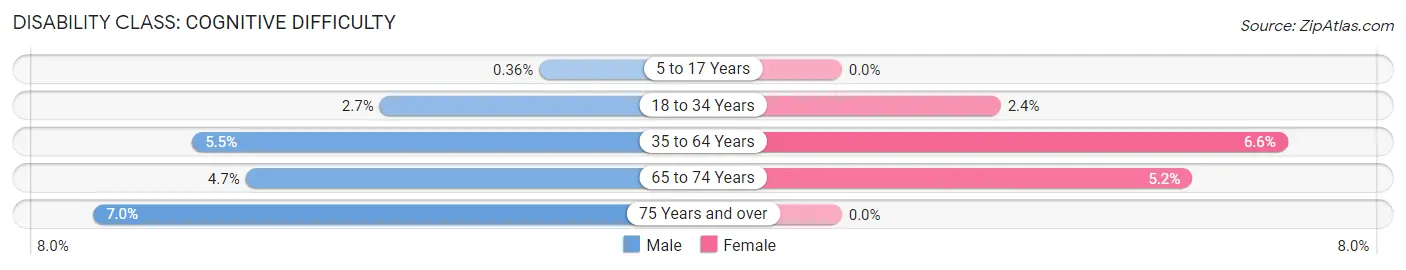
| Age Bracket | Male | Female |
| 5 to 17 Years | 6 (0.4%) | 0 (0.0%) |
| 18 to 34 Years | 72 (2.7%) | 71 (2.4%) |
| 35 to 64 Years | 185 (5.5%) | 236 (6.6%) |
| 65 to 74 Years | 18 (4.7%) | 17 (5.2%) |
| 75 Years and over | 9 (7.0%) | 0 (0.0%) |
Disability Class: Ambulatory Difficulty
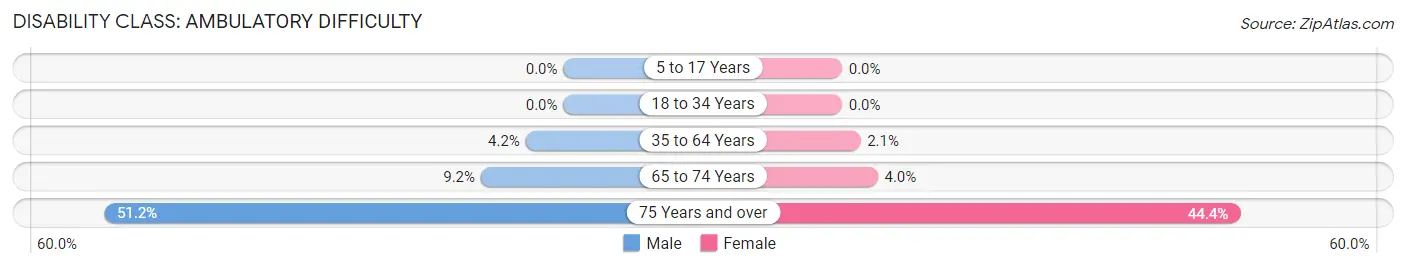
| Age Bracket | Male | Female |
| 5 to 17 Years | 0 (0.0%) | 0 (0.0%) |
| 18 to 34 Years | 0 (0.0%) | 0 (0.0%) |
| 35 to 64 Years | 141 (4.2%) | 73 (2.1%) |
| 65 to 74 Years | 35 (9.2%) | 13 (4.0%) |
| 75 Years and over | 66 (51.2%) | 59 (44.4%) |
Disability Class: Self-Care Difficulty
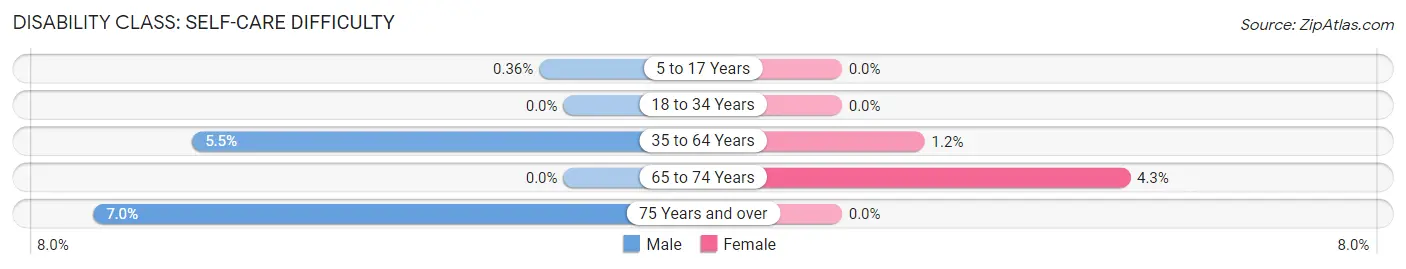
| Age Bracket | Male | Female |
| 5 to 17 Years | 6 (0.4%) | 0 (0.0%) |
| 18 to 34 Years | 0 (0.0%) | 0 (0.0%) |
| 35 to 64 Years | 185 (5.5%) | 44 (1.2%) |
| 65 to 74 Years | 0 (0.0%) | 14 (4.3%) |
| 75 Years and over | 9 (7.0%) | 0 (0.0%) |
Technology Access in Anna
Computing Device Access in Anna
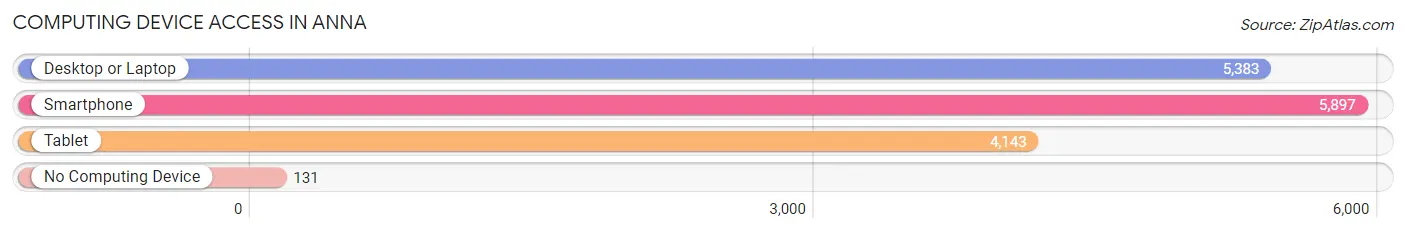
| Device Type | # Households | % Households |
| Desktop or Laptop | 5,383 | 87.4% |
| Smartphone | 5,897 | 95.7% |
| Tablet | 4,143 | 67.2% |
| No Computing Device | 131 | 2.1% |
| Total | 6,161 | 100.0% |
Internet Access in Anna
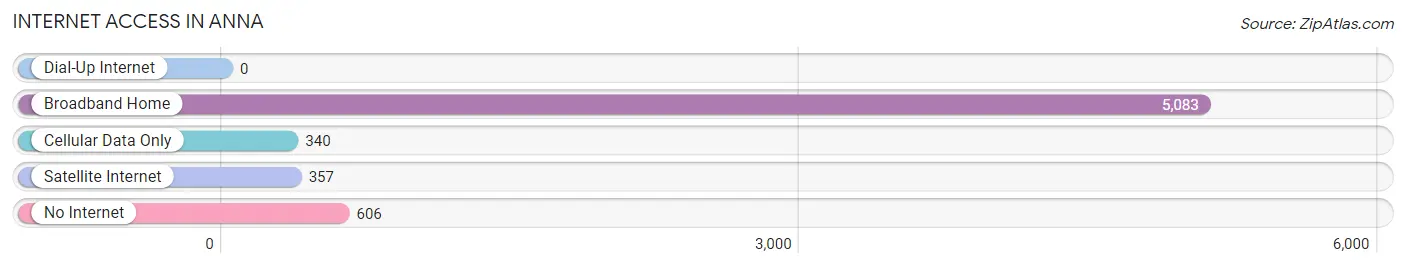
| Internet Type | # Households | % Households |
| Dial-Up Internet | 0 | 0.0% |
| Broadband Home | 5,083 | 82.5% |
| Cellular Data Only | 340 | 5.5% |
| Satellite Internet | 357 | 5.8% |
| No Internet | 606 | 9.8% |
| Total | 6,161 | 100.0% |
Anna Summary
Anna, Texas is a small city located in Collin County, Texas, United States. It is part of the Dallas-Fort Worth-Arlington metropolitan area. The city was founded in 1872 and is named after Anna Maria Risher, the daughter of one of the city’s first settlers. As of the 2010 census, the population of Anna was 8,249.
Geography
Anna is located at 33°33'25" North, 96°30'45" West (33.556944, -96.5125). It is situated in the Blackland Prairie region of North Central Texas. The city has a total area of 5.2 square miles, all of which is land. Anna is located approximately 40 miles north of Dallas and is part of the Dallas-Fort Worth-Arlington metropolitan area.
Economy
Anna’s economy is largely based on agriculture and light manufacturing. The city is home to several large employers, including the Anna Independent School District, the City of Anna, and the Anna-Melissa Tribune newspaper. Other major employers include the Anna Medical Center, the Anna Chamber of Commerce, and the Anna Economic Development Corporation.
Demographics
As of the 2010 census, the population of Anna was 8,249. The racial makeup of the city was 79.2% White, 11.2% African American, 0.5% Native American, 0.7% Asian, 6.2% from other races, and 2.2% from two or more races. Hispanic or Latino of any race were 15.3% of the population.
The median income for a household in Anna was $50,945, and the median income for a family was $60,945. The per capita income for the city was $22,845. About 8.2% of families and 10.2% of the population were below the poverty line, including 14.2% of those under age 18 and 8.2% of those age 65 or over.
Education
Anna is served by the Anna Independent School District, which consists of four elementary schools, one middle school, and one high school. The district also operates an alternative education program. The city is also home to several private schools, including the Anna Christian Academy and the Anna Montessori School.
Conclusion
Anna, Texas is a small city located in Collin County, Texas, United States. It is part of the Dallas-Fort Worth-Arlington metropolitan area and was founded in 1872. The city’s economy is largely based on agriculture and light manufacturing, and it is home to several large employers. As of the 2010 census, the population of Anna was 8,249. The city is served by the Anna Independent School District, as well as several private schools.
Common Questions
What is Per Capita Income in Anna?
Per Capita income in Anna is $36,340.
What is the Median Family Income in Anna?
Median Family Income in Anna is $98,389.
What is the Median Household income in Anna?
Median Household Income in Anna is $93,785.
What is Income or Wage Gap in Anna?
Income or Wage Gap in Anna is 31.0%.
Women in Anna earn 69.0 cents for every dollar earned by a man.
What is Inequality or Gini Index in Anna?
Inequality or Gini Index in Anna is 0.39.
What is the Total Population of Anna?
Total Population of Anna is 18,585.
What is the Total Male Population of Anna?
Total Male Population of Anna is 8,968.
What is the Total Female Population of Anna?
Total Female Population of Anna is 9,617.
What is the Ratio of Males per 100 Females in Anna?
There are 93.25 Males per 100 Females in Anna.
What is the Ratio of Females per 100 Males in Anna?
There are 107.24 Females per 100 Males in Anna.
What is the Median Population Age in Anna?
Median Population Age in Anna is 32.2 Years.
What is the Average Family Size in Anna
Average Family Size in Anna is 3.3 People.
What is the Average Household Size in Anna
Average Household Size in Anna is 3.0 People.
How Large is the Labor Force in Anna?
There are 10,049 People in the Labor Forcein in Anna.
What is the Percentage of People in the Labor Force in Anna?
71.0% of People are in the Labor Force in Anna.
What is the Unemployment Rate in Anna?
Unemployment Rate in Anna is 3.4%.