Zip Codes with the Highest Percentage of Population with a Degree in Psychology in Seneca, SC
RELATED REPORTS & OPTIONS
Psychology
Seneca
Compare Zip Codes
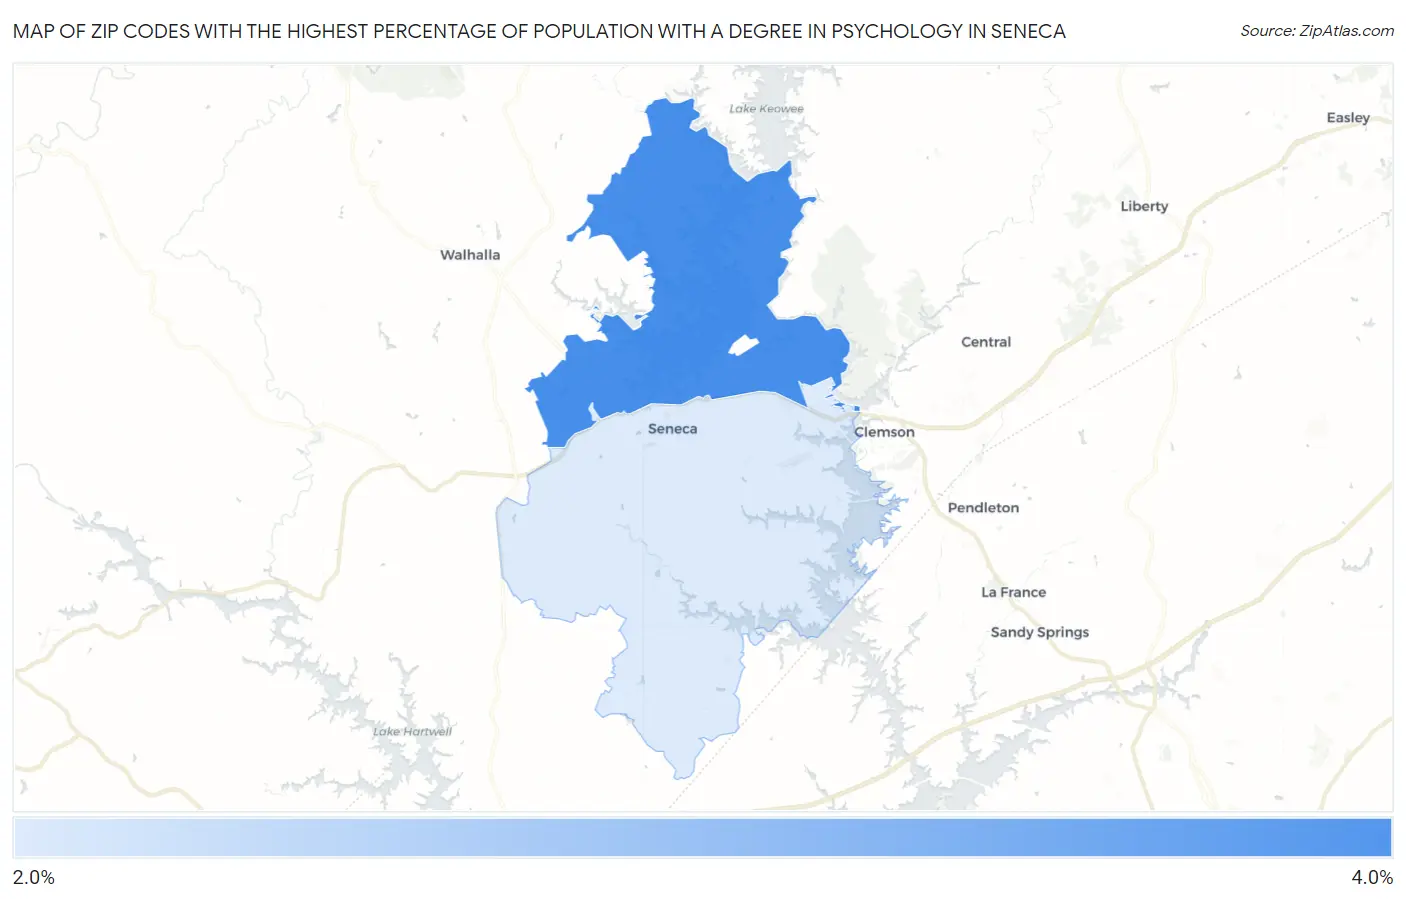
Map of Zip Codes with the Highest Percentage of Population with a Degree in Psychology in Seneca
2.4%
3.6%
Zip Codes with the Highest Percentage of Population with a Degree in Psychology in Seneca, SC
| Zip Code | % Graduates | vs State | vs National | |
| 1. | 29672 | 3.6% | 5.1%(-1.44)#225 | 5.1%(-1.40)#16,151 |
| 2. | 29678 | 2.4% | 5.1%(-2.68)#271 | 5.1%(-2.65)#19,863 |
1
Common Questions
What are the Top Zip Codes with the Highest Percentage of Population with a Degree in Psychology in Seneca, SC?
Top Zip Codes with the Highest Percentage of Population with a Degree in Psychology in Seneca, SC are:
What zip code has the Highest Percentage of Population with a Degree in Psychology in Seneca, SC?
29672 has the Highest Percentage of Population with a Degree in Psychology in Seneca, SC with 3.6%.
What is the Percentage of Population with a Degree in Psychology in Seneca, SC?
Percentage of Population with a Degree in Psychology in Seneca is 0.68%.
What is the Percentage of Population with a Degree in Psychology in South Carolina?
Percentage of Population with a Degree in Psychology in South Carolina is 5.1%.
What is the Percentage of Population with a Degree in Psychology in the United States?
Percentage of Population with a Degree in Psychology in the United States is 5.1%.