Lonerock, OR Map & Demographics
Lonerock Map

Lonerock Overview
$52,778
PER CAPITA INCOME
0.51
INEQUALITY / GINI INDEX
18
TOTAL POPULATION
6
MALE POPULATION
12
FEMALE POPULATION
50.00
MALES / 100 FEMALES
200.00
FEMALES / 100 MALES
69.0
MEDIAN AGE
2.0
AVG FAMILY SIZE
1.5
AVG HOUSEHOLD SIZE
7
LABOR FORCE [ PEOPLE ]
38.9%
PERCENT IN LABOR FORCE
Lonerock Area Codes
Income in Lonerock
Income Overview in Lonerock
| Characteristic | Number | Measure |
| Per Capita Income | 18 | $52,778 |
| Median Family Income | 5 | $0 |
| Mean Family Income | 5 | $202,500 |
| Median Household Income | 12 | $0 |
| Mean Household Income | 12 | $120,467 |
| Income Deficit | 5 | $0 |
| Wage / Income Gap (%) | 18 | 0.00% |
| Wage / Income Gap ($) | 18 | 100.00¢ per $1 |
| Gini / Inequality Index | 18 | 0.51 |
Earnings by Sex in Lonerock
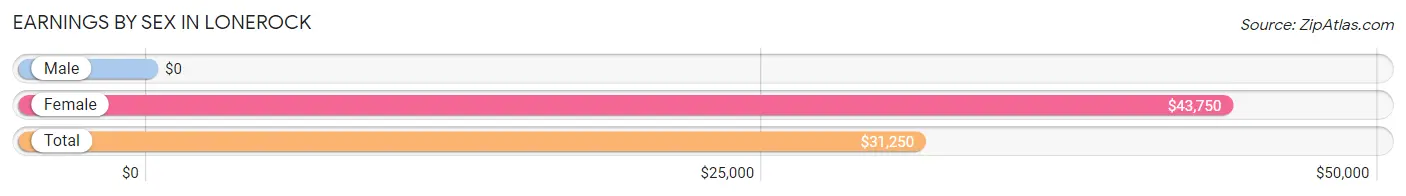
| Sex | Number | Average Earnings |
| Male | 4 (36.4%) | $0 |
| Female | 7 (63.6%) | $43,750 |
| Total | 11 (100.0%) | $31,250 |
Earnings by Sex by Income Bracket in Lonerock
The most common earnings brackets in Lonerock are $7,500 to $9,999 for men (1 | 25.0%) and $45,000 to $49,999 for women (3 | 42.9%).
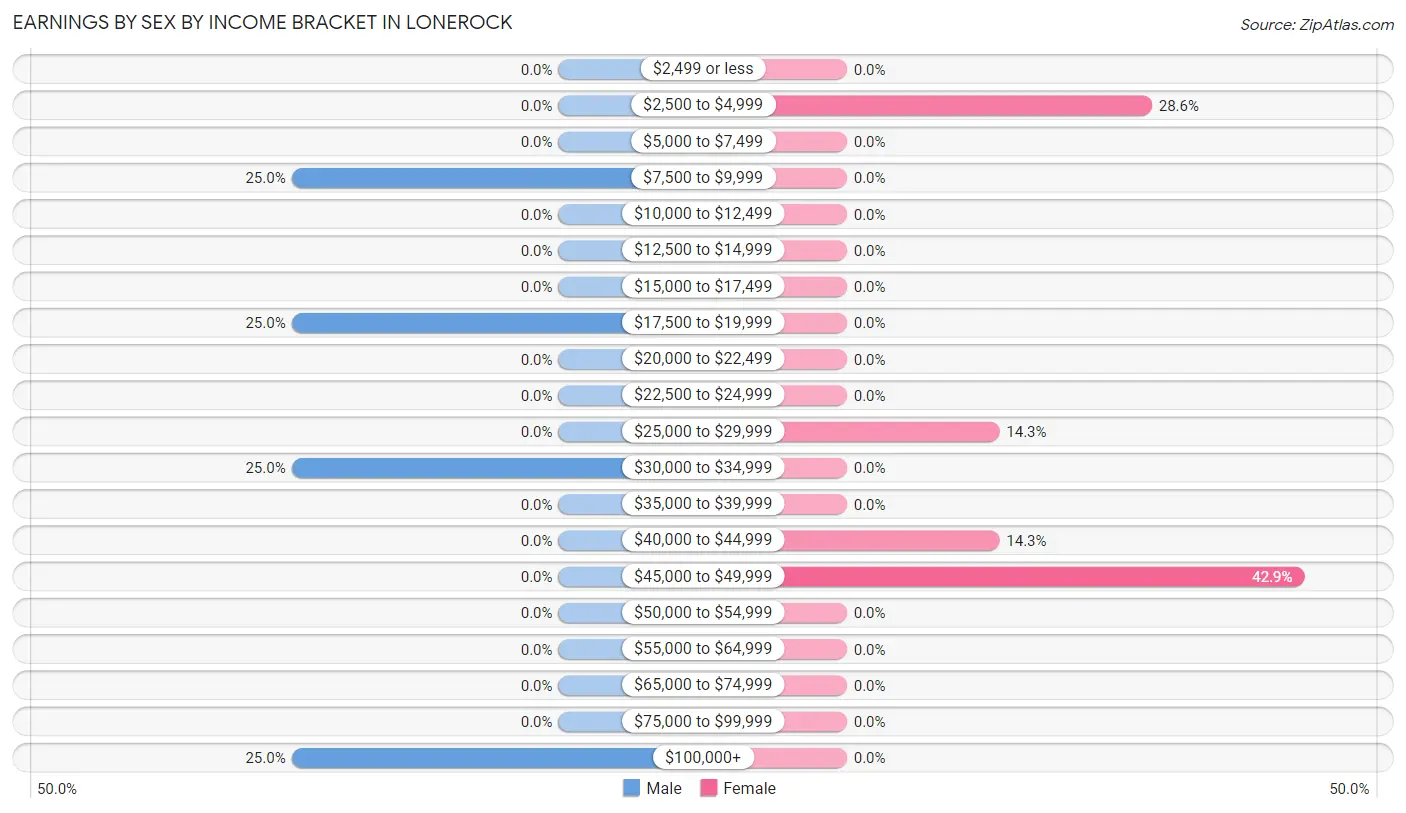
| Income | Male | Female |
| $2,499 or less | 0 (0.0%) | 0 (0.0%) |
| $2,500 to $4,999 | 0 (0.0%) | 2 (28.6%) |
| $5,000 to $7,499 | 0 (0.0%) | 0 (0.0%) |
| $7,500 to $9,999 | 1 (25.0%) | 0 (0.0%) |
| $10,000 to $12,499 | 0 (0.0%) | 0 (0.0%) |
| $12,500 to $14,999 | 0 (0.0%) | 0 (0.0%) |
| $15,000 to $17,499 | 0 (0.0%) | 0 (0.0%) |
| $17,500 to $19,999 | 1 (25.0%) | 0 (0.0%) |
| $20,000 to $22,499 | 0 (0.0%) | 0 (0.0%) |
| $22,500 to $24,999 | 0 (0.0%) | 0 (0.0%) |
| $25,000 to $29,999 | 0 (0.0%) | 1 (14.3%) |
| $30,000 to $34,999 | 1 (25.0%) | 0 (0.0%) |
| $35,000 to $39,999 | 0 (0.0%) | 0 (0.0%) |
| $40,000 to $44,999 | 0 (0.0%) | 1 (14.3%) |
| $45,000 to $49,999 | 0 (0.0%) | 3 (42.9%) |
| $50,000 to $54,999 | 0 (0.0%) | 0 (0.0%) |
| $55,000 to $64,999 | 0 (0.0%) | 0 (0.0%) |
| $65,000 to $74,999 | 0 (0.0%) | 0 (0.0%) |
| $75,000 to $99,999 | 0 (0.0%) | 0 (0.0%) |
| $100,000+ | 1 (25.0%) | 0 (0.0%) |
| Total | 4 (100.0%) | 7 (100.0%) |
Earnings by Sex by Educational Attainment in Lonerock
| Educational Attainment | Male Income | Female Income |
| Less than High School | - | - |
| High School Diploma | - | - |
| College or Associate's Degree | - | - |
| Bachelor's Degree | - | - |
| Graduate Degree | - | - |
| Total | - | - |
Family Income in Lonerock
Family Income Brackets in Lonerock
According to the Lonerock family income data, there are 2 families falling into the $200,000+ income range, which is the most common income bracket and makes up 40.0% of all families.
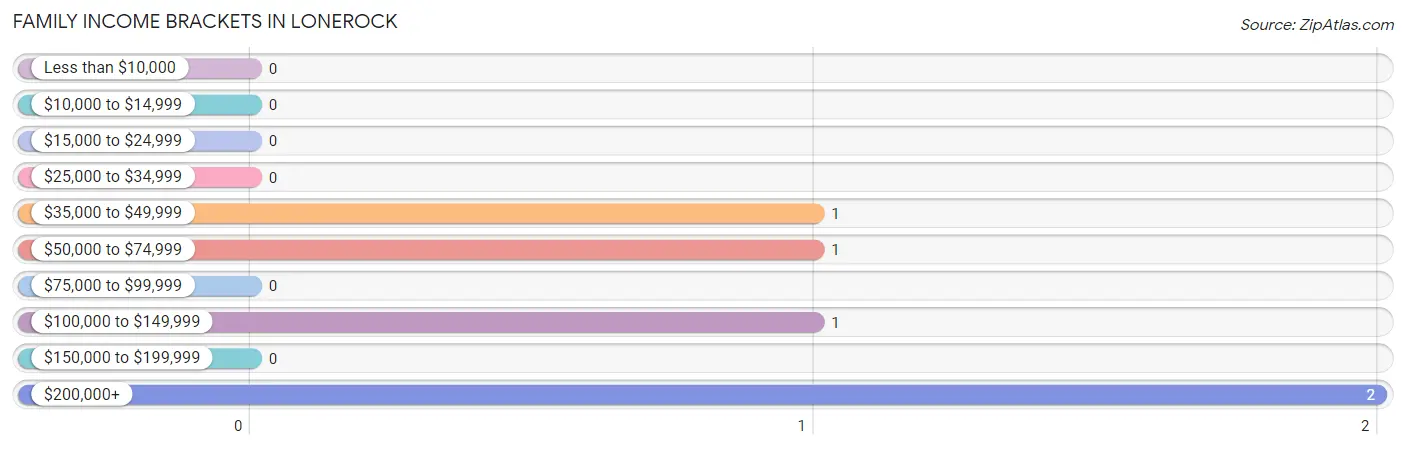
| Income Bracket | # Families | % Families |
| Less than $10,000 | 0 | 0.0% |
| $10,000 to $14,999 | 0 | 0.0% |
| $15,000 to $24,999 | 0 | 0.0% |
| $25,000 to $34,999 | 0 | 0.0% |
| $35,000 to $49,999 | 1 | 20.0% |
| $50,000 to $74,999 | 1 | 20.0% |
| $75,000 to $99,999 | 0 | 0.0% |
| $100,000 to $149,999 | 1 | 20.0% |
| $150,000 to $199,999 | 0 | 0.0% |
| $200,000+ | 2 | 40.0% |
Family Income by Famaliy Size in Lonerock
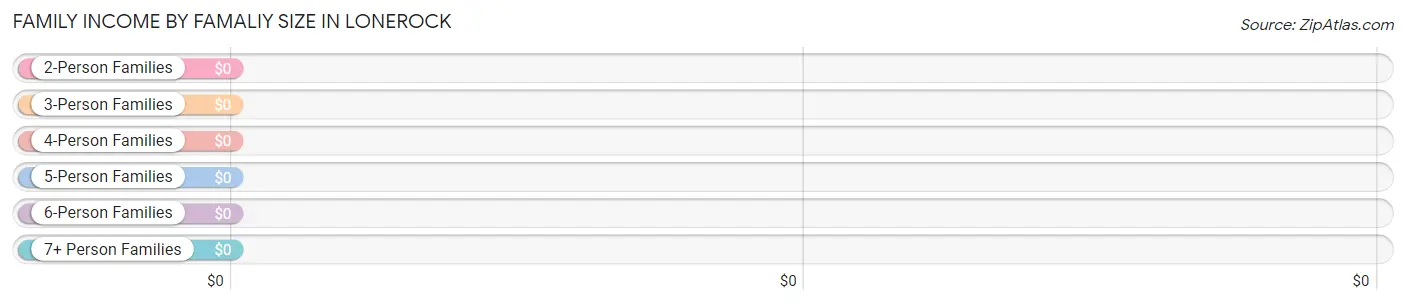
| Income Bracket | # Families | Median Income |
| 2-Person Families | 5 (100.0%) | $0 |
| 3-Person Families | 0 (0.0%) | $0 |
| 4-Person Families | 0 (0.0%) | $0 |
| 5-Person Families | 0 (0.0%) | $0 |
| 6-Person Families | 0 (0.0%) | $0 |
| 7+ Person Families | 0 (0.0%) | $0 |
| Total | 5 (100.0%) | $0 |
Family Income by Number of Earners in Lonerock
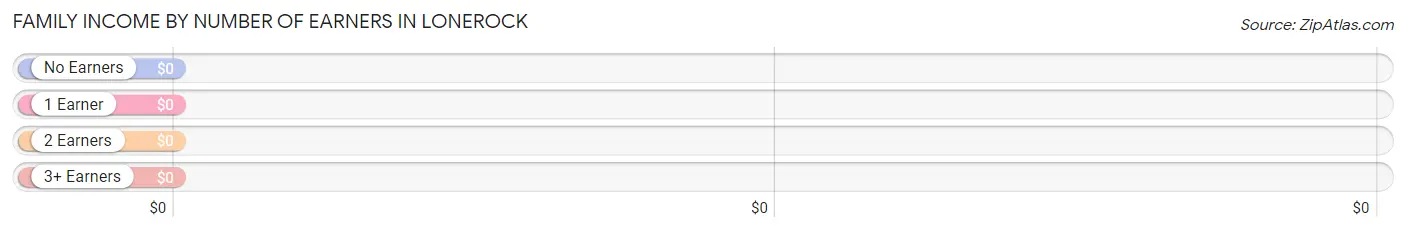
| Number of Earners | # Families | Median Income |
| No Earners | 1 (20.0%) | $0 |
| 1 Earner | 0 (0.0%) | $0 |
| 2 Earners | 4 (80.0%) | $0 |
| 3+ Earners | 0 (0.0%) | $0 |
| Total | 5 (100.0%) | $0 |
Household Income in Lonerock
Household Income Brackets in Lonerock
With 4 households falling in the category, the $15,000 to $24,999 income range is the most frequent in Lonerock, accounting for 33.3% of all households.
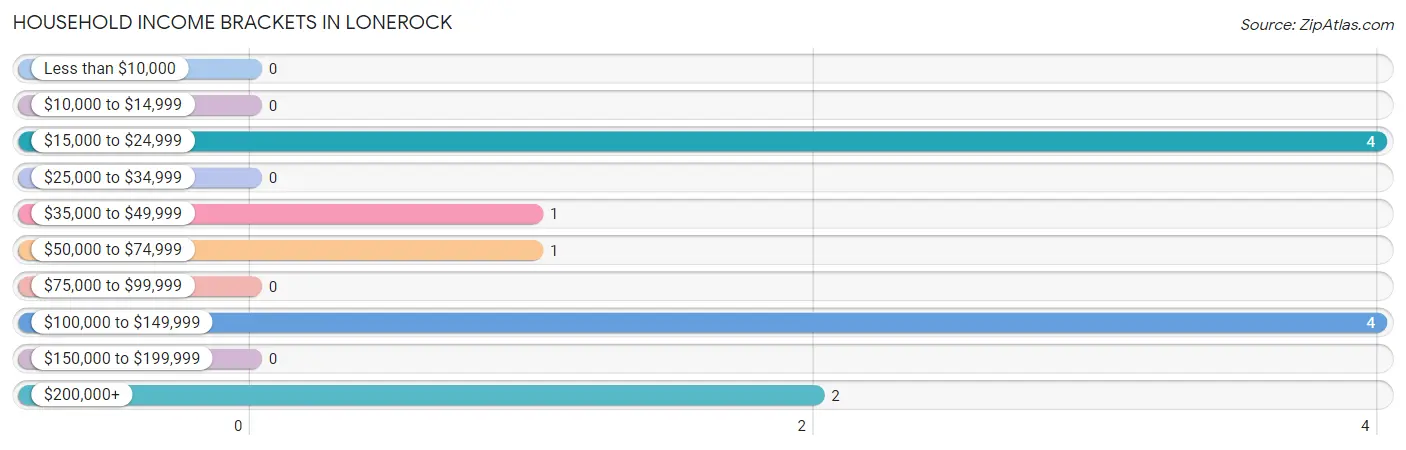
| Income Bracket | # Households | % Households |
| Less than $10,000 | 0 | 0.0% |
| $10,000 to $14,999 | 0 | 0.0% |
| $15,000 to $24,999 | 4 | 33.3% |
| $25,000 to $34,999 | 0 | 0.0% |
| $35,000 to $49,999 | 1 | 8.3% |
| $50,000 to $74,999 | 1 | 8.3% |
| $75,000 to $99,999 | 0 | 0.0% |
| $100,000 to $149,999 | 4 | 33.3% |
| $150,000 to $199,999 | 0 | 0.0% |
| $200,000+ | 2 | 16.7% |
Household Income by Householder Age in Lonerock
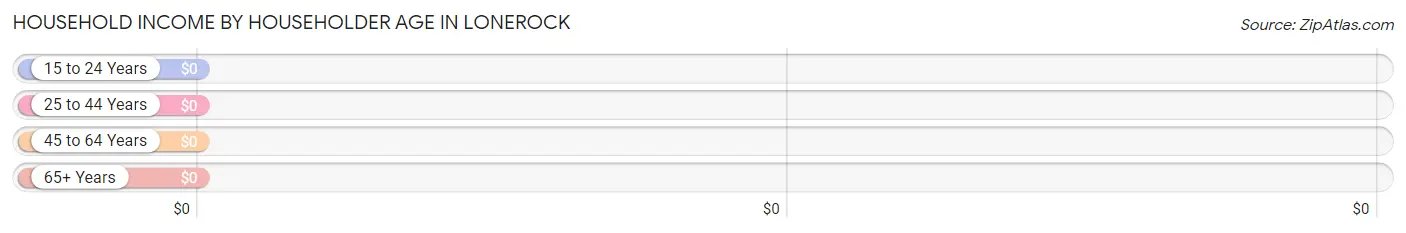
| Income Bracket | # Households | Median Income |
| 15 to 24 Years | 0 (0.0%) | $0 |
| 25 to 44 Years | 0 (0.0%) | $0 |
| 45 to 64 Years | 6 (50.0%) | $0 |
| 65+ Years | 6 (50.0%) | $0 |
| Total | 12 (100.0%) | $0 |
Poverty in Lonerock
Income Below Poverty by Sex and Age in Lonerock
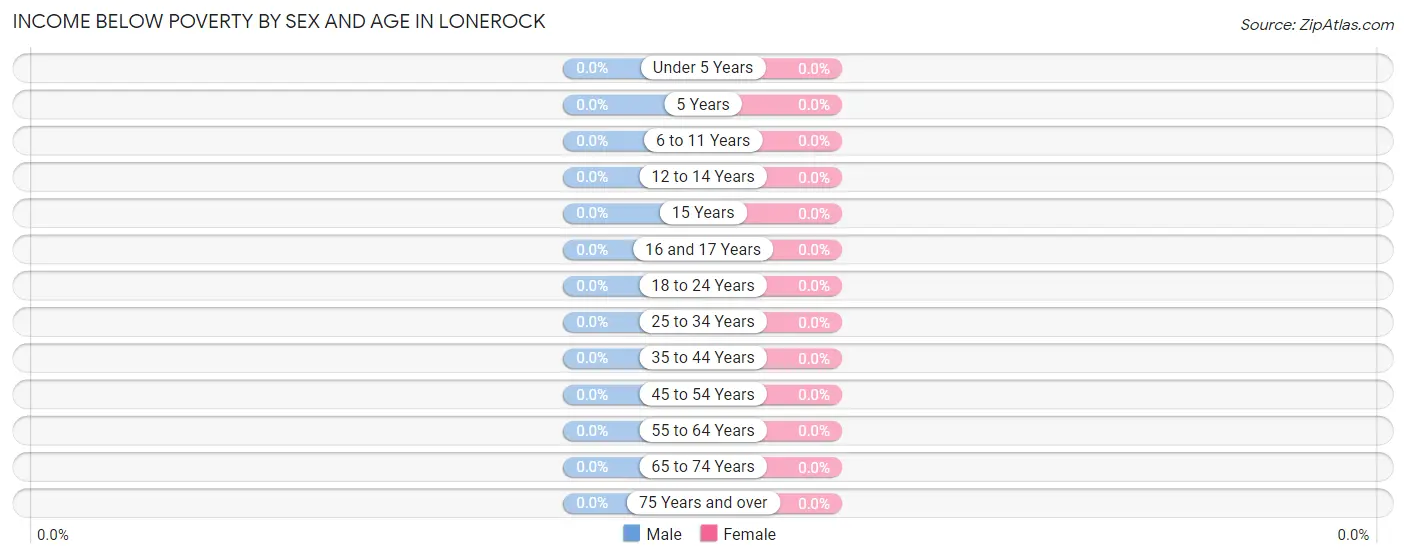
| Age Bracket | Male | Female |
| Under 5 Years | 0 (0.0%) | 0 (0.0%) |
| 5 Years | 0 (0.0%) | 0 (0.0%) |
| 6 to 11 Years | 0 (0.0%) | 0 (0.0%) |
| 12 to 14 Years | 0 (0.0%) | 0 (0.0%) |
| 15 Years | 0 (0.0%) | 0 (0.0%) |
| 16 and 17 Years | 0 (0.0%) | 0 (0.0%) |
| 18 to 24 Years | 0 (0.0%) | 0 (0.0%) |
| 25 to 34 Years | 0 (0.0%) | 0 (0.0%) |
| 35 to 44 Years | 0 (0.0%) | 0 (0.0%) |
| 45 to 54 Years | 0 (0.0%) | 0 (0.0%) |
| 55 to 64 Years | 0 (0.0%) | 0 (0.0%) |
| 65 to 74 Years | 0 (0.0%) | 0 (0.0%) |
| 75 Years and over | 0 (0.0%) | 0 (0.0%) |
| Total | 0 (0.0%) | 0 (0.0%) |
Income Above Poverty by Sex and Age in Lonerock
According to the poverty statistics in Lonerock, males aged 55 to 64 years and females aged 45 to 54 years are the age groups that are most secure financially, with 100.0% of males and 100.0% of females in these age groups living above the poverty line.
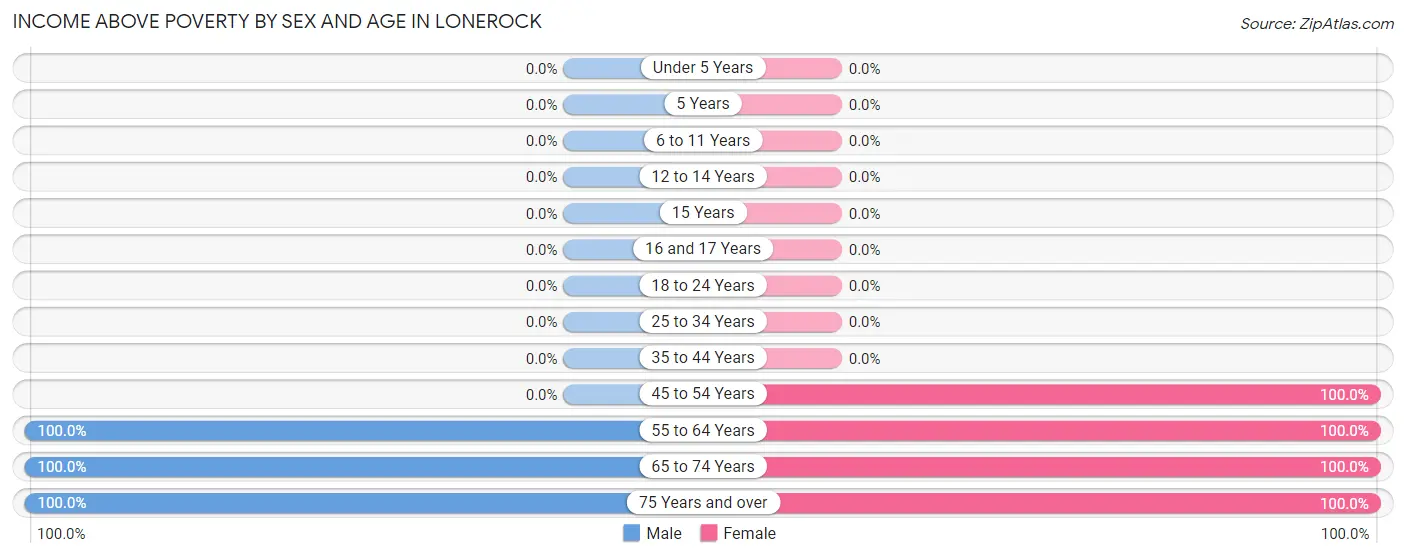
| Age Bracket | Male | Female |
| Under 5 Years | 0 (0.0%) | 0 (0.0%) |
| 5 Years | 0 (0.0%) | 0 (0.0%) |
| 6 to 11 Years | 0 (0.0%) | 0 (0.0%) |
| 12 to 14 Years | 0 (0.0%) | 0 (0.0%) |
| 15 Years | 0 (0.0%) | 0 (0.0%) |
| 16 and 17 Years | 0 (0.0%) | 0 (0.0%) |
| 18 to 24 Years | 0 (0.0%) | 0 (0.0%) |
| 25 to 34 Years | 0 (0.0%) | 0 (0.0%) |
| 35 to 44 Years | 0 (0.0%) | 0 (0.0%) |
| 45 to 54 Years | 0 (0.0%) | 3 (100.0%) |
| 55 to 64 Years | 1 (100.0%) | 3 (100.0%) |
| 65 to 74 Years | 2 (100.0%) | 1 (100.0%) |
| 75 Years and over | 3 (100.0%) | 5 (100.0%) |
| Total | 6 (100.0%) | 12 (100.0%) |
Income Below Poverty Among Married-Couple Families in Lonerock
| Children | Above Poverty | Below Poverty |
| No Children | 5 (100.0%) | 0 (0.0%) |
| 1 or 2 Children | 0 (0.0%) | 0 (0.0%) |
| 3 or 4 Children | 0 (0.0%) | 0 (0.0%) |
| 5 or more Children | 0 (0.0%) | 0 (0.0%) |
| Total | 5 (100.0%) | 0 (0.0%) |
Income Below Poverty Among Single-Parent Households in Lonerock
| Children | Single Father | Single Mother |
| No Children | 0 (0.0%) | 0 (0.0%) |
| 1 or 2 Children | 0 (0.0%) | 0 (0.0%) |
| 3 or 4 Children | 0 (0.0%) | 0 (0.0%) |
| 5 or more Children | 0 (0.0%) | 0 (0.0%) |
| Total | 0 (0.0%) | 0 (0.0%) |
Income Below Poverty Among Married-Couple vs Single-Parent Households in Lonerock
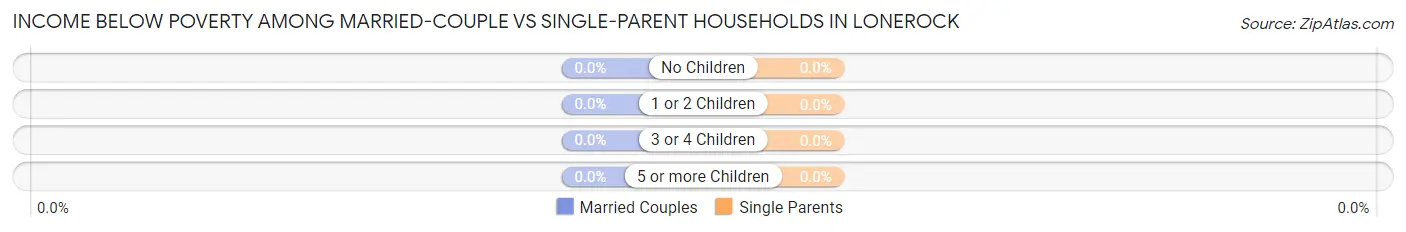
| Children | Married-Couple Families | Single-Parent Households |
| No Children | 0 (0.0%) | 0 (0.0%) |
| 1 or 2 Children | 0 (0.0%) | 0 (0.0%) |
| 3 or 4 Children | 0 (0.0%) | 0 (0.0%) |
| 5 or more Children | 0 (0.0%) | 0 (0.0%) |
| Total | 0 (0.0%) | 0 (0.0%) |
Race in Lonerock
The most populous races in Lonerock are White / Caucasian (18 | 100.0%), and Hispanic or Latino (1 | 5.6%).
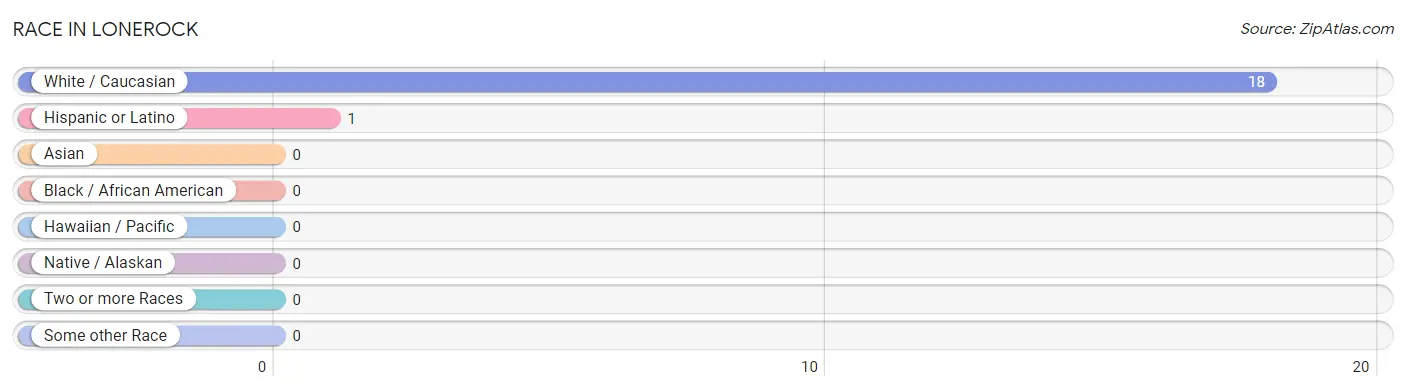
| Race | # Population | % Population |
| Asian | 0 | 0.0% |
| Black / African American | 0 | 0.0% |
| Hawaiian / Pacific | 0 | 0.0% |
| Hispanic or Latino | 1 | 5.6% |
| Native / Alaskan | 0 | 0.0% |
| White / Caucasian | 18 | 100.0% |
| Two or more Races | 0 | 0.0% |
| Some other Race | 0 | 0.0% |
| Total | 18 | 100.0% |
Ancestry in Lonerock
The most populous ancestries reported in Lonerock are Irish (5 | 27.8%), Norwegian (4 | 22.2%), Scotch-Irish (4 | 22.2%), English (3 | 16.7%), and European (1 | 5.6%), together accounting for 94.4% of all Lonerock residents.
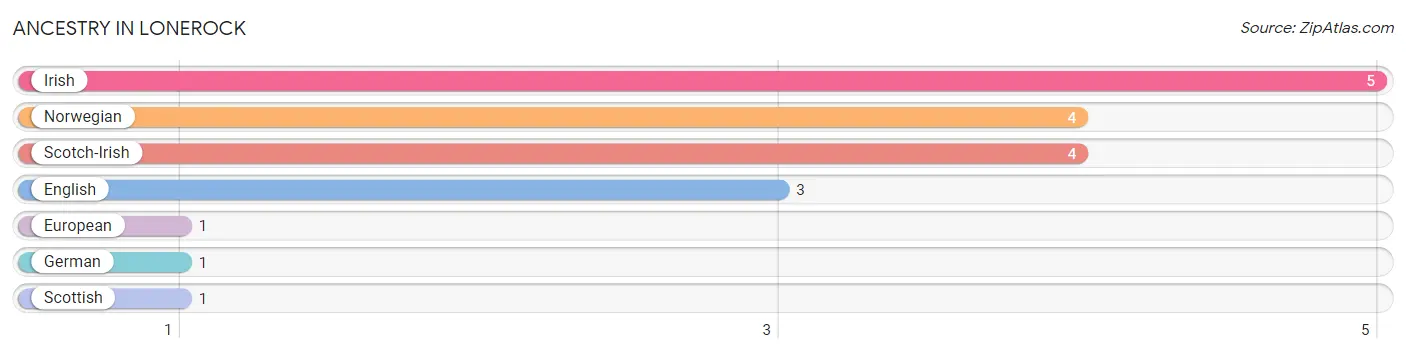
| Ancestry | # Population | % Population |
| English | 3 | 16.7% |
| European | 1 | 5.6% |
| German | 1 | 5.6% |
| Irish | 5 | 27.8% |
| Norwegian | 4 | 22.2% |
| Scotch-Irish | 4 | 22.2% |
| Scottish | 1 | 5.6% | View All 7 Rows |
Immigrants in Lonerock

| Immigration Origin | # Population | % Population | View All 0 Rows |
Sex and Age in Lonerock
Sex and Age in Lonerock
The most populous age groups in Lonerock are 65 to 69 Years (2 | 33.3%) for men and 85 Years and over (4 | 33.3%) for women.
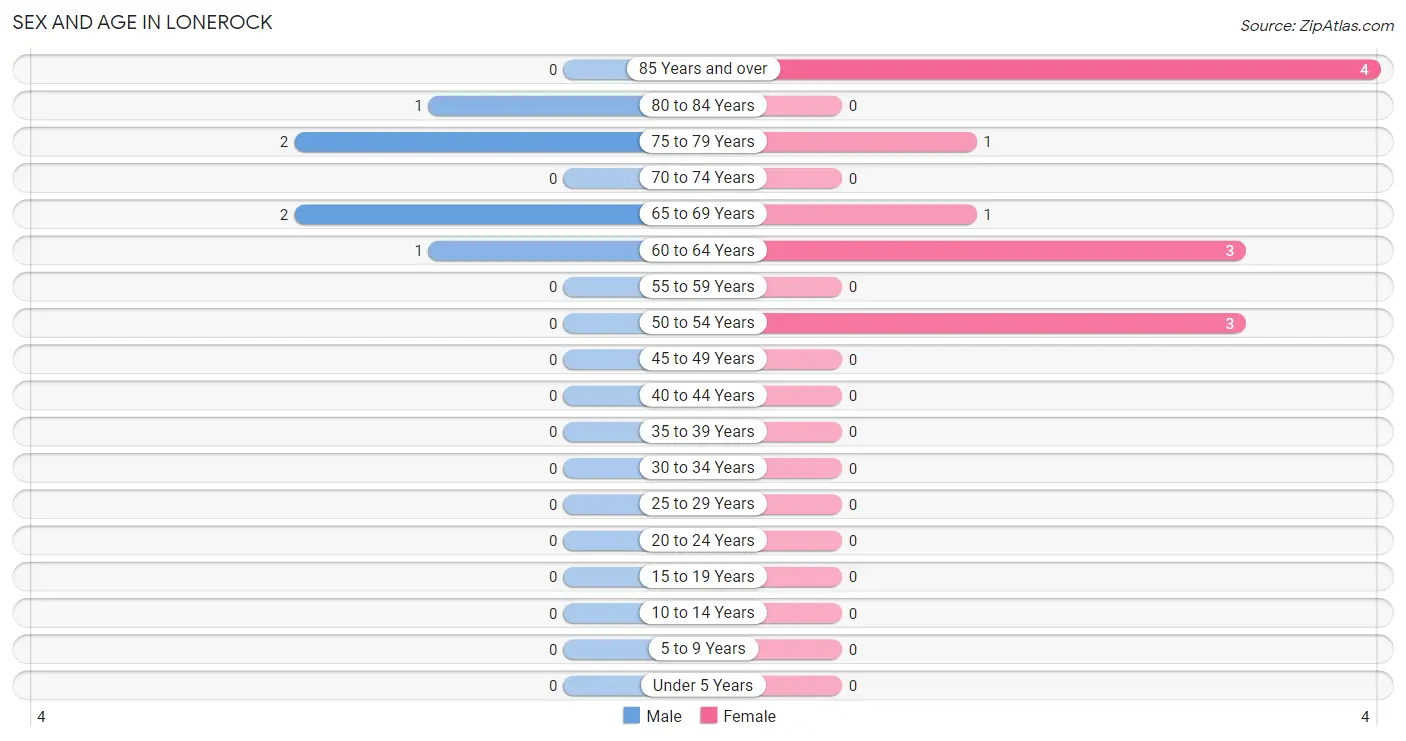
| Age Bracket | Male | Female |
| Under 5 Years | 0 (0.0%) | 0 (0.0%) |
| 5 to 9 Years | 0 (0.0%) | 0 (0.0%) |
| 10 to 14 Years | 0 (0.0%) | 0 (0.0%) |
| 15 to 19 Years | 0 (0.0%) | 0 (0.0%) |
| 20 to 24 Years | 0 (0.0%) | 0 (0.0%) |
| 25 to 29 Years | 0 (0.0%) | 0 (0.0%) |
| 30 to 34 Years | 0 (0.0%) | 0 (0.0%) |
| 35 to 39 Years | 0 (0.0%) | 0 (0.0%) |
| 40 to 44 Years | 0 (0.0%) | 0 (0.0%) |
| 45 to 49 Years | 0 (0.0%) | 0 (0.0%) |
| 50 to 54 Years | 0 (0.0%) | 3 (25.0%) |
| 55 to 59 Years | 0 (0.0%) | 0 (0.0%) |
| 60 to 64 Years | 1 (16.7%) | 3 (25.0%) |
| 65 to 69 Years | 2 (33.3%) | 1 (8.3%) |
| 70 to 74 Years | 0 (0.0%) | 0 (0.0%) |
| 75 to 79 Years | 2 (33.3%) | 1 (8.3%) |
| 80 to 84 Years | 1 (16.7%) | 0 (0.0%) |
| 85 Years and over | 0 (0.0%) | 4 (33.3%) |
| Total | 6 (100.0%) | 12 (100.0%) |
Families and Households in Lonerock
Median Family Size in Lonerock
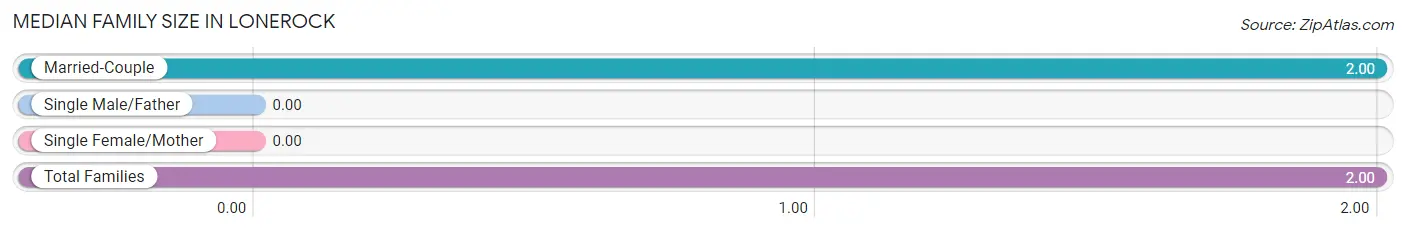
| Family Type | # Families | Family Size |
| Married-Couple | 5 (100.0%) | 2.00 |
| Single Male/Father | 0 (0.0%) | - |
| Single Female/Mother | 0 (0.0%) | - |
| Total Families | 5 (100.0%) | 2.00 |
Median Household Size in Lonerock
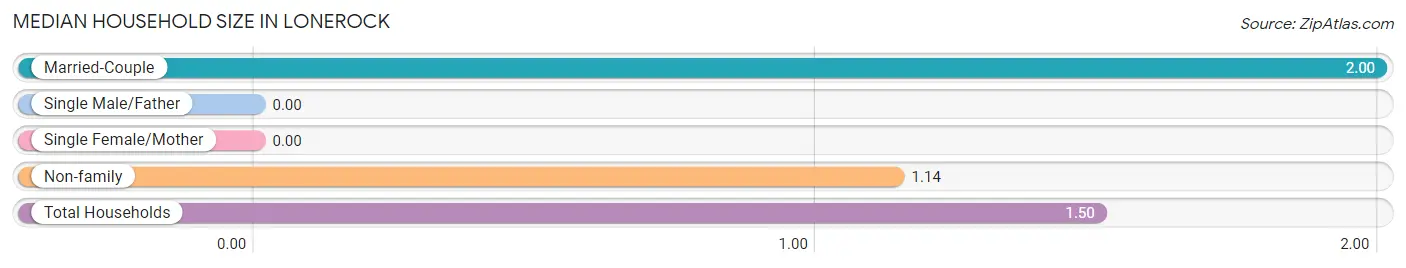
| Household Type | # Households | Household Size |
| Married-Couple | 5 (41.7%) | 2.00 |
| Single Male/Father | 0 (0.0%) | - |
| Single Female/Mother | 0 (0.0%) | - |
| Non-family | 7 (58.3%) | 1.14 |
| Total Households | 12 (100.0%) | 1.50 |
Household Size by Marriage Status in Lonerock
Out of a total of 12 households in Lonerock, 5 (41.7%) are family households, while 7 (58.3%) are nonfamily households. The most numerous type of family households are 2-person households, comprising 5, and the most common type of nonfamily households are 1-person households, comprising 4.
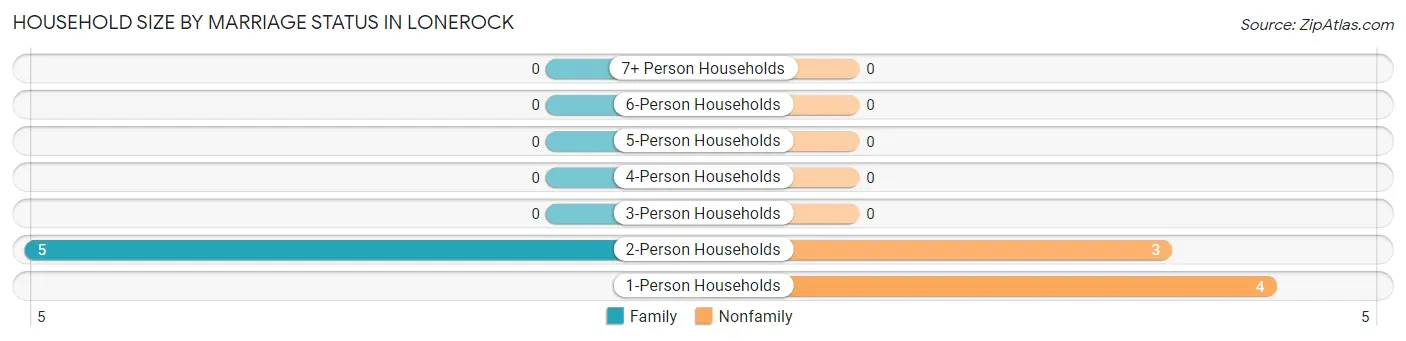
| Household Size | Family Households | Nonfamily Households |
| 1-Person Households | - | 4 (33.3%) |
| 2-Person Households | 5 (41.7%) | 3 (25.0%) |
| 3-Person Households | 0 (0.0%) | 0 (0.0%) |
| 4-Person Households | 0 (0.0%) | 0 (0.0%) |
| 5-Person Households | 0 (0.0%) | 0 (0.0%) |
| 6-Person Households | 0 (0.0%) | 0 (0.0%) |
| 7+ Person Households | 0 (0.0%) | 0 (0.0%) |
| Total | 5 (41.7%) | 7 (58.3%) |
Female Fertility in Lonerock
Fertility by Age in Lonerock
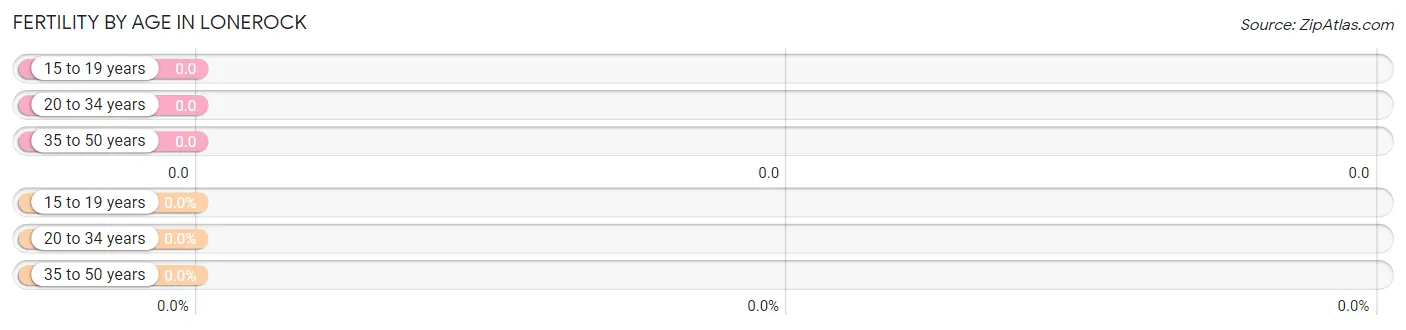
| Age Bracket | Women with Births | Births / 1,000 Women |
| 15 to 19 years | 0 (0.0%) | 0.0 |
| 20 to 34 years | 0 (0.0%) | 0.0 |
| 35 to 50 years | 0 (0.0%) | 0.0 |
| Total | 0 (0.0%) | 0.0 |
Fertility by Age by Marriage Status in Lonerock
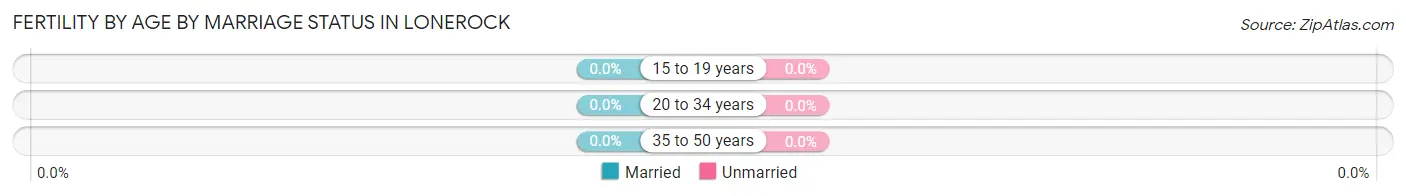
| Age Bracket | Married | Unmarried |
| 15 to 19 years | 0 (0.0%) | 0 (0.0%) |
| 20 to 34 years | 0 (0.0%) | 0 (0.0%) |
| 35 to 50 years | 0 (0.0%) | 0 (0.0%) |
| Total | 0 (0.0%) | 0 (0.0%) |
Fertility by Education in Lonerock
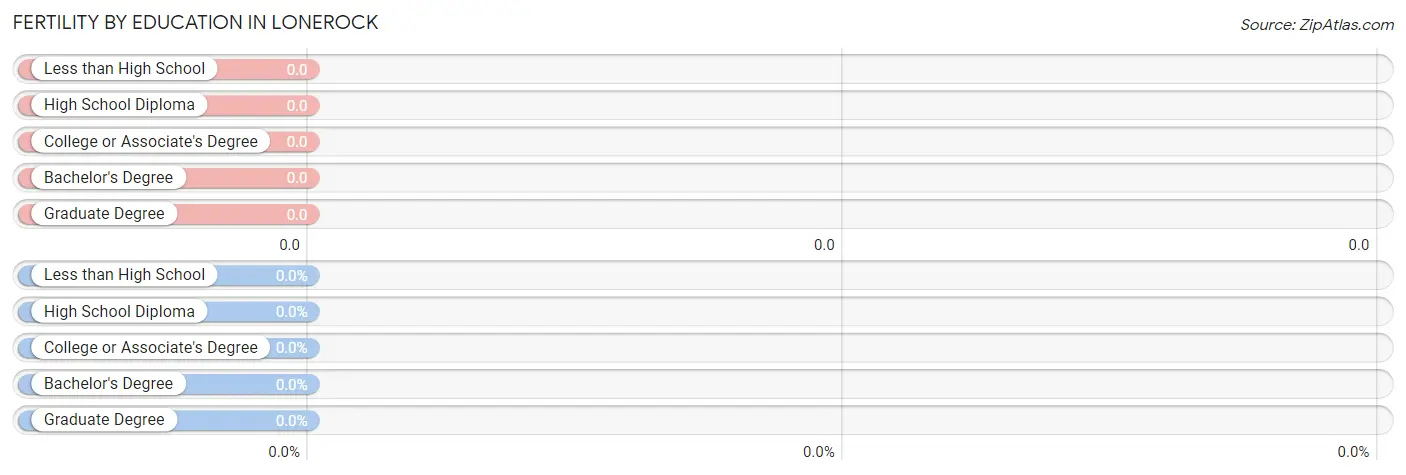
| Educational Attainment | Women with Births | Births / 1,000 Women |
| Less than High School | 0 (0.0%) | 0.0 |
| High School Diploma | 0 (0.0%) | 0.0 |
| College or Associate's Degree | 0 (0.0%) | 0.0 |
| Bachelor's Degree | 0 (0.0%) | 0.0 |
| Graduate Degree | 0 (0.0%) | 0.0 |
| Total | 0 (0.0%) | 0.0 |
Fertility by Education by Marriage Status in Lonerock
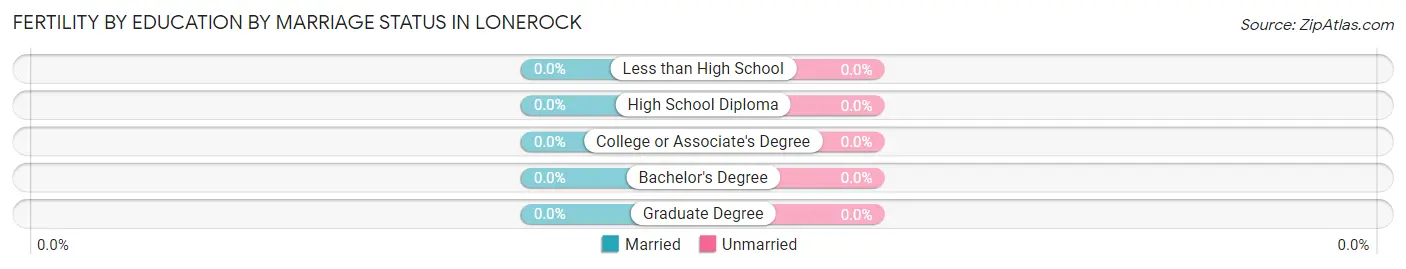
| Educational Attainment | Married | Unmarried |
| Less than High School | 0 (0.0%) | 0 (0.0%) |
| High School Diploma | 0 (0.0%) | 0 (0.0%) |
| College or Associate's Degree | 0 (0.0%) | 0 (0.0%) |
| Bachelor's Degree | 0 (0.0%) | 0 (0.0%) |
| Graduate Degree | 0 (0.0%) | 0 (0.0%) |
| Total | 0 (0.0%) | 0 (0.0%) |
Employment Characteristics in Lonerock
Employment by Class of Employer in Lonerock
Among the 7 employed individuals in Lonerock, private company employees (3 | 42.9%), not-for-profit organizations (3 | 42.9%), and federal government employees (1 | 14.3%) make up the most common classes of employment.
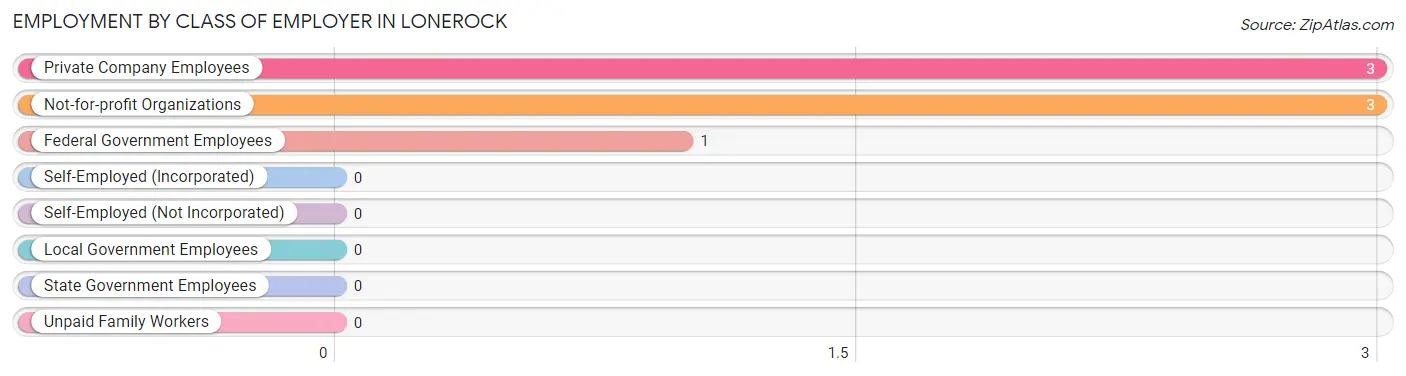
| Employer Class | # Employees | % Employees |
| Private Company Employees | 3 | 42.9% |
| Self-Employed (Incorporated) | 0 | 0.0% |
| Self-Employed (Not Incorporated) | 0 | 0.0% |
| Not-for-profit Organizations | 3 | 42.9% |
| Local Government Employees | 0 | 0.0% |
| State Government Employees | 0 | 0.0% |
| Federal Government Employees | 1 | 14.3% |
| Unpaid Family Workers | 0 | 0.0% |
| Total | 7 | 100.0% |
Employment Status by Age in Lonerock
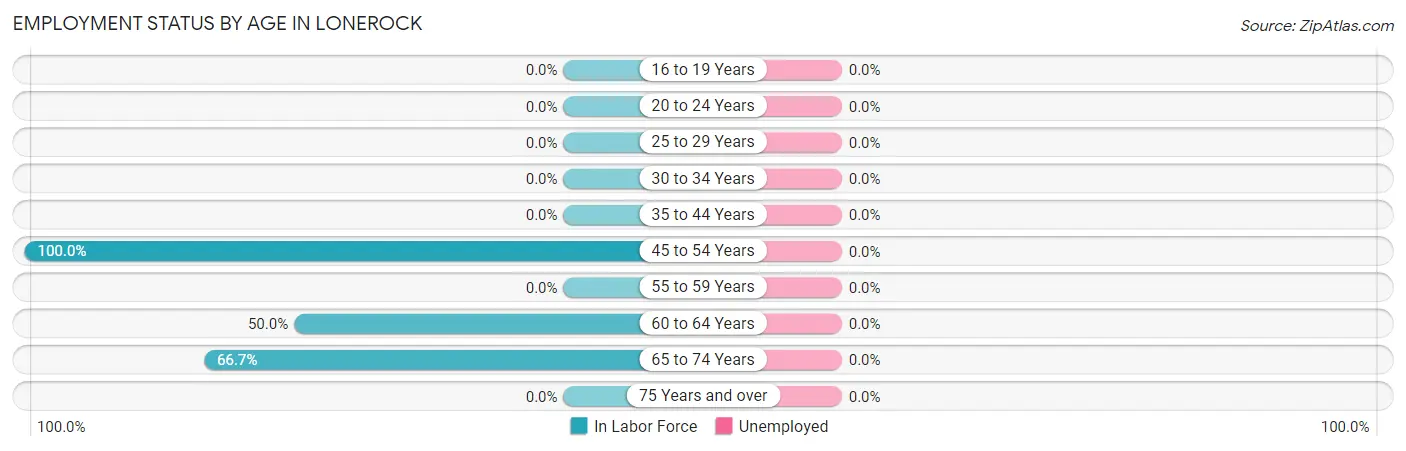
| Age Bracket | In Labor Force | Unemployed |
| 16 to 19 Years | 0 (0.0%) | 0 (0.0%) |
| 20 to 24 Years | 0 (0.0%) | 0 (0.0%) |
| 25 to 29 Years | 0 (0.0%) | 0 (0.0%) |
| 30 to 34 Years | 0 (0.0%) | 0 (0.0%) |
| 35 to 44 Years | 0 (0.0%) | 0 (0.0%) |
| 45 to 54 Years | 3 (100.0%) | 0 (0.0%) |
| 55 to 59 Years | 0 (0.0%) | 0 (0.0%) |
| 60 to 64 Years | 2 (50.0%) | 0 (0.0%) |
| 65 to 74 Years | 2 (66.7%) | 0 (0.0%) |
| 75 Years and over | 0 (0.0%) | 0 (0.0%) |
| Total | 7 (38.9%) | 0 (0.0%) |
Employment Status by Educational Attainment in Lonerock
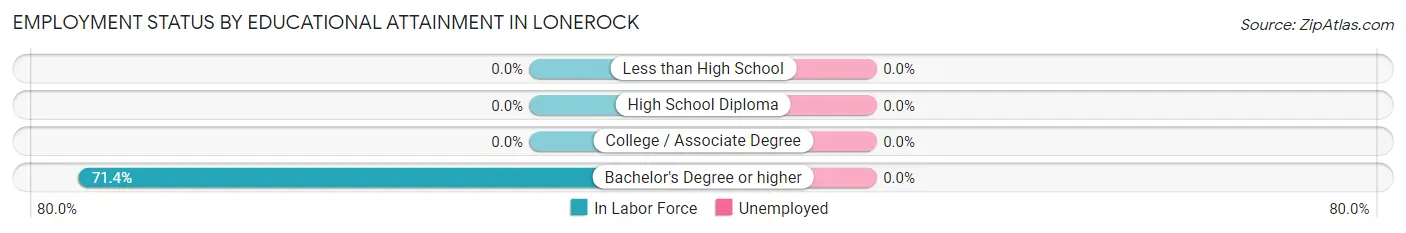
| Educational Attainment | In Labor Force | Unemployed |
| Less than High School | 0 (0.0%) | 0 (0.0%) |
| High School Diploma | 0 (0.0%) | 0 (0.0%) |
| College / Associate Degree | 0 (0.0%) | 0 (0.0%) |
| Bachelor's Degree or higher | 5 (71.4%) | 0 (0.0%) |
| Total | 5 (71.4%) | 0 (0.0%) |
Employment Occupations by Sex in Lonerock
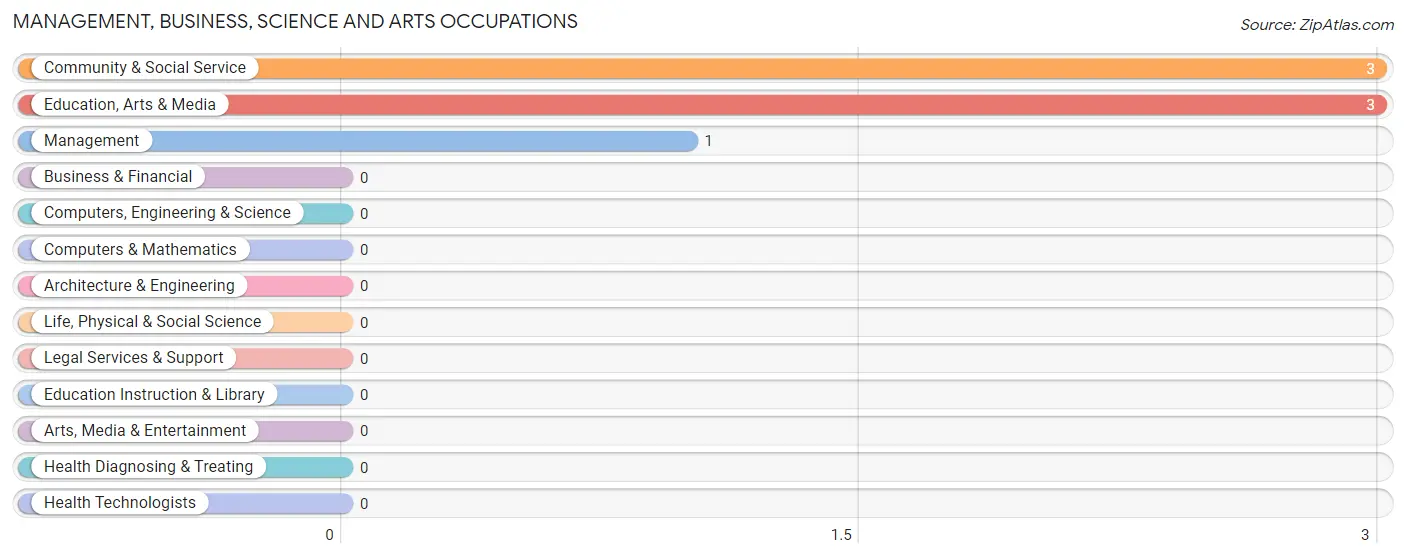
Management, Business, Science and Arts Occupations
The most common Management, Business, Science and Arts occupations in Lonerock are Community & Social Service (3 | 42.9%), Education, Arts & Media (3 | 42.9%), and Management (1 | 14.3%).
Management, Business, Science and Arts Occupations by Sex
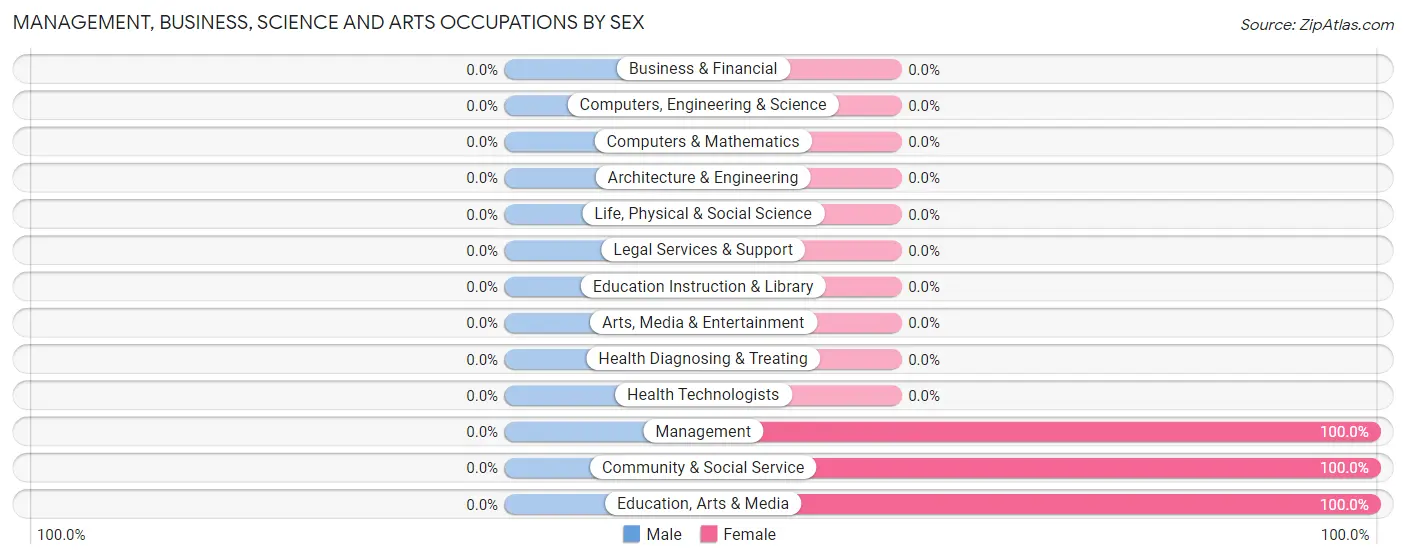
| Occupation | Male | Female |
| Management | 0 (0.0%) | 1 (100.0%) |
| Business & Financial | 0 (0.0%) | 0 (0.0%) |
| Computers, Engineering & Science | 0 (0.0%) | 0 (0.0%) |
| Computers & Mathematics | 0 (0.0%) | 0 (0.0%) |
| Architecture & Engineering | 0 (0.0%) | 0 (0.0%) |
| Life, Physical & Social Science | 0 (0.0%) | 0 (0.0%) |
| Community & Social Service | 0 (0.0%) | 3 (100.0%) |
| Education, Arts & Media | 0 (0.0%) | 3 (100.0%) |
| Legal Services & Support | 0 (0.0%) | 0 (0.0%) |
| Education Instruction & Library | 0 (0.0%) | 0 (0.0%) |
| Arts, Media & Entertainment | 0 (0.0%) | 0 (0.0%) |
| Health Diagnosing & Treating | 0 (0.0%) | 0 (0.0%) |
| Health Technologists | 0 (0.0%) | 0 (0.0%) |
| Total (Category) | 0 (0.0%) | 4 (100.0%) |
| Total (Overall) | 2 (28.6%) | 5 (71.4%) |
Services Occupations
The most common Services occupations in Lonerock are , and Healthcare Support (1 | 14.3%).
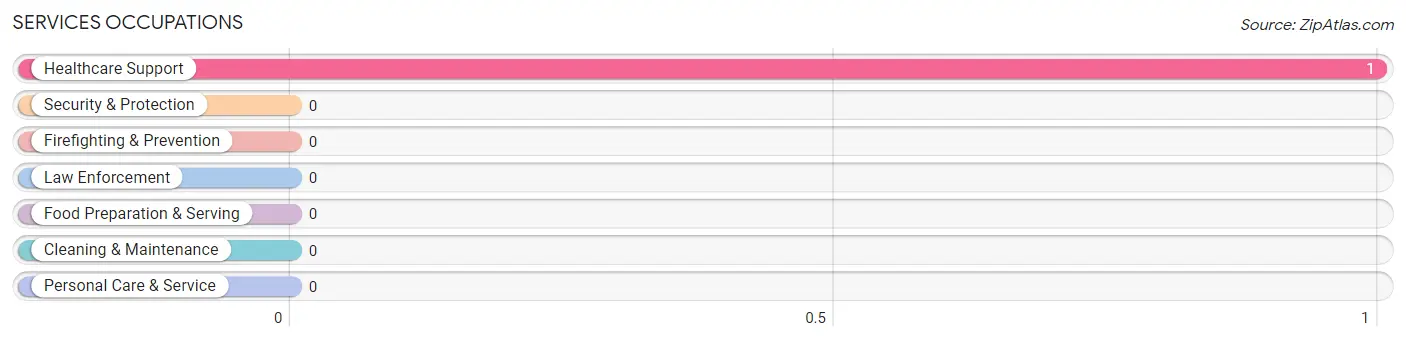
Services Occupations by Sex
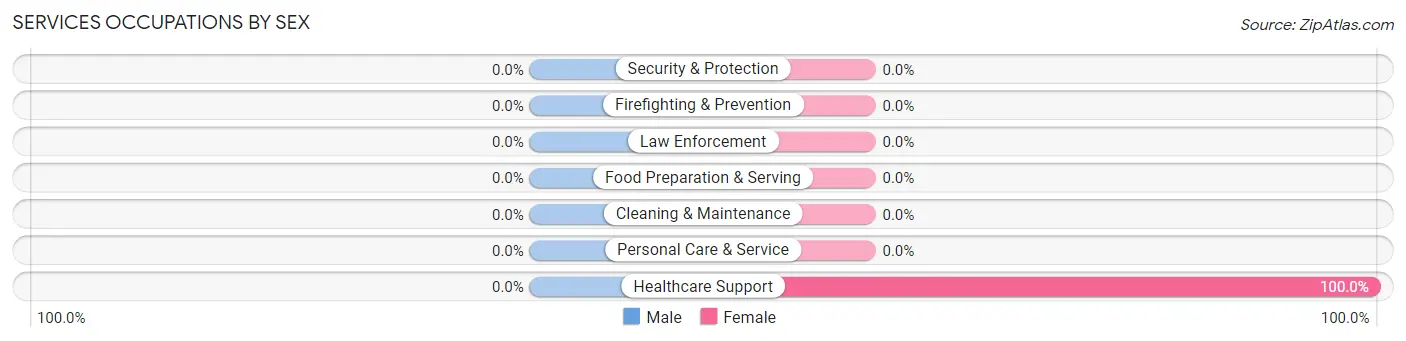
| Occupation | Male | Female |
| Healthcare Support | 0 (0.0%) | 1 (100.0%) |
| Security & Protection | 0 (0.0%) | 0 (0.0%) |
| Firefighting & Prevention | 0 (0.0%) | 0 (0.0%) |
| Law Enforcement | 0 (0.0%) | 0 (0.0%) |
| Food Preparation & Serving | 0 (0.0%) | 0 (0.0%) |
| Cleaning & Maintenance | 0 (0.0%) | 0 (0.0%) |
| Personal Care & Service | 0 (0.0%) | 0 (0.0%) |
| Total (Category) | 0 (0.0%) | 1 (100.0%) |
| Total (Overall) | 2 (28.6%) | 5 (71.4%) |
Sales and Office Occupations
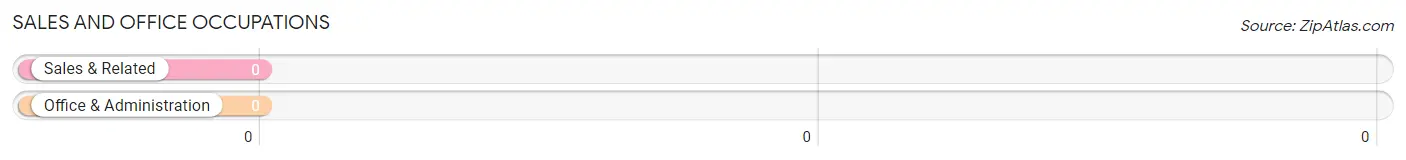
Sales and Office Occupations by Sex
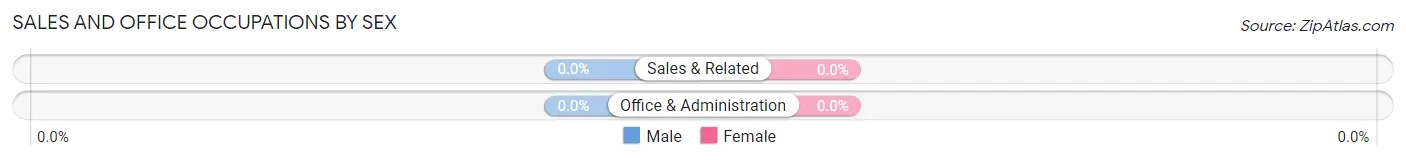
| Occupation | Male | Female |
| Sales & Related | 0 (0.0%) | 0 (0.0%) |
| Office & Administration | 0 (0.0%) | 0 (0.0%) |
| Total (Category) | 0 (0.0%) | 0 (0.0%) |
| Total (Overall) | 2 (28.6%) | 5 (71.4%) |
Natural Resources, Construction and Maintenance Occupations
The most common Natural Resources, Construction and Maintenance occupations in Lonerock are , and Farming, Fishing & Forestry (1 | 14.3%).
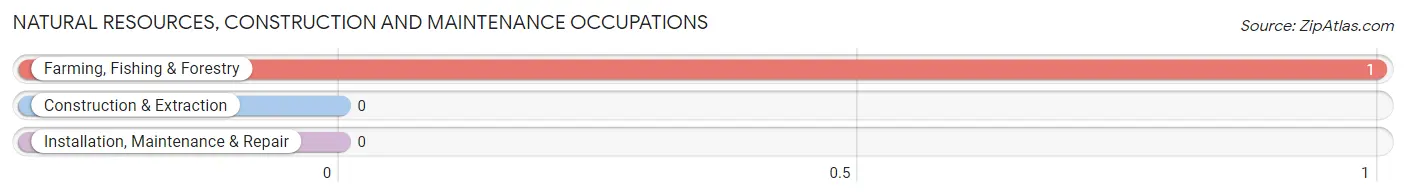
Natural Resources, Construction and Maintenance Occupations by Sex
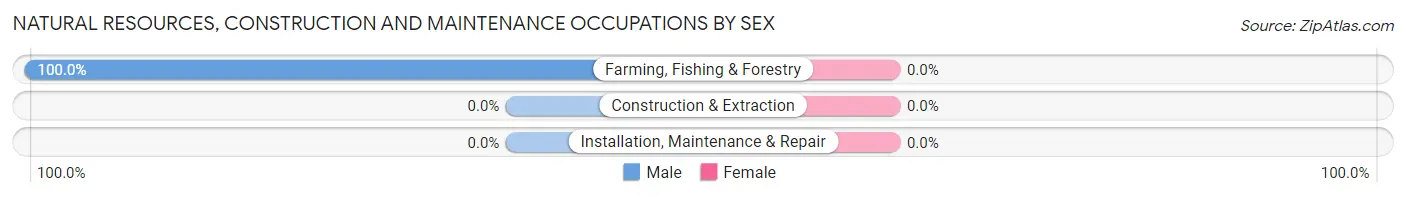
| Occupation | Male | Female |
| Farming, Fishing & Forestry | 1 (100.0%) | 0 (0.0%) |
| Construction & Extraction | 0 (0.0%) | 0 (0.0%) |
| Installation, Maintenance & Repair | 0 (0.0%) | 0 (0.0%) |
| Total (Category) | 1 (100.0%) | 0 (0.0%) |
| Total (Overall) | 2 (28.6%) | 5 (71.4%) |
Production, Transportation and Moving Occupations
The most common Production, Transportation and Moving occupations in Lonerock are , and Transportation (1 | 14.3%).
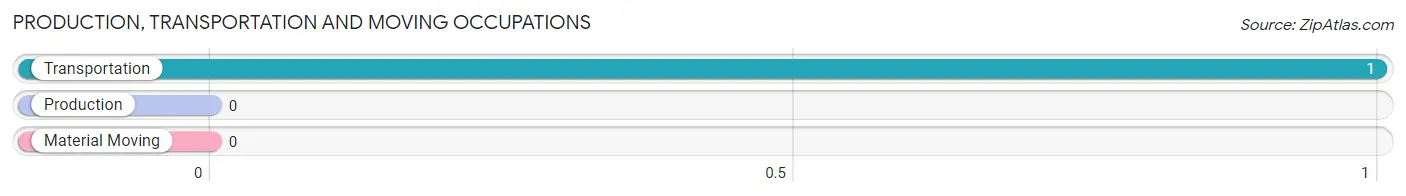
Production, Transportation and Moving Occupations by Sex
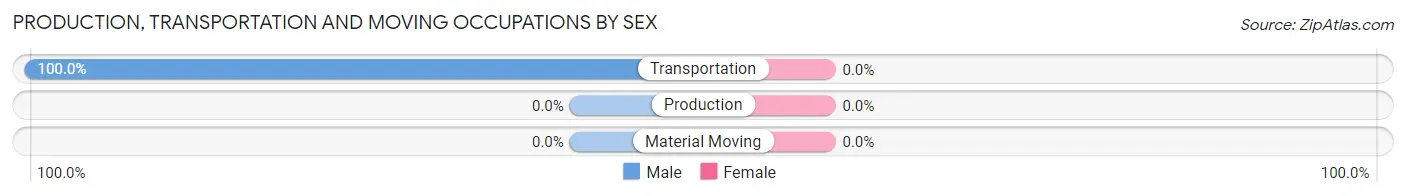
| Occupation | Male | Female |
| Production | 0 (0.0%) | 0 (0.0%) |
| Transportation | 1 (100.0%) | 0 (0.0%) |
| Material Moving | 0 (0.0%) | 0 (0.0%) |
| Total (Category) | 1 (100.0%) | 0 (0.0%) |
| Total (Overall) | 2 (28.6%) | 5 (71.4%) |
Employment Industries by Sex in Lonerock
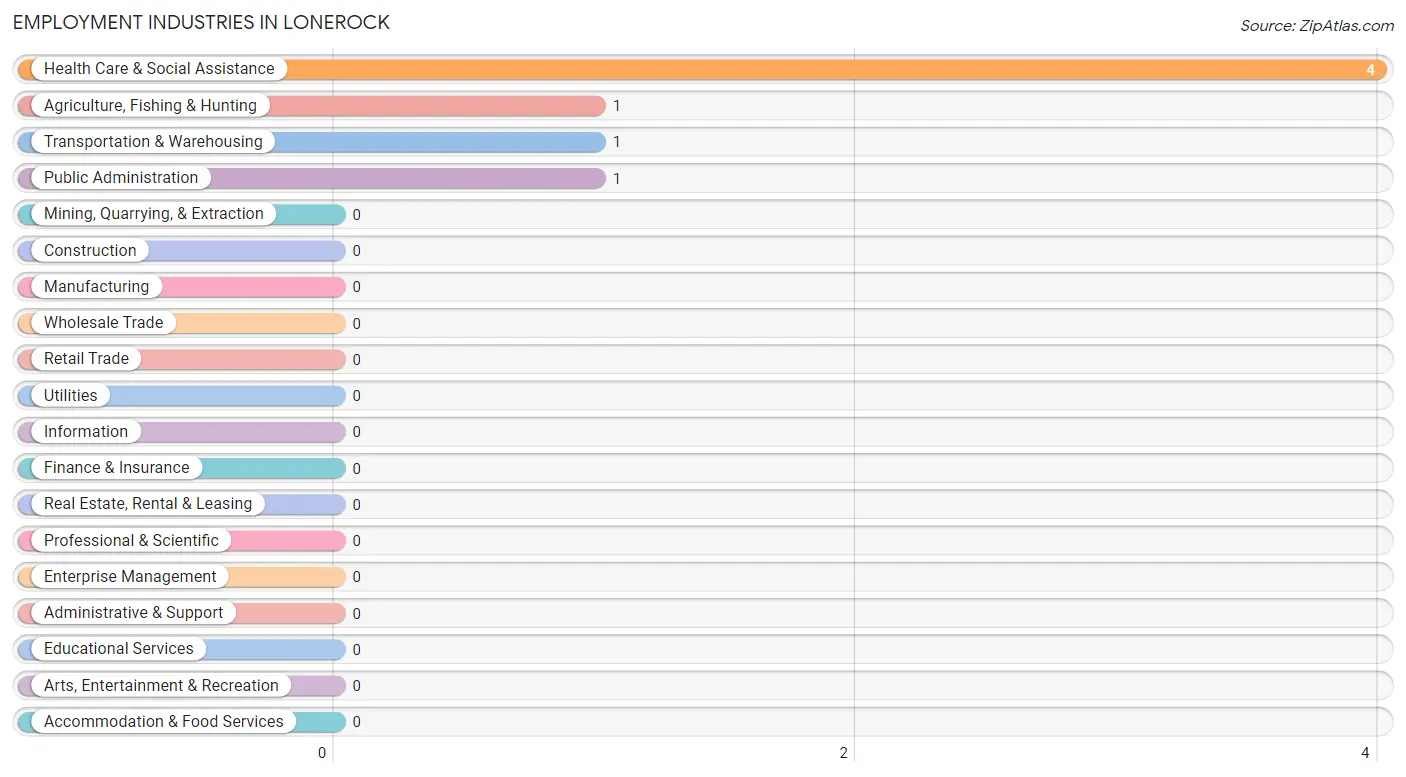
Employment Industries in Lonerock
The major employment industries in Lonerock include Health Care & Social Assistance (4 | 57.1%), Agriculture, Fishing & Hunting (1 | 14.3%), Transportation & Warehousing (1 | 14.3%), and Public Administration (1 | 14.3%).
Employment Industries by Sex in Lonerock
The Lonerock industries that see more men than women are Agriculture, Fishing & Hunting (100.0%), and Transportation & Warehousing (100.0%), whereas the industries that tend to have a higher number of women are Health Care & Social Assistance (100.0%), and Public Administration (100.0%).
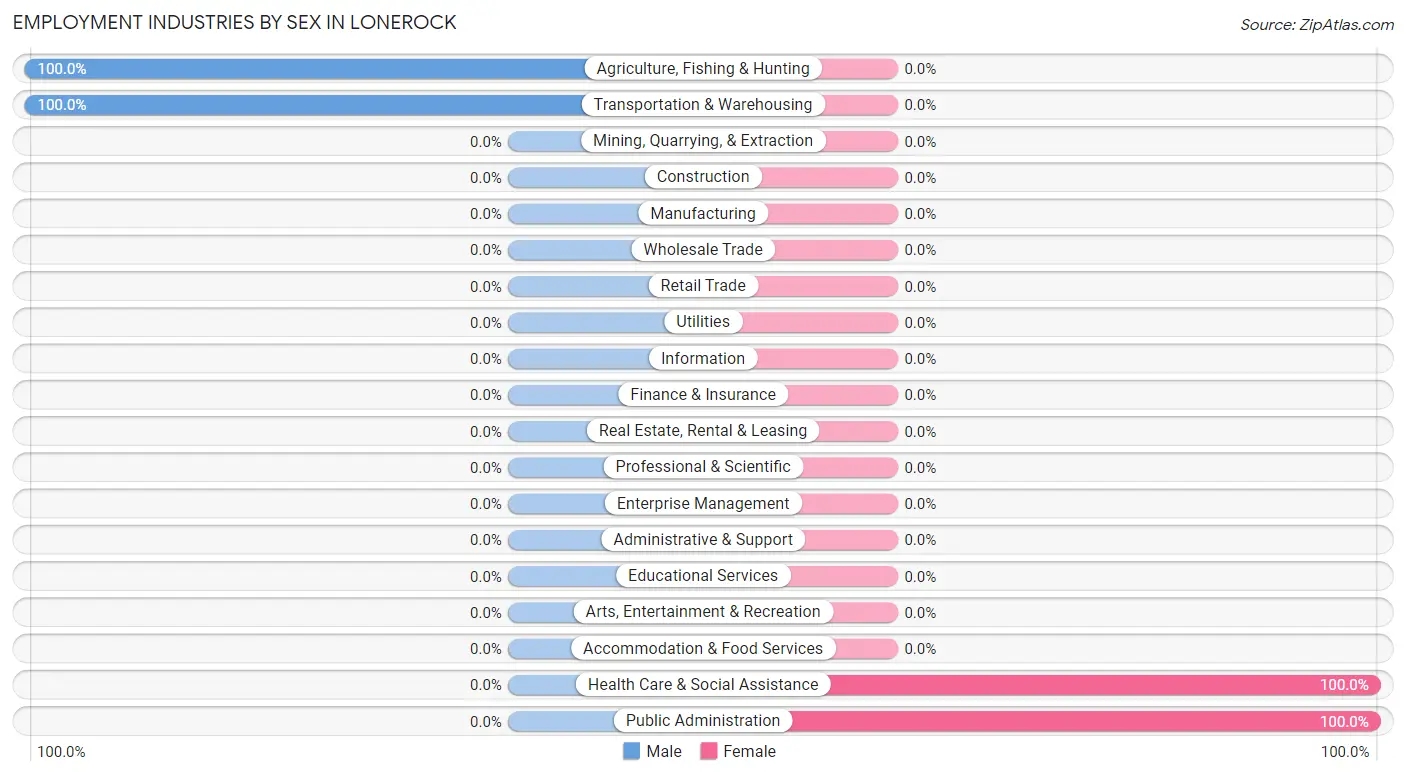
| Industry | Male | Female |
| Agriculture, Fishing & Hunting | 1 (100.0%) | 0 (0.0%) |
| Mining, Quarrying, & Extraction | 0 (0.0%) | 0 (0.0%) |
| Construction | 0 (0.0%) | 0 (0.0%) |
| Manufacturing | 0 (0.0%) | 0 (0.0%) |
| Wholesale Trade | 0 (0.0%) | 0 (0.0%) |
| Retail Trade | 0 (0.0%) | 0 (0.0%) |
| Transportation & Warehousing | 1 (100.0%) | 0 (0.0%) |
| Utilities | 0 (0.0%) | 0 (0.0%) |
| Information | 0 (0.0%) | 0 (0.0%) |
| Finance & Insurance | 0 (0.0%) | 0 (0.0%) |
| Real Estate, Rental & Leasing | 0 (0.0%) | 0 (0.0%) |
| Professional & Scientific | 0 (0.0%) | 0 (0.0%) |
| Enterprise Management | 0 (0.0%) | 0 (0.0%) |
| Administrative & Support | 0 (0.0%) | 0 (0.0%) |
| Educational Services | 0 (0.0%) | 0 (0.0%) |
| Health Care & Social Assistance | 0 (0.0%) | 4 (100.0%) |
| Arts, Entertainment & Recreation | 0 (0.0%) | 0 (0.0%) |
| Accommodation & Food Services | 0 (0.0%) | 0 (0.0%) |
| Public Administration | 0 (0.0%) | 1 (100.0%) |
| Total | 2 (28.6%) | 5 (71.4%) |
Education in Lonerock
School Enrollment in Lonerock
| School Level | # Students | % Students |
| Nursery / Preschool | 0 | 0.0% |
| Kindergarten | 0 | 0.0% |
| Elementary School | 0 | 0.0% |
| Middle School | 0 | 0.0% |
| High School | 0 | 0.0% |
| College / Undergraduate | 0 | 0.0% |
| Graduate / Professional | 0 | 0.0% |
| Total | 0 | 0.0% |
School Enrollment by Age by Funding Source in Lonerock
| Age Bracket | Public School | Private School |
| 3 to 4 Year Olds | 0 (0.0%) | 0 (0.0%) |
| 5 to 9 Year Old | 0 (0.0%) | 0 (0.0%) |
| 10 to 14 Year Olds | 0 (0.0%) | 0 (0.0%) |
| 15 to 17 Year Olds | 0 (0.0%) | 0 (0.0%) |
| 18 to 19 Year Olds | 0 (0.0%) | 0 (0.0%) |
| 20 to 24 Year Olds | 0 (0.0%) | 0 (0.0%) |
| 25 to 34 Year Olds | 0 (0.0%) | 0 (0.0%) |
| 35 Years and over | 0 (0.0%) | 0 (0.0%) |
| Total | 0 (0.0%) | 0 (0.0%) |
Educational Attainment by Field of Study in Lonerock
Liberal arts & history (4 | 44.4%), psychology (3 | 33.3%), bio, nature & agricultural (1 | 11.1%), and physical & health sciences (1 | 11.1%) are the most common fields of study among 9 individuals in Lonerock who have obtained a bachelor's degree or higher.
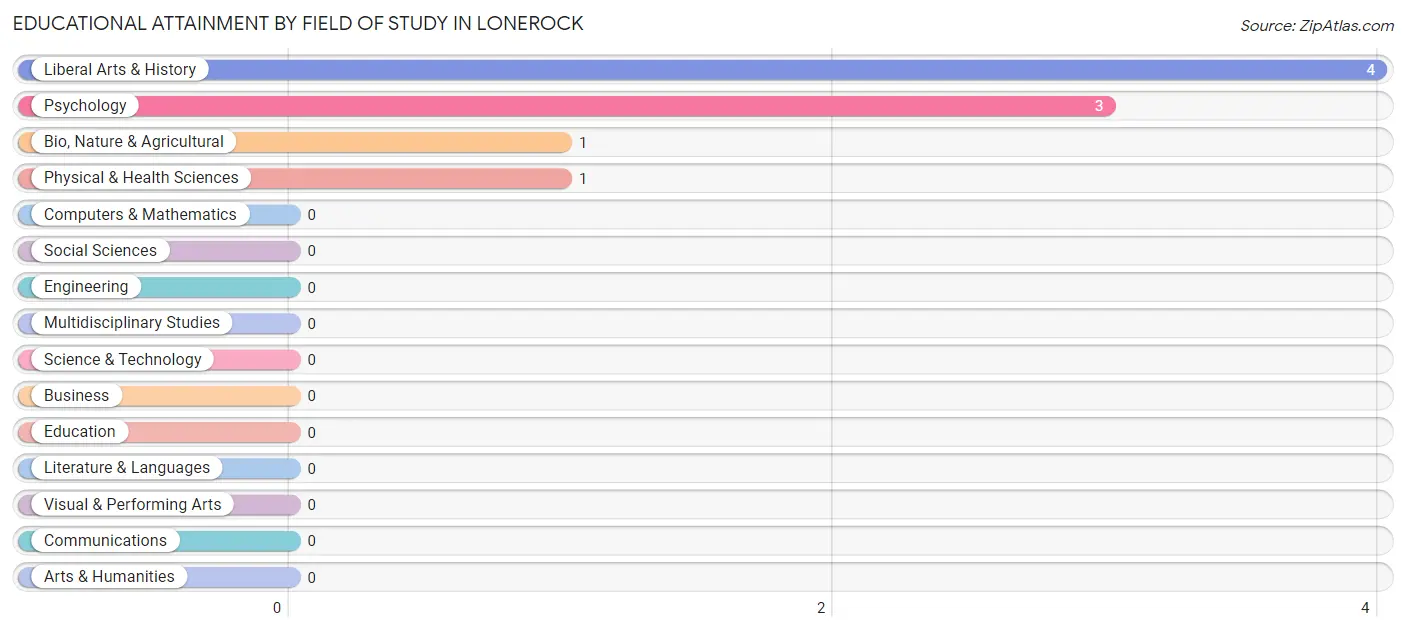
| Field of Study | # Graduates | % Graduates |
| Computers & Mathematics | 0 | 0.0% |
| Bio, Nature & Agricultural | 1 | 11.1% |
| Physical & Health Sciences | 1 | 11.1% |
| Psychology | 3 | 33.3% |
| Social Sciences | 0 | 0.0% |
| Engineering | 0 | 0.0% |
| Multidisciplinary Studies | 0 | 0.0% |
| Science & Technology | 0 | 0.0% |
| Business | 0 | 0.0% |
| Education | 0 | 0.0% |
| Literature & Languages | 0 | 0.0% |
| Liberal Arts & History | 4 | 44.4% |
| Visual & Performing Arts | 0 | 0.0% |
| Communications | 0 | 0.0% |
| Arts & Humanities | 0 | 0.0% |
| Total | 9 | 100.0% |
Transportation & Commute in Lonerock
Vehicle Availability by Sex in Lonerock
The most prevalent vehicle ownership categories in Lonerock are males with 3 vehicles (2, accounting for 100.0%) and females with 3 vehicles (4, making up 40.0%).
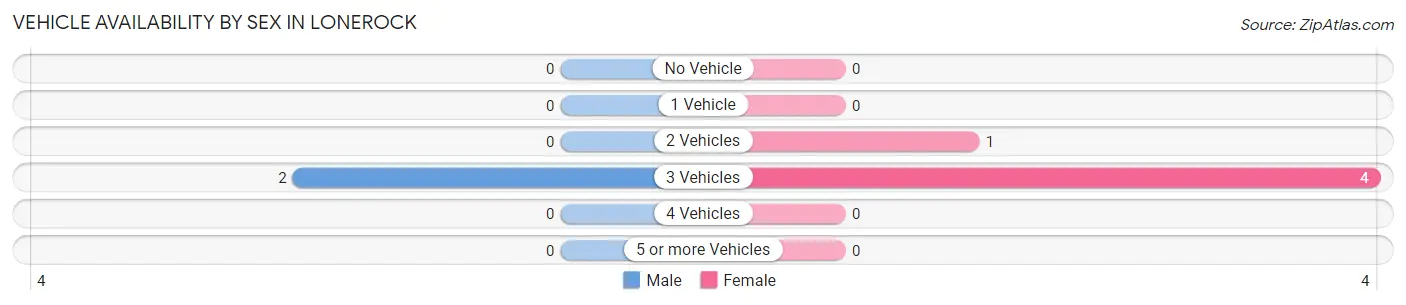
| Vehicles Available | Male | Female |
| No Vehicle | 0 (0.0%) | 0 (0.0%) |
| 1 Vehicle | 0 (0.0%) | 0 (0.0%) |
| 2 Vehicles | 0 (0.0%) | 1 (20.0%) |
| 3 Vehicles | 2 (100.0%) | 4 (80.0%) |
| 4 Vehicles | 0 (0.0%) | 0 (0.0%) |
| 5 or more Vehicles | 0 (0.0%) | 0 (0.0%) |
| Total | 2 (100.0%) | 5 (100.0%) |
Commute Time in Lonerock
The most frequently occuring commute durations in Lonerock are 60 to 89 minutes (3 commuters, 50.0%), less than 5 minutes (1 commuters, 16.7%), and 45 to 59 minutes (1 commuters, 16.7%).
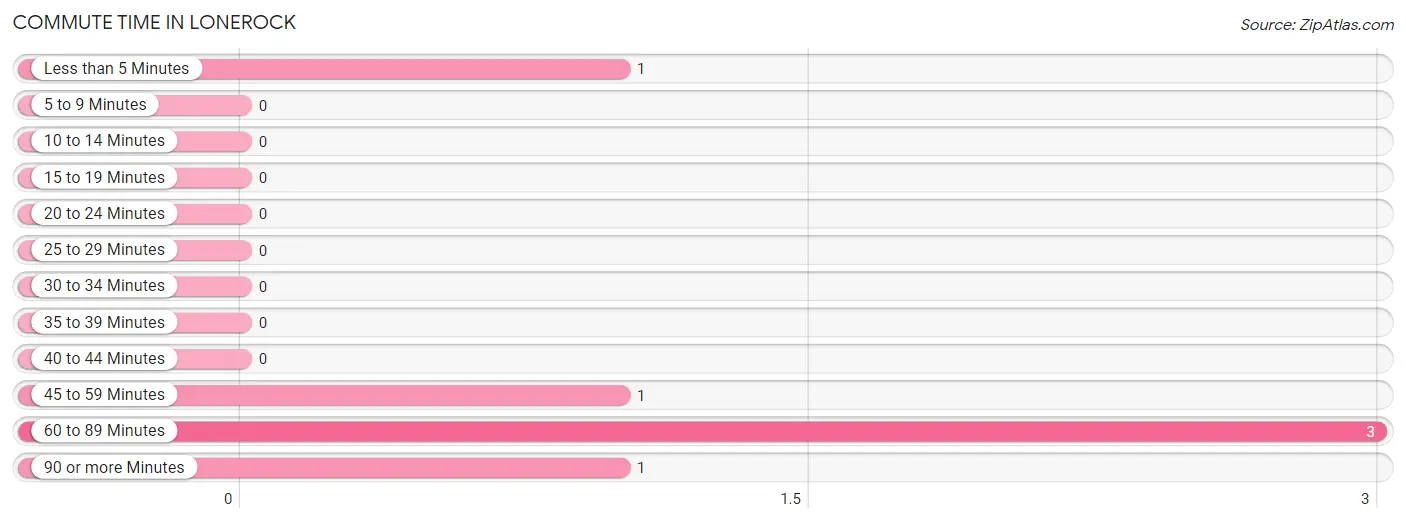
| Commute Time | # Commuters | % Commuters |
| Less than 5 Minutes | 1 | 16.7% |
| 5 to 9 Minutes | 0 | 0.0% |
| 10 to 14 Minutes | 0 | 0.0% |
| 15 to 19 Minutes | 0 | 0.0% |
| 20 to 24 Minutes | 0 | 0.0% |
| 25 to 29 Minutes | 0 | 0.0% |
| 30 to 34 Minutes | 0 | 0.0% |
| 35 to 39 Minutes | 0 | 0.0% |
| 40 to 44 Minutes | 0 | 0.0% |
| 45 to 59 Minutes | 1 | 16.7% |
| 60 to 89 Minutes | 3 | 50.0% |
| 90 or more Minutes | 1 | 16.7% |
Commute Time by Sex in Lonerock
The most common commute times in Lonerock are less than 5 minutes (1 commuters, 50.0%) for males and 60 to 89 minutes (3 commuters, 75.0%) for females.
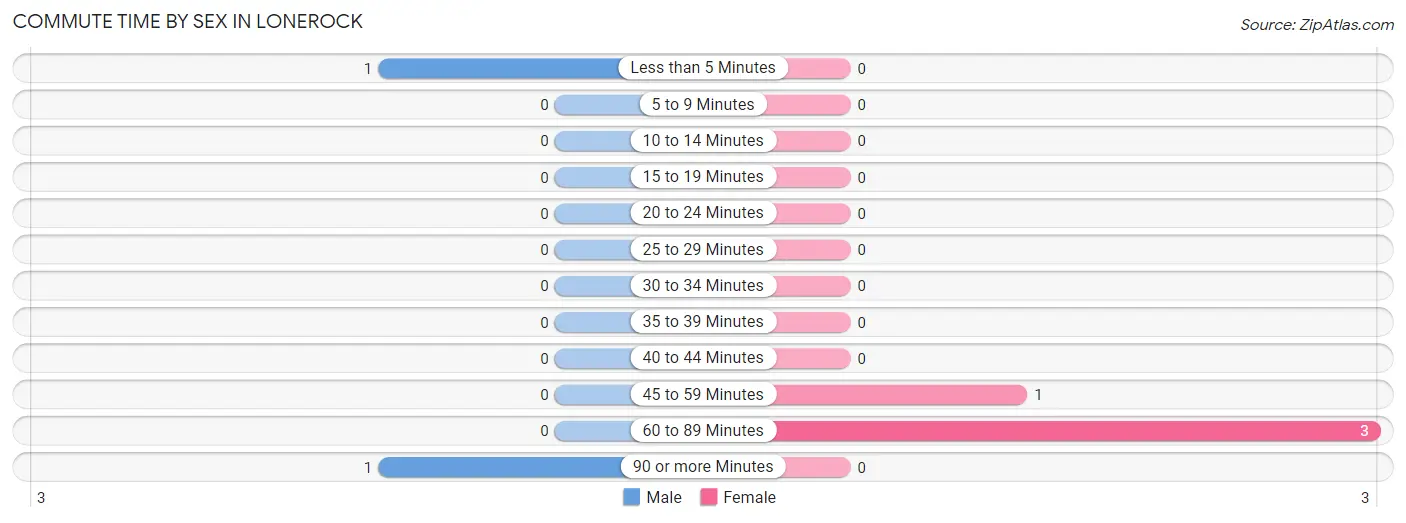
| Commute Time | Male | Female |
| Less than 5 Minutes | 1 (50.0%) | 0 (0.0%) |
| 5 to 9 Minutes | 0 (0.0%) | 0 (0.0%) |
| 10 to 14 Minutes | 0 (0.0%) | 0 (0.0%) |
| 15 to 19 Minutes | 0 (0.0%) | 0 (0.0%) |
| 20 to 24 Minutes | 0 (0.0%) | 0 (0.0%) |
| 25 to 29 Minutes | 0 (0.0%) | 0 (0.0%) |
| 30 to 34 Minutes | 0 (0.0%) | 0 (0.0%) |
| 35 to 39 Minutes | 0 (0.0%) | 0 (0.0%) |
| 40 to 44 Minutes | 0 (0.0%) | 0 (0.0%) |
| 45 to 59 Minutes | 0 (0.0%) | 1 (25.0%) |
| 60 to 89 Minutes | 0 (0.0%) | 3 (75.0%) |
| 90 or more Minutes | 1 (50.0%) | 0 (0.0%) |
Time of Departure to Work by Sex in Lonerock
The most frequent times of departure to work in Lonerock are 5:00 AM to 5:29 AM (1, 50.0%) for males and 6:00 AM to 6:29 AM (3, 75.0%) for females.
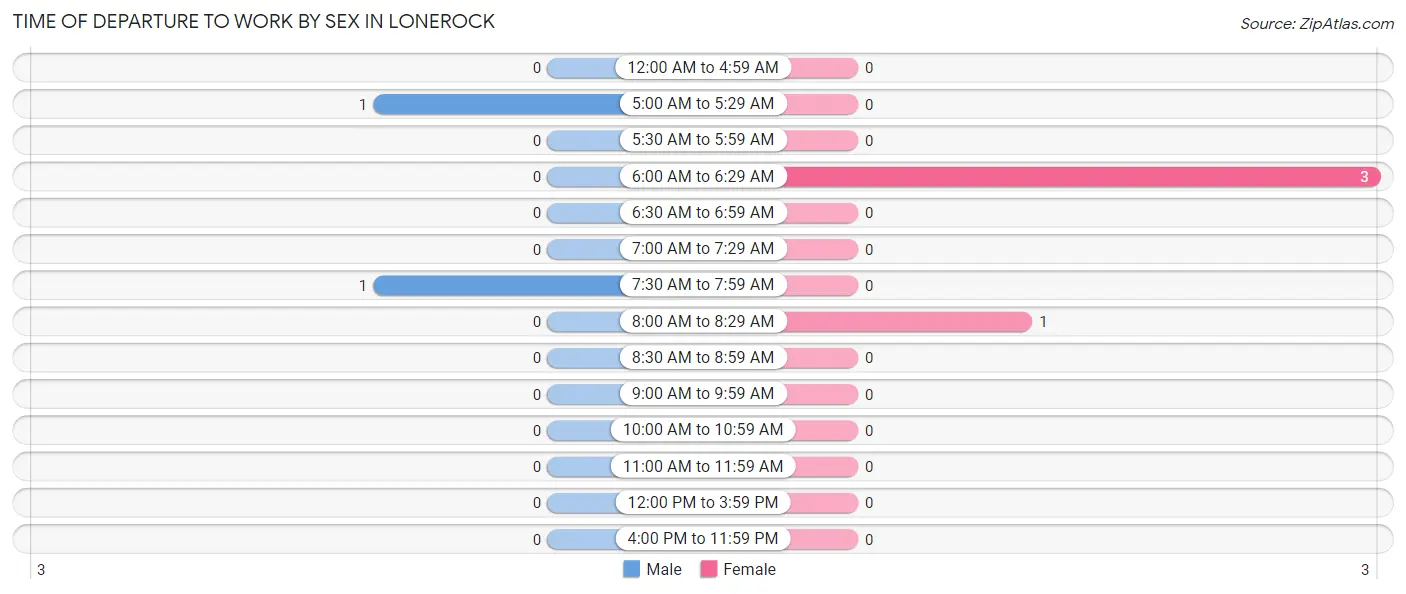
| Time of Departure | Male | Female |
| 12:00 AM to 4:59 AM | 0 (0.0%) | 0 (0.0%) |
| 5:00 AM to 5:29 AM | 1 (50.0%) | 0 (0.0%) |
| 5:30 AM to 5:59 AM | 0 (0.0%) | 0 (0.0%) |
| 6:00 AM to 6:29 AM | 0 (0.0%) | 3 (75.0%) |
| 6:30 AM to 6:59 AM | 0 (0.0%) | 0 (0.0%) |
| 7:00 AM to 7:29 AM | 0 (0.0%) | 0 (0.0%) |
| 7:30 AM to 7:59 AM | 1 (50.0%) | 0 (0.0%) |
| 8:00 AM to 8:29 AM | 0 (0.0%) | 1 (25.0%) |
| 8:30 AM to 8:59 AM | 0 (0.0%) | 0 (0.0%) |
| 9:00 AM to 9:59 AM | 0 (0.0%) | 0 (0.0%) |
| 10:00 AM to 10:59 AM | 0 (0.0%) | 0 (0.0%) |
| 11:00 AM to 11:59 AM | 0 (0.0%) | 0 (0.0%) |
| 12:00 PM to 3:59 PM | 0 (0.0%) | 0 (0.0%) |
| 4:00 PM to 11:59 PM | 0 (0.0%) | 0 (0.0%) |
| Total | 2 (100.0%) | 4 (100.0%) |
Housing Occupancy in Lonerock
Occupancy by Ownership in Lonerock
Of the total 12 dwellings in Lonerock, owner-occupied units account for 12 (100.0%), while renter-occupied units make up 0 (0.0%).
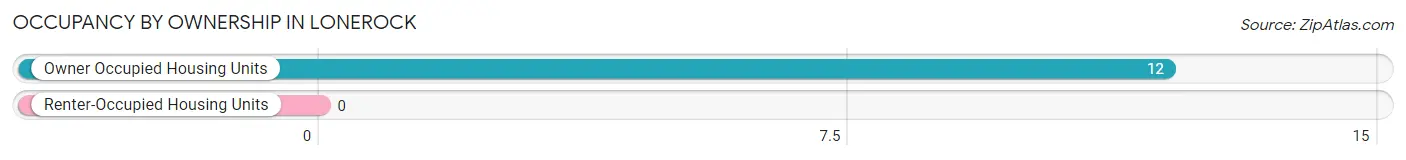
| Occupancy | # Housing Units | % Housing Units |
| Owner Occupied Housing Units | 12 | 100.0% |
| Renter-Occupied Housing Units | 0 | 0.0% |
| Total Occupied Housing Units | 12 | 100.0% |
Occupancy by Household Size in Lonerock
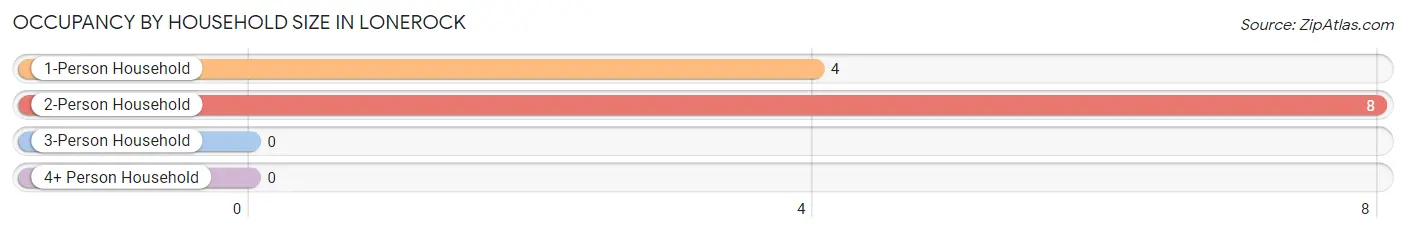
| Household Size | # Housing Units | % Housing Units |
| 1-Person Household | 4 | 33.3% |
| 2-Person Household | 8 | 66.7% |
| 3-Person Household | 0 | 0.0% |
| 4+ Person Household | 0 | 0.0% |
| Total Housing Units | 12 | 100.0% |
Occupancy by Ownership by Household Size in Lonerock
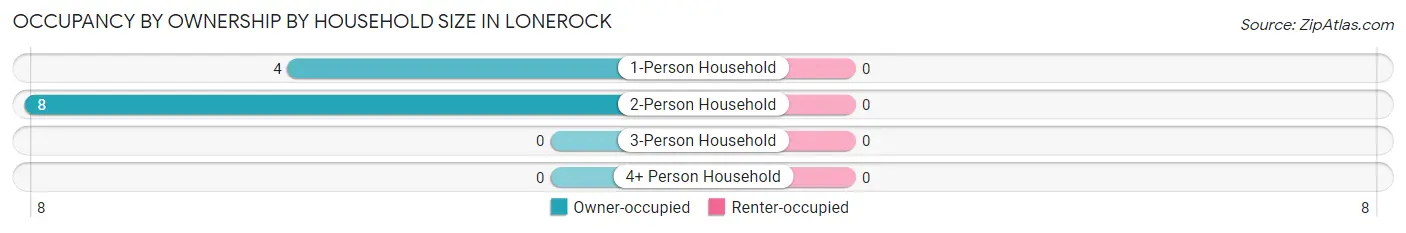
| Household Size | Owner-occupied | Renter-occupied |
| 1-Person Household | 4 (100.0%) | 0 (0.0%) |
| 2-Person Household | 8 (100.0%) | 0 (0.0%) |
| 3-Person Household | 0 (0.0%) | 0 (0.0%) |
| 4+ Person Household | 0 (0.0%) | 0 (0.0%) |
| Total Housing Units | 12 (100.0%) | 0 (0.0%) |
Occupancy by Educational Attainment in Lonerock
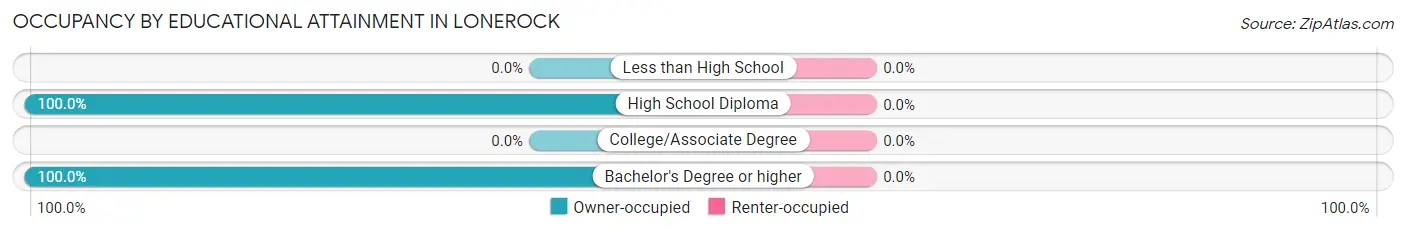
| Household Size | Owner-occupied | Renter-occupied |
| Less than High School | 0 (0.0%) | 0 (0.0%) |
| High School Diploma | 5 (100.0%) | 0 (0.0%) |
| College/Associate Degree | 0 (0.0%) | 0 (0.0%) |
| Bachelor's Degree or higher | 7 (100.0%) | 0 (0.0%) |
Occupancy by Age of Householder in Lonerock
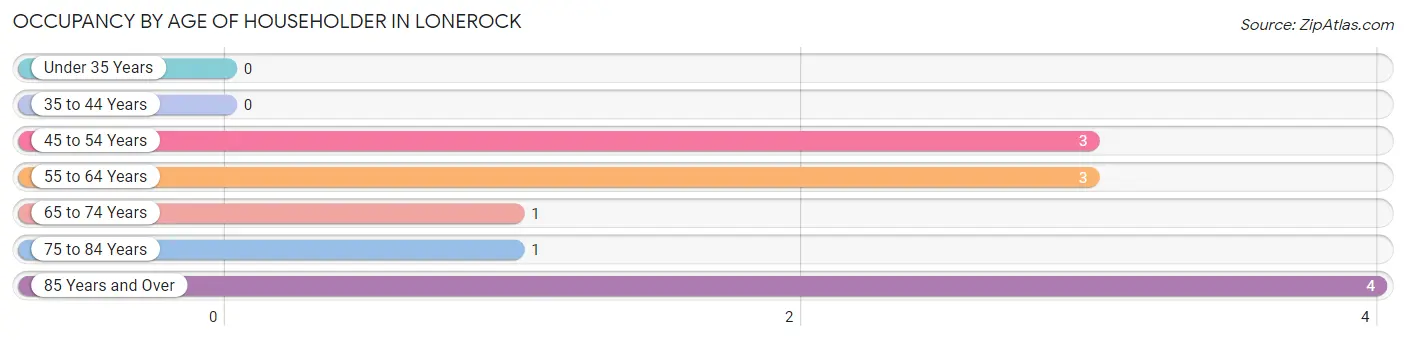
| Age Bracket | # Households | % Households |
| Under 35 Years | 0 | 0.0% |
| 35 to 44 Years | 0 | 0.0% |
| 45 to 54 Years | 3 | 25.0% |
| 55 to 64 Years | 3 | 25.0% |
| 65 to 74 Years | 1 | 8.3% |
| 75 to 84 Years | 1 | 8.3% |
| 85 Years and Over | 4 | 33.3% |
| Total | 12 | 100.0% |
Housing Finances in Lonerock
Median Income by Occupancy in Lonerock
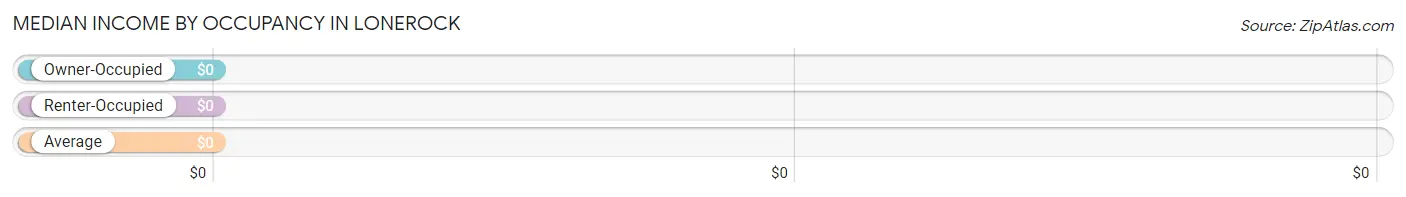
| Occupancy Type | # Households | Median Income |
| Owner-Occupied | 12 (100.0%) | $0 |
| Renter-Occupied | 0 (0.0%) | $0 |
| Average | 12 (100.0%) | $0 |
Occupancy by Householder Income Bracket in Lonerock
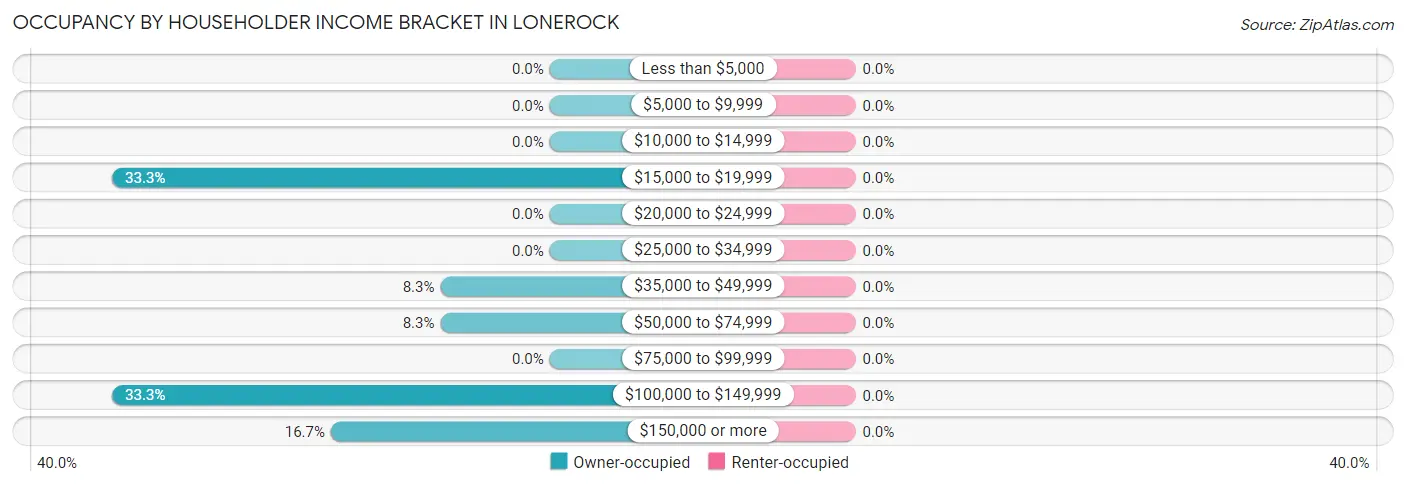
| Income Bracket | Owner-occupied | Renter-occupied |
| Less than $5,000 | 0 (0.0%) | 0 (0.0%) |
| $5,000 to $9,999 | 0 (0.0%) | 0 (0.0%) |
| $10,000 to $14,999 | 0 (0.0%) | 0 (0.0%) |
| $15,000 to $19,999 | 4 (33.3%) | 0 (0.0%) |
| $20,000 to $24,999 | 0 (0.0%) | 0 (0.0%) |
| $25,000 to $34,999 | 0 (0.0%) | 0 (0.0%) |
| $35,000 to $49,999 | 1 (8.3%) | 0 (0.0%) |
| $50,000 to $74,999 | 1 (8.3%) | 0 (0.0%) |
| $75,000 to $99,999 | 0 (0.0%) | 0 (0.0%) |
| $100,000 to $149,999 | 4 (33.3%) | 0 (0.0%) |
| $150,000 or more | 2 (16.7%) | 0 (0.0%) |
| Total | 12 (100.0%) | 0 (0.0%) |
Monthly Housing Cost Tiers in Lonerock
| Monthly Cost | Owner-occupied | Renter-occupied |
| Less than $300 | 0 (0.0%) | 0 (0.0%) |
| $300 to $499 | 4 (33.3%) | 0 (0.0%) |
| $500 to $799 | 5 (41.7%) | 0 (0.0%) |
| $800 to $999 | 0 (0.0%) | 0 (0.0%) |
| $1,000 to $1,499 | 3 (25.0%) | 0 (0.0%) |
| $1,500 to $1,999 | 0 (0.0%) | 0 (0.0%) |
| $2,000 to $2,499 | 0 (0.0%) | 0 (0.0%) |
| $2,500 to $2,999 | 0 (0.0%) | 0 (0.0%) |
| $3,000 or more | 0 (0.0%) | 0 (0.0%) |
| Total | 12 (100.0%) | 0 (0.0%) |
Physical Housing Characteristics in Lonerock
Housing Structures in Lonerock
| Structure Type | # Housing Units | % Housing Units |
| Single Unit, Detached | 10 | 83.3% |
| Single Unit, Attached | 0 | 0.0% |
| 2 Unit Apartments | 0 | 0.0% |
| 3 or 4 Unit Apartments | 0 | 0.0% |
| 5 to 9 Unit Apartments | 0 | 0.0% |
| 10 or more Apartments | 0 | 0.0% |
| Mobile Home / Other | 2 | 16.7% |
| Total | 12 | 100.0% |
Housing Structures by Occupancy in Lonerock
| Structure Type | Owner-occupied | Renter-occupied |
| Single Unit, Detached | 10 (100.0%) | 0 (0.0%) |
| Single Unit, Attached | 0 (0.0%) | 0 (0.0%) |
| 2 Unit Apartments | 0 (0.0%) | 0 (0.0%) |
| 3 or 4 Unit Apartments | 0 (0.0%) | 0 (0.0%) |
| 5 to 9 Unit Apartments | 0 (0.0%) | 0 (0.0%) |
| 10 or more Apartments | 0 (0.0%) | 0 (0.0%) |
| Mobile Home / Other | 2 (100.0%) | 0 (0.0%) |
| Total | 12 (100.0%) | 0 (0.0%) |
Housing Structures by Number of Rooms in Lonerock
| Number of Rooms | Owner-occupied | Renter-occupied |
| 1 Room | 0 (0.0%) | 0 (0.0%) |
| 2 or 3 Rooms | 0 (0.0%) | 0 (0.0%) |
| 4 or 5 Rooms | 2 (16.7%) | 0 (0.0%) |
| 6 or 7 Rooms | 4 (33.3%) | 0 (0.0%) |
| 8 or more Rooms | 6 (50.0%) | 0 (0.0%) |
| Total | 12 (100.0%) | 0 (0.0%) |
Housing Structure by Heating Type in Lonerock
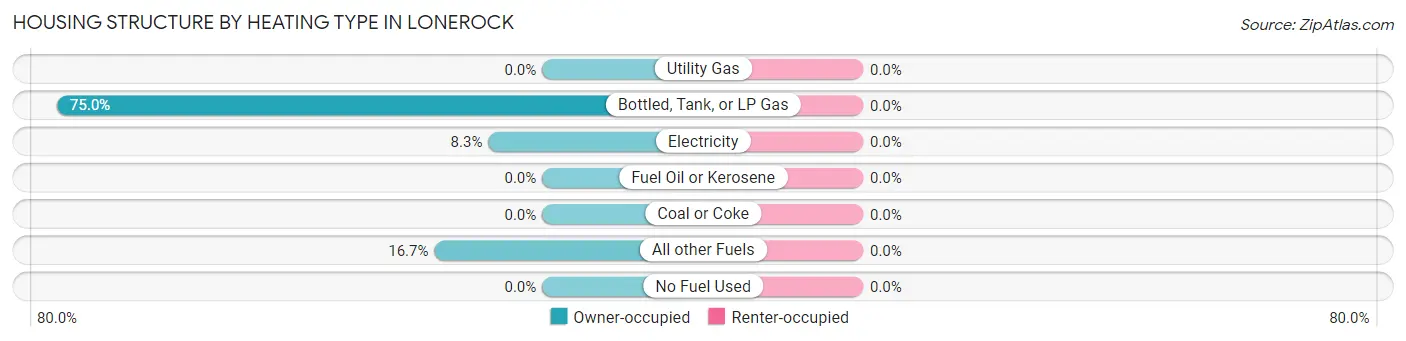
| Heating Type | Owner-occupied | Renter-occupied |
| Utility Gas | 0 (0.0%) | 0 (0.0%) |
| Bottled, Tank, or LP Gas | 9 (75.0%) | 0 (0.0%) |
| Electricity | 1 (8.3%) | 0 (0.0%) |
| Fuel Oil or Kerosene | 0 (0.0%) | 0 (0.0%) |
| Coal or Coke | 0 (0.0%) | 0 (0.0%) |
| All other Fuels | 2 (16.7%) | 0 (0.0%) |
| No Fuel Used | 0 (0.0%) | 0 (0.0%) |
| Total | 12 (100.0%) | 0 (0.0%) |
Household Vehicle Usage in Lonerock
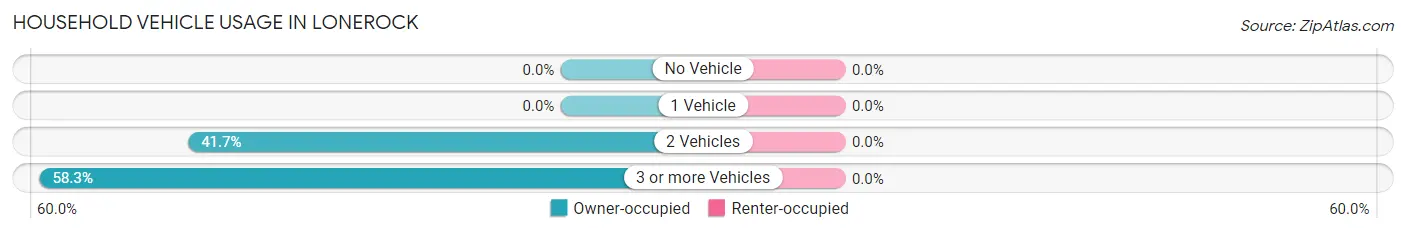
| Vehicles per Household | Owner-occupied | Renter-occupied |
| No Vehicle | 0 (0.0%) | 0 (0.0%) |
| 1 Vehicle | 0 (0.0%) | 0 (0.0%) |
| 2 Vehicles | 5 (41.7%) | 0 (0.0%) |
| 3 or more Vehicles | 7 (58.3%) | 0 (0.0%) |
| Total | 12 (100.0%) | 0 (0.0%) |
Real Estate & Mortgages in Lonerock
Real Estate and Mortgage Overview in Lonerock
| Characteristic | Without Mortgage | With Mortgage |
| Housing Units | 8 | 4 |
| Median Property Value | $112,500 | $0 |
| Median Household Income | - | - |
| Monthly Housing Costs | $550 | $0 |
| Real Estate Taxes | - | - |
Property Value by Mortgage Status in Lonerock
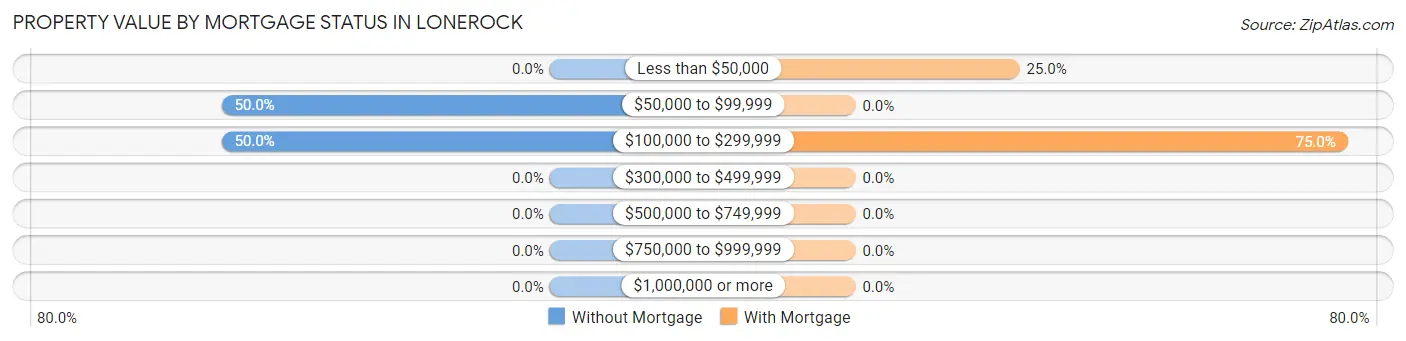
| Property Value | Without Mortgage | With Mortgage |
| Less than $50,000 | 0 (0.0%) | 1 (25.0%) |
| $50,000 to $99,999 | 4 (50.0%) | 0 (0.0%) |
| $100,000 to $299,999 | 4 (50.0%) | 3 (75.0%) |
| $300,000 to $499,999 | 0 (0.0%) | 0 (0.0%) |
| $500,000 to $749,999 | 0 (0.0%) | 0 (0.0%) |
| $750,000 to $999,999 | 0 (0.0%) | 0 (0.0%) |
| $1,000,000 or more | 0 (0.0%) | 0 (0.0%) |
| Total | 8 (100.0%) | 4 (100.0%) |
Household Income by Mortgage Status in Lonerock
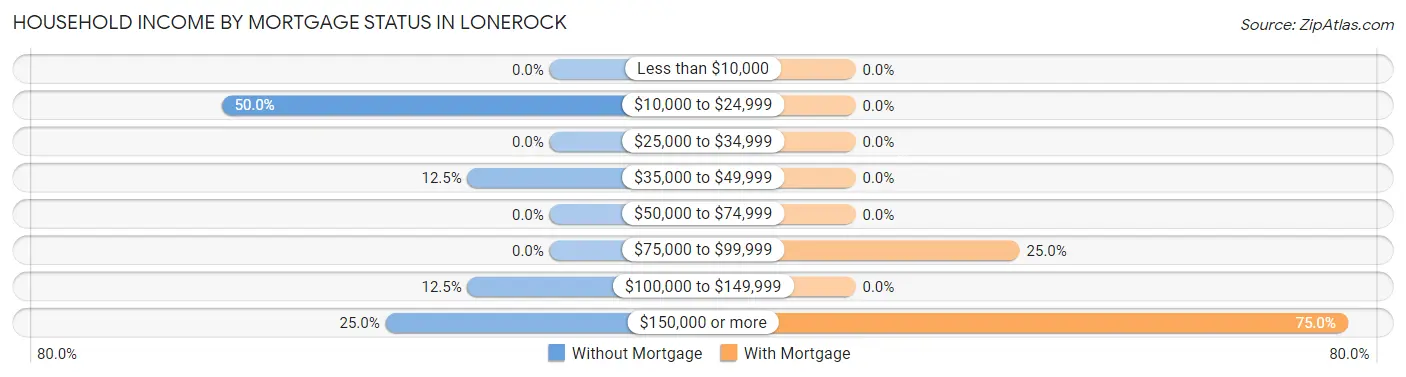
| Household Income | Without Mortgage | With Mortgage |
| Less than $10,000 | 0 (0.0%) | 0 (0.0%) |
| $10,000 to $24,999 | 4 (50.0%) | 0 (0.0%) |
| $25,000 to $34,999 | 0 (0.0%) | 0 (0.0%) |
| $35,000 to $49,999 | 1 (12.5%) | 0 (0.0%) |
| $50,000 to $74,999 | 0 (0.0%) | 0 (0.0%) |
| $75,000 to $99,999 | 0 (0.0%) | 1 (25.0%) |
| $100,000 to $149,999 | 1 (12.5%) | 0 (0.0%) |
| $150,000 or more | 2 (25.0%) | 3 (75.0%) |
| Total | 8 (100.0%) | 4 (100.0%) |
Property Value to Household Income Ratio in Lonerock
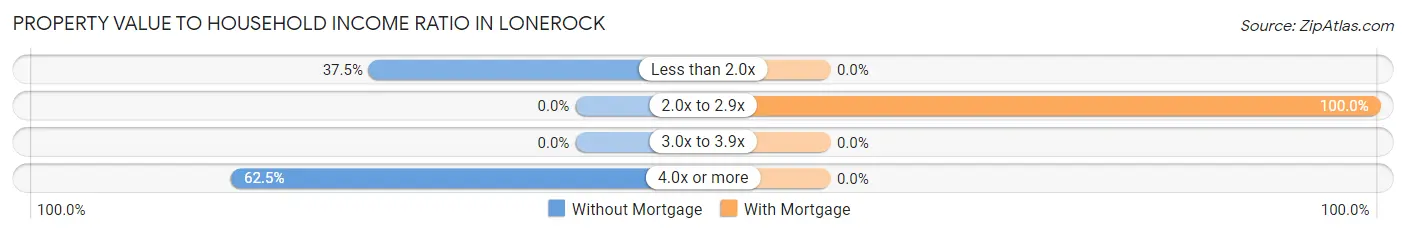
| Value-to-Income Ratio | Without Mortgage | With Mortgage |
| Less than 2.0x | 3 (37.5%) | 0 (0.0%) |
| 2.0x to 2.9x | 0 (0.0%) | 4 (100.0%) |
| 3.0x to 3.9x | 0 (0.0%) | 0 (0.0%) |
| 4.0x or more | 5 (62.5%) | 0 (0.0%) |
| Total | 8 (100.0%) | 4 (100.0%) |
Real Estate Taxes by Mortgage Status in Lonerock
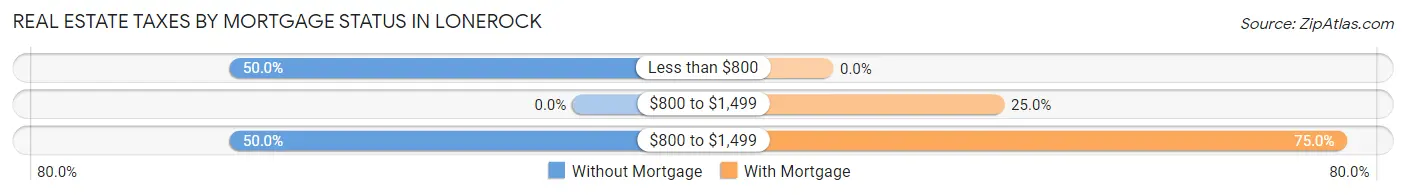
| Property Taxes | Without Mortgage | With Mortgage |
| Less than $800 | 4 (50.0%) | 0 (0.0%) |
| $800 to $1,499 | 0 (0.0%) | 1 (25.0%) |
| $800 to $1,499 | 4 (50.0%) | 3 (75.0%) |
| Total | 8 (100.0%) | 4 (100.0%) |
Health & Disability in Lonerock
Health Insurance Coverage by Age in Lonerock
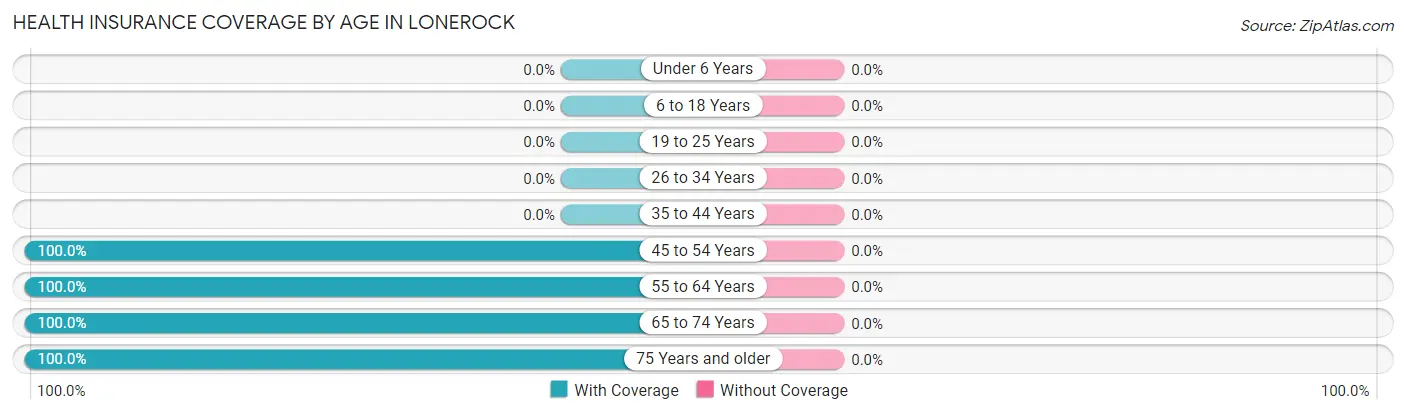
| Age Bracket | With Coverage | Without Coverage |
| Under 6 Years | 0 (0.0%) | 0 (0.0%) |
| 6 to 18 Years | 0 (0.0%) | 0 (0.0%) |
| 19 to 25 Years | 0 (0.0%) | 0 (0.0%) |
| 26 to 34 Years | 0 (0.0%) | 0 (0.0%) |
| 35 to 44 Years | 0 (0.0%) | 0 (0.0%) |
| 45 to 54 Years | 3 (100.0%) | 0 (0.0%) |
| 55 to 64 Years | 4 (100.0%) | 0 (0.0%) |
| 65 to 74 Years | 3 (100.0%) | 0 (0.0%) |
| 75 Years and older | 8 (100.0%) | 0 (0.0%) |
| Total | 18 (100.0%) | 0 (0.0%) |
Health Insurance Coverage by Citizenship Status in Lonerock
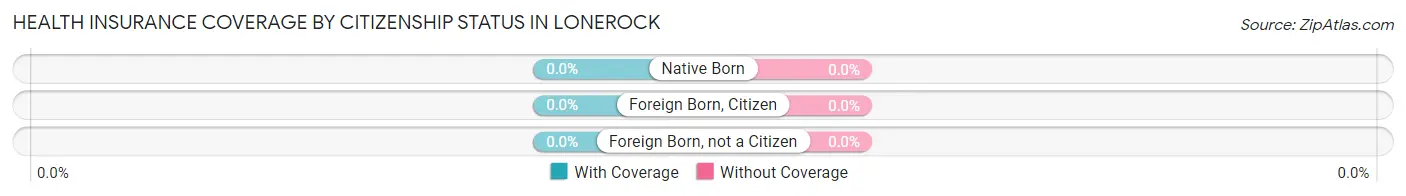
| Citizenship Status | With Coverage | Without Coverage |
| Native Born | 0 (0.0%) | 0 (0.0%) |
| Foreign Born, Citizen | 0 (0.0%) | 0 (0.0%) |
| Foreign Born, not a Citizen | 0 (0.0%) | 0 (0.0%) |
Health Insurance Coverage by Household Income in Lonerock
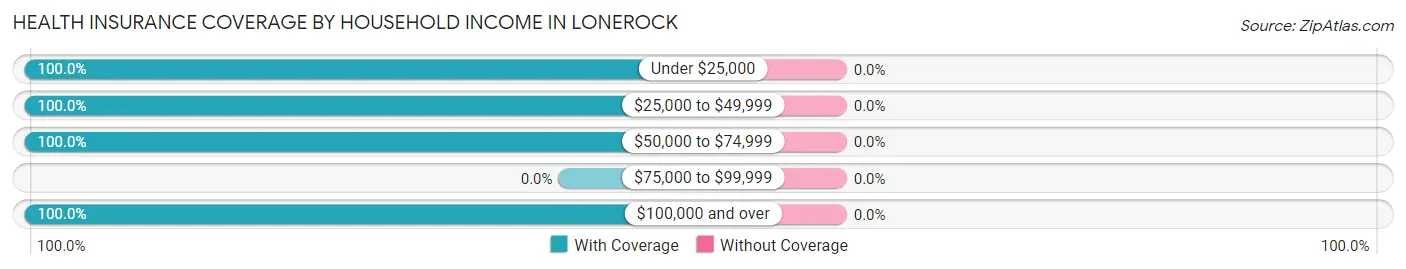
| Household Income | With Coverage | Without Coverage |
| Under $25,000 | 4 (100.0%) | 0 (0.0%) |
| $25,000 to $49,999 | 3 (100.0%) | 0 (0.0%) |
| $50,000 to $74,999 | 2 (100.0%) | 0 (0.0%) |
| $75,000 to $99,999 | 0 (0.0%) | 0 (0.0%) |
| $100,000 and over | 9 (100.0%) | 0 (0.0%) |
Public vs Private Health Insurance Coverage by Age in Lonerock
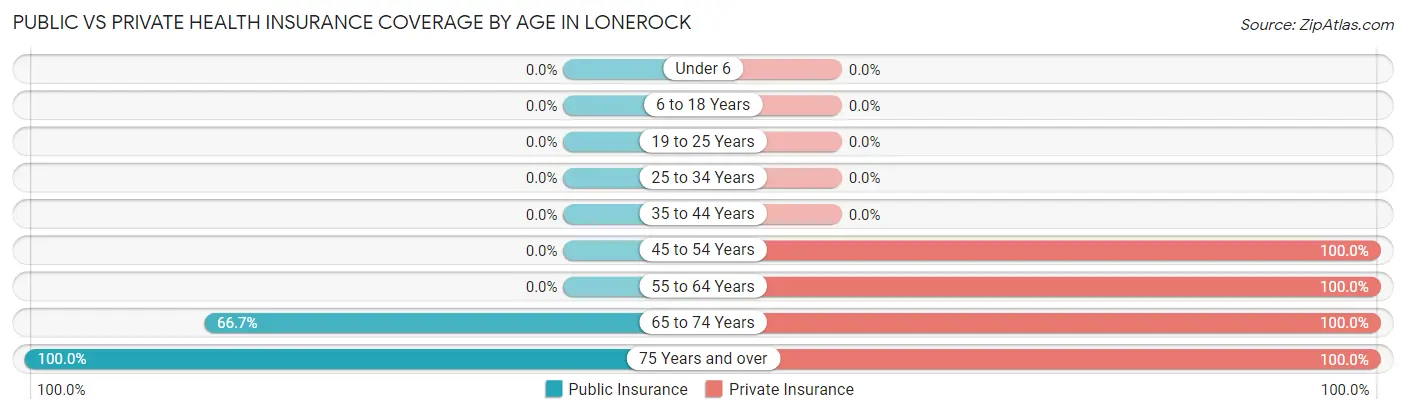
| Age Bracket | Public Insurance | Private Insurance |
| Under 6 | 0 (0.0%) | 0 (0.0%) |
| 6 to 18 Years | 0 (0.0%) | 0 (0.0%) |
| 19 to 25 Years | 0 (0.0%) | 0 (0.0%) |
| 25 to 34 Years | 0 (0.0%) | 0 (0.0%) |
| 35 to 44 Years | 0 (0.0%) | 0 (0.0%) |
| 45 to 54 Years | 0 (0.0%) | 3 (100.0%) |
| 55 to 64 Years | 0 (0.0%) | 4 (100.0%) |
| 65 to 74 Years | 2 (66.7%) | 3 (100.0%) |
| 75 Years and over | 8 (100.0%) | 8 (100.0%) |
| Total | 10 (55.6%) | 18 (100.0%) |
Disability Status by Sex by Age in Lonerock
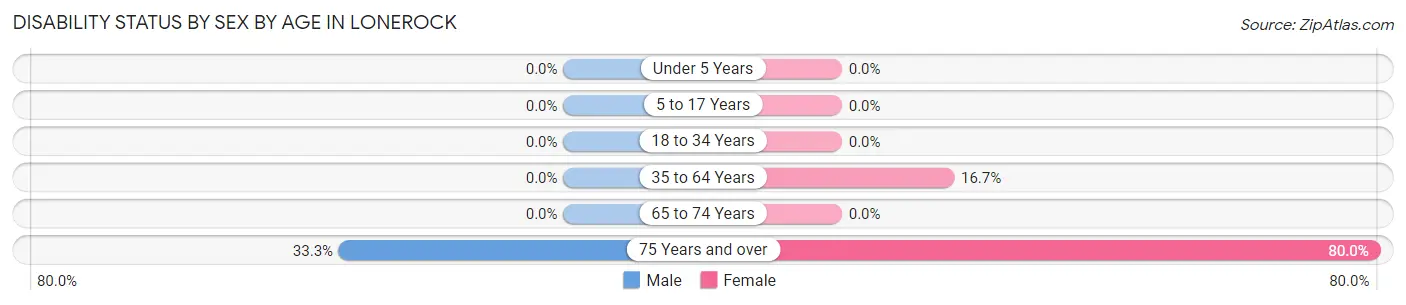
| Age Bracket | Male | Female |
| Under 5 Years | 0 (0.0%) | 0 (0.0%) |
| 5 to 17 Years | 0 (0.0%) | 0 (0.0%) |
| 18 to 34 Years | 0 (0.0%) | 0 (0.0%) |
| 35 to 64 Years | 0 (0.0%) | 1 (16.7%) |
| 65 to 74 Years | 0 (0.0%) | 0 (0.0%) |
| 75 Years and over | 1 (33.3%) | 4 (80.0%) |
Disability Class by Sex by Age in Lonerock
Disability Class: Hearing Difficulty
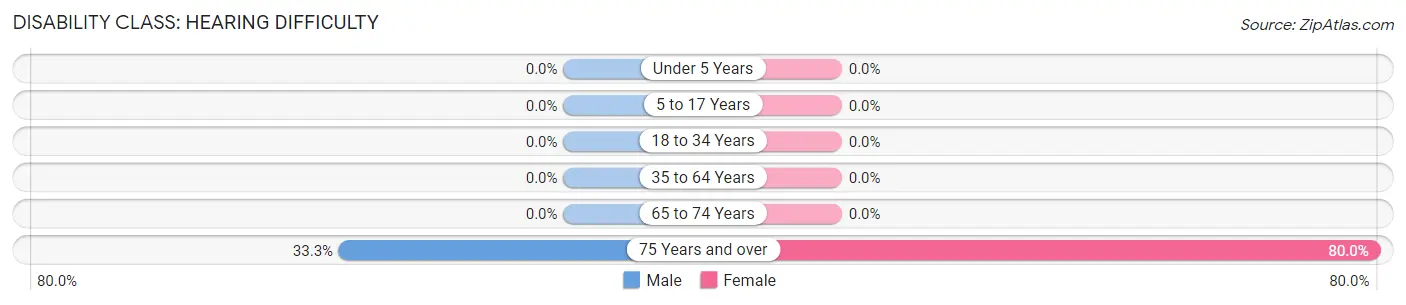
| Age Bracket | Male | Female |
| Under 5 Years | 0 (0.0%) | 0 (0.0%) |
| 5 to 17 Years | 0 (0.0%) | 0 (0.0%) |
| 18 to 34 Years | 0 (0.0%) | 0 (0.0%) |
| 35 to 64 Years | 0 (0.0%) | 0 (0.0%) |
| 65 to 74 Years | 0 (0.0%) | 0 (0.0%) |
| 75 Years and over | 1 (33.3%) | 4 (80.0%) |
Disability Class: Vision Difficulty
| Age Bracket | Male | Female |
| Under 5 Years | 0 (0.0%) | 0 (0.0%) |
| 5 to 17 Years | 0 (0.0%) | 0 (0.0%) |
| 18 to 34 Years | 0 (0.0%) | 0 (0.0%) |
| 35 to 64 Years | 0 (0.0%) | 0 (0.0%) |
| 65 to 74 Years | 0 (0.0%) | 0 (0.0%) |
| 75 Years and over | 0 (0.0%) | 0 (0.0%) |
Disability Class: Cognitive Difficulty
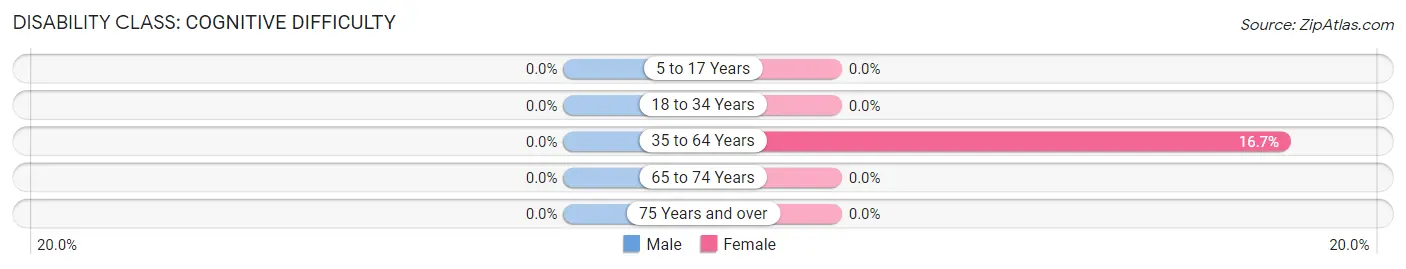
| Age Bracket | Male | Female |
| 5 to 17 Years | 0 (0.0%) | 0 (0.0%) |
| 18 to 34 Years | 0 (0.0%) | 0 (0.0%) |
| 35 to 64 Years | 0 (0.0%) | 1 (16.7%) |
| 65 to 74 Years | 0 (0.0%) | 0 (0.0%) |
| 75 Years and over | 0 (0.0%) | 0 (0.0%) |
Disability Class: Ambulatory Difficulty
| Age Bracket | Male | Female |
| 5 to 17 Years | 0 (0.0%) | 0 (0.0%) |
| 18 to 34 Years | 0 (0.0%) | 0 (0.0%) |
| 35 to 64 Years | 0 (0.0%) | 0 (0.0%) |
| 65 to 74 Years | 0 (0.0%) | 0 (0.0%) |
| 75 Years and over | 0 (0.0%) | 0 (0.0%) |
Disability Class: Self-Care Difficulty
| Age Bracket | Male | Female |
| 5 to 17 Years | 0 (0.0%) | 0 (0.0%) |
| 18 to 34 Years | 0 (0.0%) | 0 (0.0%) |
| 35 to 64 Years | 0 (0.0%) | 0 (0.0%) |
| 65 to 74 Years | 0 (0.0%) | 0 (0.0%) |
| 75 Years and over | 0 (0.0%) | 0 (0.0%) |
Technology Access in Lonerock
Computing Device Access in Lonerock
| Device Type | # Households | % Households |
| Desktop or Laptop | 12 | 100.0% |
| Smartphone | 7 | 58.3% |
| Tablet | 5 | 41.7% |
| No Computing Device | 0 | 0.0% |
| Total | 12 | 100.0% |
Internet Access in Lonerock
| Internet Type | # Households | % Households |
| Dial-Up Internet | 0 | 0.0% |
| Broadband Home | 8 | 66.7% |
| Cellular Data Only | 0 | 0.0% |
| Satellite Internet | 4 | 33.3% |
| No Internet | 0 | 0.0% |
| Total | 12 | 100.0% |
Lonerock Summary
Lonerock is a small unincorporated community located in Gilliam County, Oregon. It is situated in the foothills of the Blue Mountains, approximately 20 miles east of the city of Condon. The population of Lonerock was estimated to be around 200 people in 2020.
History
Lonerock was founded in 1883 by a group of settlers from the Midwest. The settlers were attracted to the area by the abundance of natural resources, including timber, water, and fertile soil. The town was named after a nearby rock formation, which was said to resemble a lone rock in the middle of the prairie.
The first settlers in Lonerock were primarily farmers and ranchers, and the town quickly grew to become a thriving agricultural community. In the early 1900s, the town was home to several businesses, including a general store, a blacksmith, a hotel, and a post office.
In the 1920s, the town began to decline as the timber industry moved away from the area. The population decreased and many of the businesses closed. However, the town was able to survive due to its strong agricultural base.
Geography
Lonerock is located in the foothills of the Blue Mountains, approximately 20 miles east of the city of Condon. The town is situated in a valley surrounded by rolling hills and grasslands. The area is known for its scenic beauty and is a popular destination for outdoor recreation.
The climate in Lonerock is semi-arid, with hot summers and cold winters. The average annual temperature is around 50 degrees Fahrenheit. The area receives an average of 12 inches of precipitation per year, most of which falls in the form of snow during the winter months.
Economy
The economy of Lonerock is primarily based on agriculture. The town is home to several farms and ranches, which produce a variety of crops and livestock. The town also has a small manufacturing sector, which produces a variety of products, including furniture and clothing.
The town is also home to several small businesses, including restaurants, stores, and service providers. The town is also home to a small airport, which serves as a hub for air travel in the region.
Demographics
The population of Lonerock was estimated to be around 200 people in 2020. The town is predominantly white, with a small Hispanic population. The median household income in the town is around $35,000 per year. The town has a low unemployment rate and a high rate of homeownership.
Lonerock is a small, rural community with a strong sense of community and a commitment to preserving its rural character. The town is home to several churches, a library, and a community center. The town is also home to a variety of recreational activities, including fishing, hunting, and camping.
Common Questions
What is Per Capita Income in Lonerock?
Per Capita income in Lonerock is $52,778.
What is Inequality or Gini Index in Lonerock?
Inequality or Gini Index in Lonerock is 0.51.
What is the Total Population of Lonerock?
Total Population of Lonerock is 18.
What is the Total Male Population of Lonerock?
Total Male Population of Lonerock is 6.
What is the Total Female Population of Lonerock?
Total Female Population of Lonerock is 12.
What is the Ratio of Males per 100 Females in Lonerock?
There are 50.00 Males per 100 Females in Lonerock.
What is the Ratio of Females per 100 Males in Lonerock?
There are 200.00 Females per 100 Males in Lonerock.
What is the Median Population Age in Lonerock?
Median Population Age in Lonerock is 69.0 Years.
What is the Average Family Size in Lonerock
Average Family Size in Lonerock is 2.0 People.
What is the Average Household Size in Lonerock
Average Household Size in Lonerock is 1.5 People.
How Large is the Labor Force in Lonerock?
There are 7 People in the Labor Forcein in Lonerock.
What is the Percentage of People in the Labor Force in Lonerock?
38.9% of People are in the Labor Force in Lonerock.