Pineville, NC Map & Demographics
Pineville Map
Pineville Overview
$32,945
PER CAPITA INCOME
$77,750
AVG FAMILY INCOME
$55,450
AVG HOUSEHOLD INCOME
1.5%
WAGE / INCOME GAP [ % ]
98.5¢/ $1
WAGE / INCOME GAP [ $ ]
0.44
INEQUALITY / GINI INDEX
10,532
TOTAL POPULATION
4,595
MALE POPULATION
5,937
FEMALE POPULATION
77.40
MALES / 100 FEMALES
129.21
FEMALES / 100 MALES
33.7
MEDIAN AGE
3.3
AVG FAMILY SIZE
2.4
AVG HOUSEHOLD SIZE
5,350
LABOR FORCE [ PEOPLE ]
65.7%
PERCENT IN LABOR FORCE
3.9%
UNEMPLOYMENT RATE
Pineville Zip Codes
Pineville Area Codes
Income in Pineville
Income Overview in Pineville
Per Capita Income in Pineville is $32,945, while median incomes of families and households are $77,750 and $55,450 respectively.
| Characteristic | Number | Measure |
| Per Capita Income | 10,532 | $32,945 |
| Median Family Income | 2,407 | $77,750 |
| Mean Family Income | 2,407 | $96,327 |
| Median Household Income | 4,417 | $55,450 |
| Mean Household Income | 4,417 | $76,304 |
| Income Deficit | 2,407 | $0 |
| Wage / Income Gap (%) | 10,532 | 1.47% |
| Wage / Income Gap ($) | 10,532 | 98.53¢ per $1 |
| Gini / Inequality Index | 10,532 | 0.44 |
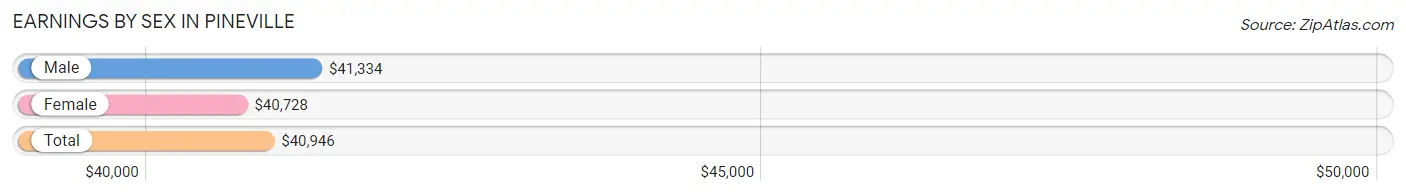
Earnings by Sex in Pineville
Average Earnings in Pineville are $40,946, $41,334 for men and $40,728 for women, a difference of 1.5%.
| Sex | Number | Average Earnings |
| Male | 2,619 (46.8%) | $41,334 |
| Female | 2,978 (53.2%) | $40,728 |
| Total | 5,597 (100.0%) | $40,946 |
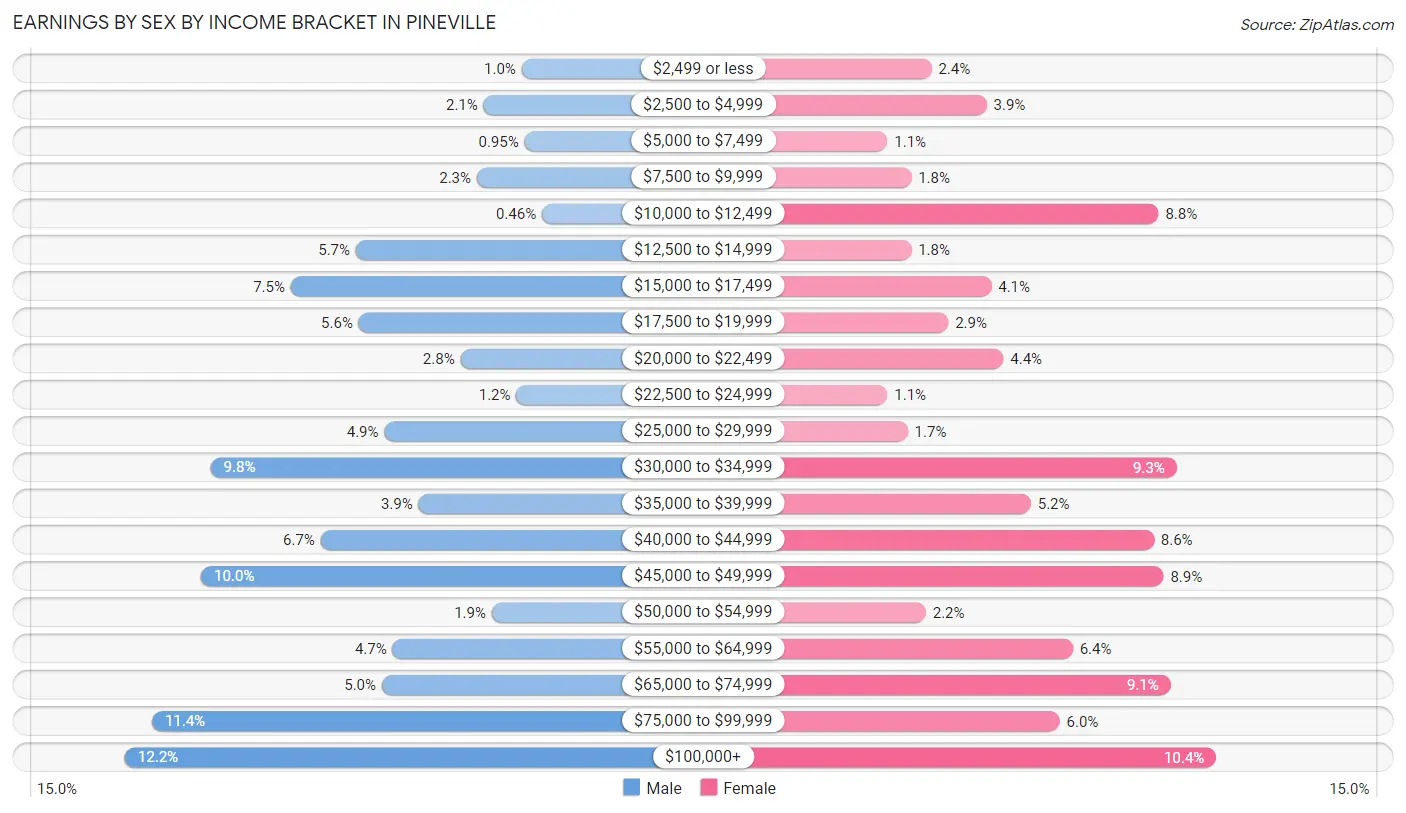
Earnings by Sex by Income Bracket in Pineville
The most common earnings brackets in Pineville are $100,000+ for men (319 | 12.2%) and $100,000+ for women (309 | 10.4%).
| Income | Male | Female |
| $2,499 or less | 27 (1.0%) | 71 (2.4%) |
| $2,500 to $4,999 | 55 (2.1%) | 117 (3.9%) |
| $5,000 to $7,499 | 25 (0.9%) | 34 (1.1%) |
| $7,500 to $9,999 | 60 (2.3%) | 54 (1.8%) |
| $10,000 to $12,499 | 12 (0.5%) | 261 (8.8%) |
| $12,500 to $14,999 | 149 (5.7%) | 54 (1.8%) |
| $15,000 to $17,499 | 197 (7.5%) | 121 (4.1%) |
| $17,500 to $19,999 | 147 (5.6%) | 85 (2.9%) |
| $20,000 to $22,499 | 72 (2.8%) | 131 (4.4%) |
| $22,500 to $24,999 | 31 (1.2%) | 34 (1.1%) |
| $25,000 to $29,999 | 128 (4.9%) | 51 (1.7%) |
| $30,000 to $34,999 | 256 (9.8%) | 276 (9.3%) |
| $35,000 to $39,999 | 103 (3.9%) | 154 (5.2%) |
| $40,000 to $44,999 | 175 (6.7%) | 257 (8.6%) |
| $45,000 to $49,999 | 263 (10.0%) | 265 (8.9%) |
| $50,000 to $54,999 | 49 (1.9%) | 66 (2.2%) |
| $55,000 to $64,999 | 122 (4.7%) | 189 (6.4%) |
| $65,000 to $74,999 | 130 (5.0%) | 271 (9.1%) |
| $75,000 to $99,999 | 299 (11.4%) | 178 (6.0%) |
| $100,000+ | 319 (12.2%) | 309 (10.4%) |
| Total | 2,619 (100.0%) | 2,978 (100.0%) |
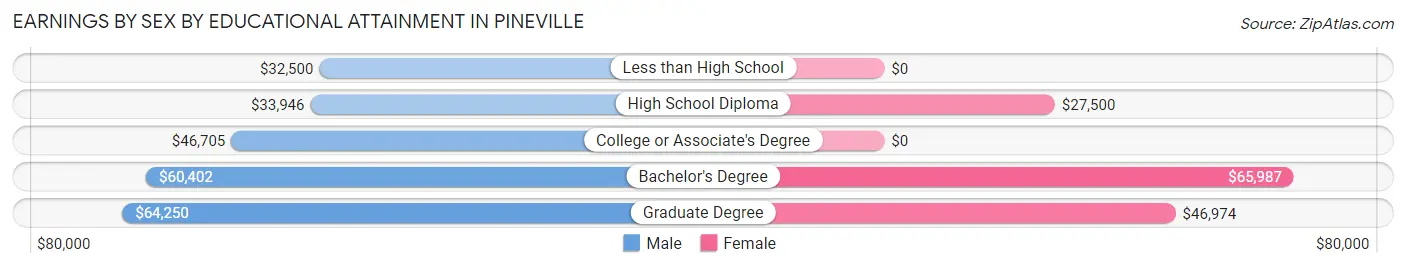
Earnings by Sex by Educational Attainment in Pineville
Average earnings in Pineville are $44,506 for men and $41,733 for women, a difference of 6.2%. Men with an educational attainment of graduate degree enjoy the highest average annual earnings of $64,250, while those with less than high school education earn the least with $32,500. Women with an educational attainment of bachelor's degree earn the most with the average annual earnings of $65,987, while those with high school diploma education have the smallest earnings of $27,500.
| Educational Attainment | Male Income | Female Income |
| Less than High School | $32,500 | $0 |
| High School Diploma | $33,946 | $27,500 |
| College or Associate's Degree | $46,705 | $0 |
| Bachelor's Degree | $60,402 | $65,987 |
| Graduate Degree | $64,250 | $46,974 |
| Total | $44,506 | $41,733 |
Family Income in Pineville
Family Income Brackets in Pineville
According to the Pineville family income data, there are 400 families falling into the $100,000 to $149,999 income range, which is the most common income bracket and makes up 16.6% of all families. Conversely, the less than $10,000 income bracket is the least frequent group with only 22 families (0.9%) belonging to this category.
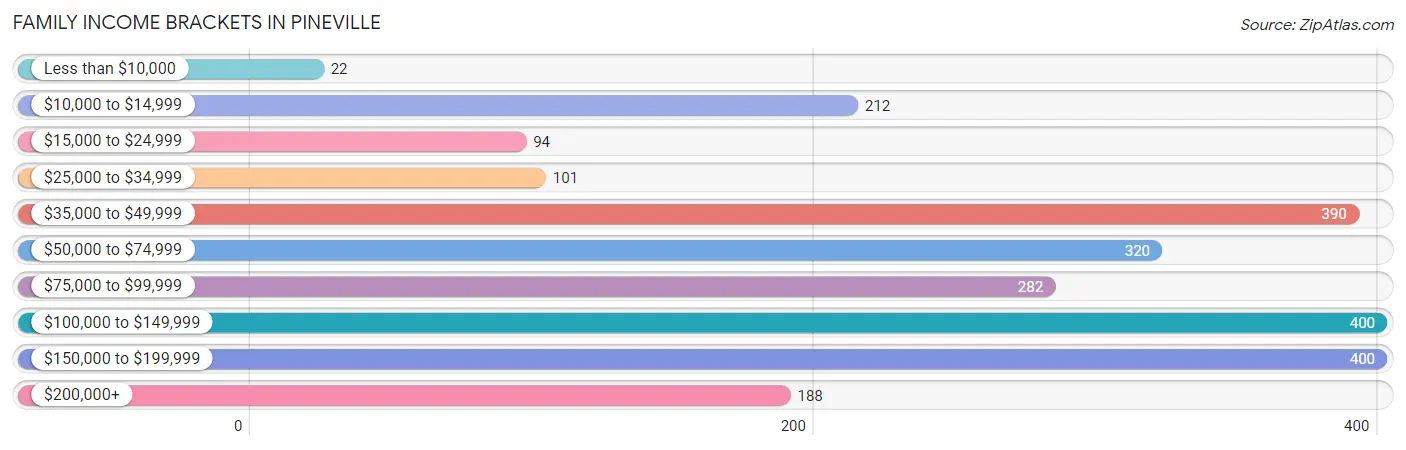
| Income Bracket | # Families | % Families |
| Less than $10,000 | 22 | 0.9% |
| $10,000 to $14,999 | 212 | 8.8% |
| $15,000 to $24,999 | 94 | 3.9% |
| $25,000 to $34,999 | 101 | 4.2% |
| $35,000 to $49,999 | 390 | 16.2% |
| $50,000 to $74,999 | 320 | 13.3% |
| $75,000 to $99,999 | 282 | 11.7% |
| $100,000 to $149,999 | 400 | 16.6% |
| $150,000 to $199,999 | 400 | 16.6% |
| $200,000+ | 188 | 7.8% |
Family Income by Famaliy Size in Pineville
5-person families (99 | 4.1%) account for the highest median family income in Pineville with $117,250 per family, while 2-person families (1,098 | 45.6%) have the highest median income of $45,364 per family member.
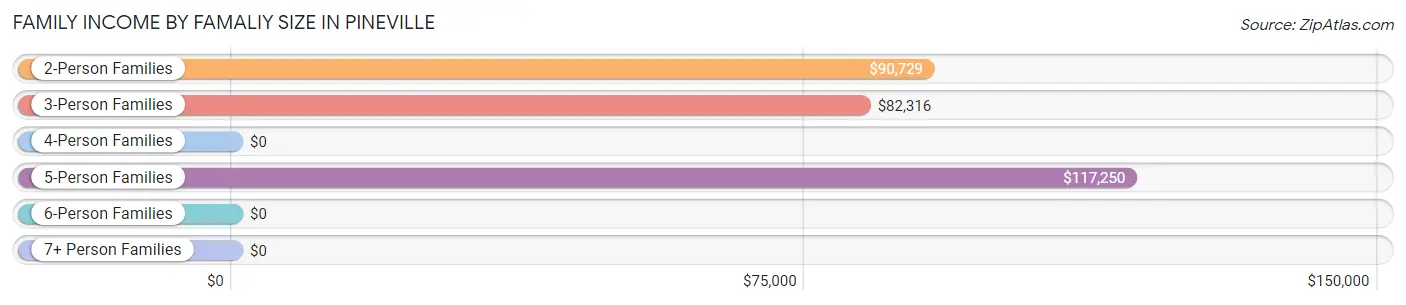
| Income Bracket | # Families | Median Income |
| 2-Person Families | 1,098 (45.6%) | $90,729 |
| 3-Person Families | 669 (27.8%) | $82,316 |
| 4-Person Families | 282 (11.7%) | $0 |
| 5-Person Families | 99 (4.1%) | $117,250 |
| 6-Person Families | 258 (10.7%) | $0 |
| 7+ Person Families | 1 (0.0%) | $0 |
| Total | 2,407 (100.0%) | $77,750 |
Family Income by Number of Earners in Pineville
The median family income in Pineville is $77,750, with families comprising 2 earners (1,095) having the highest median family income of $120,366, while families with 1 earner (966) have the lowest median family income of $39,900, accounting for 45.5% and 40.1% of families, respectively.
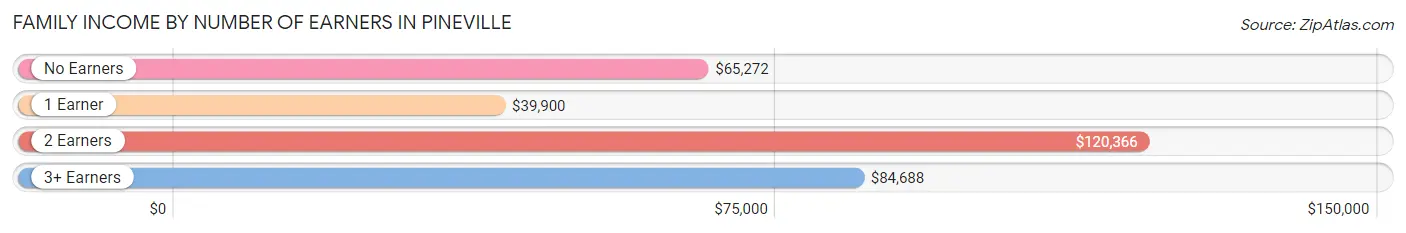
| Number of Earners | # Families | Median Income |
| No Earners | 163 (6.8%) | $65,272 |
| 1 Earner | 966 (40.1%) | $39,900 |
| 2 Earners | 1,095 (45.5%) | $120,366 |
| 3+ Earners | 183 (7.6%) | $84,688 |
| Total | 2,407 (100.0%) | $77,750 |
Household Income in Pineville
Household Income Brackets in Pineville
With 773 households falling in the category, the $35,000 to $49,999 income range is the most frequent in Pineville, accounting for 17.5% of all households. In contrast, only 181 households (4.1%) fall into the less than $10,000 income bracket, making it the least populous group.
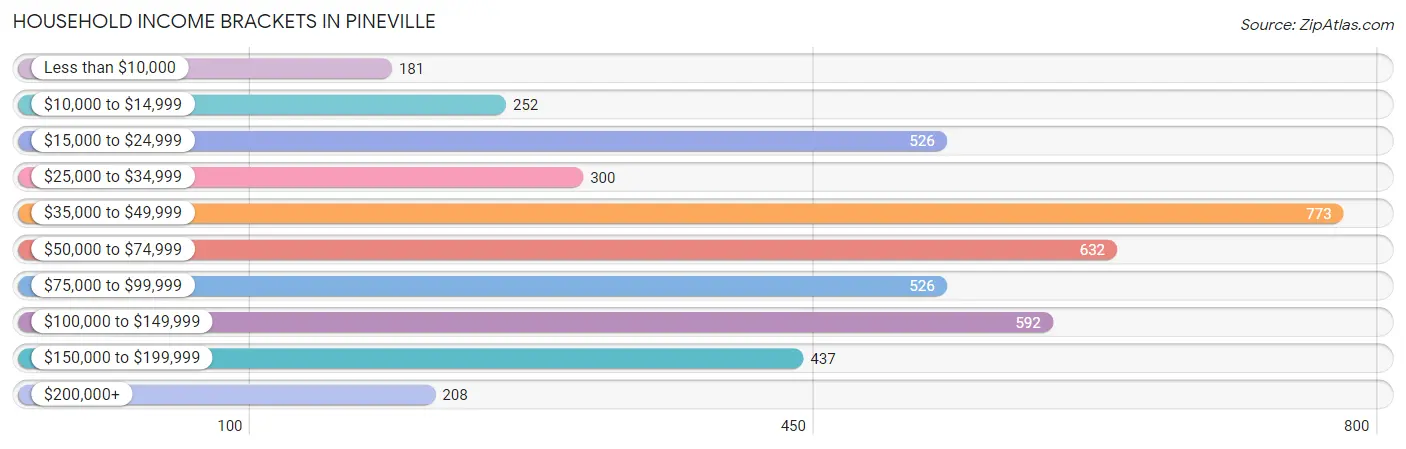
| Income Bracket | # Households | % Households |
| Less than $10,000 | 181 | 4.1% |
| $10,000 to $14,999 | 252 | 5.7% |
| $15,000 to $24,999 | 526 | 11.9% |
| $25,000 to $34,999 | 300 | 6.8% |
| $35,000 to $49,999 | 773 | 17.5% |
| $50,000 to $74,999 | 632 | 14.3% |
| $75,000 to $99,999 | 526 | 11.9% |
| $100,000 to $149,999 | 592 | 13.4% |
| $150,000 to $199,999 | 437 | 9.9% |
| $200,000+ | 208 | 4.7% |
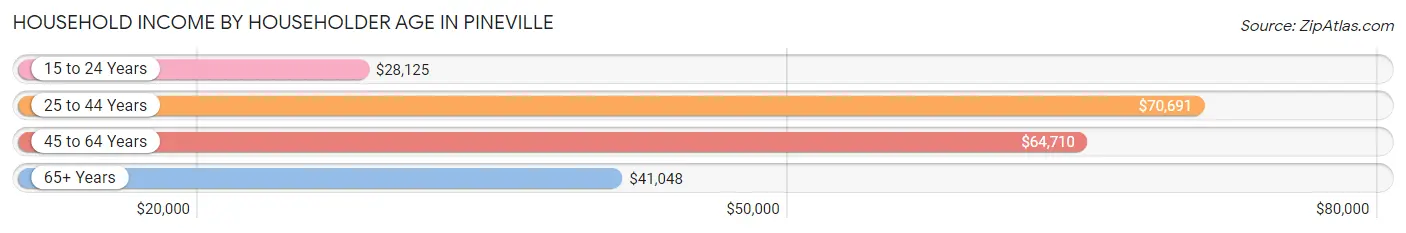
Household Income by Householder Age in Pineville
The median household income in Pineville is $55,450, with the highest median household income of $70,691 found in the 25 to 44 years age bracket for the primary householder. A total of 1,789 households (40.5%) fall into this category. Meanwhile, the 15 to 24 years age bracket for the primary householder has the lowest median household income of $28,125, with 139 households (3.2%) in this group.
| Income Bracket | # Households | Median Income |
| 15 to 24 Years | 139 (3.2%) | $28,125 |
| 25 to 44 Years | 1,789 (40.5%) | $70,691 |
| 45 to 64 Years | 1,419 (32.1%) | $64,710 |
| 65+ Years | 1,070 (24.2%) | $41,048 |
| Total | 4,417 (100.0%) | $55,450 |
Poverty in Pineville
Income Below Poverty by Sex and Age in Pineville
With 11.5% poverty level for males and 16.0% for females among the residents of Pineville, 15 year old males and 6 to 11 year old females are the most vulnerable to poverty, with 246 males (100.0%) and 242 females (41.9%) in their respective age groups living below the poverty level.
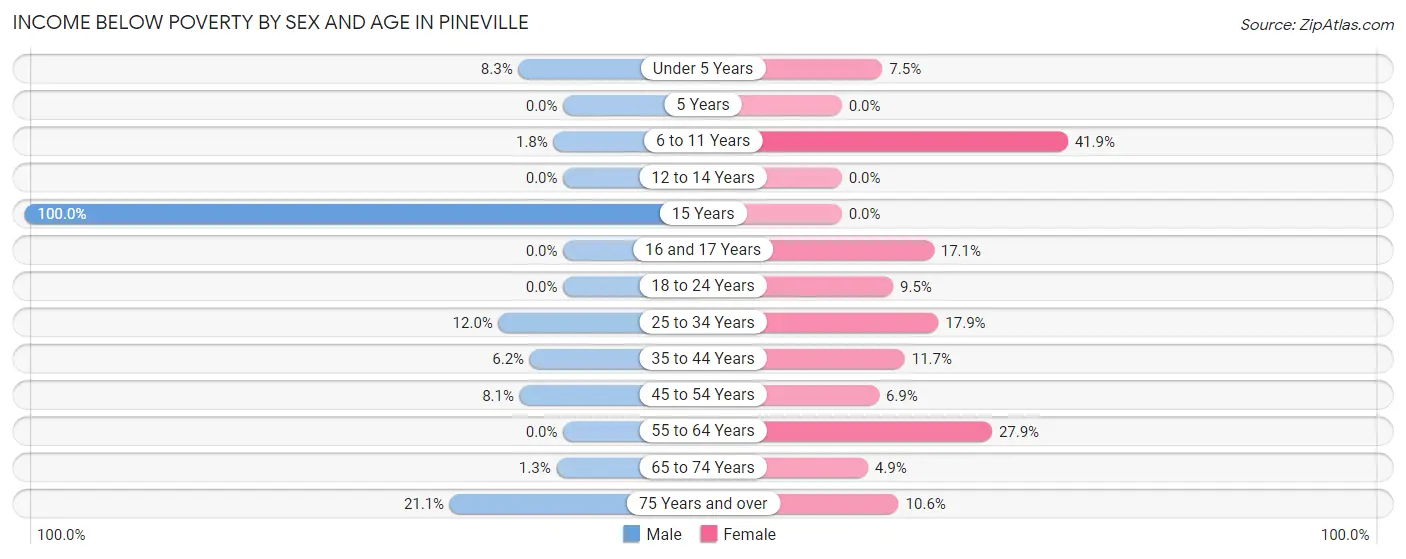
| Age Bracket | Male | Female |
| Under 5 Years | 47 (8.3%) | 27 (7.5%) |
| 5 Years | 0 (0.0%) | 0 (0.0%) |
| 6 to 11 Years | 5 (1.8%) | 242 (41.9%) |
| 12 to 14 Years | 0 (0.0%) | 0 (0.0%) |
| 15 Years | 246 (100.0%) | 0 (0.0%) |
| 16 and 17 Years | 0 (0.0%) | 28 (17.1%) |
| 18 to 24 Years | 0 (0.0%) | 22 (9.5%) |
| 25 to 34 Years | 125 (12.0%) | 229 (17.9%) |
| 35 to 44 Years | 38 (6.2%) | 71 (11.7%) |
| 45 to 54 Years | 21 (8.1%) | 50 (6.9%) |
| 55 to 64 Years | 0 (0.0%) | 177 (27.9%) |
| 65 to 74 Years | 5 (1.3%) | 21 (4.9%) |
| 75 Years and over | 36 (21.0%) | 71 (10.5%) |
| Total | 523 (11.5%) | 938 (16.0%) |
Income Above Poverty by Sex and Age in Pineville
According to the poverty statistics in Pineville, males aged 5 years and females aged 5 years are the age groups that are most secure financially, with 100.0% of males and 100.0% of females in these age groups living above the poverty line.
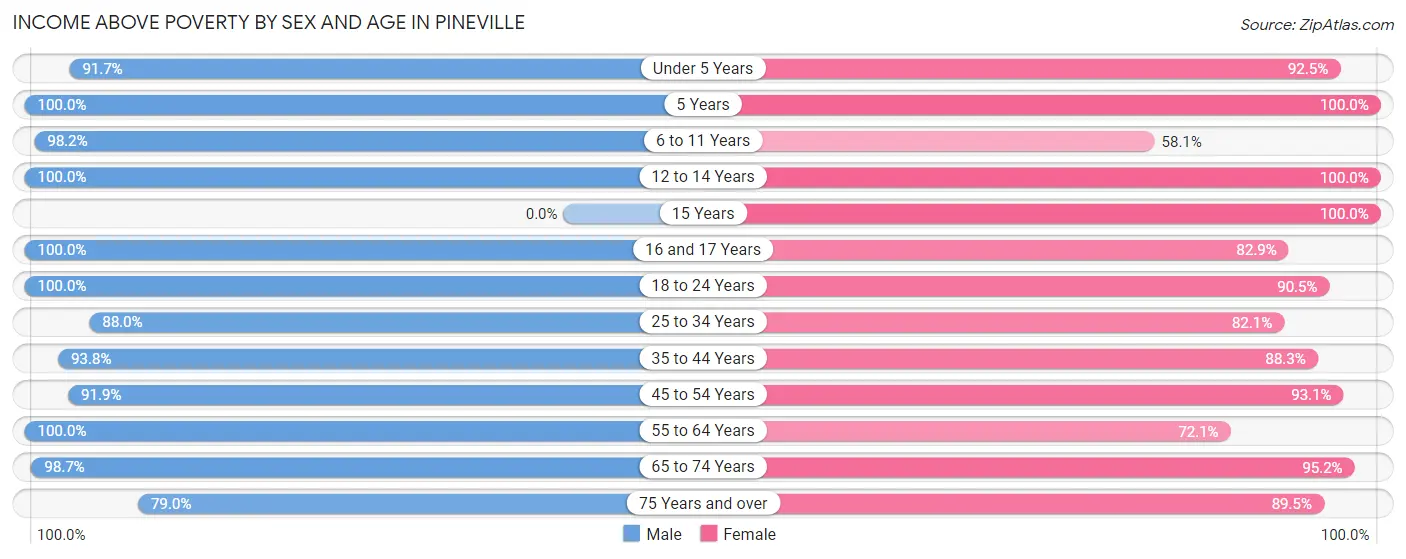
| Age Bracket | Male | Female |
| Under 5 Years | 517 (91.7%) | 331 (92.5%) |
| 5 Years | 116 (100.0%) | 10 (100.0%) |
| 6 to 11 Years | 272 (98.2%) | 335 (58.1%) |
| 12 to 14 Years | 53 (100.0%) | 58 (100.0%) |
| 15 Years | 0 (0.0%) | 117 (100.0%) |
| 16 and 17 Years | 13 (100.0%) | 136 (82.9%) |
| 18 to 24 Years | 470 (100.0%) | 209 (90.5%) |
| 25 to 34 Years | 916 (88.0%) | 1,048 (82.1%) |
| 35 to 44 Years | 575 (93.8%) | 536 (88.3%) |
| 45 to 54 Years | 239 (91.9%) | 675 (93.1%) |
| 55 to 64 Years | 345 (100.0%) | 458 (72.1%) |
| 65 to 74 Years | 390 (98.7%) | 412 (95.2%) |
| 75 Years and over | 135 (78.9%) | 602 (89.4%) |
| Total | 4,041 (88.5%) | 4,927 (84.0%) |
Income Below Poverty Among Married-Couple Families in Pineville
The poverty statistics for married-couple families in Pineville show that 2.5% or 36 of the total 1,443 families live below the poverty line. Families with no children have the highest poverty rate of 4.5%, comprising of 36 families. On the other hand, families with 1 or 2 children have the lowest poverty rate of 0.0%, which includes 0 families.
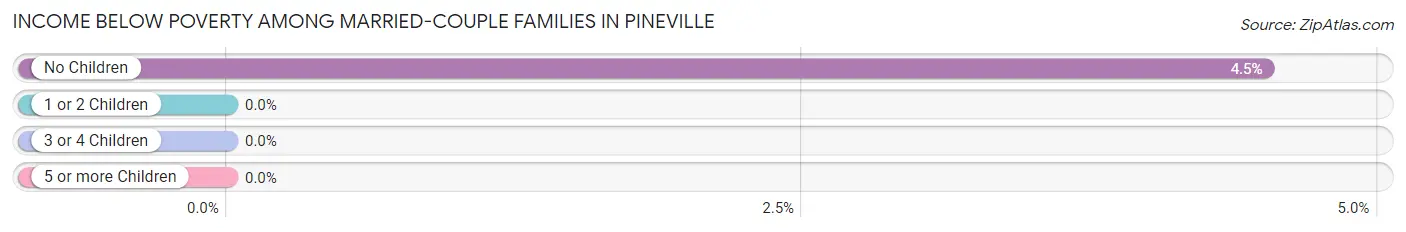
| Children | Above Poverty | Below Poverty |
| No Children | 762 (95.5%) | 36 (4.5%) |
| 1 or 2 Children | 602 (100.0%) | 0 (0.0%) |
| 3 or 4 Children | 43 (100.0%) | 0 (0.0%) |
| 5 or more Children | 0 (0.0%) | 0 (0.0%) |
| Total | 1,407 (97.5%) | 36 (2.5%) |
Income Below Poverty Among Single-Parent Households in Pineville
According to the poverty data in Pineville, 9.1% or 15 single-father households and 28.1% or 225 single-mother households are living below the poverty line. Among single-father households, those with no children have the highest poverty rate, with 15 households (26.8%) experiencing poverty. Likewise, among single-mother households, those with 3 or 4 children have the highest poverty rate, with 178 households (80.9%) falling below the poverty line.
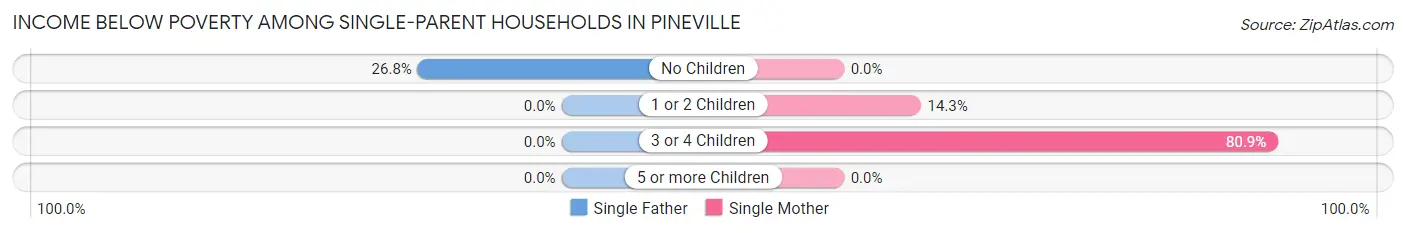
| Children | Single Father | Single Mother |
| No Children | 15 (26.8%) | 0 (0.0%) |
| 1 or 2 Children | 0 (0.0%) | 47 (14.3%) |
| 3 or 4 Children | 0 (0.0%) | 178 (80.9%) |
| 5 or more Children | 0 (0.0%) | 0 (0.0%) |
| Total | 15 (9.1%) | 225 (28.1%) |
Income Below Poverty Among Married-Couple vs Single-Parent Households in Pineville
The poverty data for Pineville shows that 36 of the married-couple family households (2.5%) and 240 of the single-parent households (24.9%) are living below the poverty level. Within the married-couple family households, those with no children have the highest poverty rate, with 36 households (4.5%) falling below the poverty line. Among the single-parent households, those with 3 or 4 children have the highest poverty rate, with 178 household (80.9%) living below poverty.
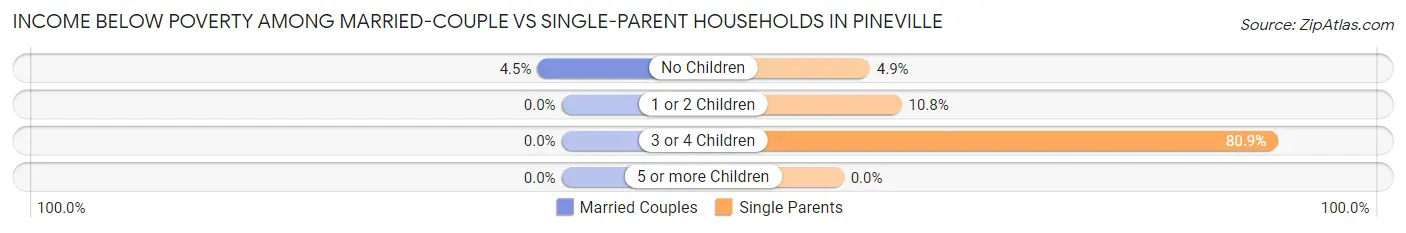
| Children | Married-Couple Families | Single-Parent Households |
| No Children | 36 (4.5%) | 15 (4.9%) |
| 1 or 2 Children | 0 (0.0%) | 47 (10.8%) |
| 3 or 4 Children | 0 (0.0%) | 178 (80.9%) |
| 5 or more Children | 0 (0.0%) | 0 (0.0%) |
| Total | 36 (2.5%) | 240 (24.9%) |
Race in Pineville
The most populous races in Pineville are White / Caucasian (5,108 | 48.5%), Black / African American (2,579 | 24.5%), and Hispanic or Latino (1,836 | 17.4%).
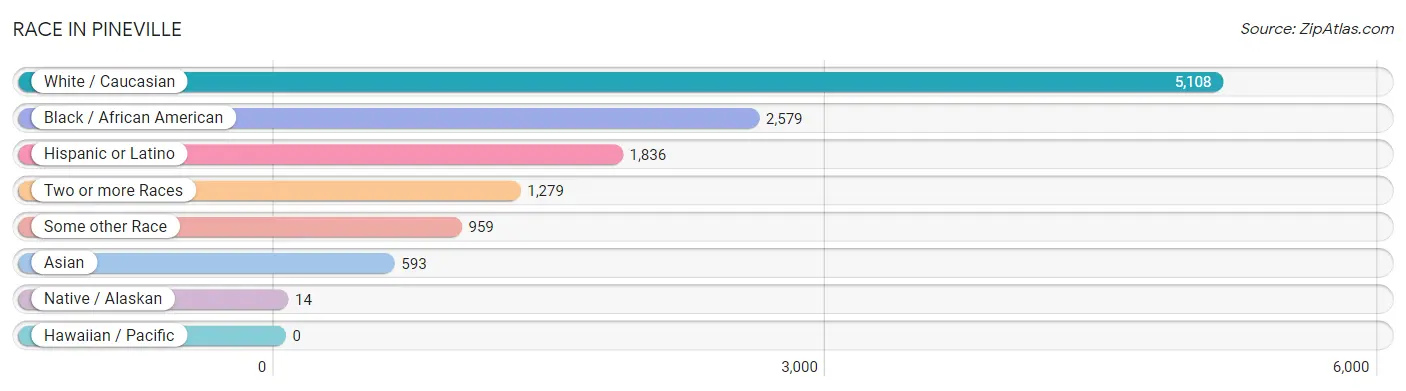
| Race | # Population | % Population |
| Asian | 593 | 5.6% |
| Black / African American | 2,579 | 24.5% |
| Hawaiian / Pacific | 0 | 0.0% |
| Hispanic or Latino | 1,836 | 17.4% |
| Native / Alaskan | 14 | 0.1% |
| White / Caucasian | 5,108 | 48.5% |
| Two or more Races | 1,279 | 12.1% |
| Some other Race | 959 | 9.1% |
| Total | 10,532 | 100.0% |
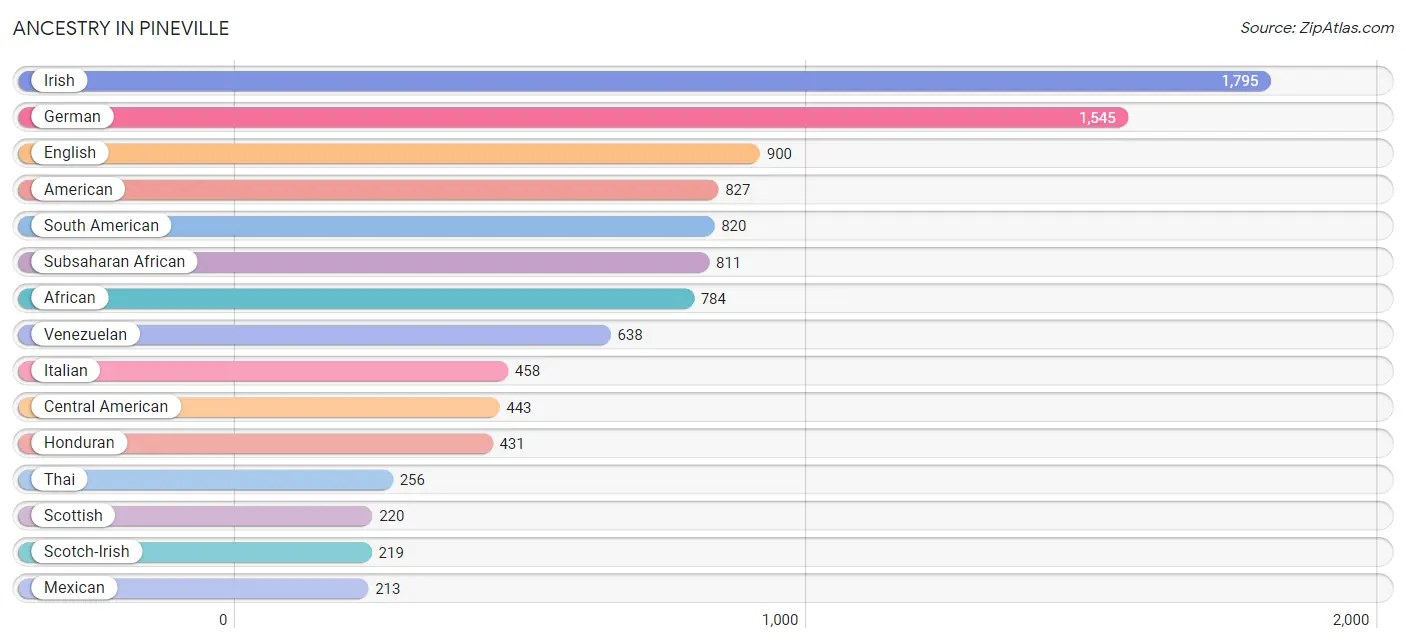
Ancestry in Pineville
The most populous ancestries reported in Pineville are Irish (1,795 | 17.0%), German (1,545 | 14.7%), English (900 | 8.6%), American (827 | 7.9%), and South American (820 | 7.8%), together accounting for 55.9% of all Pineville residents.
| Ancestry | # Population | % Population |
| African | 784 | 7.4% |
| American | 827 | 7.9% |
| Arab | 31 | 0.3% |
| Australian | 8 | 0.1% |
| Austrian | 19 | 0.2% |
| Bhutanese | 31 | 0.3% |
| British | 55 | 0.5% |
| Burmese | 134 | 1.3% |
| Canadian | 5 | 0.1% |
| Central American | 443 | 4.2% |
| Choctaw | 14 | 0.1% |
| Colombian | 113 | 1.1% |
| Costa Rican | 10 | 0.1% |
| Cuban | 39 | 0.4% |
| Czech | 9 | 0.1% |
| Czechoslovakian | 12 | 0.1% |
| Danish | 6 | 0.1% |
| Dominican | 124 | 1.2% |
| Dutch | 16 | 0.2% |
| Eastern European | 13 | 0.1% |
| Ecuadorian | 60 | 0.6% |
| English | 900 | 8.6% |
| European | 105 | 1.0% |
| Filipino | 26 | 0.3% |
| French | 124 | 1.2% |
| French Canadian | 36 | 0.3% |
| German | 1,545 | 14.7% |
| Greek | 165 | 1.6% |
| Haitian | 36 | 0.3% |
| Honduran | 431 | 4.1% |
| Hungarian | 17 | 0.2% |
| Indian (Asian) | 94 | 0.9% |
| Irish | 1,795 | 17.0% |
| Italian | 458 | 4.3% |
| Jamaican | 77 | 0.7% |
| Korean | 29 | 0.3% |
| Laotian | 94 | 0.9% |
| Lebanese | 10 | 0.1% |
| Lithuanian | 9 | 0.1% |
| Lumbee | 64 | 0.6% |
| Malaysian | 12 | 0.1% |
| Mexican | 213 | 2.0% |
| Mexican American Indian | 6 | 0.1% |
| Native Hawaiian | 14 | 0.1% |
| Northern European | 35 | 0.3% |
| Norwegian | 112 | 1.1% |
| Pennsylvania German | 7 | 0.1% |
| Peruvian | 9 | 0.1% |
| Polish | 140 | 1.3% |
| Portuguese | 12 | 0.1% |
| Puerto Rican | 70 | 0.7% |
| Russian | 56 | 0.5% |
| Salvadoran | 2 | 0.0% |
| Scotch-Irish | 219 | 2.1% |
| Scottish | 220 | 2.1% |
| Sioux | 41 | 0.4% |
| Slavic | 6 | 0.1% |
| Slovak | 25 | 0.2% |
| South American | 820 | 7.8% |
| Spaniard | 20 | 0.2% |
| Spanish | 14 | 0.1% |
| Sri Lankan | 25 | 0.2% |
| Subsaharan African | 811 | 7.7% |
| Swedish | 34 | 0.3% |
| Thai | 256 | 2.4% |
| Venezuelan | 638 | 6.1% |
| Welsh | 92 | 0.9% |
| West Indian | 7 | 0.1% | View All 68 Rows |
Immigrants in Pineville
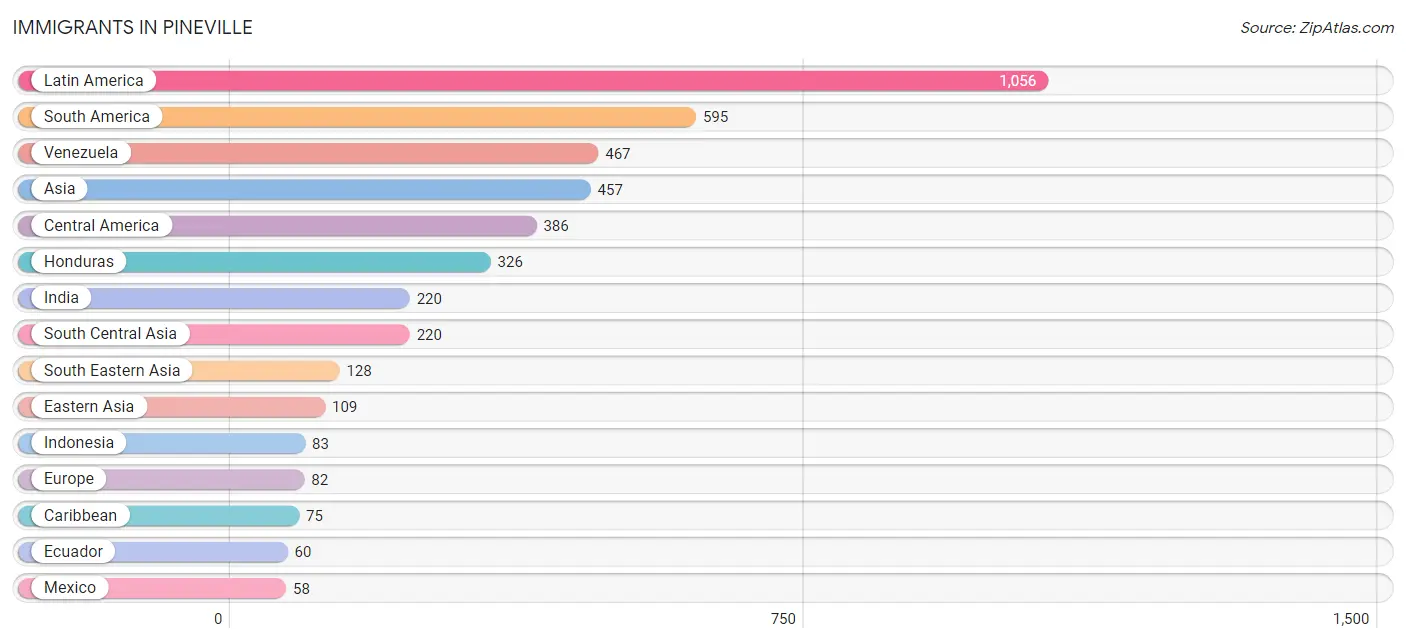
The most numerous immigrant groups reported in Pineville came from Latin America (1,056 | 10.0%), South America (595 | 5.7%), Venezuela (467 | 4.4%), Asia (457 | 4.3%), and Central America (386 | 3.7%), together accounting for 28.1% of all Pineville residents.
| Immigration Origin | # Population | % Population |
| Africa | 33 | 0.3% |
| Asia | 457 | 4.3% |
| Australia | 8 | 0.1% |
| Brazil | 8 | 0.1% |
| Canada | 5 | 0.1% |
| Caribbean | 75 | 0.7% |
| Central America | 386 | 3.7% |
| China | 41 | 0.4% |
| Colombia | 51 | 0.5% |
| Dominican Republic | 41 | 0.4% |
| Eastern Asia | 109 | 1.0% |
| Eastern Europe | 39 | 0.4% |
| Ecuador | 60 | 0.6% |
| Egypt | 21 | 0.2% |
| El Salvador | 2 | 0.0% |
| England | 13 | 0.1% |
| Europe | 82 | 0.8% |
| Germany | 5 | 0.1% |
| Greece | 10 | 0.1% |
| Haiti | 9 | 0.1% |
| Honduras | 326 | 3.1% |
| India | 220 | 2.1% |
| Indonesia | 83 | 0.8% |
| Italy | 5 | 0.1% |
| Jamaica | 25 | 0.2% |
| Japan | 19 | 0.2% |
| Korea | 49 | 0.5% |
| Latin America | 1,056 | 10.0% |
| Mexico | 58 | 0.5% |
| Moldova | 11 | 0.1% |
| Northern Africa | 21 | 0.2% |
| Northern Europe | 23 | 0.2% |
| Oceania | 8 | 0.1% |
| Peru | 9 | 0.1% |
| Philippines | 29 | 0.3% |
| Russia | 28 | 0.3% |
| South Africa | 12 | 0.1% |
| South America | 595 | 5.7% |
| South Central Asia | 220 | 2.1% |
| South Eastern Asia | 128 | 1.2% |
| Southern Europe | 15 | 0.1% |
| Taiwan | 26 | 0.3% |
| Venezuela | 467 | 4.4% |
| Vietnam | 16 | 0.2% |
| Western Europe | 5 | 0.1% | View All 45 Rows |
Sex and Age in Pineville
Sex and Age in Pineville
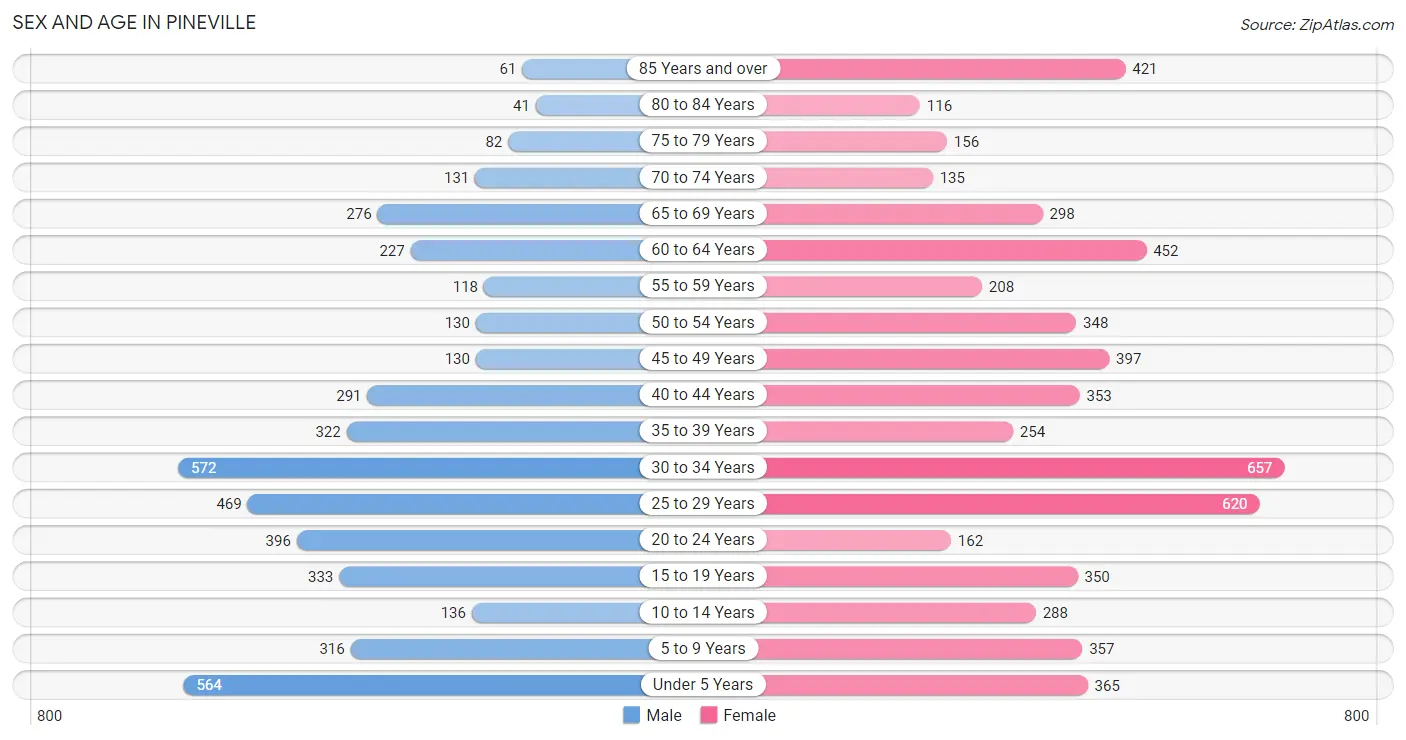
The most populous age groups in Pineville are 30 to 34 Years (572 | 12.4%) for men and 30 to 34 Years (657 | 11.1%) for women.
| Age Bracket | Male | Female |
| Under 5 Years | 564 (12.3%) | 365 (6.1%) |
| 5 to 9 Years | 316 (6.9%) | 357 (6.0%) |
| 10 to 14 Years | 136 (3.0%) | 288 (4.9%) |
| 15 to 19 Years | 333 (7.2%) | 350 (5.9%) |
| 20 to 24 Years | 396 (8.6%) | 162 (2.7%) |
| 25 to 29 Years | 469 (10.2%) | 620 (10.4%) |
| 30 to 34 Years | 572 (12.4%) | 657 (11.1%) |
| 35 to 39 Years | 322 (7.0%) | 254 (4.3%) |
| 40 to 44 Years | 291 (6.3%) | 353 (5.9%) |
| 45 to 49 Years | 130 (2.8%) | 397 (6.7%) |
| 50 to 54 Years | 130 (2.8%) | 348 (5.9%) |
| 55 to 59 Years | 118 (2.6%) | 208 (3.5%) |
| 60 to 64 Years | 227 (4.9%) | 452 (7.6%) |
| 65 to 69 Years | 276 (6.0%) | 298 (5.0%) |
| 70 to 74 Years | 131 (2.9%) | 135 (2.3%) |
| 75 to 79 Years | 82 (1.8%) | 156 (2.6%) |
| 80 to 84 Years | 41 (0.9%) | 116 (1.9%) |
| 85 Years and over | 61 (1.3%) | 421 (7.1%) |
| Total | 4,595 (100.0%) | 5,937 (100.0%) |
Families and Households in Pineville
Median Family Size in Pineville
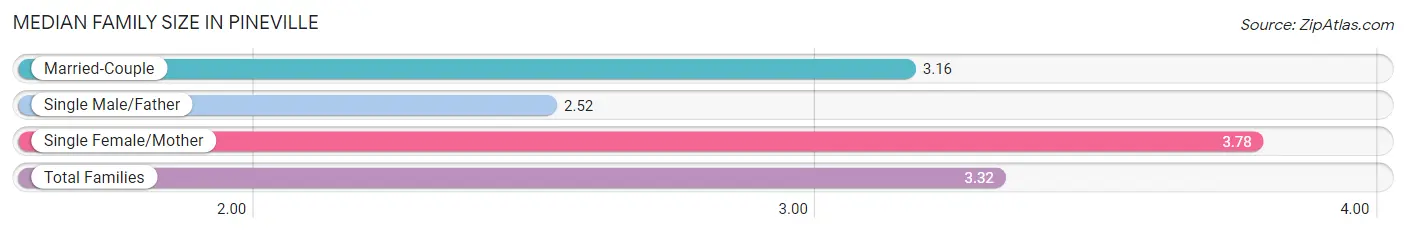
The median family size in Pineville is 3.32 persons per family, with single female/mother families (800 | 33.2%) accounting for the largest median family size of 3.78 persons per family. On the other hand, single male/father families (164 | 6.8%) represent the smallest median family size with 2.52 persons per family.
| Family Type | # Families | Family Size |
| Married-Couple | 1,443 (60.0%) | 3.16 |
| Single Male/Father | 164 (6.8%) | 2.52 |
| Single Female/Mother | 800 (33.2%) | 3.78 |
| Total Families | 2,407 (100.0%) | 3.32 |
Median Household Size in Pineville
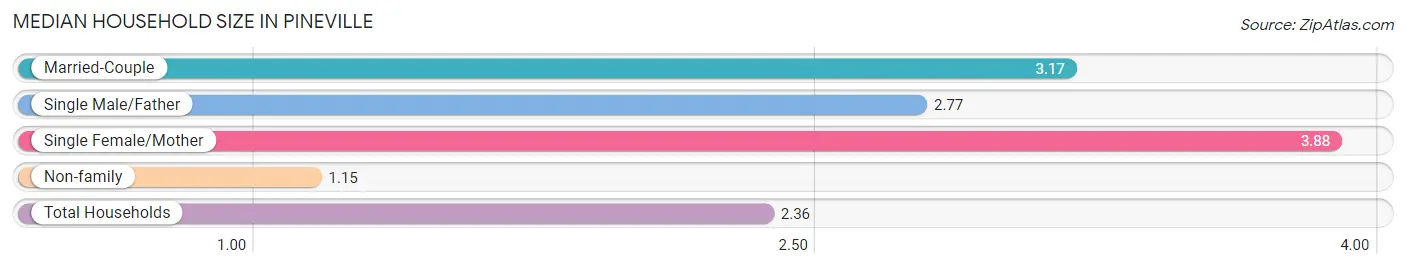
The median household size in Pineville is 2.36 persons per household, with single female/mother households (800 | 18.1%) accounting for the largest median household size of 3.88 persons per household. non-family households (2,010 | 45.5%) represent the smallest median household size with 1.15 persons per household.
| Household Type | # Households | Household Size |
| Married-Couple | 1,443 (32.7%) | 3.17 |
| Single Male/Father | 164 (3.7%) | 2.77 |
| Single Female/Mother | 800 (18.1%) | 3.88 |
| Non-family | 2,010 (45.5%) | 1.15 |
| Total Households | 4,417 (100.0%) | 2.36 |
Household Size by Marriage Status in Pineville
Out of a total of 4,417 households in Pineville, 2,407 (54.5%) are family households, while 2,010 (45.5%) are nonfamily households. The most numerous type of family households are 2-person households, comprising 1,044, and the most common type of nonfamily households are 1-person households, comprising 1,784.
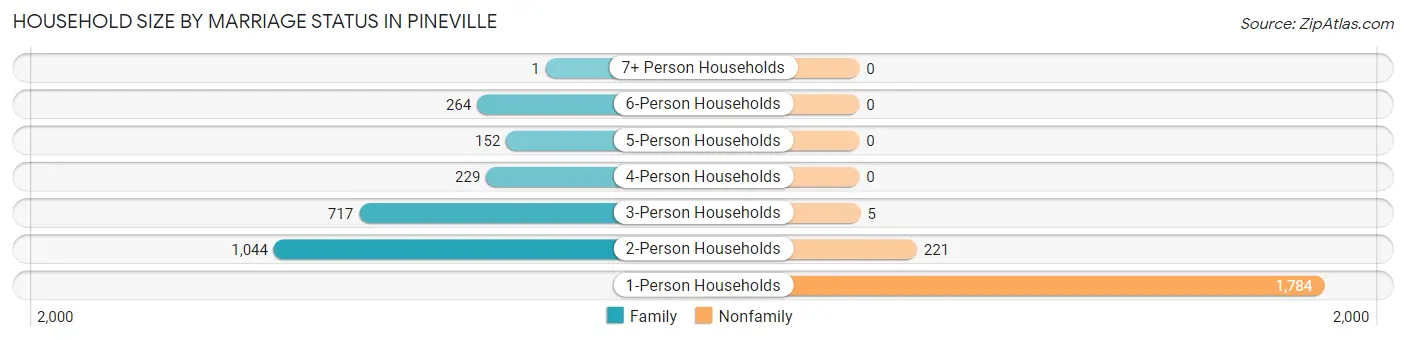
| Household Size | Family Households | Nonfamily Households |
| 1-Person Households | - | 1,784 (40.4%) |
| 2-Person Households | 1,044 (23.6%) | 221 (5.0%) |
| 3-Person Households | 717 (16.2%) | 5 (0.1%) |
| 4-Person Households | 229 (5.2%) | 0 (0.0%) |
| 5-Person Households | 152 (3.4%) | 0 (0.0%) |
| 6-Person Households | 264 (6.0%) | 0 (0.0%) |
| 7+ Person Households | 1 (0.0%) | 0 (0.0%) |
| Total | 2,407 (54.5%) | 2,010 (45.5%) |
Female Fertility in Pineville
Fertility by Age in Pineville
Average fertility rate in Pineville is 83.0 births per 1,000 women. Women in the age bracket of 20 to 34 years have the highest fertility rate with 161.0 births per 1,000 women. Women in the age bracket of 20 to 34 years acount for 97.1% of all women with births.
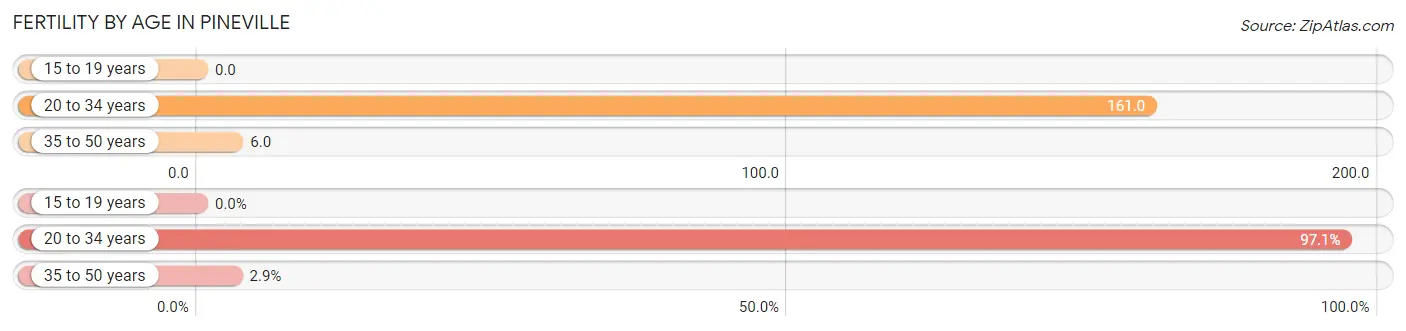
| Age Bracket | Women with Births | Births / 1,000 Women |
| 15 to 19 years | 0 (0.0%) | 0.0 |
| 20 to 34 years | 232 (97.1%) | 161.0 |
| 35 to 50 years | 7 (2.9%) | 6.0 |
| Total | 239 (100.0%) | 83.0 |
Fertility by Age by Marriage Status in Pineville
91.2% of women with births (239) in Pineville are married. The highest percentage of unmarried women with births falls into 20 to 34 years age bracket with 9.0% of them unmarried at the time of birth, while the lowest percentage of unmarried women with births belong to 35 to 50 years age bracket with 0.0% of them unmarried.
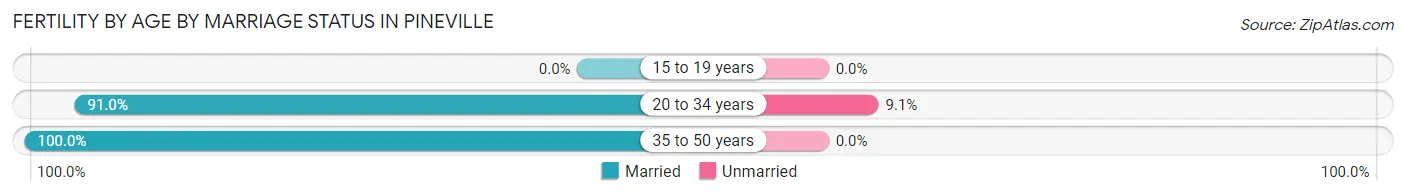
| Age Bracket | Married | Unmarried |
| 15 to 19 years | 0 (0.0%) | 0 (0.0%) |
| 20 to 34 years | 211 (90.9%) | 21 (9.0%) |
| 35 to 50 years | 7 (100.0%) | 0 (0.0%) |
| Total | 218 (91.2%) | 21 (8.8%) |
Fertility by Education in Pineville
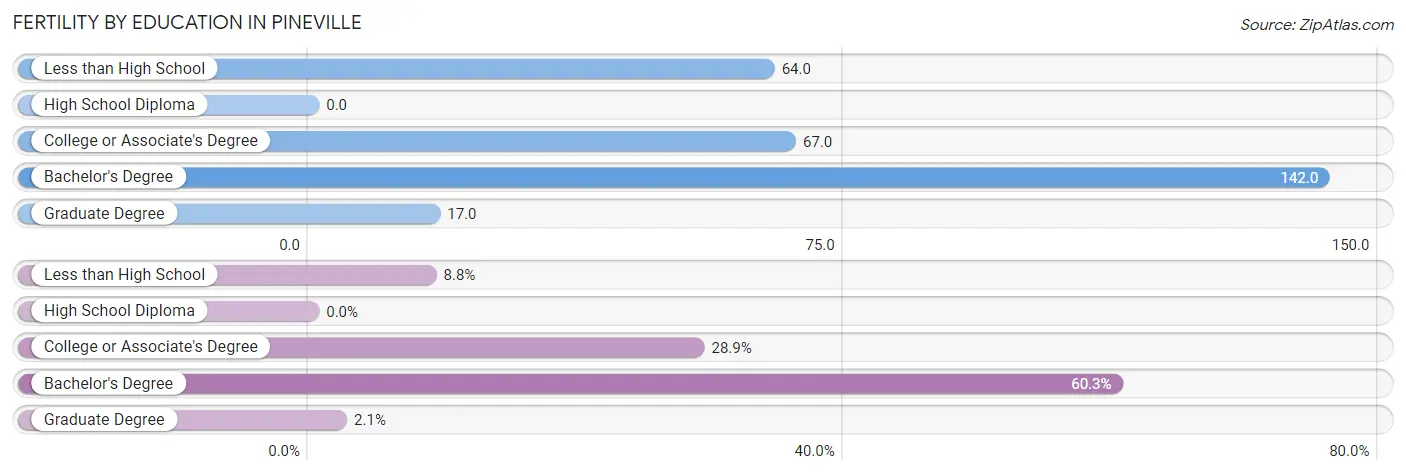
| Educational Attainment | Women with Births | Births / 1,000 Women |
| Less than High School | 21 (8.8%) | 64.0 |
| High School Diploma | 0 (0.0%) | 0.0 |
| College or Associate's Degree | 69 (28.9%) | 67.0 |
| Bachelor's Degree | 144 (60.3%) | 142.0 |
| Graduate Degree | 5 (2.1%) | 17.0 |
| Total | 239 (100.0%) | 83.0 |
Fertility by Education by Marriage Status in Pineville
8.8% of women with births in Pineville are unmarried. Women with the educational attainment of college or associate's degree are most likely to be married with 100.0% of them married at childbirth, while women with the educational attainment of less than high school are least likely to be married with 100.0% of them unmarried at childbirth.
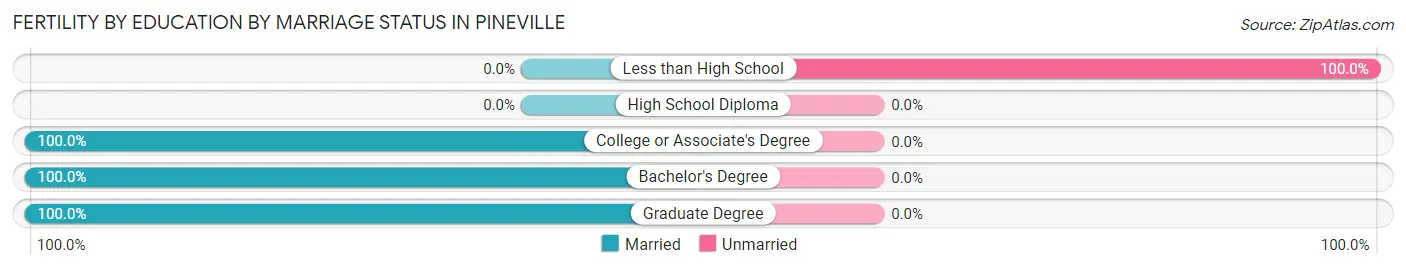
| Educational Attainment | Married | Unmarried |
| Less than High School | 0 (0.0%) | 21 (100.0%) |
| High School Diploma | 0 (0.0%) | 0 (0.0%) |
| College or Associate's Degree | 69 (100.0%) | 0 (0.0%) |
| Bachelor's Degree | 144 (100.0%) | 0 (0.0%) |
| Graduate Degree | 5 (100.0%) | 0 (0.0%) |
| Total | 218 (91.2%) | 21 (8.8%) |
Employment Characteristics in Pineville
Employment by Class of Employer in Pineville
Among the 4,844 employed individuals in Pineville, private company employees (3,434 | 70.9%), not-for-profit organizations (609 | 12.6%), and self-employed (not incorporated) (302 | 6.2%) make up the most common classes of employment.
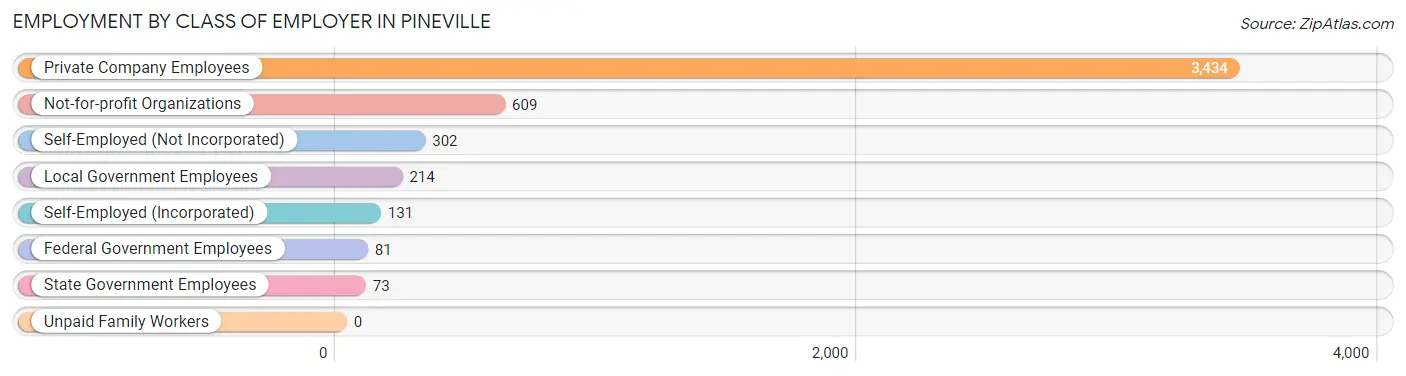
| Employer Class | # Employees | % Employees |
| Private Company Employees | 3,434 | 70.9% |
| Self-Employed (Incorporated) | 131 | 2.7% |
| Self-Employed (Not Incorporated) | 302 | 6.2% |
| Not-for-profit Organizations | 609 | 12.6% |
| Local Government Employees | 214 | 4.4% |
| State Government Employees | 73 | 1.5% |
| Federal Government Employees | 81 | 1.7% |
| Unpaid Family Workers | 0 | 0.0% |
| Total | 4,844 | 100.0% |
Employment Status by Age in Pineville
According to the labor force statistics for Pineville, out of the total population over 16 years of age (8,143), 65.7% or 5,350 individuals are in the labor force, with 3.9% or 209 of them unemployed. The age group with the highest labor force participation rate is 30 to 34 years, with 93.5% or 1,149 individuals in the labor force. Within the labor force, the 16 to 19 years age range has the highest percentage of unemployed individuals, with 47.9% or 68 of them being unemployed.
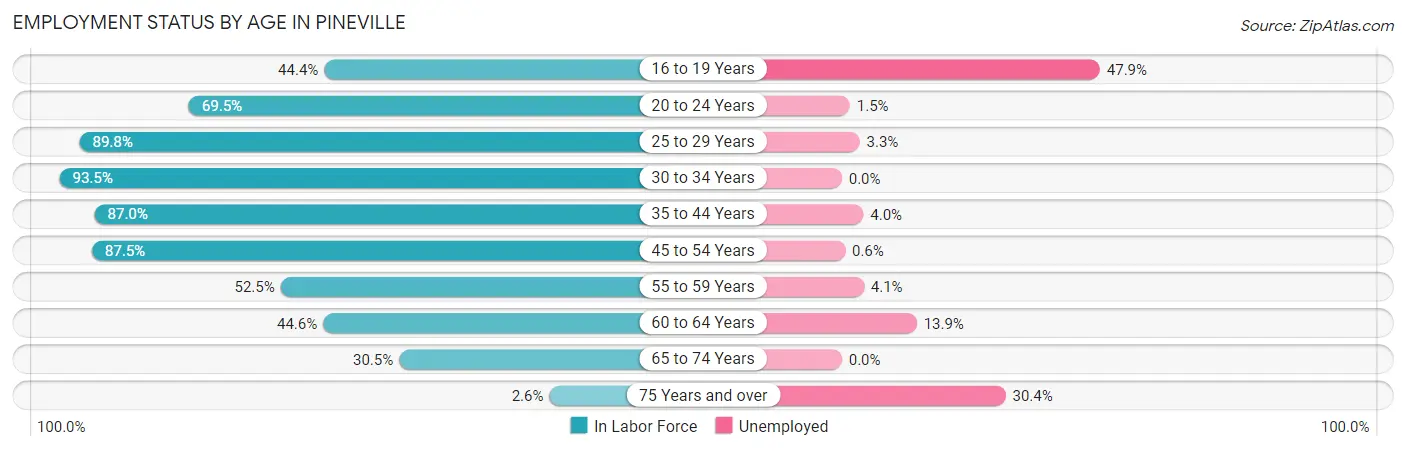
| Age Bracket | In Labor Force | Unemployed |
| 16 to 19 Years | 142 (44.4%) | 68 (47.9%) |
| 20 to 24 Years | 388 (69.5%) | 6 (1.5%) |
| 25 to 29 Years | 978 (89.8%) | 32 (3.3%) |
| 30 to 34 Years | 1,149 (93.5%) | 0 (0.0%) |
| 35 to 44 Years | 1,061 (87.0%) | 42 (4.0%) |
| 45 to 54 Years | 879 (87.5%) | 5 (0.6%) |
| 55 to 59 Years | 171 (52.5%) | 7 (4.1%) |
| 60 to 64 Years | 303 (44.6%) | 42 (13.9%) |
| 65 to 74 Years | 256 (30.5%) | 0 (0.0%) |
| 75 Years and over | 23 (2.6%) | 7 (30.4%) |
| Total | 5,350 (65.7%) | 209 (3.9%) |
Employment Status by Educational Attainment in Pineville
According to labor force statistics for Pineville, 81.9% of individuals (4,544) out of the total population between 25 and 64 years of age (5,548) are in the labor force, with 2.8% or 127 of them being unemployed. The group with the highest labor force participation rate are those with the educational attainment of college / associate degree, with 86.1% or 1,765 individuals in the labor force. Within the labor force, individuals with college / associate degree education have the highest percentage of unemployment, with 4.0% or 71 of them being unemployed.
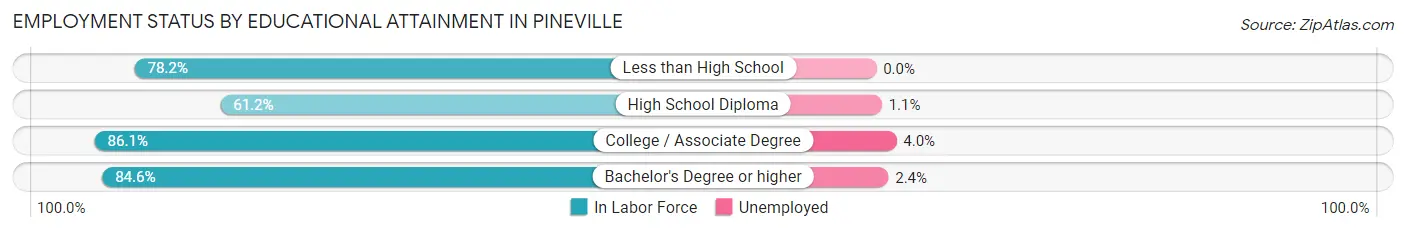
| Educational Attainment | In Labor Force | Unemployed |
| Less than High School | 172 (78.2%) | 0 (0.0%) |
| High School Diploma | 437 (61.2%) | 8 (1.1%) |
| College / Associate Degree | 1,765 (86.1%) | 82 (4.0%) |
| Bachelor's Degree or higher | 2,169 (84.6%) | 62 (2.4%) |
| Total | 4,544 (81.9%) | 155 (2.8%) |
Employment Occupations by Sex in Pineville
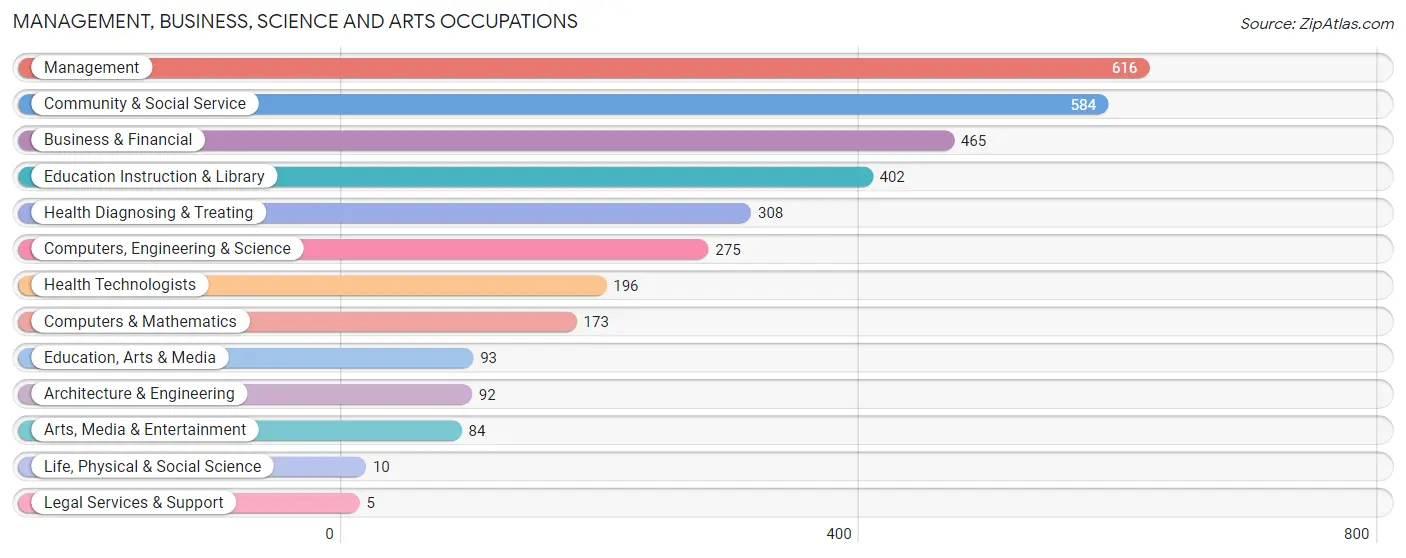
Management, Business, Science and Arts Occupations
The most common Management, Business, Science and Arts occupations in Pineville are Management (616 | 12.0%), Community & Social Service (584 | 11.4%), Business & Financial (465 | 9.0%), Education Instruction & Library (402 | 7.8%), and Health Diagnosing & Treating (308 | 6.0%).
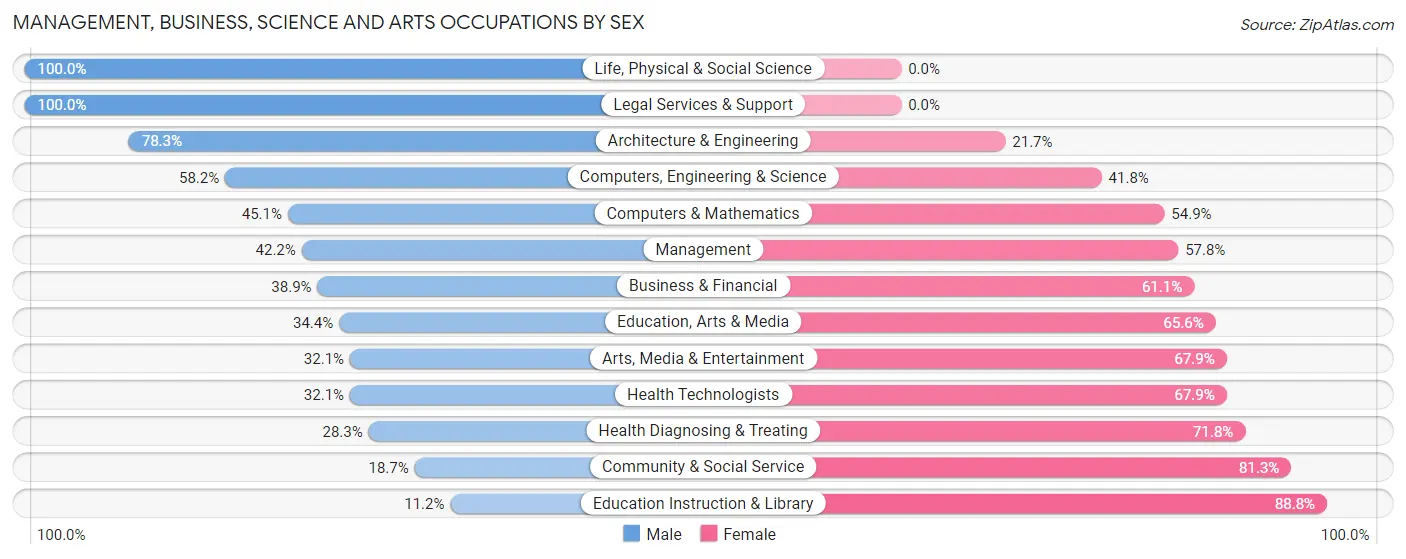
Management, Business, Science and Arts Occupations by Sex
Within the Management, Business, Science and Arts occupations in Pineville, the most male-oriented occupations are Life, Physical & Social Science (100.0%), Legal Services & Support (100.0%), and Architecture & Engineering (78.3%), while the most female-oriented occupations are Education Instruction & Library (88.8%), Community & Social Service (81.3%), and Health Diagnosing & Treating (71.8%).
| Occupation | Male | Female |
| Management | 260 (42.2%) | 356 (57.8%) |
| Business & Financial | 181 (38.9%) | 284 (61.1%) |
| Computers, Engineering & Science | 160 (58.2%) | 115 (41.8%) |
| Computers & Mathematics | 78 (45.1%) | 95 (54.9%) |
| Architecture & Engineering | 72 (78.3%) | 20 (21.7%) |
| Life, Physical & Social Science | 10 (100.0%) | 0 (0.0%) |
| Community & Social Service | 109 (18.7%) | 475 (81.3%) |
| Education, Arts & Media | 32 (34.4%) | 61 (65.6%) |
| Legal Services & Support | 5 (100.0%) | 0 (0.0%) |
| Education Instruction & Library | 45 (11.2%) | 357 (88.8%) |
| Arts, Media & Entertainment | 27 (32.1%) | 57 (67.9%) |
| Health Diagnosing & Treating | 87 (28.2%) | 221 (71.8%) |
| Health Technologists | 63 (32.1%) | 133 (67.9%) |
| Total (Category) | 797 (35.4%) | 1,451 (64.5%) |
| Total (Overall) | 2,376 (46.2%) | 2,766 (53.8%) |
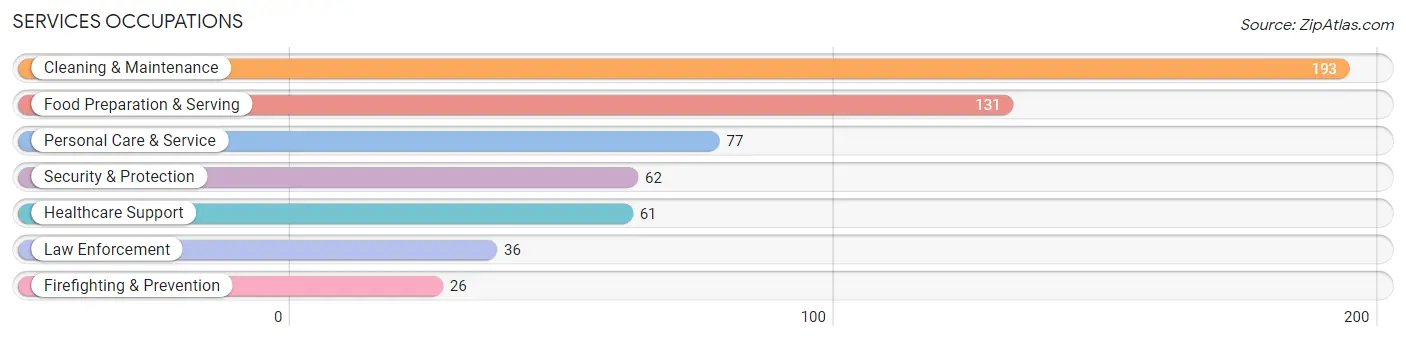
Services Occupations
The most common Services occupations in Pineville are Cleaning & Maintenance (193 | 3.7%), Food Preparation & Serving (131 | 2.5%), Personal Care & Service (77 | 1.5%), Security & Protection (62 | 1.2%), and Healthcare Support (61 | 1.2%).
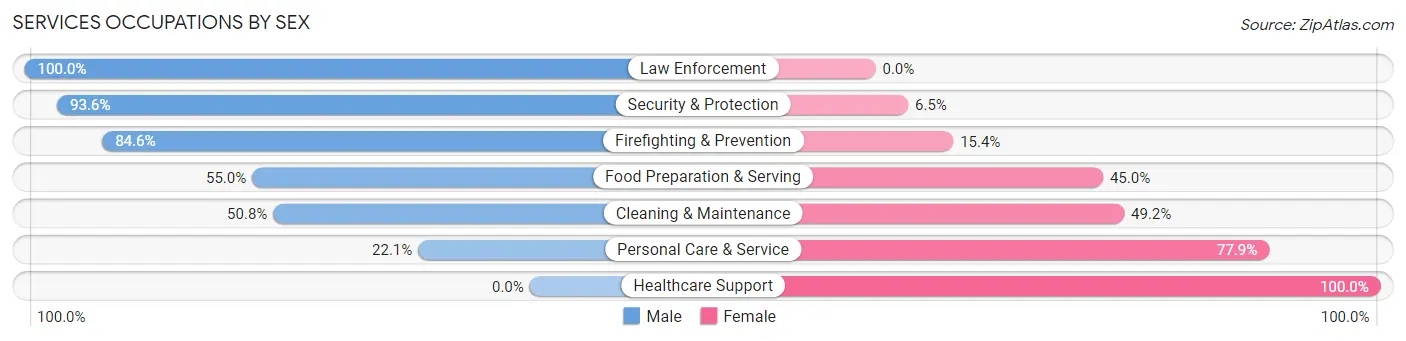
Services Occupations by Sex
Within the Services occupations in Pineville, the most male-oriented occupations are Law Enforcement (100.0%), Security & Protection (93.5%), and Firefighting & Prevention (84.6%), while the most female-oriented occupations are Healthcare Support (100.0%), Personal Care & Service (77.9%), and Cleaning & Maintenance (49.2%).
| Occupation | Male | Female |
| Healthcare Support | 0 (0.0%) | 61 (100.0%) |
| Security & Protection | 58 (93.5%) | 4 (6.5%) |
| Firefighting & Prevention | 22 (84.6%) | 4 (15.4%) |
| Law Enforcement | 36 (100.0%) | 0 (0.0%) |
| Food Preparation & Serving | 72 (55.0%) | 59 (45.0%) |
| Cleaning & Maintenance | 98 (50.8%) | 95 (49.2%) |
| Personal Care & Service | 17 (22.1%) | 60 (77.9%) |
| Total (Category) | 245 (46.8%) | 279 (53.2%) |
| Total (Overall) | 2,376 (46.2%) | 2,766 (53.8%) |
Sales and Office Occupations
The most common Sales and Office occupations in Pineville are Sales & Related (707 | 13.8%), and Office & Administration (657 | 12.8%).

Sales and Office Occupations by Sex

| Occupation | Male | Female |
| Sales & Related | 441 (62.4%) | 266 (37.6%) |
| Office & Administration | 66 (10.1%) | 591 (89.9%) |
| Total (Category) | 507 (37.2%) | 857 (62.8%) |
| Total (Overall) | 2,376 (46.2%) | 2,766 (53.8%) |
Natural Resources, Construction and Maintenance Occupations
The most common Natural Resources, Construction and Maintenance occupations in Pineville are Construction & Extraction (109 | 2.1%), and Installation, Maintenance & Repair (79 | 1.5%).

Natural Resources, Construction and Maintenance Occupations by Sex
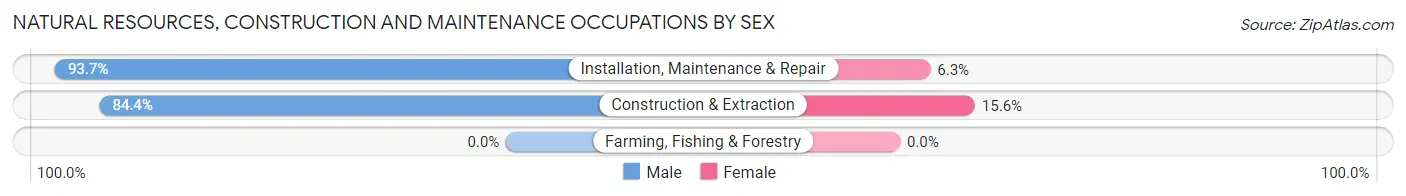
| Occupation | Male | Female |
| Farming, Fishing & Forestry | 0 (0.0%) | 0 (0.0%) |
| Construction & Extraction | 92 (84.4%) | 17 (15.6%) |
| Installation, Maintenance & Repair | 74 (93.7%) | 5 (6.3%) |
| Total (Category) | 166 (88.3%) | 22 (11.7%) |
| Total (Overall) | 2,376 (46.2%) | 2,766 (53.8%) |
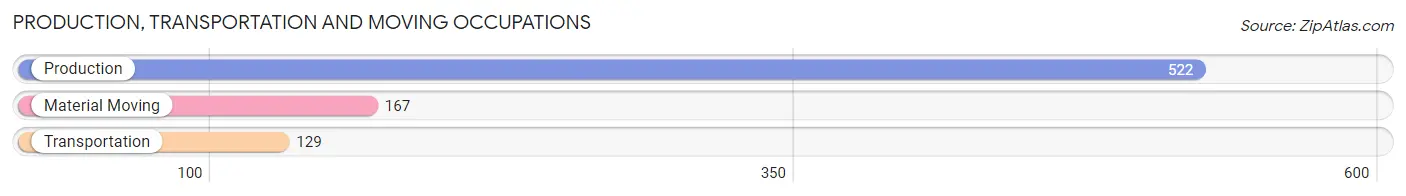
Production, Transportation and Moving Occupations
The most common Production, Transportation and Moving occupations in Pineville are Production (522 | 10.2%), Material Moving (167 | 3.3%), and Transportation (129 | 2.5%).
Production, Transportation and Moving Occupations by Sex
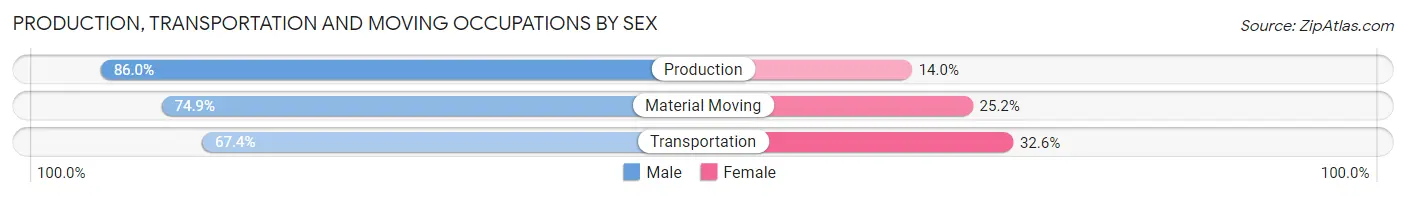
| Occupation | Male | Female |
| Production | 449 (86.0%) | 73 (14.0%) |
| Transportation | 87 (67.4%) | 42 (32.6%) |
| Material Moving | 125 (74.9%) | 42 (25.2%) |
| Total (Category) | 661 (80.8%) | 157 (19.2%) |
| Total (Overall) | 2,376 (46.2%) | 2,766 (53.8%) |
Employment Industries by Sex in Pineville
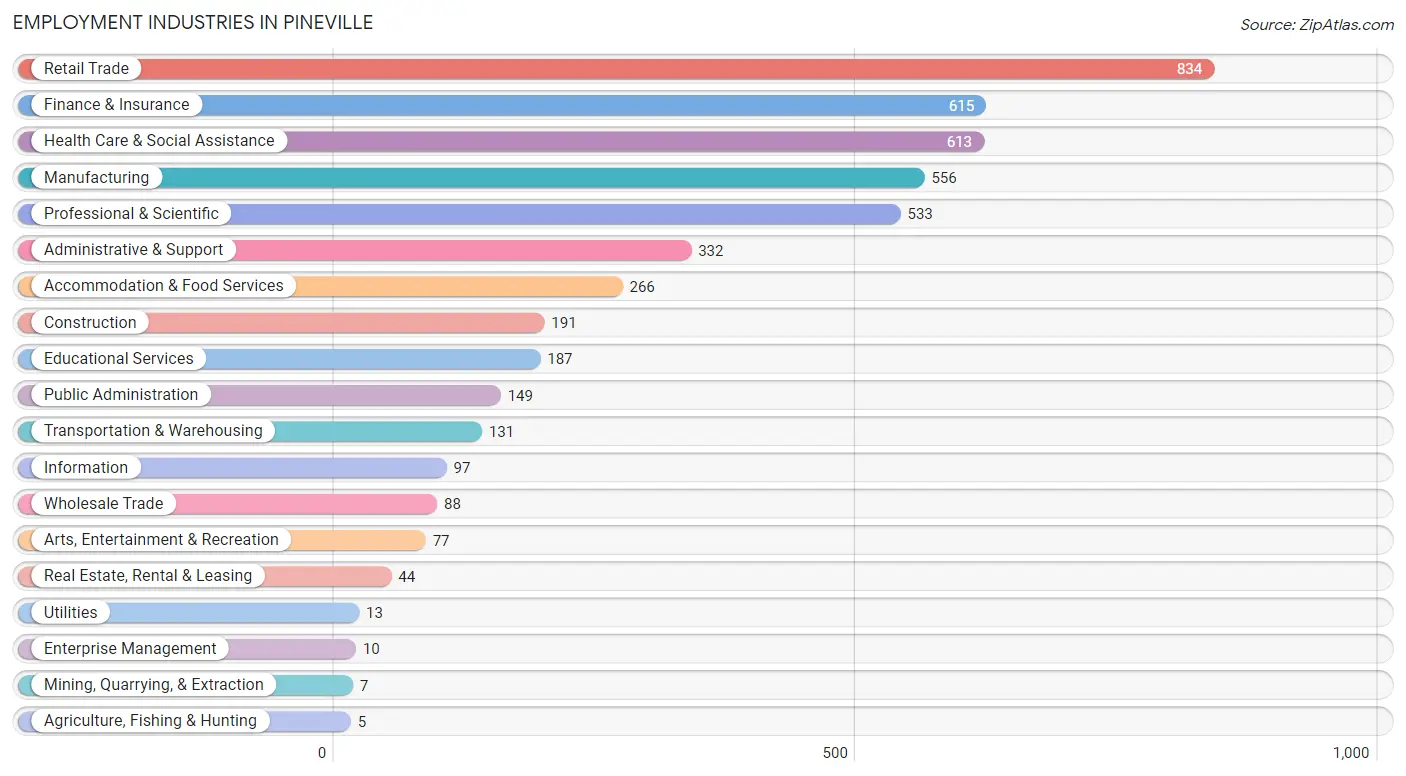
Employment Industries in Pineville
The major employment industries in Pineville include Retail Trade (834 | 16.2%), Finance & Insurance (615 | 12.0%), Health Care & Social Assistance (613 | 11.9%), Manufacturing (556 | 10.8%), and Professional & Scientific (533 | 10.4%).
Employment Industries by Sex in Pineville
The Pineville industries that see more men than women are Mining, Quarrying, & Extraction (100.0%), Wholesale Trade (81.8%), and Manufacturing (79.7%), whereas the industries that tend to have a higher number of women are Agriculture, Fishing & Hunting (100.0%), Real Estate, Rental & Leasing (100.0%), and Enterprise Management (100.0%).
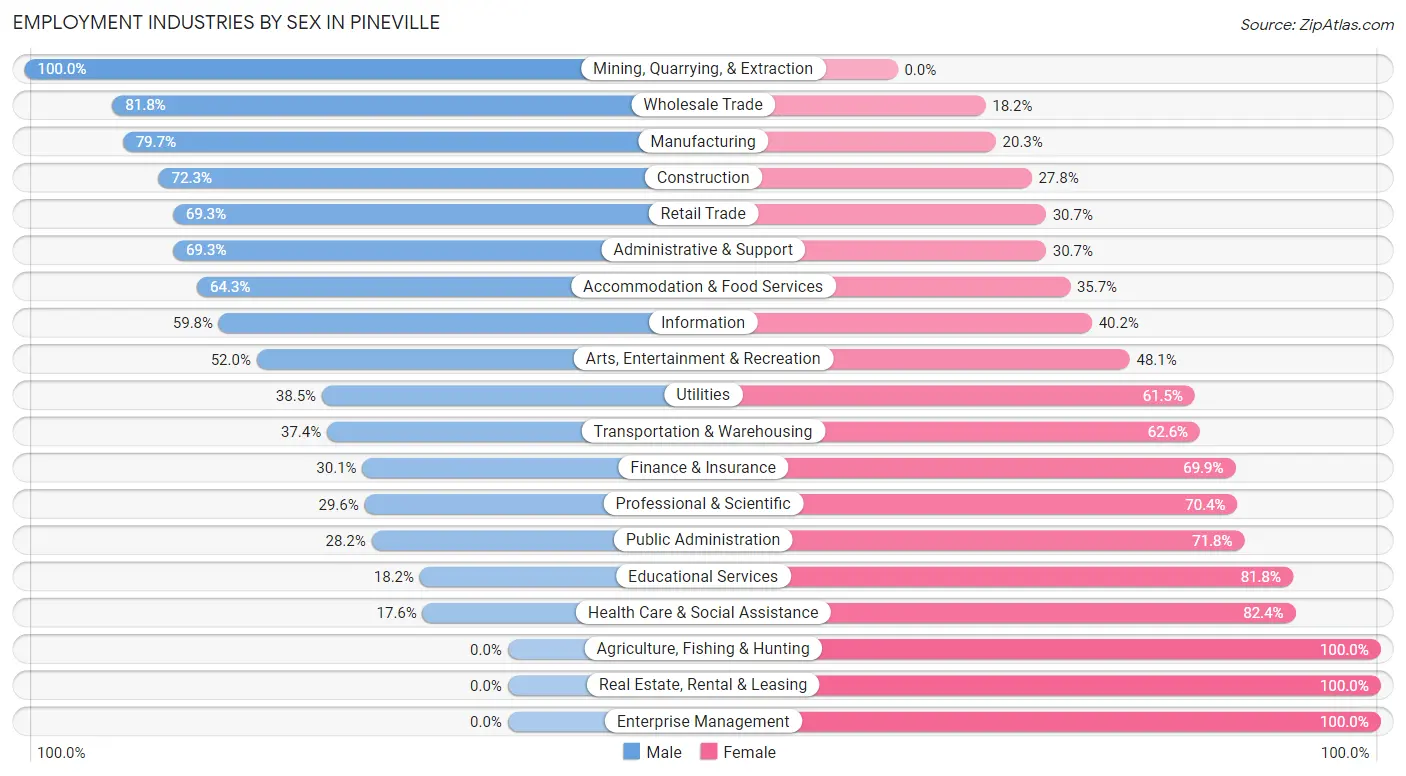
| Industry | Male | Female |
| Agriculture, Fishing & Hunting | 0 (0.0%) | 5 (100.0%) |
| Mining, Quarrying, & Extraction | 7 (100.0%) | 0 (0.0%) |
| Construction | 138 (72.3%) | 53 (27.8%) |
| Manufacturing | 443 (79.7%) | 113 (20.3%) |
| Wholesale Trade | 72 (81.8%) | 16 (18.2%) |
| Retail Trade | 578 (69.3%) | 256 (30.7%) |
| Transportation & Warehousing | 49 (37.4%) | 82 (62.6%) |
| Utilities | 5 (38.5%) | 8 (61.5%) |
| Information | 58 (59.8%) | 39 (40.2%) |
| Finance & Insurance | 185 (30.1%) | 430 (69.9%) |
| Real Estate, Rental & Leasing | 0 (0.0%) | 44 (100.0%) |
| Professional & Scientific | 158 (29.6%) | 375 (70.4%) |
| Enterprise Management | 0 (0.0%) | 10 (100.0%) |
| Administrative & Support | 230 (69.3%) | 102 (30.7%) |
| Educational Services | 34 (18.2%) | 153 (81.8%) |
| Health Care & Social Assistance | 108 (17.6%) | 505 (82.4%) |
| Arts, Entertainment & Recreation | 40 (51.9%) | 37 (48.0%) |
| Accommodation & Food Services | 171 (64.3%) | 95 (35.7%) |
| Public Administration | 42 (28.2%) | 107 (71.8%) |
| Total | 2,376 (46.2%) | 2,766 (53.8%) |
Education in Pineville
School Enrollment in Pineville
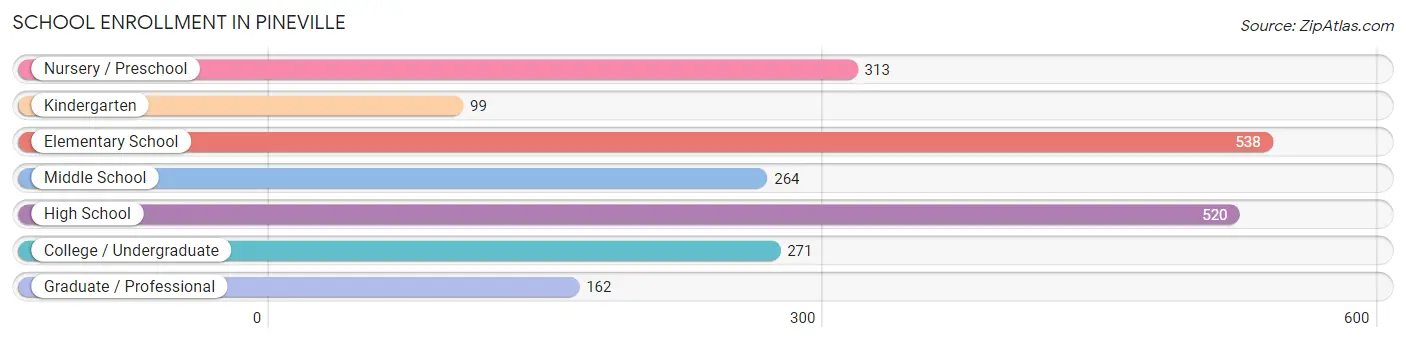
The most common levels of schooling among the 2,167 students in Pineville are elementary school (538 | 24.8%), high school (520 | 24.0%), and nursery / preschool (313 | 14.4%).
| School Level | # Students | % Students |
| Nursery / Preschool | 313 | 14.4% |
| Kindergarten | 99 | 4.6% |
| Elementary School | 538 | 24.8% |
| Middle School | 264 | 12.2% |
| High School | 520 | 24.0% |
| College / Undergraduate | 271 | 12.5% |
| Graduate / Professional | 162 | 7.5% |
| Total | 2,167 | 100.0% |
School Enrollment by Age by Funding Source in Pineville
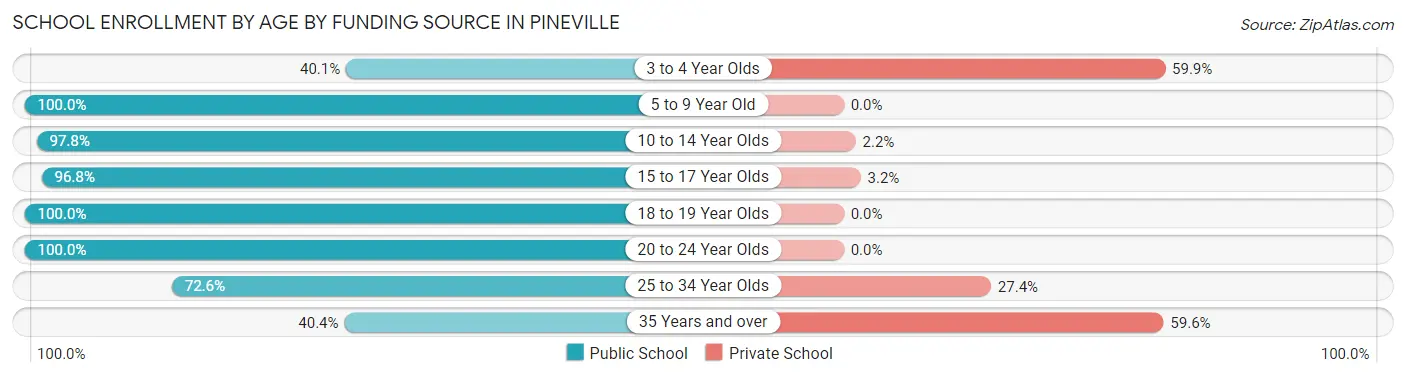
Out of a total of 2,167 students who are enrolled in schools in Pineville, 347 (16.0%) attend a private institution, while the remaining 1,820 (84.0%) are enrolled in public schools. The age group of 3 to 4 year olds has the highest likelihood of being enrolled in private schools, with 179 (59.9% in the age bracket) enrolled. Conversely, the age group of 5 to 9 year old has the lowest likelihood of being enrolled in a private school, with 651 (100.0% in the age bracket) attending a public institution.
| Age Bracket | Public School | Private School |
| 3 to 4 Year Olds | 120 (40.1%) | 179 (59.9%) |
| 5 to 9 Year Old | 651 (100.0%) | 0 (0.0%) |
| 10 to 14 Year Olds | 263 (97.8%) | 6 (2.2%) |
| 15 to 17 Year Olds | 399 (96.8%) | 13 (3.2%) |
| 18 to 19 Year Olds | 88 (100.0%) | 0 (0.0%) |
| 20 to 24 Year Olds | 64 (100.0%) | 0 (0.0%) |
| 25 to 34 Year Olds | 180 (72.6%) | 68 (27.4%) |
| 35 Years and over | 55 (40.4%) | 81 (59.6%) |
| Total | 1,820 (84.0%) | 347 (16.0%) |
Educational Attainment by Field of Study in Pineville
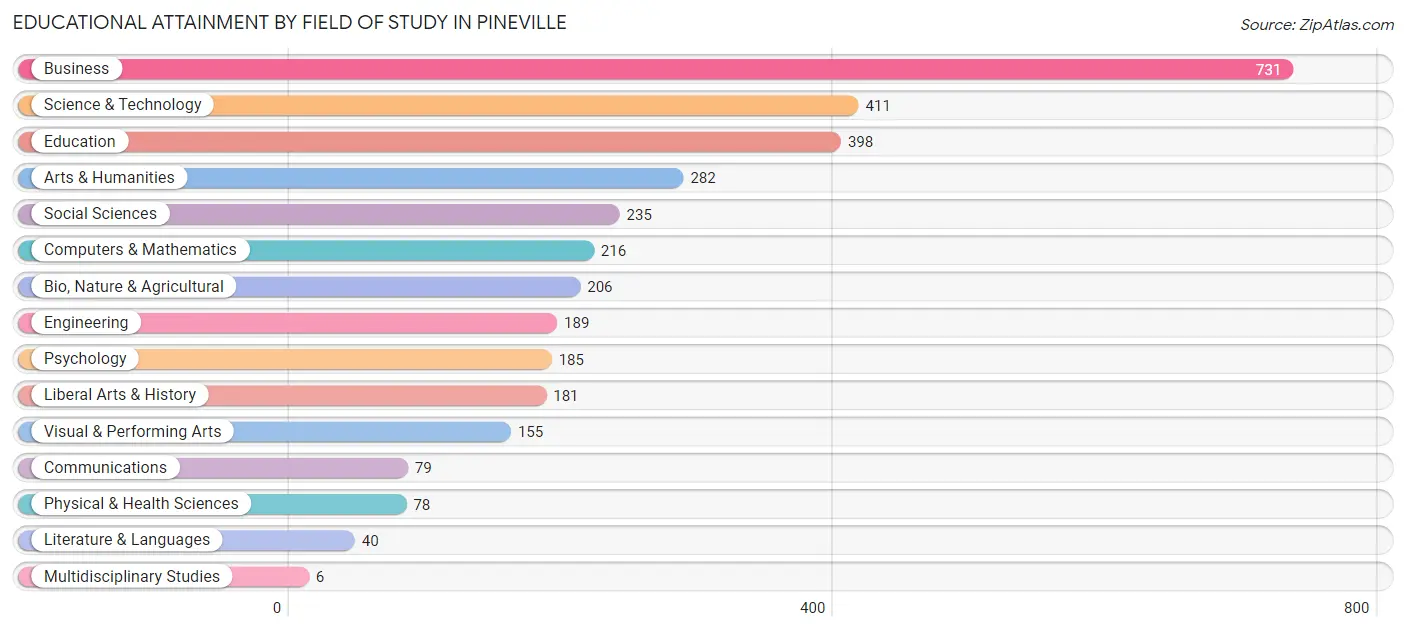
Business (731 | 21.5%), science & technology (411 | 12.1%), education (398 | 11.7%), arts & humanities (282 | 8.3%), and social sciences (235 | 6.9%) are the most common fields of study among 3,392 individuals in Pineville who have obtained a bachelor's degree or higher.
| Field of Study | # Graduates | % Graduates |
| Computers & Mathematics | 216 | 6.4% |
| Bio, Nature & Agricultural | 206 | 6.1% |
| Physical & Health Sciences | 78 | 2.3% |
| Psychology | 185 | 5.4% |
| Social Sciences | 235 | 6.9% |
| Engineering | 189 | 5.6% |
| Multidisciplinary Studies | 6 | 0.2% |
| Science & Technology | 411 | 12.1% |
| Business | 731 | 21.5% |
| Education | 398 | 11.7% |
| Literature & Languages | 40 | 1.2% |
| Liberal Arts & History | 181 | 5.3% |
| Visual & Performing Arts | 155 | 4.6% |
| Communications | 79 | 2.3% |
| Arts & Humanities | 282 | 8.3% |
| Total | 3,392 | 100.0% |
Transportation & Commute in Pineville
Vehicle Availability by Sex in Pineville
The most prevalent vehicle ownership categories in Pineville are males with 2 vehicles (974, accounting for 45.3%) and females with 2 vehicles (1,078, making up 36.1%).
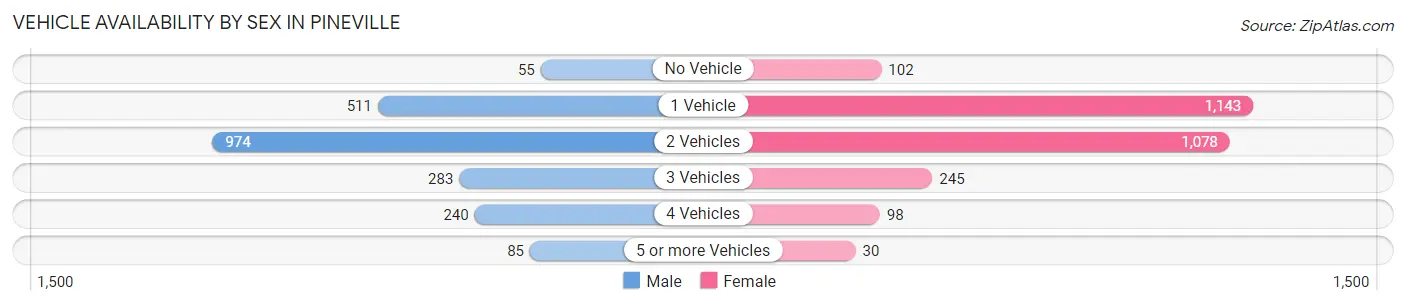
| Vehicles Available | Male | Female |
| No Vehicle | 55 (2.6%) | 102 (3.8%) |
| 1 Vehicle | 511 (23.8%) | 1,143 (42.4%) |
| 2 Vehicles | 974 (45.3%) | 1,078 (40.0%) |
| 3 Vehicles | 283 (13.2%) | 245 (9.1%) |
| 4 Vehicles | 240 (11.2%) | 98 (3.6%) |
| 5 or more Vehicles | 85 (4.0%) | 30 (1.1%) |
| Total | 2,148 (100.0%) | 2,696 (100.0%) |
Commute Time in Pineville
The most frequently occuring commute durations in Pineville are 15 to 19 minutes (859 commuters, 22.5%), 20 to 24 minutes (604 commuters, 15.8%), and 10 to 14 minutes (542 commuters, 14.2%).
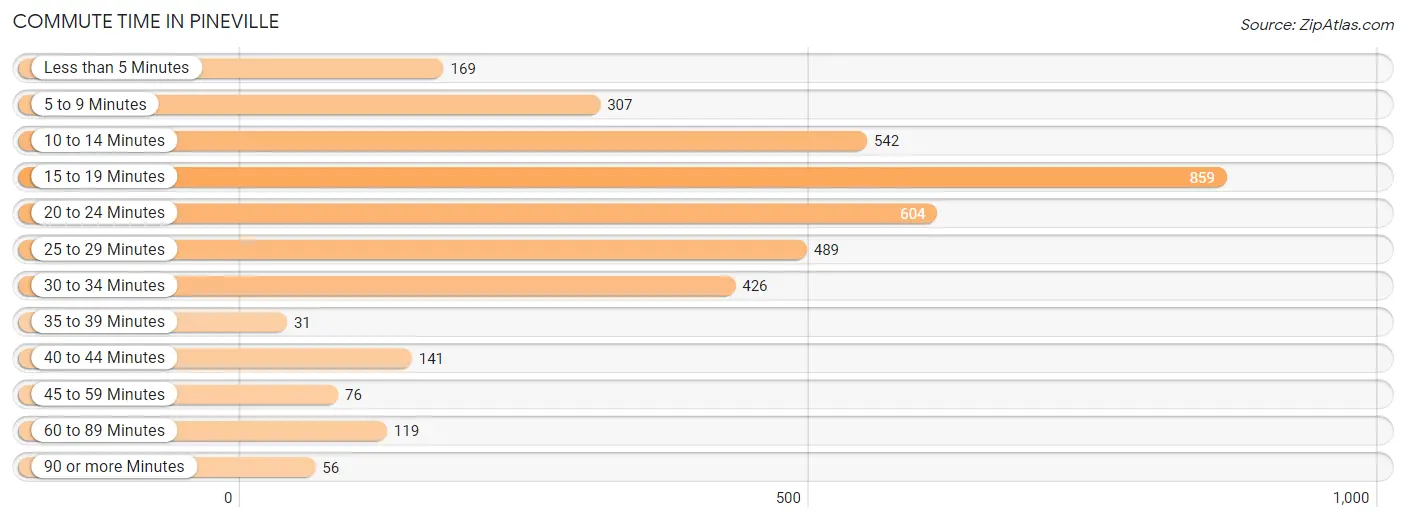
| Commute Time | # Commuters | % Commuters |
| Less than 5 Minutes | 169 | 4.4% |
| 5 to 9 Minutes | 307 | 8.0% |
| 10 to 14 Minutes | 542 | 14.2% |
| 15 to 19 Minutes | 859 | 22.5% |
| 20 to 24 Minutes | 604 | 15.8% |
| 25 to 29 Minutes | 489 | 12.8% |
| 30 to 34 Minutes | 426 | 11.2% |
| 35 to 39 Minutes | 31 | 0.8% |
| 40 to 44 Minutes | 141 | 3.7% |
| 45 to 59 Minutes | 76 | 2.0% |
| 60 to 89 Minutes | 119 | 3.1% |
| 90 or more Minutes | 56 | 1.5% |
Commute Time by Sex in Pineville
The most common commute times in Pineville are 15 to 19 minutes (364 commuters, 20.0%) for males and 15 to 19 minutes (495 commuters, 24.8%) for females.
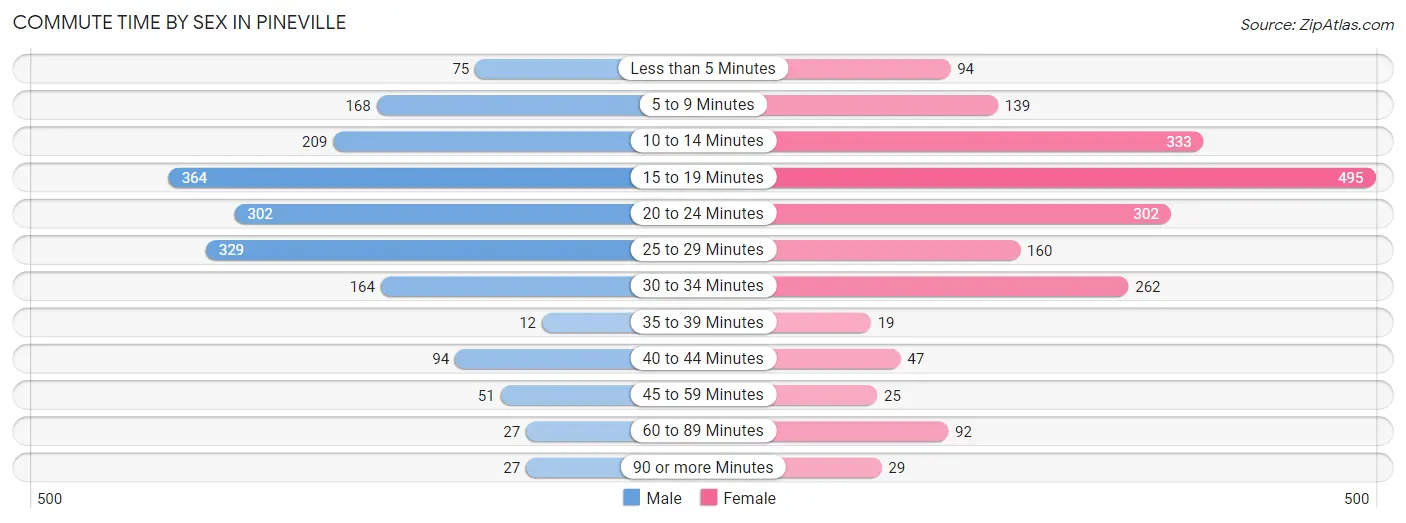
| Commute Time | Male | Female |
| Less than 5 Minutes | 75 (4.1%) | 94 (4.7%) |
| 5 to 9 Minutes | 168 (9.2%) | 139 (7.0%) |
| 10 to 14 Minutes | 209 (11.5%) | 333 (16.7%) |
| 15 to 19 Minutes | 364 (20.0%) | 495 (24.8%) |
| 20 to 24 Minutes | 302 (16.6%) | 302 (15.1%) |
| 25 to 29 Minutes | 329 (18.1%) | 160 (8.0%) |
| 30 to 34 Minutes | 164 (9.0%) | 262 (13.1%) |
| 35 to 39 Minutes | 12 (0.7%) | 19 (0.9%) |
| 40 to 44 Minutes | 94 (5.2%) | 47 (2.4%) |
| 45 to 59 Minutes | 51 (2.8%) | 25 (1.3%) |
| 60 to 89 Minutes | 27 (1.5%) | 92 (4.6%) |
| 90 or more Minutes | 27 (1.5%) | 29 (1.5%) |
Time of Departure to Work by Sex in Pineville
The most frequent times of departure to work in Pineville are 7:30 AM to 7:59 AM (271, 14.9%) for males and 7:30 AM to 7:59 AM (526, 26.3%) for females.
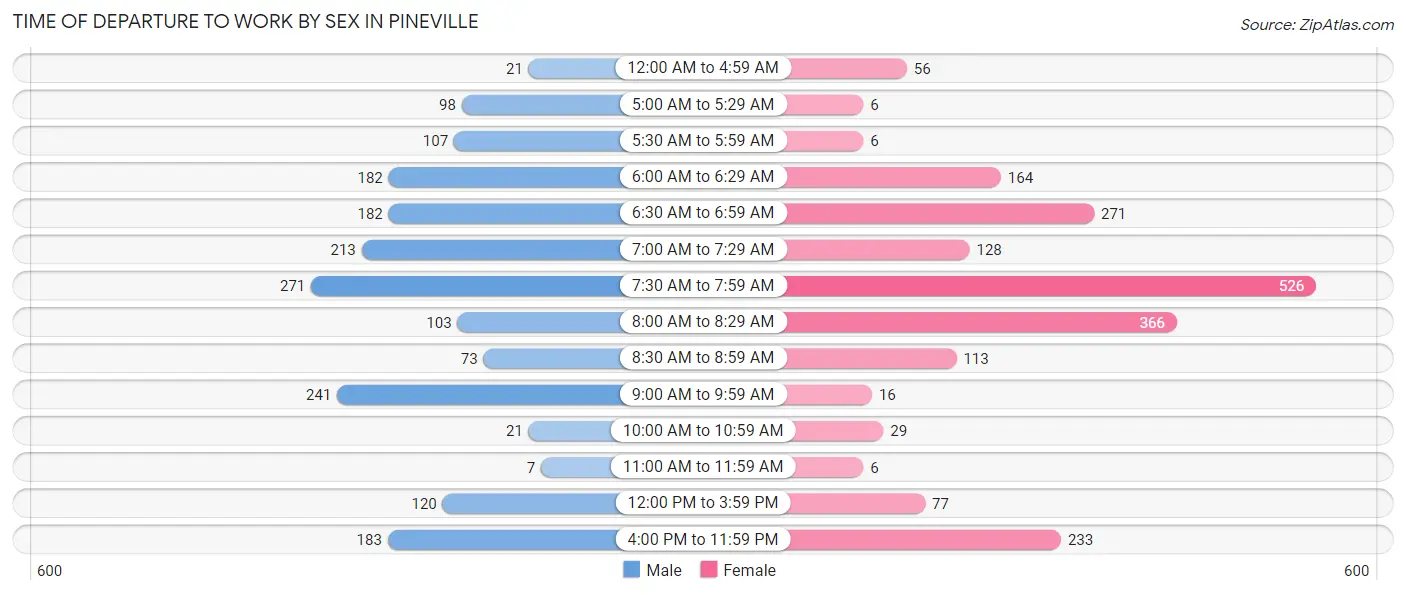
| Time of Departure | Male | Female |
| 12:00 AM to 4:59 AM | 21 (1.1%) | 56 (2.8%) |
| 5:00 AM to 5:29 AM | 98 (5.4%) | 6 (0.3%) |
| 5:30 AM to 5:59 AM | 107 (5.9%) | 6 (0.3%) |
| 6:00 AM to 6:29 AM | 182 (10.0%) | 164 (8.2%) |
| 6:30 AM to 6:59 AM | 182 (10.0%) | 271 (13.6%) |
| 7:00 AM to 7:29 AM | 213 (11.7%) | 128 (6.4%) |
| 7:30 AM to 7:59 AM | 271 (14.9%) | 526 (26.3%) |
| 8:00 AM to 8:29 AM | 103 (5.7%) | 366 (18.3%) |
| 8:30 AM to 8:59 AM | 73 (4.0%) | 113 (5.7%) |
| 9:00 AM to 9:59 AM | 241 (13.2%) | 16 (0.8%) |
| 10:00 AM to 10:59 AM | 21 (1.1%) | 29 (1.5%) |
| 11:00 AM to 11:59 AM | 7 (0.4%) | 6 (0.3%) |
| 12:00 PM to 3:59 PM | 120 (6.6%) | 77 (3.9%) |
| 4:00 PM to 11:59 PM | 183 (10.0%) | 233 (11.7%) |
| Total | 1,822 (100.0%) | 1,997 (100.0%) |
Housing Occupancy in Pineville
Occupancy by Ownership in Pineville
Of the total 4,417 dwellings in Pineville, owner-occupied units account for 2,097 (47.5%), while renter-occupied units make up 2,320 (52.5%).
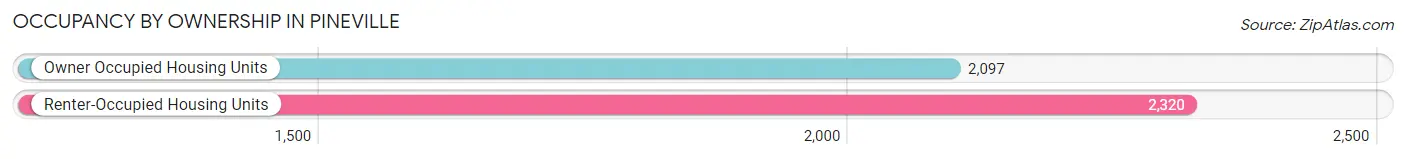
| Occupancy | # Housing Units | % Housing Units |
| Owner Occupied Housing Units | 2,097 | 47.5% |
| Renter-Occupied Housing Units | 2,320 | 52.5% |
| Total Occupied Housing Units | 4,417 | 100.0% |
Occupancy by Household Size in Pineville
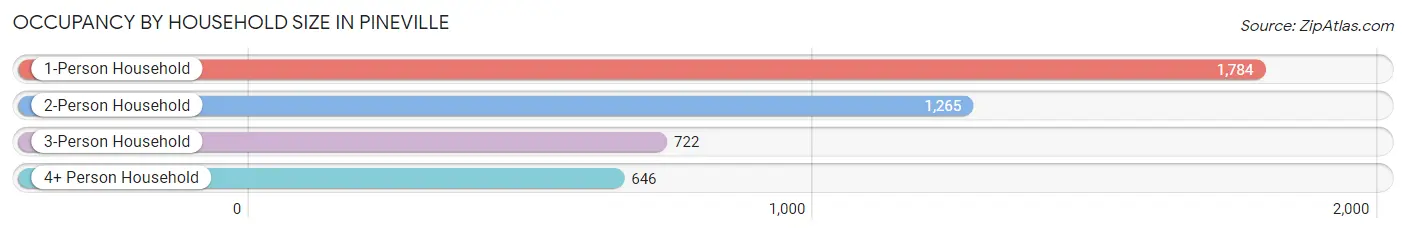
| Household Size | # Housing Units | % Housing Units |
| 1-Person Household | 1,784 | 40.4% |
| 2-Person Household | 1,265 | 28.6% |
| 3-Person Household | 722 | 16.4% |
| 4+ Person Household | 646 | 14.6% |
| Total Housing Units | 4,417 | 100.0% |
Occupancy by Ownership by Household Size in Pineville
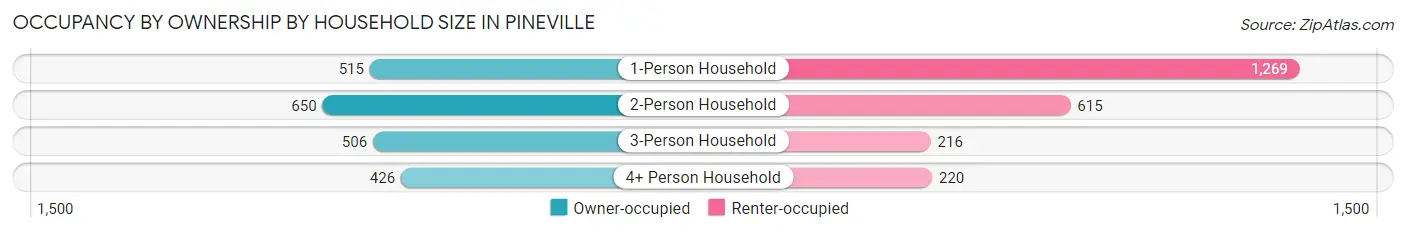
| Household Size | Owner-occupied | Renter-occupied |
| 1-Person Household | 515 (28.9%) | 1,269 (71.1%) |
| 2-Person Household | 650 (51.4%) | 615 (48.6%) |
| 3-Person Household | 506 (70.1%) | 216 (29.9%) |
| 4+ Person Household | 426 (65.9%) | 220 (34.1%) |
| Total Housing Units | 2,097 (47.5%) | 2,320 (52.5%) |
Occupancy by Educational Attainment in Pineville
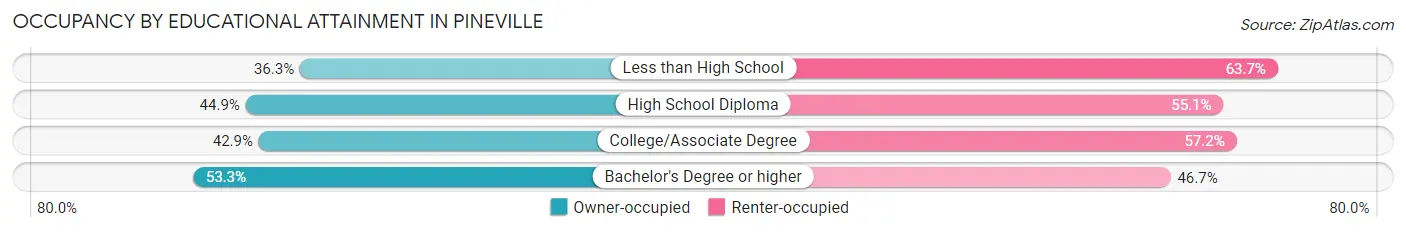
| Household Size | Owner-occupied | Renter-occupied |
| Less than High School | 81 (36.3%) | 142 (63.7%) |
| High School Diploma | 302 (44.9%) | 370 (55.1%) |
| College/Associate Degree | 671 (42.8%) | 895 (57.2%) |
| Bachelor's Degree or higher | 1,043 (53.3%) | 913 (46.7%) |
Occupancy by Age of Householder in Pineville
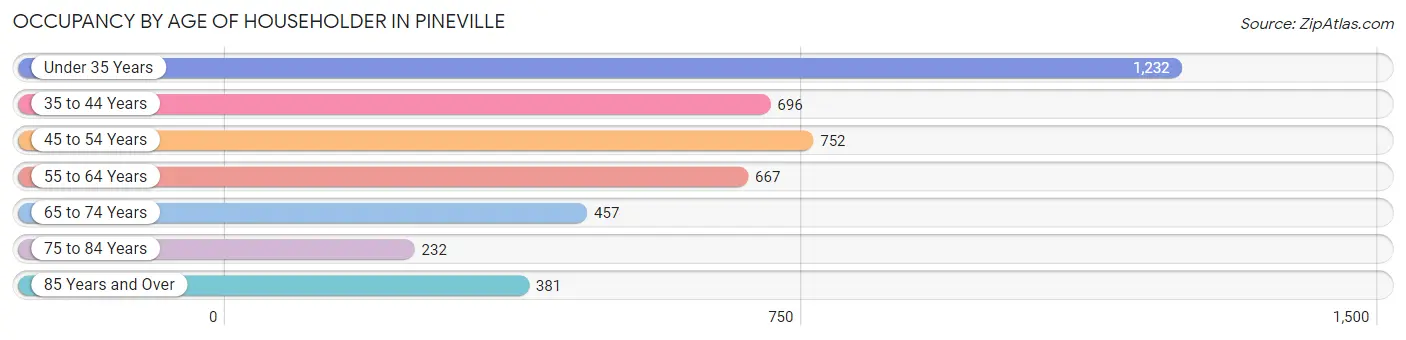
| Age Bracket | # Households | % Households |
| Under 35 Years | 1,232 | 27.9% |
| 35 to 44 Years | 696 | 15.8% |
| 45 to 54 Years | 752 | 17.0% |
| 55 to 64 Years | 667 | 15.1% |
| 65 to 74 Years | 457 | 10.3% |
| 75 to 84 Years | 232 | 5.2% |
| 85 Years and Over | 381 | 8.6% |
| Total | 4,417 | 100.0% |
Housing Finances in Pineville
Median Income by Occupancy in Pineville
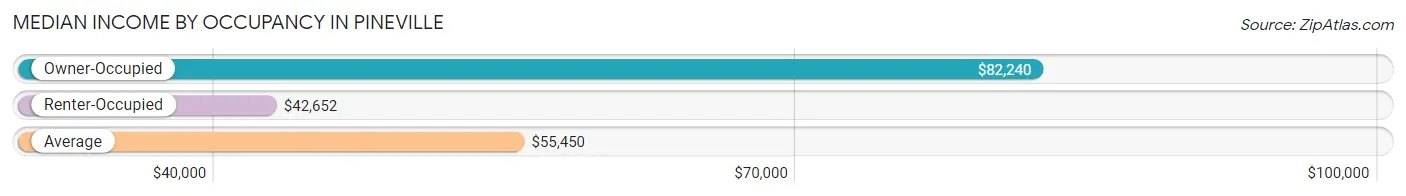
| Occupancy Type | # Households | Median Income |
| Owner-Occupied | 2,097 (47.5%) | $82,240 |
| Renter-Occupied | 2,320 (52.5%) | $42,652 |
| Average | 4,417 (100.0%) | $55,450 |
Occupancy by Householder Income Bracket in Pineville
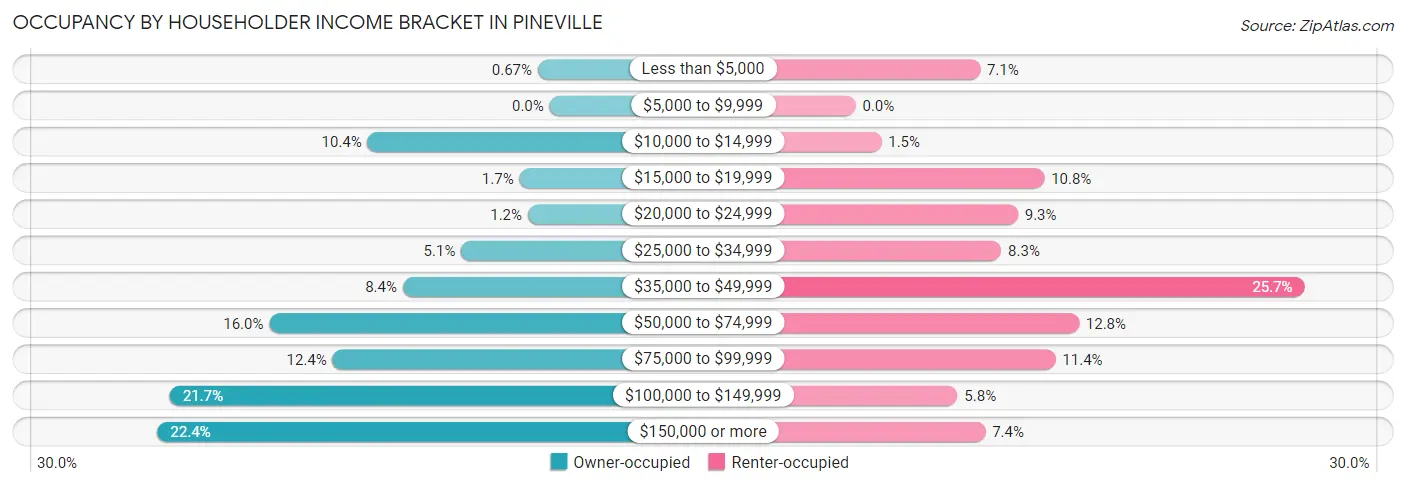
| Income Bracket | Owner-occupied | Renter-occupied |
| Less than $5,000 | 14 (0.7%) | 165 (7.1%) |
| $5,000 to $9,999 | 0 (0.0%) | 0 (0.0%) |
| $10,000 to $14,999 | 218 (10.4%) | 34 (1.5%) |
| $15,000 to $19,999 | 36 (1.7%) | 250 (10.8%) |
| $20,000 to $24,999 | 26 (1.2%) | 215 (9.3%) |
| $25,000 to $34,999 | 106 (5.1%) | 193 (8.3%) |
| $35,000 to $49,999 | 176 (8.4%) | 595 (25.7%) |
| $50,000 to $74,999 | 336 (16.0%) | 296 (12.8%) |
| $75,000 to $99,999 | 260 (12.4%) | 265 (11.4%) |
| $100,000 to $149,999 | 455 (21.7%) | 135 (5.8%) |
| $150,000 or more | 470 (22.4%) | 172 (7.4%) |
| Total | 2,097 (100.0%) | 2,320 (100.0%) |
Monthly Housing Cost Tiers in Pineville
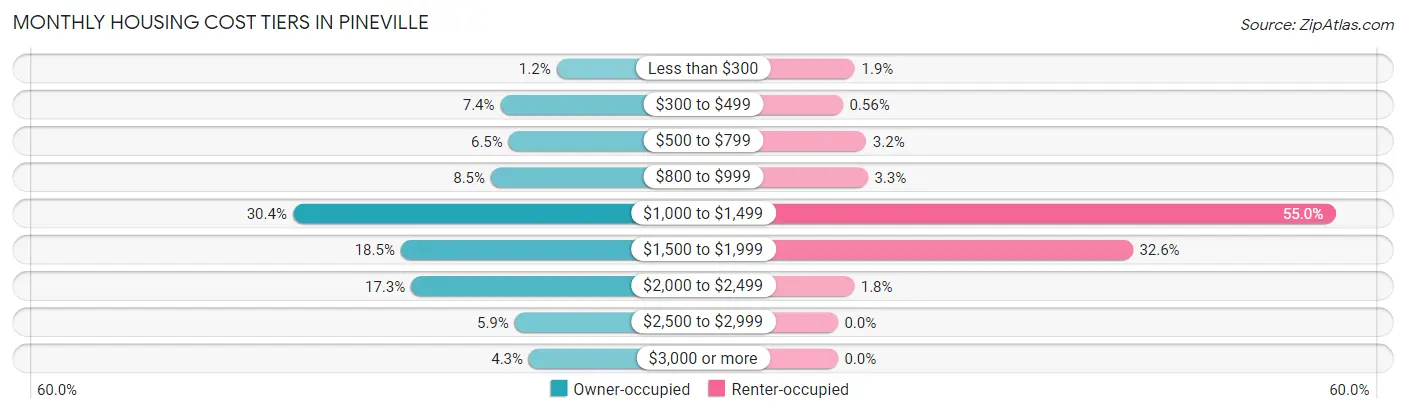
| Monthly Cost | Owner-occupied | Renter-occupied |
| Less than $300 | 26 (1.2%) | 44 (1.9%) |
| $300 to $499 | 156 (7.4%) | 13 (0.6%) |
| $500 to $799 | 137 (6.5%) | 73 (3.2%) |
| $800 to $999 | 178 (8.5%) | 77 (3.3%) |
| $1,000 to $1,499 | 637 (30.4%) | 1,275 (55.0%) |
| $1,500 to $1,999 | 387 (18.4%) | 756 (32.6%) |
| $2,000 to $2,499 | 363 (17.3%) | 42 (1.8%) |
| $2,500 to $2,999 | 123 (5.9%) | 0 (0.0%) |
| $3,000 or more | 90 (4.3%) | 0 (0.0%) |
| Total | 2,097 (100.0%) | 2,320 (100.0%) |
Physical Housing Characteristics in Pineville
Housing Structures in Pineville
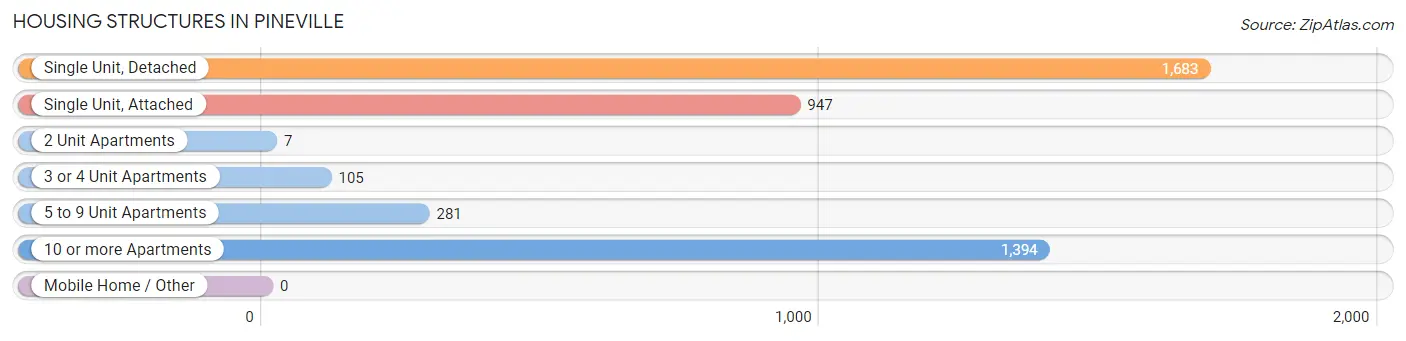
| Structure Type | # Housing Units | % Housing Units |
| Single Unit, Detached | 1,683 | 38.1% |
| Single Unit, Attached | 947 | 21.4% |
| 2 Unit Apartments | 7 | 0.2% |
| 3 or 4 Unit Apartments | 105 | 2.4% |
| 5 to 9 Unit Apartments | 281 | 6.4% |
| 10 or more Apartments | 1,394 | 31.6% |
| Mobile Home / Other | 0 | 0.0% |
| Total | 4,417 | 100.0% |
Housing Structures by Occupancy in Pineville
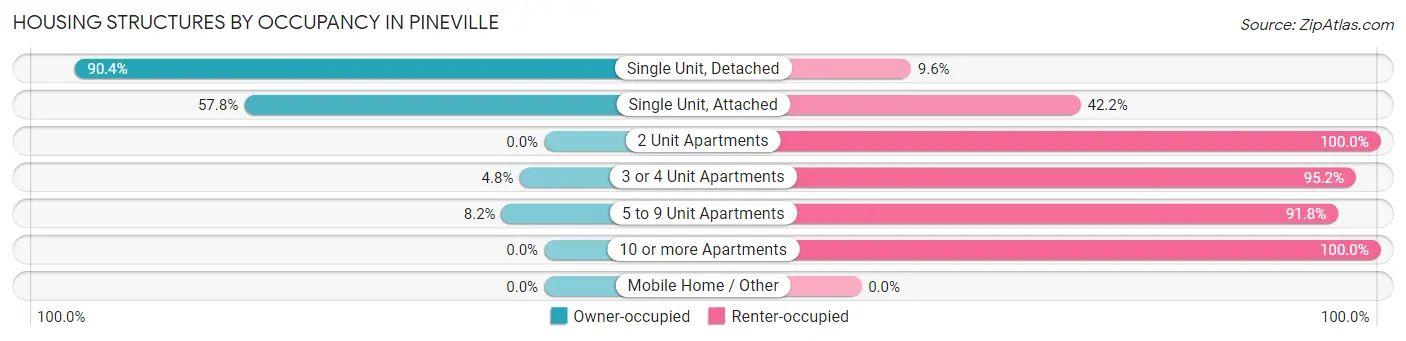
| Structure Type | Owner-occupied | Renter-occupied |
| Single Unit, Detached | 1,522 (90.4%) | 161 (9.6%) |
| Single Unit, Attached | 547 (57.8%) | 400 (42.2%) |
| 2 Unit Apartments | 0 (0.0%) | 7 (100.0%) |
| 3 or 4 Unit Apartments | 5 (4.8%) | 100 (95.2%) |
| 5 to 9 Unit Apartments | 23 (8.2%) | 258 (91.8%) |
| 10 or more Apartments | 0 (0.0%) | 1,394 (100.0%) |
| Mobile Home / Other | 0 (0.0%) | 0 (0.0%) |
| Total | 2,097 (47.5%) | 2,320 (52.5%) |
Housing Structures by Number of Rooms in Pineville
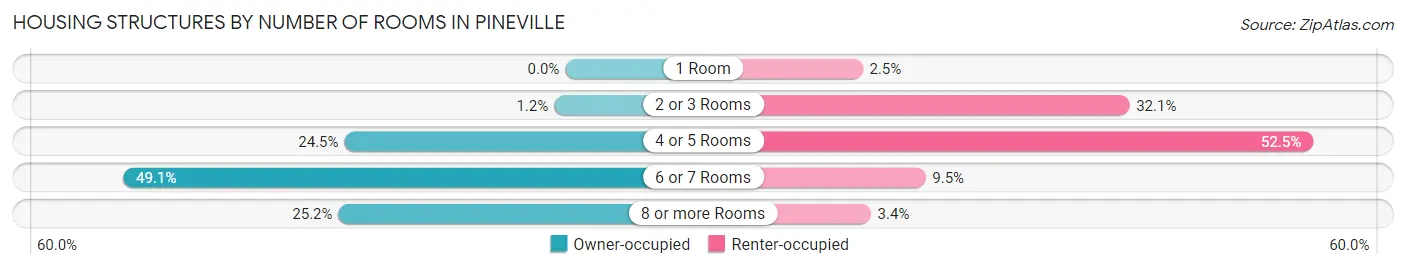
| Number of Rooms | Owner-occupied | Renter-occupied |
| 1 Room | 0 (0.0%) | 58 (2.5%) |
| 2 or 3 Rooms | 26 (1.2%) | 745 (32.1%) |
| 4 or 5 Rooms | 514 (24.5%) | 1,218 (52.5%) |
| 6 or 7 Rooms | 1,029 (49.1%) | 220 (9.5%) |
| 8 or more Rooms | 528 (25.2%) | 79 (3.4%) |
| Total | 2,097 (100.0%) | 2,320 (100.0%) |
Housing Structure by Heating Type in Pineville
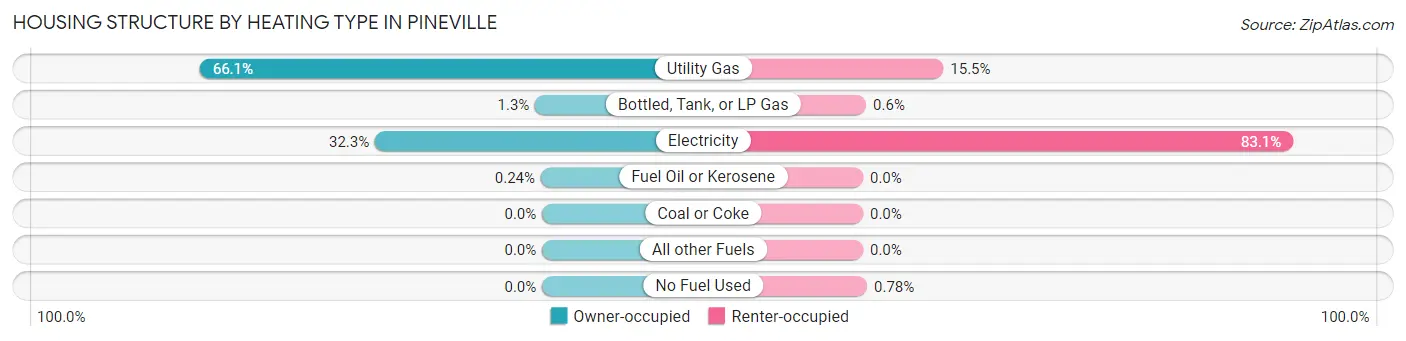
| Heating Type | Owner-occupied | Renter-occupied |
| Utility Gas | 1,387 (66.1%) | 360 (15.5%) |
| Bottled, Tank, or LP Gas | 28 (1.3%) | 14 (0.6%) |
| Electricity | 677 (32.3%) | 1,928 (83.1%) |
| Fuel Oil or Kerosene | 5 (0.2%) | 0 (0.0%) |
| Coal or Coke | 0 (0.0%) | 0 (0.0%) |
| All other Fuels | 0 (0.0%) | 0 (0.0%) |
| No Fuel Used | 0 (0.0%) | 18 (0.8%) |
| Total | 2,097 (100.0%) | 2,320 (100.0%) |
Household Vehicle Usage in Pineville
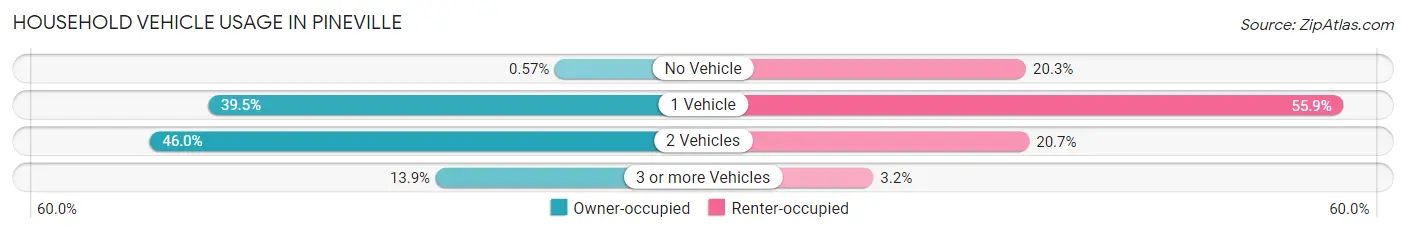
| Vehicles per Household | Owner-occupied | Renter-occupied |
| No Vehicle | 12 (0.6%) | 471 (20.3%) |
| 1 Vehicle | 828 (39.5%) | 1,296 (55.9%) |
| 2 Vehicles | 965 (46.0%) | 479 (20.6%) |
| 3 or more Vehicles | 292 (13.9%) | 74 (3.2%) |
| Total | 2,097 (100.0%) | 2,320 (100.0%) |
Real Estate & Mortgages in Pineville
Real Estate and Mortgage Overview in Pineville
| Characteristic | Without Mortgage | With Mortgage |
| Housing Units | 307 | 1,790 |
| Median Property Value | $264,900 | $326,800 |
| Median Household Income | $51,655 | $456 |
| Monthly Housing Costs | $519 | $90 |
| Real Estate Taxes | $2,359 | $43 |
Property Value by Mortgage Status in Pineville
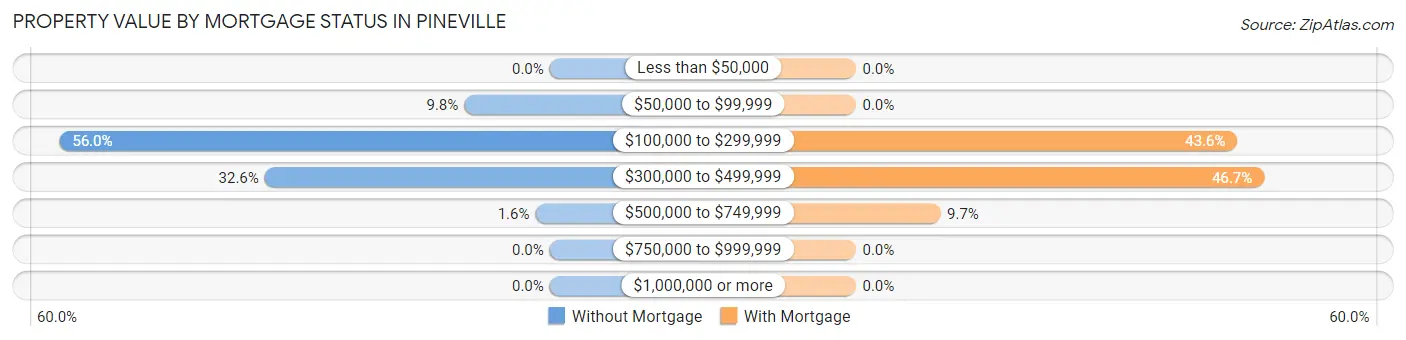
| Property Value | Without Mortgage | With Mortgage |
| Less than $50,000 | 0 (0.0%) | 0 (0.0%) |
| $50,000 to $99,999 | 30 (9.8%) | 0 (0.0%) |
| $100,000 to $299,999 | 172 (56.0%) | 781 (43.6%) |
| $300,000 to $499,999 | 100 (32.6%) | 836 (46.7%) |
| $500,000 to $749,999 | 5 (1.6%) | 173 (9.7%) |
| $750,000 to $999,999 | 0 (0.0%) | 0 (0.0%) |
| $1,000,000 or more | 0 (0.0%) | 0 (0.0%) |
| Total | 307 (100.0%) | 1,790 (100.0%) |
Household Income by Mortgage Status in Pineville
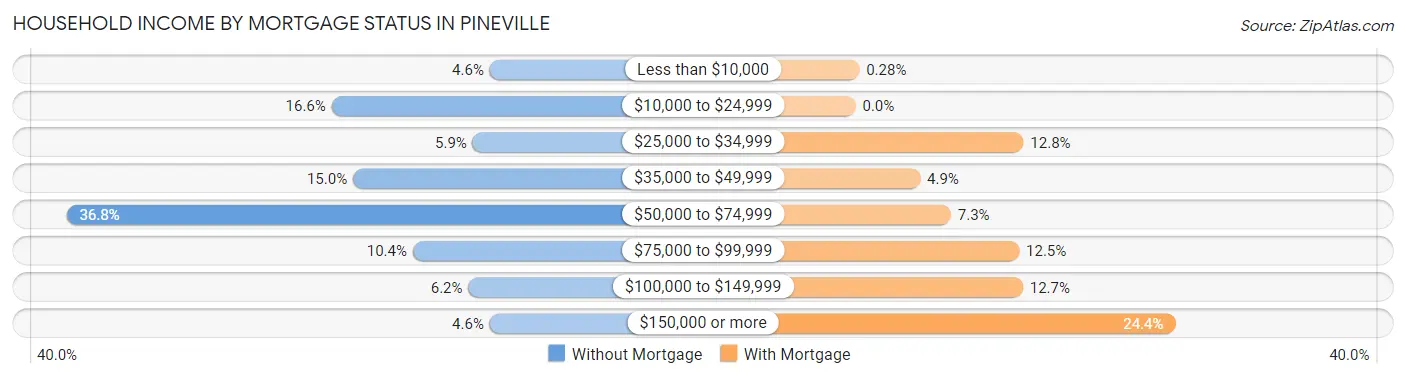
| Household Income | Without Mortgage | With Mortgage |
| Less than $10,000 | 14 (4.6%) | 5 (0.3%) |
| $10,000 to $24,999 | 51 (16.6%) | 0 (0.0%) |
| $25,000 to $34,999 | 18 (5.9%) | 229 (12.8%) |
| $35,000 to $49,999 | 46 (15.0%) | 88 (4.9%) |
| $50,000 to $74,999 | 113 (36.8%) | 130 (7.3%) |
| $75,000 to $99,999 | 32 (10.4%) | 223 (12.5%) |
| $100,000 to $149,999 | 19 (6.2%) | 228 (12.7%) |
| $150,000 or more | 14 (4.6%) | 436 (24.4%) |
| Total | 307 (100.0%) | 1,790 (100.0%) |
Property Value to Household Income Ratio in Pineville
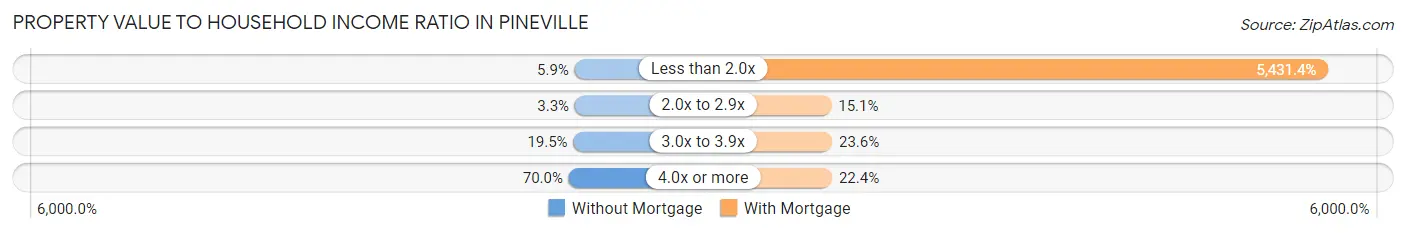
| Value-to-Income Ratio | Without Mortgage | With Mortgage |
| Less than 2.0x | 18 (5.9%) | 97,222 (5,431.4%) |
| 2.0x to 2.9x | 10 (3.3%) | 271 (15.1%) |
| 3.0x to 3.9x | 60 (19.5%) | 422 (23.6%) |
| 4.0x or more | 215 (70.0%) | 400 (22.4%) |
| Total | 307 (100.0%) | 1,790 (100.0%) |
Real Estate Taxes by Mortgage Status in Pineville
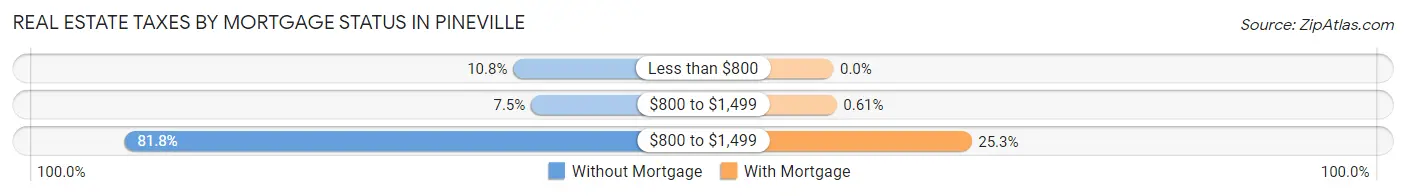
| Property Taxes | Without Mortgage | With Mortgage |
| Less than $800 | 33 (10.7%) | 0 (0.0%) |
| $800 to $1,499 | 23 (7.5%) | 11 (0.6%) |
| $800 to $1,499 | 251 (81.8%) | 452 (25.3%) |
| Total | 307 (100.0%) | 1,790 (100.0%) |
Health & Disability in Pineville
Health Insurance Coverage by Age in Pineville
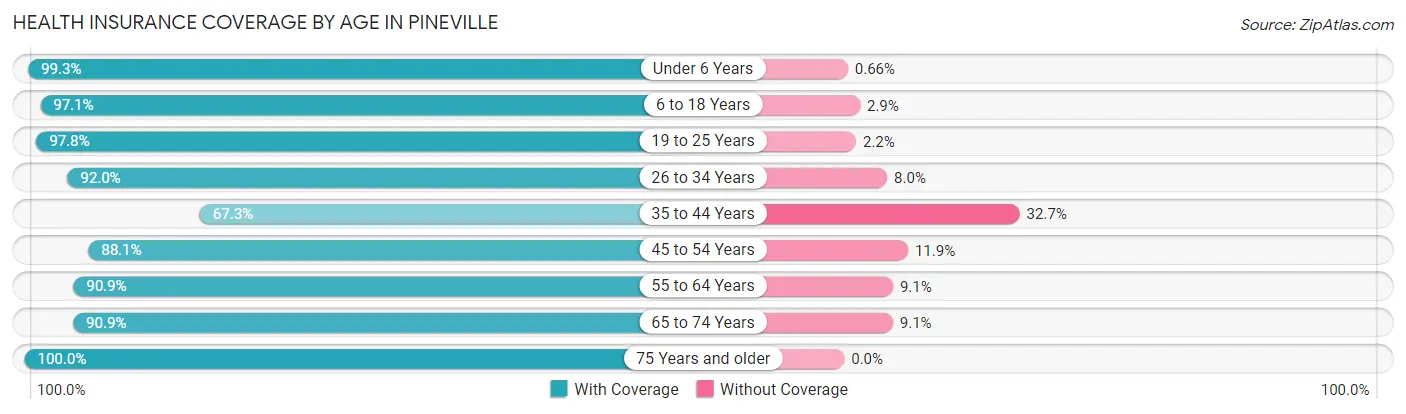
| Age Bracket | With Coverage | Without Coverage |
| Under 6 Years | 1,048 (99.3%) | 7 (0.7%) |
| 6 to 18 Years | 1,591 (97.1%) | 48 (2.9%) |
| 19 to 25 Years | 758 (97.8%) | 17 (2.2%) |
| 26 to 34 Years | 1,947 (92.0%) | 169 (8.0%) |
| 35 to 44 Years | 821 (67.3%) | 399 (32.7%) |
| 45 to 54 Years | 868 (88.1%) | 117 (11.9%) |
| 55 to 64 Years | 891 (90.9%) | 89 (9.1%) |
| 65 to 74 Years | 753 (90.9%) | 75 (9.1%) |
| 75 Years and older | 844 (100.0%) | 0 (0.0%) |
| Total | 9,521 (91.2%) | 921 (8.8%) |
Health Insurance Coverage by Citizenship Status in Pineville
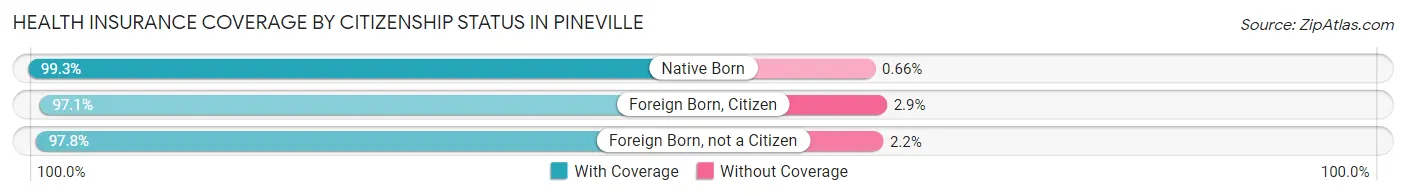
| Citizenship Status | With Coverage | Without Coverage |
| Native Born | 1,048 (99.3%) | 7 (0.7%) |
| Foreign Born, Citizen | 1,591 (97.1%) | 48 (2.9%) |
| Foreign Born, not a Citizen | 758 (97.8%) | 17 (2.2%) |
Health Insurance Coverage by Household Income in Pineville
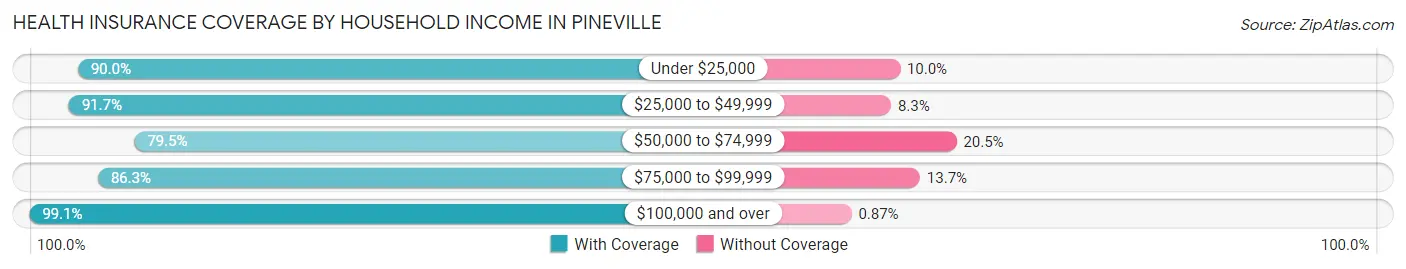
| Household Income | With Coverage | Without Coverage |
| Under $25,000 | 1,717 (90.0%) | 190 (10.0%) |
| $25,000 to $49,999 | 2,093 (91.7%) | 189 (8.3%) |
| $50,000 to $74,999 | 1,168 (79.5%) | 302 (20.5%) |
| $75,000 to $99,999 | 1,336 (86.3%) | 212 (13.7%) |
| $100,000 and over | 3,207 (99.1%) | 28 (0.9%) |
Public vs Private Health Insurance Coverage by Age in Pineville
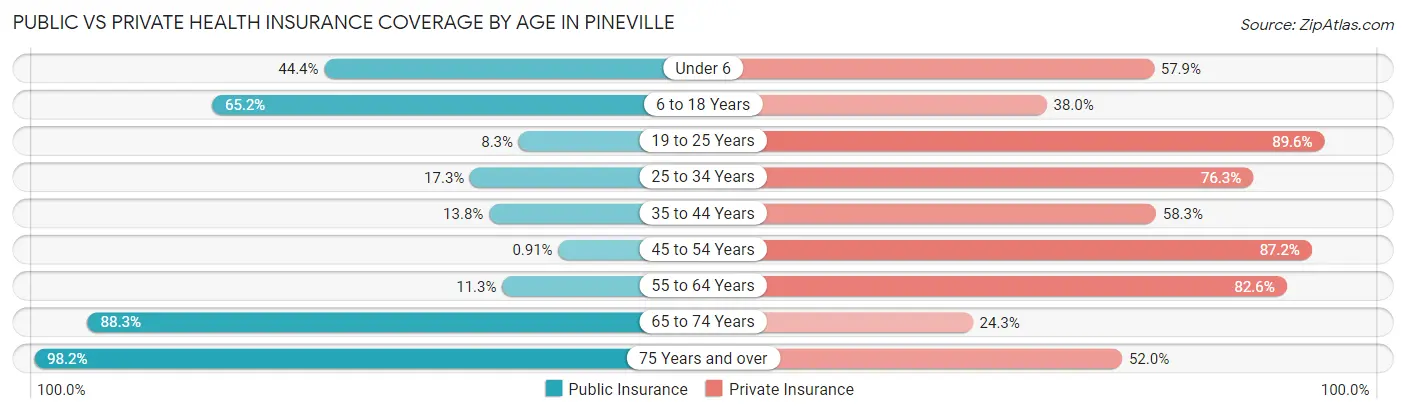
| Age Bracket | Public Insurance | Private Insurance |
| Under 6 | 468 (44.4%) | 611 (57.9%) |
| 6 to 18 Years | 1,069 (65.2%) | 623 (38.0%) |
| 19 to 25 Years | 64 (8.3%) | 694 (89.5%) |
| 25 to 34 Years | 366 (17.3%) | 1,615 (76.3%) |
| 35 to 44 Years | 168 (13.8%) | 711 (58.3%) |
| 45 to 54 Years | 9 (0.9%) | 859 (87.2%) |
| 55 to 64 Years | 111 (11.3%) | 809 (82.6%) |
| 65 to 74 Years | 731 (88.3%) | 201 (24.3%) |
| 75 Years and over | 829 (98.2%) | 439 (52.0%) |
| Total | 3,815 (36.5%) | 6,562 (62.8%) |
Disability Status by Sex by Age in Pineville
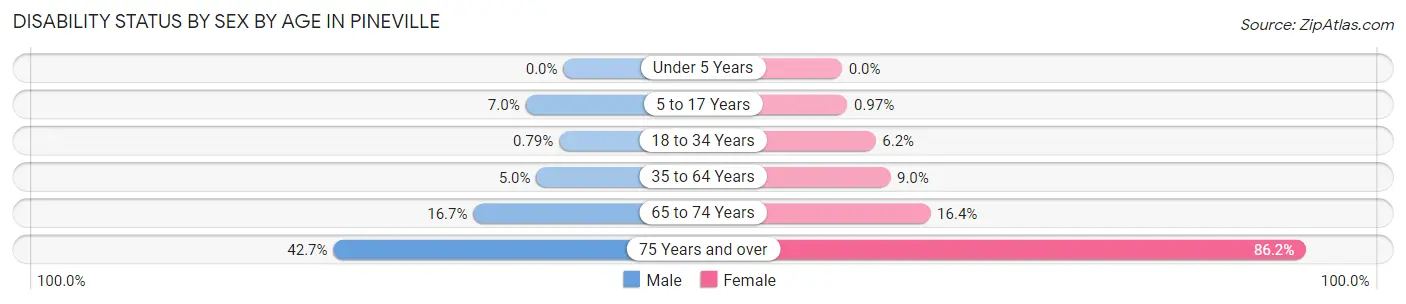
| Age Bracket | Male | Female |
| Under 5 Years | 0 (0.0%) | 0 (0.0%) |
| 5 to 17 Years | 50 (7.0%) | 9 (1.0%) |
| 18 to 34 Years | 12 (0.8%) | 94 (6.2%) |
| 35 to 64 Years | 61 (5.0%) | 176 (8.9%) |
| 65 to 74 Years | 66 (16.7%) | 71 (16.4%) |
| 75 Years and over | 73 (42.7%) | 580 (86.2%) |
Disability Class by Sex by Age in Pineville
Disability Class: Hearing Difficulty
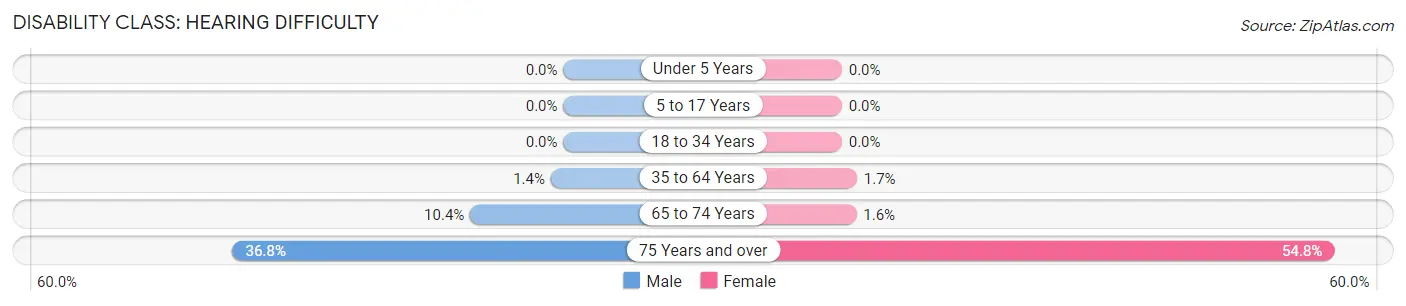
| Age Bracket | Male | Female |
| Under 5 Years | 0 (0.0%) | 0 (0.0%) |
| 5 to 17 Years | 0 (0.0%) | 0 (0.0%) |
| 18 to 34 Years | 0 (0.0%) | 0 (0.0%) |
| 35 to 64 Years | 17 (1.4%) | 33 (1.7%) |
| 65 to 74 Years | 41 (10.4%) | 7 (1.6%) |
| 75 Years and over | 63 (36.8%) | 369 (54.8%) |
Disability Class: Vision Difficulty
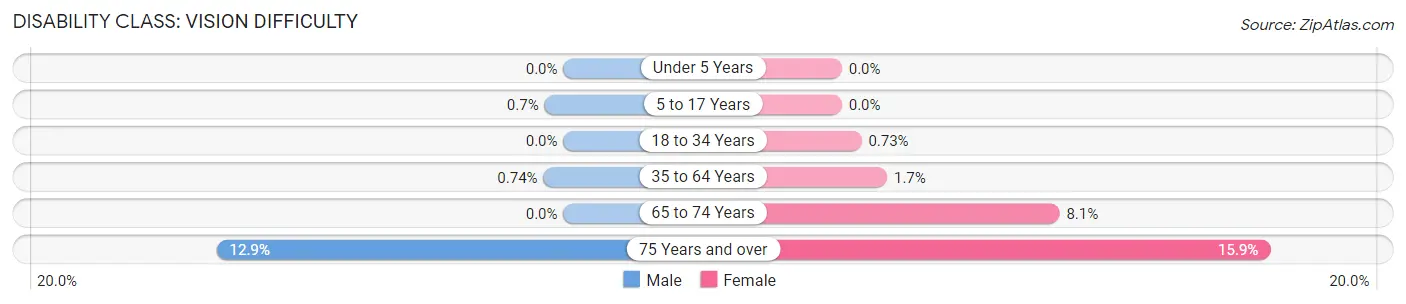
| Age Bracket | Male | Female |
| Under 5 Years | 0 (0.0%) | 0 (0.0%) |
| 5 to 17 Years | 5 (0.7%) | 0 (0.0%) |
| 18 to 34 Years | 0 (0.0%) | 11 (0.7%) |
| 35 to 64 Years | 9 (0.7%) | 33 (1.7%) |
| 65 to 74 Years | 0 (0.0%) | 35 (8.1%) |
| 75 Years and over | 22 (12.9%) | 107 (15.9%) |
Disability Class: Cognitive Difficulty
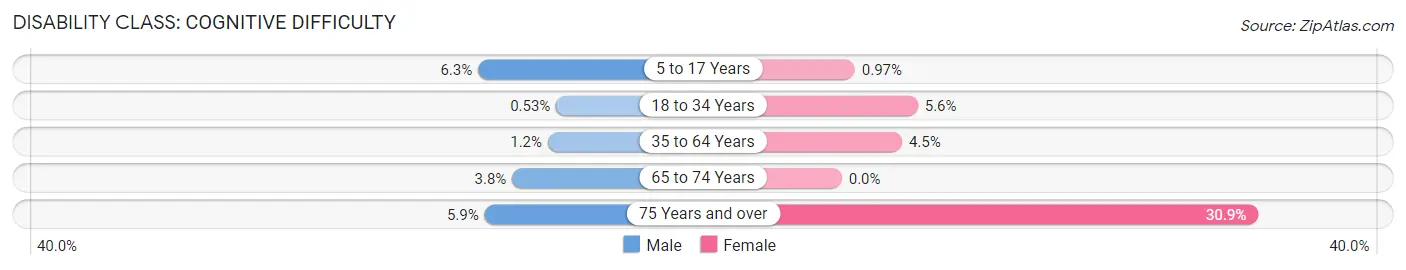
| Age Bracket | Male | Female |
| 5 to 17 Years | 45 (6.3%) | 9 (1.0%) |
| 18 to 34 Years | 8 (0.5%) | 85 (5.6%) |
| 35 to 64 Years | 14 (1.1%) | 88 (4.5%) |
| 65 to 74 Years | 15 (3.8%) | 0 (0.0%) |
| 75 Years and over | 10 (5.9%) | 208 (30.9%) |
Disability Class: Ambulatory Difficulty
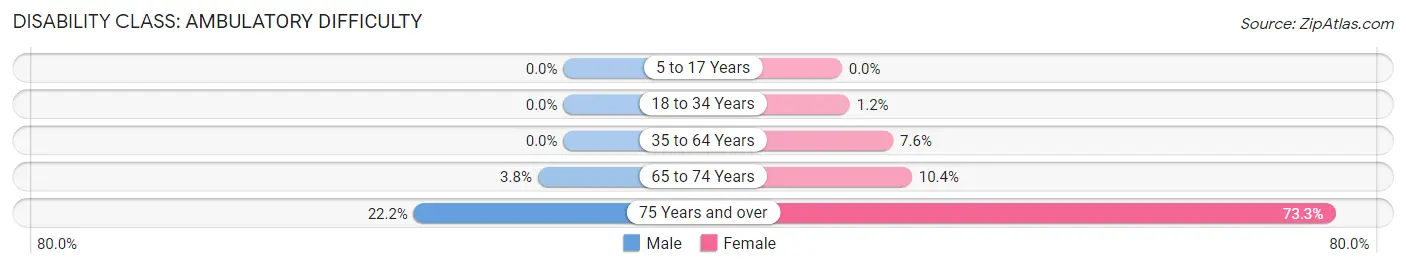
| Age Bracket | Male | Female |
| 5 to 17 Years | 0 (0.0%) | 0 (0.0%) |
| 18 to 34 Years | 0 (0.0%) | 18 (1.2%) |
| 35 to 64 Years | 0 (0.0%) | 150 (7.6%) |
| 65 to 74 Years | 15 (3.8%) | 45 (10.4%) |
| 75 Years and over | 38 (22.2%) | 493 (73.3%) |
Disability Class: Self-Care Difficulty
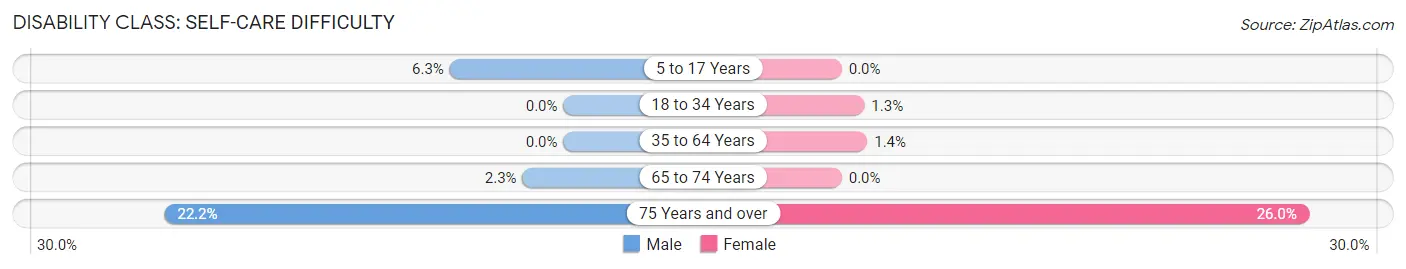
| Age Bracket | Male | Female |
| 5 to 17 Years | 45 (6.3%) | 0 (0.0%) |
| 18 to 34 Years | 0 (0.0%) | 19 (1.3%) |
| 35 to 64 Years | 0 (0.0%) | 28 (1.4%) |
| 65 to 74 Years | 9 (2.3%) | 0 (0.0%) |
| 75 Years and over | 38 (22.2%) | 175 (26.0%) |
Technology Access in Pineville
Computing Device Access in Pineville
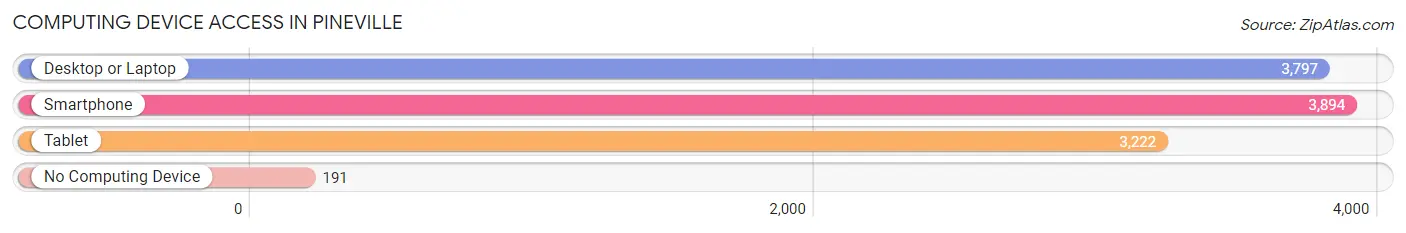
| Device Type | # Households | % Households |
| Desktop or Laptop | 3,797 | 86.0% |
| Smartphone | 3,894 | 88.2% |
| Tablet | 3,222 | 73.0% |
| No Computing Device | 191 | 4.3% |
| Total | 4,417 | 100.0% |
Internet Access in Pineville
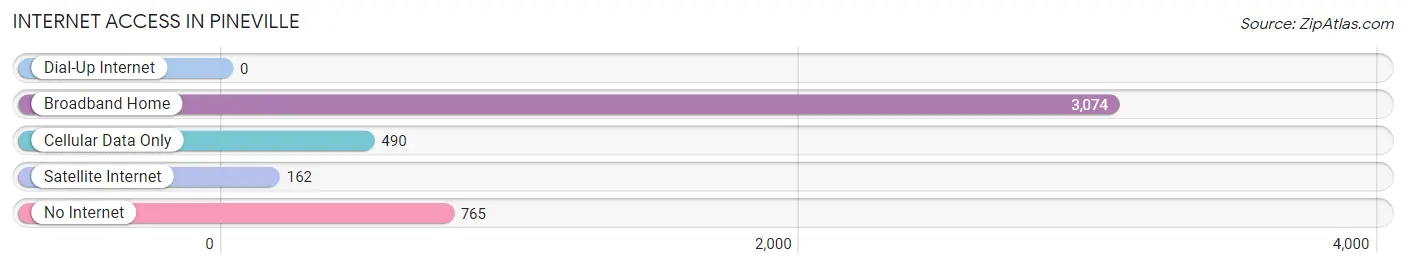
| Internet Type | # Households | % Households |
| Dial-Up Internet | 0 | 0.0% |
| Broadband Home | 3,074 | 69.6% |
| Cellular Data Only | 490 | 11.1% |
| Satellite Internet | 162 | 3.7% |
| No Internet | 765 | 17.3% |
| Total | 4,417 | 100.0% |
Pineville Summary
Pineville is a small town located in Mecklenburg County, North Carolina. It is situated just south of Charlotte and is part of the Charlotte metropolitan area. The town has a population of approximately 8,000 people and is home to a variety of businesses, including retail stores, restaurants, and professional services.
History
Pineville was first settled in the late 1700s by a group of German immigrants. The town was originally known as Pineville Crossroads, as it was located at the intersection of two major roads. In 1873, the town was officially incorporated and renamed Pineville.
The town grew steadily throughout the 19th century, and by the early 20th century, it had become a popular destination for tourists. The town was home to a number of resorts, including the Pineville Hotel, which was built in the late 1800s. The hotel was a popular destination for wealthy visitors from Charlotte and other nearby cities.
In the mid-20th century, Pineville began to experience rapid growth due to its proximity to Charlotte. The town was annexed by the city of Charlotte in 1961, and it has since become a popular suburb.
Geography
Pineville is located in Mecklenburg County, North Carolina. It is situated just south of Charlotte and is part of the Charlotte metropolitan area. The town is located on the banks of the Catawba River, and it is surrounded by a number of small lakes and ponds.
The town has a total area of 4.2 square miles, all of which is land. The terrain is mostly flat, with some rolling hills in the northern part of the town. The climate is humid subtropical, with hot, humid summers and mild winters.
Economy
Pineville’s economy is largely based on retail and professional services. The town is home to a number of retail stores, restaurants, and professional services. The town is also home to a number of corporate offices, including those of Bank of America, Duke Energy, and Lowe’s.
The town is also home to a number of manufacturing companies, including a paper mill and a furniture factory. The town is also home to a number of educational institutions, including Central Piedmont Community College and the University of North Carolina at Charlotte.
Demographics
As of the 2010 census, Pineville had a population of 8,073 people. The racial makeup of the town was 79.3% White, 14.2% African American, 0.4% Native American, 2.2% Asian, and 3.9% from other races. Hispanic or Latino of any race were 6.2% of the population.
The median household income in Pineville was $50,945, and the median family income was $60,945. The per capita income was $25,945. About 8.3% of families and 10.2% of the population were below the poverty line, including 14.2% of those under age 18 and 6.2% of those age 65 or over.
Pineville is a small town with a rich history and a diverse population. The town is home to a variety of businesses, including retail stores, restaurants, and professional services. The town is also home to a number of educational institutions, including Central Piedmont Community College and the University of North Carolina at Charlotte. The town has a humid subtropical climate and is located on the banks of the Catawba River. The town has a population of approximately 8,000 people and is part of the Charlotte metropolitan area.
Common Questions
What is Per Capita Income in Pineville?
Per Capita income in Pineville is $32,945.
What is the Median Family Income in Pineville?
Median Family Income in Pineville is $77,750.
What is the Median Household income in Pineville?
Median Household Income in Pineville is $55,450.
What is Income or Wage Gap in Pineville?
Income or Wage Gap in Pineville is 1.5%.
Women in Pineville earn 98.5 cents for every dollar earned by a man.
What is Inequality or Gini Index in Pineville?
Inequality or Gini Index in Pineville is 0.44.
What is the Total Population of Pineville?
Total Population of Pineville is 10,532.
What is the Total Male Population of Pineville?
Total Male Population of Pineville is 4,595.
What is the Total Female Population of Pineville?
Total Female Population of Pineville is 5,937.
What is the Ratio of Males per 100 Females in Pineville?
There are 77.40 Males per 100 Females in Pineville.
What is the Ratio of Females per 100 Males in Pineville?
There are 129.21 Females per 100 Males in Pineville.
What is the Median Population Age in Pineville?
Median Population Age in Pineville is 33.7 Years.
What is the Average Family Size in Pineville
Average Family Size in Pineville is 3.3 People.
What is the Average Household Size in Pineville
Average Household Size in Pineville is 2.4 People.
How Large is the Labor Force in Pineville?
There are 5,350 People in the Labor Forcein in Pineville.
What is the Percentage of People in the Labor Force in Pineville?
65.7% of People are in the Labor Force in Pineville.
What is the Unemployment Rate in Pineville?
Unemployment Rate in Pineville is 3.9%.