Lake Tekakwitha, MO Map & Demographics
Lake Tekakwitha Map
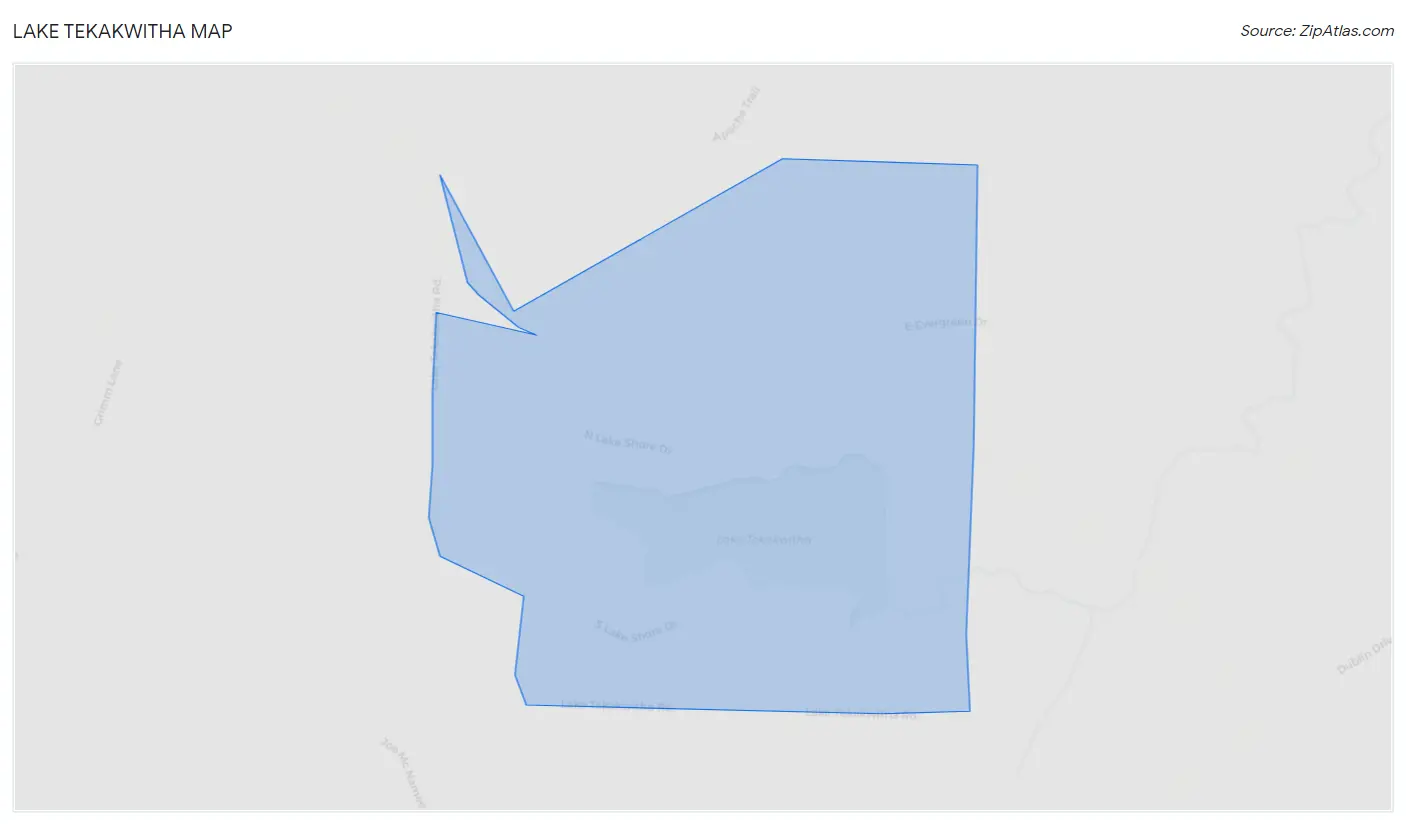
Lake Tekakwitha Overview
$29,587
PER CAPITA INCOME
$51,806
AVG FAMILY INCOME
$46,250
AVG HOUSEHOLD INCOME
40.8%
WAGE / INCOME GAP [ % ]
59.2¢/ $1
WAGE / INCOME GAP [ $ ]
0.33
INEQUALITY / GINI INDEX
252
TOTAL POPULATION
132
MALE POPULATION
120
FEMALE POPULATION
110.00
MALES / 100 FEMALES
90.91
FEMALES / 100 MALES
49.3
MEDIAN AGE
2.8
AVG FAMILY SIZE
2.0
AVG HOUSEHOLD SIZE
171
LABOR FORCE [ PEOPLE ]
73.4%
PERCENT IN LABOR FORCE
5.8%
UNEMPLOYMENT RATE
Income in Lake Tekakwitha
Income Overview in Lake Tekakwitha
Per Capita Income in Lake Tekakwitha is $29,587, while median incomes of families and households are $51,806 and $46,250 respectively.
| Characteristic | Number | Measure |
| Per Capita Income | 252 | $29,587 |
| Median Family Income | 67 | $51,806 |
| Mean Family Income | 67 | $61,657 |
| Median Household Income | 124 | $46,250 |
| Mean Household Income | 124 | $58,969 |
| Income Deficit | 67 | $0 |
| Wage / Income Gap (%) | 252 | 40.79% |
| Wage / Income Gap ($) | 252 | 59.21¢ per $1 |
| Gini / Inequality Index | 252 | 0.33 |
Earnings by Sex in Lake Tekakwitha
Average Earnings in Lake Tekakwitha are $33,125, $44,333 for men and $26,250 for women, a difference of 40.8%.
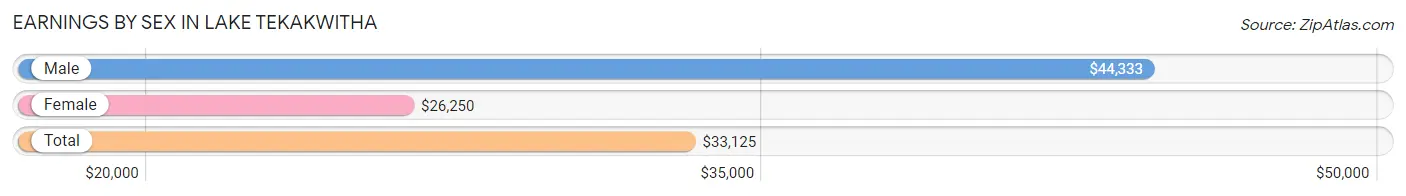
| Sex | Number | Average Earnings |
| Male | 78 (46.4%) | $44,333 |
| Female | 90 (53.6%) | $26,250 |
| Total | 168 (100.0%) | $33,125 |
Earnings by Sex by Income Bracket in Lake Tekakwitha
The most common earnings brackets in Lake Tekakwitha are $40,000 to $44,999 for men (19 | 24.4%) and $10,000 to $12,499 for women (17 | 18.9%).
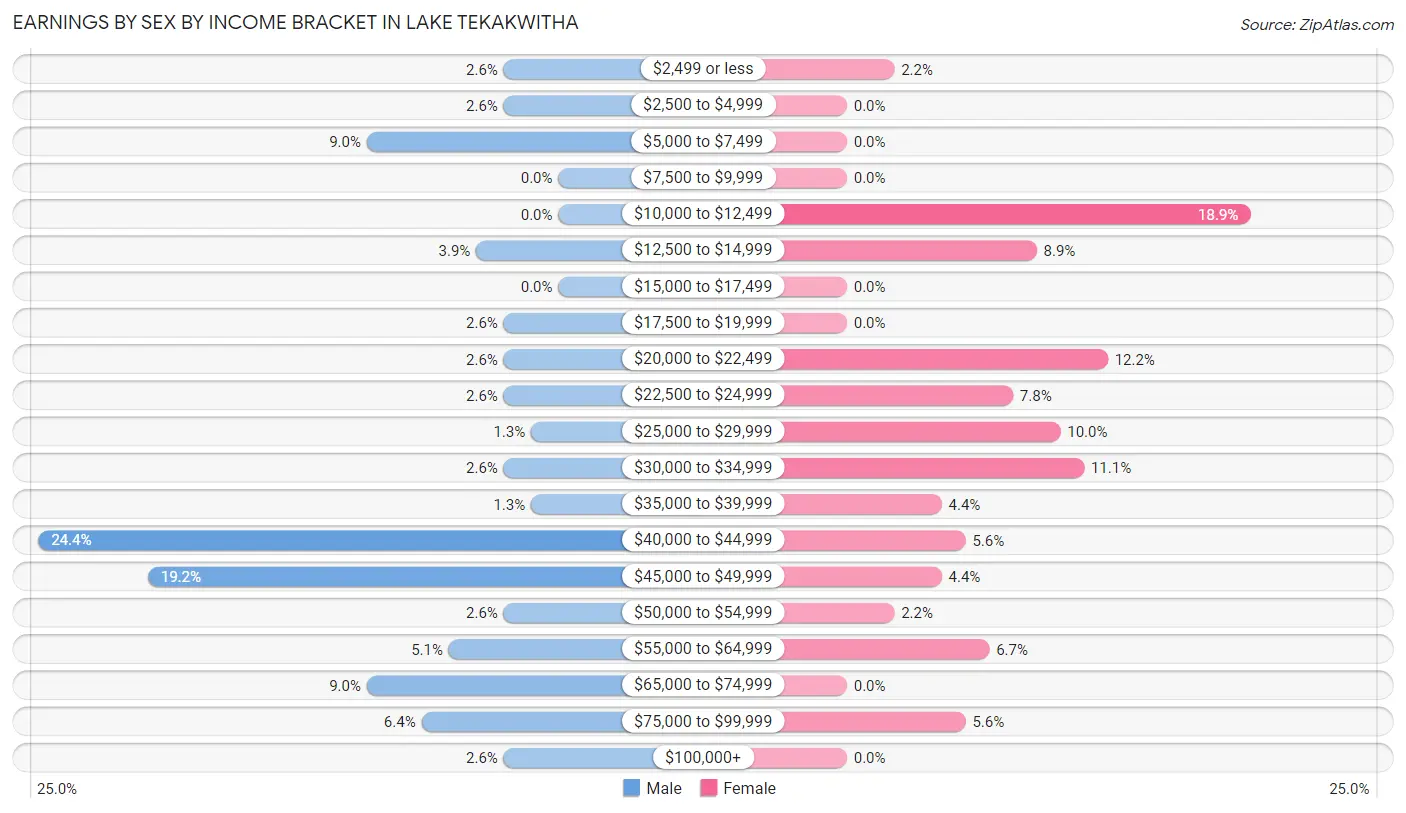
| Income | Male | Female |
| $2,499 or less | 2 (2.6%) | 2 (2.2%) |
| $2,500 to $4,999 | 2 (2.6%) | 0 (0.0%) |
| $5,000 to $7,499 | 7 (9.0%) | 0 (0.0%) |
| $7,500 to $9,999 | 0 (0.0%) | 0 (0.0%) |
| $10,000 to $12,499 | 0 (0.0%) | 17 (18.9%) |
| $12,500 to $14,999 | 3 (3.8%) | 8 (8.9%) |
| $15,000 to $17,499 | 0 (0.0%) | 0 (0.0%) |
| $17,500 to $19,999 | 2 (2.6%) | 0 (0.0%) |
| $20,000 to $22,499 | 2 (2.6%) | 11 (12.2%) |
| $22,500 to $24,999 | 2 (2.6%) | 7 (7.8%) |
| $25,000 to $29,999 | 1 (1.3%) | 9 (10.0%) |
| $30,000 to $34,999 | 2 (2.6%) | 10 (11.1%) |
| $35,000 to $39,999 | 1 (1.3%) | 4 (4.4%) |
| $40,000 to $44,999 | 19 (24.4%) | 5 (5.6%) |
| $45,000 to $49,999 | 15 (19.2%) | 4 (4.4%) |
| $50,000 to $54,999 | 2 (2.6%) | 2 (2.2%) |
| $55,000 to $64,999 | 4 (5.1%) | 6 (6.7%) |
| $65,000 to $74,999 | 7 (9.0%) | 0 (0.0%) |
| $75,000 to $99,999 | 5 (6.4%) | 5 (5.6%) |
| $100,000+ | 2 (2.6%) | 0 (0.0%) |
| Total | 78 (100.0%) | 90 (100.0%) |
Earnings by Sex by Educational Attainment in Lake Tekakwitha
Average earnings in Lake Tekakwitha are $44,083 for men and $29,444 for women, a difference of 33.2%. Men with an educational attainment of bachelor's degree enjoy the highest average annual earnings of $58,750, while those with college or associate's degree education earn the least with $43,125. Women with an educational attainment of graduate degree earn the most with the average annual earnings of $61,250, while those with high school diploma education have the smallest earnings of $21,591.
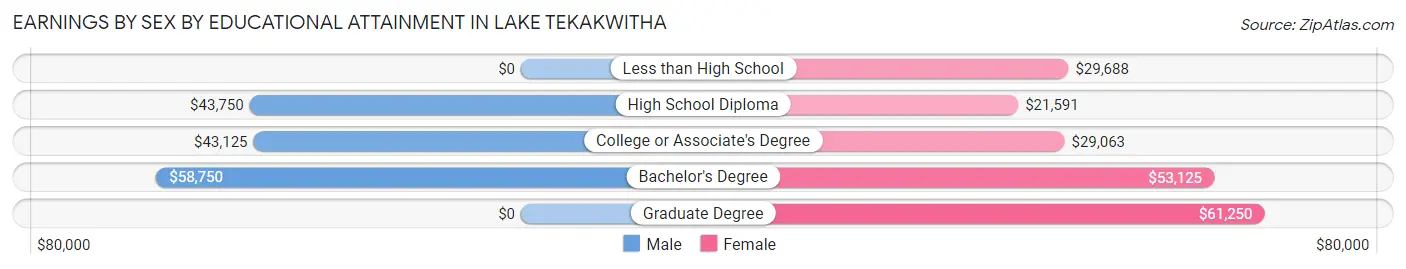
| Educational Attainment | Male Income | Female Income |
| Less than High School | - | - |
| High School Diploma | $43,750 | $21,591 |
| College or Associate's Degree | $43,125 | $29,063 |
| Bachelor's Degree | $58,750 | $53,125 |
| Graduate Degree | - | - |
| Total | $44,083 | $29,444 |
Family Income in Lake Tekakwitha
Family Income Brackets in Lake Tekakwitha
According to the Lake Tekakwitha family income data, there are 23 families falling into the $50,000 to $74,999 income range, which is the most common income bracket and makes up 34.3% of all families.
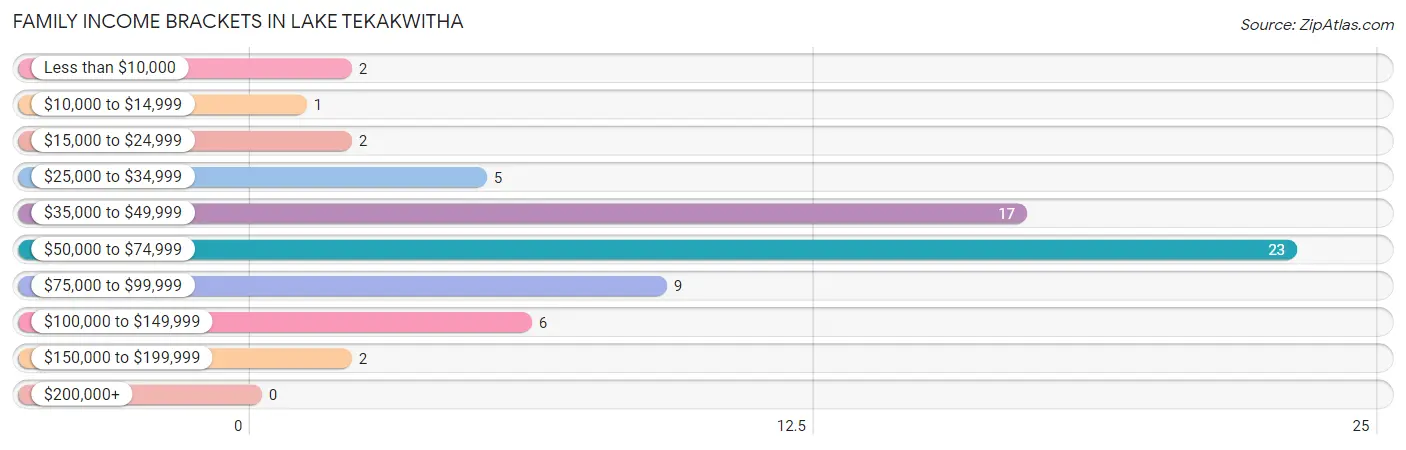
| Income Bracket | # Families | % Families |
| Less than $10,000 | 2 | 3.0% |
| $10,000 to $14,999 | 1 | 1.5% |
| $15,000 to $24,999 | 2 | 3.0% |
| $25,000 to $34,999 | 5 | 7.5% |
| $35,000 to $49,999 | 17 | 25.4% |
| $50,000 to $74,999 | 23 | 34.3% |
| $75,000 to $99,999 | 9 | 13.4% |
| $100,000 to $149,999 | 6 | 9.0% |
| $150,000 to $199,999 | 2 | 3.0% |
| $200,000+ | 0 | 0.0% |
Family Income by Famaliy Size in Lake Tekakwitha
3-person families (20 | 29.8%) account for the highest median family income in Lake Tekakwitha with $57,500 per family, while 2-person families (43 | 64.2%) have the highest median income of $23,229 per family member.
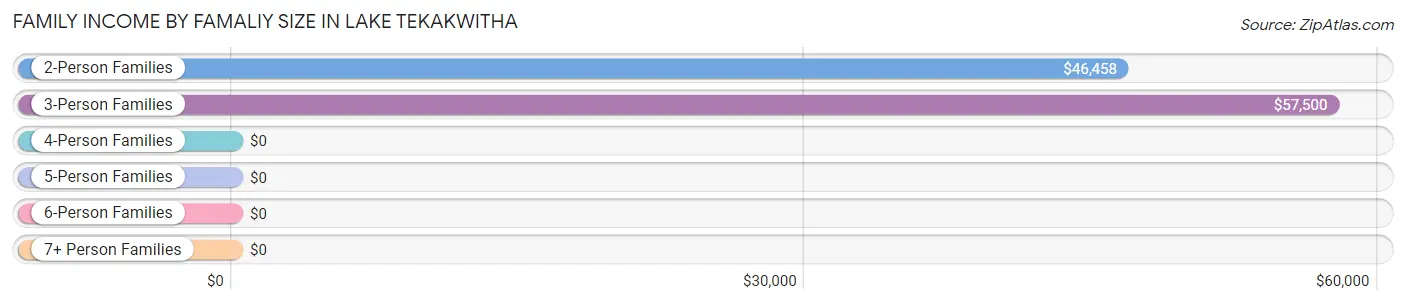
| Income Bracket | # Families | Median Income |
| 2-Person Families | 43 (64.2%) | $46,458 |
| 3-Person Families | 20 (29.8%) | $57,500 |
| 4-Person Families | 2 (3.0%) | $0 |
| 5-Person Families | 2 (3.0%) | $0 |
| 6-Person Families | 0 (0.0%) | $0 |
| 7+ Person Families | 0 (0.0%) | $0 |
| Total | 67 (100.0%) | $51,806 |
Family Income by Number of Earners in Lake Tekakwitha
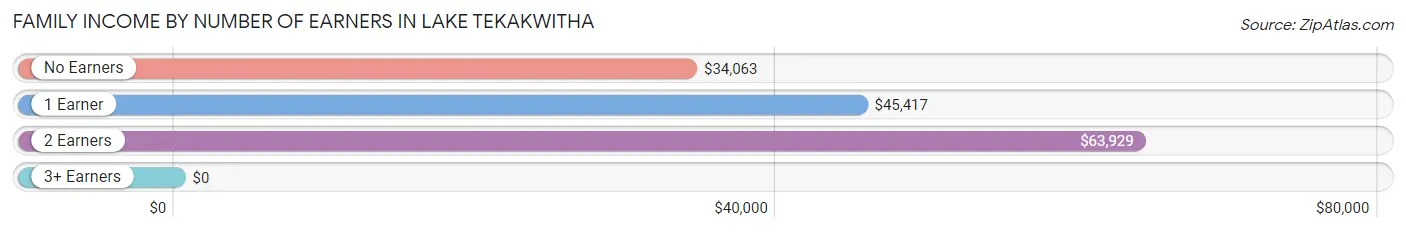
| Number of Earners | # Families | Median Income |
| No Earners | 7 (10.4%) | $34,063 |
| 1 Earner | 30 (44.8%) | $45,417 |
| 2 Earners | 26 (38.8%) | $63,929 |
| 3+ Earners | 4 (6.0%) | $0 |
| Total | 67 (100.0%) | $51,806 |
Household Income in Lake Tekakwitha
Household Income Brackets in Lake Tekakwitha
With 40 households falling in the category, the $35,000 to $49,999 income range is the most frequent in Lake Tekakwitha, accounting for 32.3% of all households.
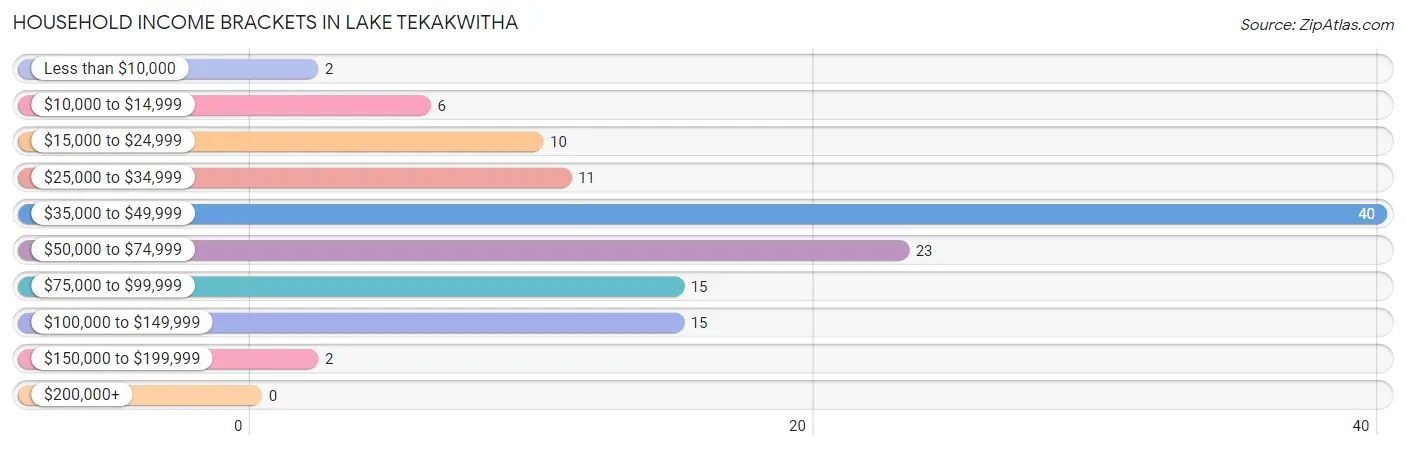
| Income Bracket | # Households | % Households |
| Less than $10,000 | 2 | 1.6% |
| $10,000 to $14,999 | 6 | 4.8% |
| $15,000 to $24,999 | 10 | 8.1% |
| $25,000 to $34,999 | 11 | 8.9% |
| $35,000 to $49,999 | 40 | 32.3% |
| $50,000 to $74,999 | 23 | 18.5% |
| $75,000 to $99,999 | 15 | 12.1% |
| $100,000 to $149,999 | 15 | 12.1% |
| $150,000 to $199,999 | 2 | 1.6% |
| $200,000+ | 0 | 0.0% |
Household Income by Householder Age in Lake Tekakwitha
The median household income in Lake Tekakwitha is $46,250, with the highest median household income of $51,094 found in the 45 to 64 years age bracket for the primary householder. A total of 61 households (49.2%) fall into this category.
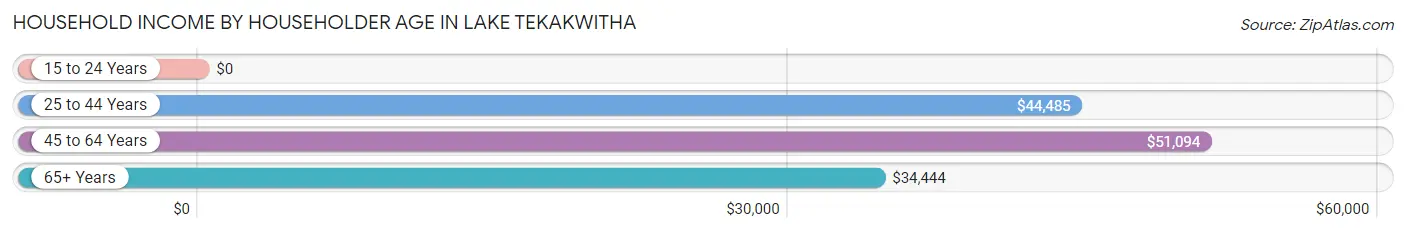
| Income Bracket | # Households | Median Income |
| 15 to 24 Years | 0 (0.0%) | $0 |
| 25 to 44 Years | 31 (25.0%) | $44,485 |
| 45 to 64 Years | 61 (49.2%) | $51,094 |
| 65+ Years | 32 (25.8%) | $34,444 |
| Total | 124 (100.0%) | $46,250 |
Poverty in Lake Tekakwitha
Income Below Poverty by Sex and Age in Lake Tekakwitha
With 9.9% poverty level for males and 0.8% for females among the residents of Lake Tekakwitha, 65 to 74 year old males and 35 to 44 year old females are the most vulnerable to poverty, with 5 males (62.5%) and 1 females (11.1%) in their respective age groups living below the poverty level.
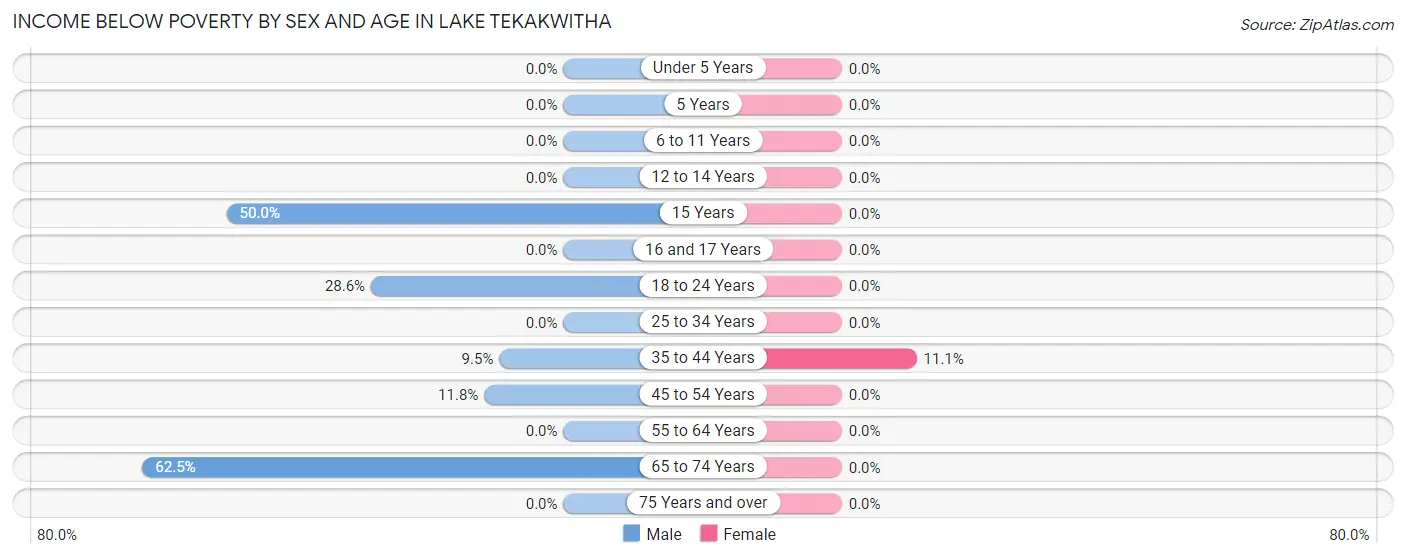
| Age Bracket | Male | Female |
| Under 5 Years | 0 (0.0%) | 0 (0.0%) |
| 5 Years | 0 (0.0%) | 0 (0.0%) |
| 6 to 11 Years | 0 (0.0%) | 0 (0.0%) |
| 12 to 14 Years | 0 (0.0%) | 0 (0.0%) |
| 15 Years | 2 (50.0%) | 0 (0.0%) |
| 16 and 17 Years | 0 (0.0%) | 0 (0.0%) |
| 18 to 24 Years | 2 (28.6%) | 0 (0.0%) |
| 25 to 34 Years | 0 (0.0%) | 0 (0.0%) |
| 35 to 44 Years | 2 (9.5%) | 1 (11.1%) |
| 45 to 54 Years | 2 (11.8%) | 0 (0.0%) |
| 55 to 64 Years | 0 (0.0%) | 0 (0.0%) |
| 65 to 74 Years | 5 (62.5%) | 0 (0.0%) |
| 75 Years and over | 0 (0.0%) | 0 (0.0%) |
| Total | 13 (9.9%) | 1 (0.8%) |
Income Above Poverty by Sex and Age in Lake Tekakwitha
According to the poverty statistics in Lake Tekakwitha, males aged under 5 years and females aged under 5 years are the age groups that are most secure financially, with 100.0% of males and 100.0% of females in these age groups living above the poverty line.
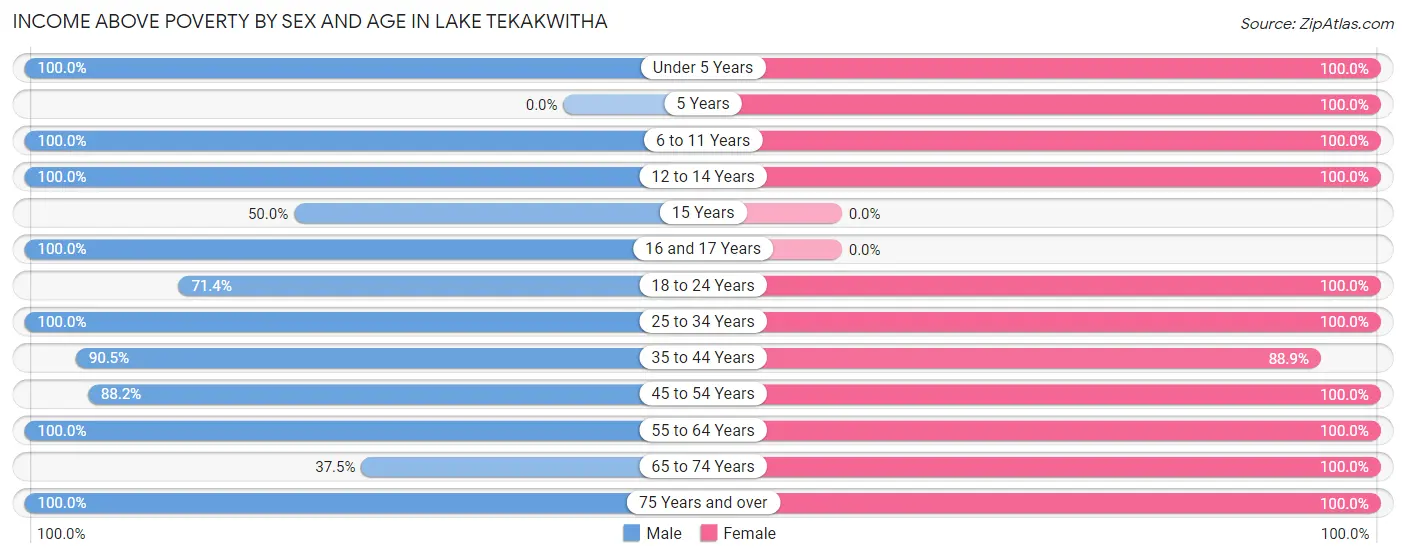
| Age Bracket | Male | Female |
| Under 5 Years | 2 (100.0%) | 1 (100.0%) |
| 5 Years | 0 (0.0%) | 1 (100.0%) |
| 6 to 11 Years | 2 (100.0%) | 5 (100.0%) |
| 12 to 14 Years | 2 (100.0%) | 2 (100.0%) |
| 15 Years | 2 (50.0%) | 0 (0.0%) |
| 16 and 17 Years | 2 (100.0%) | 0 (0.0%) |
| 18 to 24 Years | 5 (71.4%) | 33 (100.0%) |
| 25 to 34 Years | 21 (100.0%) | 7 (100.0%) |
| 35 to 44 Years | 19 (90.5%) | 8 (88.9%) |
| 45 to 54 Years | 15 (88.2%) | 26 (100.0%) |
| 55 to 64 Years | 34 (100.0%) | 16 (100.0%) |
| 65 to 74 Years | 3 (37.5%) | 14 (100.0%) |
| 75 Years and over | 12 (100.0%) | 6 (100.0%) |
| Total | 119 (90.1%) | 119 (99.2%) |
Income Below Poverty Among Married-Couple Families in Lake Tekakwitha
The poverty statistics for married-couple families in Lake Tekakwitha show that 2.3% or 1 of the total 43 families live below the poverty line. Families with 1 or 2 children have the highest poverty rate of 25.0%, comprising of 1 families. On the other hand, families with no children have the lowest poverty rate of 0.0%, which includes 0 families.
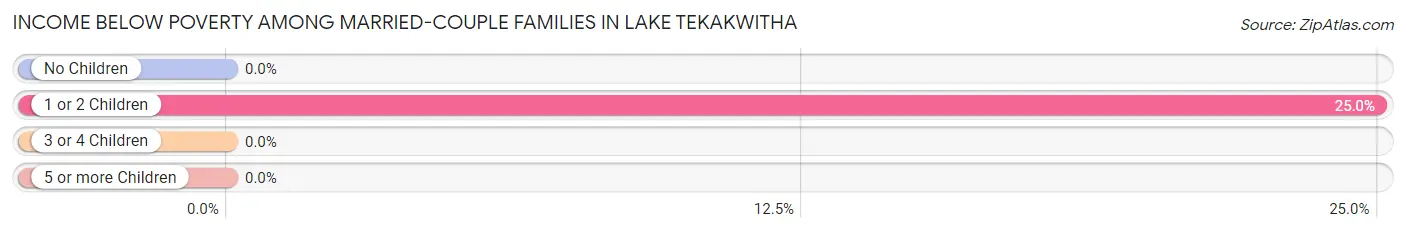
| Children | Above Poverty | Below Poverty |
| No Children | 39 (100.0%) | 0 (0.0%) |
| 1 or 2 Children | 3 (75.0%) | 1 (25.0%) |
| 3 or 4 Children | 0 (0.0%) | 0 (0.0%) |
| 5 or more Children | 0 (0.0%) | 0 (0.0%) |
| Total | 42 (97.7%) | 1 (2.3%) |
Income Below Poverty Among Single-Parent Households in Lake Tekakwitha
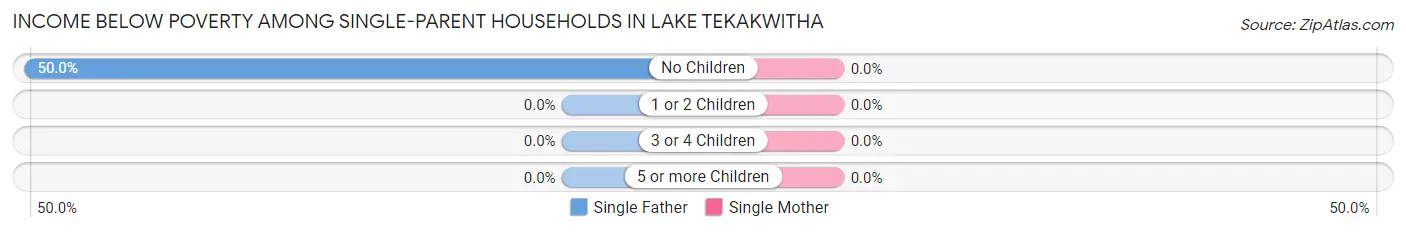
| Children | Single Father | Single Mother |
| No Children | 2 (50.0%) | 0 (0.0%) |
| 1 or 2 Children | 0 (0.0%) | 0 (0.0%) |
| 3 or 4 Children | 0 (0.0%) | 0 (0.0%) |
| 5 or more Children | 0 (0.0%) | 0 (0.0%) |
| Total | 2 (15.4%) | 0 (0.0%) |
Income Below Poverty Among Married-Couple vs Single-Parent Households in Lake Tekakwitha
The poverty data for Lake Tekakwitha shows that 1 of the married-couple family households (2.3%) and 2 of the single-parent households (8.3%) are living below the poverty level. Within the married-couple family households, those with 1 or 2 children have the highest poverty rate, with 1 households (25.0%) falling below the poverty line. Among the single-parent households, those with no children have the highest poverty rate, with 2 household (16.7%) living below poverty.
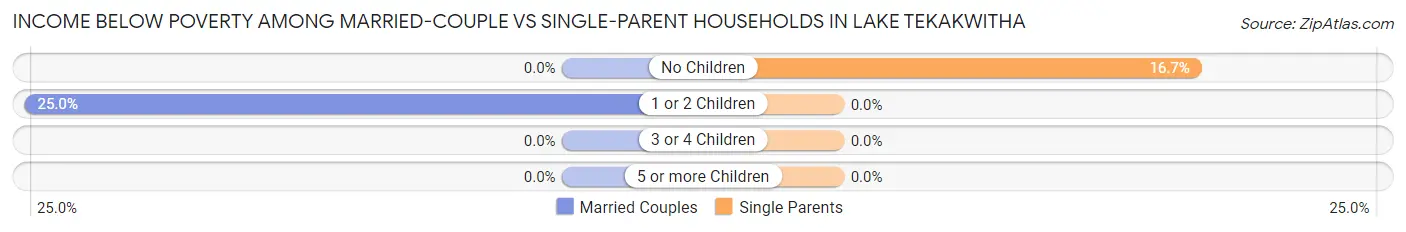
| Children | Married-Couple Families | Single-Parent Households |
| No Children | 0 (0.0%) | 2 (16.7%) |
| 1 or 2 Children | 1 (25.0%) | 0 (0.0%) |
| 3 or 4 Children | 0 (0.0%) | 0 (0.0%) |
| 5 or more Children | 0 (0.0%) | 0 (0.0%) |
| Total | 1 (2.3%) | 2 (8.3%) |
Race in Lake Tekakwitha
The most populous races in Lake Tekakwitha are White / Caucasian (214 | 84.9%), Two or more Races (26 | 10.3%), and Black / African American (7 | 2.8%).
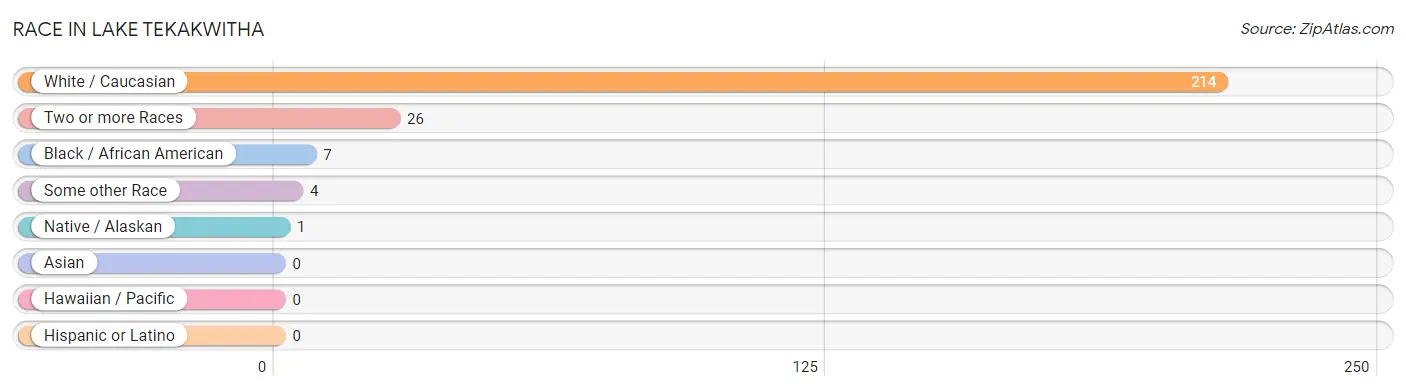
| Race | # Population | % Population |
| Asian | 0 | 0.0% |
| Black / African American | 7 | 2.8% |
| Hawaiian / Pacific | 0 | 0.0% |
| Hispanic or Latino | 0 | 0.0% |
| Native / Alaskan | 1 | 0.4% |
| White / Caucasian | 214 | 84.9% |
| Two or more Races | 26 | 10.3% |
| Some other Race | 4 | 1.6% |
| Total | 252 | 100.0% |
Ancestry in Lake Tekakwitha
The most populous ancestries reported in Lake Tekakwitha are German (53 | 21.0%), Irish (45 | 17.9%), Cherokee (10 | 4.0%), French (7 | 2.8%), and English (6 | 2.4%), together accounting for 48.0% of all Lake Tekakwitha residents.
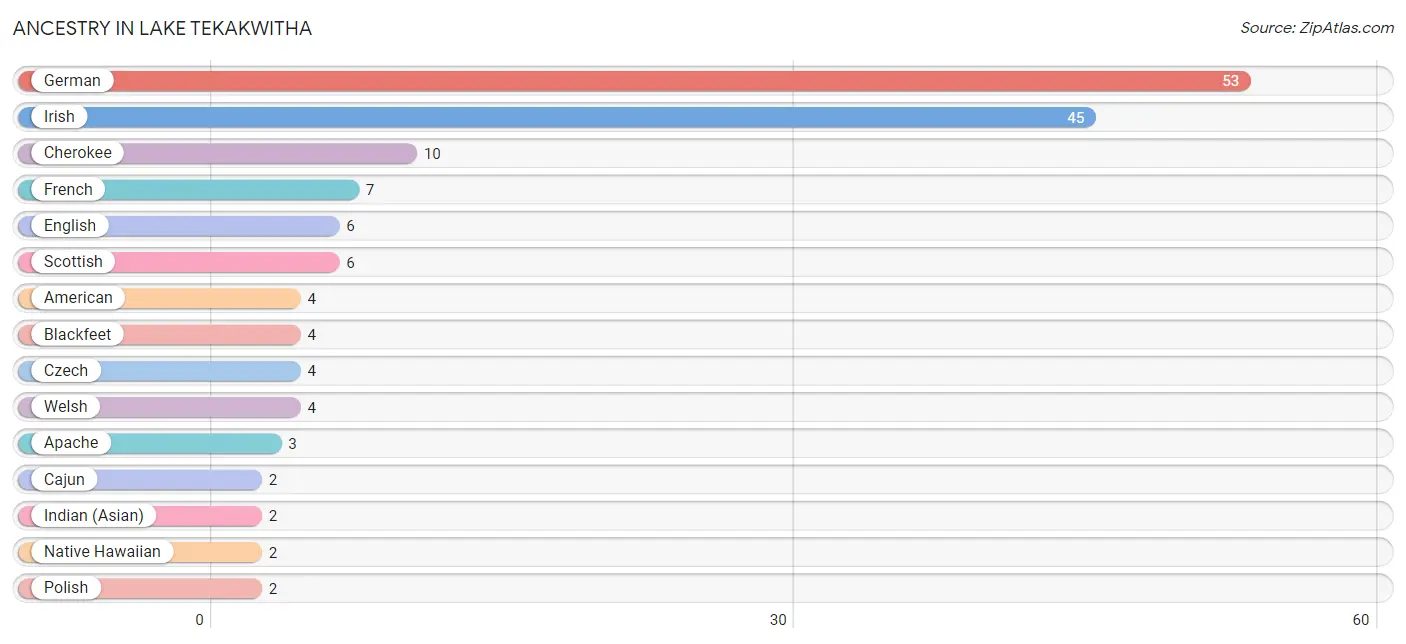
| Ancestry | # Population | % Population |
| American | 4 | 1.6% |
| Apache | 3 | 1.2% |
| Blackfeet | 4 | 1.6% |
| Cajun | 2 | 0.8% |
| Cherokee | 10 | 4.0% |
| Czech | 4 | 1.6% |
| English | 6 | 2.4% |
| French | 7 | 2.8% |
| German | 53 | 21.0% |
| Greek | 1 | 0.4% |
| Indian (Asian) | 2 | 0.8% |
| Irish | 45 | 17.9% |
| Italian | 1 | 0.4% |
| Native Hawaiian | 2 | 0.8% |
| Polish | 2 | 0.8% |
| Scotch-Irish | 1 | 0.4% |
| Scottish | 6 | 2.4% |
| Welsh | 4 | 1.6% |
| Yugoslavian | 1 | 0.4% | View All 19 Rows |
Immigrants in Lake Tekakwitha

| Immigration Origin | # Population | % Population | View All 0 Rows |
Sex and Age in Lake Tekakwitha
Sex and Age in Lake Tekakwitha
The most populous age groups in Lake Tekakwitha are 60 to 64 Years (20 | 15.1%) for men and 15 to 19 Years (22 | 18.3%) for women.
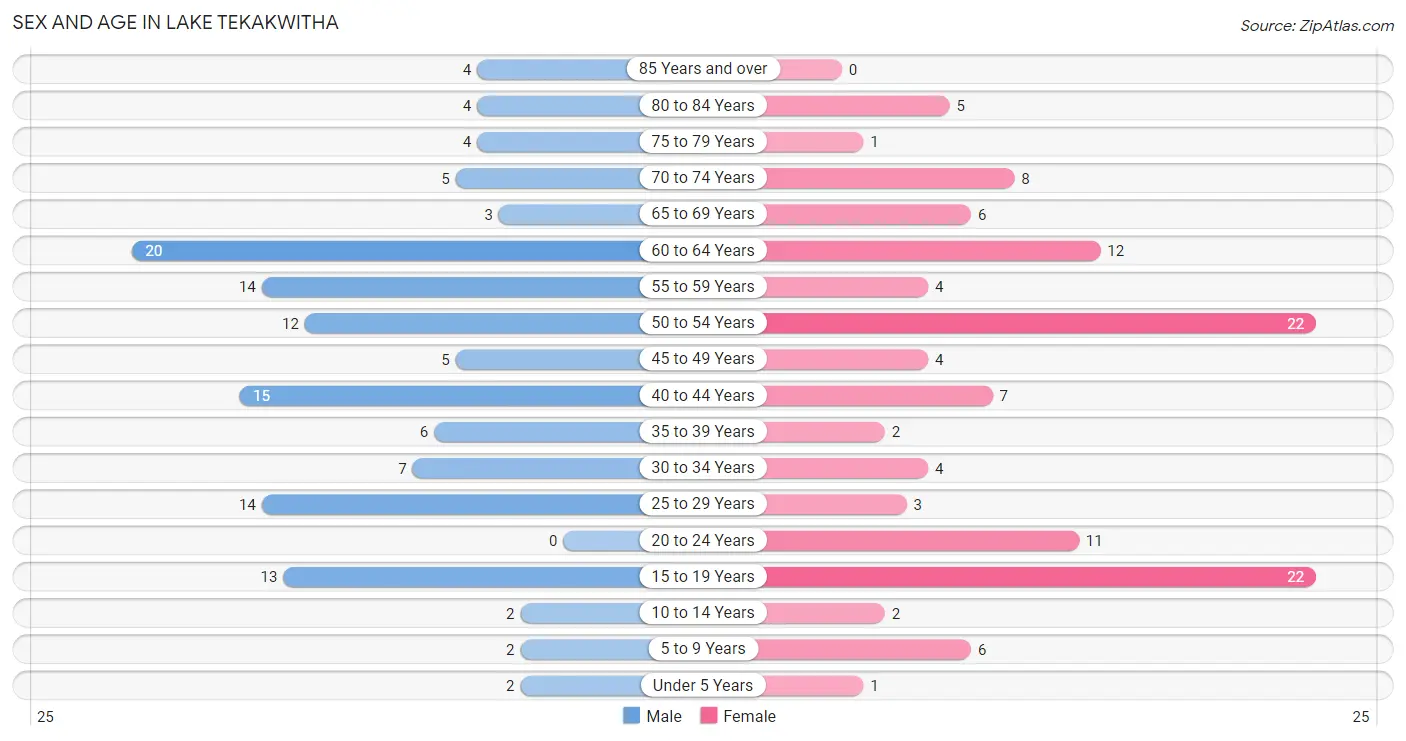
| Age Bracket | Male | Female |
| Under 5 Years | 2 (1.5%) | 1 (0.8%) |
| 5 to 9 Years | 2 (1.5%) | 6 (5.0%) |
| 10 to 14 Years | 2 (1.5%) | 2 (1.7%) |
| 15 to 19 Years | 13 (9.9%) | 22 (18.3%) |
| 20 to 24 Years | 0 (0.0%) | 11 (9.2%) |
| 25 to 29 Years | 14 (10.6%) | 3 (2.5%) |
| 30 to 34 Years | 7 (5.3%) | 4 (3.3%) |
| 35 to 39 Years | 6 (4.5%) | 2 (1.7%) |
| 40 to 44 Years | 15 (11.4%) | 7 (5.8%) |
| 45 to 49 Years | 5 (3.8%) | 4 (3.3%) |
| 50 to 54 Years | 12 (9.1%) | 22 (18.3%) |
| 55 to 59 Years | 14 (10.6%) | 4 (3.3%) |
| 60 to 64 Years | 20 (15.1%) | 12 (10.0%) |
| 65 to 69 Years | 3 (2.3%) | 6 (5.0%) |
| 70 to 74 Years | 5 (3.8%) | 8 (6.7%) |
| 75 to 79 Years | 4 (3.0%) | 1 (0.8%) |
| 80 to 84 Years | 4 (3.0%) | 5 (4.2%) |
| 85 Years and over | 4 (3.0%) | 0 (0.0%) |
| Total | 132 (100.0%) | 120 (100.0%) |
Families and Households in Lake Tekakwitha
Median Family Size in Lake Tekakwitha
The median family size in Lake Tekakwitha is 2.76 persons per family, with married-couple families (43 | 64.2%) accounting for the largest median family size of 2.98 persons per family. On the other hand, single male/father families (13 | 19.4%) represent the smallest median family size with 2.08 persons per family.
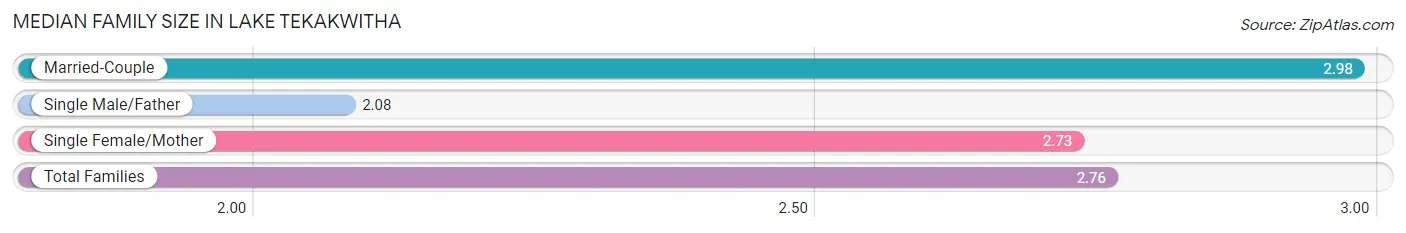
| Family Type | # Families | Family Size |
| Married-Couple | 43 (64.2%) | 2.98 |
| Single Male/Father | 13 (19.4%) | 2.08 |
| Single Female/Mother | 11 (16.4%) | 2.73 |
| Total Families | 67 (100.0%) | 2.76 |
Median Household Size in Lake Tekakwitha
The median household size in Lake Tekakwitha is 2.03 persons per household, with single female/mother households (11 | 8.9%) accounting for the largest median household size of 3.18 persons per household. non-family households (57 | 46.0%) represent the smallest median household size with 1.05 persons per household.
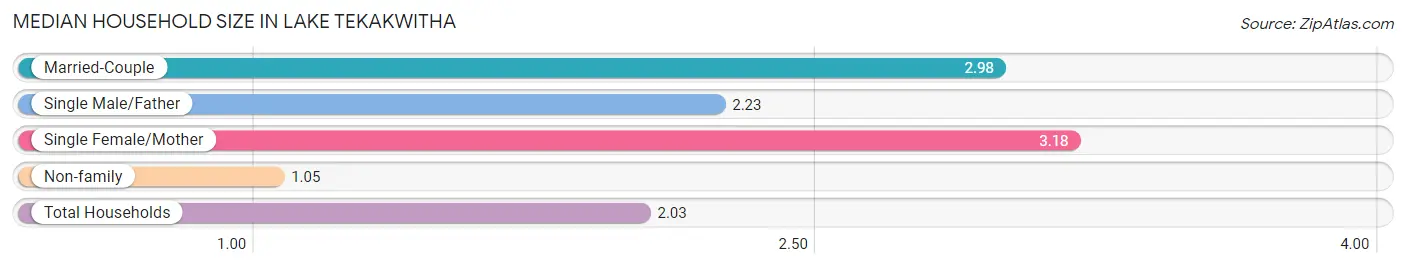
| Household Type | # Households | Household Size |
| Married-Couple | 43 (34.7%) | 2.98 |
| Single Male/Father | 13 (10.5%) | 2.23 |
| Single Female/Mother | 11 (8.9%) | 3.18 |
| Non-family | 57 (46.0%) | 1.05 |
| Total Households | 124 (100.0%) | 2.03 |
Household Size by Marriage Status in Lake Tekakwitha
Out of a total of 124 households in Lake Tekakwitha, 67 (54.0%) are family households, while 57 (46.0%) are nonfamily households. The most numerous type of family households are 2-person households, comprising 43, and the most common type of nonfamily households are 1-person households, comprising 53.
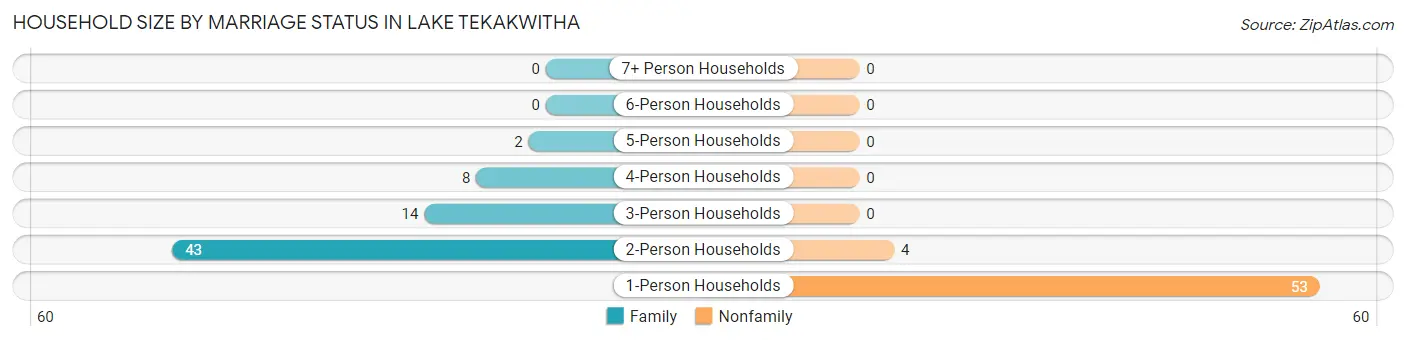
| Household Size | Family Households | Nonfamily Households |
| 1-Person Households | - | 53 (42.7%) |
| 2-Person Households | 43 (34.7%) | 4 (3.2%) |
| 3-Person Households | 14 (11.3%) | 0 (0.0%) |
| 4-Person Households | 8 (6.5%) | 0 (0.0%) |
| 5-Person Households | 2 (1.6%) | 0 (0.0%) |
| 6-Person Households | 0 (0.0%) | 0 (0.0%) |
| 7+ Person Households | 0 (0.0%) | 0 (0.0%) |
| Total | 67 (54.0%) | 57 (46.0%) |
Female Fertility in Lake Tekakwitha
Fertility by Age in Lake Tekakwitha
| Age Bracket | Women with Births | Births / 1,000 Women |
| 15 to 19 years | 0 (0.0%) | 0.0 |
| 20 to 34 years | 0 (0.0%) | 0.0 |
| 35 to 50 years | 0 (0.0%) | 0.0 |
| Total | 0 (0.0%) | 0.0 |
Fertility by Age by Marriage Status in Lake Tekakwitha
| Age Bracket | Married | Unmarried |
| 15 to 19 years | 0 (0.0%) | 0 (0.0%) |
| 20 to 34 years | 0 (0.0%) | 0 (0.0%) |
| 35 to 50 years | 0 (0.0%) | 0 (0.0%) |
| Total | 0 (0.0%) | 0 (0.0%) |
Fertility by Education in Lake Tekakwitha
| Educational Attainment | Women with Births | Births / 1,000 Women |
| Less than High School | 0 (0.0%) | 0.0 |
| High School Diploma | 0 (0.0%) | 0.0 |
| College or Associate's Degree | 0 (0.0%) | 0.0 |
| Bachelor's Degree | 0 (0.0%) | 0.0 |
| Graduate Degree | 0 (0.0%) | 0.0 |
| Total | 0 (0.0%) | 0.0 |
Fertility by Education by Marriage Status in Lake Tekakwitha
| Educational Attainment | Married | Unmarried |
| Less than High School | 0 (0.0%) | 0 (0.0%) |
| High School Diploma | 0 (0.0%) | 0 (0.0%) |
| College or Associate's Degree | 0 (0.0%) | 0 (0.0%) |
| Bachelor's Degree | 0 (0.0%) | 0 (0.0%) |
| Graduate Degree | 0 (0.0%) | 0 (0.0%) |
| Total | 0 (0.0%) | 0 (0.0%) |
Employment Characteristics in Lake Tekakwitha
Employment by Class of Employer in Lake Tekakwitha
Among the 161 employed individuals in Lake Tekakwitha, private company employees (103 | 64.0%), not-for-profit organizations (28 | 17.4%), and self-employed (not incorporated) (11 | 6.8%) make up the most common classes of employment.
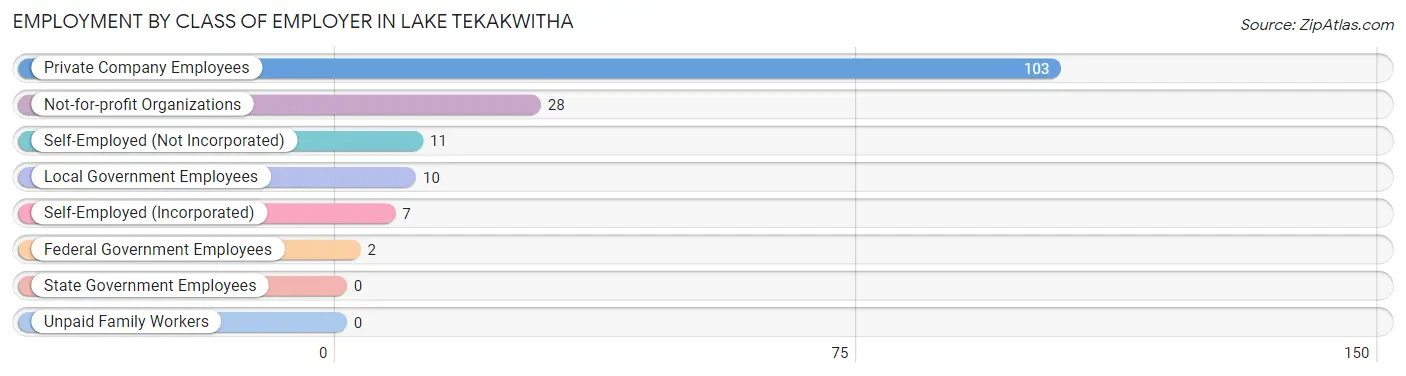
| Employer Class | # Employees | % Employees |
| Private Company Employees | 103 | 64.0% |
| Self-Employed (Incorporated) | 7 | 4.3% |
| Self-Employed (Not Incorporated) | 11 | 6.8% |
| Not-for-profit Organizations | 28 | 17.4% |
| Local Government Employees | 10 | 6.2% |
| State Government Employees | 0 | 0.0% |
| Federal Government Employees | 2 | 1.2% |
| Unpaid Family Workers | 0 | 0.0% |
| Total | 161 | 100.0% |
Employment Status by Age in Lake Tekakwitha
According to the labor force statistics for Lake Tekakwitha, out of the total population over 16 years of age (233), 73.4% or 171 individuals are in the labor force, with 5.8% or 10 of them unemployed. The age group with the highest labor force participation rate is 20 to 24 years, with 100.0% or 11 individuals in the labor force. Within the labor force, the 55 to 59 years age range has the highest percentage of unemployed individuals, with 50.0% or 8 of them being unemployed.
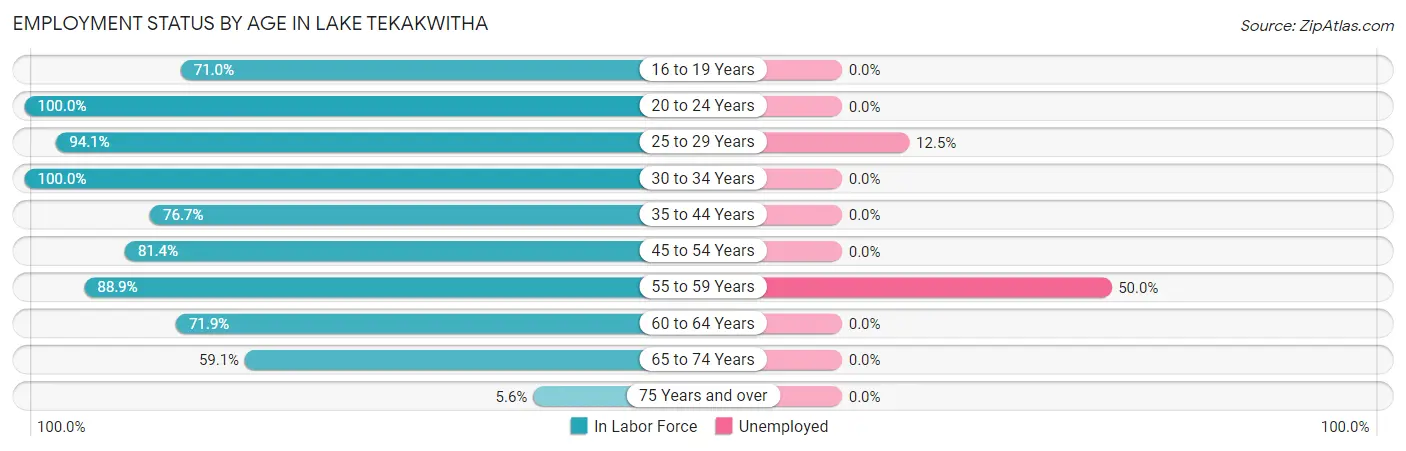
| Age Bracket | In Labor Force | Unemployed |
| 16 to 19 Years | 22 (71.0%) | 0 (0.0%) |
| 20 to 24 Years | 11 (100.0%) | 0 (0.0%) |
| 25 to 29 Years | 16 (94.1%) | 2 (12.5%) |
| 30 to 34 Years | 11 (100.0%) | 0 (0.0%) |
| 35 to 44 Years | 23 (76.7%) | 0 (0.0%) |
| 45 to 54 Years | 35 (81.4%) | 0 (0.0%) |
| 55 to 59 Years | 16 (88.9%) | 8 (50.0%) |
| 60 to 64 Years | 23 (71.9%) | 0 (0.0%) |
| 65 to 74 Years | 13 (59.1%) | 0 (0.0%) |
| 75 Years and over | 1 (5.6%) | 0 (0.0%) |
| Total | 171 (73.4%) | 10 (5.8%) |
Employment Status by Educational Attainment in Lake Tekakwitha
According to labor force statistics for Lake Tekakwitha, 82.1% of individuals (124) out of the total population between 25 and 64 years of age (151) are in the labor force, with 8.1% or 10 of them being unemployed. The group with the highest labor force participation rate are those with the educational attainment of college / associate degree, with 91.1% or 41 individuals in the labor force. Within the labor force, individuals with high school diploma education have the highest percentage of unemployment, with 13.1% or 8 of them being unemployed.
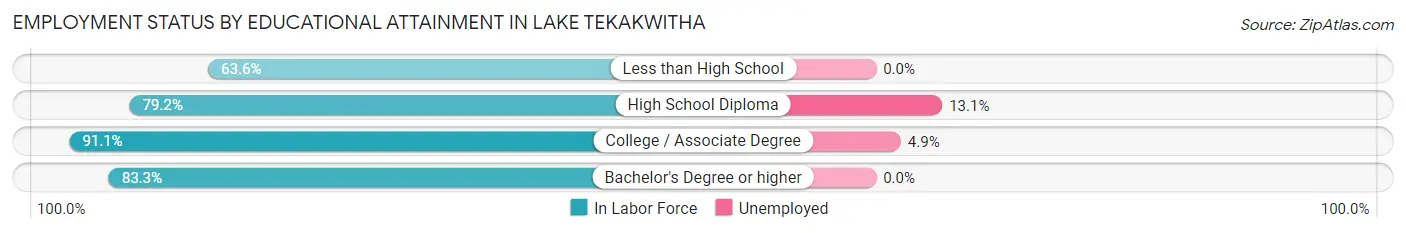
| Educational Attainment | In Labor Force | Unemployed |
| Less than High School | 7 (63.6%) | 0 (0.0%) |
| High School Diploma | 61 (79.2%) | 10 (13.1%) |
| College / Associate Degree | 41 (91.1%) | 2 (4.9%) |
| Bachelor's Degree or higher | 15 (83.3%) | 0 (0.0%) |
| Total | 124 (82.1%) | 12 (8.1%) |
Employment Occupations by Sex in Lake Tekakwitha
Management, Business, Science and Arts Occupations
The most common Management, Business, Science and Arts occupations in Lake Tekakwitha are Management (15 | 9.3%), Community & Social Service (12 | 7.4%), Education Instruction & Library (11 | 6.8%), Health Diagnosing & Treating (6 | 3.7%), and Computers, Engineering & Science (2 | 1.2%).
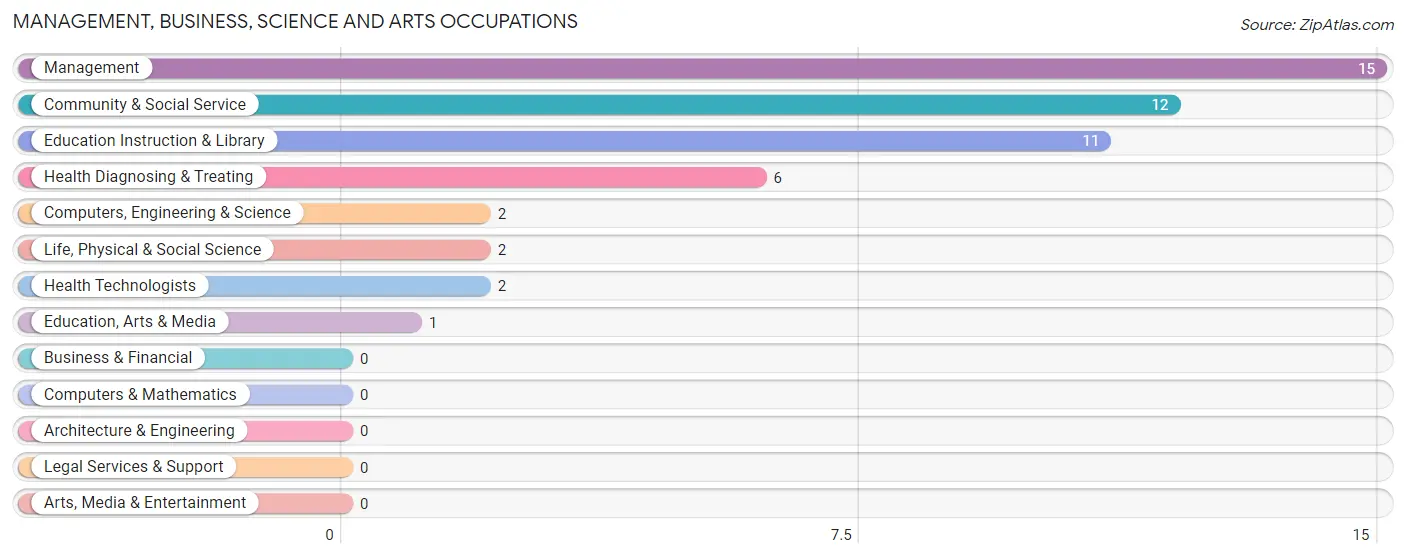
Management, Business, Science and Arts Occupations by Sex
Within the Management, Business, Science and Arts occupations in Lake Tekakwitha, the most male-oriented occupations are Computers, Engineering & Science (100.0%), Life, Physical & Social Science (100.0%), and Management (46.7%), while the most female-oriented occupations are Education, Arts & Media (100.0%), Health Technologists (100.0%), and Community & Social Service (83.3%).
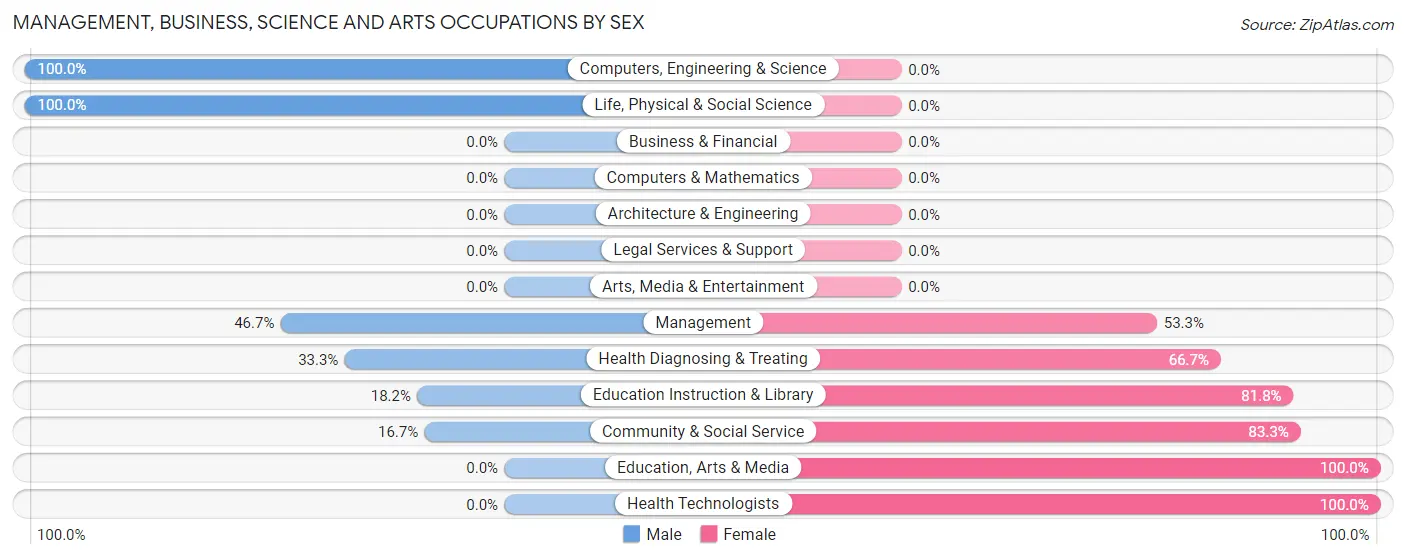
| Occupation | Male | Female |
| Management | 7 (46.7%) | 8 (53.3%) |
| Business & Financial | 0 (0.0%) | 0 (0.0%) |
| Computers, Engineering & Science | 2 (100.0%) | 0 (0.0%) |
| Computers & Mathematics | 0 (0.0%) | 0 (0.0%) |
| Architecture & Engineering | 0 (0.0%) | 0 (0.0%) |
| Life, Physical & Social Science | 2 (100.0%) | 0 (0.0%) |
| Community & Social Service | 2 (16.7%) | 10 (83.3%) |
| Education, Arts & Media | 0 (0.0%) | 1 (100.0%) |
| Legal Services & Support | 0 (0.0%) | 0 (0.0%) |
| Education Instruction & Library | 2 (18.2%) | 9 (81.8%) |
| Arts, Media & Entertainment | 0 (0.0%) | 0 (0.0%) |
| Health Diagnosing & Treating | 2 (33.3%) | 4 (66.7%) |
| Health Technologists | 0 (0.0%) | 2 (100.0%) |
| Total (Category) | 13 (37.1%) | 22 (62.9%) |
| Total (Overall) | 72 (44.7%) | 89 (55.3%) |
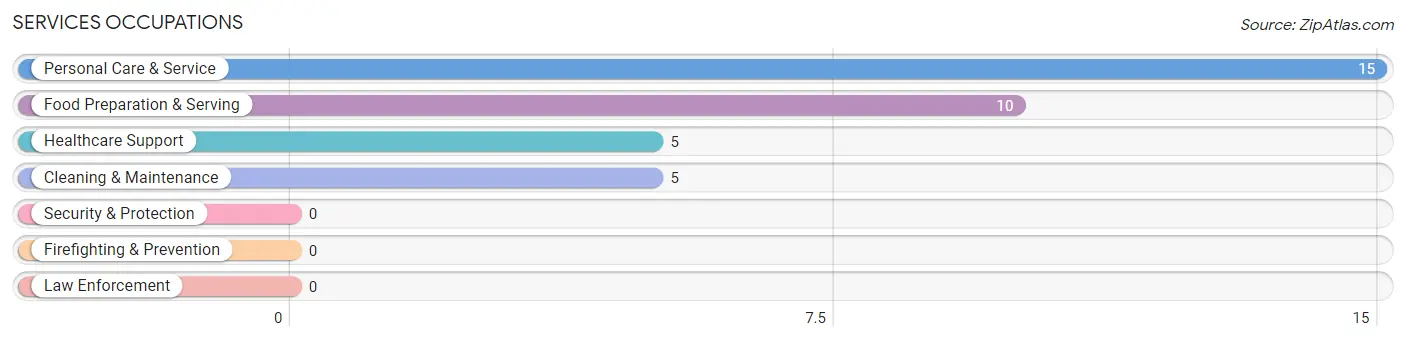
Services Occupations
The most common Services occupations in Lake Tekakwitha are Personal Care & Service (15 | 9.3%), Food Preparation & Serving (10 | 6.2%), Healthcare Support (5 | 3.1%), and Cleaning & Maintenance (5 | 3.1%).
Services Occupations by Sex
Within the Services occupations in Lake Tekakwitha, the most male-oriented occupations are Cleaning & Maintenance (80.0%), and Food Preparation & Serving (70.0%), while the most female-oriented occupations are Healthcare Support (100.0%), Personal Care & Service (100.0%), and Food Preparation & Serving (30.0%).
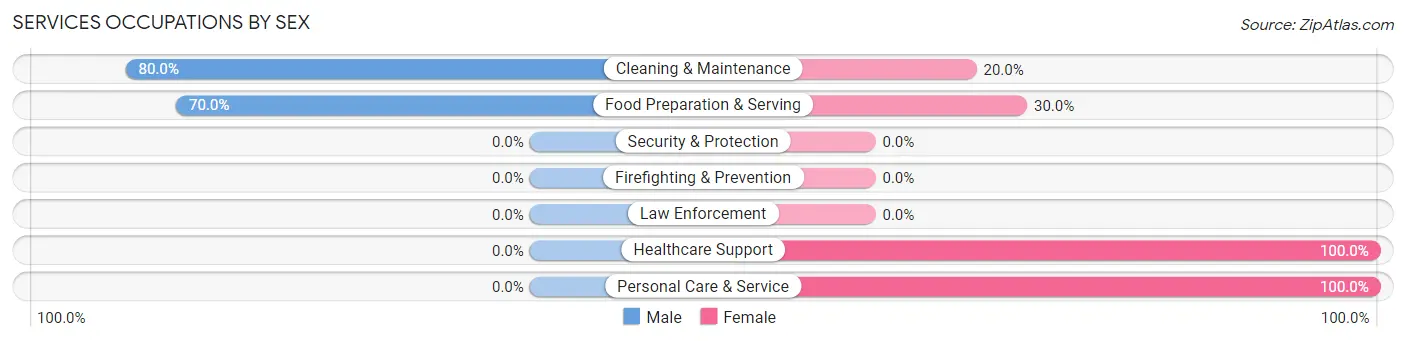
| Occupation | Male | Female |
| Healthcare Support | 0 (0.0%) | 5 (100.0%) |
| Security & Protection | 0 (0.0%) | 0 (0.0%) |
| Firefighting & Prevention | 0 (0.0%) | 0 (0.0%) |
| Law Enforcement | 0 (0.0%) | 0 (0.0%) |
| Food Preparation & Serving | 7 (70.0%) | 3 (30.0%) |
| Cleaning & Maintenance | 4 (80.0%) | 1 (20.0%) |
| Personal Care & Service | 0 (0.0%) | 15 (100.0%) |
| Total (Category) | 11 (31.4%) | 24 (68.6%) |
| Total (Overall) | 72 (44.7%) | 89 (55.3%) |
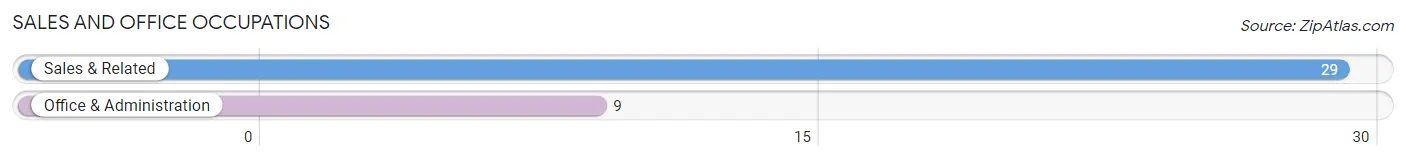
Sales and Office Occupations
The most common Sales and Office occupations in Lake Tekakwitha are Sales & Related (29 | 18.0%), and Office & Administration (9 | 5.6%).
Sales and Office Occupations by Sex
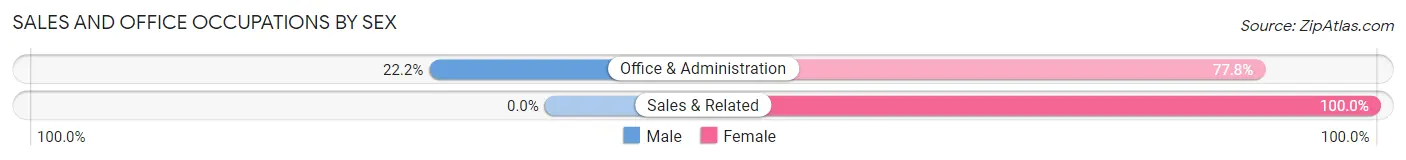
| Occupation | Male | Female |
| Sales & Related | 0 (0.0%) | 29 (100.0%) |
| Office & Administration | 2 (22.2%) | 7 (77.8%) |
| Total (Category) | 2 (5.3%) | 36 (94.7%) |
| Total (Overall) | 72 (44.7%) | 89 (55.3%) |
Natural Resources, Construction and Maintenance Occupations
The most common Natural Resources, Construction and Maintenance occupations in Lake Tekakwitha are Construction & Extraction (23 | 14.3%), and Installation, Maintenance & Repair (2 | 1.2%).
Natural Resources, Construction and Maintenance Occupations by Sex
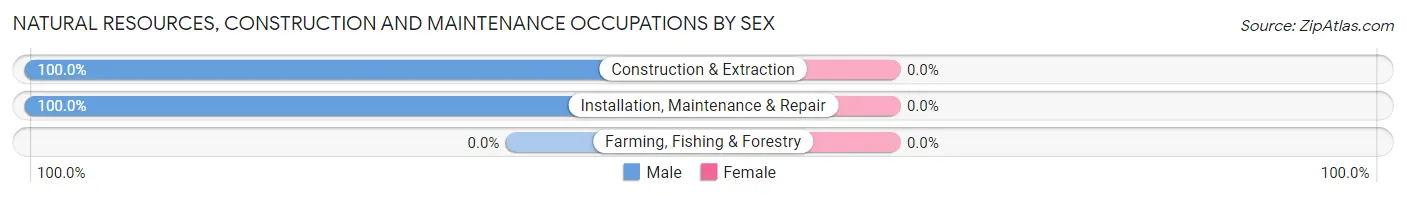
| Occupation | Male | Female |
| Farming, Fishing & Forestry | 0 (0.0%) | 0 (0.0%) |
| Construction & Extraction | 23 (100.0%) | 0 (0.0%) |
| Installation, Maintenance & Repair | 2 (100.0%) | 0 (0.0%) |
| Total (Category) | 25 (100.0%) | 0 (0.0%) |
| Total (Overall) | 72 (44.7%) | 89 (55.3%) |
Production, Transportation and Moving Occupations
The most common Production, Transportation and Moving occupations in Lake Tekakwitha are Production (13 | 8.1%), Transportation (8 | 5.0%), and Material Moving (7 | 4.3%).
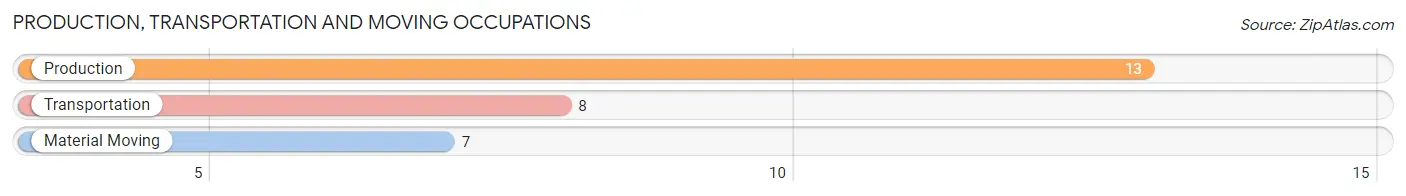
Production, Transportation and Moving Occupations by Sex
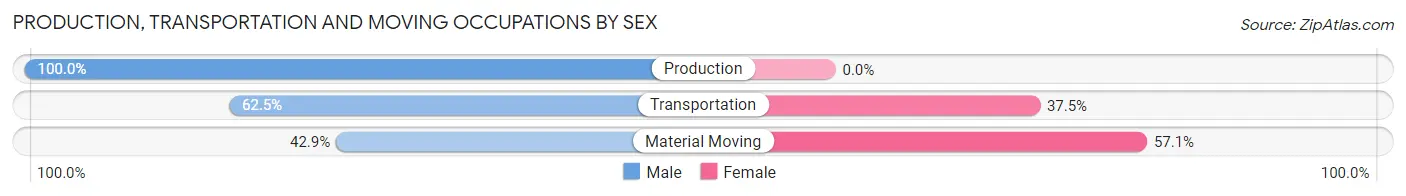
| Occupation | Male | Female |
| Production | 13 (100.0%) | 0 (0.0%) |
| Transportation | 5 (62.5%) | 3 (37.5%) |
| Material Moving | 3 (42.9%) | 4 (57.1%) |
| Total (Category) | 21 (75.0%) | 7 (25.0%) |
| Total (Overall) | 72 (44.7%) | 89 (55.3%) |
Employment Industries by Sex in Lake Tekakwitha
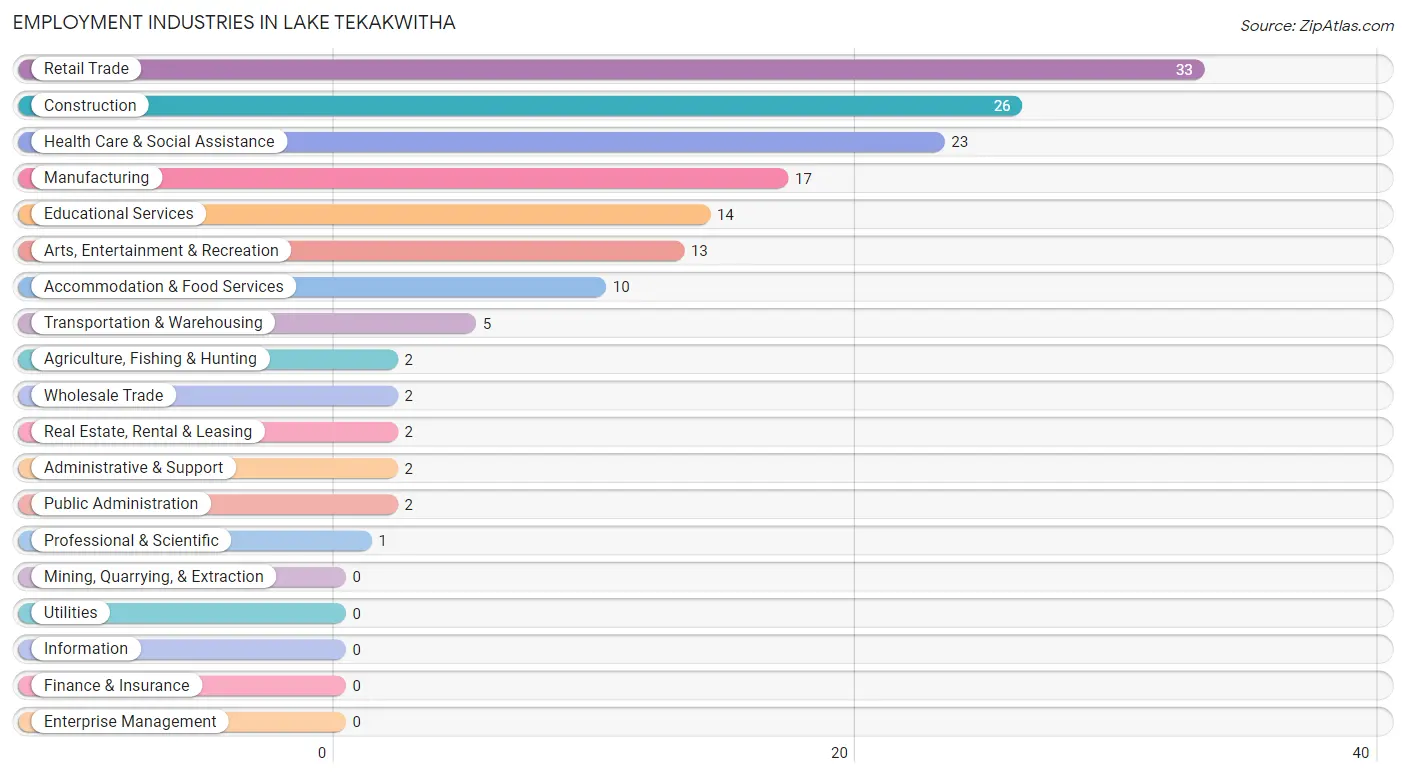
Employment Industries in Lake Tekakwitha
The major employment industries in Lake Tekakwitha include Retail Trade (33 | 20.5%), Construction (26 | 16.2%), Health Care & Social Assistance (23 | 14.3%), Manufacturing (17 | 10.6%), and Educational Services (14 | 8.7%).
Employment Industries by Sex in Lake Tekakwitha
The Lake Tekakwitha industries that see more men than women are Construction (100.0%), Real Estate, Rental & Leasing (100.0%), and Administrative & Support (100.0%), whereas the industries that tend to have a higher number of women are Agriculture, Fishing & Hunting (100.0%), Wholesale Trade (100.0%), and Transportation & Warehousing (100.0%).
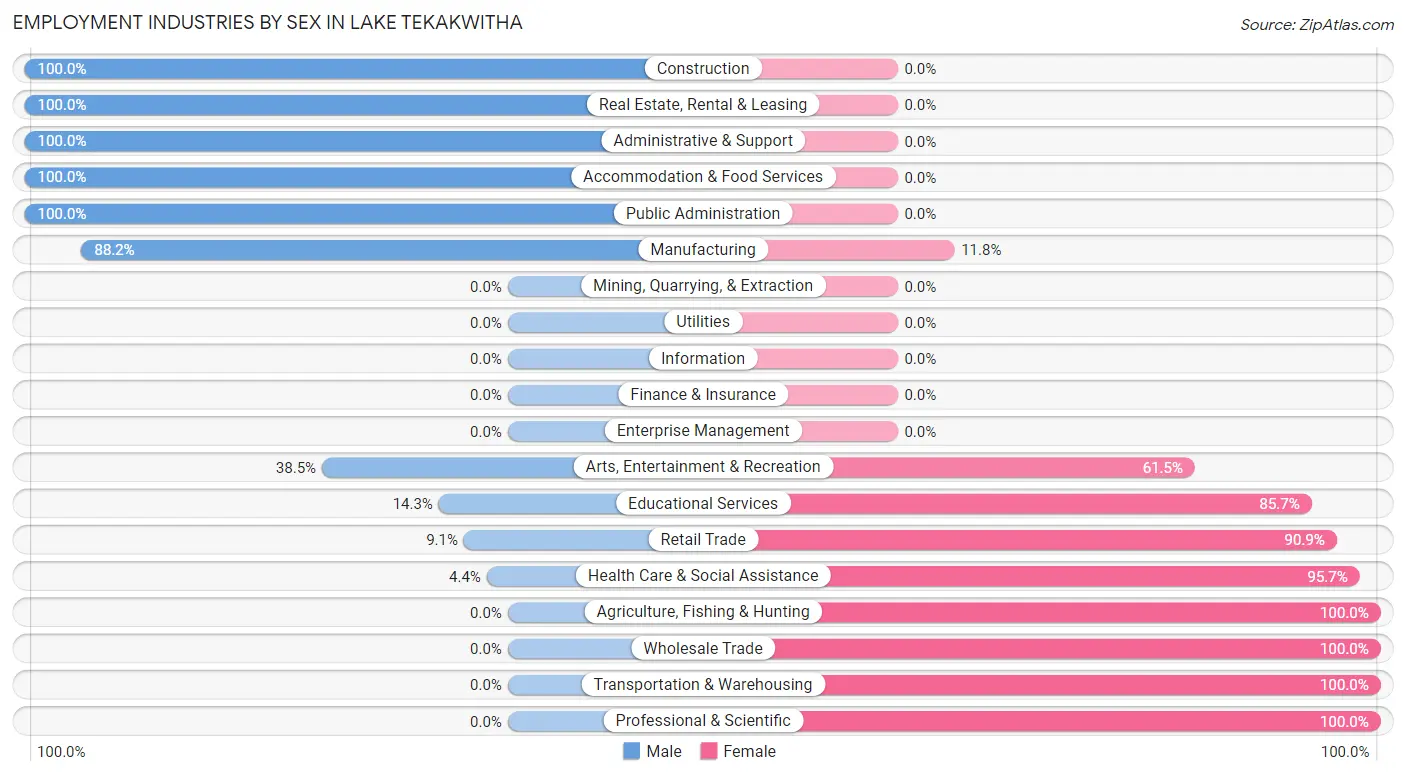
| Industry | Male | Female |
| Agriculture, Fishing & Hunting | 0 (0.0%) | 2 (100.0%) |
| Mining, Quarrying, & Extraction | 0 (0.0%) | 0 (0.0%) |
| Construction | 26 (100.0%) | 0 (0.0%) |
| Manufacturing | 15 (88.2%) | 2 (11.8%) |
| Wholesale Trade | 0 (0.0%) | 2 (100.0%) |
| Retail Trade | 3 (9.1%) | 30 (90.9%) |
| Transportation & Warehousing | 0 (0.0%) | 5 (100.0%) |
| Utilities | 0 (0.0%) | 0 (0.0%) |
| Information | 0 (0.0%) | 0 (0.0%) |
| Finance & Insurance | 0 (0.0%) | 0 (0.0%) |
| Real Estate, Rental & Leasing | 2 (100.0%) | 0 (0.0%) |
| Professional & Scientific | 0 (0.0%) | 1 (100.0%) |
| Enterprise Management | 0 (0.0%) | 0 (0.0%) |
| Administrative & Support | 2 (100.0%) | 0 (0.0%) |
| Educational Services | 2 (14.3%) | 12 (85.7%) |
| Health Care & Social Assistance | 1 (4.3%) | 22 (95.7%) |
| Arts, Entertainment & Recreation | 5 (38.5%) | 8 (61.5%) |
| Accommodation & Food Services | 10 (100.0%) | 0 (0.0%) |
| Public Administration | 2 (100.0%) | 0 (0.0%) |
| Total | 72 (44.7%) | 89 (55.3%) |
Education in Lake Tekakwitha
School Enrollment in Lake Tekakwitha
The most common levels of schooling among the 48 students in Lake Tekakwitha are college / undergraduate (21 | 43.8%), high school (14 | 29.2%), and elementary school (7 | 14.6%).

| School Level | # Students | % Students |
| Nursery / Preschool | 2 | 4.2% |
| Kindergarten | 0 | 0.0% |
| Elementary School | 7 | 14.6% |
| Middle School | 1 | 2.1% |
| High School | 14 | 29.2% |
| College / Undergraduate | 21 | 43.8% |
| Graduate / Professional | 3 | 6.2% |
| Total | 48 | 100.0% |
School Enrollment by Age by Funding Source in Lake Tekakwitha
Out of a total of 48 students who are enrolled in schools in Lake Tekakwitha, 5 (10.4%) attend a private institution, while the remaining 43 (89.6%) are enrolled in public schools. The age group of 25 to 34 year olds has the highest likelihood of being enrolled in private schools, with 2 (50.0% in the age bracket) enrolled. Conversely, the age group of 3 to 4 year olds has the lowest likelihood of being enrolled in a private school, with 1 (100.0% in the age bracket) attending a public institution.
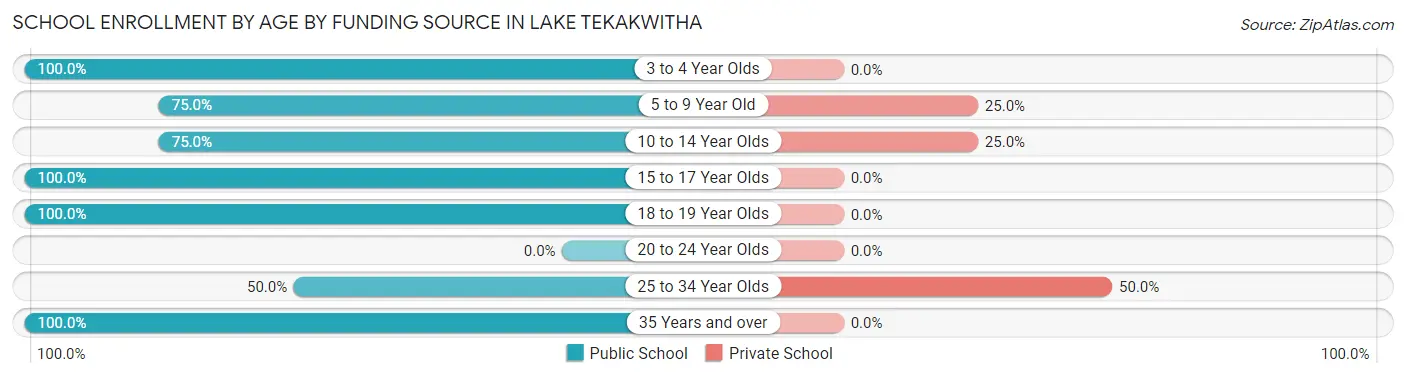
| Age Bracket | Public School | Private School |
| 3 to 4 Year Olds | 1 (100.0%) | 0 (0.0%) |
| 5 to 9 Year Old | 6 (75.0%) | 2 (25.0%) |
| 10 to 14 Year Olds | 3 (75.0%) | 1 (25.0%) |
| 15 to 17 Year Olds | 4 (100.0%) | 0 (0.0%) |
| 18 to 19 Year Olds | 24 (100.0%) | 0 (0.0%) |
| 20 to 24 Year Olds | 0 (0.0%) | 0 (0.0%) |
| 25 to 34 Year Olds | 2 (50.0%) | 2 (50.0%) |
| 35 Years and over | 3 (100.0%) | 0 (0.0%) |
| Total | 43 (89.6%) | 5 (10.4%) |
Educational Attainment by Field of Study in Lake Tekakwitha
Communications (7 | 24.1%), business (4 | 13.8%), education (4 | 13.8%), science & technology (3 | 10.3%), and literature & languages (3 | 10.3%) are the most common fields of study among 29 individuals in Lake Tekakwitha who have obtained a bachelor's degree or higher.
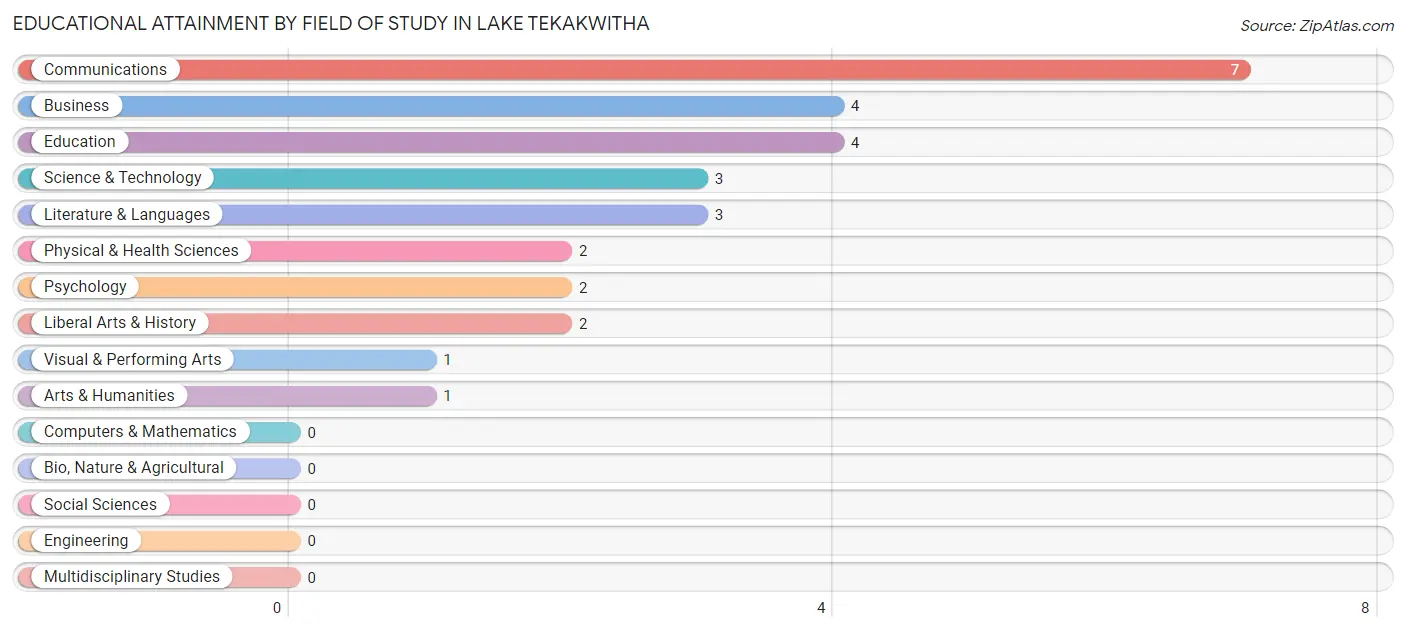
| Field of Study | # Graduates | % Graduates |
| Computers & Mathematics | 0 | 0.0% |
| Bio, Nature & Agricultural | 0 | 0.0% |
| Physical & Health Sciences | 2 | 6.9% |
| Psychology | 2 | 6.9% |
| Social Sciences | 0 | 0.0% |
| Engineering | 0 | 0.0% |
| Multidisciplinary Studies | 0 | 0.0% |
| Science & Technology | 3 | 10.3% |
| Business | 4 | 13.8% |
| Education | 4 | 13.8% |
| Literature & Languages | 3 | 10.3% |
| Liberal Arts & History | 2 | 6.9% |
| Visual & Performing Arts | 1 | 3.5% |
| Communications | 7 | 24.1% |
| Arts & Humanities | 1 | 3.5% |
| Total | 29 | 100.0% |
Transportation & Commute in Lake Tekakwitha
Vehicle Availability by Sex in Lake Tekakwitha
The most prevalent vehicle ownership categories in Lake Tekakwitha are males with 1 vehicle (35, accounting for 48.6%) and females with 1 vehicle (12, making up 39.3%).
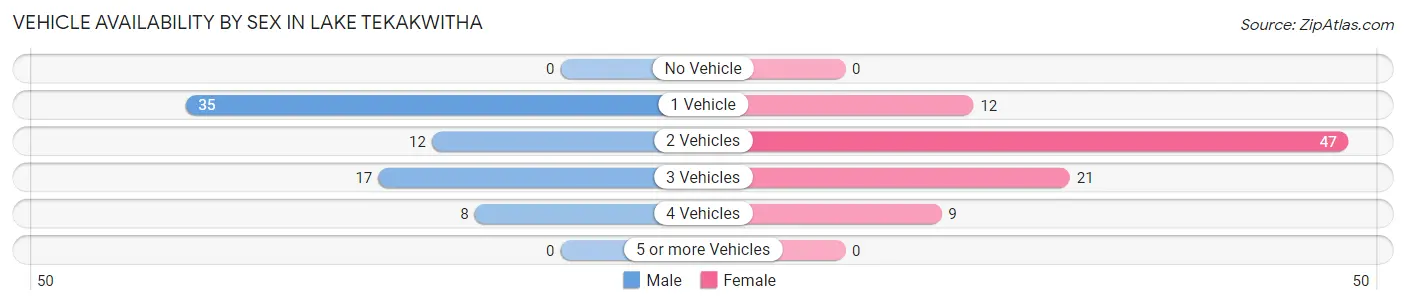
| Vehicles Available | Male | Female |
| No Vehicle | 0 (0.0%) | 0 (0.0%) |
| 1 Vehicle | 35 (48.6%) | 12 (13.5%) |
| 2 Vehicles | 12 (16.7%) | 47 (52.8%) |
| 3 Vehicles | 17 (23.6%) | 21 (23.6%) |
| 4 Vehicles | 8 (11.1%) | 9 (10.1%) |
| 5 or more Vehicles | 0 (0.0%) | 0 (0.0%) |
| Total | 72 (100.0%) | 89 (100.0%) |
Commute Time in Lake Tekakwitha
The most frequently occuring commute durations in Lake Tekakwitha are 10 to 14 minutes (36 commuters, 22.5%), 20 to 24 minutes (29 commuters, 18.1%), and 30 to 34 minutes (24 commuters, 15.0%).
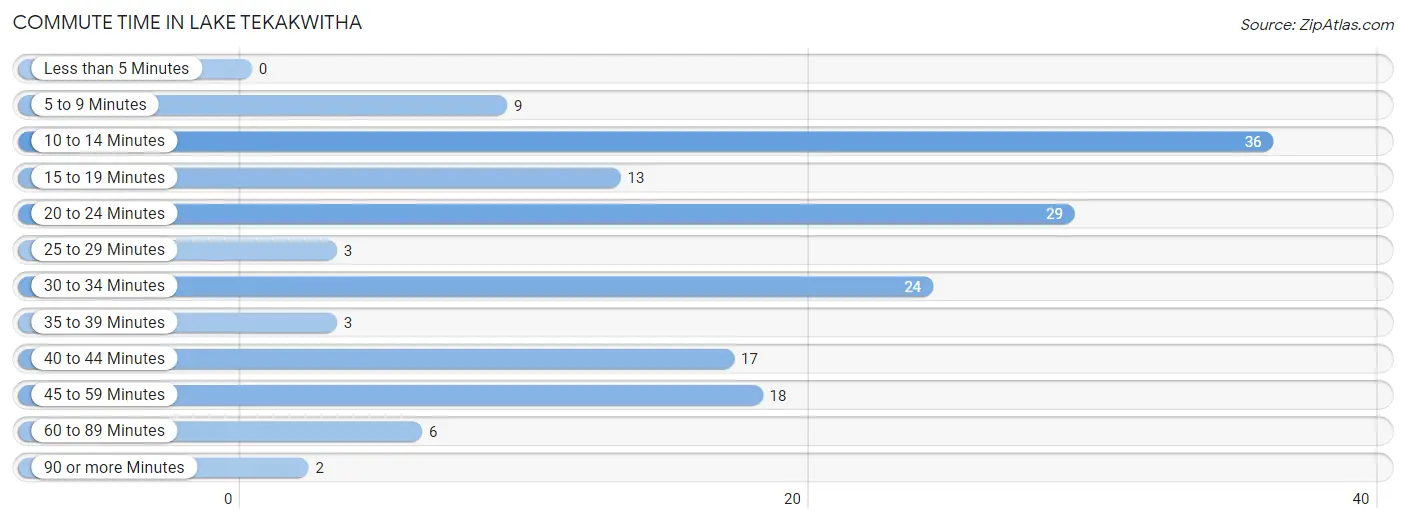
| Commute Time | # Commuters | % Commuters |
| Less than 5 Minutes | 0 | 0.0% |
| 5 to 9 Minutes | 9 | 5.6% |
| 10 to 14 Minutes | 36 | 22.5% |
| 15 to 19 Minutes | 13 | 8.1% |
| 20 to 24 Minutes | 29 | 18.1% |
| 25 to 29 Minutes | 3 | 1.9% |
| 30 to 34 Minutes | 24 | 15.0% |
| 35 to 39 Minutes | 3 | 1.9% |
| 40 to 44 Minutes | 17 | 10.6% |
| 45 to 59 Minutes | 18 | 11.3% |
| 60 to 89 Minutes | 6 | 3.7% |
| 90 or more Minutes | 2 | 1.3% |
Commute Time by Sex in Lake Tekakwitha
The most common commute times in Lake Tekakwitha are 10 to 14 minutes (15 commuters, 20.8%) for males and 20 to 24 minutes (26 commuters, 29.5%) for females.
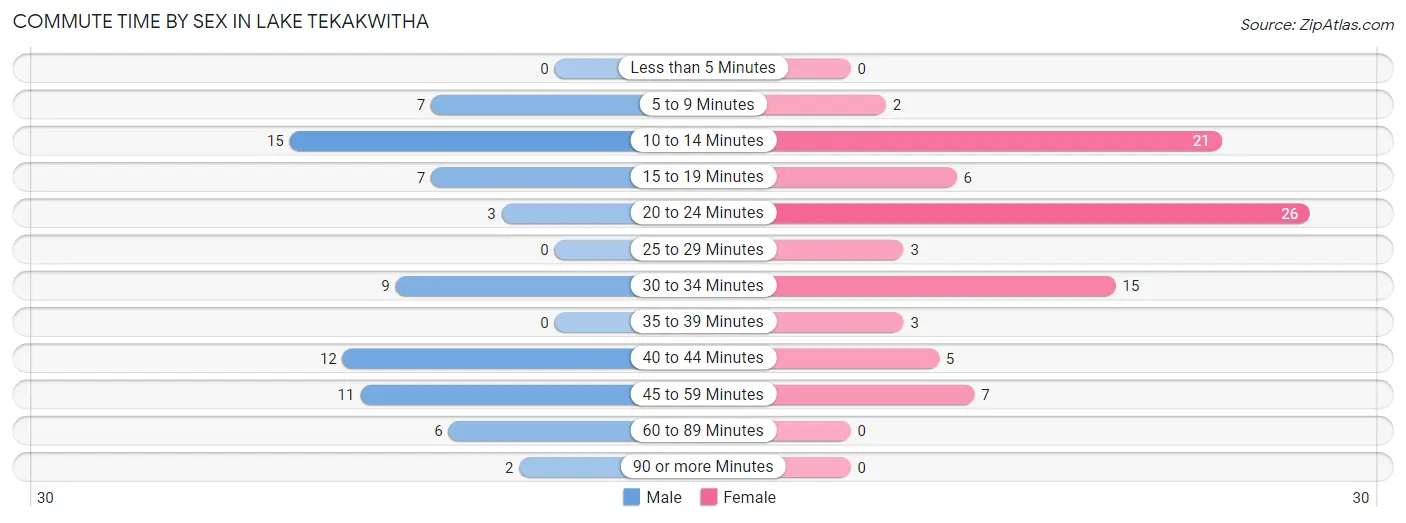
| Commute Time | Male | Female |
| Less than 5 Minutes | 0 (0.0%) | 0 (0.0%) |
| 5 to 9 Minutes | 7 (9.7%) | 2 (2.3%) |
| 10 to 14 Minutes | 15 (20.8%) | 21 (23.9%) |
| 15 to 19 Minutes | 7 (9.7%) | 6 (6.8%) |
| 20 to 24 Minutes | 3 (4.2%) | 26 (29.5%) |
| 25 to 29 Minutes | 0 (0.0%) | 3 (3.4%) |
| 30 to 34 Minutes | 9 (12.5%) | 15 (17.1%) |
| 35 to 39 Minutes | 0 (0.0%) | 3 (3.4%) |
| 40 to 44 Minutes | 12 (16.7%) | 5 (5.7%) |
| 45 to 59 Minutes | 11 (15.3%) | 7 (8.0%) |
| 60 to 89 Minutes | 6 (8.3%) | 0 (0.0%) |
| 90 or more Minutes | 2 (2.8%) | 0 (0.0%) |
Time of Departure to Work by Sex in Lake Tekakwitha
The most frequent times of departure to work in Lake Tekakwitha are 6:00 AM to 6:29 AM (14, 19.4%) for males and 5:30 AM to 5:59 AM (28, 31.8%) for females.
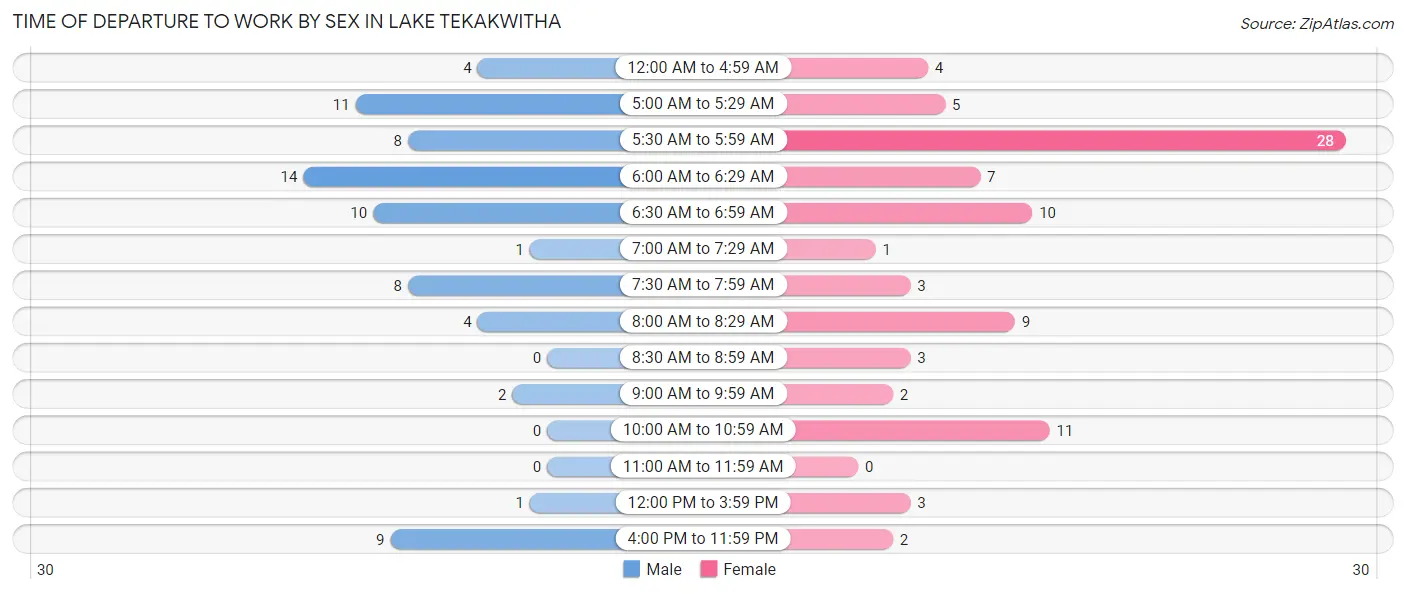
| Time of Departure | Male | Female |
| 12:00 AM to 4:59 AM | 4 (5.6%) | 4 (4.5%) |
| 5:00 AM to 5:29 AM | 11 (15.3%) | 5 (5.7%) |
| 5:30 AM to 5:59 AM | 8 (11.1%) | 28 (31.8%) |
| 6:00 AM to 6:29 AM | 14 (19.4%) | 7 (8.0%) |
| 6:30 AM to 6:59 AM | 10 (13.9%) | 10 (11.4%) |
| 7:00 AM to 7:29 AM | 1 (1.4%) | 1 (1.1%) |
| 7:30 AM to 7:59 AM | 8 (11.1%) | 3 (3.4%) |
| 8:00 AM to 8:29 AM | 4 (5.6%) | 9 (10.2%) |
| 8:30 AM to 8:59 AM | 0 (0.0%) | 3 (3.4%) |
| 9:00 AM to 9:59 AM | 2 (2.8%) | 2 (2.3%) |
| 10:00 AM to 10:59 AM | 0 (0.0%) | 11 (12.5%) |
| 11:00 AM to 11:59 AM | 0 (0.0%) | 0 (0.0%) |
| 12:00 PM to 3:59 PM | 1 (1.4%) | 3 (3.4%) |
| 4:00 PM to 11:59 PM | 9 (12.5%) | 2 (2.3%) |
| Total | 72 (100.0%) | 88 (100.0%) |
Housing Occupancy in Lake Tekakwitha
Occupancy by Ownership in Lake Tekakwitha
Of the total 124 dwellings in Lake Tekakwitha, owner-occupied units account for 117 (94.4%), while renter-occupied units make up 7 (5.7%).
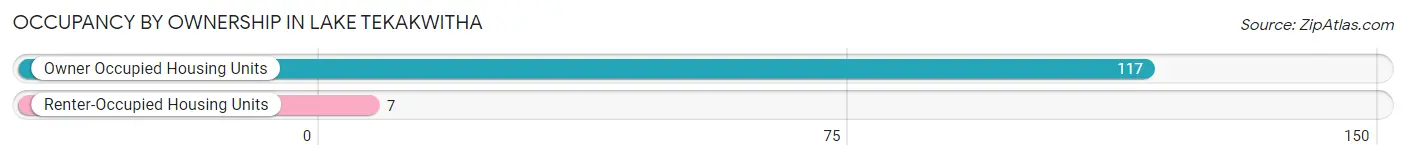
| Occupancy | # Housing Units | % Housing Units |
| Owner Occupied Housing Units | 117 | 94.4% |
| Renter-Occupied Housing Units | 7 | 5.7% |
| Total Occupied Housing Units | 124 | 100.0% |
Occupancy by Household Size in Lake Tekakwitha
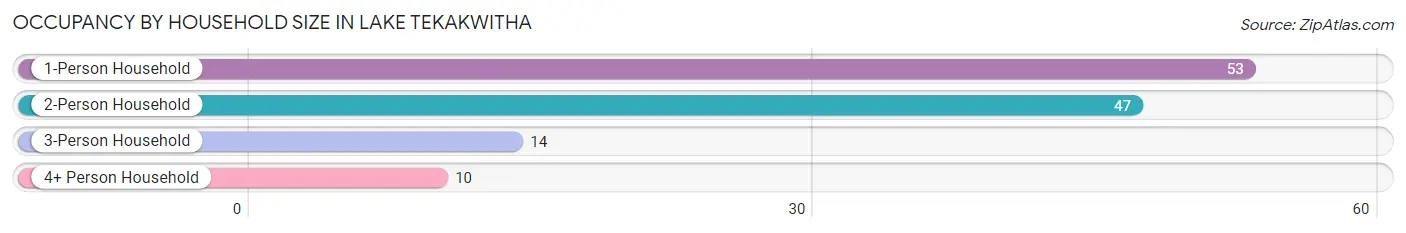
| Household Size | # Housing Units | % Housing Units |
| 1-Person Household | 53 | 42.7% |
| 2-Person Household | 47 | 37.9% |
| 3-Person Household | 14 | 11.3% |
| 4+ Person Household | 10 | 8.1% |
| Total Housing Units | 124 | 100.0% |
Occupancy by Ownership by Household Size in Lake Tekakwitha
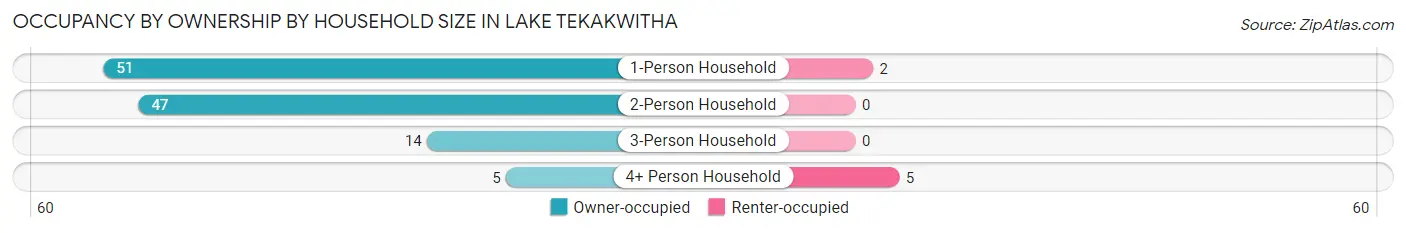
| Household Size | Owner-occupied | Renter-occupied |
| 1-Person Household | 51 (96.2%) | 2 (3.8%) |
| 2-Person Household | 47 (100.0%) | 0 (0.0%) |
| 3-Person Household | 14 (100.0%) | 0 (0.0%) |
| 4+ Person Household | 5 (50.0%) | 5 (50.0%) |
| Total Housing Units | 117 (94.4%) | 7 (5.7%) |
Occupancy by Educational Attainment in Lake Tekakwitha
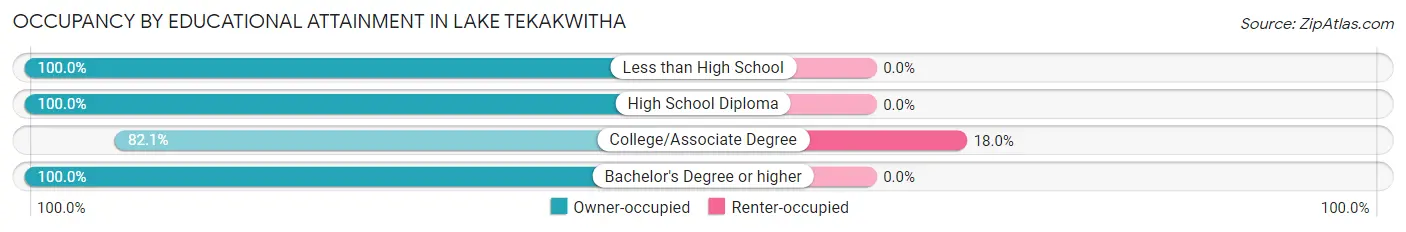
| Household Size | Owner-occupied | Renter-occupied |
| Less than High School | 6 (100.0%) | 0 (0.0%) |
| High School Diploma | 58 (100.0%) | 0 (0.0%) |
| College/Associate Degree | 32 (82.1%) | 7 (17.9%) |
| Bachelor's Degree or higher | 21 (100.0%) | 0 (0.0%) |
Occupancy by Age of Householder in Lake Tekakwitha
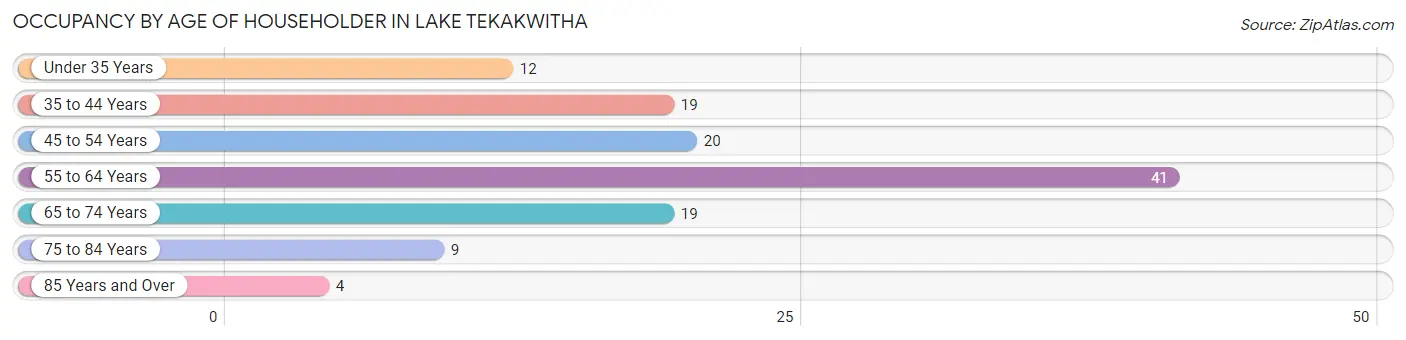
| Age Bracket | # Households | % Households |
| Under 35 Years | 12 | 9.7% |
| 35 to 44 Years | 19 | 15.3% |
| 45 to 54 Years | 20 | 16.1% |
| 55 to 64 Years | 41 | 33.1% |
| 65 to 74 Years | 19 | 15.3% |
| 75 to 84 Years | 9 | 7.3% |
| 85 Years and Over | 4 | 3.2% |
| Total | 124 | 100.0% |
Housing Finances in Lake Tekakwitha
Median Income by Occupancy in Lake Tekakwitha
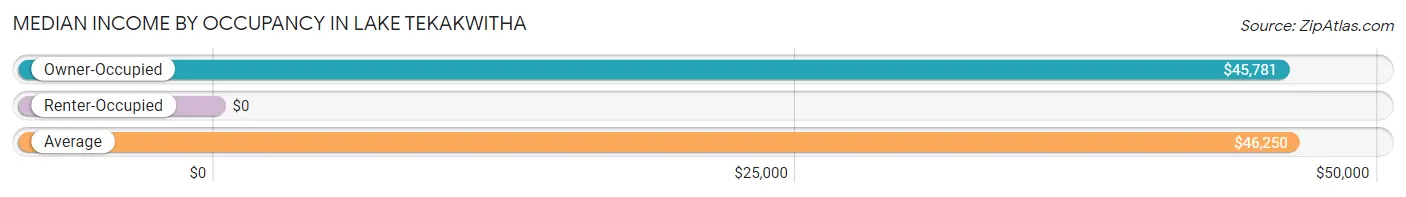
| Occupancy Type | # Households | Median Income |
| Owner-Occupied | 117 (94.4%) | $45,781 |
| Renter-Occupied | 7 (5.7%) | $0 |
| Average | 124 (100.0%) | $46,250 |
Occupancy by Householder Income Bracket in Lake Tekakwitha
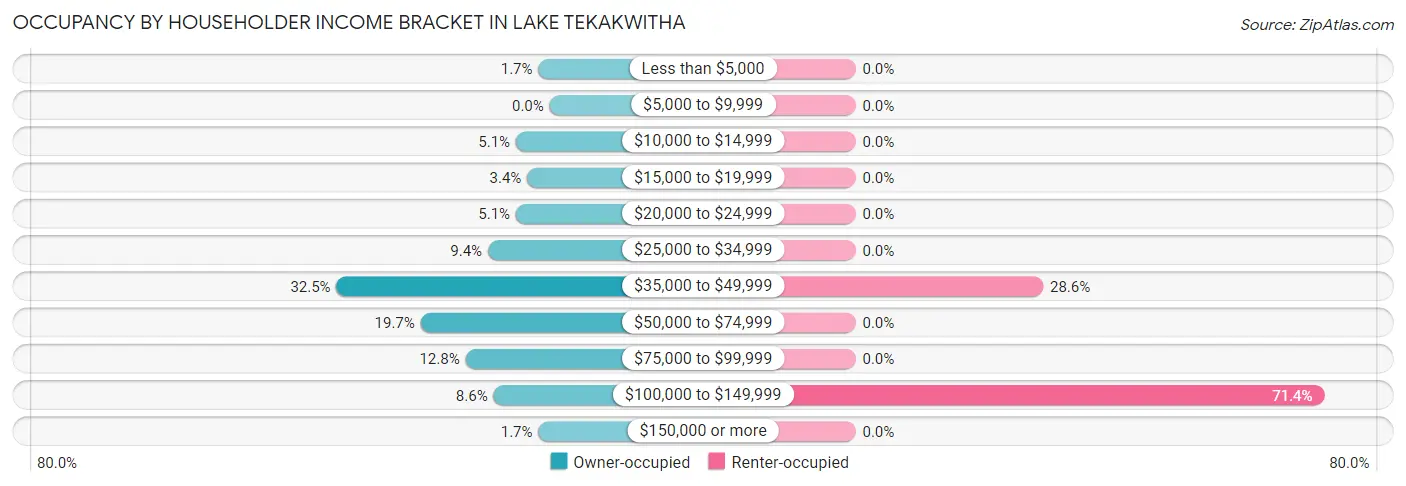
| Income Bracket | Owner-occupied | Renter-occupied |
| Less than $5,000 | 2 (1.7%) | 0 (0.0%) |
| $5,000 to $9,999 | 0 (0.0%) | 0 (0.0%) |
| $10,000 to $14,999 | 6 (5.1%) | 0 (0.0%) |
| $15,000 to $19,999 | 4 (3.4%) | 0 (0.0%) |
| $20,000 to $24,999 | 6 (5.1%) | 0 (0.0%) |
| $25,000 to $34,999 | 11 (9.4%) | 0 (0.0%) |
| $35,000 to $49,999 | 38 (32.5%) | 2 (28.6%) |
| $50,000 to $74,999 | 23 (19.7%) | 0 (0.0%) |
| $75,000 to $99,999 | 15 (12.8%) | 0 (0.0%) |
| $100,000 to $149,999 | 10 (8.6%) | 5 (71.4%) |
| $150,000 or more | 2 (1.7%) | 0 (0.0%) |
| Total | 117 (100.0%) | 7 (100.0%) |
Monthly Housing Cost Tiers in Lake Tekakwitha
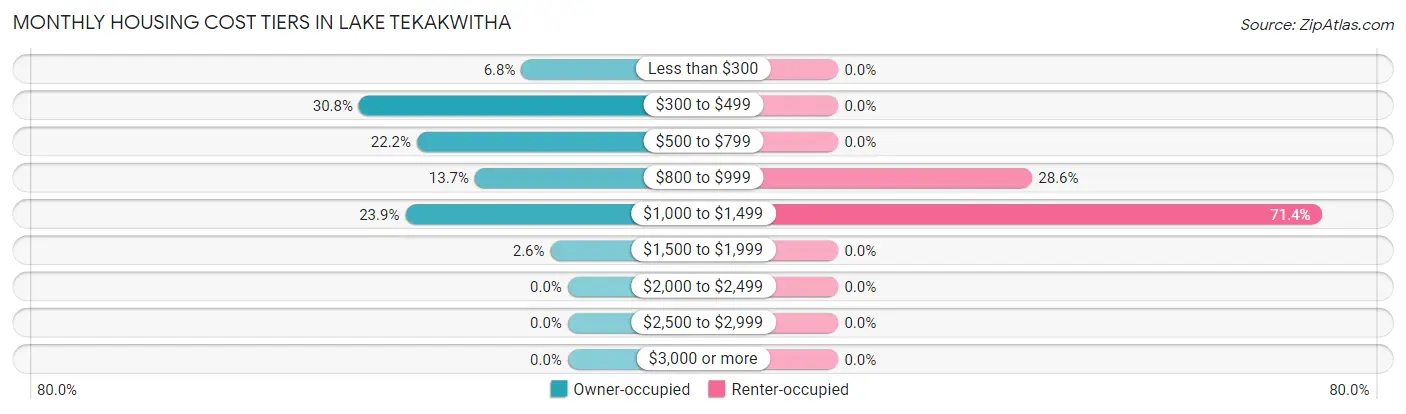
| Monthly Cost | Owner-occupied | Renter-occupied |
| Less than $300 | 8 (6.8%) | 0 (0.0%) |
| $300 to $499 | 36 (30.8%) | 0 (0.0%) |
| $500 to $799 | 26 (22.2%) | 0 (0.0%) |
| $800 to $999 | 16 (13.7%) | 2 (28.6%) |
| $1,000 to $1,499 | 28 (23.9%) | 5 (71.4%) |
| $1,500 to $1,999 | 3 (2.6%) | 0 (0.0%) |
| $2,000 to $2,499 | 0 (0.0%) | 0 (0.0%) |
| $2,500 to $2,999 | 0 (0.0%) | 0 (0.0%) |
| $3,000 or more | 0 (0.0%) | 0 (0.0%) |
| Total | 117 (100.0%) | 7 (100.0%) |
Physical Housing Characteristics in Lake Tekakwitha
Housing Structures in Lake Tekakwitha
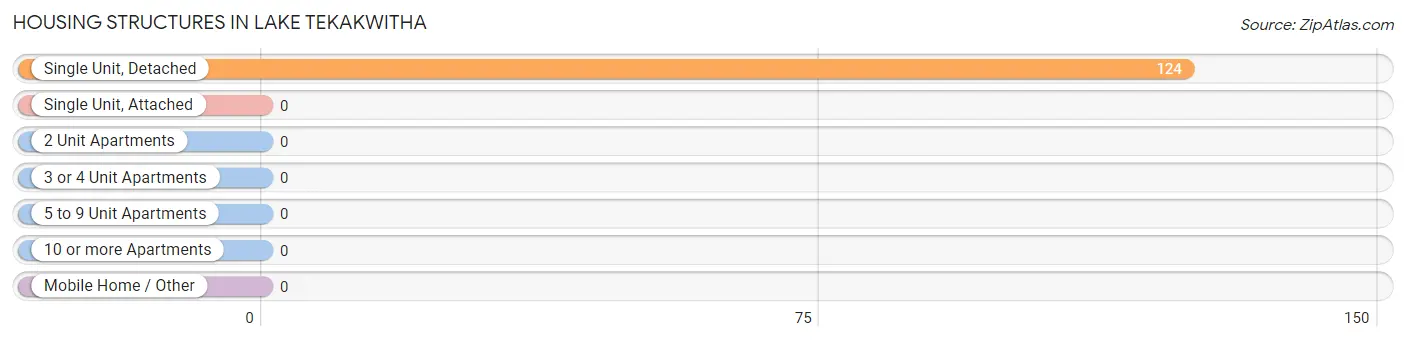
| Structure Type | # Housing Units | % Housing Units |
| Single Unit, Detached | 124 | 100.0% |
| Single Unit, Attached | 0 | 0.0% |
| 2 Unit Apartments | 0 | 0.0% |
| 3 or 4 Unit Apartments | 0 | 0.0% |
| 5 to 9 Unit Apartments | 0 | 0.0% |
| 10 or more Apartments | 0 | 0.0% |
| Mobile Home / Other | 0 | 0.0% |
| Total | 124 | 100.0% |
Housing Structures by Occupancy in Lake Tekakwitha
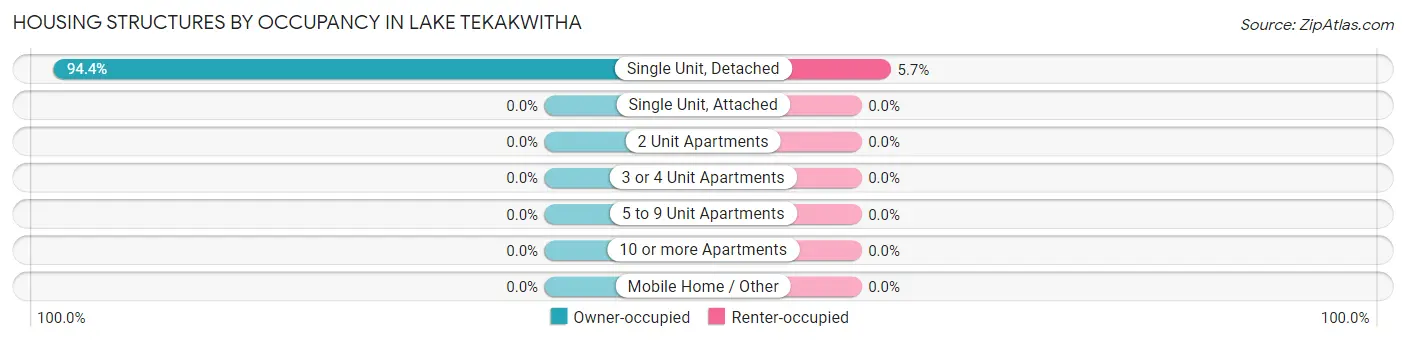
| Structure Type | Owner-occupied | Renter-occupied |
| Single Unit, Detached | 117 (94.4%) | 7 (5.7%) |
| Single Unit, Attached | 0 (0.0%) | 0 (0.0%) |
| 2 Unit Apartments | 0 (0.0%) | 0 (0.0%) |
| 3 or 4 Unit Apartments | 0 (0.0%) | 0 (0.0%) |
| 5 to 9 Unit Apartments | 0 (0.0%) | 0 (0.0%) |
| 10 or more Apartments | 0 (0.0%) | 0 (0.0%) |
| Mobile Home / Other | 0 (0.0%) | 0 (0.0%) |
| Total | 117 (94.4%) | 7 (5.7%) |
Housing Structures by Number of Rooms in Lake Tekakwitha
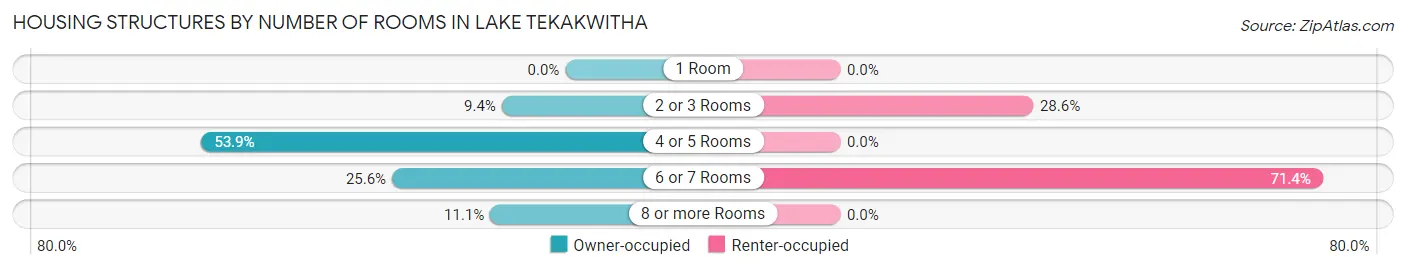
| Number of Rooms | Owner-occupied | Renter-occupied |
| 1 Room | 0 (0.0%) | 0 (0.0%) |
| 2 or 3 Rooms | 11 (9.4%) | 2 (28.6%) |
| 4 or 5 Rooms | 63 (53.8%) | 0 (0.0%) |
| 6 or 7 Rooms | 30 (25.6%) | 5 (71.4%) |
| 8 or more Rooms | 13 (11.1%) | 0 (0.0%) |
| Total | 117 (100.0%) | 7 (100.0%) |
Housing Structure by Heating Type in Lake Tekakwitha
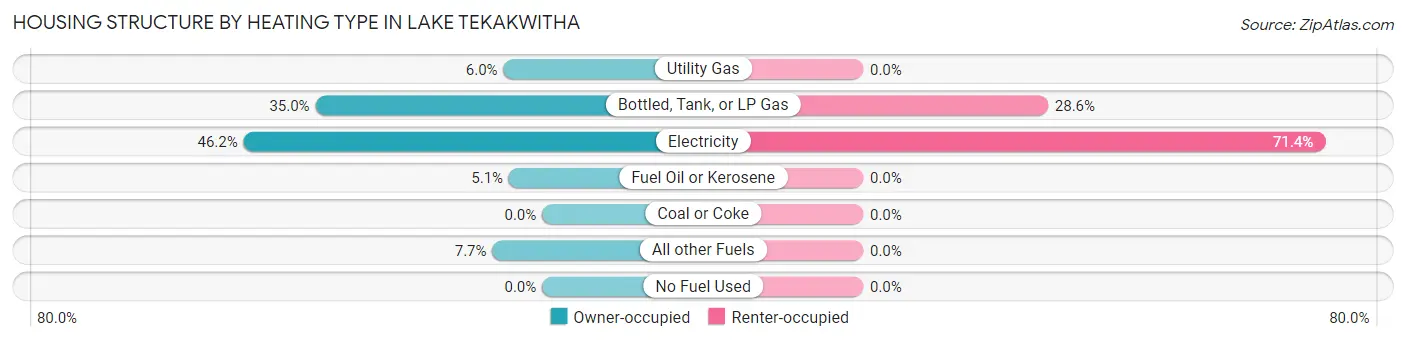
| Heating Type | Owner-occupied | Renter-occupied |
| Utility Gas | 7 (6.0%) | 0 (0.0%) |
| Bottled, Tank, or LP Gas | 41 (35.0%) | 2 (28.6%) |
| Electricity | 54 (46.2%) | 5 (71.4%) |
| Fuel Oil or Kerosene | 6 (5.1%) | 0 (0.0%) |
| Coal or Coke | 0 (0.0%) | 0 (0.0%) |
| All other Fuels | 9 (7.7%) | 0 (0.0%) |
| No Fuel Used | 0 (0.0%) | 0 (0.0%) |
| Total | 117 (100.0%) | 7 (100.0%) |
Household Vehicle Usage in Lake Tekakwitha
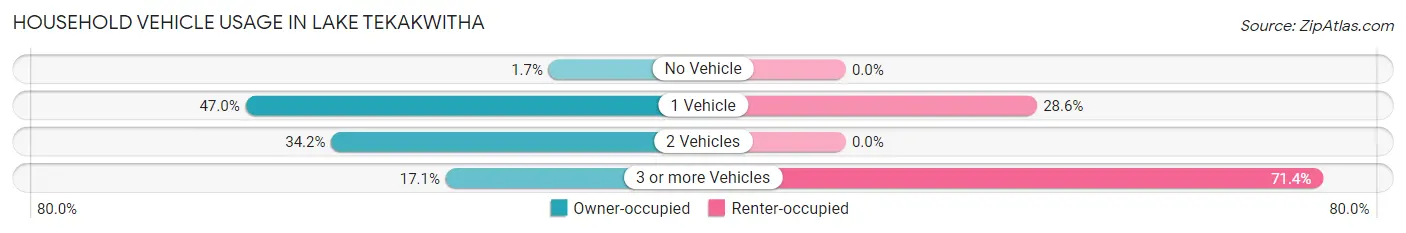
| Vehicles per Household | Owner-occupied | Renter-occupied |
| No Vehicle | 2 (1.7%) | 0 (0.0%) |
| 1 Vehicle | 55 (47.0%) | 2 (28.6%) |
| 2 Vehicles | 40 (34.2%) | 0 (0.0%) |
| 3 or more Vehicles | 20 (17.1%) | 5 (71.4%) |
| Total | 117 (100.0%) | 7 (100.0%) |
Real Estate & Mortgages in Lake Tekakwitha
Real Estate and Mortgage Overview in Lake Tekakwitha
| Characteristic | Without Mortgage | With Mortgage |
| Housing Units | 42 | 75 |
| Median Property Value | $105,400 | $98,300 |
| Median Household Income | $48,333 | $2 |
| Monthly Housing Costs | $405 | $0 |
| Real Estate Taxes | $917 | $2 |
Property Value by Mortgage Status in Lake Tekakwitha
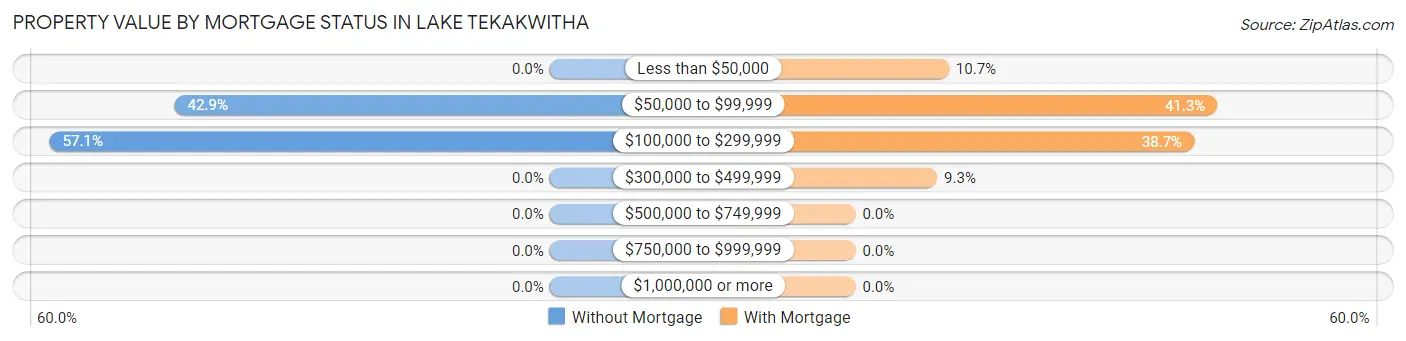
| Property Value | Without Mortgage | With Mortgage |
| Less than $50,000 | 0 (0.0%) | 8 (10.7%) |
| $50,000 to $99,999 | 18 (42.9%) | 31 (41.3%) |
| $100,000 to $299,999 | 24 (57.1%) | 29 (38.7%) |
| $300,000 to $499,999 | 0 (0.0%) | 7 (9.3%) |
| $500,000 to $749,999 | 0 (0.0%) | 0 (0.0%) |
| $750,000 to $999,999 | 0 (0.0%) | 0 (0.0%) |
| $1,000,000 or more | 0 (0.0%) | 0 (0.0%) |
| Total | 42 (100.0%) | 75 (100.0%) |
Household Income by Mortgage Status in Lake Tekakwitha
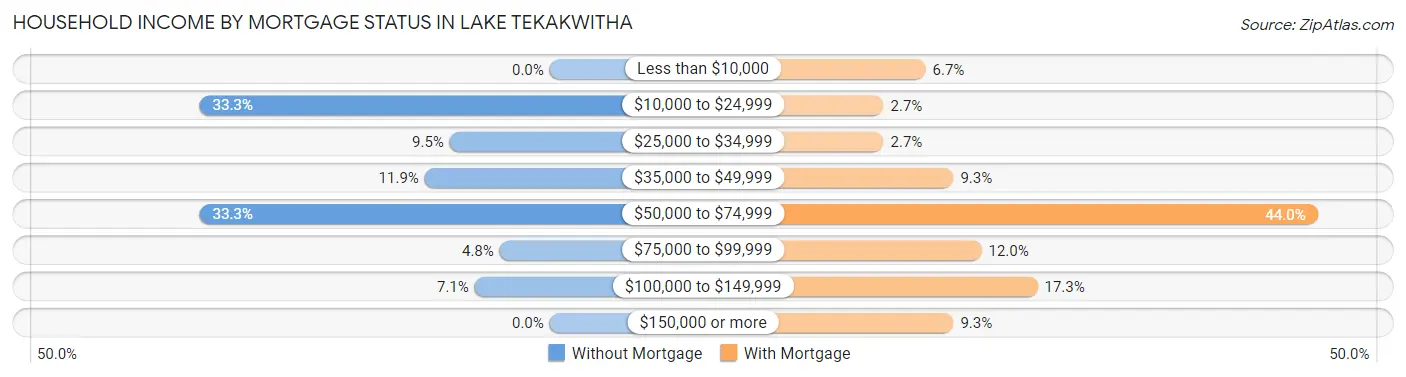
| Household Income | Without Mortgage | With Mortgage |
| Less than $10,000 | 0 (0.0%) | 5 (6.7%) |
| $10,000 to $24,999 | 14 (33.3%) | 2 (2.7%) |
| $25,000 to $34,999 | 4 (9.5%) | 2 (2.7%) |
| $35,000 to $49,999 | 5 (11.9%) | 7 (9.3%) |
| $50,000 to $74,999 | 14 (33.3%) | 33 (44.0%) |
| $75,000 to $99,999 | 2 (4.8%) | 9 (12.0%) |
| $100,000 to $149,999 | 3 (7.1%) | 13 (17.3%) |
| $150,000 or more | 0 (0.0%) | 7 (9.3%) |
| Total | 42 (100.0%) | 75 (100.0%) |
Property Value to Household Income Ratio in Lake Tekakwitha
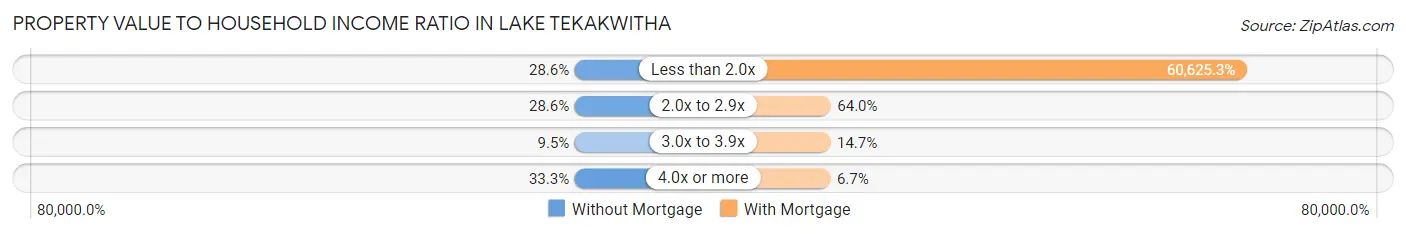
| Value-to-Income Ratio | Without Mortgage | With Mortgage |
| Less than 2.0x | 12 (28.6%) | 45,469 (60,625.3%) |
| 2.0x to 2.9x | 12 (28.6%) | 48 (64.0%) |
| 3.0x to 3.9x | 4 (9.5%) | 11 (14.7%) |
| 4.0x or more | 14 (33.3%) | 5 (6.7%) |
| Total | 42 (100.0%) | 75 (100.0%) |
Real Estate Taxes by Mortgage Status in Lake Tekakwitha
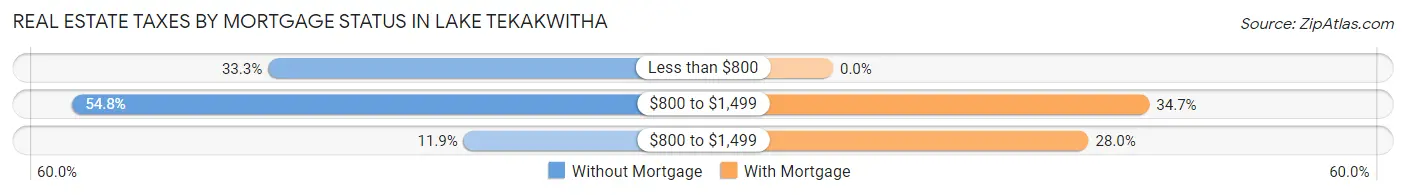
| Property Taxes | Without Mortgage | With Mortgage |
| Less than $800 | 14 (33.3%) | 0 (0.0%) |
| $800 to $1,499 | 23 (54.8%) | 26 (34.7%) |
| $800 to $1,499 | 5 (11.9%) | 21 (28.0%) |
| Total | 42 (100.0%) | 75 (100.0%) |
Health & Disability in Lake Tekakwitha
Health Insurance Coverage by Age in Lake Tekakwitha
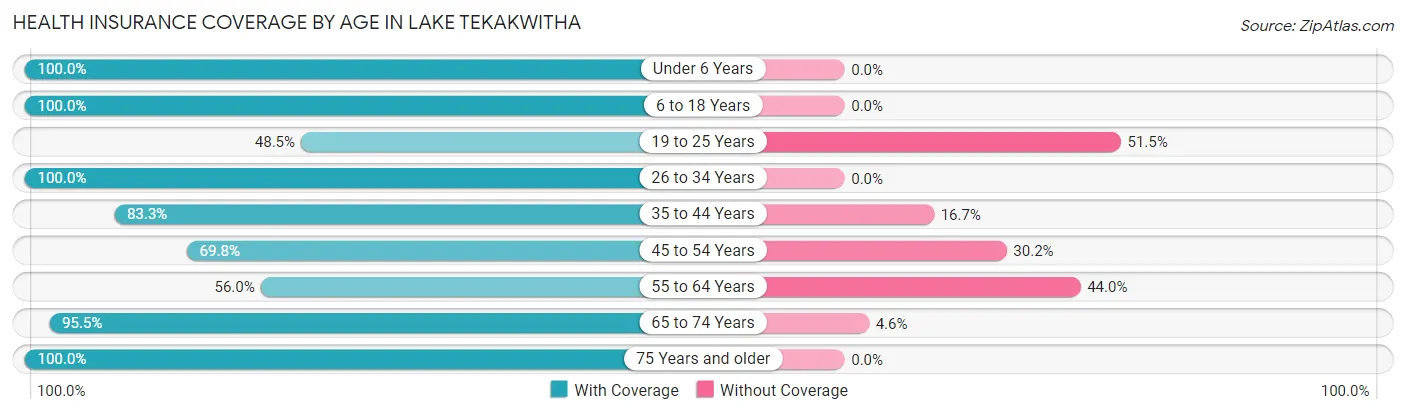
| Age Bracket | With Coverage | Without Coverage |
| Under 6 Years | 4 (100.0%) | 0 (0.0%) |
| 6 to 18 Years | 24 (100.0%) | 0 (0.0%) |
| 19 to 25 Years | 16 (48.5%) | 17 (51.5%) |
| 26 to 34 Years | 28 (100.0%) | 0 (0.0%) |
| 35 to 44 Years | 25 (83.3%) | 5 (16.7%) |
| 45 to 54 Years | 30 (69.8%) | 13 (30.2%) |
| 55 to 64 Years | 28 (56.0%) | 22 (44.0%) |
| 65 to 74 Years | 21 (95.5%) | 1 (4.5%) |
| 75 Years and older | 18 (100.0%) | 0 (0.0%) |
| Total | 194 (77.0%) | 58 (23.0%) |
Health Insurance Coverage by Citizenship Status in Lake Tekakwitha
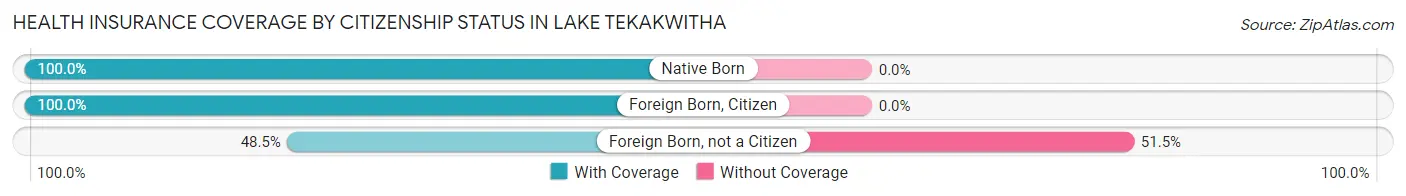
| Citizenship Status | With Coverage | Without Coverage |
| Native Born | 4 (100.0%) | 0 (0.0%) |
| Foreign Born, Citizen | 24 (100.0%) | 0 (0.0%) |
| Foreign Born, not a Citizen | 16 (48.5%) | 17 (51.5%) |
Health Insurance Coverage by Household Income in Lake Tekakwitha
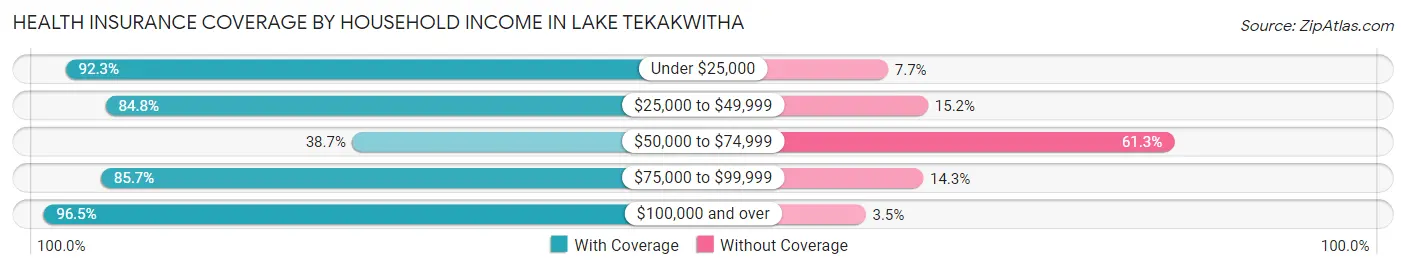
| Household Income | With Coverage | Without Coverage |
| Under $25,000 | 24 (92.3%) | 2 (7.7%) |
| $25,000 to $49,999 | 67 (84.8%) | 12 (15.2%) |
| $50,000 to $74,999 | 24 (38.7%) | 38 (61.3%) |
| $75,000 to $99,999 | 24 (85.7%) | 4 (14.3%) |
| $100,000 and over | 55 (96.5%) | 2 (3.5%) |
Public vs Private Health Insurance Coverage by Age in Lake Tekakwitha
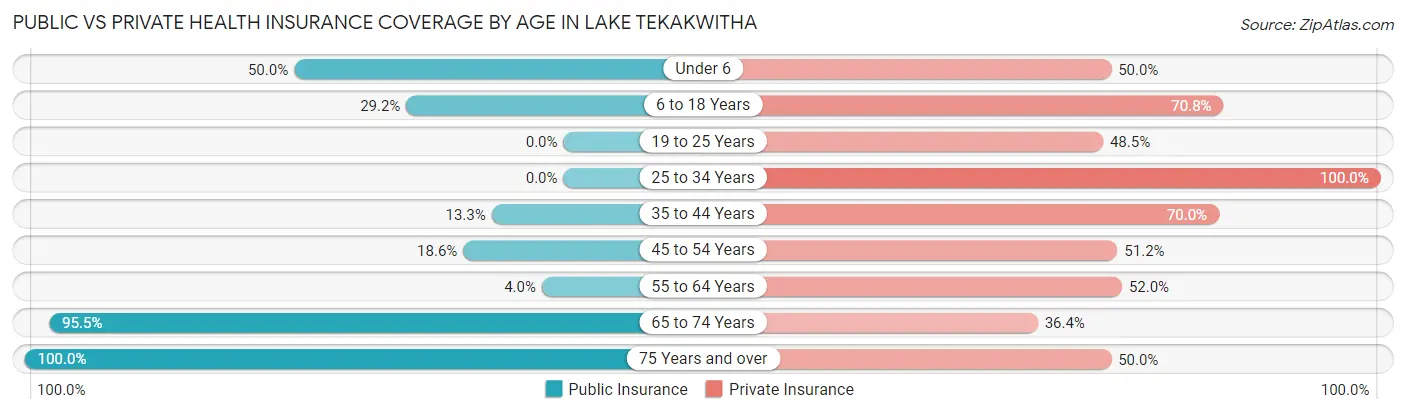
| Age Bracket | Public Insurance | Private Insurance |
| Under 6 | 2 (50.0%) | 2 (50.0%) |
| 6 to 18 Years | 7 (29.2%) | 17 (70.8%) |
| 19 to 25 Years | 0 (0.0%) | 16 (48.5%) |
| 25 to 34 Years | 0 (0.0%) | 28 (100.0%) |
| 35 to 44 Years | 4 (13.3%) | 21 (70.0%) |
| 45 to 54 Years | 8 (18.6%) | 22 (51.2%) |
| 55 to 64 Years | 2 (4.0%) | 26 (52.0%) |
| 65 to 74 Years | 21 (95.5%) | 8 (36.4%) |
| 75 Years and over | 18 (100.0%) | 9 (50.0%) |
| Total | 62 (24.6%) | 149 (59.1%) |
Disability Status by Sex by Age in Lake Tekakwitha
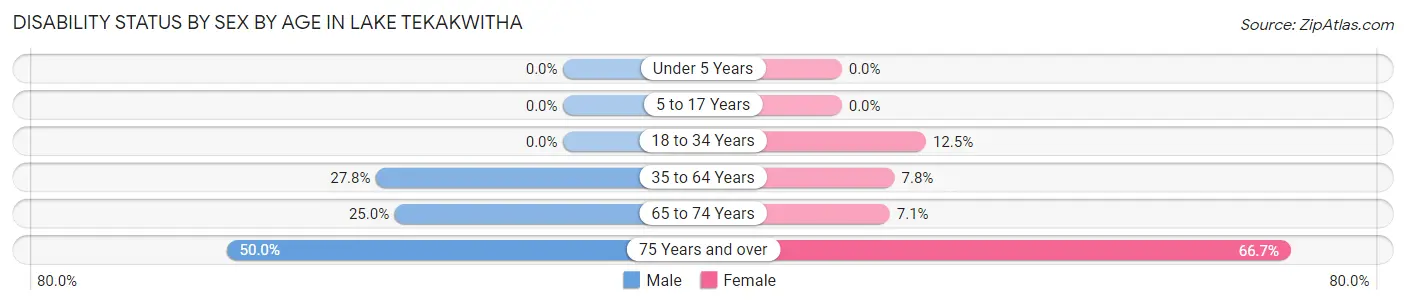
| Age Bracket | Male | Female |
| Under 5 Years | 0 (0.0%) | 0 (0.0%) |
| 5 to 17 Years | 0 (0.0%) | 0 (0.0%) |
| 18 to 34 Years | 0 (0.0%) | 5 (12.5%) |
| 35 to 64 Years | 20 (27.8%) | 4 (7.8%) |
| 65 to 74 Years | 2 (25.0%) | 1 (7.1%) |
| 75 Years and over | 6 (50.0%) | 4 (66.7%) |
Disability Class by Sex by Age in Lake Tekakwitha
Disability Class: Hearing Difficulty
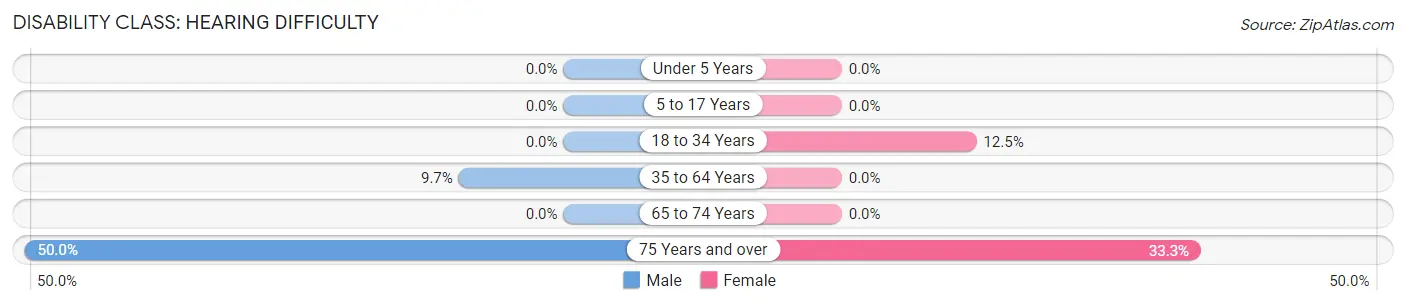
| Age Bracket | Male | Female |
| Under 5 Years | 0 (0.0%) | 0 (0.0%) |
| 5 to 17 Years | 0 (0.0%) | 0 (0.0%) |
| 18 to 34 Years | 0 (0.0%) | 5 (12.5%) |
| 35 to 64 Years | 7 (9.7%) | 0 (0.0%) |
| 65 to 74 Years | 0 (0.0%) | 0 (0.0%) |
| 75 Years and over | 6 (50.0%) | 2 (33.3%) |
Disability Class: Vision Difficulty
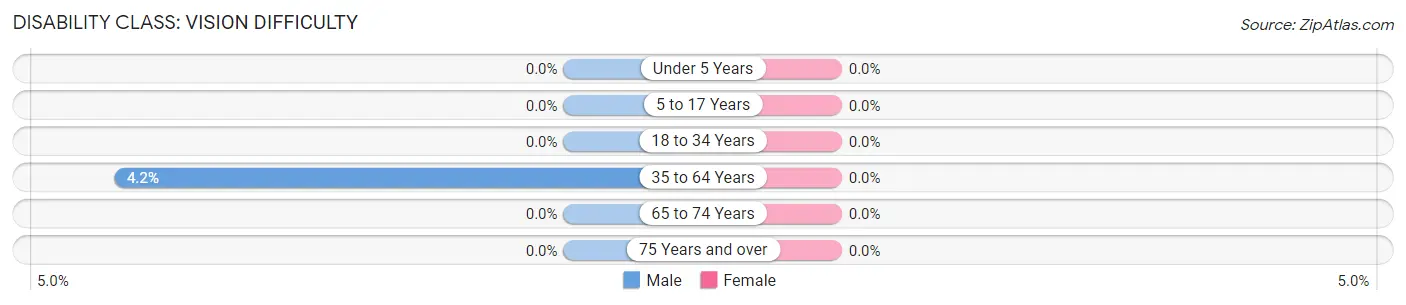
| Age Bracket | Male | Female |
| Under 5 Years | 0 (0.0%) | 0 (0.0%) |
| 5 to 17 Years | 0 (0.0%) | 0 (0.0%) |
| 18 to 34 Years | 0 (0.0%) | 0 (0.0%) |
| 35 to 64 Years | 3 (4.2%) | 0 (0.0%) |
| 65 to 74 Years | 0 (0.0%) | 0 (0.0%) |
| 75 Years and over | 0 (0.0%) | 0 (0.0%) |
Disability Class: Cognitive Difficulty
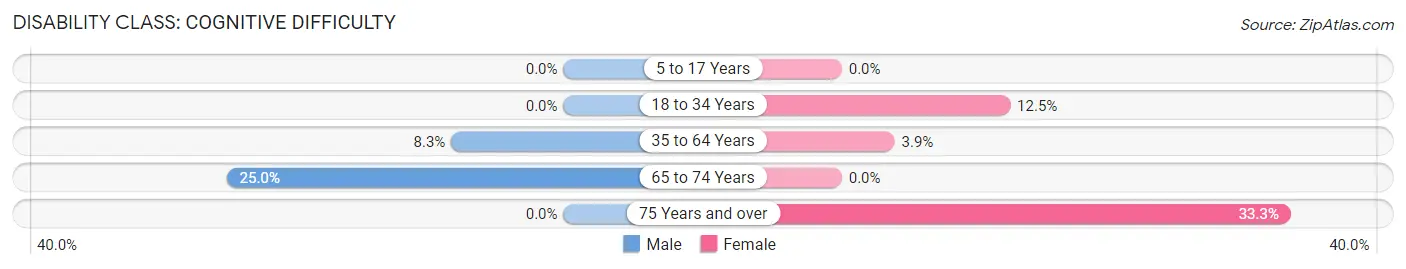
| Age Bracket | Male | Female |
| 5 to 17 Years | 0 (0.0%) | 0 (0.0%) |
| 18 to 34 Years | 0 (0.0%) | 5 (12.5%) |
| 35 to 64 Years | 6 (8.3%) | 2 (3.9%) |
| 65 to 74 Years | 2 (25.0%) | 0 (0.0%) |
| 75 Years and over | 0 (0.0%) | 2 (33.3%) |
Disability Class: Ambulatory Difficulty
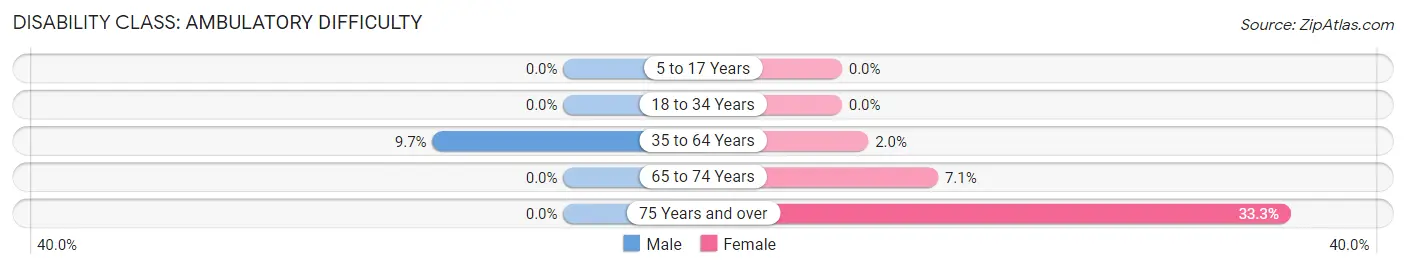
| Age Bracket | Male | Female |
| 5 to 17 Years | 0 (0.0%) | 0 (0.0%) |
| 18 to 34 Years | 0 (0.0%) | 0 (0.0%) |
| 35 to 64 Years | 7 (9.7%) | 1 (2.0%) |
| 65 to 74 Years | 0 (0.0%) | 1 (7.1%) |
| 75 Years and over | 0 (0.0%) | 2 (33.3%) |
Disability Class: Self-Care Difficulty
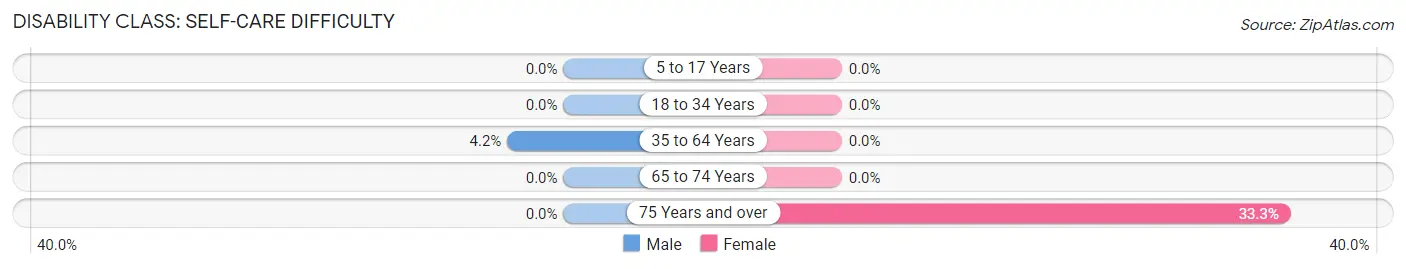
| Age Bracket | Male | Female |
| 5 to 17 Years | 0 (0.0%) | 0 (0.0%) |
| 18 to 34 Years | 0 (0.0%) | 0 (0.0%) |
| 35 to 64 Years | 3 (4.2%) | 0 (0.0%) |
| 65 to 74 Years | 0 (0.0%) | 0 (0.0%) |
| 75 Years and over | 0 (0.0%) | 2 (33.3%) |
Technology Access in Lake Tekakwitha
Computing Device Access in Lake Tekakwitha
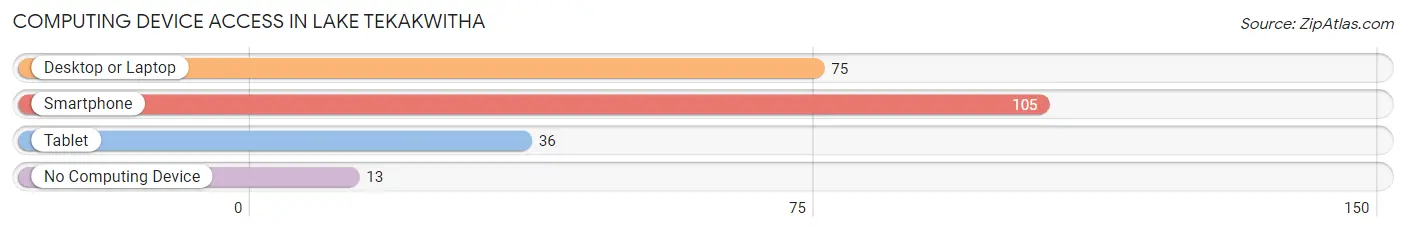
| Device Type | # Households | % Households |
| Desktop or Laptop | 75 | 60.5% |
| Smartphone | 105 | 84.7% |
| Tablet | 36 | 29.0% |
| No Computing Device | 13 | 10.5% |
| Total | 124 | 100.0% |
Internet Access in Lake Tekakwitha
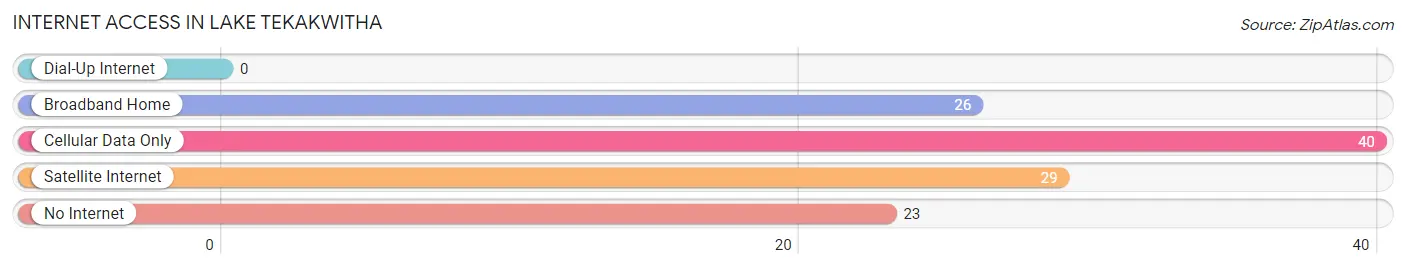
| Internet Type | # Households | % Households |
| Dial-Up Internet | 0 | 0.0% |
| Broadband Home | 26 | 21.0% |
| Cellular Data Only | 40 | 32.3% |
| Satellite Internet | 29 | 23.4% |
| No Internet | 23 | 18.5% |
| Total | 124 | 100.0% |
Lake Tekakwitha Summary
History
Lake Tekakwitha is a small unincorporated community located in the Ozark Mountains of Missouri. It is situated in the southeastern corner of the state, near the Arkansas border. The community was founded in the late 1800s by settlers who were drawn to the area by its natural beauty and abundant resources. The area was originally inhabited by the Osage Indians, who had lived in the area for centuries before the arrival of the settlers.
The first settlers to the area were mostly farmers and loggers, who were attracted to the area for its rich soil and abundant timber. The area was also known for its abundant wildlife, including deer, turkey, and other game. The settlers quickly established a small community, which was centered around a general store and post office. The community was named after the nearby lake, which was named after the Osage chief, Tekakwitha.
The community grew slowly over the years, and by the early 1900s, it had become a popular destination for tourists and outdoor enthusiasts. The area was known for its beautiful scenery, and the lake was a popular spot for fishing and swimming. The community also had a few small businesses, including a sawmill, a gristmill, and a blacksmith shop.
In the late 1940s, the area was chosen as the site of a new dam, which was built to create a reservoir for the nearby city of Springfield. The dam was completed in 1952, and the resulting lake was named Lake Tekakwitha. The lake quickly became a popular destination for fishing, swimming, and boating.
Geography
Lake Tekakwitha is located in the Ozark Mountains of Missouri, near the Arkansas border. The area is characterized by rolling hills, dense forests, and numerous streams and rivers. The lake itself is located in a valley, surrounded by steep hills and bluffs. The lake is fed by several small creeks and streams, and is home to a variety of fish, including bass, catfish, and crappie.
The area is also home to a variety of wildlife, including deer, turkey, and other game. The area is known for its abundant wildflowers, and is a popular destination for hikers and nature lovers.
Economy
The economy of Lake Tekakwitha is largely based on tourism and outdoor recreation. The lake is a popular destination for fishing, swimming, and boating, and the surrounding area is known for its beautiful scenery and abundant wildlife. The area is also home to several small businesses, including a sawmill, a gristmill, and a blacksmith shop.
The area is also home to several small farms, which produce a variety of crops, including corn, soybeans, and hay. The area is also known for its production of honey, which is sold locally and throughout the region.
Demographics
As of the 2010 census, the population of Lake Tekakwitha was 1,072. The population is largely white (94.3%), with a small minority population (5.7%). The median age of the population is 44.7 years, and the median household income is $37,917. The area is largely rural, with most of the population living in small towns and villages. The area is served by several small schools, and the nearest hospital is located in the nearby town of Springfield.
Common Questions
What is Per Capita Income in Lake Tekakwitha?
Per Capita income in Lake Tekakwitha is $29,587.
What is the Median Family Income in Lake Tekakwitha?
Median Family Income in Lake Tekakwitha is $51,806.
What is the Median Household income in Lake Tekakwitha?
Median Household Income in Lake Tekakwitha is $46,250.
What is Income or Wage Gap in Lake Tekakwitha?
Income or Wage Gap in Lake Tekakwitha is 40.8%.
Women in Lake Tekakwitha earn 59.2 cents for every dollar earned by a man.
What is Inequality or Gini Index in Lake Tekakwitha?
Inequality or Gini Index in Lake Tekakwitha is 0.33.
What is the Total Population of Lake Tekakwitha?
Total Population of Lake Tekakwitha is 252.
What is the Total Male Population of Lake Tekakwitha?
Total Male Population of Lake Tekakwitha is 132.
What is the Total Female Population of Lake Tekakwitha?
Total Female Population of Lake Tekakwitha is 120.
What is the Ratio of Males per 100 Females in Lake Tekakwitha?
There are 110.00 Males per 100 Females in Lake Tekakwitha.
What is the Ratio of Females per 100 Males in Lake Tekakwitha?
There are 90.91 Females per 100 Males in Lake Tekakwitha.
What is the Median Population Age in Lake Tekakwitha?
Median Population Age in Lake Tekakwitha is 49.3 Years.
What is the Average Family Size in Lake Tekakwitha
Average Family Size in Lake Tekakwitha is 2.8 People.
What is the Average Household Size in Lake Tekakwitha
Average Household Size in Lake Tekakwitha is 2.0 People.
How Large is the Labor Force in Lake Tekakwitha?
There are 171 People in the Labor Forcein in Lake Tekakwitha.
What is the Percentage of People in the Labor Force in Lake Tekakwitha?
73.4% of People are in the Labor Force in Lake Tekakwitha.
What is the Unemployment Rate in Lake Tekakwitha?
Unemployment Rate in Lake Tekakwitha is 5.8%.