Myrtle, MN Map & Demographics
Myrtle Map
Myrtle Overview
$17,898
PER CAPITA INCOME
$56,250
AVG FAMILY INCOME
$42,500
AVG HOUSEHOLD INCOME
29.1%
WAGE / INCOME GAP [ % ]
70.9¢/ $1
WAGE / INCOME GAP [ $ ]
0.27
INEQUALITY / GINI INDEX
54
TOTAL POPULATION
30
MALE POPULATION
24
FEMALE POPULATION
125.00
MALES / 100 FEMALES
80.00
FEMALES / 100 MALES
40.0
MEDIAN AGE
3.6
AVG FAMILY SIZE
3.4
AVG HOUSEHOLD SIZE
13
LABOR FORCE [ PEOPLE ]
28.3%
PERCENT IN LABOR FORCE
Myrtle Area Codes
Income in Myrtle
Income Overview in Myrtle
Per Capita Income in Myrtle is $17,898, while median incomes of families and households are $56,250 and $42,500 respectively.
| Characteristic | Number | Measure |
| Per Capita Income | 54 | $17,898 |
| Median Family Income | 14 | $56,250 |
| Mean Family Income | 14 | $58,757 |
| Median Household Income | 16 | $42,500 |
| Mean Household Income | 16 | $55,656 |
| Income Deficit | 14 | $0 |
| Wage / Income Gap (%) | 54 | 29.05% |
| Wage / Income Gap ($) | 54 | 70.95¢ per $1 |
| Gini / Inequality Index | 54 | 0.27 |
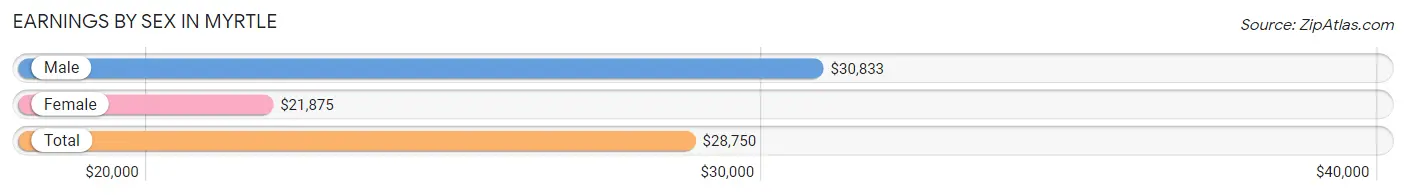
Earnings by Sex in Myrtle
Average Earnings in Myrtle are $28,750, $30,833 for men and $21,875 for women, a difference of 29.0%.
| Sex | Number | Average Earnings |
| Male | 8 (47.1%) | $30,833 |
| Female | 9 (52.9%) | $21,875 |
| Total | 17 (100.0%) | $28,750 |
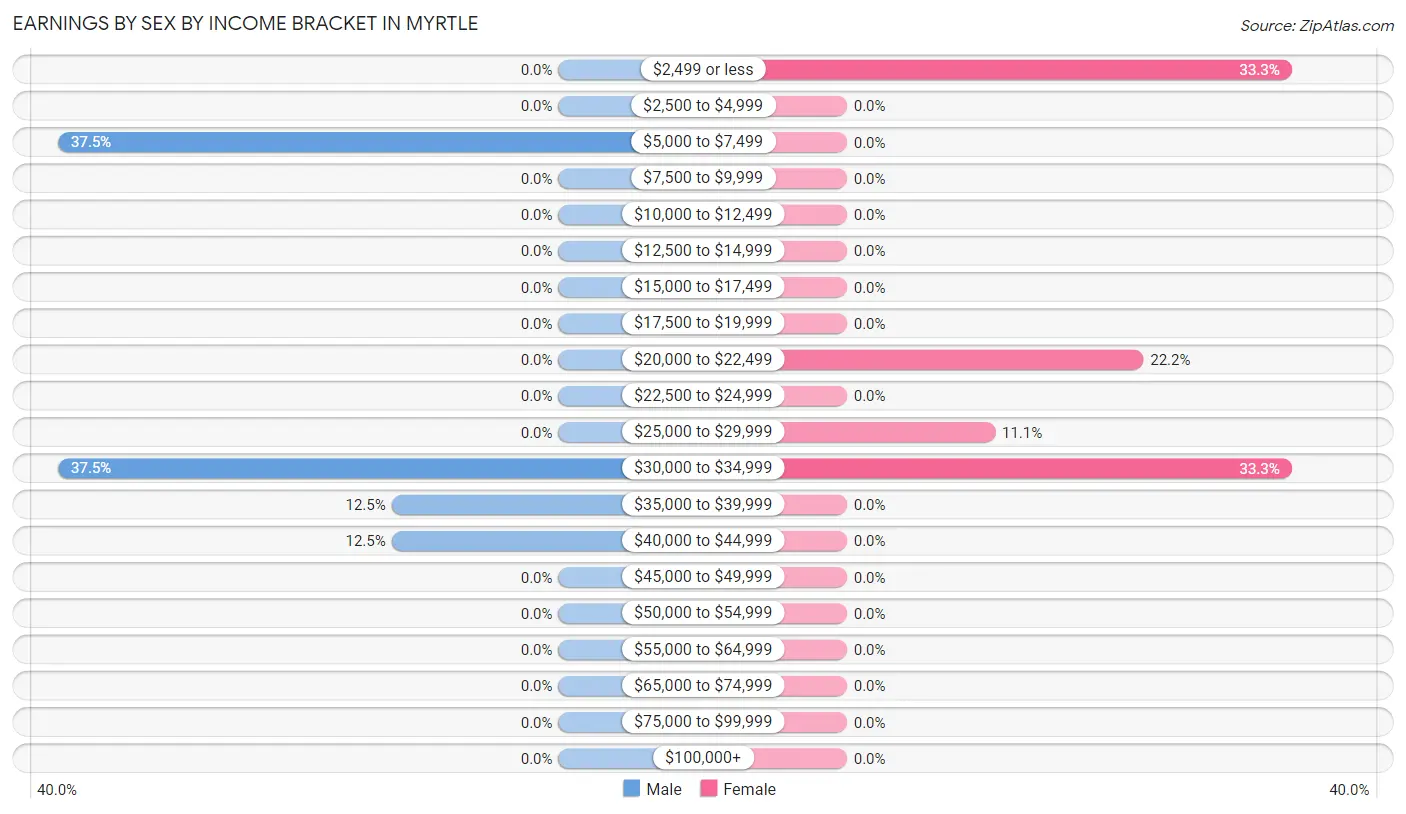
Earnings by Sex by Income Bracket in Myrtle
The most common earnings brackets in Myrtle are $5,000 to $7,499 for men (3 | 37.5%) and $2,499 or less for women (3 | 33.3%).
| Income | Male | Female |
| $2,499 or less | 0 (0.0%) | 3 (33.3%) |
| $2,500 to $4,999 | 0 (0.0%) | 0 (0.0%) |
| $5,000 to $7,499 | 3 (37.5%) | 0 (0.0%) |
| $7,500 to $9,999 | 0 (0.0%) | 0 (0.0%) |
| $10,000 to $12,499 | 0 (0.0%) | 0 (0.0%) |
| $12,500 to $14,999 | 0 (0.0%) | 0 (0.0%) |
| $15,000 to $17,499 | 0 (0.0%) | 0 (0.0%) |
| $17,500 to $19,999 | 0 (0.0%) | 0 (0.0%) |
| $20,000 to $22,499 | 0 (0.0%) | 2 (22.2%) |
| $22,500 to $24,999 | 0 (0.0%) | 0 (0.0%) |
| $25,000 to $29,999 | 0 (0.0%) | 1 (11.1%) |
| $30,000 to $34,999 | 3 (37.5%) | 3 (33.3%) |
| $35,000 to $39,999 | 1 (12.5%) | 0 (0.0%) |
| $40,000 to $44,999 | 1 (12.5%) | 0 (0.0%) |
| $45,000 to $49,999 | 0 (0.0%) | 0 (0.0%) |
| $50,000 to $54,999 | 0 (0.0%) | 0 (0.0%) |
| $55,000 to $64,999 | 0 (0.0%) | 0 (0.0%) |
| $65,000 to $74,999 | 0 (0.0%) | 0 (0.0%) |
| $75,000 to $99,999 | 0 (0.0%) | 0 (0.0%) |
| $100,000+ | 0 (0.0%) | 0 (0.0%) |
| Total | 8 (100.0%) | 9 (100.0%) |
Earnings by Sex by Educational Attainment in Myrtle
| Educational Attainment | Male Income | Female Income |
| Less than High School | - | - |
| High School Diploma | - | - |
| College or Associate's Degree | - | - |
| Bachelor's Degree | - | - |
| Graduate Degree | - | - |
| Total | $30,833 | $0 |
Family Income in Myrtle
Family Income Brackets in Myrtle
According to the Myrtle family income data, there are 6 families falling into the $25,000 to $34,999 income range, which is the most common income bracket and makes up 42.9% of all families.
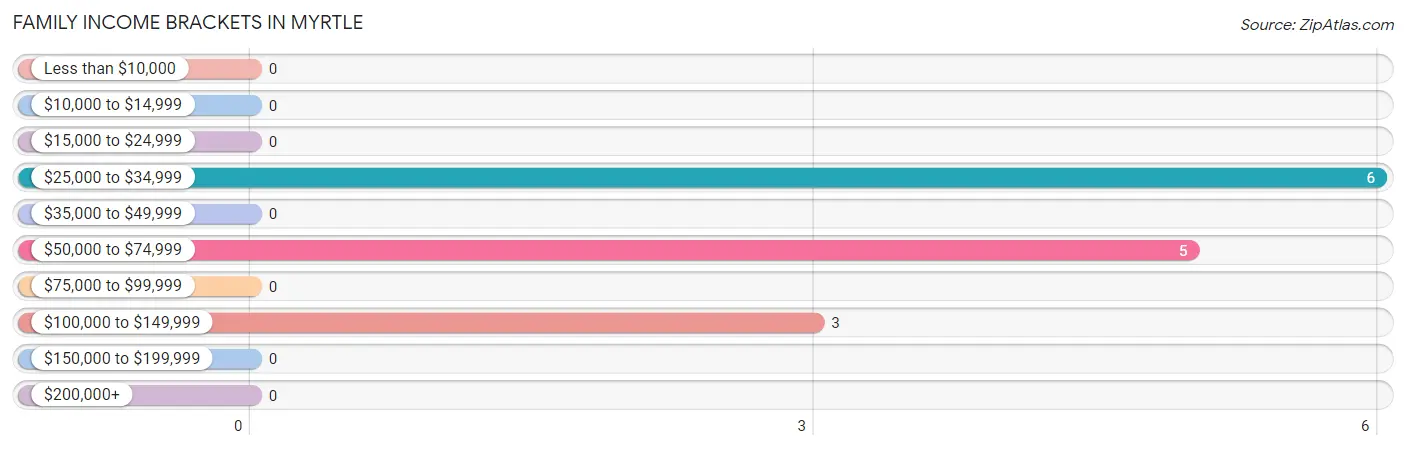
| Income Bracket | # Families | % Families |
| Less than $10,000 | 0 | 0.0% |
| $10,000 to $14,999 | 0 | 0.0% |
| $15,000 to $24,999 | 0 | 0.0% |
| $25,000 to $34,999 | 6 | 42.9% |
| $35,000 to $49,999 | 0 | 0.0% |
| $50,000 to $74,999 | 5 | 35.7% |
| $75,000 to $99,999 | 0 | 0.0% |
| $100,000 to $149,999 | 3 | 21.4% |
| $150,000 to $199,999 | 0 | 0.0% |
| $200,000+ | 0 | 0.0% |
Family Income by Famaliy Size in Myrtle
2-person families (10 | 71.4%) account for the highest median family income in Myrtle with $57,500 per family, while 2-person families (10 | 71.4%) have the highest median income of $28,750 per family member.
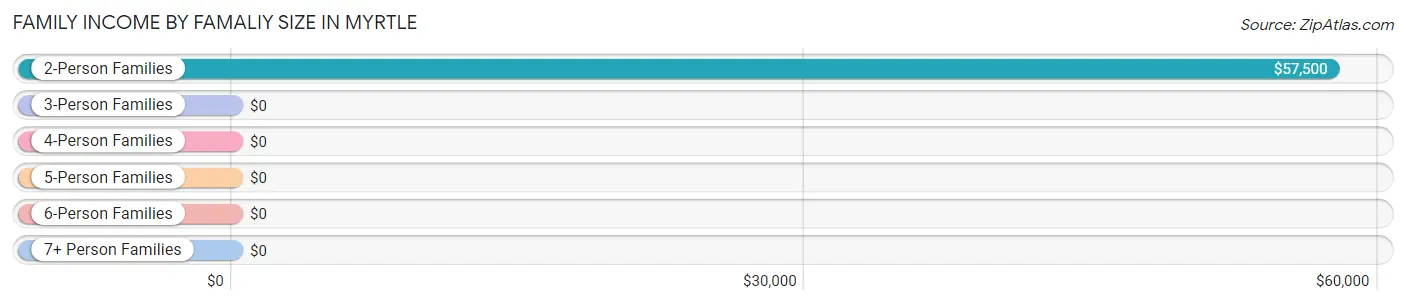
| Income Bracket | # Families | Median Income |
| 2-Person Families | 10 (71.4%) | $57,500 |
| 3-Person Families | 2 (14.3%) | $0 |
| 4-Person Families | 0 (0.0%) | $0 |
| 5-Person Families | 0 (0.0%) | $0 |
| 6-Person Families | 0 (0.0%) | $0 |
| 7+ Person Families | 2 (14.3%) | $0 |
| Total | 14 (100.0%) | $56,250 |
Family Income by Number of Earners in Myrtle
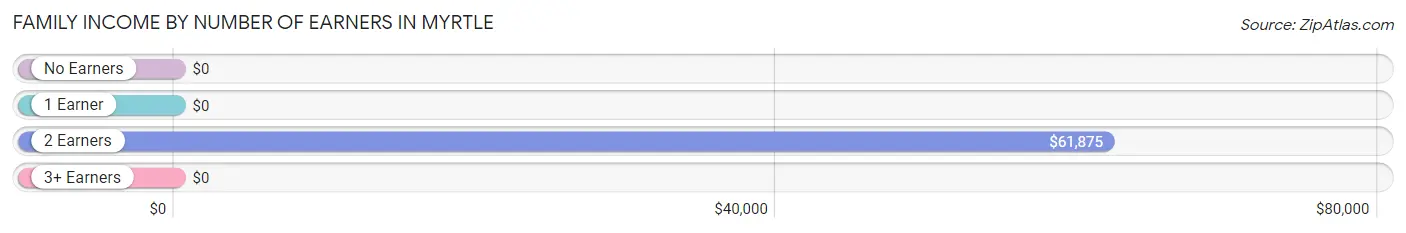
| Number of Earners | # Families | Median Income |
| No Earners | 6 (42.9%) | $0 |
| 1 Earner | 3 (21.4%) | $0 |
| 2 Earners | 5 (35.7%) | $61,875 |
| 3+ Earners | 0 (0.0%) | $0 |
| Total | 14 (100.0%) | $56,250 |
Household Income in Myrtle
Household Income Brackets in Myrtle
With 8 households falling in the category, the $25,000 to $34,999 income range is the most frequent in Myrtle, accounting for 50.0% of all households.
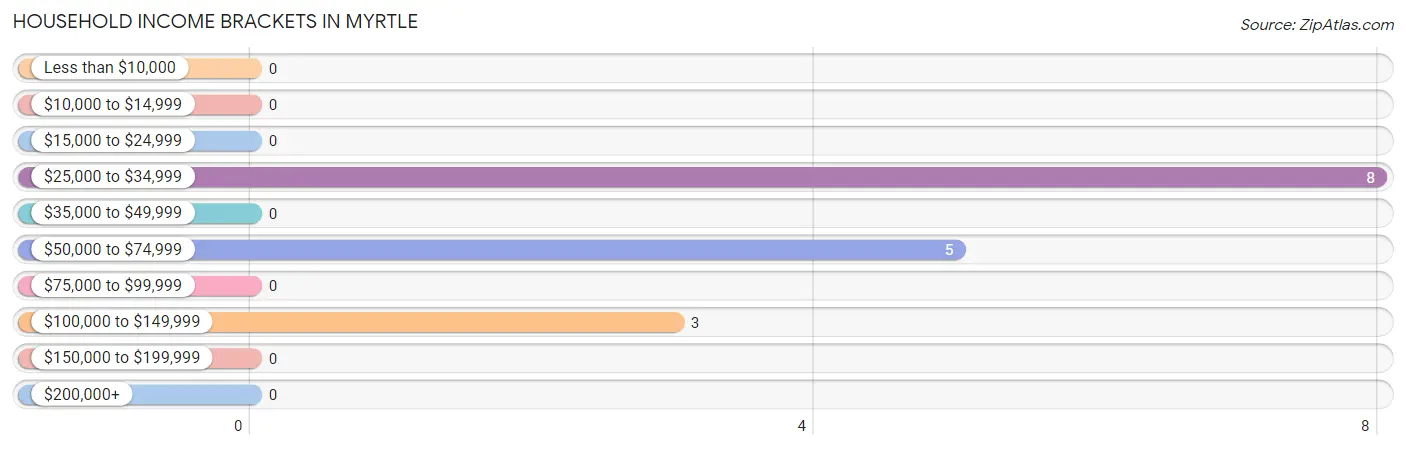
| Income Bracket | # Households | % Households |
| Less than $10,000 | 0 | 0.0% |
| $10,000 to $14,999 | 0 | 0.0% |
| $15,000 to $24,999 | 0 | 0.0% |
| $25,000 to $34,999 | 8 | 50.0% |
| $35,000 to $49,999 | 0 | 0.0% |
| $50,000 to $74,999 | 5 | 31.3% |
| $75,000 to $99,999 | 0 | 0.0% |
| $100,000 to $149,999 | 3 | 18.8% |
| $150,000 to $199,999 | 0 | 0.0% |
| $200,000+ | 0 | 0.0% |
Household Income by Householder Age in Myrtle
The median household income in Myrtle is $42,500, with the highest median household income of $78,750 found in the 65+ years age bracket for the primary householder. A total of 6 households (37.5%) fall into this category.
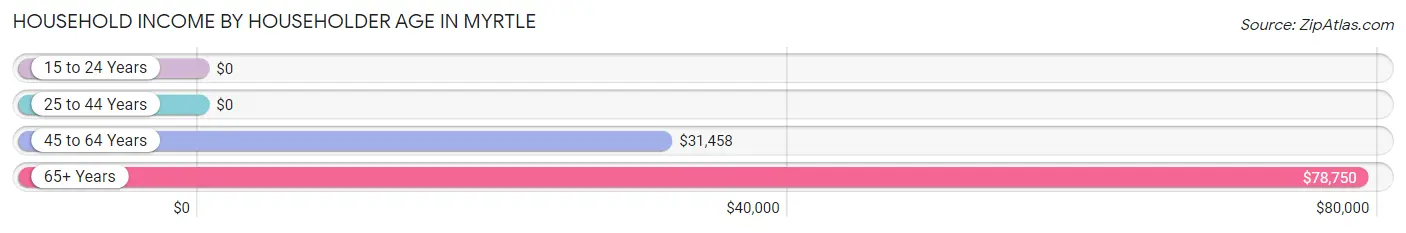
| Income Bracket | # Households | Median Income |
| 15 to 24 Years | 0 (0.0%) | $0 |
| 25 to 44 Years | 3 (18.8%) | $0 |
| 45 to 64 Years | 7 (43.8%) | $31,458 |
| 65+ Years | 6 (37.5%) | $78,750 |
| Total | 16 (100.0%) | $42,500 |
Poverty in Myrtle
Income Below Poverty by Sex and Age in Myrtle
With 43.3% poverty level for males and 45.8% for females among the residents of Myrtle, 6 to 11 year old males and 12 to 14 year old females are the most vulnerable to poverty, with 3 males (100.0%) and 3 females (100.0%) in their respective age groups living below the poverty level.
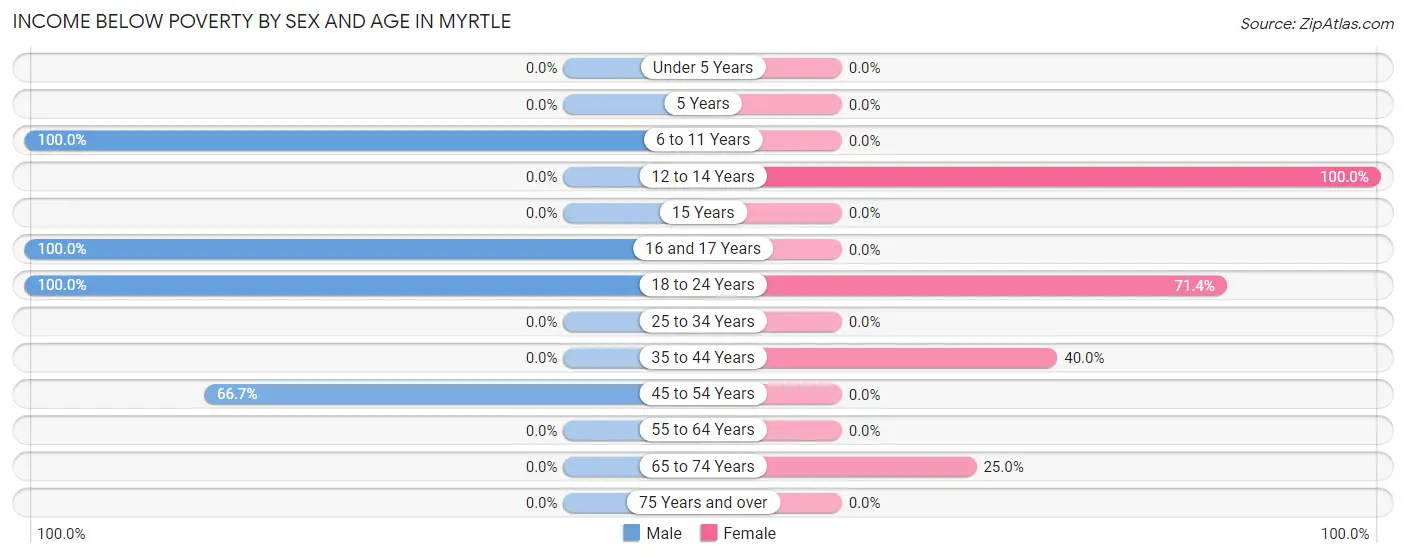
| Age Bracket | Male | Female |
| Under 5 Years | 0 (0.0%) | 0 (0.0%) |
| 5 Years | 0 (0.0%) | 0 (0.0%) |
| 6 to 11 Years | 3 (100.0%) | 0 (0.0%) |
| 12 to 14 Years | 0 (0.0%) | 3 (100.0%) |
| 15 Years | 0 (0.0%) | 0 (0.0%) |
| 16 and 17 Years | 4 (100.0%) | 0 (0.0%) |
| 18 to 24 Years | 4 (100.0%) | 5 (71.4%) |
| 25 to 34 Years | 0 (0.0%) | 0 (0.0%) |
| 35 to 44 Years | 0 (0.0%) | 2 (40.0%) |
| 45 to 54 Years | 2 (66.7%) | 0 (0.0%) |
| 55 to 64 Years | 0 (0.0%) | 0 (0.0%) |
| 65 to 74 Years | 0 (0.0%) | 1 (25.0%) |
| 75 Years and over | 0 (0.0%) | 0 (0.0%) |
| Total | 13 (43.3%) | 11 (45.8%) |
Income Above Poverty by Sex and Age in Myrtle
According to the poverty statistics in Myrtle, males aged 5 years and females aged 45 to 54 years are the age groups that are most secure financially, with 100.0% of males and 100.0% of females in these age groups living above the poverty line.
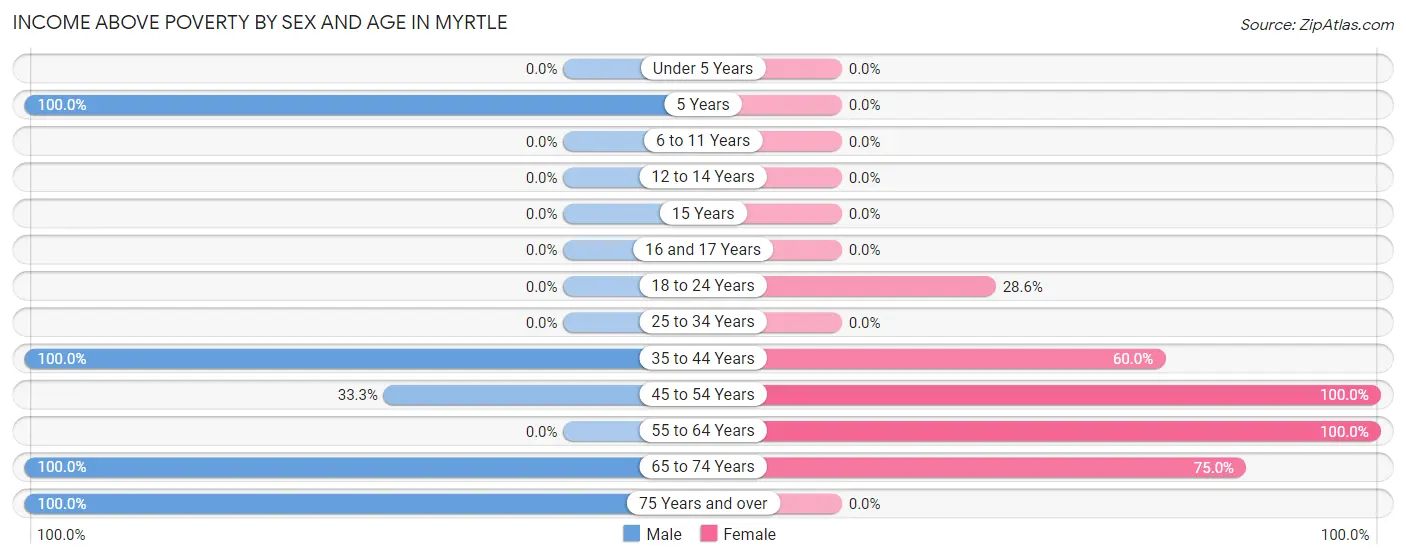
| Age Bracket | Male | Female |
| Under 5 Years | 0 (0.0%) | 0 (0.0%) |
| 5 Years | 2 (100.0%) | 0 (0.0%) |
| 6 to 11 Years | 0 (0.0%) | 0 (0.0%) |
| 12 to 14 Years | 0 (0.0%) | 0 (0.0%) |
| 15 Years | 0 (0.0%) | 0 (0.0%) |
| 16 and 17 Years | 0 (0.0%) | 0 (0.0%) |
| 18 to 24 Years | 0 (0.0%) | 2 (28.6%) |
| 25 to 34 Years | 0 (0.0%) | 0 (0.0%) |
| 35 to 44 Years | 4 (100.0%) | 3 (60.0%) |
| 45 to 54 Years | 1 (33.3%) | 1 (100.0%) |
| 55 to 64 Years | 0 (0.0%) | 4 (100.0%) |
| 65 to 74 Years | 6 (100.0%) | 3 (75.0%) |
| 75 Years and over | 4 (100.0%) | 0 (0.0%) |
| Total | 17 (56.7%) | 13 (54.2%) |
Income Below Poverty Among Married-Couple Families in Myrtle
The poverty statistics for married-couple families in Myrtle show that 15.4% or 2 of the total 13 families live below the poverty line. Families with 3 or 4 children have the highest poverty rate of 100.0%, comprising of 2 families. On the other hand, families with no children have the lowest poverty rate of 0.0%, which includes 0 families.
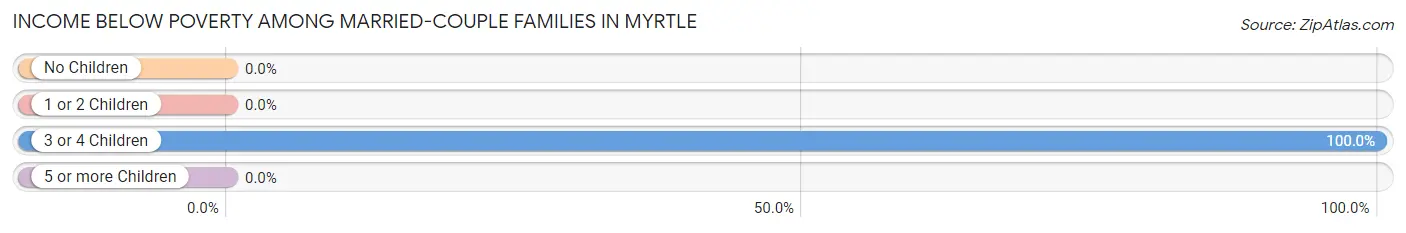
| Children | Above Poverty | Below Poverty |
| No Children | 9 (100.0%) | 0 (0.0%) |
| 1 or 2 Children | 2 (100.0%) | 0 (0.0%) |
| 3 or 4 Children | 0 (0.0%) | 2 (100.0%) |
| 5 or more Children | 0 (0.0%) | 0 (0.0%) |
| Total | 11 (84.6%) | 2 (15.4%) |
Income Below Poverty Among Single-Parent Households in Myrtle
| Children | Single Father | Single Mother |
| No Children | 0 (0.0%) | 0 (0.0%) |
| 1 or 2 Children | 0 (0.0%) | 0 (0.0%) |
| 3 or 4 Children | 0 (0.0%) | 0 (0.0%) |
| 5 or more Children | 0 (0.0%) | 0 (0.0%) |
| Total | 0 (0.0%) | 0 (0.0%) |
Income Below Poverty Among Married-Couple vs Single-Parent Households in Myrtle
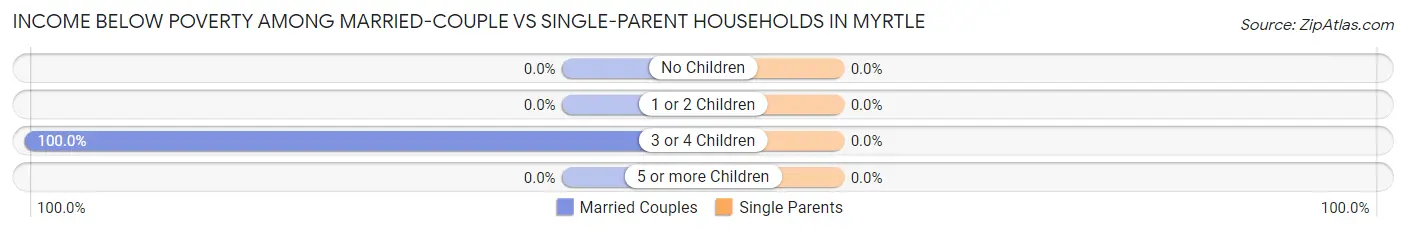
| Children | Married-Couple Families | Single-Parent Households |
| No Children | 0 (0.0%) | 0 (0.0%) |
| 1 or 2 Children | 0 (0.0%) | 0 (0.0%) |
| 3 or 4 Children | 2 (100.0%) | 0 (0.0%) |
| 5 or more Children | 0 (0.0%) | 0 (0.0%) |
| Total | 2 (15.4%) | 0 (0.0%) |
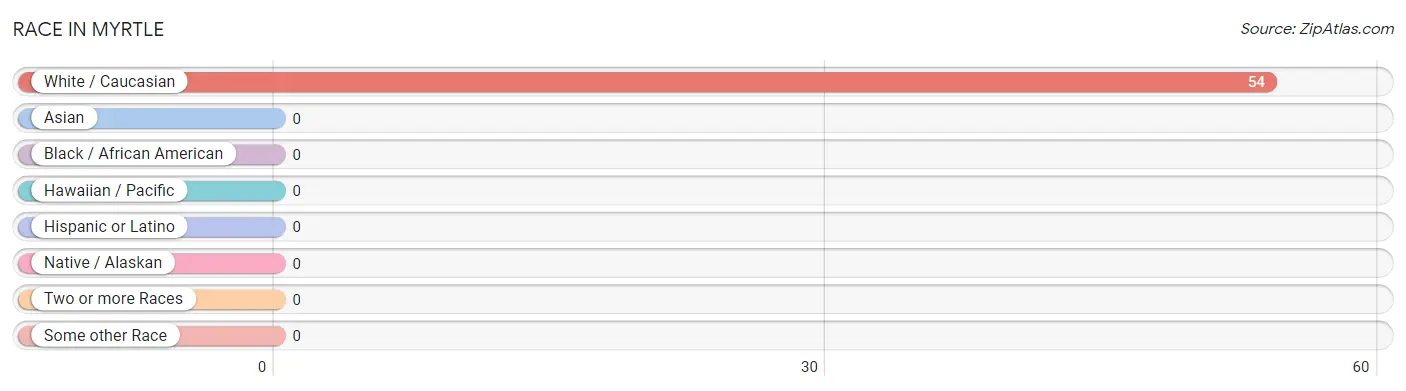
Race in Myrtle
The most populous races in Myrtle are , and White / Caucasian (54 | 100.0%).
| Race | # Population | % Population |
| Asian | 0 | 0.0% |
| Black / African American | 0 | 0.0% |
| Hawaiian / Pacific | 0 | 0.0% |
| Hispanic or Latino | 0 | 0.0% |
| Native / Alaskan | 0 | 0.0% |
| White / Caucasian | 54 | 100.0% |
| Two or more Races | 0 | 0.0% |
| Some other Race | 0 | 0.0% |
| Total | 54 | 100.0% |
Ancestry in Myrtle
The most populous ancestries reported in Myrtle are German (41 | 75.9%), Norwegian (15 | 27.8%), Swedish (15 | 27.8%), English (8 | 14.8%), and Danish (4 | 7.4%), together accounting for 153.7% of all Myrtle residents.
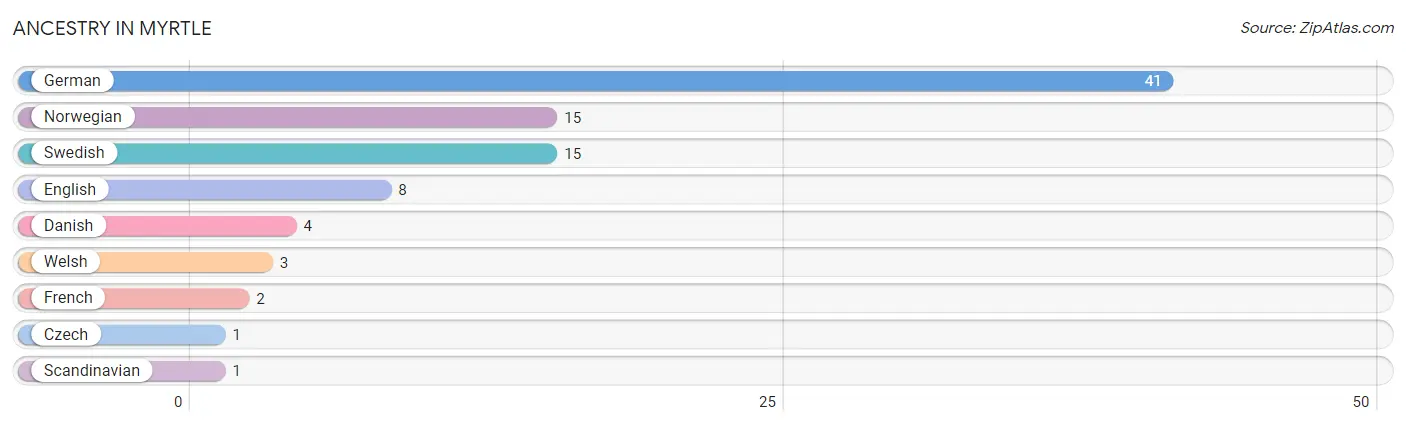
| Ancestry | # Population | % Population |
| Czech | 1 | 1.8% |
| Danish | 4 | 7.4% |
| English | 8 | 14.8% |
| French | 2 | 3.7% |
| German | 41 | 75.9% |
| Norwegian | 15 | 27.8% |
| Scandinavian | 1 | 1.8% |
| Swedish | 15 | 27.8% |
| Welsh | 3 | 5.6% | View All 9 Rows |
Immigrants in Myrtle

| Immigration Origin | # Population | % Population | View All 0 Rows |
Sex and Age in Myrtle
Sex and Age in Myrtle
The most populous age groups in Myrtle are 15 to 19 Years (4 | 13.3%) for men and 20 to 24 Years (7 | 29.2%) for women.
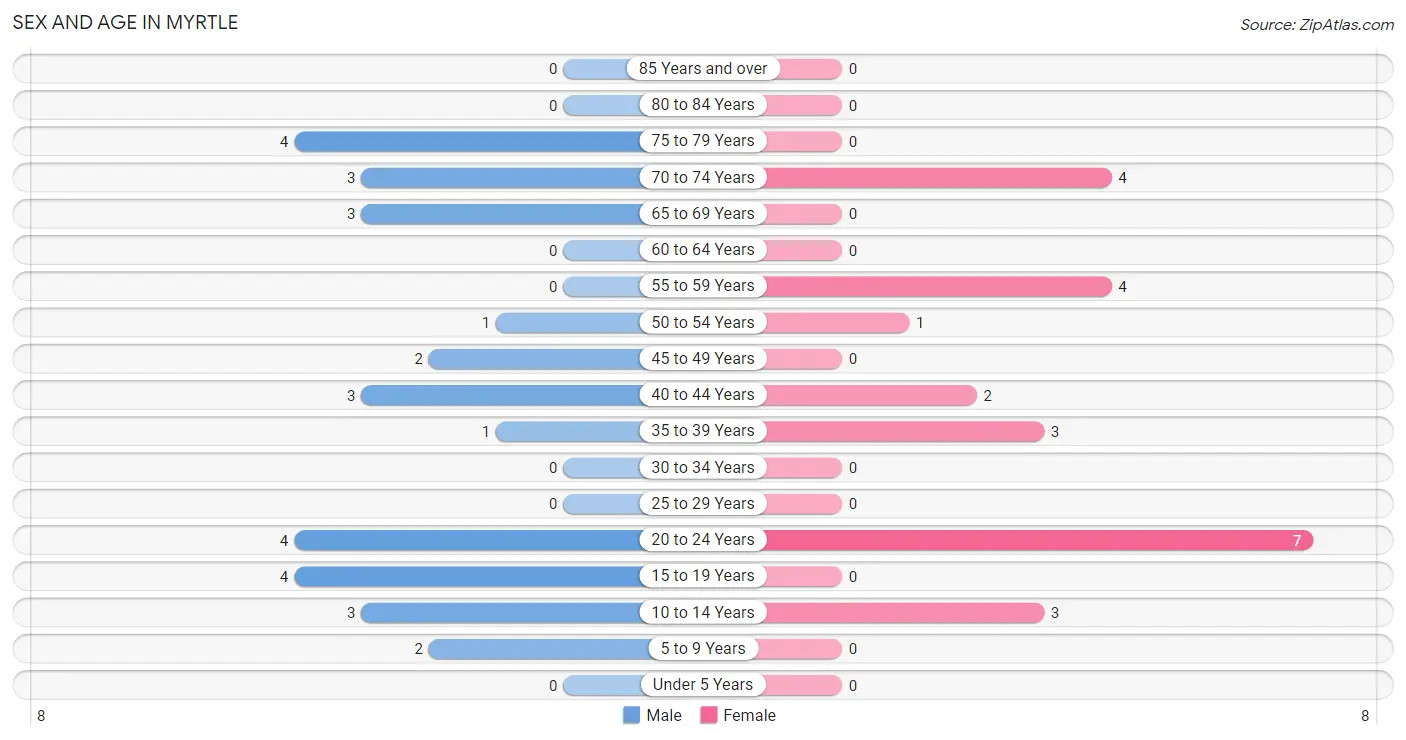
| Age Bracket | Male | Female |
| Under 5 Years | 0 (0.0%) | 0 (0.0%) |
| 5 to 9 Years | 2 (6.7%) | 0 (0.0%) |
| 10 to 14 Years | 3 (10.0%) | 3 (12.5%) |
| 15 to 19 Years | 4 (13.3%) | 0 (0.0%) |
| 20 to 24 Years | 4 (13.3%) | 7 (29.2%) |
| 25 to 29 Years | 0 (0.0%) | 0 (0.0%) |
| 30 to 34 Years | 0 (0.0%) | 0 (0.0%) |
| 35 to 39 Years | 1 (3.3%) | 3 (12.5%) |
| 40 to 44 Years | 3 (10.0%) | 2 (8.3%) |
| 45 to 49 Years | 2 (6.7%) | 0 (0.0%) |
| 50 to 54 Years | 1 (3.3%) | 1 (4.2%) |
| 55 to 59 Years | 0 (0.0%) | 4 (16.7%) |
| 60 to 64 Years | 0 (0.0%) | 0 (0.0%) |
| 65 to 69 Years | 3 (10.0%) | 0 (0.0%) |
| 70 to 74 Years | 3 (10.0%) | 4 (16.7%) |
| 75 to 79 Years | 4 (13.3%) | 0 (0.0%) |
| 80 to 84 Years | 0 (0.0%) | 0 (0.0%) |
| 85 Years and over | 0 (0.0%) | 0 (0.0%) |
| Total | 30 (100.0%) | 24 (100.0%) |
Families and Households in Myrtle
Median Family Size in Myrtle
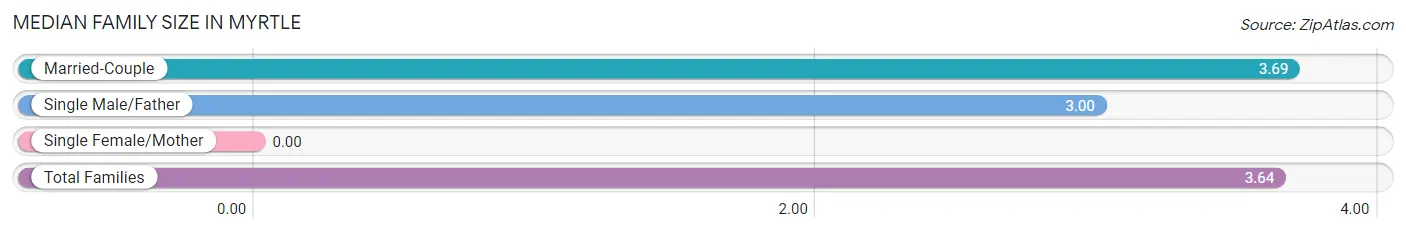
| Family Type | # Families | Family Size |
| Married-Couple | 13 (92.9%) | 3.69 |
| Single Male/Father | 1 (7.1%) | 3.00 |
| Single Female/Mother | 0 (0.0%) | - |
| Total Families | 14 (100.0%) | 3.64 |
Median Household Size in Myrtle
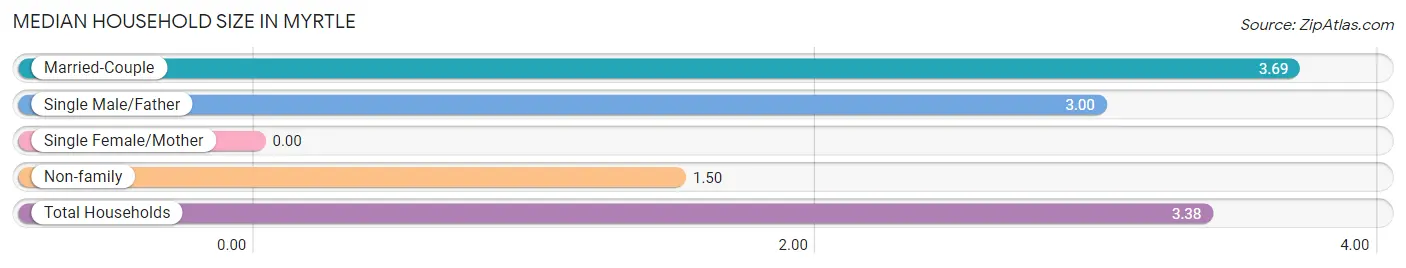
| Household Type | # Households | Household Size |
| Married-Couple | 13 (81.2%) | 3.69 |
| Single Male/Father | 1 (6.2%) | 3.00 |
| Single Female/Mother | 0 (0.0%) | - |
| Non-family | 2 (12.5%) | 1.50 |
| Total Households | 16 (100.0%) | 3.38 |
Household Size by Marriage Status in Myrtle
Out of a total of 16 households in Myrtle, 14 (87.5%) are family households, while 2 (12.5%) are nonfamily households. The most numerous type of family households are 2-person households, comprising 10, and the most common type of nonfamily households are 2-person households, comprising 2.
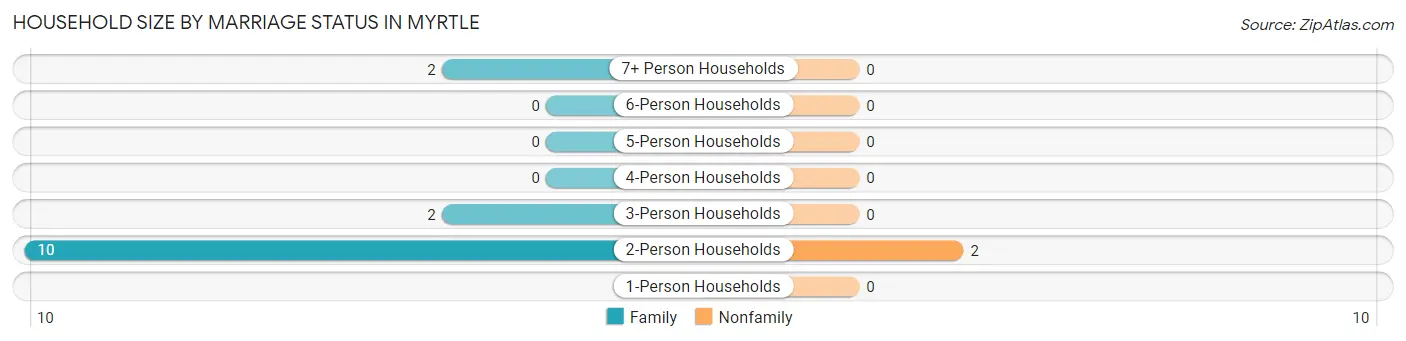
| Household Size | Family Households | Nonfamily Households |
| 1-Person Households | - | 0 (0.0%) |
| 2-Person Households | 10 (62.5%) | 2 (12.5%) |
| 3-Person Households | 2 (12.5%) | 0 (0.0%) |
| 4-Person Households | 0 (0.0%) | 0 (0.0%) |
| 5-Person Households | 0 (0.0%) | 0 (0.0%) |
| 6-Person Households | 0 (0.0%) | 0 (0.0%) |
| 7+ Person Households | 2 (12.5%) | 0 (0.0%) |
| Total | 14 (87.5%) | 2 (12.5%) |
Female Fertility in Myrtle
Fertility by Age in Myrtle
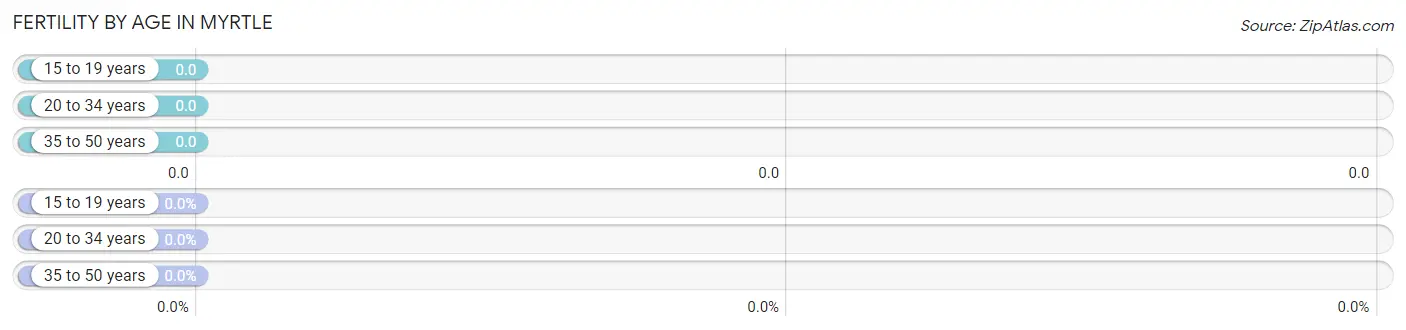
| Age Bracket | Women with Births | Births / 1,000 Women |
| 15 to 19 years | 0 (0.0%) | 0.0 |
| 20 to 34 years | 0 (0.0%) | 0.0 |
| 35 to 50 years | 0 (0.0%) | 0.0 |
| Total | 0 (0.0%) | 0.0 |
Fertility by Age by Marriage Status in Myrtle
| Age Bracket | Married | Unmarried |
| 15 to 19 years | 0 (0.0%) | 0 (0.0%) |
| 20 to 34 years | 0 (0.0%) | 0 (0.0%) |
| 35 to 50 years | 0 (0.0%) | 0 (0.0%) |
| Total | 0 (0.0%) | 0 (0.0%) |
Fertility by Education in Myrtle
| Educational Attainment | Women with Births | Births / 1,000 Women |
| Less than High School | 0 (0.0%) | 0.0 |
| High School Diploma | 0 (0.0%) | 0.0 |
| College or Associate's Degree | 0 (0.0%) | 0.0 |
| Bachelor's Degree | 0 (0.0%) | 0.0 |
| Graduate Degree | 0 (0.0%) | 0.0 |
| Total | 0 (0.0%) | 0.0 |
Fertility by Education by Marriage Status in Myrtle
| Educational Attainment | Married | Unmarried |
| Less than High School | 0 (0.0%) | 0 (0.0%) |
| High School Diploma | 0 (0.0%) | 0 (0.0%) |
| College or Associate's Degree | 0 (0.0%) | 0 (0.0%) |
| Bachelor's Degree | 0 (0.0%) | 0 (0.0%) |
| Graduate Degree | 0 (0.0%) | 0 (0.0%) |
| Total | 0 (0.0%) | 0 (0.0%) |
Employment Characteristics in Myrtle
Employment by Class of Employer in Myrtle
Among the 13 employed individuals in Myrtle, private company employees (10 | 76.9%), not-for-profit organizations (2 | 15.4%), and self-employed (not incorporated) (1 | 7.7%) make up the most common classes of employment.
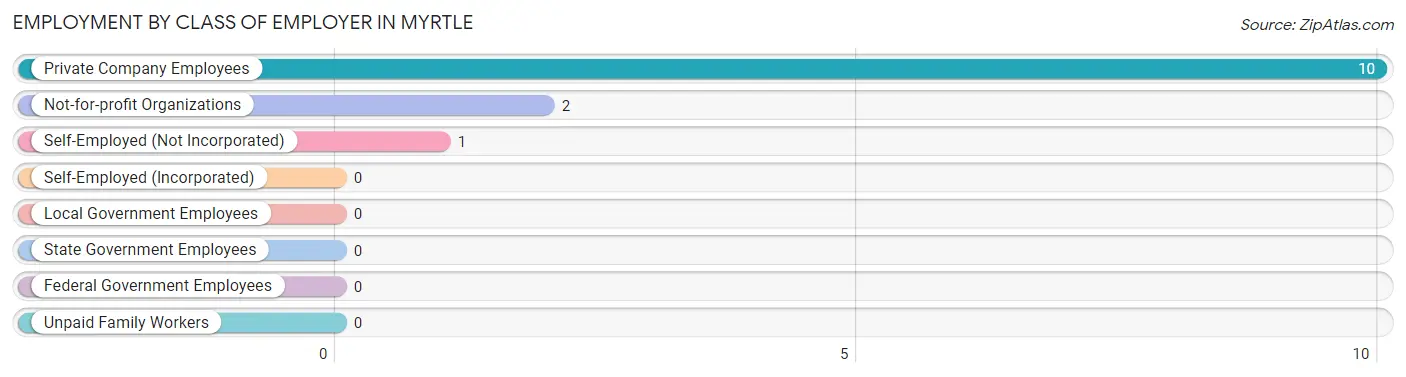
| Employer Class | # Employees | % Employees |
| Private Company Employees | 10 | 76.9% |
| Self-Employed (Incorporated) | 0 | 0.0% |
| Self-Employed (Not Incorporated) | 1 | 7.7% |
| Not-for-profit Organizations | 2 | 15.4% |
| Local Government Employees | 0 | 0.0% |
| State Government Employees | 0 | 0.0% |
| Federal Government Employees | 0 | 0.0% |
| Unpaid Family Workers | 0 | 0.0% |
| Total | 13 | 100.0% |
Employment Status by Age in Myrtle
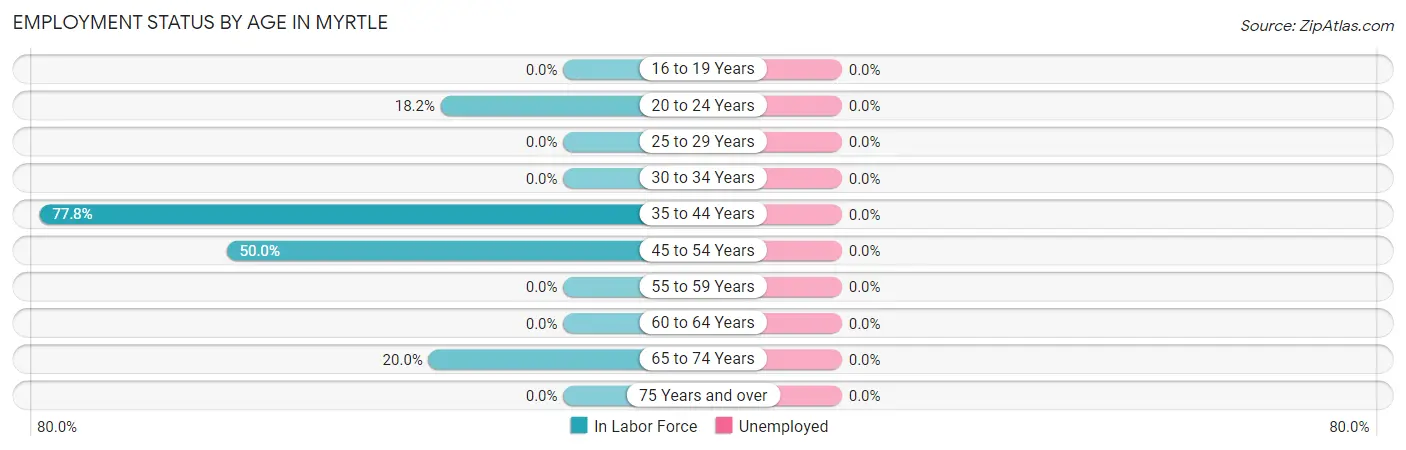
| Age Bracket | In Labor Force | Unemployed |
| 16 to 19 Years | 0 (0.0%) | 0 (0.0%) |
| 20 to 24 Years | 2 (18.2%) | 0 (0.0%) |
| 25 to 29 Years | 0 (0.0%) | 0 (0.0%) |
| 30 to 34 Years | 0 (0.0%) | 0 (0.0%) |
| 35 to 44 Years | 7 (77.8%) | 0 (0.0%) |
| 45 to 54 Years | 2 (50.0%) | 0 (0.0%) |
| 55 to 59 Years | 0 (0.0%) | 0 (0.0%) |
| 60 to 64 Years | 0 (0.0%) | 0 (0.0%) |
| 65 to 74 Years | 2 (20.0%) | 0 (0.0%) |
| 75 Years and over | 0 (0.0%) | 0 (0.0%) |
| Total | 13 (28.3%) | 0 (0.0%) |
Employment Status by Educational Attainment in Myrtle
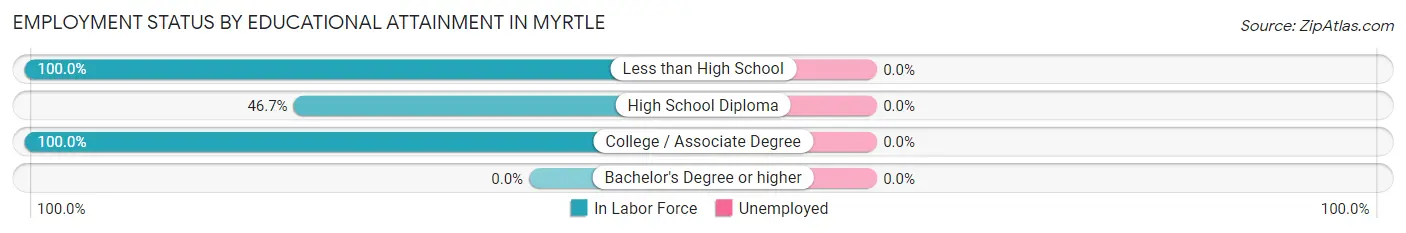
| Educational Attainment | In Labor Force | Unemployed |
| Less than High School | 1 (100.0%) | 0 (0.0%) |
| High School Diploma | 7 (46.7%) | 0 (0.0%) |
| College / Associate Degree | 1 (100.0%) | 0 (0.0%) |
| Bachelor's Degree or higher | 0 (0.0%) | 0 (0.0%) |
| Total | 9 (52.9%) | 0 (0.0%) |
Employment Occupations by Sex in Myrtle
Management, Business, Science and Arts Occupations
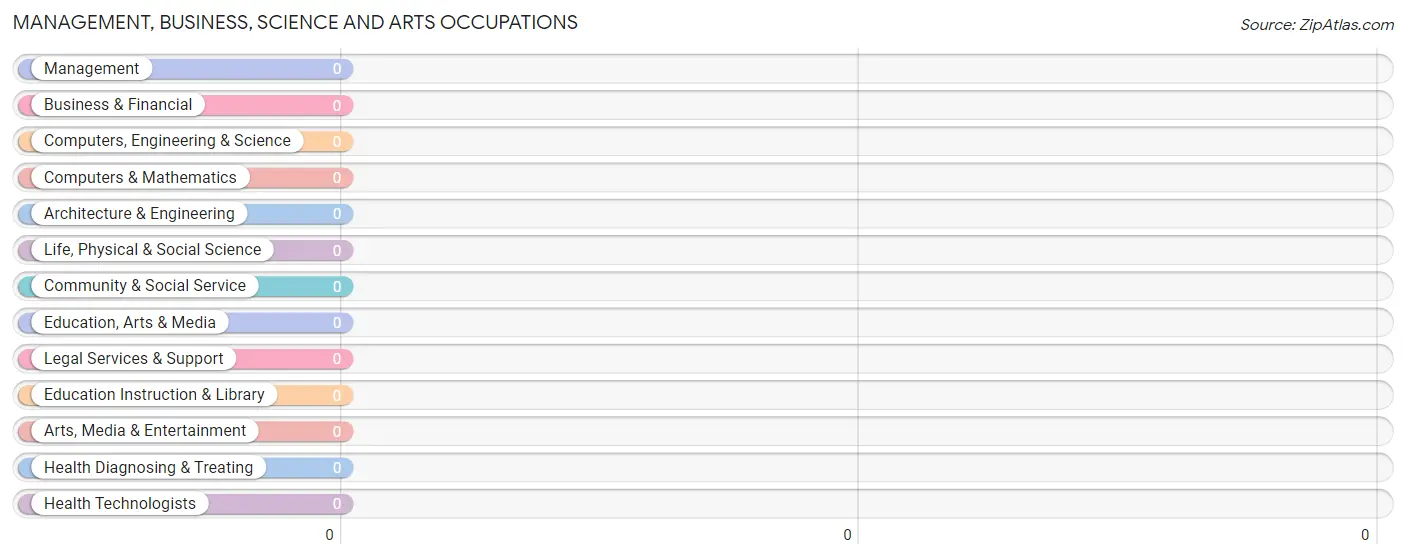
Management, Business, Science and Arts Occupations by Sex
| Occupation | Male | Female |
| Management | 0 (0.0%) | 0 (0.0%) |
| Business & Financial | 0 (0.0%) | 0 (0.0%) |
| Computers, Engineering & Science | 0 (0.0%) | 0 (0.0%) |
| Computers & Mathematics | 0 (0.0%) | 0 (0.0%) |
| Architecture & Engineering | 0 (0.0%) | 0 (0.0%) |
| Life, Physical & Social Science | 0 (0.0%) | 0 (0.0%) |
| Community & Social Service | 0 (0.0%) | 0 (0.0%) |
| Education, Arts & Media | 0 (0.0%) | 0 (0.0%) |
| Legal Services & Support | 0 (0.0%) | 0 (0.0%) |
| Education Instruction & Library | 0 (0.0%) | 0 (0.0%) |
| Arts, Media & Entertainment | 0 (0.0%) | 0 (0.0%) |
| Health Diagnosing & Treating | 0 (0.0%) | 0 (0.0%) |
| Health Technologists | 0 (0.0%) | 0 (0.0%) |
| Total (Category) | 0 (0.0%) | 0 (0.0%) |
| Total (Overall) | 7 (53.8%) | 6 (46.2%) |
Services Occupations
The most common Services occupations in Myrtle are Healthcare Support (3 | 23.1%), and Food Preparation & Serving (1 | 7.7%).
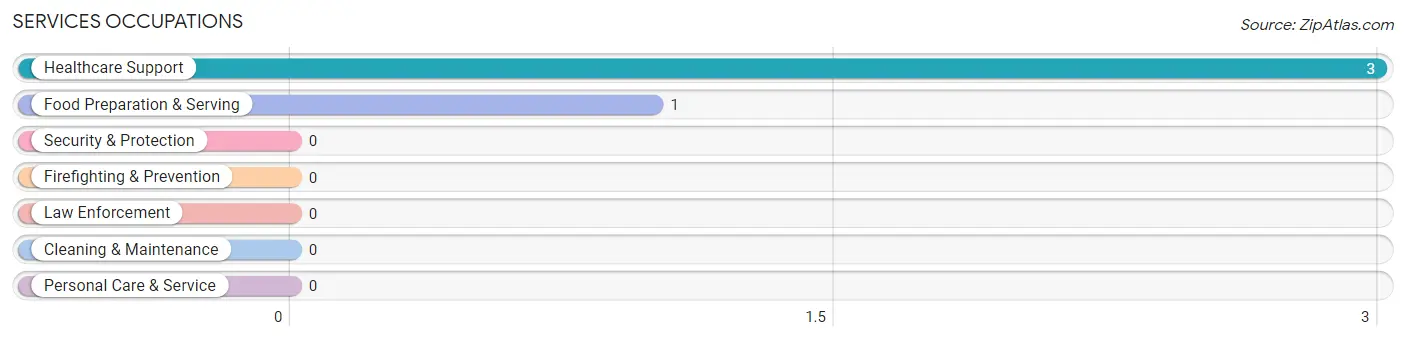
Services Occupations by Sex
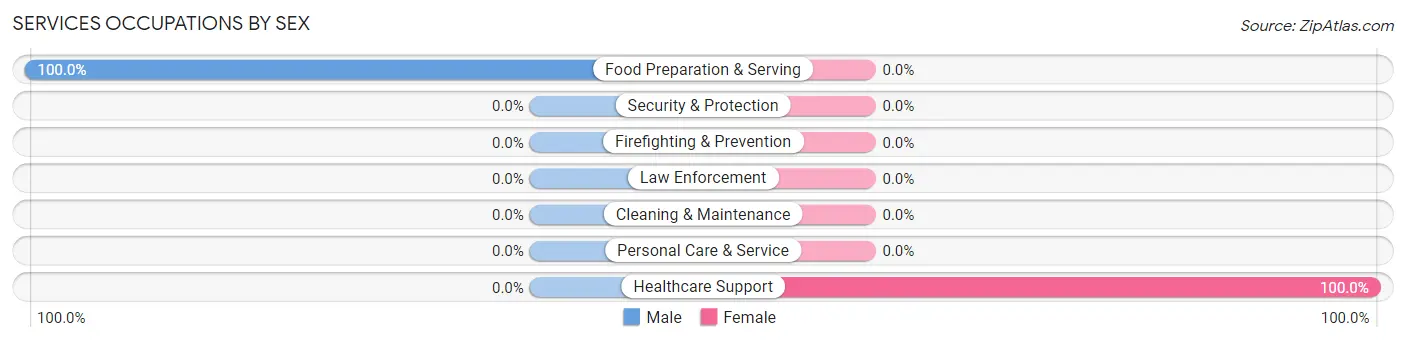
| Occupation | Male | Female |
| Healthcare Support | 0 (0.0%) | 3 (100.0%) |
| Security & Protection | 0 (0.0%) | 0 (0.0%) |
| Firefighting & Prevention | 0 (0.0%) | 0 (0.0%) |
| Law Enforcement | 0 (0.0%) | 0 (0.0%) |
| Food Preparation & Serving | 1 (100.0%) | 0 (0.0%) |
| Cleaning & Maintenance | 0 (0.0%) | 0 (0.0%) |
| Personal Care & Service | 0 (0.0%) | 0 (0.0%) |
| Total (Category) | 1 (25.0%) | 3 (75.0%) |
| Total (Overall) | 7 (53.8%) | 6 (46.2%) |
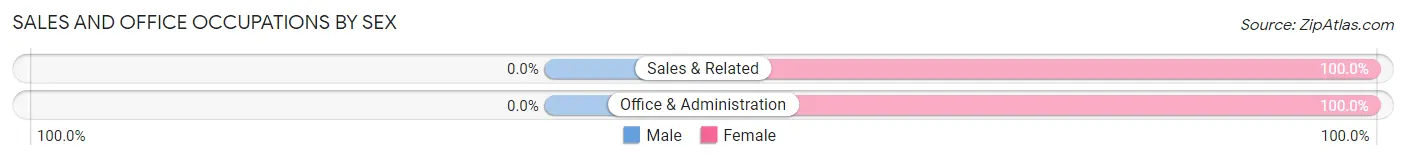
Sales and Office Occupations
The most common Sales and Office occupations in Myrtle are Sales & Related (2 | 15.4%), and Office & Administration (1 | 7.7%).
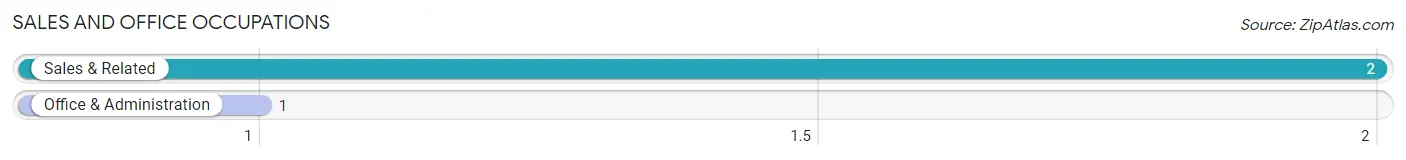
Sales and Office Occupations by Sex
| Occupation | Male | Female |
| Sales & Related | 0 (0.0%) | 2 (100.0%) |
| Office & Administration | 0 (0.0%) | 1 (100.0%) |
| Total (Category) | 0 (0.0%) | 3 (100.0%) |
| Total (Overall) | 7 (53.8%) | 6 (46.2%) |
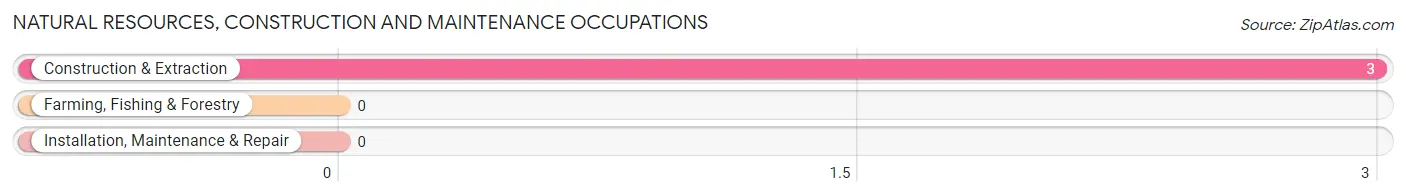
Natural Resources, Construction and Maintenance Occupations
The most common Natural Resources, Construction and Maintenance occupations in Myrtle are , and Construction & Extraction (3 | 23.1%).
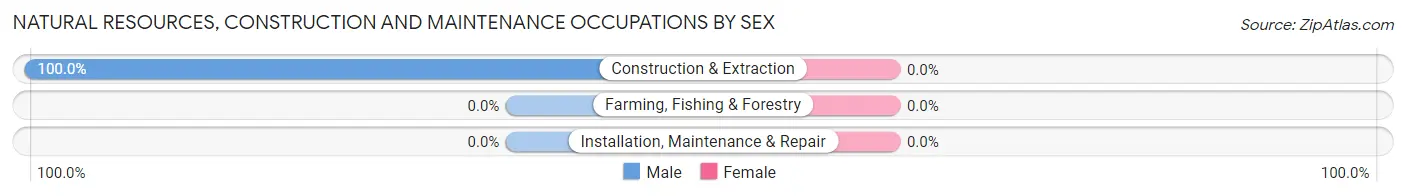
Natural Resources, Construction and Maintenance Occupations by Sex
| Occupation | Male | Female |
| Farming, Fishing & Forestry | 0 (0.0%) | 0 (0.0%) |
| Construction & Extraction | 3 (100.0%) | 0 (0.0%) |
| Installation, Maintenance & Repair | 0 (0.0%) | 0 (0.0%) |
| Total (Category) | 3 (100.0%) | 0 (0.0%) |
| Total (Overall) | 7 (53.8%) | 6 (46.2%) |
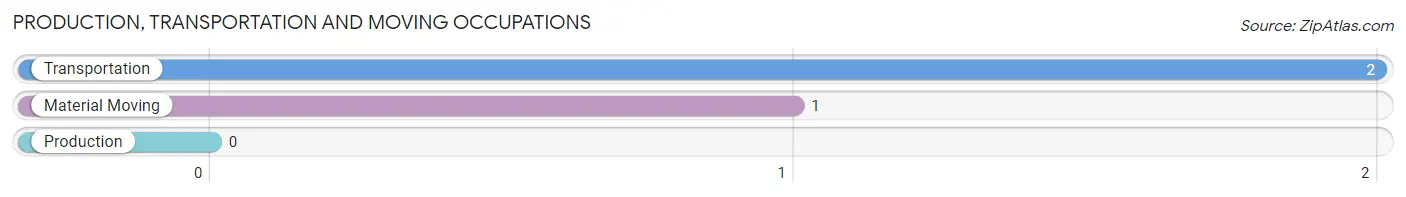
Production, Transportation and Moving Occupations
The most common Production, Transportation and Moving occupations in Myrtle are Transportation (2 | 15.4%), and Material Moving (1 | 7.7%).
Production, Transportation and Moving Occupations by Sex
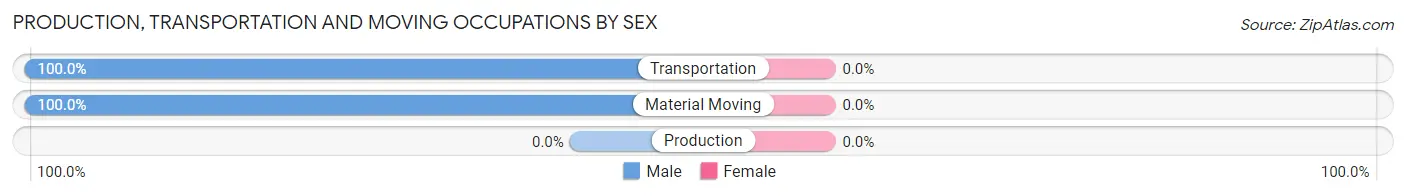
| Occupation | Male | Female |
| Production | 0 (0.0%) | 0 (0.0%) |
| Transportation | 2 (100.0%) | 0 (0.0%) |
| Material Moving | 1 (100.0%) | 0 (0.0%) |
| Total (Category) | 3 (100.0%) | 0 (0.0%) |
| Total (Overall) | 7 (53.8%) | 6 (46.2%) |
Employment Industries by Sex in Myrtle
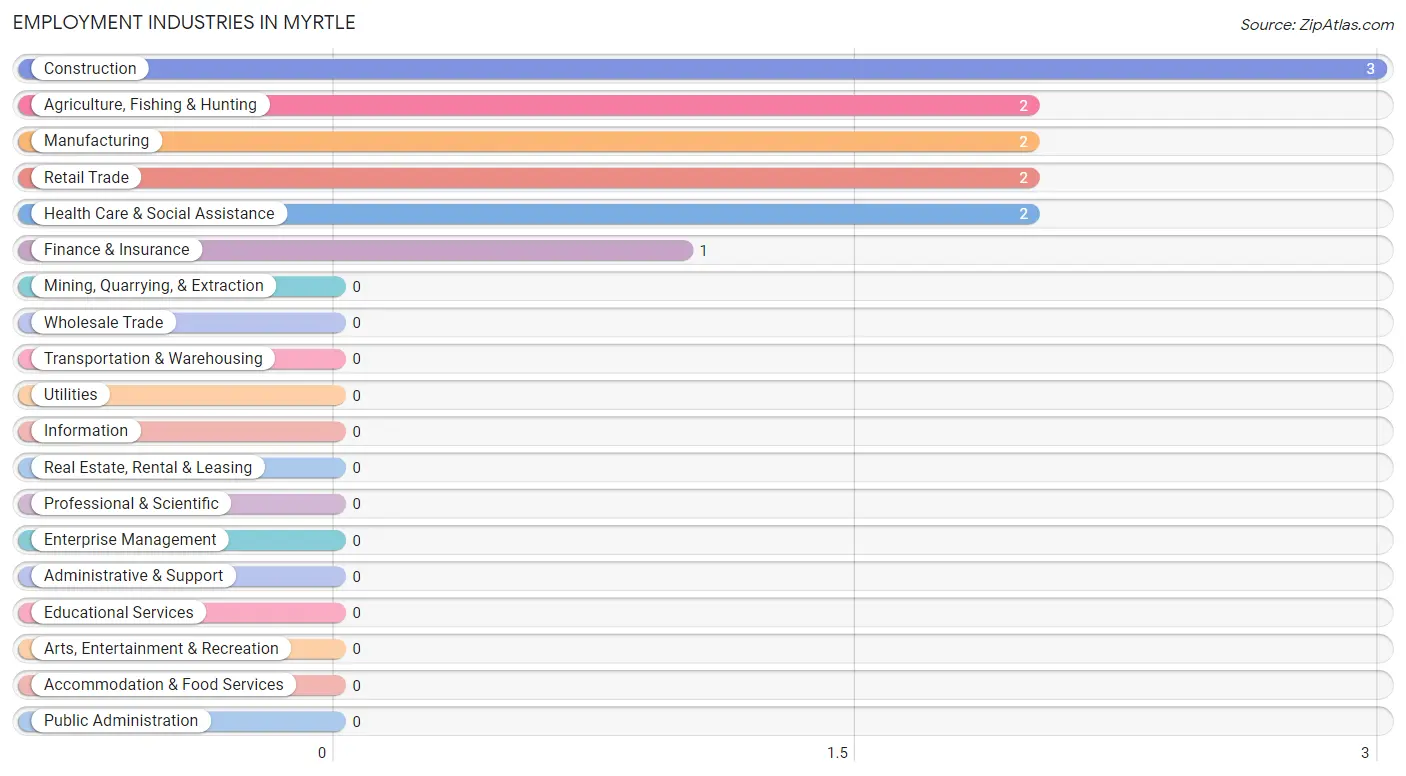
Employment Industries in Myrtle
The major employment industries in Myrtle include Construction (3 | 23.1%), Agriculture, Fishing & Hunting (2 | 15.4%), Manufacturing (2 | 15.4%), Retail Trade (2 | 15.4%), and Health Care & Social Assistance (2 | 15.4%).
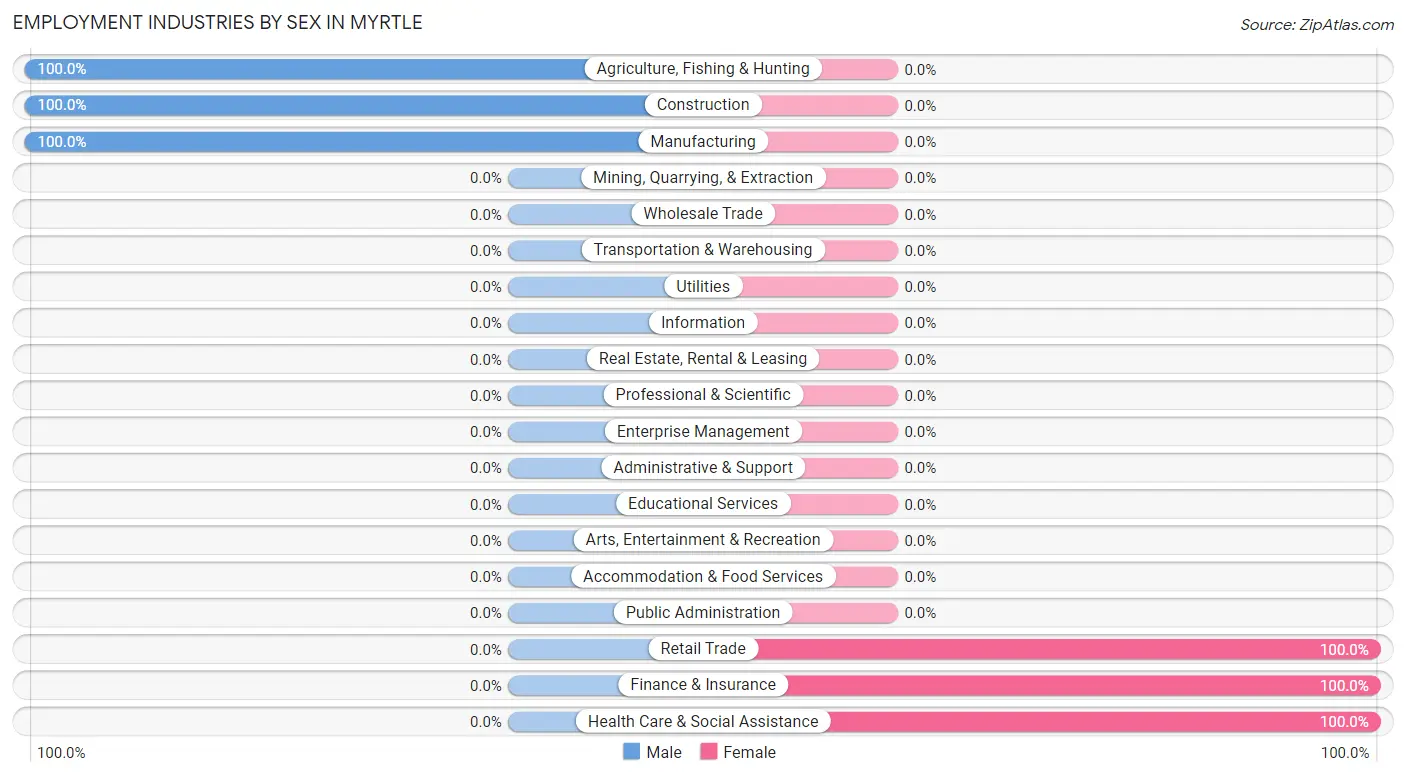
Employment Industries by Sex in Myrtle
The Myrtle industries that see more men than women are Agriculture, Fishing & Hunting (100.0%), Construction (100.0%), and Manufacturing (100.0%), whereas the industries that tend to have a higher number of women are Retail Trade (100.0%), Finance & Insurance (100.0%), and Health Care & Social Assistance (100.0%).
| Industry | Male | Female |
| Agriculture, Fishing & Hunting | 2 (100.0%) | 0 (0.0%) |
| Mining, Quarrying, & Extraction | 0 (0.0%) | 0 (0.0%) |
| Construction | 3 (100.0%) | 0 (0.0%) |
| Manufacturing | 2 (100.0%) | 0 (0.0%) |
| Wholesale Trade | 0 (0.0%) | 0 (0.0%) |
| Retail Trade | 0 (0.0%) | 2 (100.0%) |
| Transportation & Warehousing | 0 (0.0%) | 0 (0.0%) |
| Utilities | 0 (0.0%) | 0 (0.0%) |
| Information | 0 (0.0%) | 0 (0.0%) |
| Finance & Insurance | 0 (0.0%) | 1 (100.0%) |
| Real Estate, Rental & Leasing | 0 (0.0%) | 0 (0.0%) |
| Professional & Scientific | 0 (0.0%) | 0 (0.0%) |
| Enterprise Management | 0 (0.0%) | 0 (0.0%) |
| Administrative & Support | 0 (0.0%) | 0 (0.0%) |
| Educational Services | 0 (0.0%) | 0 (0.0%) |
| Health Care & Social Assistance | 0 (0.0%) | 2 (100.0%) |
| Arts, Entertainment & Recreation | 0 (0.0%) | 0 (0.0%) |
| Accommodation & Food Services | 0 (0.0%) | 0 (0.0%) |
| Public Administration | 0 (0.0%) | 0 (0.0%) |
| Total | 7 (53.8%) | 6 (46.2%) |
Education in Myrtle
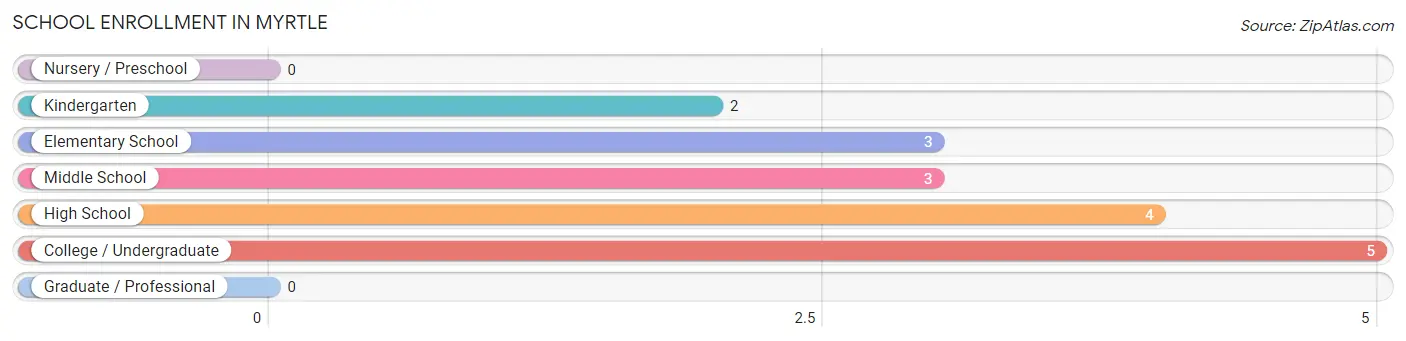
School Enrollment in Myrtle
The most common levels of schooling among the 17 students in Myrtle are college / undergraduate (5 | 29.4%), high school (4 | 23.5%), and elementary school (3 | 17.6%).
| School Level | # Students | % Students |
| Nursery / Preschool | 0 | 0.0% |
| Kindergarten | 2 | 11.8% |
| Elementary School | 3 | 17.6% |
| Middle School | 3 | 17.6% |
| High School | 4 | 23.5% |
| College / Undergraduate | 5 | 29.4% |
| Graduate / Professional | 0 | 0.0% |
| Total | 17 | 100.0% |
School Enrollment by Age by Funding Source in Myrtle
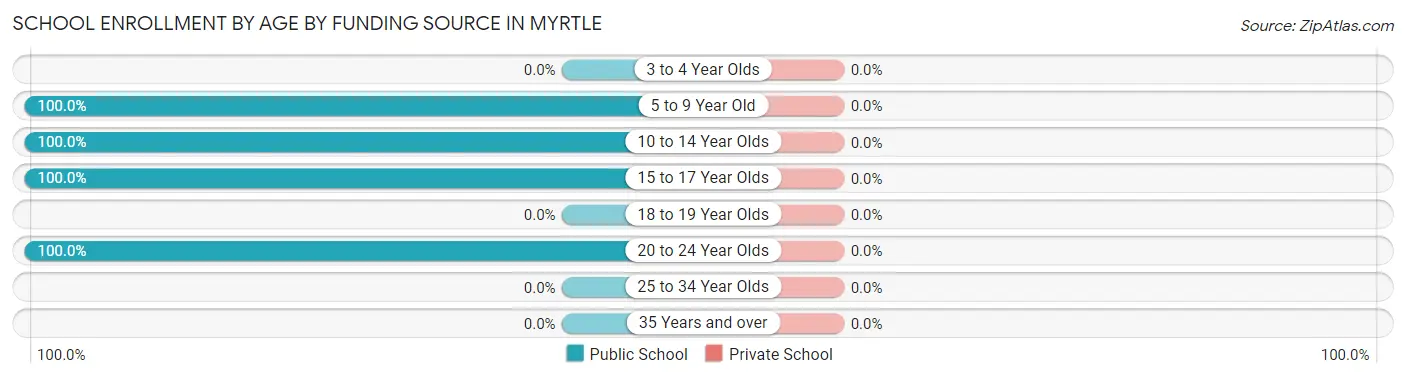
| Age Bracket | Public School | Private School |
| 3 to 4 Year Olds | 0 (0.0%) | 0 (0.0%) |
| 5 to 9 Year Old | 2 (100.0%) | 0 (0.0%) |
| 10 to 14 Year Olds | 6 (100.0%) | 0 (0.0%) |
| 15 to 17 Year Olds | 4 (100.0%) | 0 (0.0%) |
| 18 to 19 Year Olds | 0 (0.0%) | 0 (0.0%) |
| 20 to 24 Year Olds | 5 (100.0%) | 0 (0.0%) |
| 25 to 34 Year Olds | 0 (0.0%) | 0 (0.0%) |
| 35 Years and over | 0 (0.0%) | 0 (0.0%) |
| Total | 17 (100.0%) | 0 (0.0%) |
Educational Attainment by Field of Study in Myrtle
Business (4 | 57.1%), and education (3 | 42.9%) are the most common fields of study among 7 individuals in Myrtle who have obtained a bachelor's degree or higher.
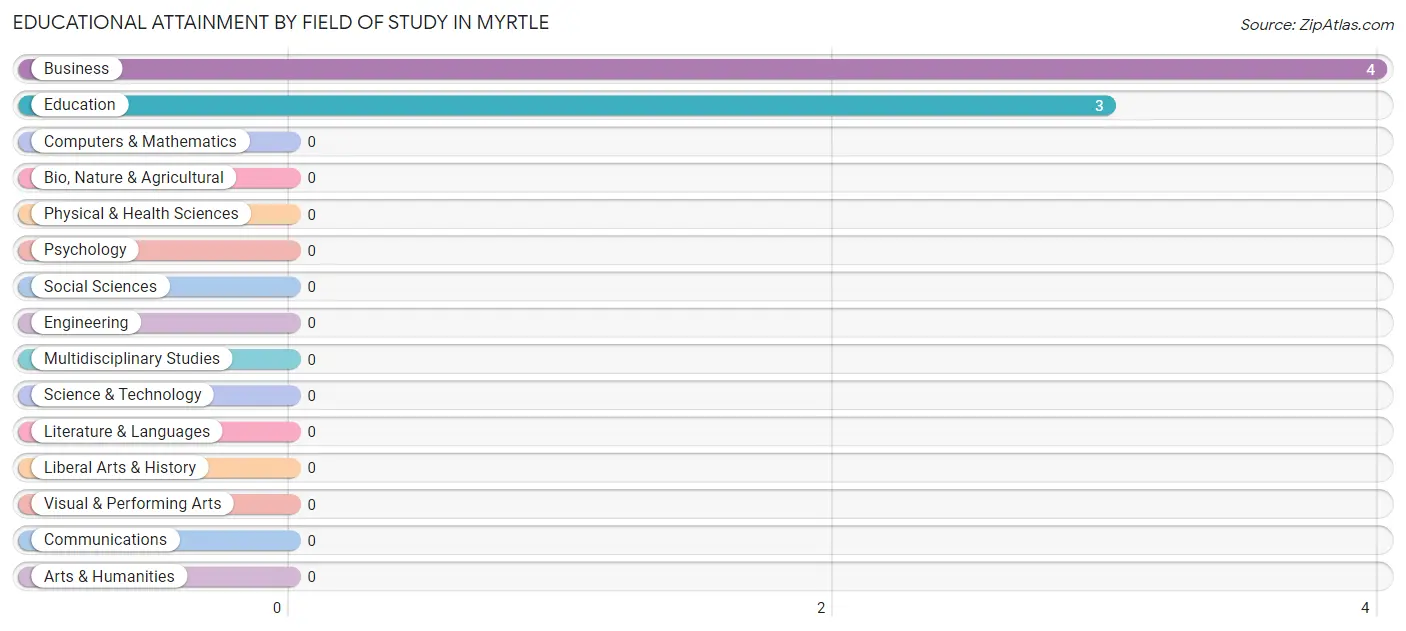
| Field of Study | # Graduates | % Graduates |
| Computers & Mathematics | 0 | 0.0% |
| Bio, Nature & Agricultural | 0 | 0.0% |
| Physical & Health Sciences | 0 | 0.0% |
| Psychology | 0 | 0.0% |
| Social Sciences | 0 | 0.0% |
| Engineering | 0 | 0.0% |
| Multidisciplinary Studies | 0 | 0.0% |
| Science & Technology | 0 | 0.0% |
| Business | 4 | 57.1% |
| Education | 3 | 42.9% |
| Literature & Languages | 0 | 0.0% |
| Liberal Arts & History | 0 | 0.0% |
| Visual & Performing Arts | 0 | 0.0% |
| Communications | 0 | 0.0% |
| Arts & Humanities | 0 | 0.0% |
| Total | 7 | 100.0% |
Transportation & Commute in Myrtle
Vehicle Availability by Sex in Myrtle
The most prevalent vehicle ownership categories in Myrtle are males with 4 vehicles (4, accounting for 57.1%) and females with 4 vehicles (3, making up 66.7%).
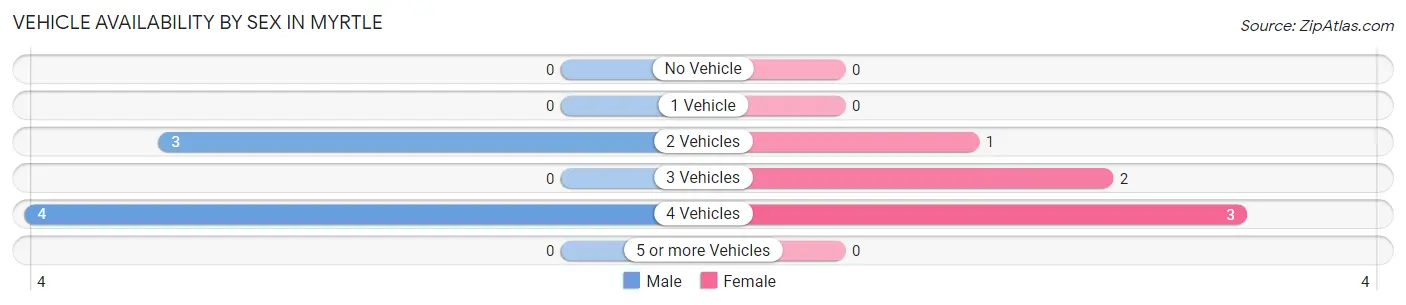
| Vehicles Available | Male | Female |
| No Vehicle | 0 (0.0%) | 0 (0.0%) |
| 1 Vehicle | 0 (0.0%) | 0 (0.0%) |
| 2 Vehicles | 3 (42.9%) | 1 (16.7%) |
| 3 Vehicles | 0 (0.0%) | 2 (33.3%) |
| 4 Vehicles | 4 (57.1%) | 3 (50.0%) |
| 5 or more Vehicles | 0 (0.0%) | 0 (0.0%) |
| Total | 7 (100.0%) | 6 (100.0%) |
Commute Time in Myrtle
The most frequently occuring commute durations in Myrtle are 20 to 24 minutes (8 commuters, 66.7%), 30 to 34 minutes (4 commuters, 33.3%), and less than 5 minutes (0 commuters, 0.0%).
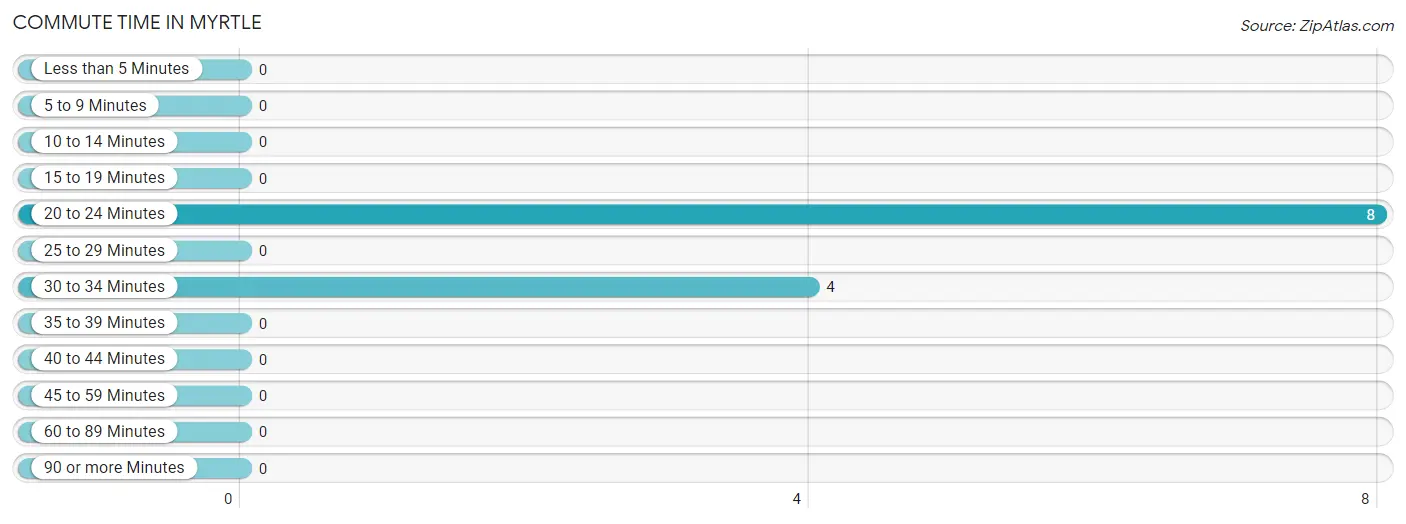
| Commute Time | # Commuters | % Commuters |
| Less than 5 Minutes | 0 | 0.0% |
| 5 to 9 Minutes | 0 | 0.0% |
| 10 to 14 Minutes | 0 | 0.0% |
| 15 to 19 Minutes | 0 | 0.0% |
| 20 to 24 Minutes | 8 | 66.7% |
| 25 to 29 Minutes | 0 | 0.0% |
| 30 to 34 Minutes | 4 | 33.3% |
| 35 to 39 Minutes | 0 | 0.0% |
| 40 to 44 Minutes | 0 | 0.0% |
| 45 to 59 Minutes | 0 | 0.0% |
| 60 to 89 Minutes | 0 | 0.0% |
| 90 or more Minutes | 0 | 0.0% |
Commute Time by Sex in Myrtle
The most common commute times in Myrtle are 20 to 24 minutes (7 commuters, 100.0%) for males and 30 to 34 minutes (4 commuters, 80.0%) for females.
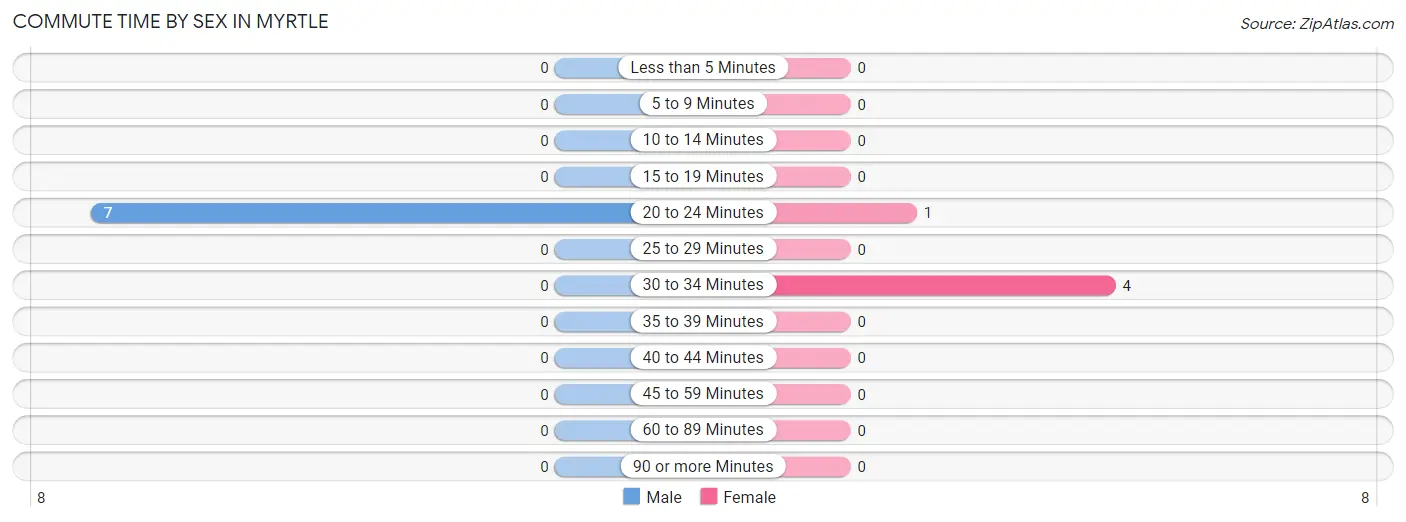
| Commute Time | Male | Female |
| Less than 5 Minutes | 0 (0.0%) | 0 (0.0%) |
| 5 to 9 Minutes | 0 (0.0%) | 0 (0.0%) |
| 10 to 14 Minutes | 0 (0.0%) | 0 (0.0%) |
| 15 to 19 Minutes | 0 (0.0%) | 0 (0.0%) |
| 20 to 24 Minutes | 7 (100.0%) | 1 (20.0%) |
| 25 to 29 Minutes | 0 (0.0%) | 0 (0.0%) |
| 30 to 34 Minutes | 0 (0.0%) | 4 (80.0%) |
| 35 to 39 Minutes | 0 (0.0%) | 0 (0.0%) |
| 40 to 44 Minutes | 0 (0.0%) | 0 (0.0%) |
| 45 to 59 Minutes | 0 (0.0%) | 0 (0.0%) |
| 60 to 89 Minutes | 0 (0.0%) | 0 (0.0%) |
| 90 or more Minutes | 0 (0.0%) | 0 (0.0%) |
Time of Departure to Work by Sex in Myrtle
The most frequent times of departure to work in Myrtle are 5:00 AM to 5:29 AM (3, 42.9%) for males and 7:00 AM to 7:29 AM (2, 40.0%) for females.
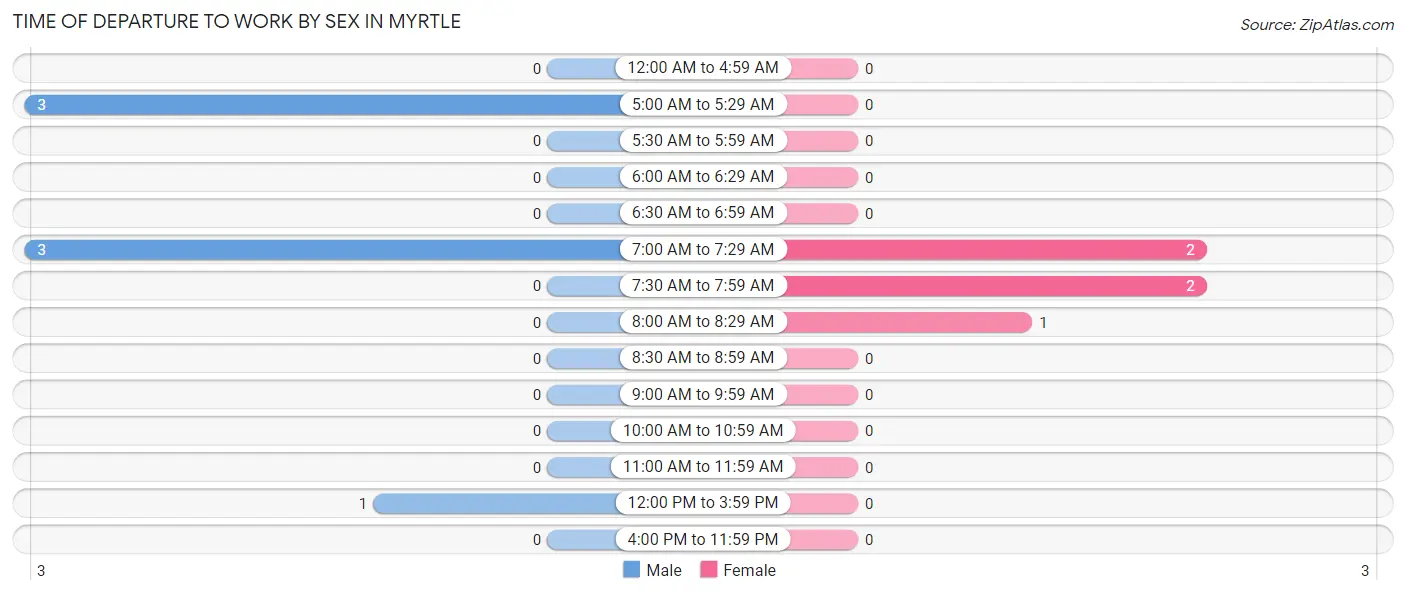
| Time of Departure | Male | Female |
| 12:00 AM to 4:59 AM | 0 (0.0%) | 0 (0.0%) |
| 5:00 AM to 5:29 AM | 3 (42.9%) | 0 (0.0%) |
| 5:30 AM to 5:59 AM | 0 (0.0%) | 0 (0.0%) |
| 6:00 AM to 6:29 AM | 0 (0.0%) | 0 (0.0%) |
| 6:30 AM to 6:59 AM | 0 (0.0%) | 0 (0.0%) |
| 7:00 AM to 7:29 AM | 3 (42.9%) | 2 (40.0%) |
| 7:30 AM to 7:59 AM | 0 (0.0%) | 2 (40.0%) |
| 8:00 AM to 8:29 AM | 0 (0.0%) | 1 (20.0%) |
| 8:30 AM to 8:59 AM | 0 (0.0%) | 0 (0.0%) |
| 9:00 AM to 9:59 AM | 0 (0.0%) | 0 (0.0%) |
| 10:00 AM to 10:59 AM | 0 (0.0%) | 0 (0.0%) |
| 11:00 AM to 11:59 AM | 0 (0.0%) | 0 (0.0%) |
| 12:00 PM to 3:59 PM | 1 (14.3%) | 0 (0.0%) |
| 4:00 PM to 11:59 PM | 0 (0.0%) | 0 (0.0%) |
| Total | 7 (100.0%) | 5 (100.0%) |
Housing Occupancy in Myrtle
Occupancy by Ownership in Myrtle
Of the total 16 dwellings in Myrtle, owner-occupied units account for 14 (87.5%), while renter-occupied units make up 2 (12.5%).
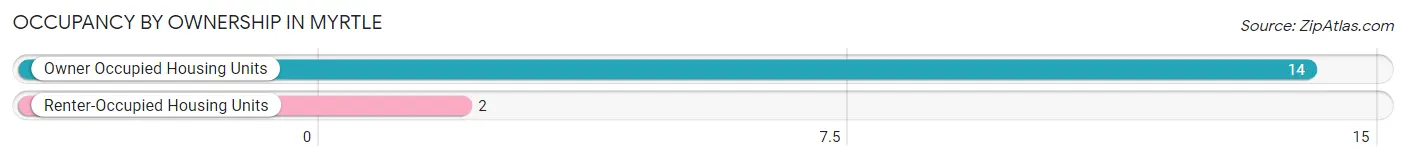
| Occupancy | # Housing Units | % Housing Units |
| Owner Occupied Housing Units | 14 | 87.5% |
| Renter-Occupied Housing Units | 2 | 12.5% |
| Total Occupied Housing Units | 16 | 100.0% |
Occupancy by Household Size in Myrtle
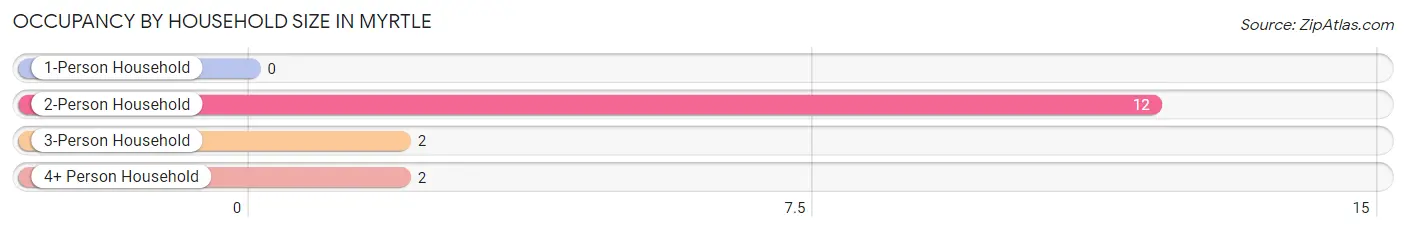
| Household Size | # Housing Units | % Housing Units |
| 1-Person Household | 0 | 0.0% |
| 2-Person Household | 12 | 75.0% |
| 3-Person Household | 2 | 12.5% |
| 4+ Person Household | 2 | 12.5% |
| Total Housing Units | 16 | 100.0% |
Occupancy by Ownership by Household Size in Myrtle
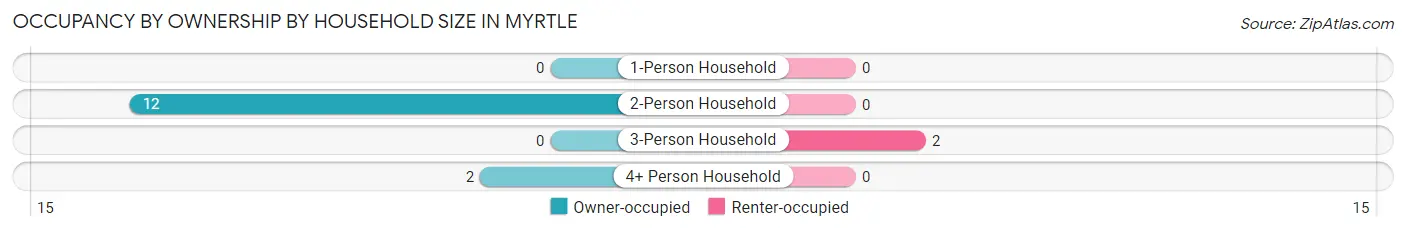
| Household Size | Owner-occupied | Renter-occupied |
| 1-Person Household | 0 (0.0%) | 0 (0.0%) |
| 2-Person Household | 12 (100.0%) | 0 (0.0%) |
| 3-Person Household | 0 (0.0%) | 2 (100.0%) |
| 4+ Person Household | 2 (100.0%) | 0 (0.0%) |
| Total Housing Units | 14 (87.5%) | 2 (12.5%) |
Occupancy by Educational Attainment in Myrtle
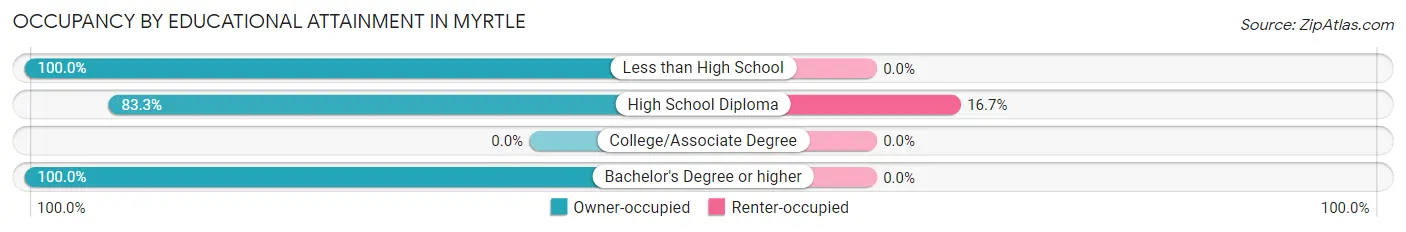
| Household Size | Owner-occupied | Renter-occupied |
| Less than High School | 1 (100.0%) | 0 (0.0%) |
| High School Diploma | 10 (83.3%) | 2 (16.7%) |
| College/Associate Degree | 0 (0.0%) | 0 (0.0%) |
| Bachelor's Degree or higher | 3 (100.0%) | 0 (0.0%) |
Occupancy by Age of Householder in Myrtle
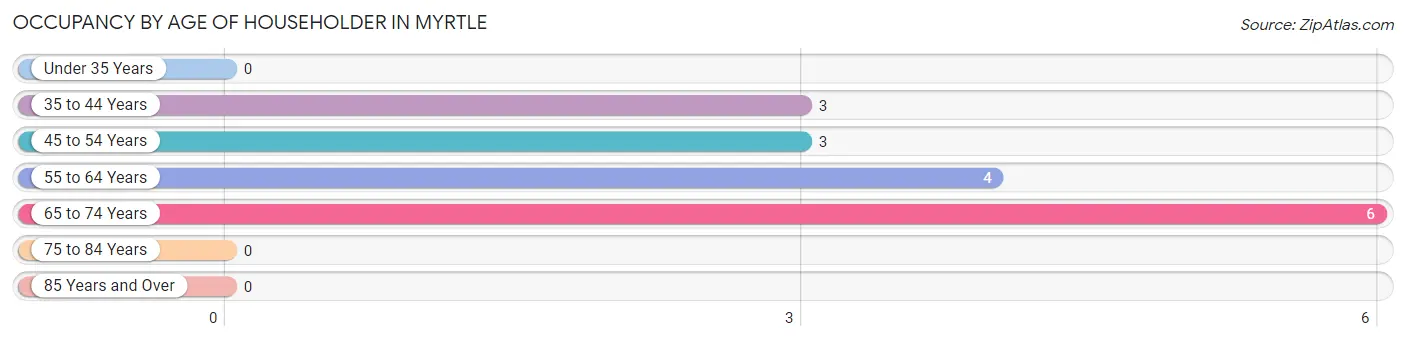
| Age Bracket | # Households | % Households |
| Under 35 Years | 0 | 0.0% |
| 35 to 44 Years | 3 | 18.8% |
| 45 to 54 Years | 3 | 18.8% |
| 55 to 64 Years | 4 | 25.0% |
| 65 to 74 Years | 6 | 37.5% |
| 75 to 84 Years | 0 | 0.0% |
| 85 Years and Over | 0 | 0.0% |
| Total | 16 | 100.0% |
Housing Finances in Myrtle
Median Income by Occupancy in Myrtle
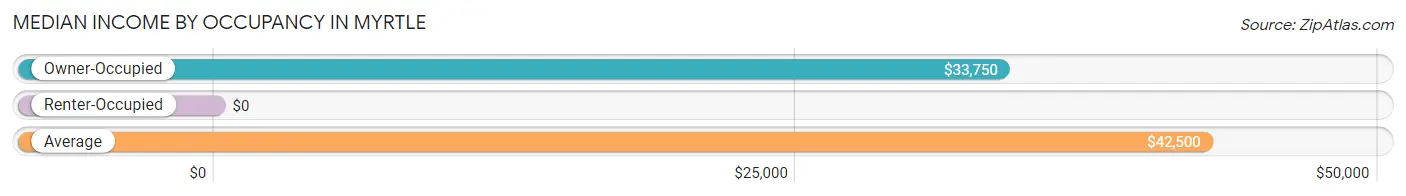
| Occupancy Type | # Households | Median Income |
| Owner-Occupied | 14 (87.5%) | $33,750 |
| Renter-Occupied | 2 (12.5%) | $0 |
| Average | 16 (100.0%) | $42,500 |
Occupancy by Householder Income Bracket in Myrtle
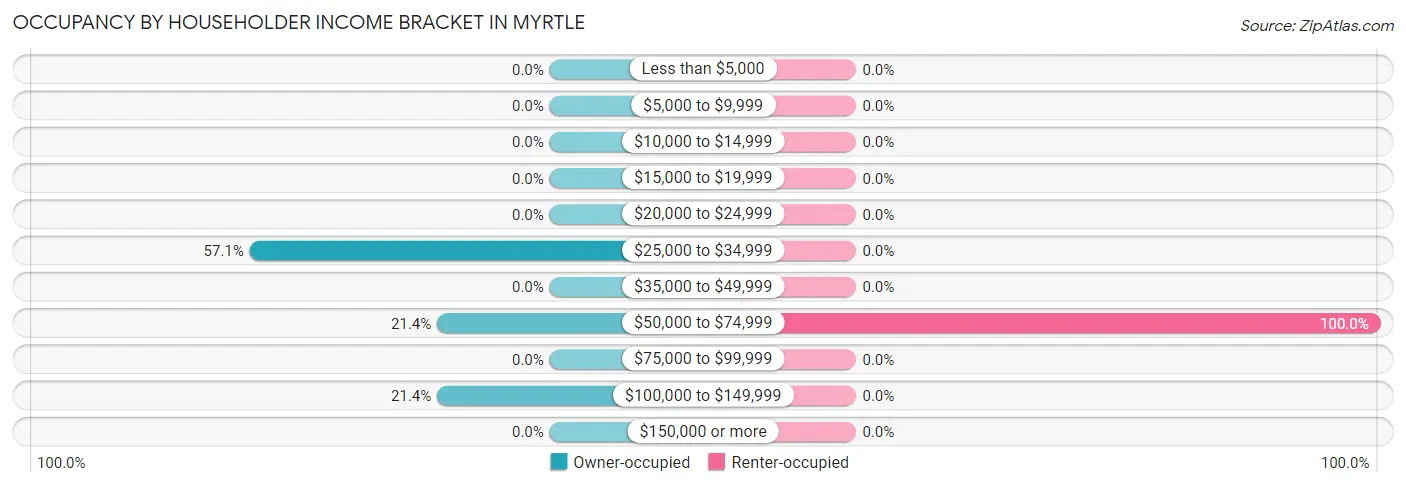
| Income Bracket | Owner-occupied | Renter-occupied |
| Less than $5,000 | 0 (0.0%) | 0 (0.0%) |
| $5,000 to $9,999 | 0 (0.0%) | 0 (0.0%) |
| $10,000 to $14,999 | 0 (0.0%) | 0 (0.0%) |
| $15,000 to $19,999 | 0 (0.0%) | 0 (0.0%) |
| $20,000 to $24,999 | 0 (0.0%) | 0 (0.0%) |
| $25,000 to $34,999 | 8 (57.1%) | 0 (0.0%) |
| $35,000 to $49,999 | 0 (0.0%) | 0 (0.0%) |
| $50,000 to $74,999 | 3 (21.4%) | 2 (100.0%) |
| $75,000 to $99,999 | 0 (0.0%) | 0 (0.0%) |
| $100,000 to $149,999 | 3 (21.4%) | 0 (0.0%) |
| $150,000 or more | 0 (0.0%) | 0 (0.0%) |
| Total | 14 (100.0%) | 2 (100.0%) |
Monthly Housing Cost Tiers in Myrtle
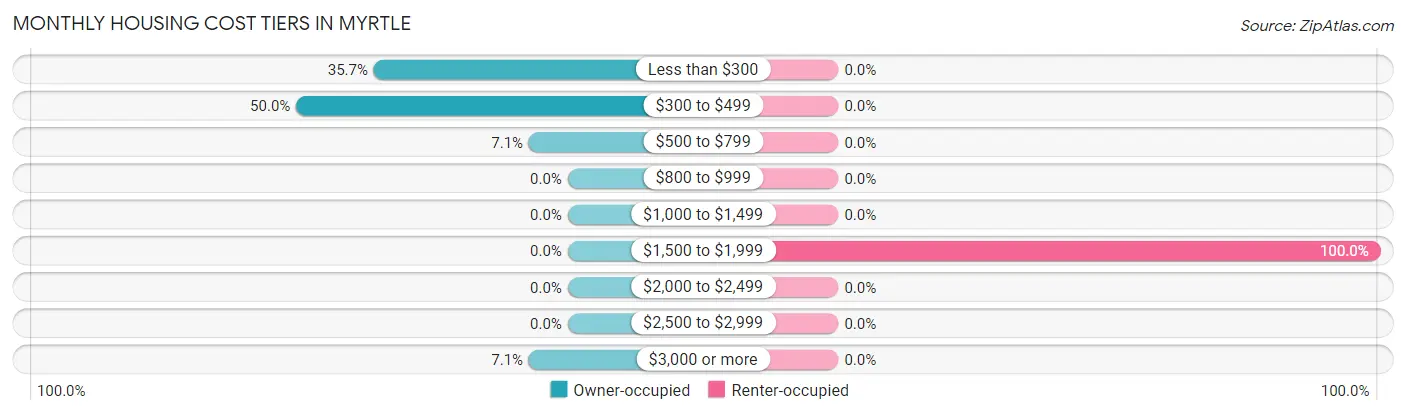
| Monthly Cost | Owner-occupied | Renter-occupied |
| Less than $300 | 5 (35.7%) | 0 (0.0%) |
| $300 to $499 | 7 (50.0%) | 0 (0.0%) |
| $500 to $799 | 1 (7.1%) | 0 (0.0%) |
| $800 to $999 | 0 (0.0%) | 0 (0.0%) |
| $1,000 to $1,499 | 0 (0.0%) | 0 (0.0%) |
| $1,500 to $1,999 | 0 (0.0%) | 2 (100.0%) |
| $2,000 to $2,499 | 0 (0.0%) | 0 (0.0%) |
| $2,500 to $2,999 | 0 (0.0%) | 0 (0.0%) |
| $3,000 or more | 1 (7.1%) | 0 (0.0%) |
| Total | 14 (100.0%) | 2 (100.0%) |
Physical Housing Characteristics in Myrtle
Housing Structures in Myrtle
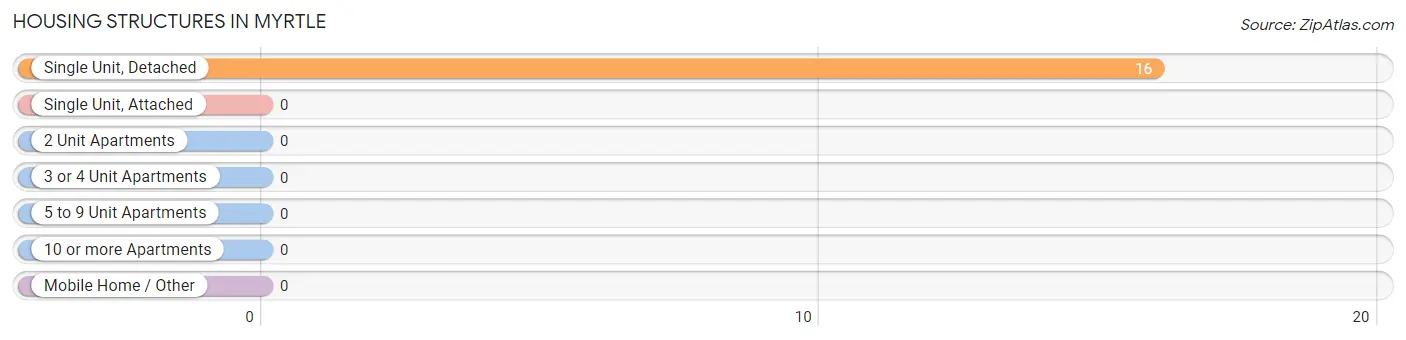
| Structure Type | # Housing Units | % Housing Units |
| Single Unit, Detached | 16 | 100.0% |
| Single Unit, Attached | 0 | 0.0% |
| 2 Unit Apartments | 0 | 0.0% |
| 3 or 4 Unit Apartments | 0 | 0.0% |
| 5 to 9 Unit Apartments | 0 | 0.0% |
| 10 or more Apartments | 0 | 0.0% |
| Mobile Home / Other | 0 | 0.0% |
| Total | 16 | 100.0% |
Housing Structures by Occupancy in Myrtle
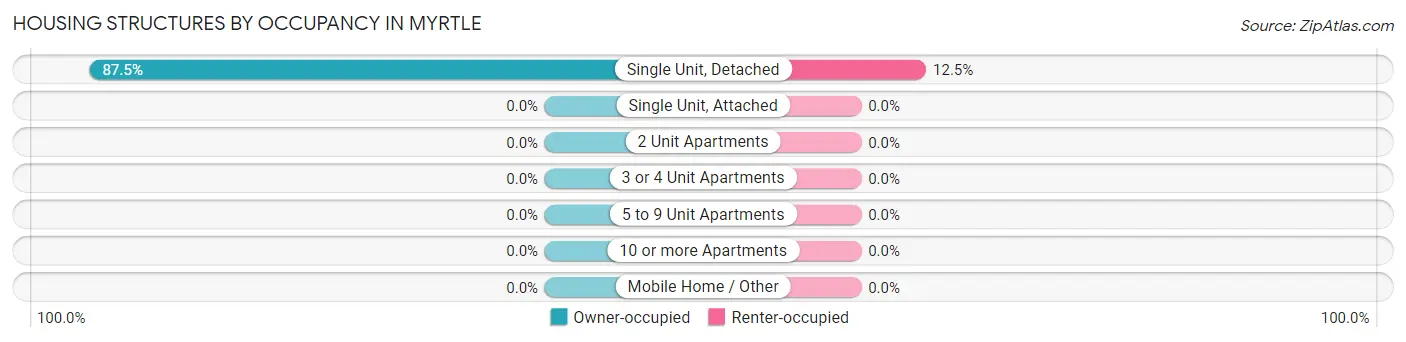
| Structure Type | Owner-occupied | Renter-occupied |
| Single Unit, Detached | 14 (87.5%) | 2 (12.5%) |
| Single Unit, Attached | 0 (0.0%) | 0 (0.0%) |
| 2 Unit Apartments | 0 (0.0%) | 0 (0.0%) |
| 3 or 4 Unit Apartments | 0 (0.0%) | 0 (0.0%) |
| 5 to 9 Unit Apartments | 0 (0.0%) | 0 (0.0%) |
| 10 or more Apartments | 0 (0.0%) | 0 (0.0%) |
| Mobile Home / Other | 0 (0.0%) | 0 (0.0%) |
| Total | 14 (87.5%) | 2 (12.5%) |
Housing Structures by Number of Rooms in Myrtle
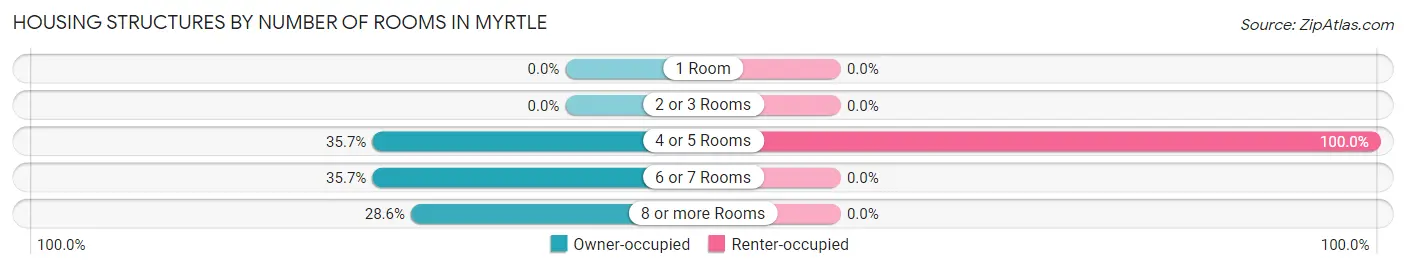
| Number of Rooms | Owner-occupied | Renter-occupied |
| 1 Room | 0 (0.0%) | 0 (0.0%) |
| 2 or 3 Rooms | 0 (0.0%) | 0 (0.0%) |
| 4 or 5 Rooms | 5 (35.7%) | 2 (100.0%) |
| 6 or 7 Rooms | 5 (35.7%) | 0 (0.0%) |
| 8 or more Rooms | 4 (28.6%) | 0 (0.0%) |
| Total | 14 (100.0%) | 2 (100.0%) |
Housing Structure by Heating Type in Myrtle
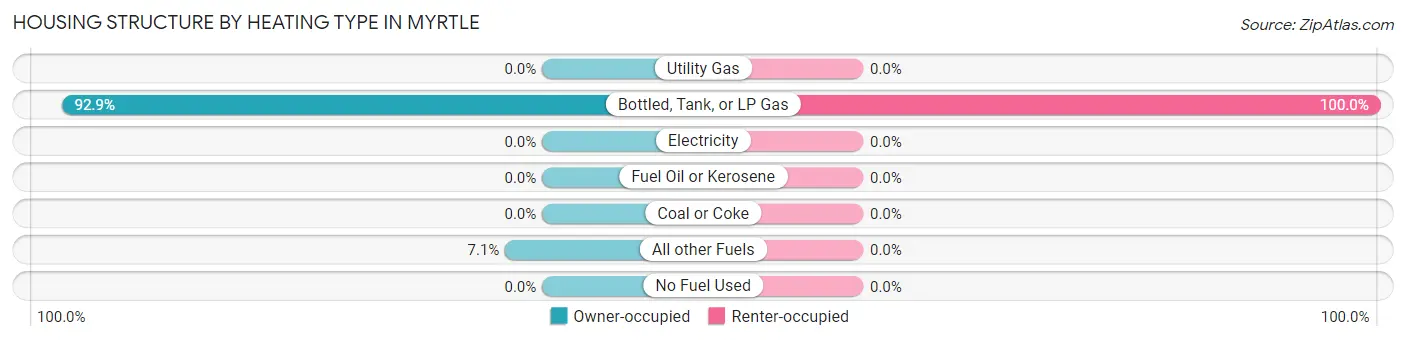
| Heating Type | Owner-occupied | Renter-occupied |
| Utility Gas | 0 (0.0%) | 0 (0.0%) |
| Bottled, Tank, or LP Gas | 13 (92.9%) | 2 (100.0%) |
| Electricity | 0 (0.0%) | 0 (0.0%) |
| Fuel Oil or Kerosene | 0 (0.0%) | 0 (0.0%) |
| Coal or Coke | 0 (0.0%) | 0 (0.0%) |
| All other Fuels | 1 (7.1%) | 0 (0.0%) |
| No Fuel Used | 0 (0.0%) | 0 (0.0%) |
| Total | 14 (100.0%) | 2 (100.0%) |
Household Vehicle Usage in Myrtle
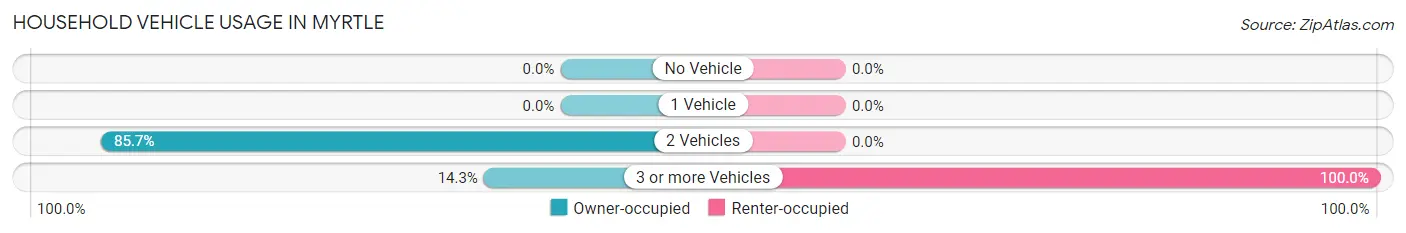
| Vehicles per Household | Owner-occupied | Renter-occupied |
| No Vehicle | 0 (0.0%) | 0 (0.0%) |
| 1 Vehicle | 0 (0.0%) | 0 (0.0%) |
| 2 Vehicles | 12 (85.7%) | 0 (0.0%) |
| 3 or more Vehicles | 2 (14.3%) | 2 (100.0%) |
| Total | 14 (100.0%) | 2 (100.0%) |
Real Estate & Mortgages in Myrtle
Real Estate and Mortgage Overview in Myrtle
| Characteristic | Without Mortgage | With Mortgage |
| Housing Units | 12 | 2 |
| Median Property Value | $56,700 | $0 |
| Median Household Income | $32,500 | $0 |
| Monthly Housing Costs | $375 | $0 |
| Real Estate Taxes | - | - |
Property Value by Mortgage Status in Myrtle
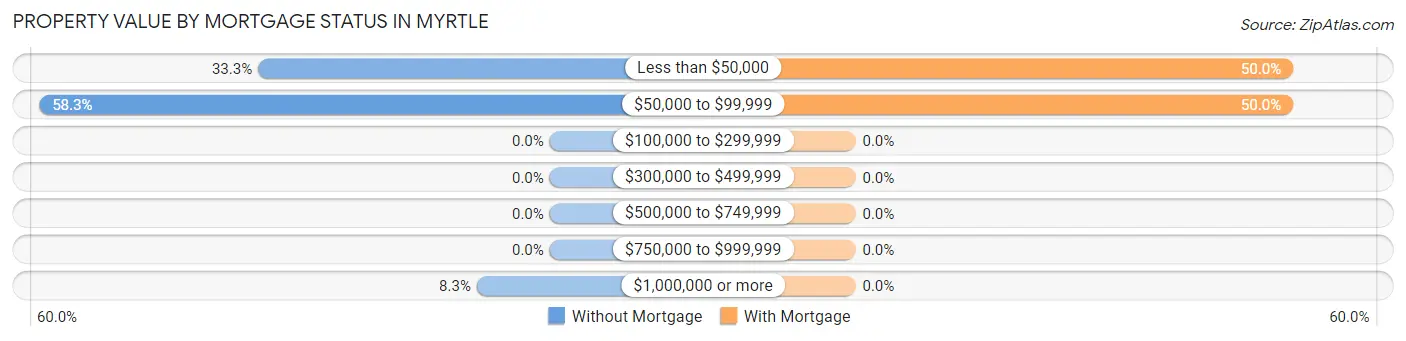
| Property Value | Without Mortgage | With Mortgage |
| Less than $50,000 | 4 (33.3%) | 1 (50.0%) |
| $50,000 to $99,999 | 7 (58.3%) | 1 (50.0%) |
| $100,000 to $299,999 | 0 (0.0%) | 0 (0.0%) |
| $300,000 to $499,999 | 0 (0.0%) | 0 (0.0%) |
| $500,000 to $749,999 | 0 (0.0%) | 0 (0.0%) |
| $750,000 to $999,999 | 0 (0.0%) | 0 (0.0%) |
| $1,000,000 or more | 1 (8.3%) | 0 (0.0%) |
| Total | 12 (100.0%) | 2 (100.0%) |
Household Income by Mortgage Status in Myrtle
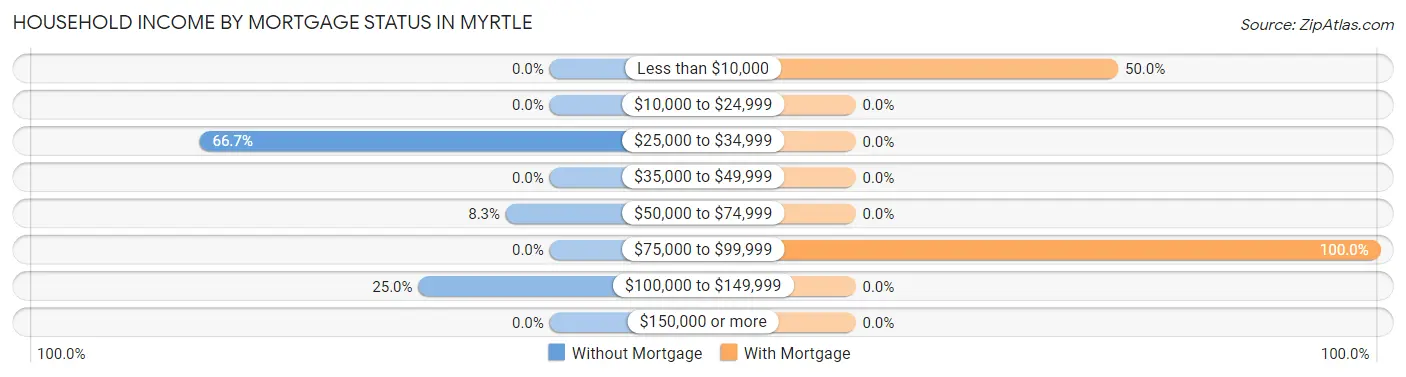
| Household Income | Without Mortgage | With Mortgage |
| Less than $10,000 | 0 (0.0%) | 1 (50.0%) |
| $10,000 to $24,999 | 0 (0.0%) | 0 (0.0%) |
| $25,000 to $34,999 | 8 (66.7%) | 0 (0.0%) |
| $35,000 to $49,999 | 0 (0.0%) | 0 (0.0%) |
| $50,000 to $74,999 | 1 (8.3%) | 0 (0.0%) |
| $75,000 to $99,999 | 0 (0.0%) | 2 (100.0%) |
| $100,000 to $149,999 | 3 (25.0%) | 0 (0.0%) |
| $150,000 or more | 0 (0.0%) | 0 (0.0%) |
| Total | 12 (100.0%) | 2 (100.0%) |
Property Value to Household Income Ratio in Myrtle
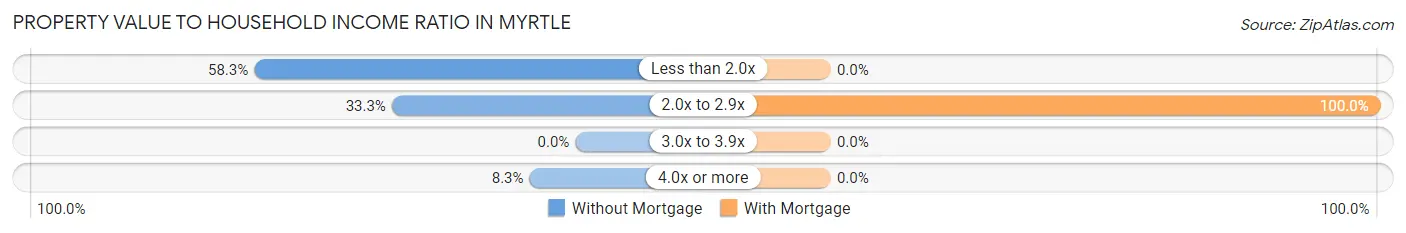
| Value-to-Income Ratio | Without Mortgage | With Mortgage |
| Less than 2.0x | 7 (58.3%) | 0 (0.0%) |
| 2.0x to 2.9x | 4 (33.3%) | 2 (100.0%) |
| 3.0x to 3.9x | 0 (0.0%) | 0 (0.0%) |
| 4.0x or more | 1 (8.3%) | 0 (0.0%) |
| Total | 12 (100.0%) | 2 (100.0%) |
Real Estate Taxes by Mortgage Status in Myrtle
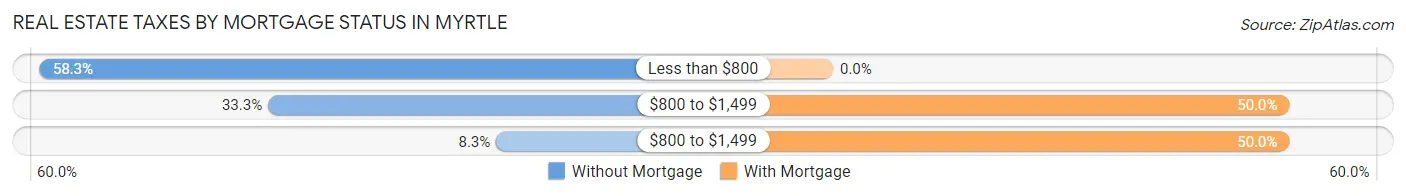
| Property Taxes | Without Mortgage | With Mortgage |
| Less than $800 | 7 (58.3%) | 0 (0.0%) |
| $800 to $1,499 | 4 (33.3%) | 1 (50.0%) |
| $800 to $1,499 | 1 (8.3%) | 1 (50.0%) |
| Total | 12 (100.0%) | 2 (100.0%) |
Health & Disability in Myrtle
Health Insurance Coverage by Age in Myrtle
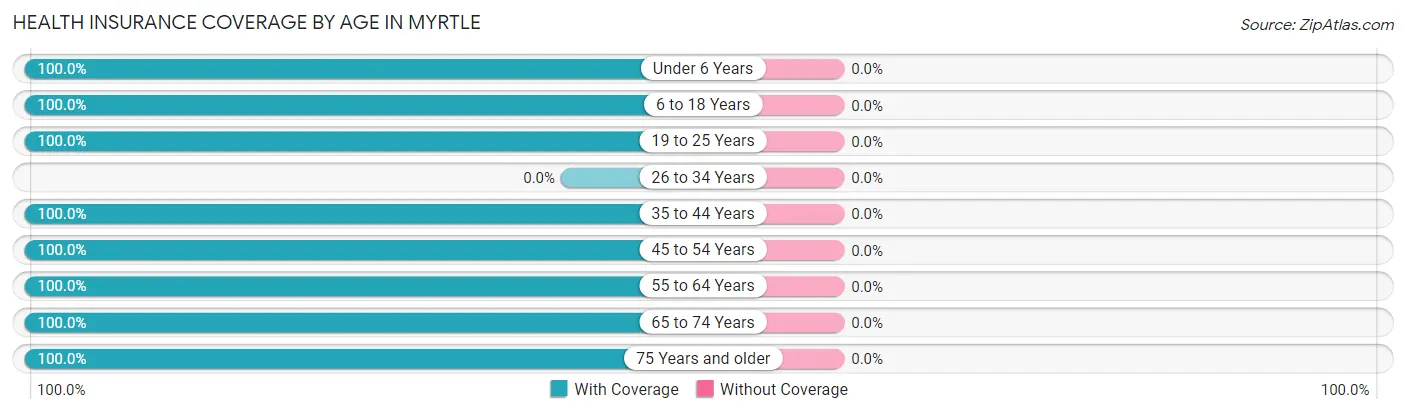
| Age Bracket | With Coverage | Without Coverage |
| Under 6 Years | 2 (100.0%) | 0 (0.0%) |
| 6 to 18 Years | 10 (100.0%) | 0 (0.0%) |
| 19 to 25 Years | 11 (100.0%) | 0 (0.0%) |
| 26 to 34 Years | 0 (0.0%) | 0 (0.0%) |
| 35 to 44 Years | 9 (100.0%) | 0 (0.0%) |
| 45 to 54 Years | 4 (100.0%) | 0 (0.0%) |
| 55 to 64 Years | 4 (100.0%) | 0 (0.0%) |
| 65 to 74 Years | 10 (100.0%) | 0 (0.0%) |
| 75 Years and older | 4 (100.0%) | 0 (0.0%) |
| Total | 54 (100.0%) | 0 (0.0%) |
Health Insurance Coverage by Citizenship Status in Myrtle
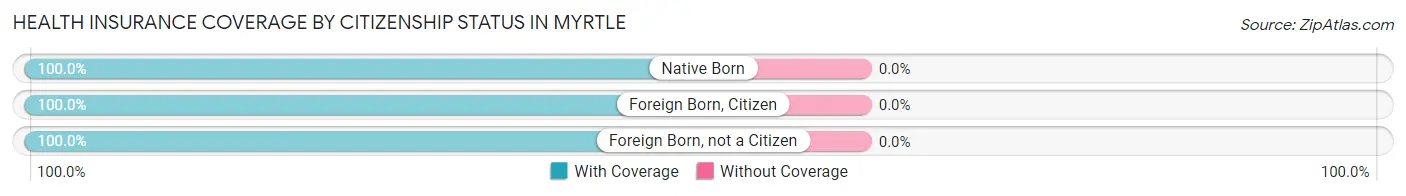
| Citizenship Status | With Coverage | Without Coverage |
| Native Born | 2 (100.0%) | 0 (0.0%) |
| Foreign Born, Citizen | 10 (100.0%) | 0 (0.0%) |
| Foreign Born, not a Citizen | 11 (100.0%) | 0 (0.0%) |
Health Insurance Coverage by Household Income in Myrtle
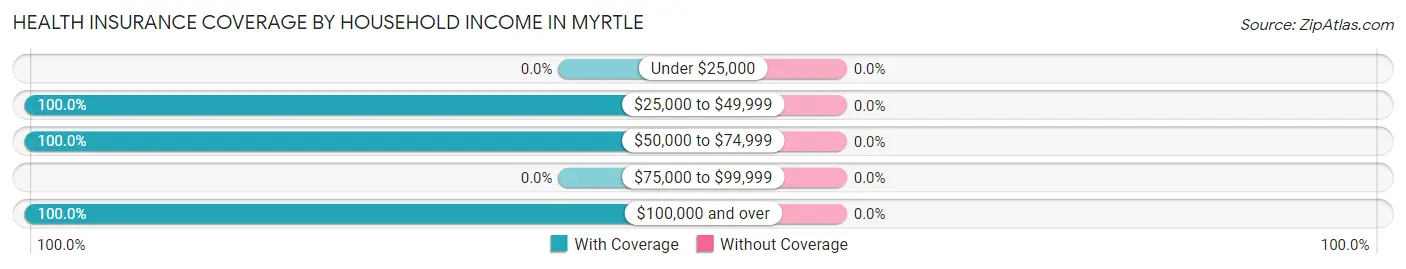
| Household Income | With Coverage | Without Coverage |
| Under $25,000 | 0 (0.0%) | 0 (0.0%) |
| $25,000 to $49,999 | 33 (100.0%) | 0 (0.0%) |
| $50,000 to $74,999 | 14 (100.0%) | 0 (0.0%) |
| $75,000 to $99,999 | 0 (0.0%) | 0 (0.0%) |
| $100,000 and over | 7 (100.0%) | 0 (0.0%) |
Public vs Private Health Insurance Coverage by Age in Myrtle
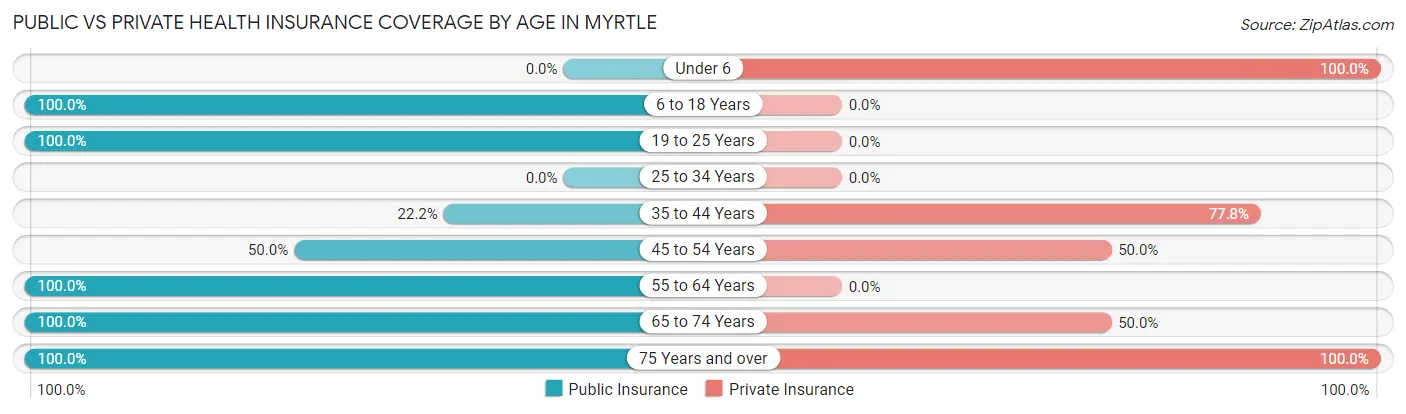
| Age Bracket | Public Insurance | Private Insurance |
| Under 6 | 0 (0.0%) | 2 (100.0%) |
| 6 to 18 Years | 10 (100.0%) | 0 (0.0%) |
| 19 to 25 Years | 11 (100.0%) | 0 (0.0%) |
| 25 to 34 Years | 0 (0.0%) | 0 (0.0%) |
| 35 to 44 Years | 2 (22.2%) | 7 (77.8%) |
| 45 to 54 Years | 2 (50.0%) | 2 (50.0%) |
| 55 to 64 Years | 4 (100.0%) | 0 (0.0%) |
| 65 to 74 Years | 10 (100.0%) | 5 (50.0%) |
| 75 Years and over | 4 (100.0%) | 4 (100.0%) |
| Total | 43 (79.6%) | 20 (37.0%) |
Disability Status by Sex by Age in Myrtle
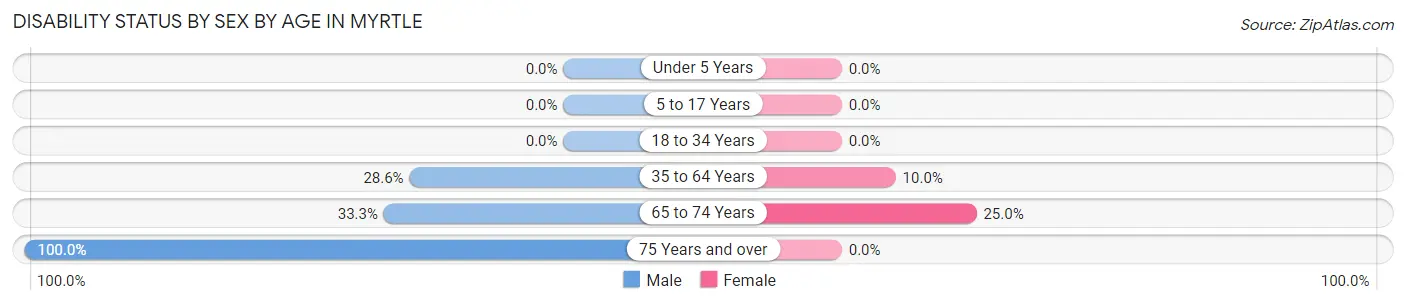
| Age Bracket | Male | Female |
| Under 5 Years | 0 (0.0%) | 0 (0.0%) |
| 5 to 17 Years | 0 (0.0%) | 0 (0.0%) |
| 18 to 34 Years | 0 (0.0%) | 0 (0.0%) |
| 35 to 64 Years | 2 (28.6%) | 1 (10.0%) |
| 65 to 74 Years | 2 (33.3%) | 1 (25.0%) |
| 75 Years and over | 4 (100.0%) | 0 (0.0%) |
Disability Class by Sex by Age in Myrtle
Disability Class: Hearing Difficulty
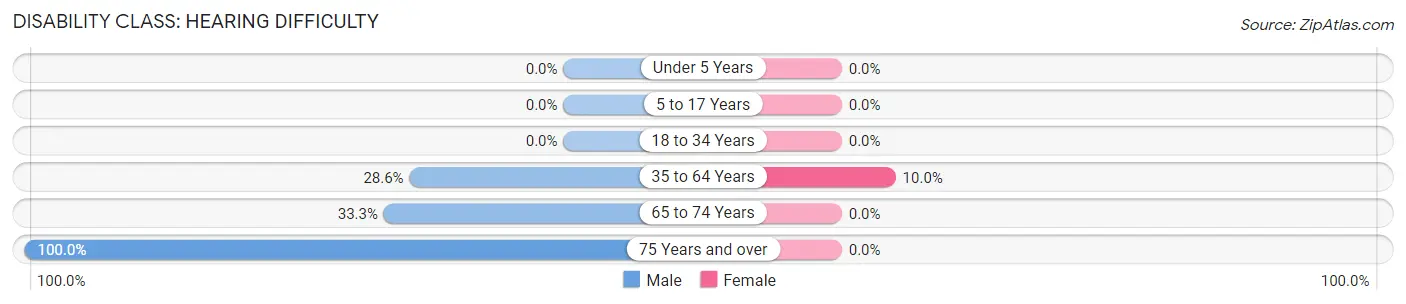
| Age Bracket | Male | Female |
| Under 5 Years | 0 (0.0%) | 0 (0.0%) |
| 5 to 17 Years | 0 (0.0%) | 0 (0.0%) |
| 18 to 34 Years | 0 (0.0%) | 0 (0.0%) |
| 35 to 64 Years | 2 (28.6%) | 1 (10.0%) |
| 65 to 74 Years | 2 (33.3%) | 0 (0.0%) |
| 75 Years and over | 4 (100.0%) | 0 (0.0%) |
Disability Class: Vision Difficulty
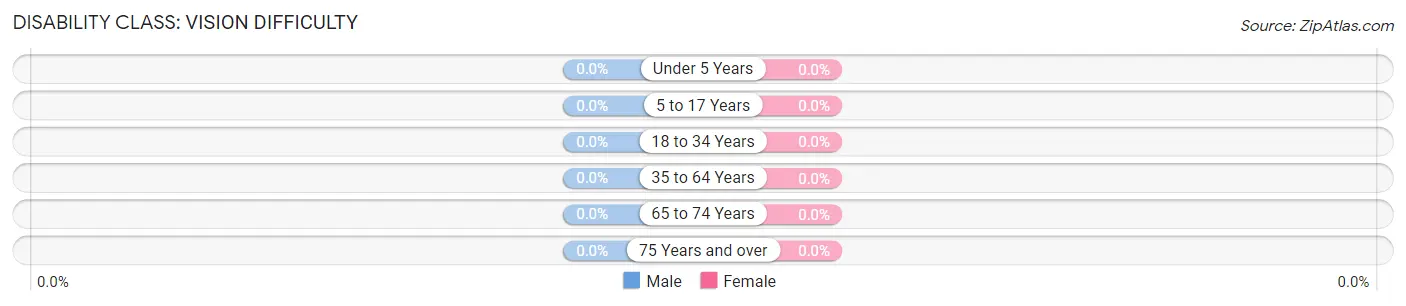
| Age Bracket | Male | Female |
| Under 5 Years | 0 (0.0%) | 0 (0.0%) |
| 5 to 17 Years | 0 (0.0%) | 0 (0.0%) |
| 18 to 34 Years | 0 (0.0%) | 0 (0.0%) |
| 35 to 64 Years | 0 (0.0%) | 0 (0.0%) |
| 65 to 74 Years | 0 (0.0%) | 0 (0.0%) |
| 75 Years and over | 0 (0.0%) | 0 (0.0%) |
Disability Class: Cognitive Difficulty
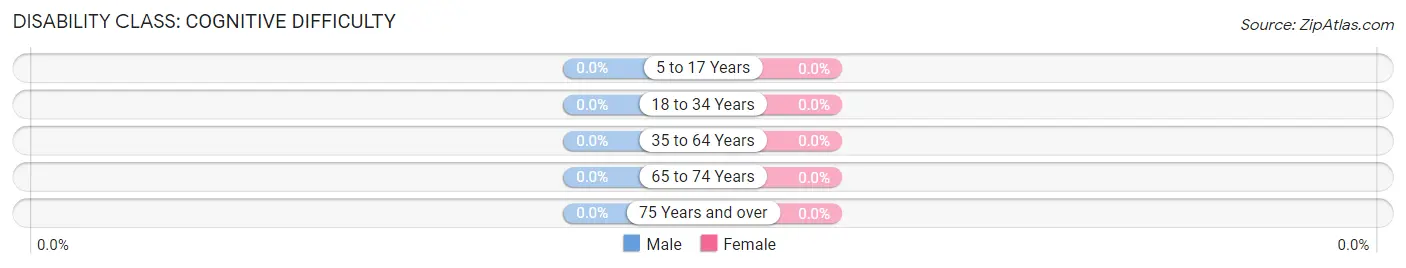
| Age Bracket | Male | Female |
| 5 to 17 Years | 0 (0.0%) | 0 (0.0%) |
| 18 to 34 Years | 0 (0.0%) | 0 (0.0%) |
| 35 to 64 Years | 0 (0.0%) | 0 (0.0%) |
| 65 to 74 Years | 0 (0.0%) | 0 (0.0%) |
| 75 Years and over | 0 (0.0%) | 0 (0.0%) |
Disability Class: Ambulatory Difficulty
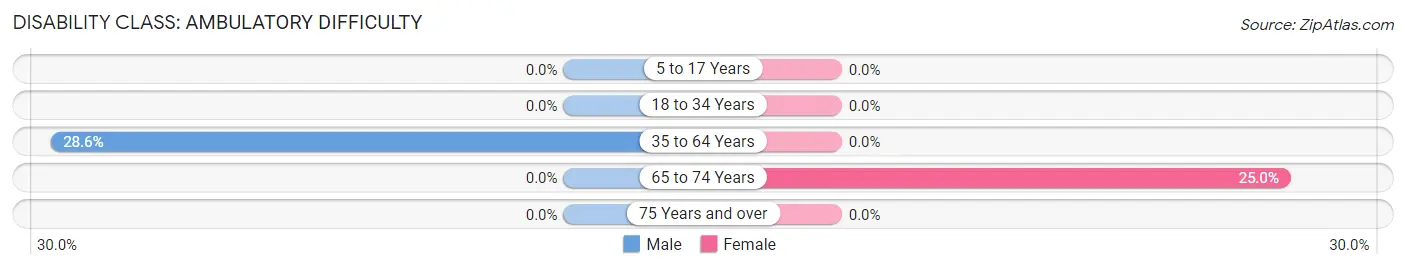
| Age Bracket | Male | Female |
| 5 to 17 Years | 0 (0.0%) | 0 (0.0%) |
| 18 to 34 Years | 0 (0.0%) | 0 (0.0%) |
| 35 to 64 Years | 2 (28.6%) | 0 (0.0%) |
| 65 to 74 Years | 0 (0.0%) | 1 (25.0%) |
| 75 Years and over | 0 (0.0%) | 0 (0.0%) |
Disability Class: Self-Care Difficulty
| Age Bracket | Male | Female |
| 5 to 17 Years | 0 (0.0%) | 0 (0.0%) |
| 18 to 34 Years | 0 (0.0%) | 0 (0.0%) |
| 35 to 64 Years | 0 (0.0%) | 0 (0.0%) |
| 65 to 74 Years | 0 (0.0%) | 0 (0.0%) |
| 75 Years and over | 0 (0.0%) | 0 (0.0%) |
Technology Access in Myrtle
Computing Device Access in Myrtle
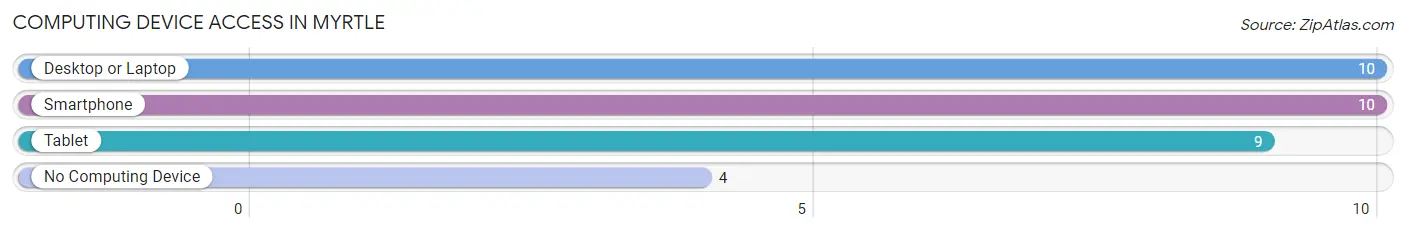
| Device Type | # Households | % Households |
| Desktop or Laptop | 10 | 62.5% |
| Smartphone | 10 | 62.5% |
| Tablet | 9 | 56.2% |
| No Computing Device | 4 | 25.0% |
| Total | 16 | 100.0% |
Internet Access in Myrtle
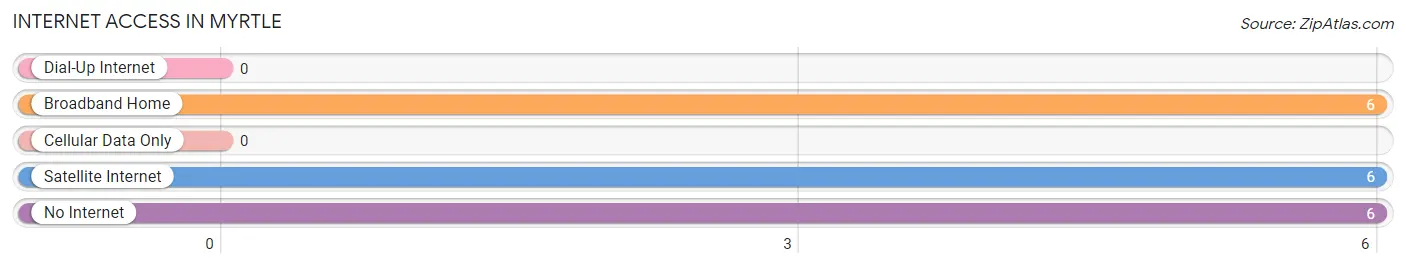
| Internet Type | # Households | % Households |
| Dial-Up Internet | 0 | 0.0% |
| Broadband Home | 6 | 37.5% |
| Cellular Data Only | 0 | 0.0% |
| Satellite Internet | 6 | 37.5% |
| No Internet | 6 | 37.5% |
| Total | 16 | 100.0% |
Myrtle Summary
Myrtle, Minnesota is a small town located in the southeastern corner of the state, near the border of Iowa. It is situated in the rolling hills of the Driftless Area, a region of the Upper Midwest that was not glaciated during the last ice age. The town is home to just over 500 people, and is known for its rural charm and friendly atmosphere.
Geography
Myrtle is located in the southeastern corner of Minnesota, near the border of Iowa. It is situated in the rolling hills of the Driftless Area, a region of the Upper Midwest that was not glaciated during the last ice age. The town is surrounded by lush farmland and rolling hills, and is located near the Root River, which is a popular destination for fishing and canoeing. The town is also located near the Mississippi River, which is a major source of recreation and commerce for the area.
The climate in Myrtle is typical of the Upper Midwest, with cold winters and hot summers. The average temperature in the winter is around 20 degrees Fahrenheit, and the average temperature in the summer is around 75 degrees Fahrenheit. The town receives an average of 33 inches of precipitation per year, with most of it falling in the form of snow in the winter months.
Economy
Myrtle’s economy is largely based on agriculture and tourism. The town is home to several small farms, which produce a variety of crops, including corn, soybeans, and hay. The town is also home to several small businesses, including a grocery store, a hardware store, and a few restaurants.
Tourism is also an important part of the local economy. The town is home to several popular attractions, including the Root River State Trail, which is a popular destination for biking and hiking. The town is also home to several historic sites, including the Myrtle Mill, which was built in 1876 and is now a museum.
Demographics
As of the 2010 census, the population of Myrtle was 514 people. The racial makeup of the town was 97.3% White, 0.6% African American, 0.2% Native American, 0.2% Asian, 0.4% from other races, and 1.3% from two or more races. Hispanic or Latino of any race were 1.2% of the population.
The median income for a household in Myrtle was $45,000, and the median income for a family was $50,000. The per capita income for the town was $20,000. About 8.3% of families and 10.2% of the population were below the poverty line, including 11.3% of those under age 18 and 8.3% of those age 65 or over.
Conclusion
Myrtle, Minnesota is a small town located in the southeastern corner of the state, near the border of Iowa. It is situated in the rolling hills of the Driftless Area, and is known for its rural charm and friendly atmosphere. The town’s economy is largely based on agriculture and tourism, and the population is mostly white. The town is home to several popular attractions, including the Root River State Trail, and is a popular destination for fishing and canoeing.
Common Questions
What is Per Capita Income in Myrtle?
Per Capita income in Myrtle is $17,898.
What is the Median Family Income in Myrtle?
Median Family Income in Myrtle is $56,250.
What is the Median Household income in Myrtle?
Median Household Income in Myrtle is $42,500.
What is Income or Wage Gap in Myrtle?
Income or Wage Gap in Myrtle is 29.1%.
Women in Myrtle earn 70.9 cents for every dollar earned by a man.
What is Inequality or Gini Index in Myrtle?
Inequality or Gini Index in Myrtle is 0.27.
What is the Total Population of Myrtle?
Total Population of Myrtle is 54.
What is the Total Male Population of Myrtle?
Total Male Population of Myrtle is 30.
What is the Total Female Population of Myrtle?
Total Female Population of Myrtle is 24.
What is the Ratio of Males per 100 Females in Myrtle?
There are 125.00 Males per 100 Females in Myrtle.
What is the Ratio of Females per 100 Males in Myrtle?
There are 80.00 Females per 100 Males in Myrtle.
What is the Median Population Age in Myrtle?
Median Population Age in Myrtle is 40.0 Years.
What is the Average Family Size in Myrtle
Average Family Size in Myrtle is 3.6 People.
What is the Average Household Size in Myrtle
Average Household Size in Myrtle is 3.4 People.
How Large is the Labor Force in Myrtle?
There are 13 People in the Labor Forcein in Myrtle.
What is the Percentage of People in the Labor Force in Myrtle?
28.3% of People are in the Labor Force in Myrtle.