Zip Codes with the Highest Percentage of Population with a Degree in Education in Minnesota
RELATED REPORTS & OPTIONS
Education
Minnesota
Compare Zip Codes
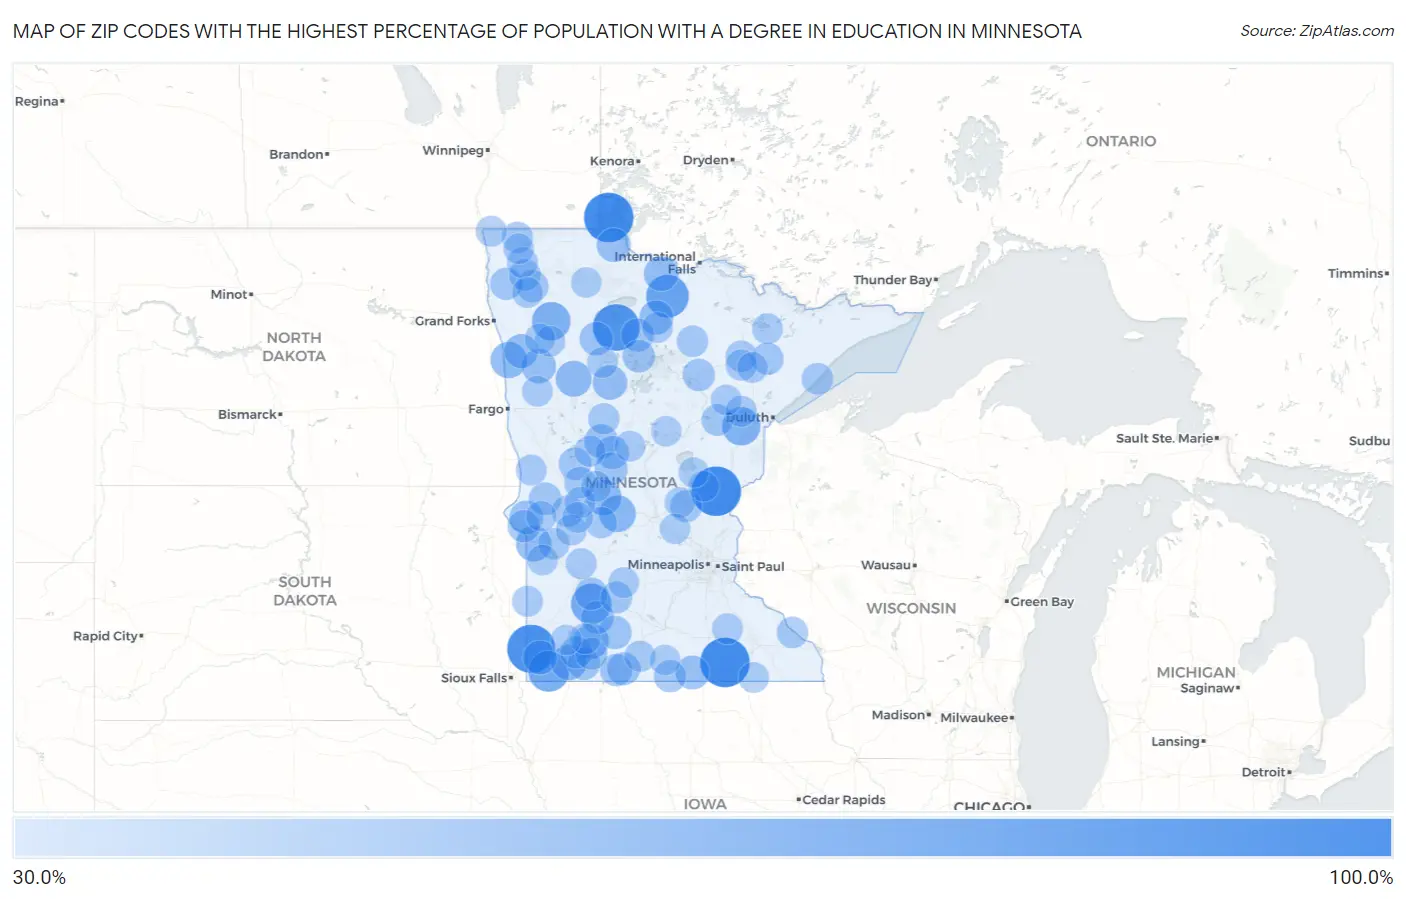
Map of Zip Codes with the Highest Percentage of Population with a Degree in Education in Minnesota
30.0%
100.0%
Zip Codes with the Highest Percentage of Population with a Degree in Education in Minnesota
| Zip Code | % Graduates | vs State | vs National | |
| 1. | 55950 | 100.0% | 12.4%(+87.6)#1 | 11.1%(+88.9)#201 |
| 2. | 56711 | 100.0% | 12.4%(+87.6)#2 | 11.1%(+88.9)#246 |
| 3. | 55036 | 100.0% | 12.4%(+87.6)#3 | 11.1%(+88.9)#280 |
| 4. | 56140 | 94.4% | 12.4%(+82.1)#4 | 11.1%(+83.4)#311 |
| 5. | 56670 | 89.3% | 12.4%(+76.9)#5 | 11.1%(+78.2)#330 |
| 6. | 56627 | 75.0% | 12.4%(+62.6)#6 | 11.1%(+63.9)#453 |
| 7. | 56158 | 67.9% | 12.4%(+55.6)#7 | 11.1%(+56.9)#542 |
| 8. | 56287 | 66.7% | 12.4%(+54.3)#8 | 11.1%(+55.6)#573 |
| 9. | 56748 | 60.0% | 12.4%(+47.6)#9 | 11.1%(+48.9)#738 |
| 10. | 55780 | 58.3% | 12.4%(+46.0)#10 | 11.1%(+47.3)#803 |
| 11. | 56335 | 52.9% | 12.4%(+40.6)#11 | 11.1%(+41.9)#1,012 |
| 12. | 56581 | 51.4% | 12.4%(+39.1)#12 | 11.1%(+40.4)#1,081 |
| 13. | 56566 | 50.0% | 12.4%(+37.6)#13 | 11.1%(+38.9)#1,159 |
| 14. | 56389 | 50.0% | 12.4%(+37.6)#14 | 11.1%(+38.9)#1,241 |
| 15. | 56276 | 48.9% | 12.4%(+36.5)#15 | 11.1%(+37.8)#1,285 |
| 16. | 56165 | 48.6% | 12.4%(+36.2)#16 | 11.1%(+37.5)#1,300 |
| 17. | 56174 | 47.6% | 12.4%(+35.3)#17 | 11.1%(+36.6)#1,361 |
| 18. | 56629 | 46.2% | 12.4%(+33.8)#18 | 11.1%(+35.1)#1,471 |
| 19. | 56458 | 45.1% | 12.4%(+32.7)#19 | 11.1%(+34.0)#1,560 |
| 20. | 56545 | 44.4% | 12.4%(+32.1)#20 | 11.1%(+33.4)#1,606 |
| 21. | 56660 | 43.8% | 12.4%(+31.4)#21 | 11.1%(+32.7)#1,687 |
| 22. | 56517 | 43.6% | 12.4%(+31.2)#22 | 11.1%(+32.5)#1,701 |
| 23. | 56134 | 43.4% | 12.4%(+31.0)#23 | 11.1%(+32.3)#1,716 |
| 24. | 56686 | 43.3% | 12.4%(+31.0)#24 | 11.1%(+32.3)#1,725 |
| 25. | 56020 | 42.9% | 12.4%(+30.5)#25 | 11.1%(+31.8)#1,785 |
| 26. | 56482 | 42.7% | 12.4%(+30.4)#26 | 11.1%(+31.7)#1,795 |
| 27. | 56240 | 42.1% | 12.4%(+29.7)#27 | 11.1%(+31.0)#1,852 |
| 28. | 56652 | 41.2% | 12.4%(+28.8)#28 | 11.1%(+30.1)#1,973 |
| 29. | 56019 | 40.7% | 12.4%(+28.4)#29 | 11.1%(+29.7)#2,042 |
| 30. | 56434 | 40.0% | 12.4%(+27.6)#30 | 11.1%(+28.9)#2,155 |
| 31. | 56294 | 40.0% | 12.4%(+27.6)#31 | 11.1%(+28.9)#2,175 |
| 32. | 56630 | 39.9% | 12.4%(+27.6)#32 | 11.1%(+28.9)#2,187 |
| 33. | 56440 | 39.3% | 12.4%(+27.0)#33 | 11.1%(+28.3)#2,254 |
| 34. | 56171 | 39.0% | 12.4%(+26.6)#34 | 11.1%(+27.9)#2,317 |
| 35. | 56663 | 38.1% | 12.4%(+25.7)#35 | 11.1%(+27.0)#2,463 |
| 36. | 56214 | 38.0% | 12.4%(+25.7)#36 | 11.1%(+27.0)#2,475 |
| 37. | 56248 | 38.0% | 12.4%(+25.6)#37 | 11.1%(+26.9)#2,484 |
| 38. | 56111 | 37.7% | 12.4%(+25.4)#38 | 11.1%(+26.7)#2,527 |
| 39. | 56225 | 37.7% | 12.4%(+25.4)#39 | 11.1%(+26.7)#2,529 |
| 40. | 56119 | 37.7% | 12.4%(+25.4)#40 | 11.1%(+26.7)#2,531 |
| 41. | 56524 | 37.7% | 12.4%(+25.4)#41 | 11.1%(+26.7)#2,532 |
| 42. | 55722 | 37.4% | 12.4%(+25.0)#42 | 11.1%(+26.3)#2,599 |
| 43. | 56713 | 37.3% | 12.4%(+25.0)#43 | 11.1%(+26.3)#2,601 |
| 44. | 55705 | 36.9% | 12.4%(+24.5)#44 | 11.1%(+25.8)#2,684 |
| 45. | 56033 | 36.7% | 12.4%(+24.4)#45 | 11.1%(+25.7)#2,709 |
| 46. | 56131 | 36.5% | 12.4%(+24.2)#46 | 11.1%(+25.5)#2,734 |
| 47. | 56738 | 36.4% | 12.4%(+24.0)#47 | 11.1%(+25.3)#2,759 |
| 48. | 56363 | 36.0% | 12.4%(+23.6)#48 | 11.1%(+24.9)#2,825 |
| 49. | 56137 | 35.7% | 12.4%(+23.4)#49 | 11.1%(+24.7)#2,873 |
| 50. | 55333 | 35.7% | 12.4%(+23.4)#50 | 11.1%(+24.7)#2,875 |
| 51. | 55787 | 35.3% | 12.4%(+22.9)#51 | 11.1%(+24.2)#2,957 |
| 52. | 56758 | 35.0% | 12.4%(+22.6)#52 | 11.1%(+23.9)#3,016 |
| 53. | 56323 | 34.9% | 12.4%(+22.6)#53 | 11.1%(+23.9)#3,039 |
| 54. | 55601 | 34.6% | 12.4%(+22.3)#54 | 11.1%(+23.6)#3,125 |
| 55. | 56332 | 34.3% | 12.4%(+21.9)#55 | 11.1%(+23.2)#3,201 |
| 56. | 56316 | 34.2% | 12.4%(+21.8)#56 | 11.1%(+23.1)#3,228 |
| 57. | 56628 | 34.1% | 12.4%(+21.7)#57 | 11.1%(+23.0)#3,249 |
| 58. | 55959 | 34.0% | 12.4%(+21.6)#58 | 11.1%(+22.9)#3,272 |
| 59. | 56208 | 33.8% | 12.4%(+21.4)#59 | 11.1%(+22.7)#3,326 |
| 60. | 55768 | 33.6% | 12.4%(+21.3)#60 | 11.1%(+22.6)#3,365 |
| 61. | 56735 | 33.3% | 12.4%(+21.0)#61 | 11.1%(+22.3)#3,433 |
| 62. | 56464 | 33.1% | 12.4%(+20.8)#62 | 11.1%(+22.1)#3,528 |
| 63. | 55751 | 33.1% | 12.4%(+20.8)#63 | 11.1%(+22.1)#3,530 |
| 64. | 56527 | 32.9% | 12.4%(+20.5)#64 | 11.1%(+21.8)#3,588 |
| 65. | 56349 | 32.8% | 12.4%(+20.4)#65 | 11.1%(+21.7)#3,615 |
| 66. | 56088 | 32.7% | 12.4%(+20.4)#66 | 11.1%(+21.7)#3,623 |
| 67. | 55711 | 32.5% | 12.4%(+20.1)#67 | 11.1%(+21.4)#3,679 |
| 68. | 55985 | 32.4% | 12.4%(+20.1)#68 | 11.1%(+21.4)#3,702 |
| 69. | 56678 | 32.3% | 12.4%(+20.0)#69 | 11.1%(+21.3)#3,730 |
| 70. | 56260 | 32.3% | 12.4%(+19.9)#70 | 11.1%(+21.2)#3,750 |
| 71. | 56732 | 32.2% | 12.4%(+19.9)#71 | 11.1%(+21.2)#3,760 |
| 72. | 56136 | 32.2% | 12.4%(+19.9)#72 | 11.1%(+21.2)#3,768 |
| 73. | 56226 | 32.1% | 12.4%(+19.8)#73 | 11.1%(+21.1)#3,794 |
| 74. | 56183 | 32.0% | 12.4%(+19.7)#74 | 11.1%(+21.0)#3,817 |
| 75. | 56755 | 32.0% | 12.4%(+19.6)#75 | 11.1%(+20.9)#3,838 |
| 76. | 56522 | 31.9% | 12.4%(+19.6)#76 | 11.1%(+20.9)#3,857 |
| 77. | 56381 | 31.9% | 12.4%(+19.5)#77 | 11.1%(+20.8)#3,875 |
| 78. | 55342 | 31.7% | 12.4%(+19.4)#78 | 11.1%(+20.7)#3,905 |
| 79. | 56466 | 31.7% | 12.4%(+19.4)#79 | 11.1%(+20.7)#3,911 |
| 80. | 55734 | 31.7% | 12.4%(+19.4)#80 | 11.1%(+20.7)#3,912 |
| 81. | 55736 | 31.7% | 12.4%(+19.4)#81 | 11.1%(+20.6)#3,917 |
| 82. | 55782 | 31.7% | 12.4%(+19.3)#82 | 11.1%(+20.6)#3,926 |
| 83. | 56661 | 31.6% | 12.4%(+19.2)#83 | 11.1%(+20.5)#3,941 |
| 84. | 56585 | 31.5% | 12.4%(+19.2)#84 | 11.1%(+20.5)#3,956 |
| 85. | 56535 | 31.5% | 12.4%(+19.1)#85 | 11.1%(+20.4)#3,968 |
| 86. | 56256 | 31.5% | 12.4%(+19.1)#86 | 11.1%(+20.4)#3,974 |
| 87. | 56734 | 31.5% | 12.4%(+19.1)#87 | 11.1%(+20.4)#3,979 |
| 88. | 56760 | 31.4% | 12.4%(+19.1)#88 | 11.1%(+20.4)#3,993 |
| 89. | 56355 | 31.3% | 12.4%(+19.0)#89 | 11.1%(+20.3)#4,019 |
| 90. | 56330 | 31.3% | 12.4%(+19.0)#90 | 11.1%(+20.3)#4,023 |
| 91. | 55051 | 31.2% | 12.4%(+18.8)#91 | 11.1%(+20.1)#4,071 |
| 92. | 56172 | 31.1% | 12.4%(+18.7)#92 | 11.1%(+20.0)#4,101 |
| 93. | 56023 | 30.9% | 12.4%(+18.6)#93 | 11.1%(+19.9)#4,155 |
| 94. | 55951 | 30.9% | 12.4%(+18.5)#94 | 11.1%(+19.8)#4,170 |
| 95. | 56221 | 30.6% | 12.4%(+18.3)#95 | 11.1%(+19.6)#4,244 |
| 96. | 55308 | 30.5% | 12.4%(+18.1)#96 | 11.1%(+19.4)#4,297 |
| 97. | 56736 | 30.5% | 12.4%(+18.1)#97 | 11.1%(+19.4)#4,307 |
| 98. | 56441 | 30.4% | 12.4%(+18.1)#98 | 11.1%(+19.4)#4,328 |
| 99. | 56727 | 30.4% | 12.4%(+18.0)#99 | 11.1%(+19.3)#4,351 |
| 100. | 56386 | 30.3% | 12.4%(+18.0)#100 | 11.1%(+19.3)#4,357 |
Common Questions
What are the Top 10 Zip Codes with the Highest Percentage of Population with a Degree in Education in Minnesota?
Top 10 Zip Codes with the Highest Percentage of Population with a Degree in Education in Minnesota are:
What zip code has the Highest Percentage of Population with a Degree in Education in Minnesota?
55950 has the Highest Percentage of Population with a Degree in Education in Minnesota with 100.0%.
What is the Percentage of Population with a Degree in Education in the State of Minnesota?
Percentage of Population with a Degree in Education in Minnesota is 12.4%.
What is the Percentage of Population with a Degree in Education in the United States?
Percentage of Population with a Degree in Education in the United States is 11.1%.