Kamiah, ID Map & Demographics
Kamiah Map
Kamiah Overview
$23,036
PER CAPITA INCOME
$47,917
AVG FAMILY INCOME
$34,803
AVG HOUSEHOLD INCOME
42.1%
WAGE / INCOME GAP [ % ]
57.9¢/ $1
WAGE / INCOME GAP [ $ ]
0.44
INEQUALITY / GINI INDEX
1,210
TOTAL POPULATION
554
MALE POPULATION
656
FEMALE POPULATION
84.45
MALES / 100 FEMALES
118.41
FEMALES / 100 MALES
48.7
MEDIAN AGE
3.0
AVG FAMILY SIZE
2.1
AVG HOUSEHOLD SIZE
460
LABOR FORCE [ PEOPLE ]
46.6%
PERCENT IN LABOR FORCE
6.1%
UNEMPLOYMENT RATE
Kamiah Zip Codes
Kamiah Area Codes
Income in Kamiah
Income Overview in Kamiah
Per Capita Income in Kamiah is $23,036, while median incomes of families and households are $47,917 and $34,803 respectively.
| Characteristic | Number | Measure |
| Per Capita Income | 1,210 | $23,036 |
| Median Family Income | 271 | $47,917 |
| Mean Family Income | 271 | $63,351 |
| Median Household Income | 579 | $34,803 |
| Mean Household Income | 579 | $49,156 |
| Income Deficit | 271 | $0 |
| Wage / Income Gap (%) | 1,210 | 42.10% |
| Wage / Income Gap ($) | 1,210 | 57.90¢ per $1 |
| Gini / Inequality Index | 1,210 | 0.44 |
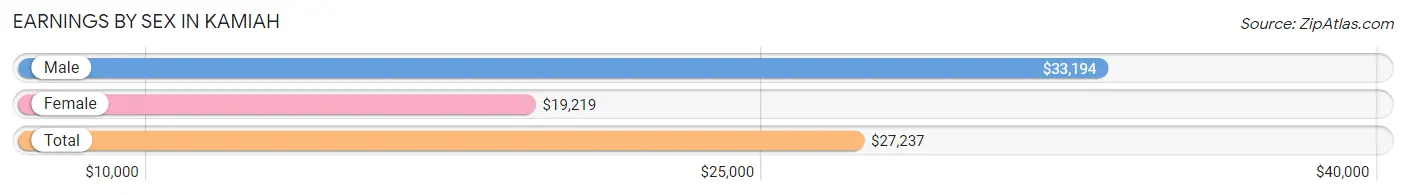
Earnings by Sex in Kamiah
Average Earnings in Kamiah are $27,237, $33,194 for men and $19,219 for women, a difference of 42.1%.
| Sex | Number | Average Earnings |
| Male | 261 (55.5%) | $33,194 |
| Female | 209 (44.5%) | $19,219 |
| Total | 470 (100.0%) | $27,237 |
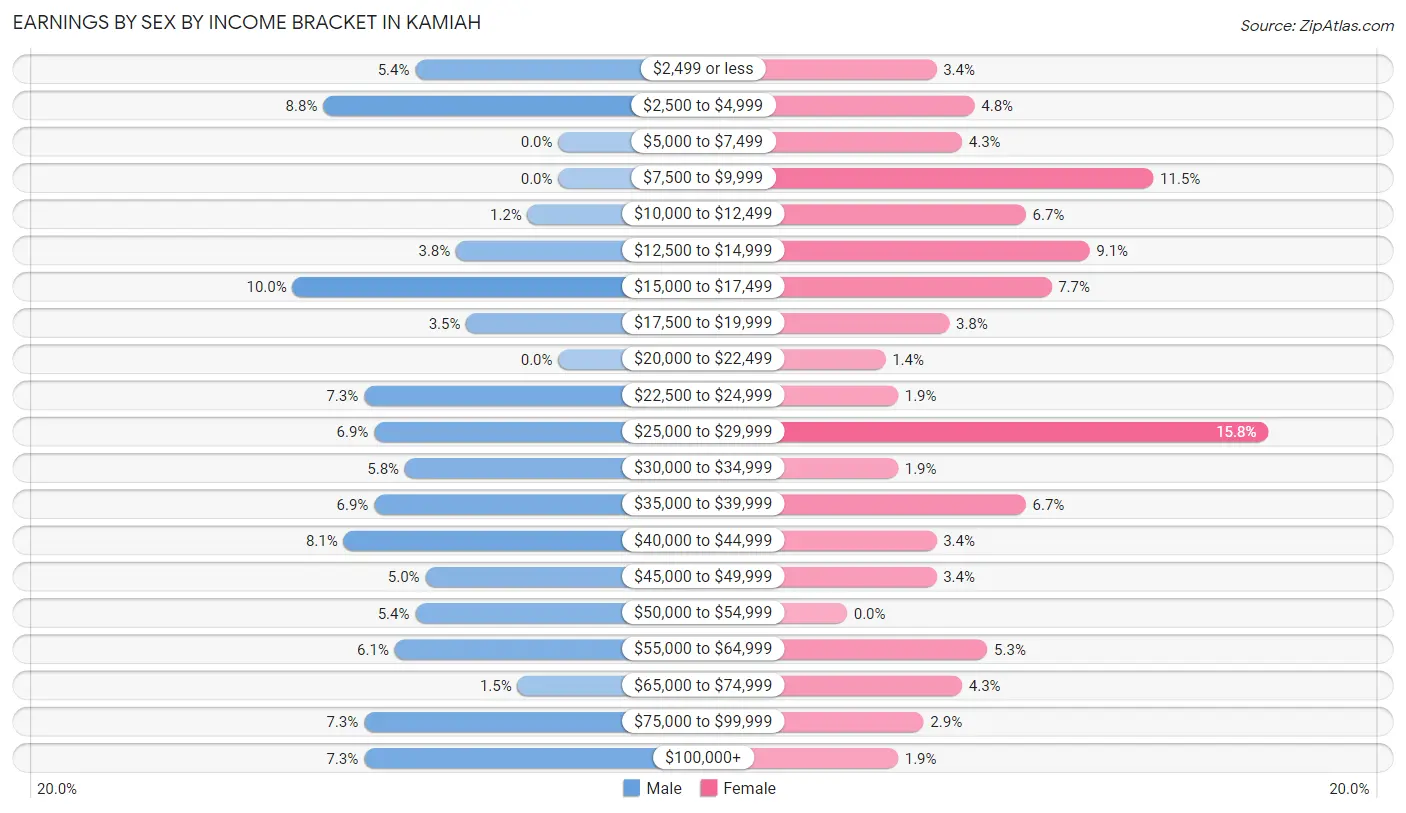
Earnings by Sex by Income Bracket in Kamiah
The most common earnings brackets in Kamiah are $15,000 to $17,499 for men (26 | 10.0%) and $25,000 to $29,999 for women (33 | 15.8%).
| Income | Male | Female |
| $2,499 or less | 14 (5.4%) | 7 (3.4%) |
| $2,500 to $4,999 | 23 (8.8%) | 10 (4.8%) |
| $5,000 to $7,499 | 0 (0.0%) | 9 (4.3%) |
| $7,500 to $9,999 | 0 (0.0%) | 24 (11.5%) |
| $10,000 to $12,499 | 3 (1.1%) | 14 (6.7%) |
| $12,500 to $14,999 | 10 (3.8%) | 19 (9.1%) |
| $15,000 to $17,499 | 26 (10.0%) | 16 (7.7%) |
| $17,500 to $19,999 | 9 (3.5%) | 8 (3.8%) |
| $20,000 to $22,499 | 0 (0.0%) | 3 (1.4%) |
| $22,500 to $24,999 | 19 (7.3%) | 4 (1.9%) |
| $25,000 to $29,999 | 18 (6.9%) | 33 (15.8%) |
| $30,000 to $34,999 | 15 (5.8%) | 4 (1.9%) |
| $35,000 to $39,999 | 18 (6.9%) | 14 (6.7%) |
| $40,000 to $44,999 | 21 (8.1%) | 7 (3.4%) |
| $45,000 to $49,999 | 13 (5.0%) | 7 (3.4%) |
| $50,000 to $54,999 | 14 (5.4%) | 0 (0.0%) |
| $55,000 to $64,999 | 16 (6.1%) | 11 (5.3%) |
| $65,000 to $74,999 | 4 (1.5%) | 9 (4.3%) |
| $75,000 to $99,999 | 19 (7.3%) | 6 (2.9%) |
| $100,000+ | 19 (7.3%) | 4 (1.9%) |
| Total | 261 (100.0%) | 209 (100.0%) |
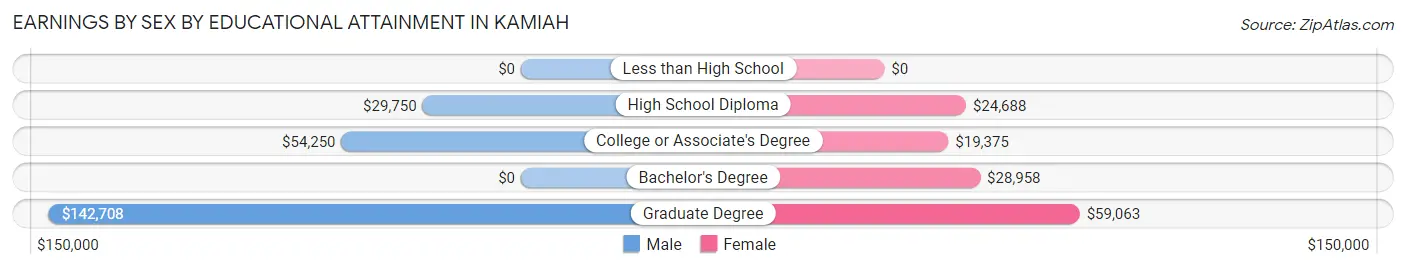
Earnings by Sex by Educational Attainment in Kamiah
Average earnings in Kamiah are $38,958 for men and $25,288 for women, a difference of 35.1%. Men with an educational attainment of graduate degree enjoy the highest average annual earnings of $142,708, while those with high school diploma education earn the least with $29,750. Women with an educational attainment of graduate degree earn the most with the average annual earnings of $59,063, while those with college or associate's degree education have the smallest earnings of $19,375.
| Educational Attainment | Male Income | Female Income |
| Less than High School | - | - |
| High School Diploma | $29,750 | $24,688 |
| College or Associate's Degree | $54,250 | $19,375 |
| Bachelor's Degree | - | - |
| Graduate Degree | $142,708 | $59,063 |
| Total | $38,958 | $25,288 |
Family Income in Kamiah
Family Income Brackets in Kamiah
According to the Kamiah family income data, there are 53 families falling into the $35,000 to $49,999 income range, which is the most common income bracket and makes up 19.6% of all families. Conversely, the $10,000 to $14,999 income bracket is the least frequent group with only 5 families (1.8%) belonging to this category.
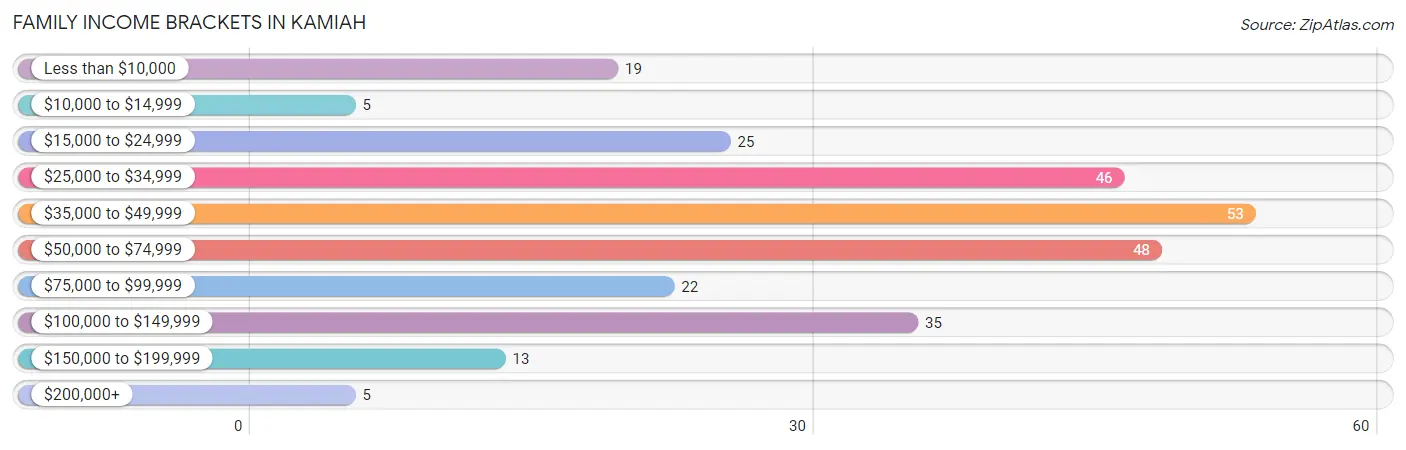
| Income Bracket | # Families | % Families |
| Less than $10,000 | 19 | 7.0% |
| $10,000 to $14,999 | 5 | 1.8% |
| $15,000 to $24,999 | 25 | 9.2% |
| $25,000 to $34,999 | 46 | 17.0% |
| $35,000 to $49,999 | 53 | 19.6% |
| $50,000 to $74,999 | 48 | 17.7% |
| $75,000 to $99,999 | 22 | 8.1% |
| $100,000 to $149,999 | 35 | 12.9% |
| $150,000 to $199,999 | 13 | 4.8% |
| $200,000+ | 5 | 1.8% |
Family Income by Famaliy Size in Kamiah
6-person families (9 | 3.3%) account for the highest median family income in Kamiah with $56,250 per family, while 2-person families (163 | 60.2%) have the highest median income of $22,344 per family member.
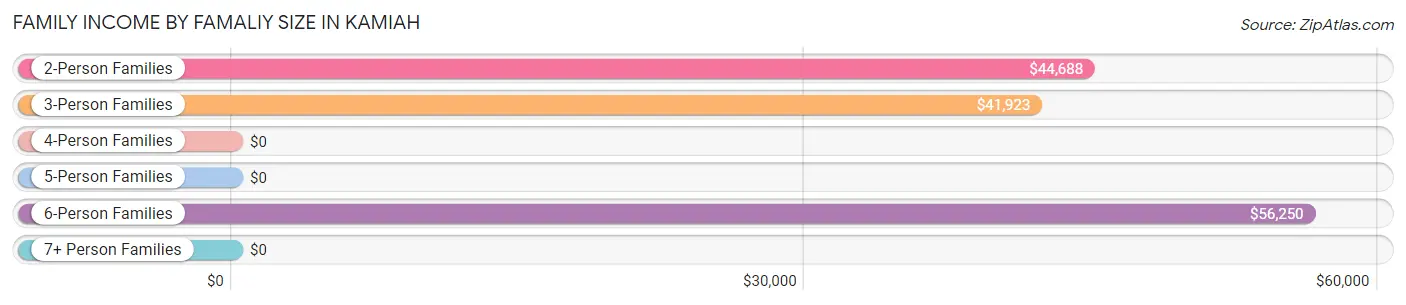
| Income Bracket | # Families | Median Income |
| 2-Person Families | 163 (60.2%) | $44,688 |
| 3-Person Families | 54 (19.9%) | $41,923 |
| 4-Person Families | 17 (6.3%) | $0 |
| 5-Person Families | 28 (10.3%) | $0 |
| 6-Person Families | 9 (3.3%) | $56,250 |
| 7+ Person Families | 0 (0.0%) | $0 |
| Total | 271 (100.0%) | $47,917 |
Family Income by Number of Earners in Kamiah
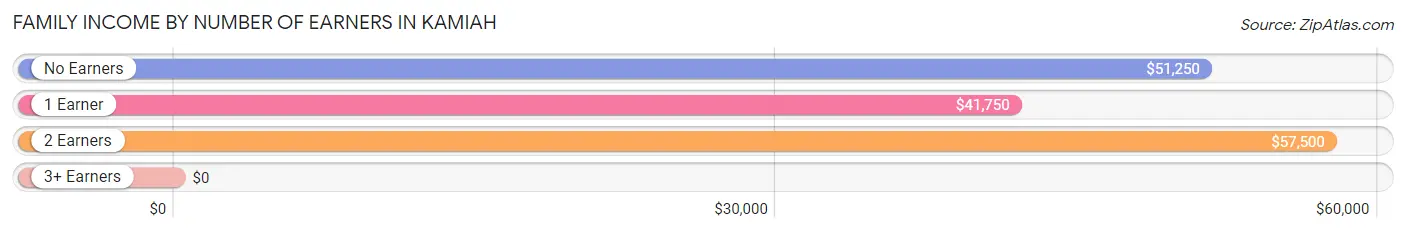
| Number of Earners | # Families | Median Income |
| No Earners | 63 (23.3%) | $51,250 |
| 1 Earner | 133 (49.1%) | $41,750 |
| 2 Earners | 70 (25.8%) | $57,500 |
| 3+ Earners | 5 (1.8%) | $0 |
| Total | 271 (100.0%) | $47,917 |
Household Income in Kamiah
Household Income Brackets in Kamiah
With 108 households falling in the category, the $25,000 to $34,999 income range is the most frequent in Kamiah, accounting for 18.6% of all households. In contrast, only 5 households (0.9%) fall into the $200,000+ income bracket, making it the least populous group.
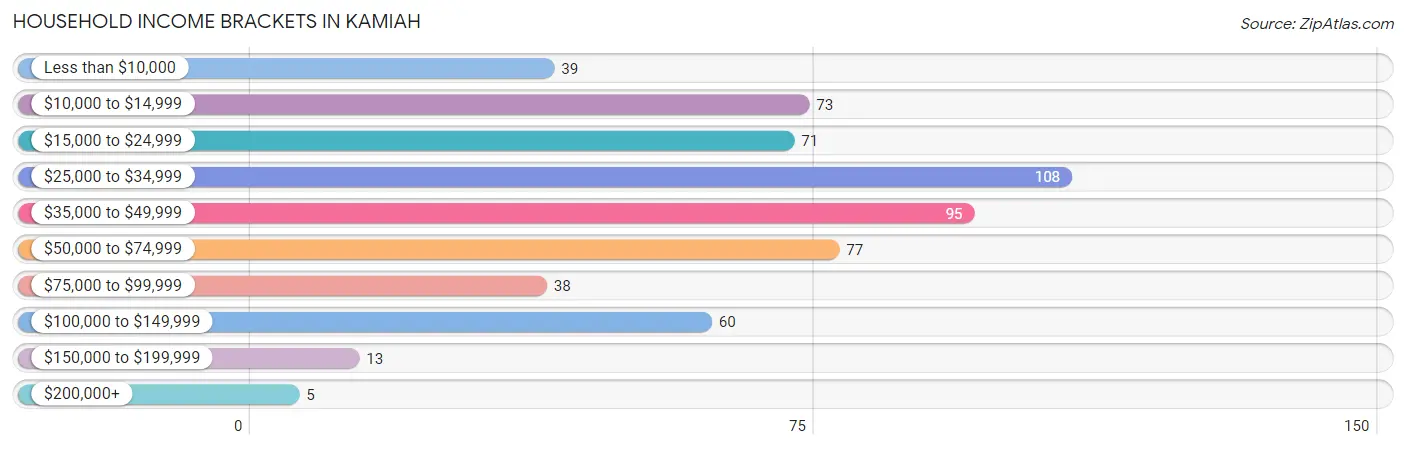
| Income Bracket | # Households | % Households |
| Less than $10,000 | 39 | 6.7% |
| $10,000 to $14,999 | 73 | 12.6% |
| $15,000 to $24,999 | 71 | 12.3% |
| $25,000 to $34,999 | 108 | 18.7% |
| $35,000 to $49,999 | 95 | 16.4% |
| $50,000 to $74,999 | 77 | 13.3% |
| $75,000 to $99,999 | 38 | 6.6% |
| $100,000 to $149,999 | 60 | 10.4% |
| $150,000 to $199,999 | 13 | 2.2% |
| $200,000+ | 5 | 0.9% |
Household Income by Householder Age in Kamiah
The median household income in Kamiah is $34,803, with the highest median household income of $46,875 found in the 25 to 44 years age bracket for the primary householder. A total of 135 households (23.3%) fall into this category. Meanwhile, the 15 to 24 years age bracket for the primary householder has the lowest median household income of $0, with 29 households (5.0%) in this group.
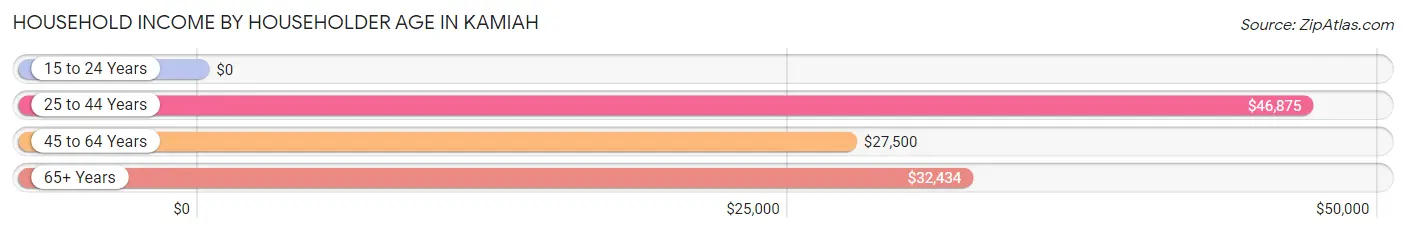
| Income Bracket | # Households | Median Income |
| 15 to 24 Years | 29 (5.0%) | $0 |
| 25 to 44 Years | 135 (23.3%) | $46,875 |
| 45 to 64 Years | 190 (32.8%) | $27,500 |
| 65+ Years | 225 (38.9%) | $32,434 |
| Total | 579 (100.0%) | $34,803 |
Poverty in Kamiah
Income Below Poverty by Sex and Age in Kamiah
With 18.0% poverty level for males and 26.5% for females among the residents of Kamiah, 15 year old males and 18 to 24 year old females are the most vulnerable to poverty, with 6 males (100.0%) and 21 females (67.7%) in their respective age groups living below the poverty level.
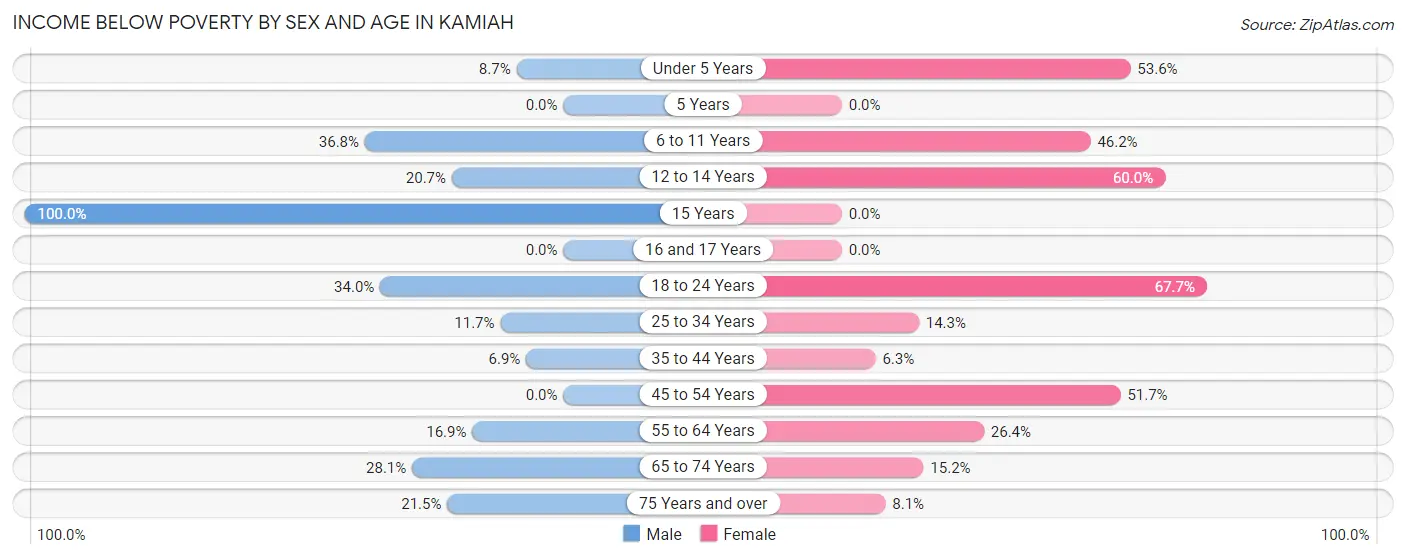
| Age Bracket | Male | Female |
| Under 5 Years | 2 (8.7%) | 30 (53.6%) |
| 5 Years | 0 (0.0%) | 0 (0.0%) |
| 6 to 11 Years | 14 (36.8%) | 24 (46.2%) |
| 12 to 14 Years | 6 (20.7%) | 6 (60.0%) |
| 15 Years | 6 (100.0%) | 0 (0.0%) |
| 16 and 17 Years | 0 (0.0%) | 0 (0.0%) |
| 18 to 24 Years | 17 (34.0%) | 21 (67.7%) |
| 25 to 34 Years | 9 (11.7%) | 6 (14.3%) |
| 35 to 44 Years | 4 (6.9%) | 4 (6.2%) |
| 45 to 54 Years | 0 (0.0%) | 30 (51.7%) |
| 55 to 64 Years | 12 (16.9%) | 24 (26.4%) |
| 65 to 74 Years | 16 (28.1%) | 20 (15.1%) |
| 75 Years and over | 14 (21.5%) | 8 (8.1%) |
| Total | 100 (18.0%) | 173 (26.5%) |
Income Above Poverty by Sex and Age in Kamiah
According to the poverty statistics in Kamiah, males aged 16 and 17 years and females aged 5 years are the age groups that are most secure financially, with 100.0% of males and 100.0% of females in these age groups living above the poverty line.
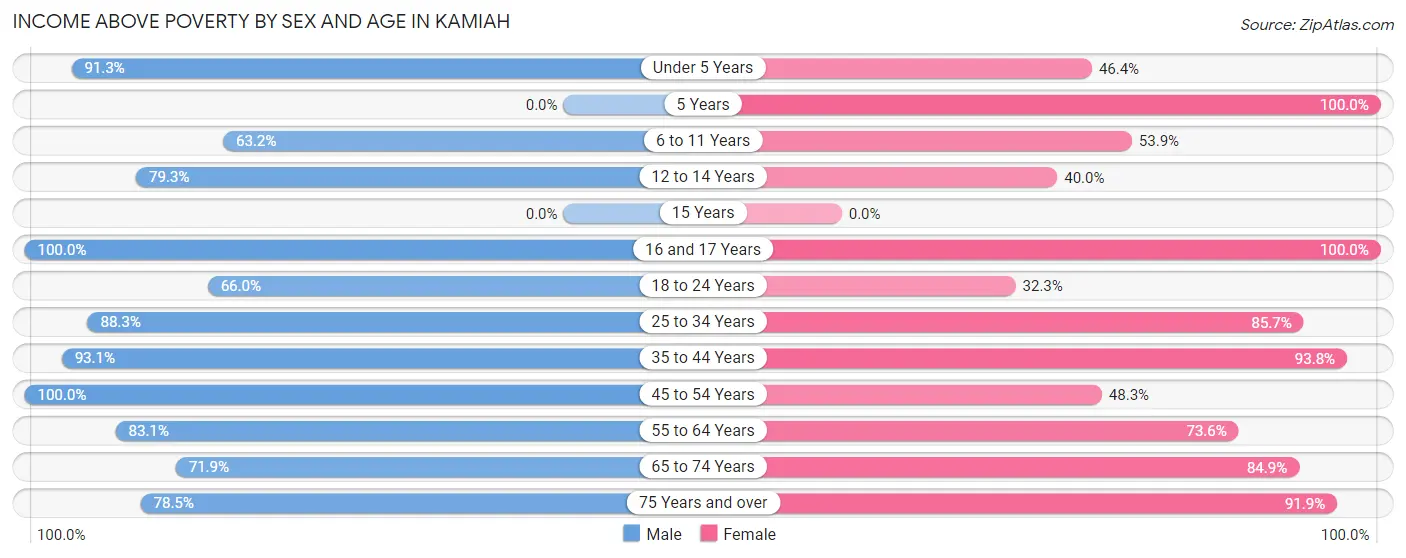
| Age Bracket | Male | Female |
| Under 5 Years | 21 (91.3%) | 26 (46.4%) |
| 5 Years | 0 (0.0%) | 6 (100.0%) |
| 6 to 11 Years | 24 (63.2%) | 28 (53.8%) |
| 12 to 14 Years | 23 (79.3%) | 4 (40.0%) |
| 15 Years | 0 (0.0%) | 0 (0.0%) |
| 16 and 17 Years | 4 (100.0%) | 12 (100.0%) |
| 18 to 24 Years | 33 (66.0%) | 10 (32.3%) |
| 25 to 34 Years | 68 (88.3%) | 36 (85.7%) |
| 35 to 44 Years | 54 (93.1%) | 60 (93.8%) |
| 45 to 54 Years | 76 (100.0%) | 28 (48.3%) |
| 55 to 64 Years | 59 (83.1%) | 67 (73.6%) |
| 65 to 74 Years | 41 (71.9%) | 112 (84.9%) |
| 75 Years and over | 51 (78.5%) | 91 (91.9%) |
| Total | 454 (82.0%) | 480 (73.5%) |
Income Below Poverty Among Married-Couple Families in Kamiah
The poverty statistics for married-couple families in Kamiah show that 7.3% or 16 of the total 219 families live below the poverty line. Families with 3 or 4 children have the highest poverty rate of 43.2%, comprising of 16 families. On the other hand, families with no children have the lowest poverty rate of 0.0%, which includes 0 families.
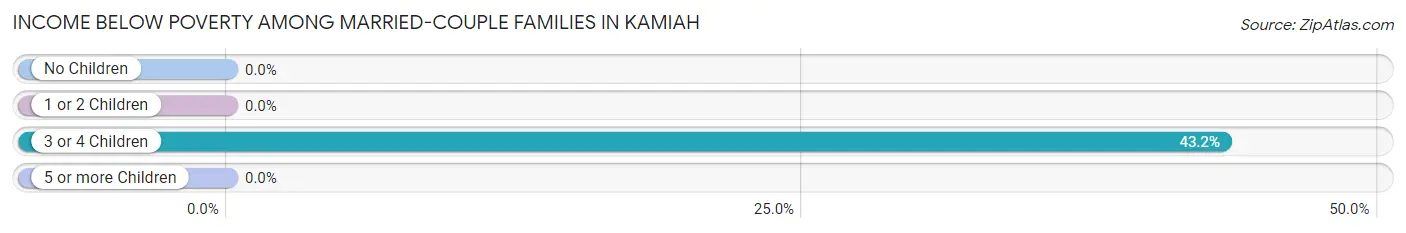
| Children | Above Poverty | Below Poverty |
| No Children | 152 (100.0%) | 0 (0.0%) |
| 1 or 2 Children | 30 (100.0%) | 0 (0.0%) |
| 3 or 4 Children | 21 (56.8%) | 16 (43.2%) |
| 5 or more Children | 0 (0.0%) | 0 (0.0%) |
| Total | 203 (92.7%) | 16 (7.3%) |
Income Below Poverty Among Single-Parent Households in Kamiah
According to the poverty data in Kamiah, 50.0% or 9 single-father households and 44.1% or 15 single-mother households are living below the poverty line. Among single-father households, those with 1 or 2 children have the highest poverty rate, with 9 households (50.0%) experiencing poverty. Likewise, among single-mother households, those with 3 or 4 children have the highest poverty rate, with 1 households (100.0%) falling below the poverty line.
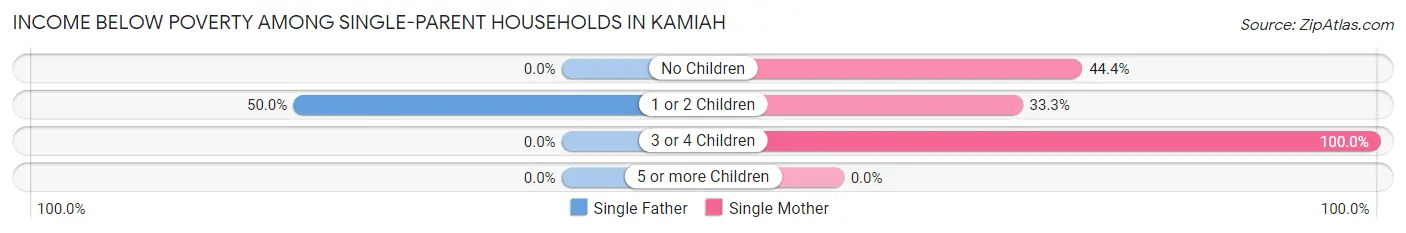
| Children | Single Father | Single Mother |
| No Children | 0 (0.0%) | 12 (44.4%) |
| 1 or 2 Children | 9 (50.0%) | 2 (33.3%) |
| 3 or 4 Children | 0 (0.0%) | 1 (100.0%) |
| 5 or more Children | 0 (0.0%) | 0 (0.0%) |
| Total | 9 (50.0%) | 15 (44.1%) |
Income Below Poverty Among Married-Couple vs Single-Parent Households in Kamiah
The poverty data for Kamiah shows that 16 of the married-couple family households (7.3%) and 24 of the single-parent households (46.2%) are living below the poverty level. Within the married-couple family households, those with 3 or 4 children have the highest poverty rate, with 16 households (43.2%) falling below the poverty line. Among the single-parent households, those with 3 or 4 children have the highest poverty rate, with 1 household (100.0%) living below poverty.
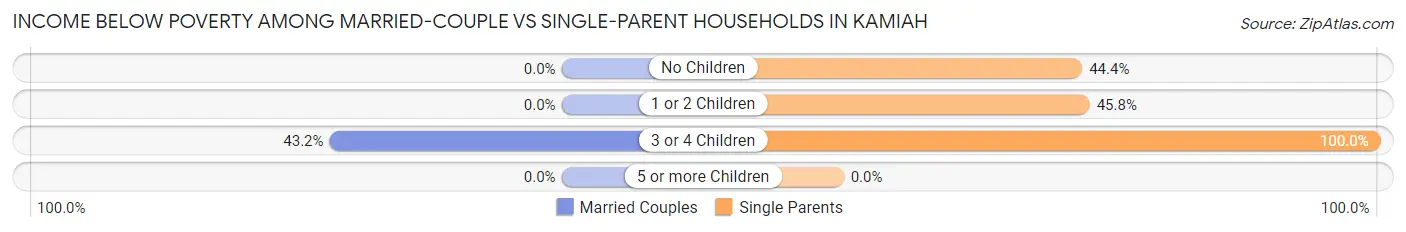
| Children | Married-Couple Families | Single-Parent Households |
| No Children | 0 (0.0%) | 12 (44.4%) |
| 1 or 2 Children | 0 (0.0%) | 11 (45.8%) |
| 3 or 4 Children | 16 (43.2%) | 1 (100.0%) |
| 5 or more Children | 0 (0.0%) | 0 (0.0%) |
| Total | 16 (7.3%) | 24 (46.2%) |
Race in Kamiah
The most populous races in Kamiah are White / Caucasian (852 | 70.4%), Two or more Races (124 | 10.2%), and Some other Race (120 | 9.9%).
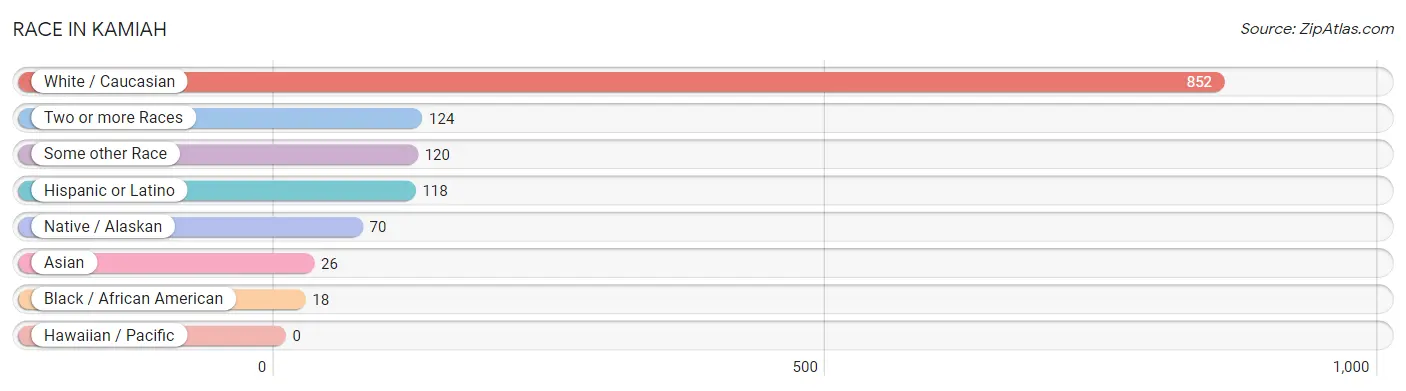
| Race | # Population | % Population |
| Asian | 26 | 2.1% |
| Black / African American | 18 | 1.5% |
| Hawaiian / Pacific | 0 | 0.0% |
| Hispanic or Latino | 118 | 9.8% |
| Native / Alaskan | 70 | 5.8% |
| White / Caucasian | 852 | 70.4% |
| Two or more Races | 124 | 10.2% |
| Some other Race | 120 | 9.9% |
| Total | 1,210 | 100.0% |
Ancestry in Kamiah
The most populous ancestries reported in Kamiah are German (260 | 21.5%), English (191 | 15.8%), Irish (182 | 15.0%), Mexican (83 | 6.9%), and Norwegian (48 | 4.0%), together accounting for 63.1% of all Kamiah residents.
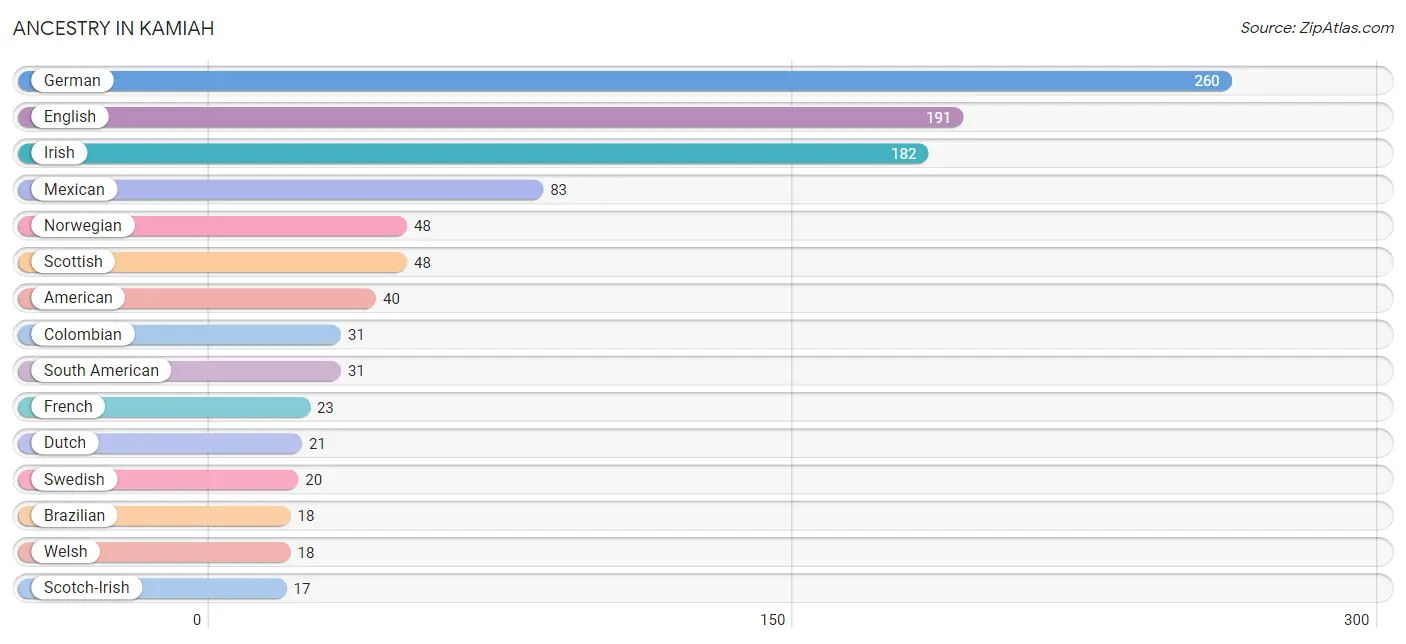
| Ancestry | # Population | % Population |
| American | 40 | 3.3% |
| Arab | 3 | 0.3% |
| Basque | 2 | 0.2% |
| Brazilian | 18 | 1.5% |
| British | 4 | 0.3% |
| Cherokee | 11 | 0.9% |
| Choctaw | 10 | 0.8% |
| Colombian | 31 | 2.6% |
| Croatian | 1 | 0.1% |
| Danish | 7 | 0.6% |
| Dutch | 21 | 1.7% |
| English | 191 | 15.8% |
| European | 16 | 1.3% |
| Finnish | 7 | 0.6% |
| French | 23 | 1.9% |
| German | 260 | 21.5% |
| Hungarian | 6 | 0.5% |
| Indian (Asian) | 12 | 1.0% |
| Irish | 182 | 15.0% |
| Italian | 14 | 1.2% |
| Korean | 5 | 0.4% |
| Lebanese | 3 | 0.3% |
| Lithuanian | 2 | 0.2% |
| Mexican | 83 | 6.9% |
| Navajo | 2 | 0.2% |
| Nigerian | 12 | 1.0% |
| Norwegian | 48 | 4.0% |
| Polish | 4 | 0.3% |
| Russian | 2 | 0.2% |
| Samoan | 13 | 1.1% |
| Scandinavian | 12 | 1.0% |
| Scotch-Irish | 17 | 1.4% |
| Scottish | 48 | 4.0% |
| South American | 31 | 2.6% |
| Spanish | 4 | 0.3% |
| Sri Lankan | 13 | 1.1% |
| Subsaharan African | 12 | 1.0% |
| Swedish | 20 | 1.7% |
| Swiss | 14 | 1.2% |
| Welsh | 18 | 1.5% | View All 40 Rows |
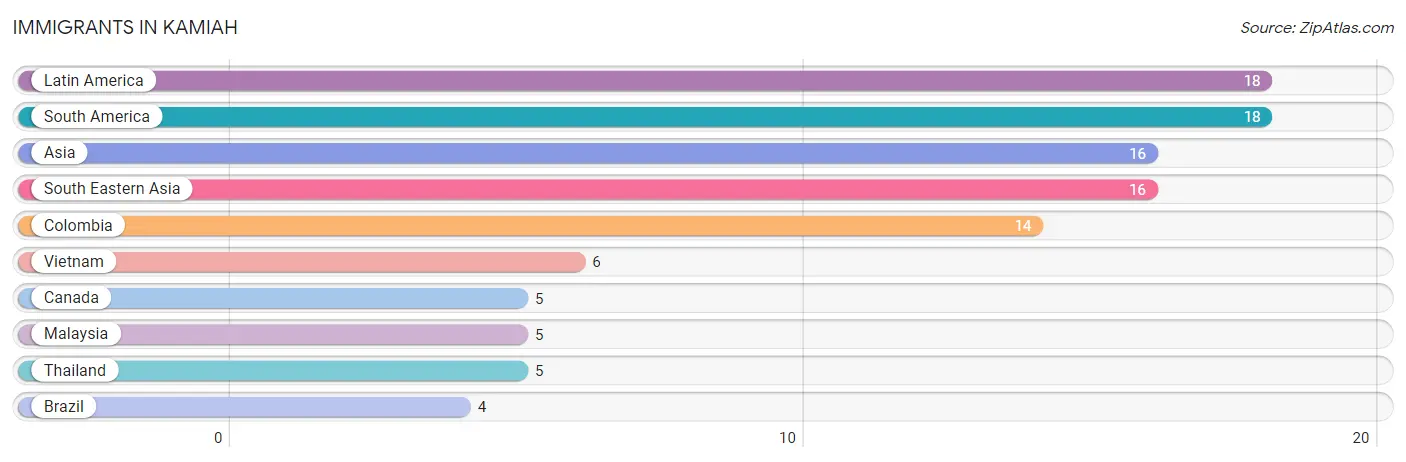
Immigrants in Kamiah
The most numerous immigrant groups reported in Kamiah came from Latin America (18 | 1.5%), South America (18 | 1.5%), Asia (16 | 1.3%), South Eastern Asia (16 | 1.3%), and Colombia (14 | 1.2%), together accounting for 6.8% of all Kamiah residents.
| Immigration Origin | # Population | % Population |
| Asia | 16 | 1.3% |
| Brazil | 4 | 0.3% |
| Canada | 5 | 0.4% |
| Colombia | 14 | 1.2% |
| Latin America | 18 | 1.5% |
| Malaysia | 5 | 0.4% |
| South America | 18 | 1.5% |
| South Eastern Asia | 16 | 1.3% |
| Thailand | 5 | 0.4% |
| Vietnam | 6 | 0.5% | View All 10 Rows |
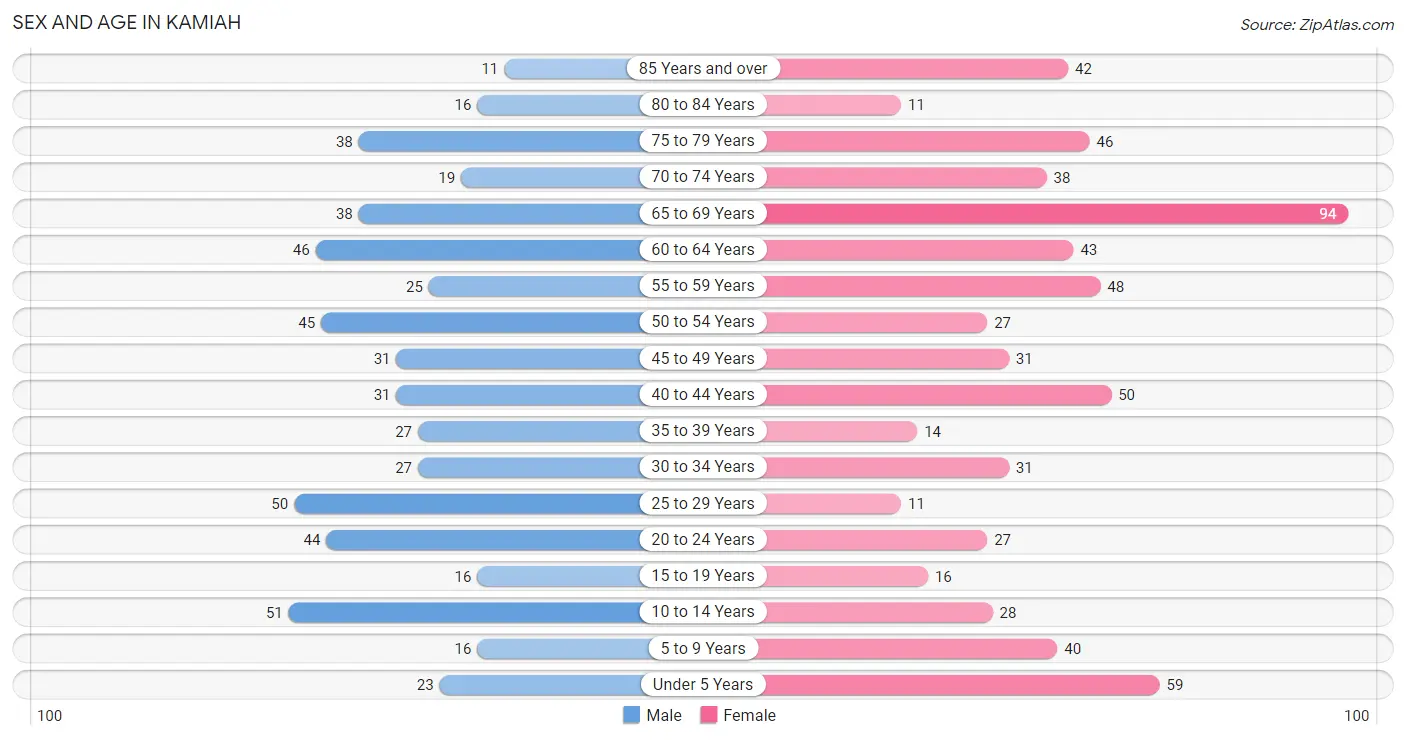
Sex and Age in Kamiah
Sex and Age in Kamiah
The most populous age groups in Kamiah are 10 to 14 Years (51 | 9.2%) for men and 65 to 69 Years (94 | 14.3%) for women.
| Age Bracket | Male | Female |
| Under 5 Years | 23 (4.2%) | 59 (9.0%) |
| 5 to 9 Years | 16 (2.9%) | 40 (6.1%) |
| 10 to 14 Years | 51 (9.2%) | 28 (4.3%) |
| 15 to 19 Years | 16 (2.9%) | 16 (2.4%) |
| 20 to 24 Years | 44 (7.9%) | 27 (4.1%) |
| 25 to 29 Years | 50 (9.0%) | 11 (1.7%) |
| 30 to 34 Years | 27 (4.9%) | 31 (4.7%) |
| 35 to 39 Years | 27 (4.9%) | 14 (2.1%) |
| 40 to 44 Years | 31 (5.6%) | 50 (7.6%) |
| 45 to 49 Years | 31 (5.6%) | 31 (4.7%) |
| 50 to 54 Years | 45 (8.1%) | 27 (4.1%) |
| 55 to 59 Years | 25 (4.5%) | 48 (7.3%) |
| 60 to 64 Years | 46 (8.3%) | 43 (6.6%) |
| 65 to 69 Years | 38 (6.9%) | 94 (14.3%) |
| 70 to 74 Years | 19 (3.4%) | 38 (5.8%) |
| 75 to 79 Years | 38 (6.9%) | 46 (7.0%) |
| 80 to 84 Years | 16 (2.9%) | 11 (1.7%) |
| 85 Years and over | 11 (2.0%) | 42 (6.4%) |
| Total | 554 (100.0%) | 656 (100.0%) |
Families and Households in Kamiah
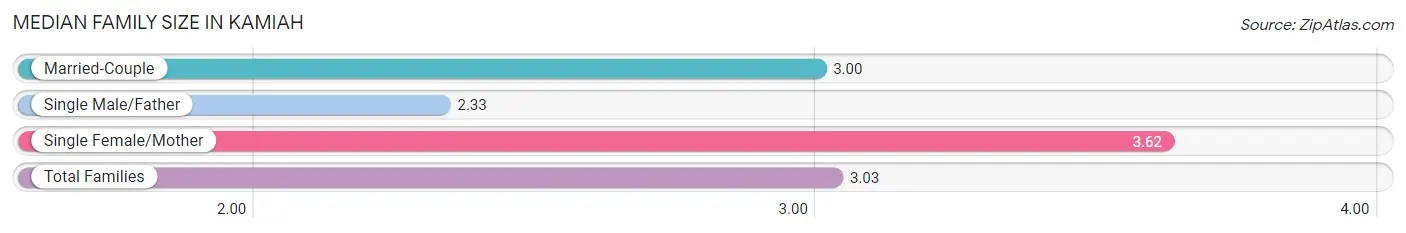
Median Family Size in Kamiah
The median family size in Kamiah is 3.03 persons per family, with single female/mother families (34 | 12.6%) accounting for the largest median family size of 3.62 persons per family. On the other hand, single male/father families (18 | 6.6%) represent the smallest median family size with 2.33 persons per family.
| Family Type | # Families | Family Size |
| Married-Couple | 219 (80.8%) | 3.00 |
| Single Male/Father | 18 (6.6%) | 2.33 |
| Single Female/Mother | 34 (12.6%) | 3.62 |
| Total Families | 271 (100.0%) | 3.03 |
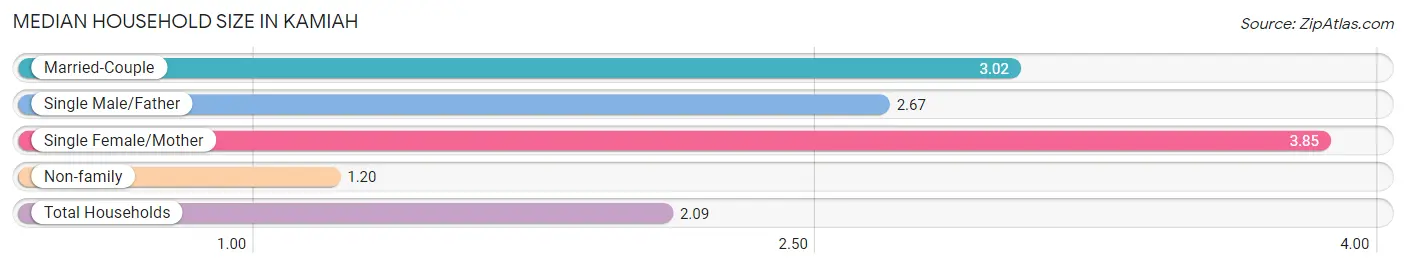
Median Household Size in Kamiah
The median household size in Kamiah is 2.09 persons per household, with single female/mother households (34 | 5.9%) accounting for the largest median household size of 3.85 persons per household. non-family households (308 | 53.2%) represent the smallest median household size with 1.20 persons per household.
| Household Type | # Households | Household Size |
| Married-Couple | 219 (37.8%) | 3.02 |
| Single Male/Father | 18 (3.1%) | 2.67 |
| Single Female/Mother | 34 (5.9%) | 3.85 |
| Non-family | 308 (53.2%) | 1.20 |
| Total Households | 579 (100.0%) | 2.09 |
Household Size by Marriage Status in Kamiah
Out of a total of 579 households in Kamiah, 271 (46.8%) are family households, while 308 (53.2%) are nonfamily households. The most numerous type of family households are 2-person households, comprising 152, and the most common type of nonfamily households are 1-person households, comprising 248.
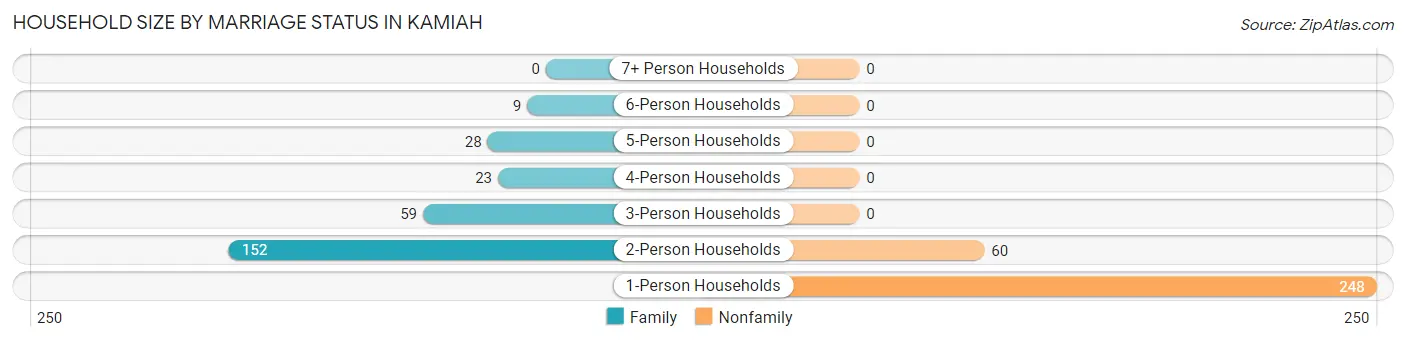
| Household Size | Family Households | Nonfamily Households |
| 1-Person Households | - | 248 (42.8%) |
| 2-Person Households | 152 (26.3%) | 60 (10.4%) |
| 3-Person Households | 59 (10.2%) | 0 (0.0%) |
| 4-Person Households | 23 (4.0%) | 0 (0.0%) |
| 5-Person Households | 28 (4.8%) | 0 (0.0%) |
| 6-Person Households | 9 (1.5%) | 0 (0.0%) |
| 7+ Person Households | 0 (0.0%) | 0 (0.0%) |
| Total | 271 (46.8%) | 308 (53.2%) |
Female Fertility in Kamiah
Fertility by Age in Kamiah
Average fertility rate in Kamiah is 33.0 births per 1,000 women. Women in the age bracket of 35 to 50 years have the highest fertility rate with 63.0 births per 1,000 women. Women in the age bracket of 35 to 50 years acount for 100.0% of all women with births.
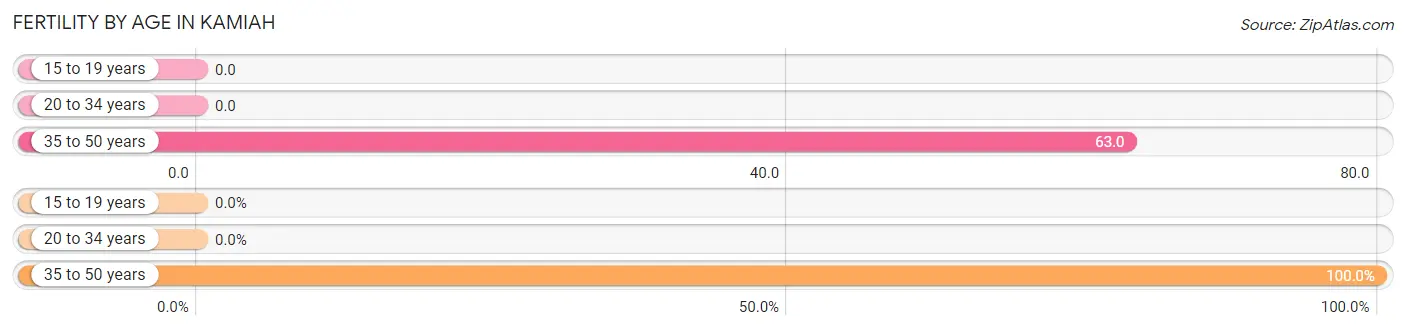
| Age Bracket | Women with Births | Births / 1,000 Women |
| 15 to 19 years | 0 (0.0%) | 0.0 |
| 20 to 34 years | 0 (0.0%) | 0.0 |
| 35 to 50 years | 6 (100.0%) | 63.0 |
| Total | 6 (100.0%) | 33.0 |
Fertility by Age by Marriage Status in Kamiah
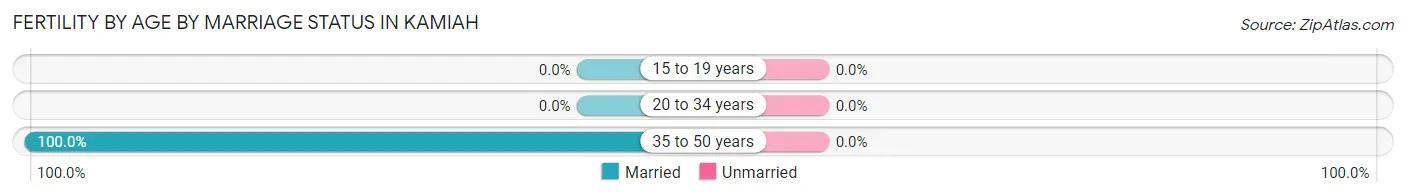
| Age Bracket | Married | Unmarried |
| 15 to 19 years | 0 (0.0%) | 0 (0.0%) |
| 20 to 34 years | 0 (0.0%) | 0 (0.0%) |
| 35 to 50 years | 6 (100.0%) | 0 (0.0%) |
| Total | 6 (100.0%) | 0 (0.0%) |
Fertility by Education in Kamiah
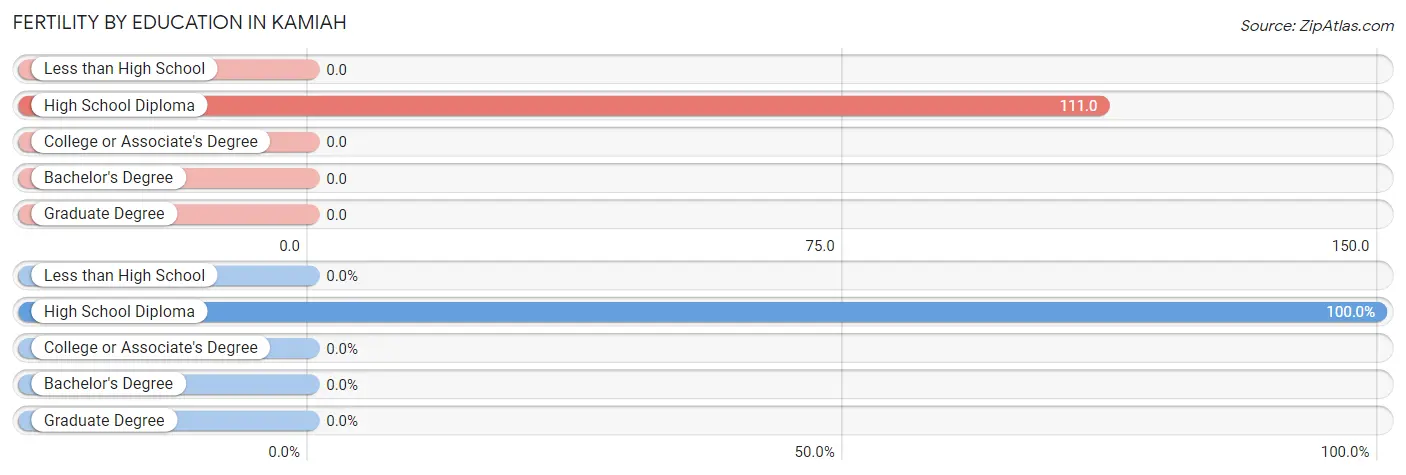
| Educational Attainment | Women with Births | Births / 1,000 Women |
| Less than High School | 0 (0.0%) | 0.0 |
| High School Diploma | 6 (100.0%) | 111.0 |
| College or Associate's Degree | 0 (0.0%) | 0.0 |
| Bachelor's Degree | 0 (0.0%) | 0.0 |
| Graduate Degree | 0 (0.0%) | 0.0 |
| Total | 6 (100.0%) | 33.0 |
Fertility by Education by Marriage Status in Kamiah
| Educational Attainment | Married | Unmarried |
| Less than High School | 0 (0.0%) | 0 (0.0%) |
| High School Diploma | 6 (100.0%) | 0 (0.0%) |
| College or Associate's Degree | 0 (0.0%) | 0 (0.0%) |
| Bachelor's Degree | 0 (0.0%) | 0 (0.0%) |
| Graduate Degree | 0 (0.0%) | 0 (0.0%) |
| Total | 6 (100.0%) | 0 (0.0%) |
Employment Characteristics in Kamiah
Employment by Class of Employer in Kamiah
Among the 426 employed individuals in Kamiah, private company employees (257 | 60.3%), federal government employees (42 | 9.9%), and local government employees (36 | 8.5%) make up the most common classes of employment.
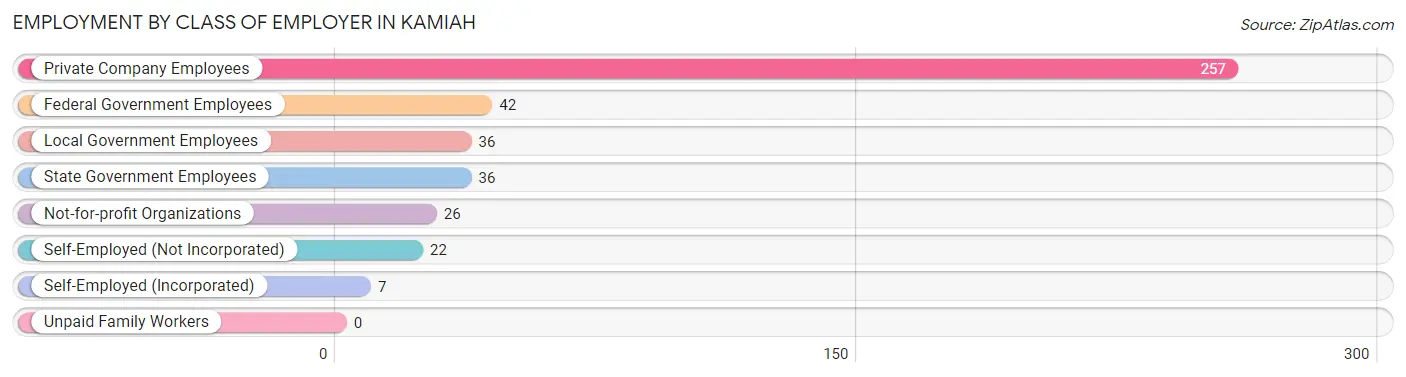
| Employer Class | # Employees | % Employees |
| Private Company Employees | 257 | 60.3% |
| Self-Employed (Incorporated) | 7 | 1.6% |
| Self-Employed (Not Incorporated) | 22 | 5.2% |
| Not-for-profit Organizations | 26 | 6.1% |
| Local Government Employees | 36 | 8.5% |
| State Government Employees | 36 | 8.5% |
| Federal Government Employees | 42 | 9.9% |
| Unpaid Family Workers | 0 | 0.0% |
| Total | 426 | 100.0% |
Employment Status by Age in Kamiah
According to the labor force statistics for Kamiah, out of the total population over 16 years of age (987), 46.6% or 460 individuals are in the labor force, with 6.1% or 28 of them unemployed. The age group with the highest labor force participation rate is 30 to 34 years, with 79.3% or 46 individuals in the labor force. Within the labor force, the 20 to 24 years age range has the highest percentage of unemployed individuals, with 19.6% or 11 of them being unemployed.
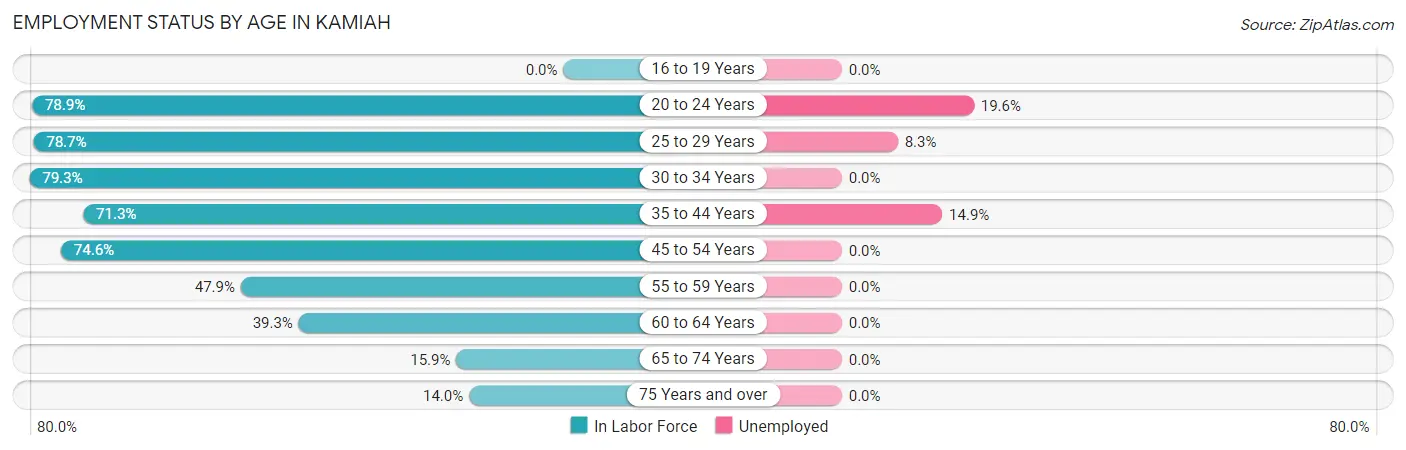
| Age Bracket | In Labor Force | Unemployed |
| 16 to 19 Years | 0 (0.0%) | 0 (0.0%) |
| 20 to 24 Years | 56 (78.9%) | 11 (19.6%) |
| 25 to 29 Years | 48 (78.7%) | 4 (8.3%) |
| 30 to 34 Years | 46 (79.3%) | 0 (0.0%) |
| 35 to 44 Years | 87 (71.3%) | 13 (14.9%) |
| 45 to 54 Years | 100 (74.6%) | 0 (0.0%) |
| 55 to 59 Years | 35 (47.9%) | 0 (0.0%) |
| 60 to 64 Years | 35 (39.3%) | 0 (0.0%) |
| 65 to 74 Years | 30 (15.9%) | 0 (0.0%) |
| 75 Years and over | 23 (14.0%) | 0 (0.0%) |
| Total | 460 (46.6%) | 28 (6.1%) |
Employment Status by Educational Attainment in Kamiah
According to labor force statistics for Kamiah, 65.4% of individuals (351) out of the total population between 25 and 64 years of age (537) are in the labor force, with 4.8% or 17 of them being unemployed. The group with the highest labor force participation rate are those with the educational attainment of bachelor's degree or higher, with 75.3% or 55 individuals in the labor force. Within the labor force, individuals with college / associate degree education have the highest percentage of unemployment, with 11.3% or 17 of them being unemployed.
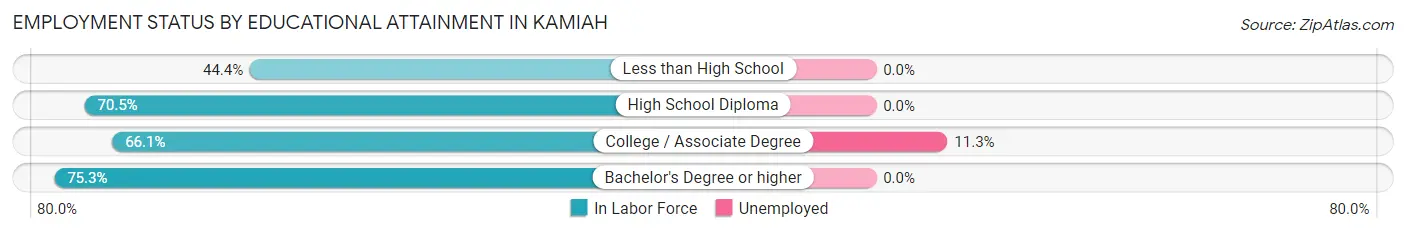
| Educational Attainment | In Labor Force | Unemployed |
| Less than High School | 36 (44.4%) | 0 (0.0%) |
| High School Diploma | 110 (70.5%) | 0 (0.0%) |
| College / Associate Degree | 150 (66.1%) | 26 (11.3%) |
| Bachelor's Degree or higher | 55 (75.3%) | 0 (0.0%) |
| Total | 351 (65.4%) | 26 (4.8%) |
Employment Occupations by Sex in Kamiah
Management, Business, Science and Arts Occupations
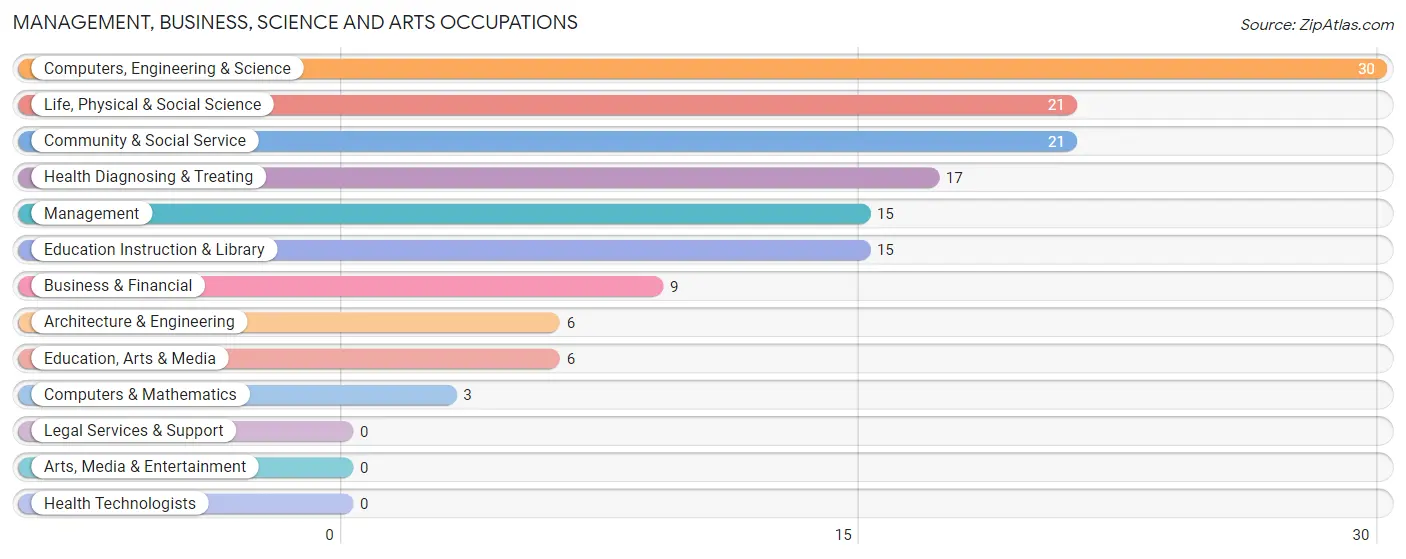
The most common Management, Business, Science and Arts occupations in Kamiah are Computers, Engineering & Science (30 | 6.9%), Life, Physical & Social Science (21 | 4.9%), Community & Social Service (21 | 4.9%), Health Diagnosing & Treating (17 | 3.9%), and Management (15 | 3.5%).
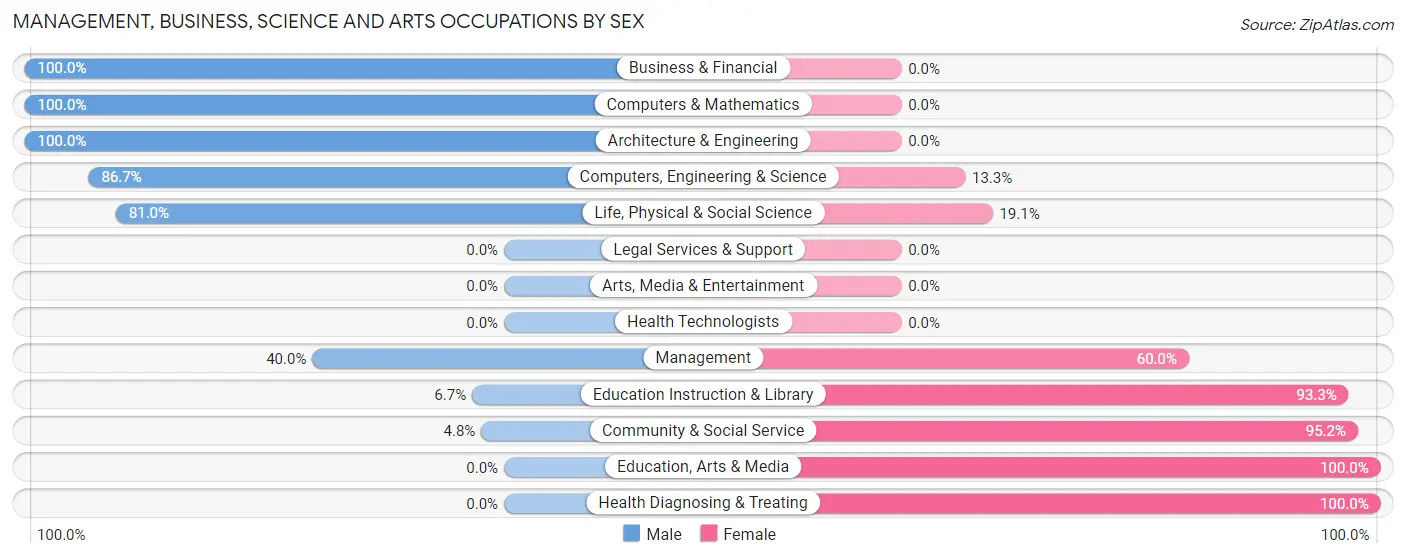
Management, Business, Science and Arts Occupations by Sex
Within the Management, Business, Science and Arts occupations in Kamiah, the most male-oriented occupations are Business & Financial (100.0%), Computers & Mathematics (100.0%), and Architecture & Engineering (100.0%), while the most female-oriented occupations are Education, Arts & Media (100.0%), Health Diagnosing & Treating (100.0%), and Community & Social Service (95.2%).
| Occupation | Male | Female |
| Management | 6 (40.0%) | 9 (60.0%) |
| Business & Financial | 9 (100.0%) | 0 (0.0%) |
| Computers, Engineering & Science | 26 (86.7%) | 4 (13.3%) |
| Computers & Mathematics | 3 (100.0%) | 0 (0.0%) |
| Architecture & Engineering | 6 (100.0%) | 0 (0.0%) |
| Life, Physical & Social Science | 17 (80.9%) | 4 (19.1%) |
| Community & Social Service | 1 (4.8%) | 20 (95.2%) |
| Education, Arts & Media | 0 (0.0%) | 6 (100.0%) |
| Legal Services & Support | 0 (0.0%) | 0 (0.0%) |
| Education Instruction & Library | 1 (6.7%) | 14 (93.3%) |
| Arts, Media & Entertainment | 0 (0.0%) | 0 (0.0%) |
| Health Diagnosing & Treating | 0 (0.0%) | 17 (100.0%) |
| Health Technologists | 0 (0.0%) | 0 (0.0%) |
| Total (Category) | 42 (45.7%) | 50 (54.3%) |
| Total (Overall) | 246 (56.9%) | 186 (43.1%) |
Services Occupations
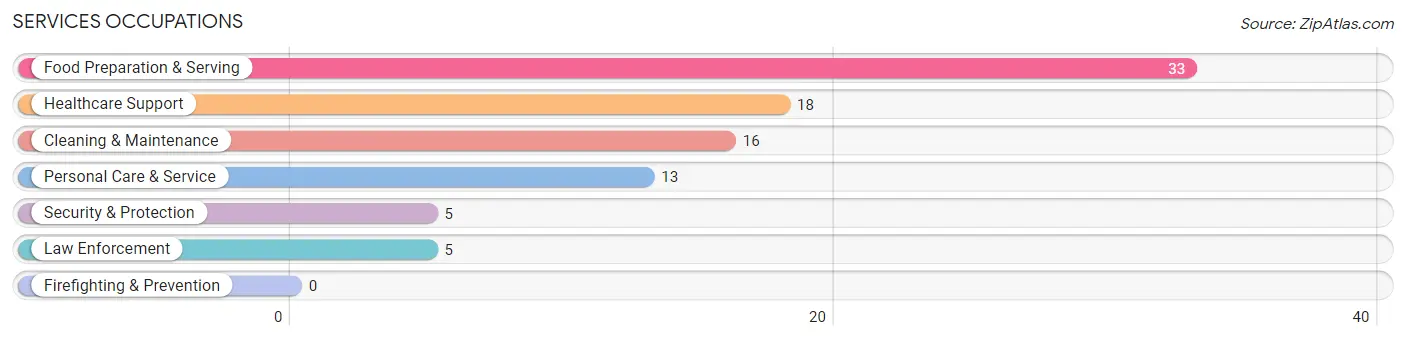
The most common Services occupations in Kamiah are Food Preparation & Serving (33 | 7.6%), Healthcare Support (18 | 4.2%), Cleaning & Maintenance (16 | 3.7%), Personal Care & Service (13 | 3.0%), and Security & Protection (5 | 1.2%).
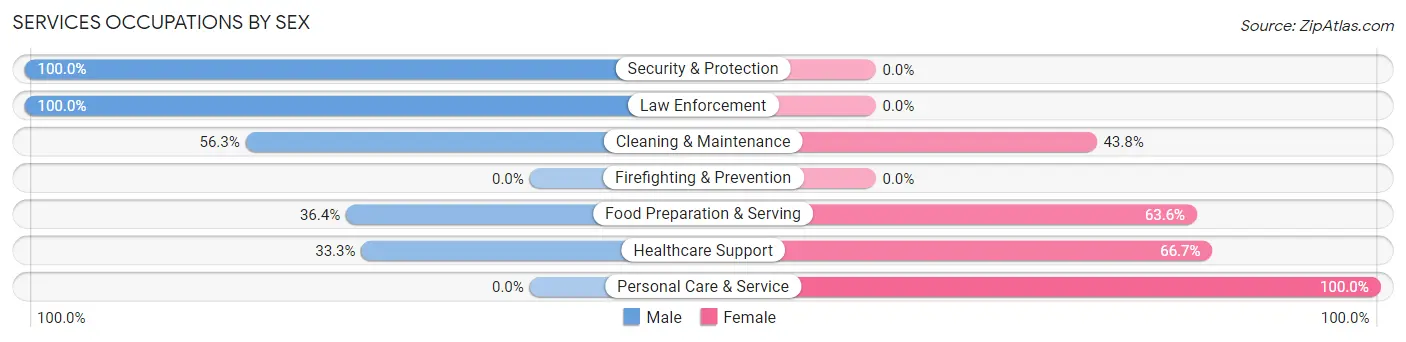
Services Occupations by Sex
Within the Services occupations in Kamiah, the most male-oriented occupations are Security & Protection (100.0%), Law Enforcement (100.0%), and Cleaning & Maintenance (56.2%), while the most female-oriented occupations are Personal Care & Service (100.0%), Healthcare Support (66.7%), and Food Preparation & Serving (63.6%).
| Occupation | Male | Female |
| Healthcare Support | 6 (33.3%) | 12 (66.7%) |
| Security & Protection | 5 (100.0%) | 0 (0.0%) |
| Firefighting & Prevention | 0 (0.0%) | 0 (0.0%) |
| Law Enforcement | 5 (100.0%) | 0 (0.0%) |
| Food Preparation & Serving | 12 (36.4%) | 21 (63.6%) |
| Cleaning & Maintenance | 9 (56.2%) | 7 (43.8%) |
| Personal Care & Service | 0 (0.0%) | 13 (100.0%) |
| Total (Category) | 32 (37.7%) | 53 (62.4%) |
| Total (Overall) | 246 (56.9%) | 186 (43.1%) |
Sales and Office Occupations
The most common Sales and Office occupations in Kamiah are Sales & Related (57 | 13.2%), and Office & Administration (44 | 10.2%).
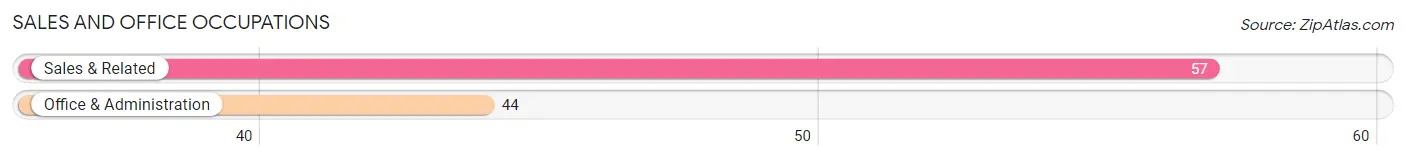
Sales and Office Occupations by Sex
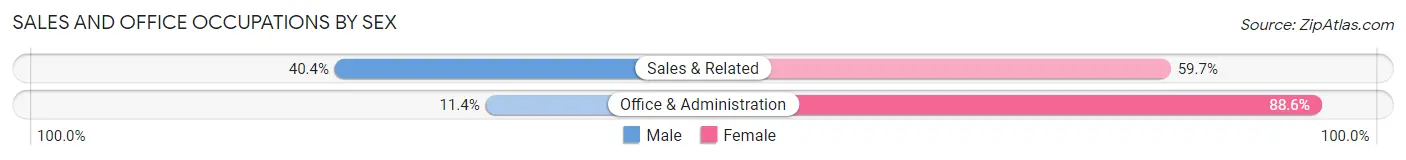
| Occupation | Male | Female |
| Sales & Related | 23 (40.4%) | 34 (59.7%) |
| Office & Administration | 5 (11.4%) | 39 (88.6%) |
| Total (Category) | 28 (27.7%) | 73 (72.3%) |
| Total (Overall) | 246 (56.9%) | 186 (43.1%) |
Natural Resources, Construction and Maintenance Occupations
The most common Natural Resources, Construction and Maintenance occupations in Kamiah are Construction & Extraction (62 | 14.3%), Farming, Fishing & Forestry (10 | 2.3%), and Installation, Maintenance & Repair (3 | 0.7%).
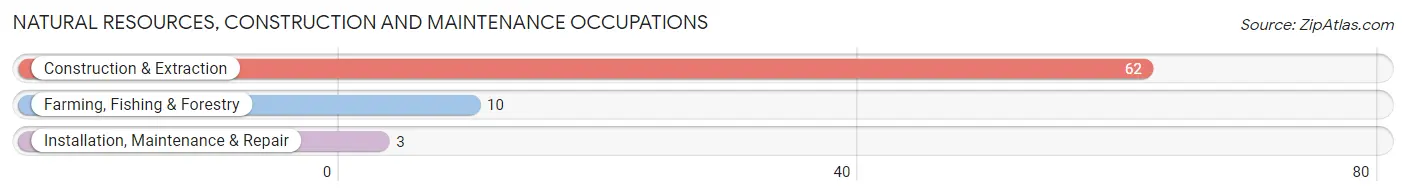
Natural Resources, Construction and Maintenance Occupations by Sex
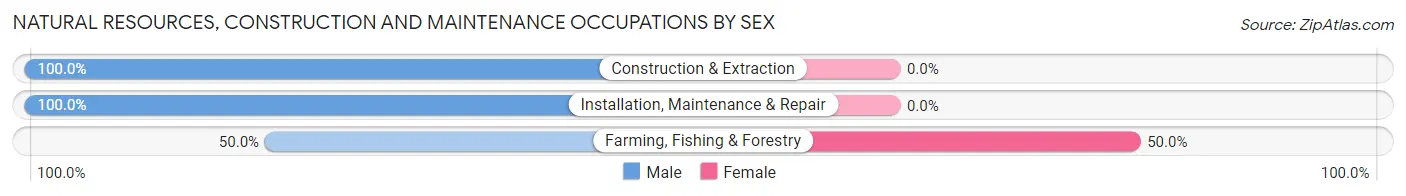
| Occupation | Male | Female |
| Farming, Fishing & Forestry | 5 (50.0%) | 5 (50.0%) |
| Construction & Extraction | 62 (100.0%) | 0 (0.0%) |
| Installation, Maintenance & Repair | 3 (100.0%) | 0 (0.0%) |
| Total (Category) | 70 (93.3%) | 5 (6.7%) |
| Total (Overall) | 246 (56.9%) | 186 (43.1%) |
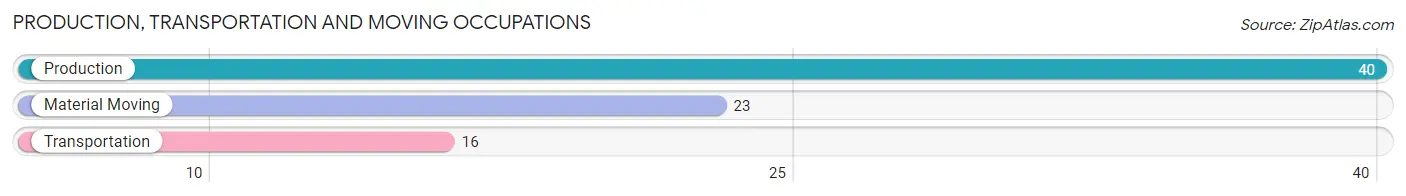
Production, Transportation and Moving Occupations
The most common Production, Transportation and Moving occupations in Kamiah are Production (40 | 9.3%), Material Moving (23 | 5.3%), and Transportation (16 | 3.7%).
Production, Transportation and Moving Occupations by Sex
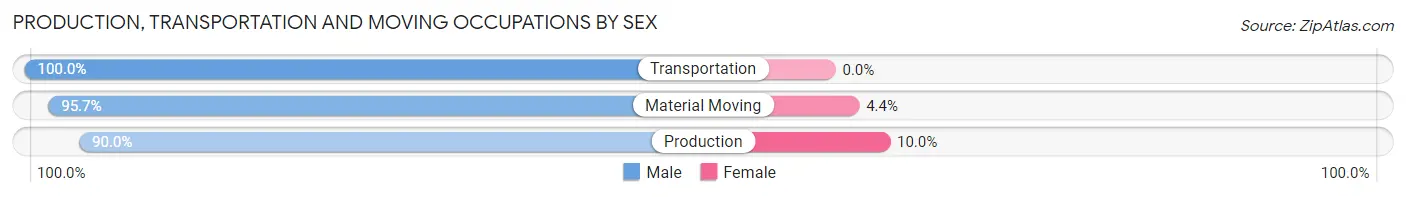
| Occupation | Male | Female |
| Production | 36 (90.0%) | 4 (10.0%) |
| Transportation | 16 (100.0%) | 0 (0.0%) |
| Material Moving | 22 (95.7%) | 1 (4.3%) |
| Total (Category) | 74 (93.7%) | 5 (6.3%) |
| Total (Overall) | 246 (56.9%) | 186 (43.1%) |
Employment Industries by Sex in Kamiah
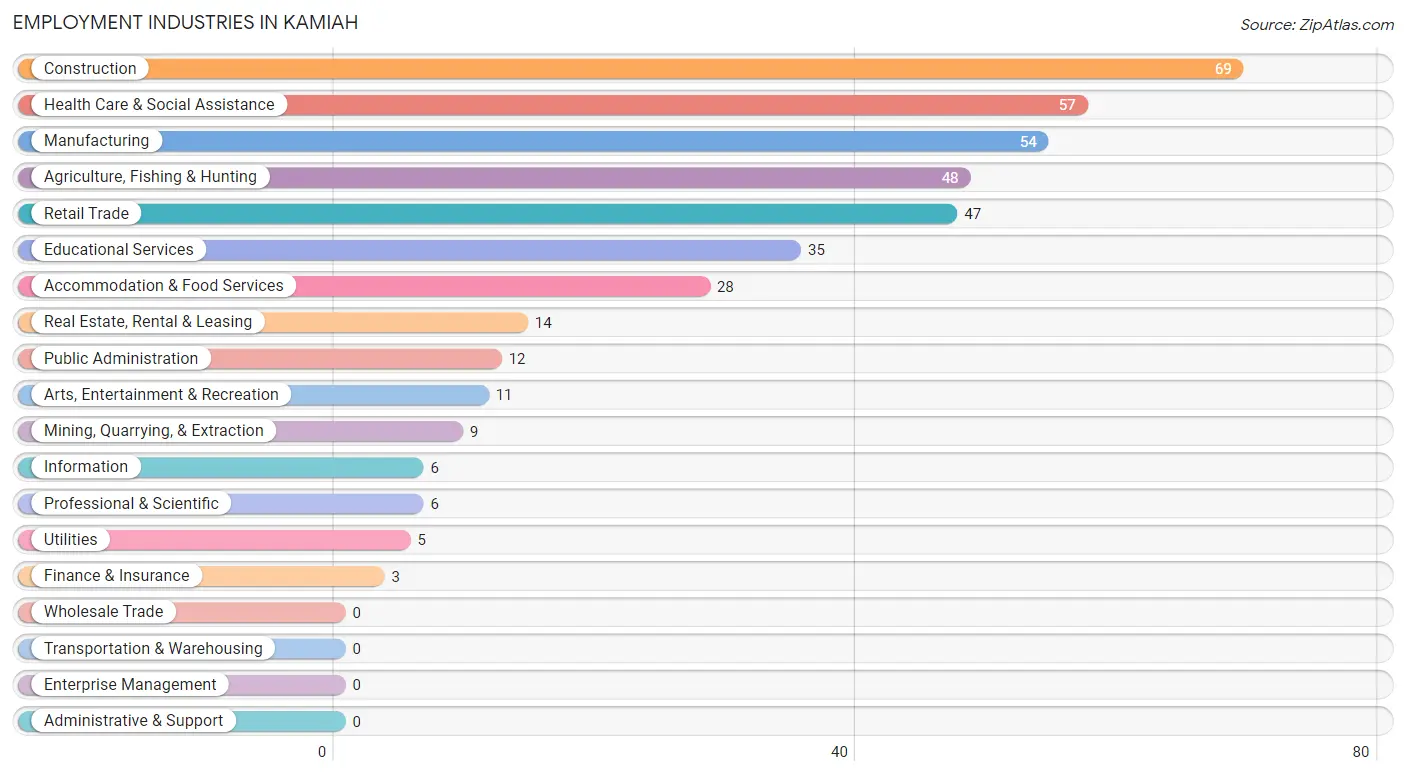
Employment Industries in Kamiah
The major employment industries in Kamiah include Construction (69 | 16.0%), Health Care & Social Assistance (57 | 13.2%), Manufacturing (54 | 12.5%), Agriculture, Fishing & Hunting (48 | 11.1%), and Retail Trade (47 | 10.9%).
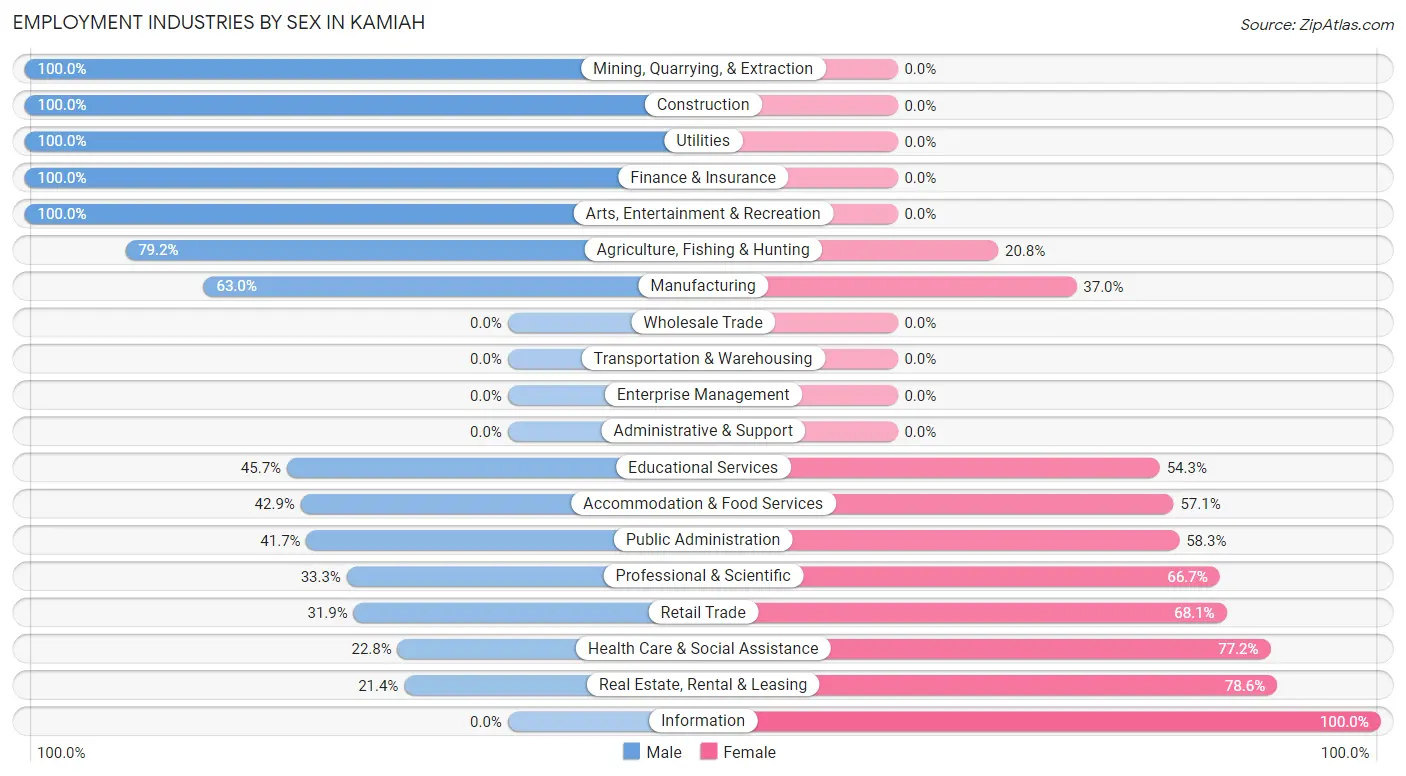
Employment Industries by Sex in Kamiah
The Kamiah industries that see more men than women are Mining, Quarrying, & Extraction (100.0%), Construction (100.0%), and Utilities (100.0%), whereas the industries that tend to have a higher number of women are Information (100.0%), Real Estate, Rental & Leasing (78.6%), and Health Care & Social Assistance (77.2%).
| Industry | Male | Female |
| Agriculture, Fishing & Hunting | 38 (79.2%) | 10 (20.8%) |
| Mining, Quarrying, & Extraction | 9 (100.0%) | 0 (0.0%) |
| Construction | 69 (100.0%) | 0 (0.0%) |
| Manufacturing | 34 (63.0%) | 20 (37.0%) |
| Wholesale Trade | 0 (0.0%) | 0 (0.0%) |
| Retail Trade | 15 (31.9%) | 32 (68.1%) |
| Transportation & Warehousing | 0 (0.0%) | 0 (0.0%) |
| Utilities | 5 (100.0%) | 0 (0.0%) |
| Information | 0 (0.0%) | 6 (100.0%) |
| Finance & Insurance | 3 (100.0%) | 0 (0.0%) |
| Real Estate, Rental & Leasing | 3 (21.4%) | 11 (78.6%) |
| Professional & Scientific | 2 (33.3%) | 4 (66.7%) |
| Enterprise Management | 0 (0.0%) | 0 (0.0%) |
| Administrative & Support | 0 (0.0%) | 0 (0.0%) |
| Educational Services | 16 (45.7%) | 19 (54.3%) |
| Health Care & Social Assistance | 13 (22.8%) | 44 (77.2%) |
| Arts, Entertainment & Recreation | 11 (100.0%) | 0 (0.0%) |
| Accommodation & Food Services | 12 (42.9%) | 16 (57.1%) |
| Public Administration | 5 (41.7%) | 7 (58.3%) |
| Total | 246 (56.9%) | 186 (43.1%) |
Education in Kamiah
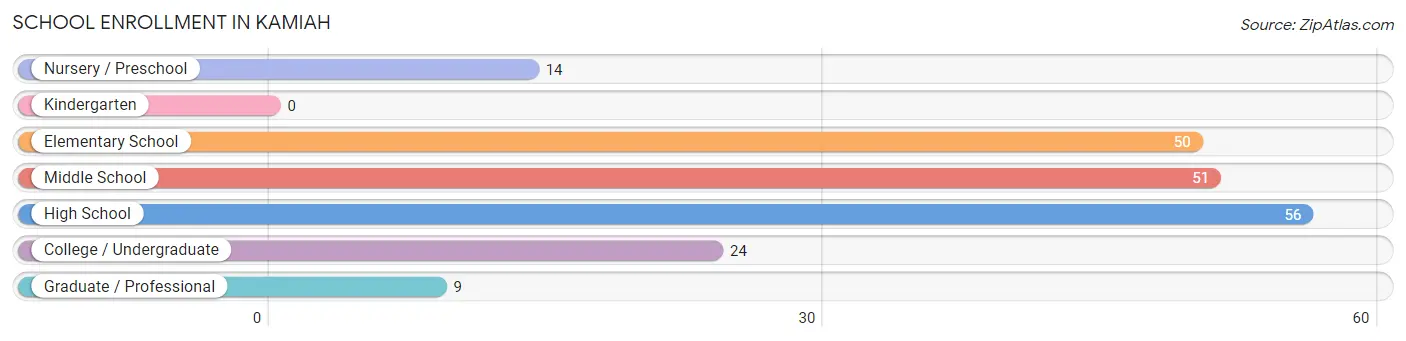
School Enrollment in Kamiah
The most common levels of schooling among the 204 students in Kamiah are high school (56 | 27.5%), middle school (51 | 25.0%), and elementary school (50 | 24.5%).
| School Level | # Students | % Students |
| Nursery / Preschool | 14 | 6.9% |
| Kindergarten | 0 | 0.0% |
| Elementary School | 50 | 24.5% |
| Middle School | 51 | 25.0% |
| High School | 56 | 27.5% |
| College / Undergraduate | 24 | 11.8% |
| Graduate / Professional | 9 | 4.4% |
| Total | 204 | 100.0% |
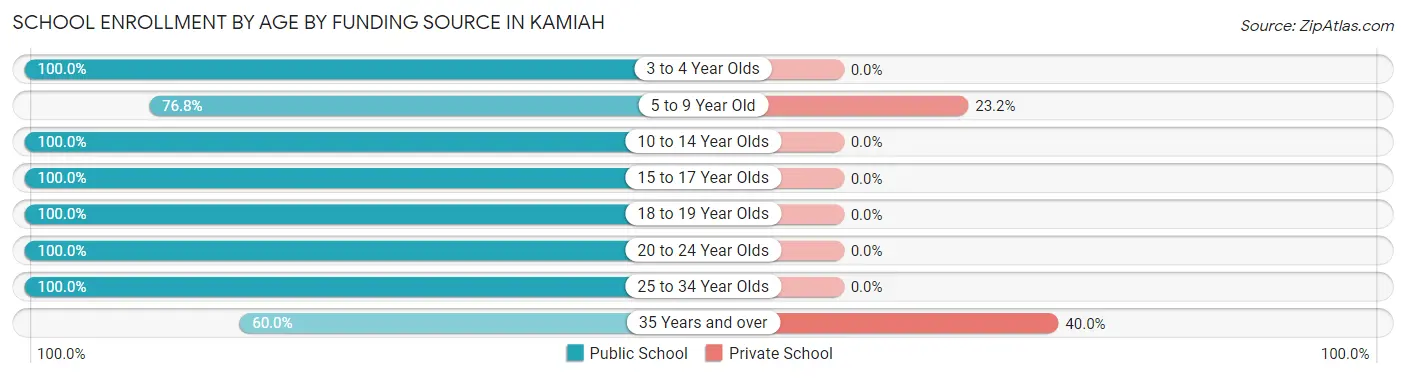
School Enrollment by Age by Funding Source in Kamiah
Out of a total of 204 students who are enrolled in schools in Kamiah, 17 (8.3%) attend a private institution, while the remaining 187 (91.7%) are enrolled in public schools. The age group of 35 years and over has the highest likelihood of being enrolled in private schools, with 4 (40.0% in the age bracket) enrolled. Conversely, the age group of 3 to 4 year olds has the lowest likelihood of being enrolled in a private school, with 8 (100.0% in the age bracket) attending a public institution.
| Age Bracket | Public School | Private School |
| 3 to 4 Year Olds | 8 (100.0%) | 0 (0.0%) |
| 5 to 9 Year Old | 43 (76.8%) | 13 (23.2%) |
| 10 to 14 Year Olds | 79 (100.0%) | 0 (0.0%) |
| 15 to 17 Year Olds | 22 (100.0%) | 0 (0.0%) |
| 18 to 19 Year Olds | 10 (100.0%) | 0 (0.0%) |
| 20 to 24 Year Olds | 11 (100.0%) | 0 (0.0%) |
| 25 to 34 Year Olds | 8 (100.0%) | 0 (0.0%) |
| 35 Years and over | 6 (60.0%) | 4 (40.0%) |
| Total | 187 (91.7%) | 17 (8.3%) |
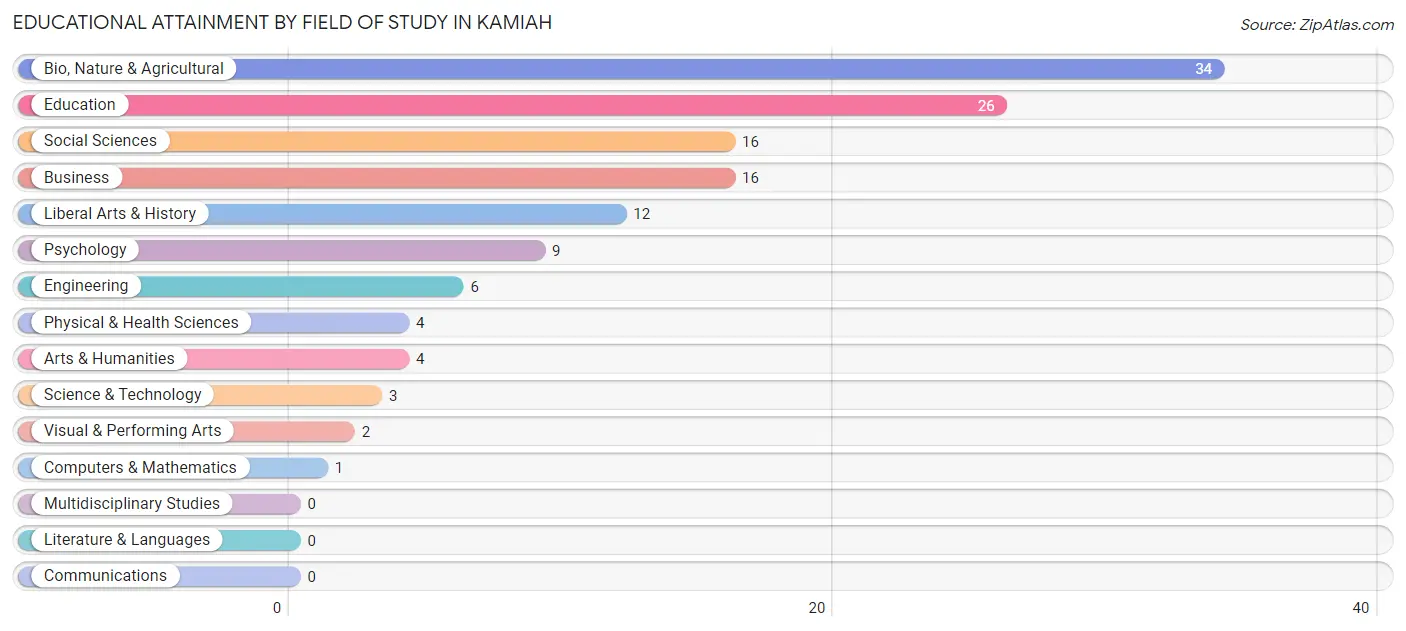
Educational Attainment by Field of Study in Kamiah
Bio, nature & agricultural (34 | 25.6%), education (26 | 19.6%), social sciences (16 | 12.0%), business (16 | 12.0%), and liberal arts & history (12 | 9.0%) are the most common fields of study among 133 individuals in Kamiah who have obtained a bachelor's degree or higher.
| Field of Study | # Graduates | % Graduates |
| Computers & Mathematics | 1 | 0.7% |
| Bio, Nature & Agricultural | 34 | 25.6% |
| Physical & Health Sciences | 4 | 3.0% |
| Psychology | 9 | 6.8% |
| Social Sciences | 16 | 12.0% |
| Engineering | 6 | 4.5% |
| Multidisciplinary Studies | 0 | 0.0% |
| Science & Technology | 3 | 2.3% |
| Business | 16 | 12.0% |
| Education | 26 | 19.6% |
| Literature & Languages | 0 | 0.0% |
| Liberal Arts & History | 12 | 9.0% |
| Visual & Performing Arts | 2 | 1.5% |
| Communications | 0 | 0.0% |
| Arts & Humanities | 4 | 3.0% |
| Total | 133 | 100.0% |
Transportation & Commute in Kamiah
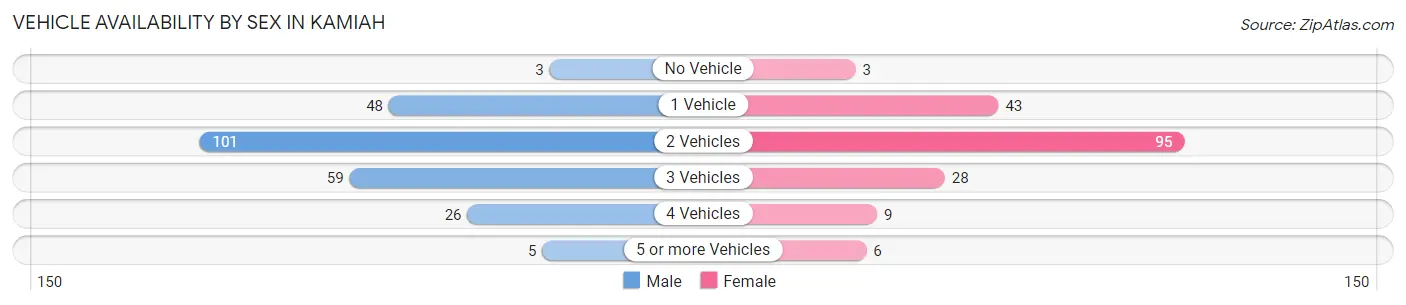
Vehicle Availability by Sex in Kamiah
The most prevalent vehicle ownership categories in Kamiah are males with 2 vehicles (101, accounting for 41.7%) and females with 2 vehicles (95, making up 54.9%).
| Vehicles Available | Male | Female |
| No Vehicle | 3 (1.2%) | 3 (1.6%) |
| 1 Vehicle | 48 (19.8%) | 43 (23.4%) |
| 2 Vehicles | 101 (41.7%) | 95 (51.6%) |
| 3 Vehicles | 59 (24.4%) | 28 (15.2%) |
| 4 Vehicles | 26 (10.7%) | 9 (4.9%) |
| 5 or more Vehicles | 5 (2.1%) | 6 (3.3%) |
| Total | 242 (100.0%) | 184 (100.0%) |
Commute Time in Kamiah
The most frequently occuring commute durations in Kamiah are 5 to 9 minutes (142 commuters, 34.8%), less than 5 minutes (102 commuters, 25.0%), and 30 to 34 minutes (41 commuters, 10.1%).
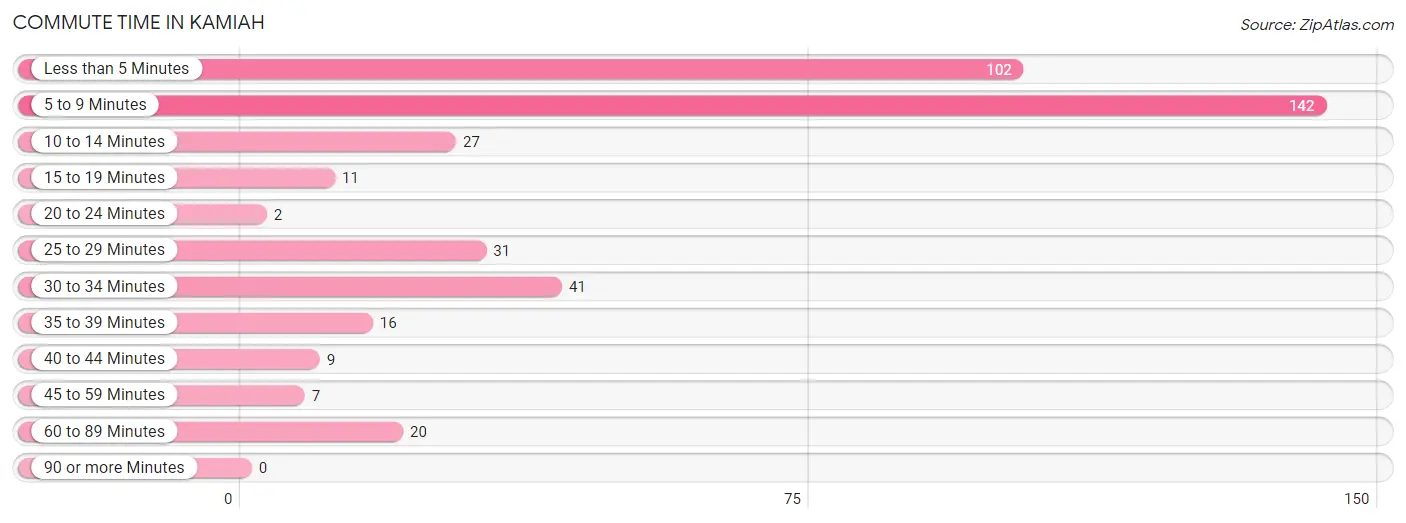
| Commute Time | # Commuters | % Commuters |
| Less than 5 Minutes | 102 | 25.0% |
| 5 to 9 Minutes | 142 | 34.8% |
| 10 to 14 Minutes | 27 | 6.6% |
| 15 to 19 Minutes | 11 | 2.7% |
| 20 to 24 Minutes | 2 | 0.5% |
| 25 to 29 Minutes | 31 | 7.6% |
| 30 to 34 Minutes | 41 | 10.1% |
| 35 to 39 Minutes | 16 | 3.9% |
| 40 to 44 Minutes | 9 | 2.2% |
| 45 to 59 Minutes | 7 | 1.7% |
| 60 to 89 Minutes | 20 | 4.9% |
| 90 or more Minutes | 0 | 0.0% |
Commute Time by Sex in Kamiah
The most common commute times in Kamiah are 5 to 9 minutes (99 commuters, 41.4%) for males and less than 5 minutes (48 commuters, 28.4%) for females.
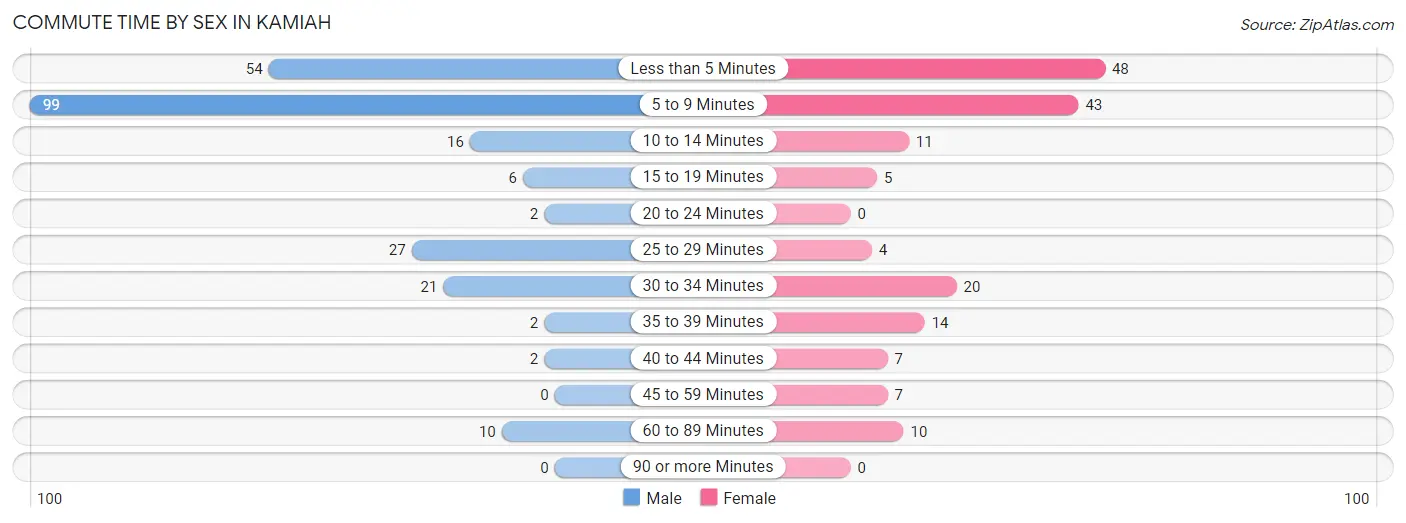
| Commute Time | Male | Female |
| Less than 5 Minutes | 54 (22.6%) | 48 (28.4%) |
| 5 to 9 Minutes | 99 (41.4%) | 43 (25.4%) |
| 10 to 14 Minutes | 16 (6.7%) | 11 (6.5%) |
| 15 to 19 Minutes | 6 (2.5%) | 5 (3.0%) |
| 20 to 24 Minutes | 2 (0.8%) | 0 (0.0%) |
| 25 to 29 Minutes | 27 (11.3%) | 4 (2.4%) |
| 30 to 34 Minutes | 21 (8.8%) | 20 (11.8%) |
| 35 to 39 Minutes | 2 (0.8%) | 14 (8.3%) |
| 40 to 44 Minutes | 2 (0.8%) | 7 (4.1%) |
| 45 to 59 Minutes | 0 (0.0%) | 7 (4.1%) |
| 60 to 89 Minutes | 10 (4.2%) | 10 (5.9%) |
| 90 or more Minutes | 0 (0.0%) | 0 (0.0%) |
Time of Departure to Work by Sex in Kamiah
The most frequent times of departure to work in Kamiah are 7:00 AM to 7:29 AM (46, 19.3%) for males and 12:00 AM to 4:59 AM (30, 17.7%) for females.
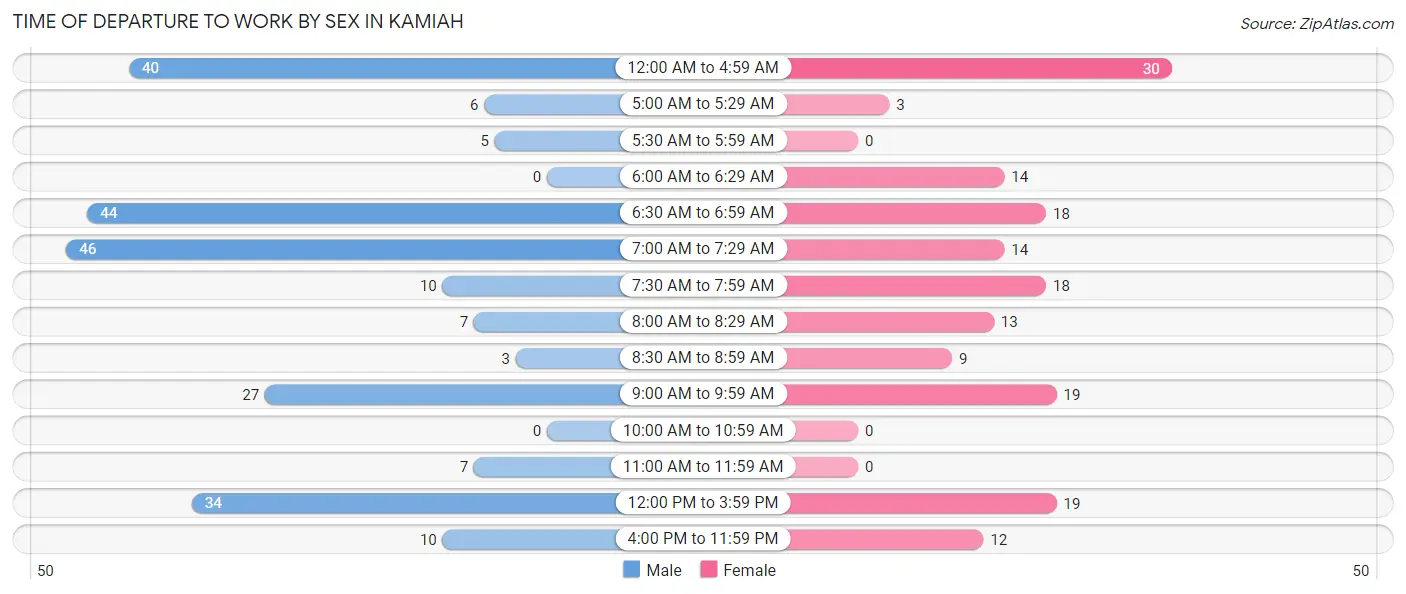
| Time of Departure | Male | Female |
| 12:00 AM to 4:59 AM | 40 (16.7%) | 30 (17.7%) |
| 5:00 AM to 5:29 AM | 6 (2.5%) | 3 (1.8%) |
| 5:30 AM to 5:59 AM | 5 (2.1%) | 0 (0.0%) |
| 6:00 AM to 6:29 AM | 0 (0.0%) | 14 (8.3%) |
| 6:30 AM to 6:59 AM | 44 (18.4%) | 18 (10.6%) |
| 7:00 AM to 7:29 AM | 46 (19.3%) | 14 (8.3%) |
| 7:30 AM to 7:59 AM | 10 (4.2%) | 18 (10.6%) |
| 8:00 AM to 8:29 AM | 7 (2.9%) | 13 (7.7%) |
| 8:30 AM to 8:59 AM | 3 (1.3%) | 9 (5.3%) |
| 9:00 AM to 9:59 AM | 27 (11.3%) | 19 (11.2%) |
| 10:00 AM to 10:59 AM | 0 (0.0%) | 0 (0.0%) |
| 11:00 AM to 11:59 AM | 7 (2.9%) | 0 (0.0%) |
| 12:00 PM to 3:59 PM | 34 (14.2%) | 19 (11.2%) |
| 4:00 PM to 11:59 PM | 10 (4.2%) | 12 (7.1%) |
| Total | 239 (100.0%) | 169 (100.0%) |
Housing Occupancy in Kamiah
Occupancy by Ownership in Kamiah
Of the total 579 dwellings in Kamiah, owner-occupied units account for 338 (58.4%), while renter-occupied units make up 241 (41.6%).
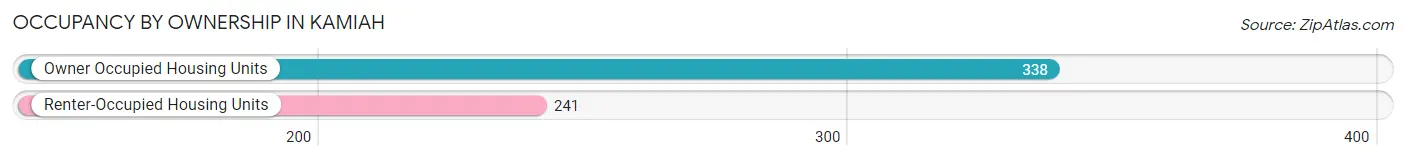
| Occupancy | # Housing Units | % Housing Units |
| Owner Occupied Housing Units | 338 | 58.4% |
| Renter-Occupied Housing Units | 241 | 41.6% |
| Total Occupied Housing Units | 579 | 100.0% |
Occupancy by Household Size in Kamiah
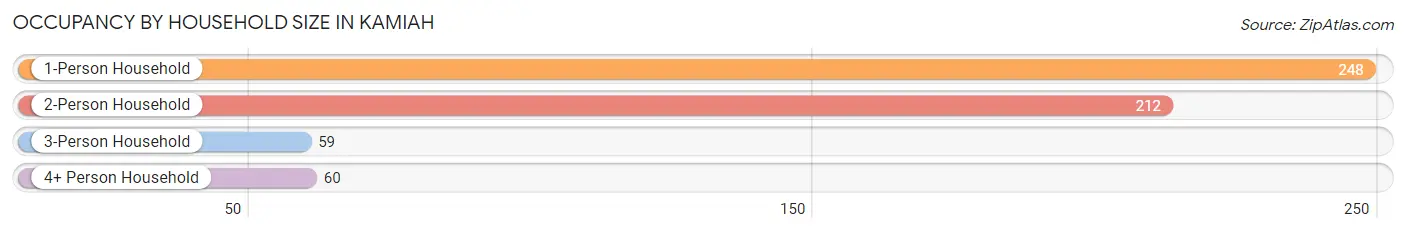
| Household Size | # Housing Units | % Housing Units |
| 1-Person Household | 248 | 42.8% |
| 2-Person Household | 212 | 36.6% |
| 3-Person Household | 59 | 10.2% |
| 4+ Person Household | 60 | 10.4% |
| Total Housing Units | 579 | 100.0% |
Occupancy by Ownership by Household Size in Kamiah
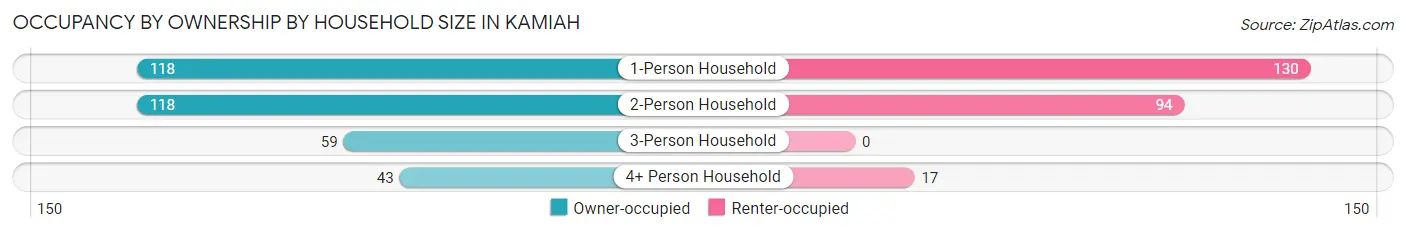
| Household Size | Owner-occupied | Renter-occupied |
| 1-Person Household | 118 (47.6%) | 130 (52.4%) |
| 2-Person Household | 118 (55.7%) | 94 (44.3%) |
| 3-Person Household | 59 (100.0%) | 0 (0.0%) |
| 4+ Person Household | 43 (71.7%) | 17 (28.3%) |
| Total Housing Units | 338 (58.4%) | 241 (41.6%) |
Occupancy by Educational Attainment in Kamiah
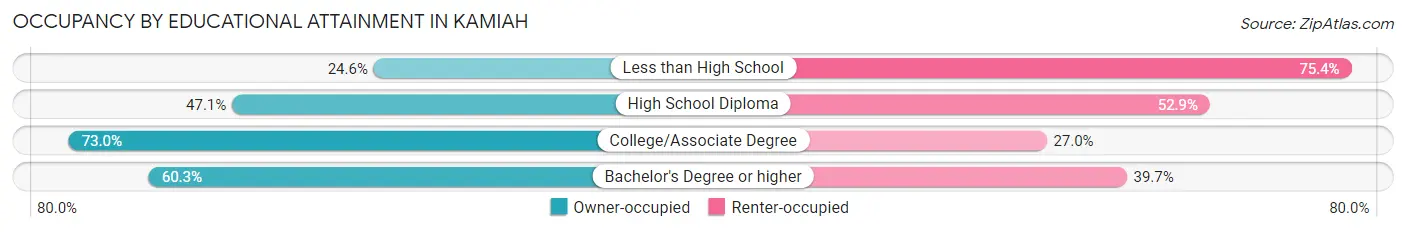
| Household Size | Owner-occupied | Renter-occupied |
| Less than High School | 16 (24.6%) | 49 (75.4%) |
| High School Diploma | 81 (47.1%) | 91 (52.9%) |
| College/Associate Degree | 200 (73.0%) | 74 (27.0%) |
| Bachelor's Degree or higher | 41 (60.3%) | 27 (39.7%) |
Occupancy by Age of Householder in Kamiah
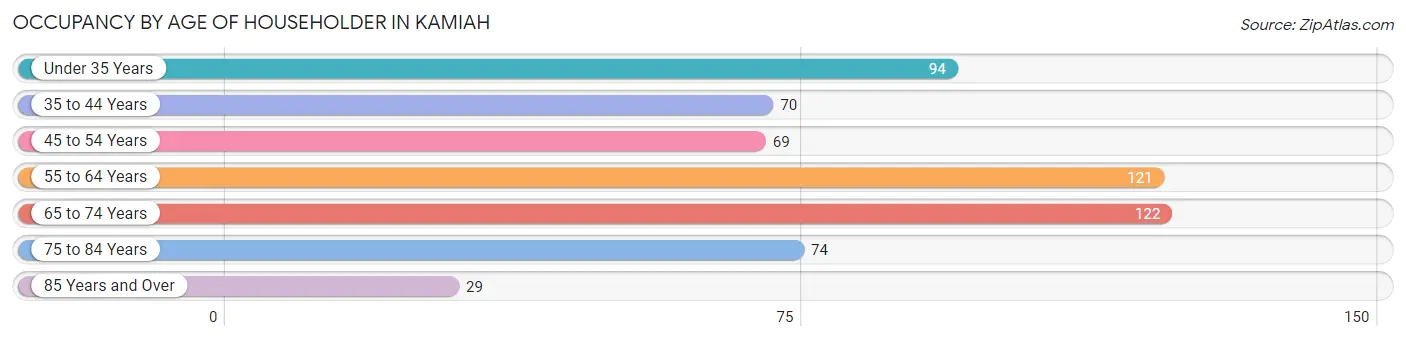
| Age Bracket | # Households | % Households |
| Under 35 Years | 94 | 16.2% |
| 35 to 44 Years | 70 | 12.1% |
| 45 to 54 Years | 69 | 11.9% |
| 55 to 64 Years | 121 | 20.9% |
| 65 to 74 Years | 122 | 21.1% |
| 75 to 84 Years | 74 | 12.8% |
| 85 Years and Over | 29 | 5.0% |
| Total | 579 | 100.0% |
Housing Finances in Kamiah
Median Income by Occupancy in Kamiah
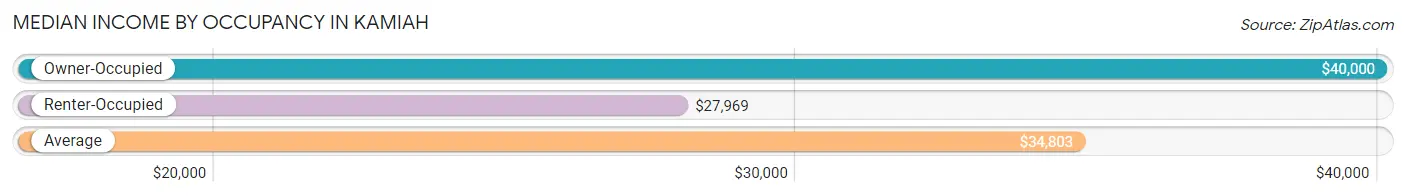
| Occupancy Type | # Households | Median Income |
| Owner-Occupied | 338 (58.4%) | $40,000 |
| Renter-Occupied | 241 (41.6%) | $27,969 |
| Average | 579 (100.0%) | $34,803 |
Occupancy by Householder Income Bracket in Kamiah
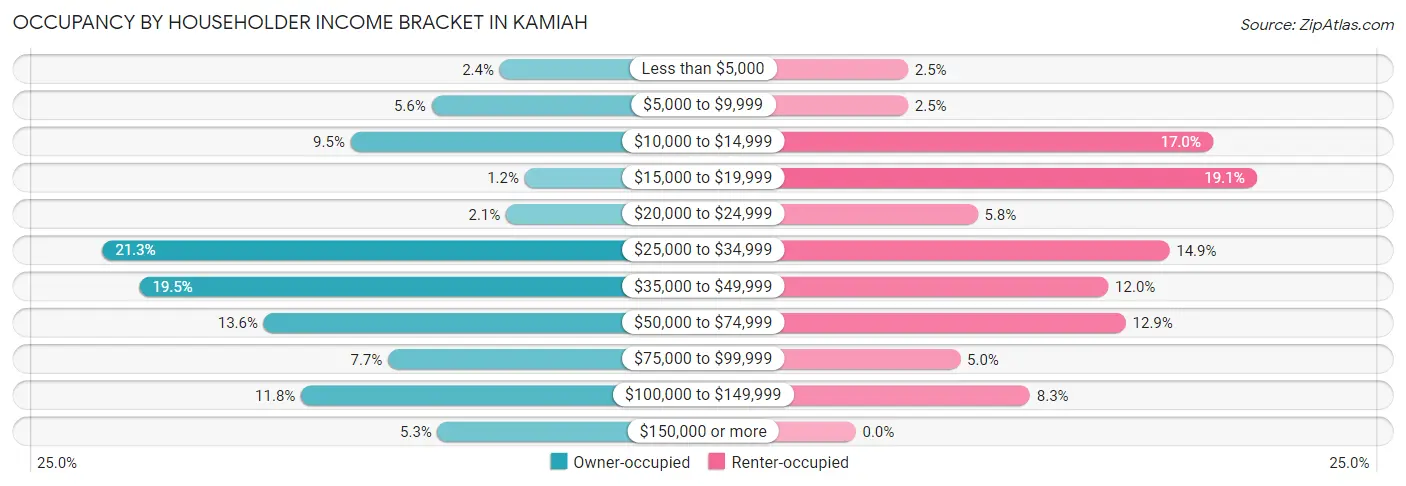
| Income Bracket | Owner-occupied | Renter-occupied |
| Less than $5,000 | 8 (2.4%) | 6 (2.5%) |
| $5,000 to $9,999 | 19 (5.6%) | 6 (2.5%) |
| $10,000 to $14,999 | 32 (9.5%) | 41 (17.0%) |
| $15,000 to $19,999 | 4 (1.2%) | 46 (19.1%) |
| $20,000 to $24,999 | 7 (2.1%) | 14 (5.8%) |
| $25,000 to $34,999 | 72 (21.3%) | 36 (14.9%) |
| $35,000 to $49,999 | 66 (19.5%) | 29 (12.0%) |
| $50,000 to $74,999 | 46 (13.6%) | 31 (12.9%) |
| $75,000 to $99,999 | 26 (7.7%) | 12 (5.0%) |
| $100,000 to $149,999 | 40 (11.8%) | 20 (8.3%) |
| $150,000 or more | 18 (5.3%) | 0 (0.0%) |
| Total | 338 (100.0%) | 241 (100.0%) |
Monthly Housing Cost Tiers in Kamiah
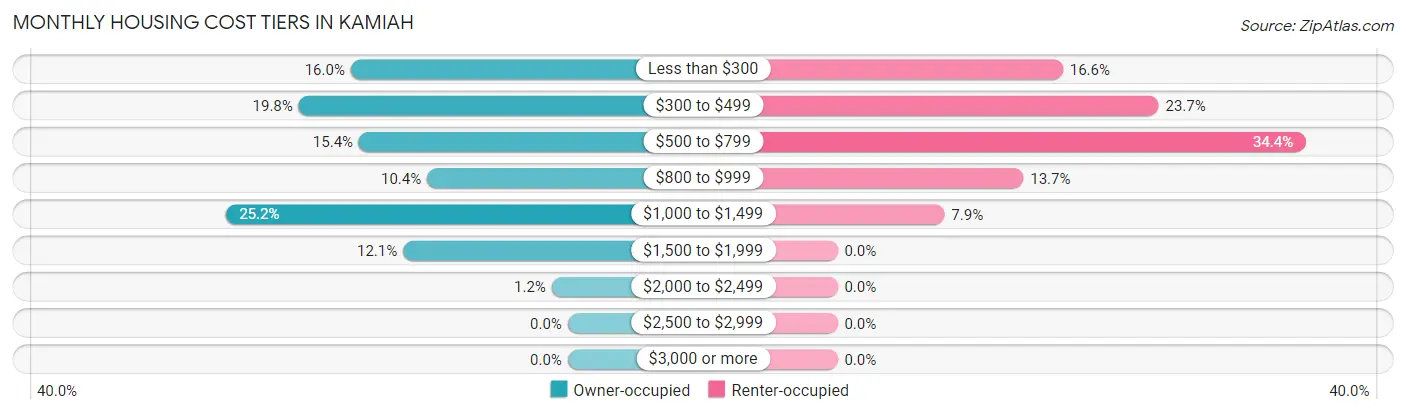
| Monthly Cost | Owner-occupied | Renter-occupied |
| Less than $300 | 54 (16.0%) | 40 (16.6%) |
| $300 to $499 | 67 (19.8%) | 57 (23.6%) |
| $500 to $799 | 52 (15.4%) | 83 (34.4%) |
| $800 to $999 | 35 (10.4%) | 33 (13.7%) |
| $1,000 to $1,499 | 85 (25.2%) | 19 (7.9%) |
| $1,500 to $1,999 | 41 (12.1%) | 0 (0.0%) |
| $2,000 to $2,499 | 4 (1.2%) | 0 (0.0%) |
| $2,500 to $2,999 | 0 (0.0%) | 0 (0.0%) |
| $3,000 or more | 0 (0.0%) | 0 (0.0%) |
| Total | 338 (100.0%) | 241 (100.0%) |
Physical Housing Characteristics in Kamiah
Housing Structures in Kamiah
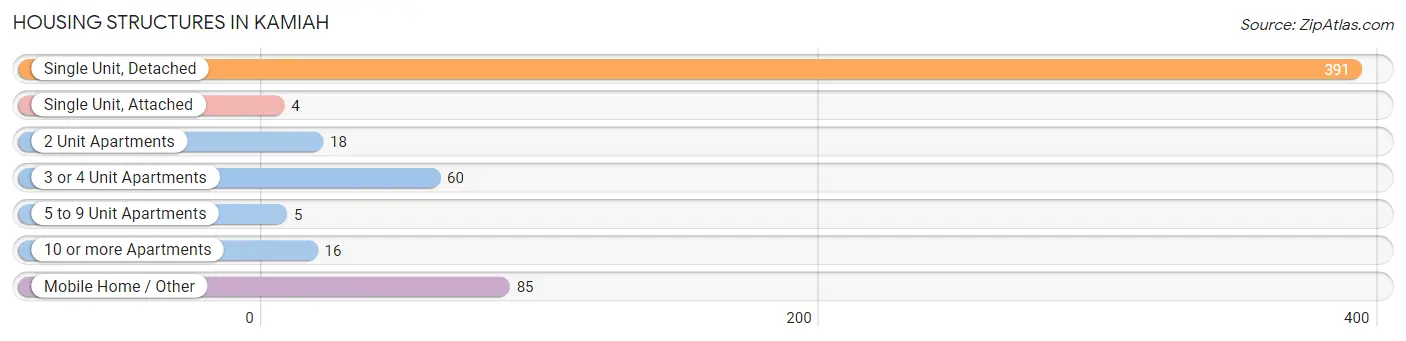
| Structure Type | # Housing Units | % Housing Units |
| Single Unit, Detached | 391 | 67.5% |
| Single Unit, Attached | 4 | 0.7% |
| 2 Unit Apartments | 18 | 3.1% |
| 3 or 4 Unit Apartments | 60 | 10.4% |
| 5 to 9 Unit Apartments | 5 | 0.9% |
| 10 or more Apartments | 16 | 2.8% |
| Mobile Home / Other | 85 | 14.7% |
| Total | 579 | 100.0% |
Housing Structures by Occupancy in Kamiah
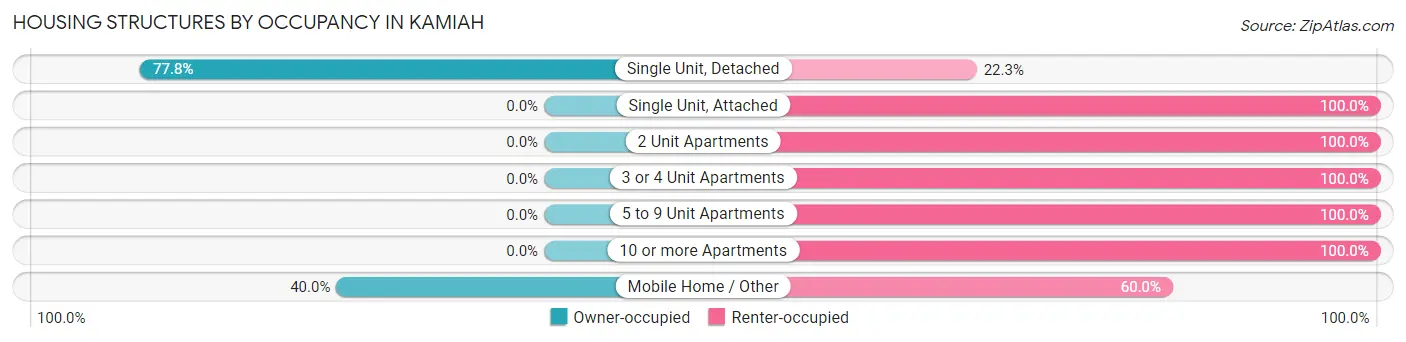
| Structure Type | Owner-occupied | Renter-occupied |
| Single Unit, Detached | 304 (77.7%) | 87 (22.3%) |
| Single Unit, Attached | 0 (0.0%) | 4 (100.0%) |
| 2 Unit Apartments | 0 (0.0%) | 18 (100.0%) |
| 3 or 4 Unit Apartments | 0 (0.0%) | 60 (100.0%) |
| 5 to 9 Unit Apartments | 0 (0.0%) | 5 (100.0%) |
| 10 or more Apartments | 0 (0.0%) | 16 (100.0%) |
| Mobile Home / Other | 34 (40.0%) | 51 (60.0%) |
| Total | 338 (58.4%) | 241 (41.6%) |
Housing Structures by Number of Rooms in Kamiah
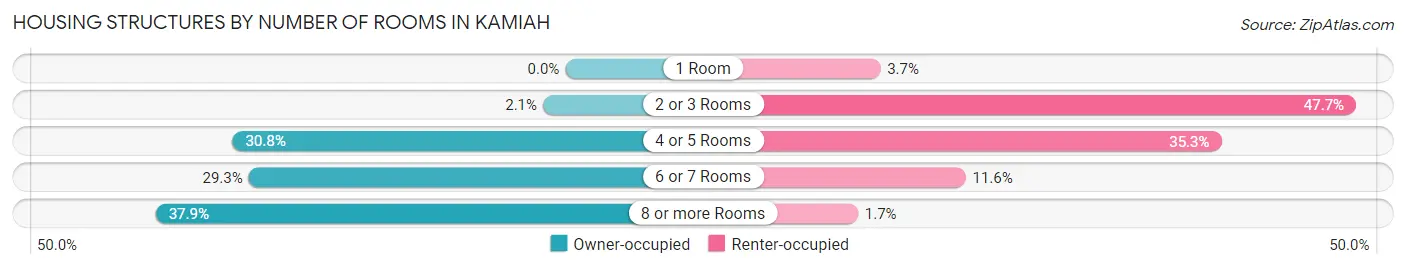
| Number of Rooms | Owner-occupied | Renter-occupied |
| 1 Room | 0 (0.0%) | 9 (3.7%) |
| 2 or 3 Rooms | 7 (2.1%) | 115 (47.7%) |
| 4 or 5 Rooms | 104 (30.8%) | 85 (35.3%) |
| 6 or 7 Rooms | 99 (29.3%) | 28 (11.6%) |
| 8 or more Rooms | 128 (37.9%) | 4 (1.7%) |
| Total | 338 (100.0%) | 241 (100.0%) |
Housing Structure by Heating Type in Kamiah
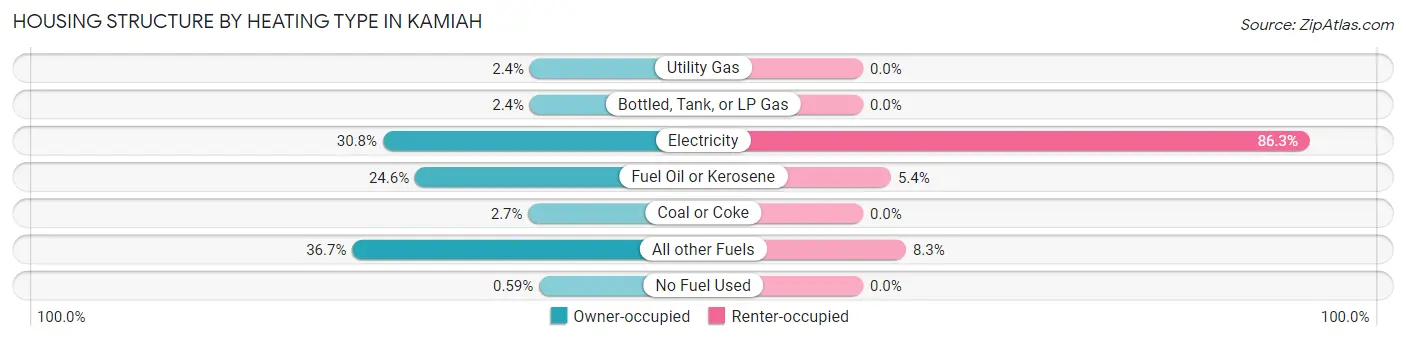
| Heating Type | Owner-occupied | Renter-occupied |
| Utility Gas | 8 (2.4%) | 0 (0.0%) |
| Bottled, Tank, or LP Gas | 8 (2.4%) | 0 (0.0%) |
| Electricity | 104 (30.8%) | 208 (86.3%) |
| Fuel Oil or Kerosene | 83 (24.6%) | 13 (5.4%) |
| Coal or Coke | 9 (2.7%) | 0 (0.0%) |
| All other Fuels | 124 (36.7%) | 20 (8.3%) |
| No Fuel Used | 2 (0.6%) | 0 (0.0%) |
| Total | 338 (100.0%) | 241 (100.0%) |
Household Vehicle Usage in Kamiah
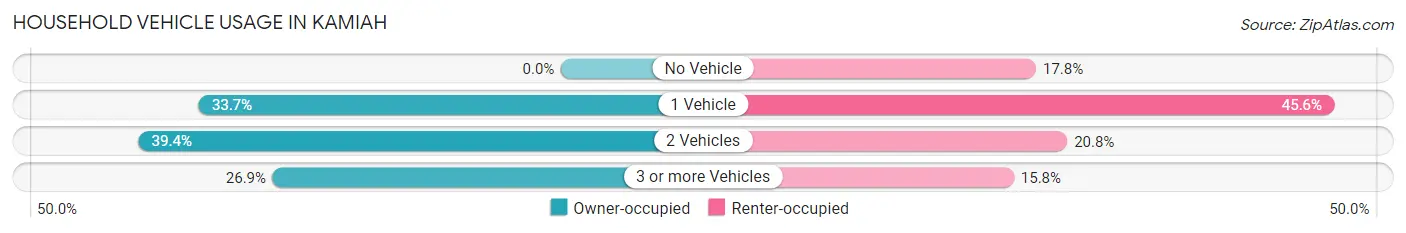
| Vehicles per Household | Owner-occupied | Renter-occupied |
| No Vehicle | 0 (0.0%) | 43 (17.8%) |
| 1 Vehicle | 114 (33.7%) | 110 (45.6%) |
| 2 Vehicles | 133 (39.4%) | 50 (20.7%) |
| 3 or more Vehicles | 91 (26.9%) | 38 (15.8%) |
| Total | 338 (100.0%) | 241 (100.0%) |
Real Estate & Mortgages in Kamiah
Real Estate and Mortgage Overview in Kamiah
| Characteristic | Without Mortgage | With Mortgage |
| Housing Units | 161 | 177 |
| Median Property Value | $173,300 | $219,400 |
| Median Household Income | $31,250 | $6 |
| Monthly Housing Costs | $332 | $0 |
| Real Estate Taxes | $839 | $3 |
Property Value by Mortgage Status in Kamiah
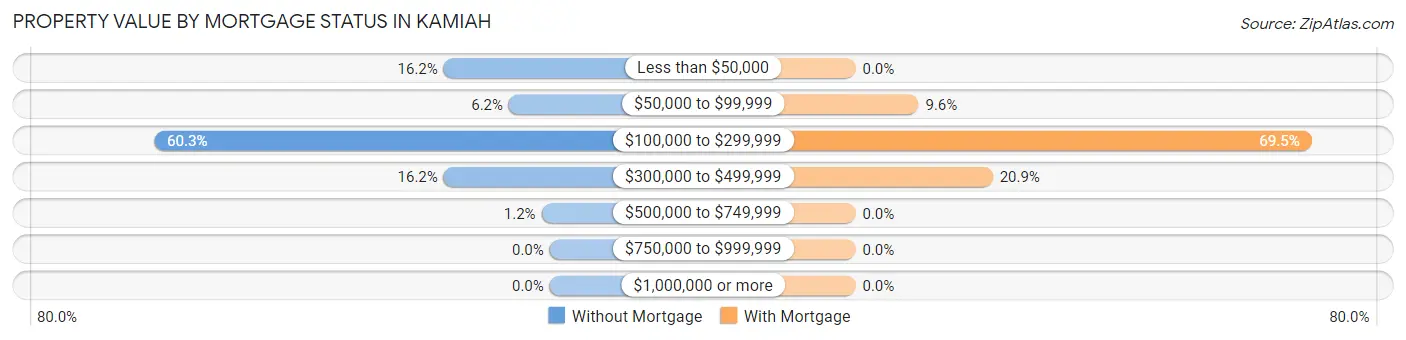
| Property Value | Without Mortgage | With Mortgage |
| Less than $50,000 | 26 (16.2%) | 0 (0.0%) |
| $50,000 to $99,999 | 10 (6.2%) | 17 (9.6%) |
| $100,000 to $299,999 | 97 (60.3%) | 123 (69.5%) |
| $300,000 to $499,999 | 26 (16.2%) | 37 (20.9%) |
| $500,000 to $749,999 | 2 (1.2%) | 0 (0.0%) |
| $750,000 to $999,999 | 0 (0.0%) | 0 (0.0%) |
| $1,000,000 or more | 0 (0.0%) | 0 (0.0%) |
| Total | 161 (100.0%) | 177 (100.0%) |
Household Income by Mortgage Status in Kamiah
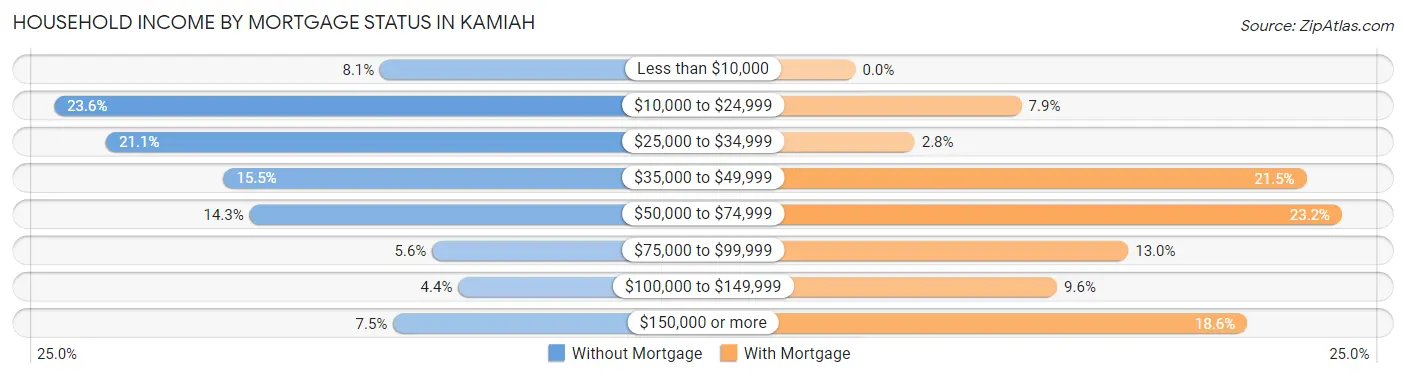
| Household Income | Without Mortgage | With Mortgage |
| Less than $10,000 | 13 (8.1%) | 0 (0.0%) |
| $10,000 to $24,999 | 38 (23.6%) | 14 (7.9%) |
| $25,000 to $34,999 | 34 (21.1%) | 5 (2.8%) |
| $35,000 to $49,999 | 25 (15.5%) | 38 (21.5%) |
| $50,000 to $74,999 | 23 (14.3%) | 41 (23.2%) |
| $75,000 to $99,999 | 9 (5.6%) | 23 (13.0%) |
| $100,000 to $149,999 | 7 (4.3%) | 17 (9.6%) |
| $150,000 or more | 12 (7.4%) | 33 (18.6%) |
| Total | 161 (100.0%) | 177 (100.0%) |
Property Value to Household Income Ratio in Kamiah
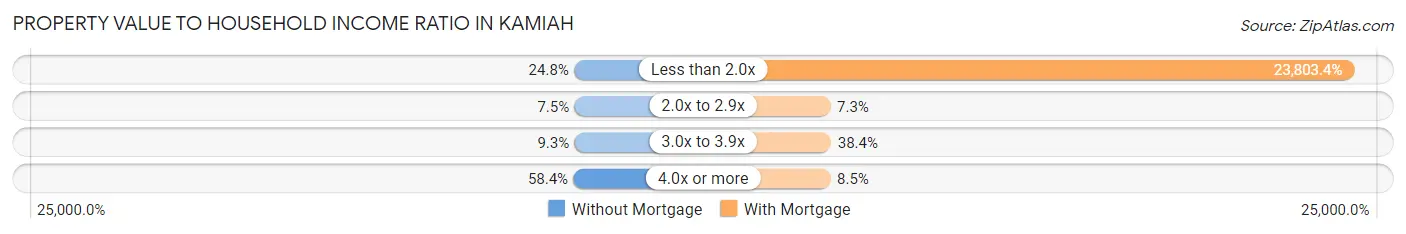
| Value-to-Income Ratio | Without Mortgage | With Mortgage |
| Less than 2.0x | 40 (24.8%) | 42,132 (23,803.4%) |
| 2.0x to 2.9x | 12 (7.4%) | 13 (7.3%) |
| 3.0x to 3.9x | 15 (9.3%) | 68 (38.4%) |
| 4.0x or more | 94 (58.4%) | 15 (8.5%) |
| Total | 161 (100.0%) | 177 (100.0%) |
Real Estate Taxes by Mortgage Status in Kamiah
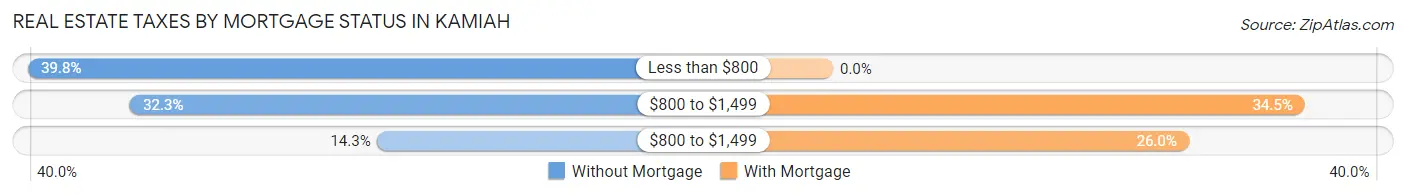
| Property Taxes | Without Mortgage | With Mortgage |
| Less than $800 | 64 (39.8%) | 0 (0.0%) |
| $800 to $1,499 | 52 (32.3%) | 61 (34.5%) |
| $800 to $1,499 | 23 (14.3%) | 46 (26.0%) |
| Total | 161 (100.0%) | 177 (100.0%) |
Health & Disability in Kamiah
Health Insurance Coverage by Age in Kamiah
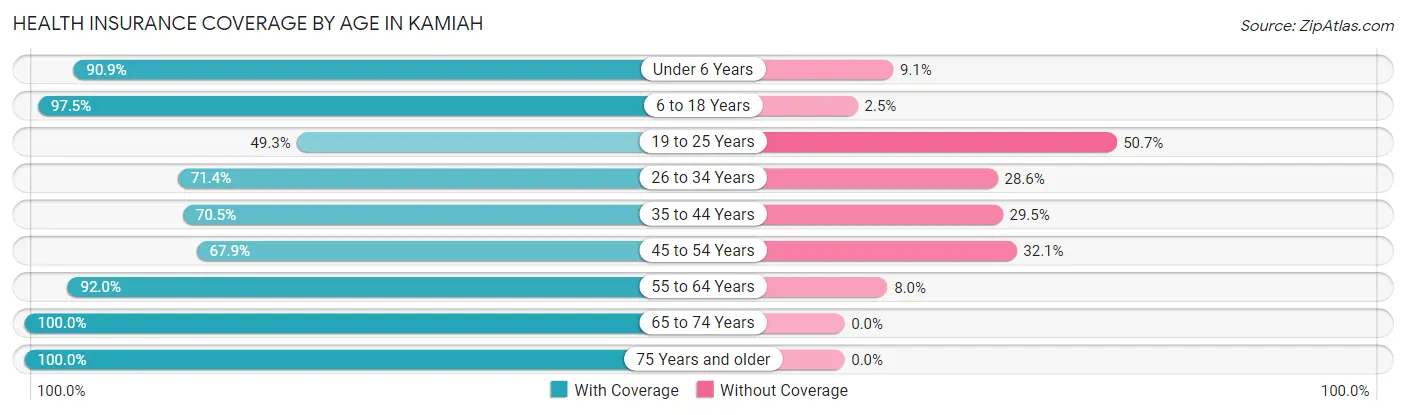
| Age Bracket | With Coverage | Without Coverage |
| Under 6 Years | 80 (90.9%) | 8 (9.1%) |
| 6 to 18 Years | 157 (97.5%) | 4 (2.5%) |
| 19 to 25 Years | 35 (49.3%) | 36 (50.7%) |
| 26 to 34 Years | 85 (71.4%) | 34 (28.6%) |
| 35 to 44 Years | 86 (70.5%) | 36 (29.5%) |
| 45 to 54 Years | 91 (67.9%) | 43 (32.1%) |
| 55 to 64 Years | 149 (92.0%) | 13 (8.0%) |
| 65 to 74 Years | 189 (100.0%) | 0 (0.0%) |
| 75 Years and older | 164 (100.0%) | 0 (0.0%) |
| Total | 1,036 (85.6%) | 174 (14.4%) |
Health Insurance Coverage by Citizenship Status in Kamiah
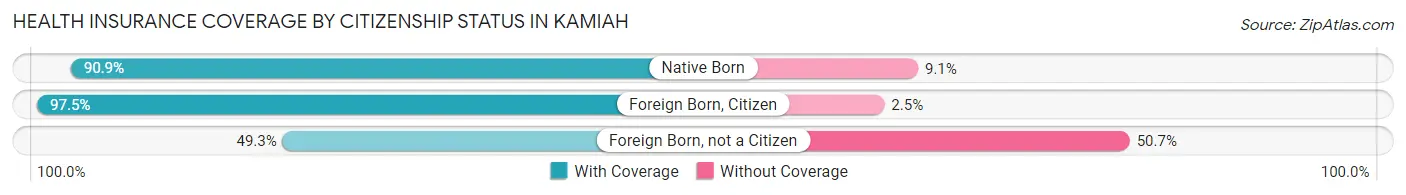
| Citizenship Status | With Coverage | Without Coverage |
| Native Born | 80 (90.9%) | 8 (9.1%) |
| Foreign Born, Citizen | 157 (97.5%) | 4 (2.5%) |
| Foreign Born, not a Citizen | 35 (49.3%) | 36 (50.7%) |
Health Insurance Coverage by Household Income in Kamiah
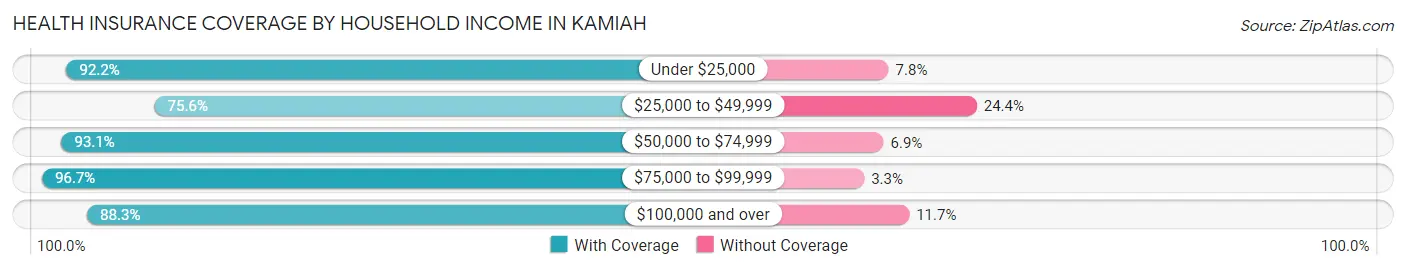
| Household Income | With Coverage | Without Coverage |
| Under $25,000 | 235 (92.2%) | 20 (7.8%) |
| $25,000 to $49,999 | 357 (75.6%) | 115 (24.4%) |
| $50,000 to $74,999 | 189 (93.1%) | 14 (6.9%) |
| $75,000 to $99,999 | 89 (96.7%) | 3 (3.3%) |
| $100,000 and over | 166 (88.3%) | 22 (11.7%) |
Public vs Private Health Insurance Coverage by Age in Kamiah
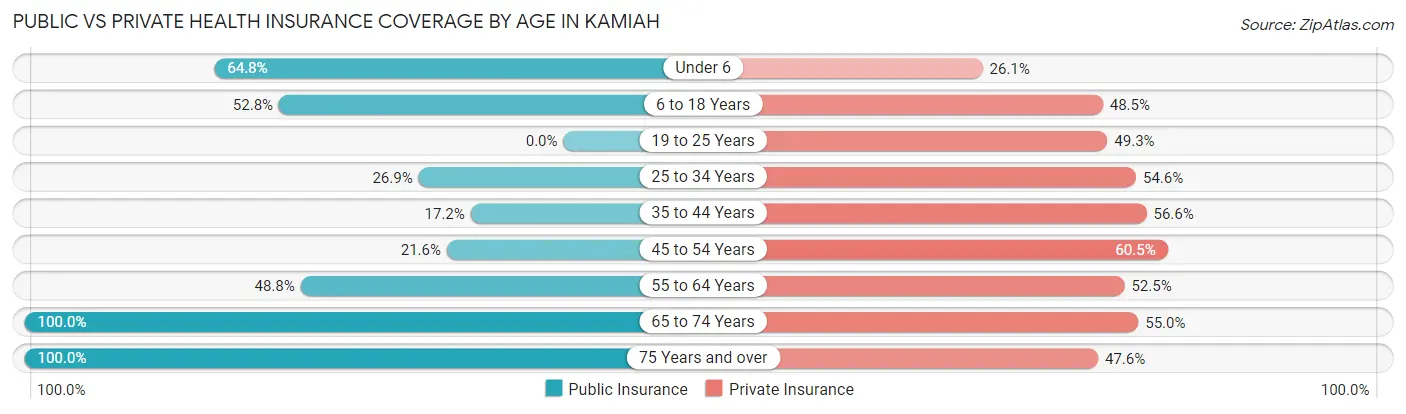
| Age Bracket | Public Insurance | Private Insurance |
| Under 6 | 57 (64.8%) | 23 (26.1%) |
| 6 to 18 Years | 85 (52.8%) | 78 (48.4%) |
| 19 to 25 Years | 0 (0.0%) | 35 (49.3%) |
| 25 to 34 Years | 32 (26.9%) | 65 (54.6%) |
| 35 to 44 Years | 21 (17.2%) | 69 (56.6%) |
| 45 to 54 Years | 29 (21.6%) | 81 (60.5%) |
| 55 to 64 Years | 79 (48.8%) | 85 (52.5%) |
| 65 to 74 Years | 189 (100.0%) | 104 (55.0%) |
| 75 Years and over | 164 (100.0%) | 78 (47.6%) |
| Total | 656 (54.2%) | 618 (51.1%) |
Disability Status by Sex by Age in Kamiah
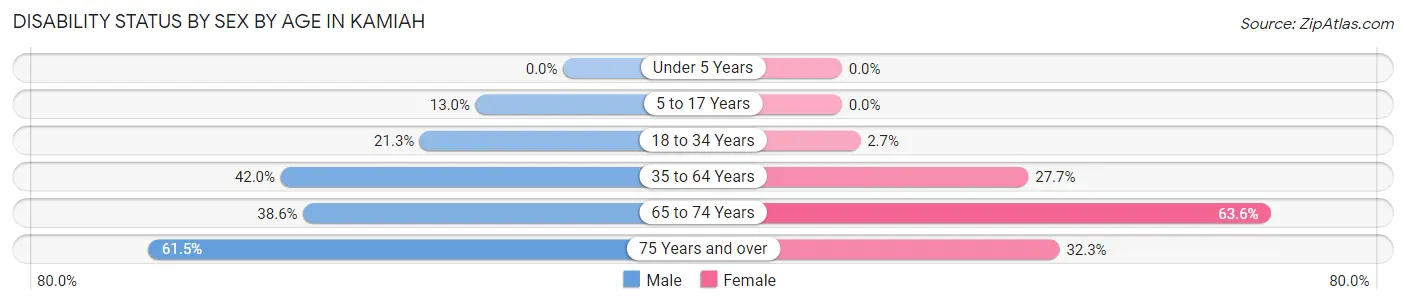
| Age Bracket | Male | Female |
| Under 5 Years | 0 (0.0%) | 0 (0.0%) |
| 5 to 17 Years | 10 (13.0%) | 0 (0.0%) |
| 18 to 34 Years | 27 (21.3%) | 2 (2.7%) |
| 35 to 64 Years | 86 (41.9%) | 59 (27.7%) |
| 65 to 74 Years | 22 (38.6%) | 84 (63.6%) |
| 75 Years and over | 40 (61.5%) | 32 (32.3%) |
Disability Class by Sex by Age in Kamiah
Disability Class: Hearing Difficulty
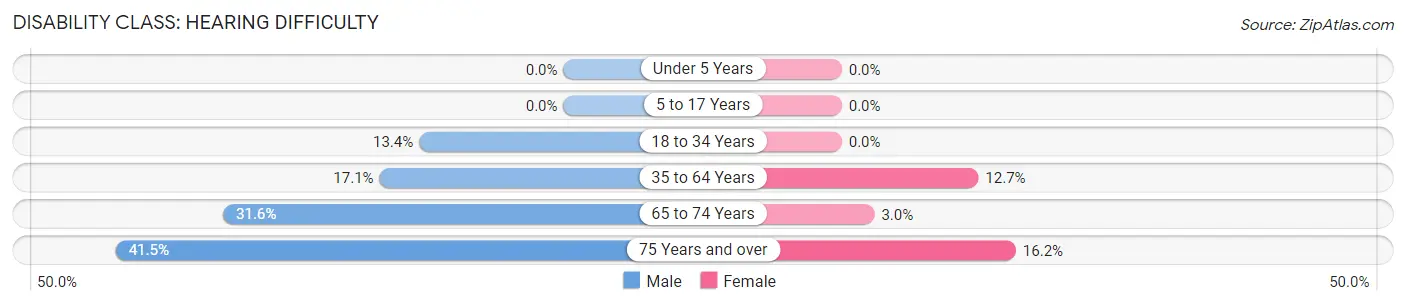
| Age Bracket | Male | Female |
| Under 5 Years | 0 (0.0%) | 0 (0.0%) |
| 5 to 17 Years | 0 (0.0%) | 0 (0.0%) |
| 18 to 34 Years | 17 (13.4%) | 0 (0.0%) |
| 35 to 64 Years | 35 (17.1%) | 27 (12.7%) |
| 65 to 74 Years | 18 (31.6%) | 4 (3.0%) |
| 75 Years and over | 27 (41.5%) | 16 (16.2%) |
Disability Class: Vision Difficulty
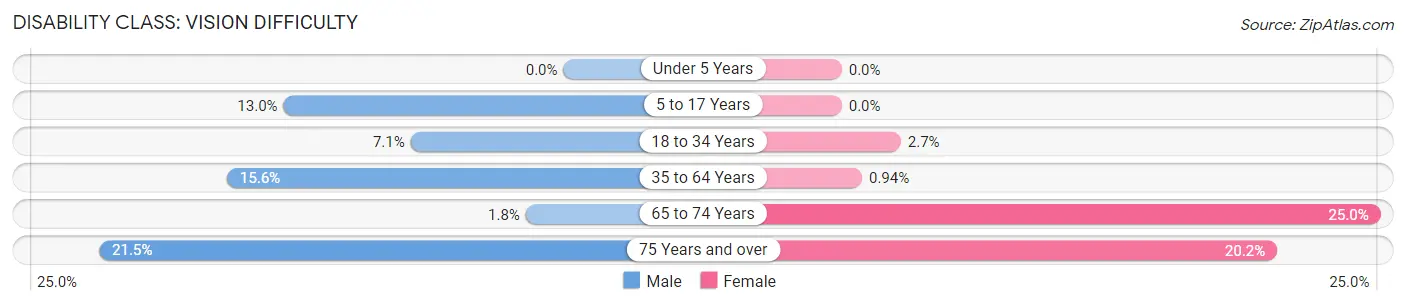
| Age Bracket | Male | Female |
| Under 5 Years | 0 (0.0%) | 0 (0.0%) |
| 5 to 17 Years | 10 (13.0%) | 0 (0.0%) |
| 18 to 34 Years | 9 (7.1%) | 2 (2.7%) |
| 35 to 64 Years | 32 (15.6%) | 2 (0.9%) |
| 65 to 74 Years | 1 (1.8%) | 33 (25.0%) |
| 75 Years and over | 14 (21.5%) | 20 (20.2%) |
Disability Class: Cognitive Difficulty
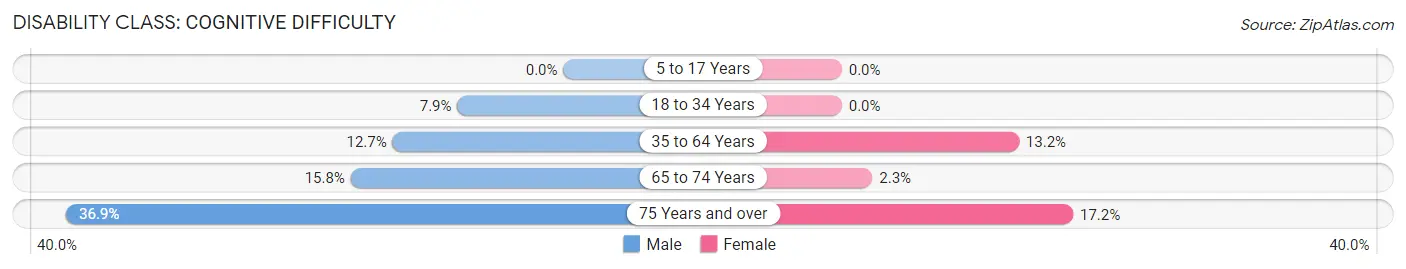
| Age Bracket | Male | Female |
| 5 to 17 Years | 0 (0.0%) | 0 (0.0%) |
| 18 to 34 Years | 10 (7.9%) | 0 (0.0%) |
| 35 to 64 Years | 26 (12.7%) | 28 (13.2%) |
| 65 to 74 Years | 9 (15.8%) | 3 (2.3%) |
| 75 Years and over | 24 (36.9%) | 17 (17.2%) |
Disability Class: Ambulatory Difficulty
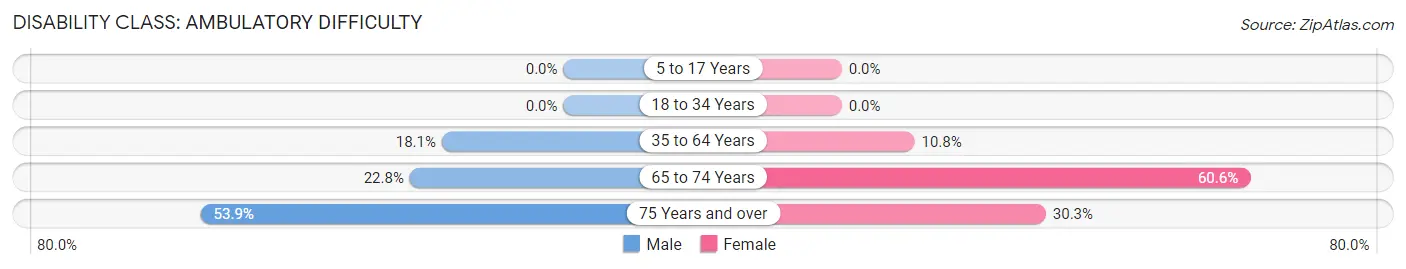
| Age Bracket | Male | Female |
| 5 to 17 Years | 0 (0.0%) | 0 (0.0%) |
| 18 to 34 Years | 0 (0.0%) | 0 (0.0%) |
| 35 to 64 Years | 37 (18.0%) | 23 (10.8%) |
| 65 to 74 Years | 13 (22.8%) | 80 (60.6%) |
| 75 Years and over | 35 (53.8%) | 30 (30.3%) |
Disability Class: Self-Care Difficulty
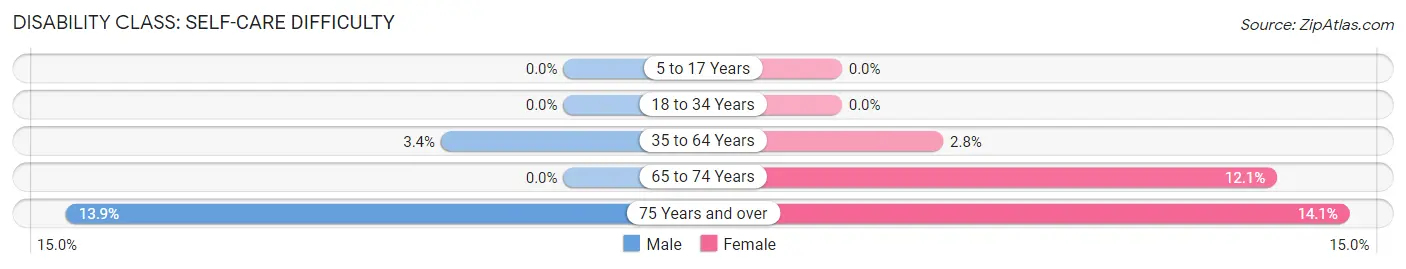
| Age Bracket | Male | Female |
| 5 to 17 Years | 0 (0.0%) | 0 (0.0%) |
| 18 to 34 Years | 0 (0.0%) | 0 (0.0%) |
| 35 to 64 Years | 7 (3.4%) | 6 (2.8%) |
| 65 to 74 Years | 0 (0.0%) | 16 (12.1%) |
| 75 Years and over | 9 (13.9%) | 14 (14.1%) |
Technology Access in Kamiah
Computing Device Access in Kamiah
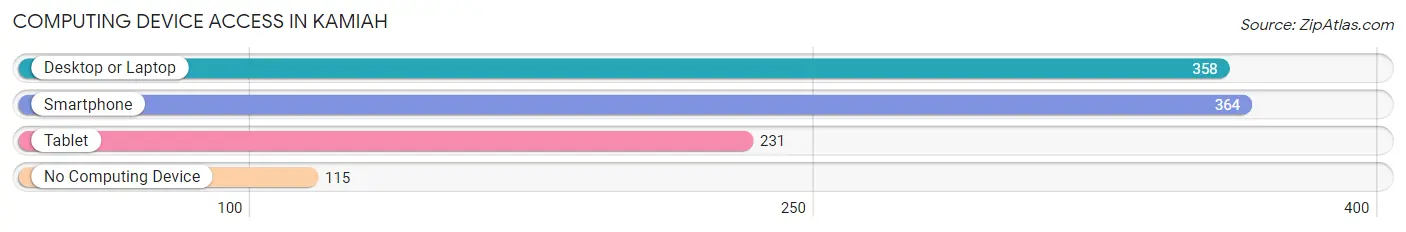
| Device Type | # Households | % Households |
| Desktop or Laptop | 358 | 61.8% |
| Smartphone | 364 | 62.9% |
| Tablet | 231 | 39.9% |
| No Computing Device | 115 | 19.9% |
| Total | 579 | 100.0% |
Internet Access in Kamiah
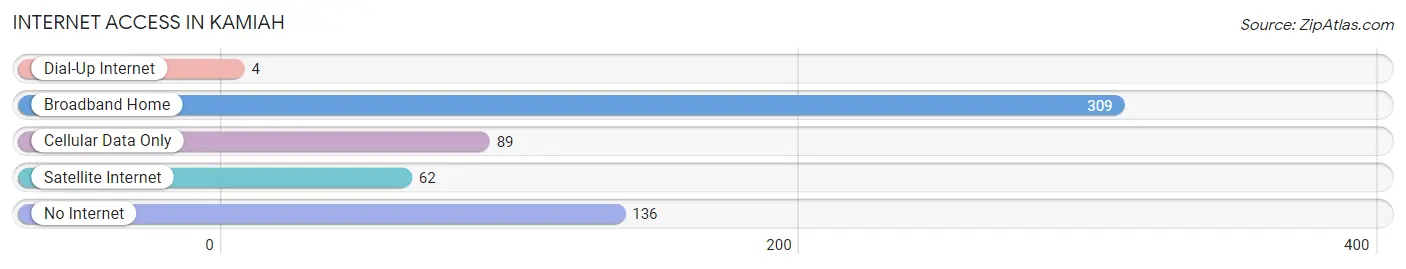
| Internet Type | # Households | % Households |
| Dial-Up Internet | 4 | 0.7% |
| Broadband Home | 309 | 53.4% |
| Cellular Data Only | 89 | 15.4% |
| Satellite Internet | 62 | 10.7% |
| No Internet | 136 | 23.5% |
| Total | 579 | 100.0% |
Kamiah Summary
Kamiah is a small city located in the Clearwater Valley of Idaho, United States. It is the county seat of Lewis County and is situated along the Clearwater River. The city is located in the foothills of the Bitterroot Mountains and is surrounded by rolling hills and forests. The population of Kamiah was 1,717 at the 2010 census.
Geography
Kamiah is located at the confluence of the Clearwater and Lochsa Rivers in the Clearwater Valley of north-central Idaho. The city is situated in the foothills of the Bitterroot Mountains and is surrounded by rolling hills and forests. The elevation of Kamiah is 1,845 feet (562 m) above sea level.
The city is located along U.S. Route 12, which connects it to Lewiston to the west and Missoula, Montana to the east. The Nez Perce National Forest is located to the north of Kamiah, and the Clearwater National Forest is located to the south.
History
Kamiah was founded in 1864 by a group of Nez Perce Indians led by Chief Kamiakin. The city was named after the chief and was originally known as Kamiah Village. The city was incorporated in 1891 and was the first incorporated city in Lewis County.
Kamiah was an important trading center for the Nez Perce Indians and was the site of the first trading post in the area. The city was also the site of the first school in the county, which was established in 1871.
Economy
Kamiah is a small city with a limited economy. The city’s main industries are timber, agriculture, and tourism. The city is home to several sawmills and lumber companies, as well as several farms and ranches.
The city is also a popular tourist destination, with many visitors coming to the area to enjoy the nearby rivers, lakes, and forests. The city is home to several campgrounds, RV parks, and other outdoor recreation areas.
Demographics
As of the 2010 census, the population of Kamiah was 1,717. The racial makeup of the city was 92.2% White, 0.3% African American, 1.2% Native American, 0.2% Asian, 0.1% Pacific Islander, 0.7% from other races, and 5.3% from two or more races. Hispanic or Latino of any race were 2.2% of the population.
The median income for a household in Kamiah was $30,938, and the median income for a family was $37,500. The per capita income for the city was $17,845. About 17.2% of families and 20.2% of the population were below the poverty line, including 28.3% of those under age 18 and 11.2% of those age 65 or over.
Kamiah is a small city with a rich history and a unique culture. The city is home to a diverse population and is a popular tourist destination. The city’s economy is largely based on timber, agriculture, and tourism, and the city is home to several sawmills, farms, and outdoor recreation areas.
Common Questions
What is Per Capita Income in Kamiah?
Per Capita income in Kamiah is $23,036.
What is the Median Family Income in Kamiah?
Median Family Income in Kamiah is $47,917.
What is the Median Household income in Kamiah?
Median Household Income in Kamiah is $34,803.
What is Income or Wage Gap in Kamiah?
Income or Wage Gap in Kamiah is 42.1%.
Women in Kamiah earn 57.9 cents for every dollar earned by a man.
What is Inequality or Gini Index in Kamiah?
Inequality or Gini Index in Kamiah is 0.44.
What is the Total Population of Kamiah?
Total Population of Kamiah is 1,210.
What is the Total Male Population of Kamiah?
Total Male Population of Kamiah is 554.
What is the Total Female Population of Kamiah?
Total Female Population of Kamiah is 656.
What is the Ratio of Males per 100 Females in Kamiah?
There are 84.45 Males per 100 Females in Kamiah.
What is the Ratio of Females per 100 Males in Kamiah?
There are 118.41 Females per 100 Males in Kamiah.
What is the Median Population Age in Kamiah?
Median Population Age in Kamiah is 48.7 Years.
What is the Average Family Size in Kamiah
Average Family Size in Kamiah is 3.0 People.
What is the Average Household Size in Kamiah
Average Household Size in Kamiah is 2.1 People.
How Large is the Labor Force in Kamiah?
There are 460 People in the Labor Forcein in Kamiah.
What is the Percentage of People in the Labor Force in Kamiah?
46.6% of People are in the Labor Force in Kamiah.
What is the Unemployment Rate in Kamiah?
Unemployment Rate in Kamiah is 6.1%.