Greenleaf, ID Map & Demographics
Greenleaf Map
Greenleaf Overview
$28,467
PER CAPITA INCOME
$79,531
AVG FAMILY INCOME
$56,289
AVG HOUSEHOLD INCOME
33.0%
WAGE / INCOME GAP [ % ]
67.0¢/ $1
WAGE / INCOME GAP [ $ ]
0.35
INEQUALITY / GINI INDEX
995
TOTAL POPULATION
525
MALE POPULATION
470
FEMALE POPULATION
111.70
MALES / 100 FEMALES
89.52
FEMALES / 100 MALES
44.6
MEDIAN AGE
2.8
AVG FAMILY SIZE
2.4
AVG HOUSEHOLD SIZE
519
LABOR FORCE [ PEOPLE ]
63.7%
PERCENT IN LABOR FORCE
6.0%
UNEMPLOYMENT RATE
Greenleaf Zip Codes
Greenleaf Area Codes
Income in Greenleaf
Income Overview in Greenleaf
Per Capita Income in Greenleaf is $28,467, while median incomes of families and households are $79,531 and $56,289 respectively.
| Characteristic | Number | Measure |
| Per Capita Income | 995 | $28,467 |
| Median Family Income | 289 | $79,531 |
| Mean Family Income | 289 | $85,125 |
| Median Household Income | 407 | $56,289 |
| Mean Household Income | 407 | $71,540 |
| Income Deficit | 289 | $0 |
| Wage / Income Gap (%) | 995 | 33.02% |
| Wage / Income Gap ($) | 995 | 66.98¢ per $1 |
| Gini / Inequality Index | 995 | 0.35 |
Earnings by Sex in Greenleaf
Average Earnings in Greenleaf are $30,036, $33,684 for men and $22,563 for women, a difference of 33.0%.
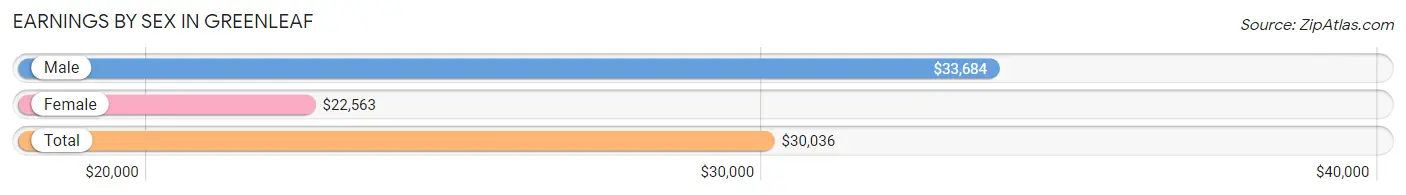
| Sex | Number | Average Earnings |
| Male | 338 (60.7%) | $33,684 |
| Female | 219 (39.3%) | $22,563 |
| Total | 557 (100.0%) | $30,036 |
Earnings by Sex by Income Bracket in Greenleaf
The most common earnings brackets in Greenleaf are $2,500 to $4,999 for men (62 | 18.3%) and $15,000 to $17,499 for women (25 | 11.4%).
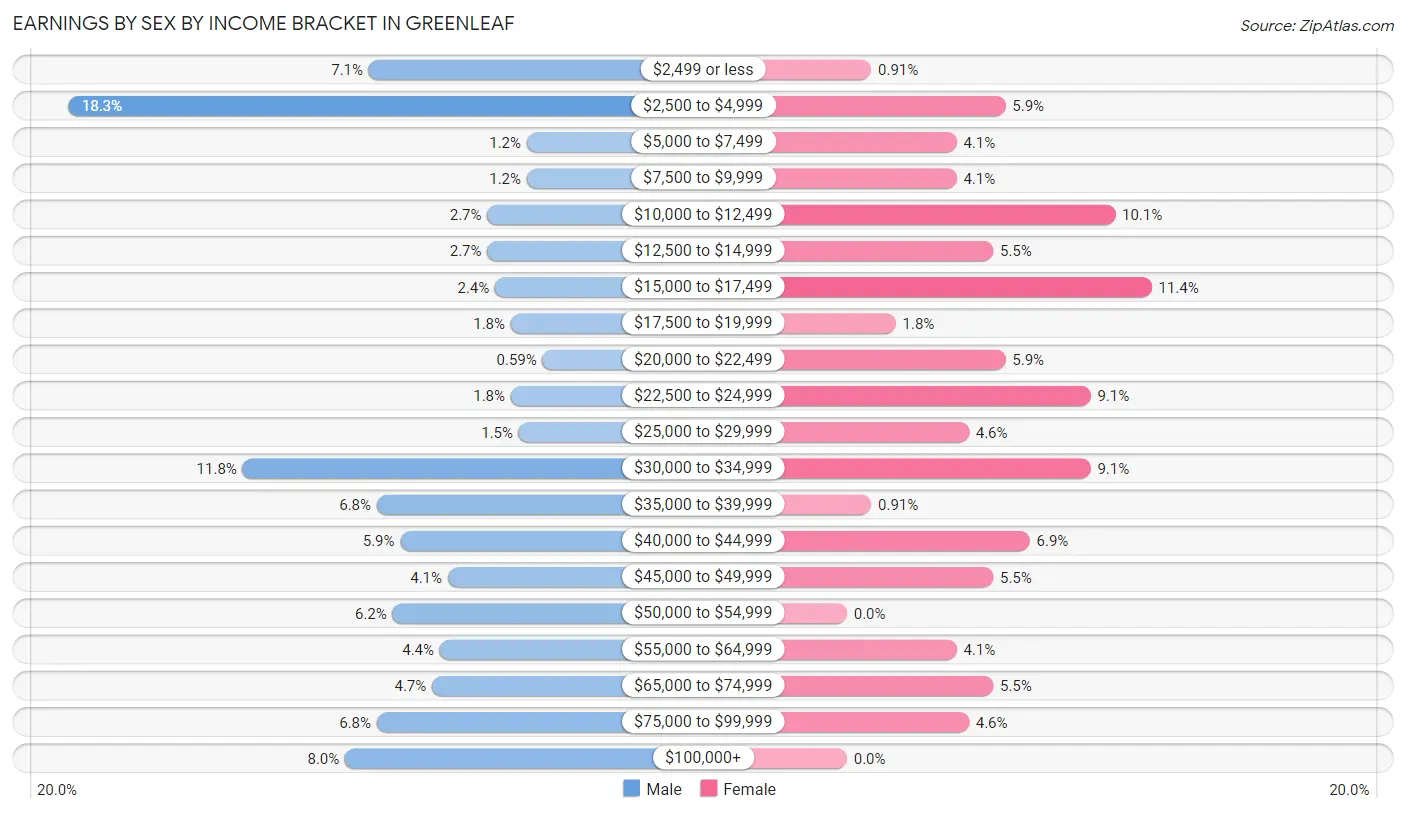
| Income | Male | Female |
| $2,499 or less | 24 (7.1%) | 2 (0.9%) |
| $2,500 to $4,999 | 62 (18.3%) | 13 (5.9%) |
| $5,000 to $7,499 | 4 (1.2%) | 9 (4.1%) |
| $7,500 to $9,999 | 4 (1.2%) | 9 (4.1%) |
| $10,000 to $12,499 | 9 (2.7%) | 22 (10.1%) |
| $12,500 to $14,999 | 9 (2.7%) | 12 (5.5%) |
| $15,000 to $17,499 | 8 (2.4%) | 25 (11.4%) |
| $17,500 to $19,999 | 6 (1.8%) | 4 (1.8%) |
| $20,000 to $22,499 | 2 (0.6%) | 13 (5.9%) |
| $22,500 to $24,999 | 6 (1.8%) | 20 (9.1%) |
| $25,000 to $29,999 | 5 (1.5%) | 10 (4.6%) |
| $30,000 to $34,999 | 40 (11.8%) | 20 (9.1%) |
| $35,000 to $39,999 | 23 (6.8%) | 2 (0.9%) |
| $40,000 to $44,999 | 20 (5.9%) | 15 (6.9%) |
| $45,000 to $49,999 | 14 (4.1%) | 12 (5.5%) |
| $50,000 to $54,999 | 21 (6.2%) | 0 (0.0%) |
| $55,000 to $64,999 | 15 (4.4%) | 9 (4.1%) |
| $65,000 to $74,999 | 16 (4.7%) | 12 (5.5%) |
| $75,000 to $99,999 | 23 (6.8%) | 10 (4.6%) |
| $100,000+ | 27 (8.0%) | 0 (0.0%) |
| Total | 338 (100.0%) | 219 (100.0%) |
Earnings by Sex by Educational Attainment in Greenleaf
Average earnings in Greenleaf are $37,813 for men and $22,500 for women, a difference of 40.5%. Men with an educational attainment of graduate degree enjoy the highest average annual earnings of $71,250, while those with bachelor's degree education earn the least with $32,031. Women with an educational attainment of graduate degree earn the most with the average annual earnings of $60,417, while those with college or associate's degree education have the smallest earnings of $15,962.
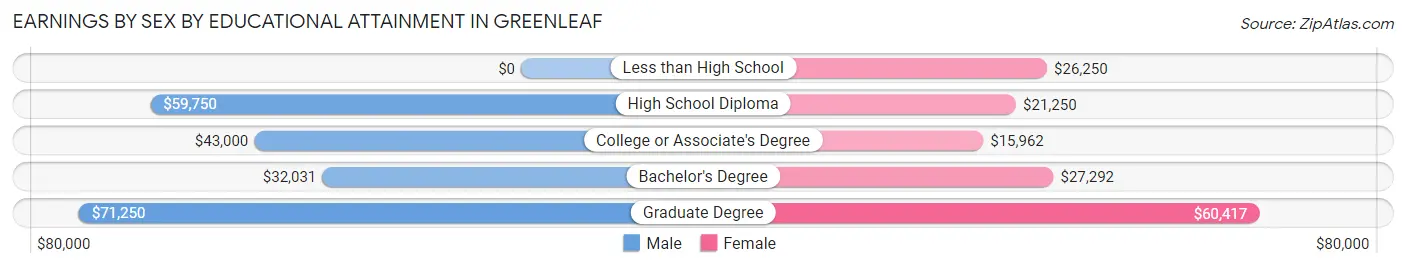
| Educational Attainment | Male Income | Female Income |
| Less than High School | - | - |
| High School Diploma | $59,750 | $21,250 |
| College or Associate's Degree | $43,000 | $15,962 |
| Bachelor's Degree | $32,031 | $27,292 |
| Graduate Degree | $71,250 | $60,417 |
| Total | $37,813 | $22,500 |
Family Income in Greenleaf
Family Income Brackets in Greenleaf
According to the Greenleaf family income data, there are 88 families falling into the $50,000 to $74,999 income range, which is the most common income bracket and makes up 30.4% of all families. Conversely, the $200,000+ income bracket is the least frequent group with only 1 families (0.4%) belonging to this category.
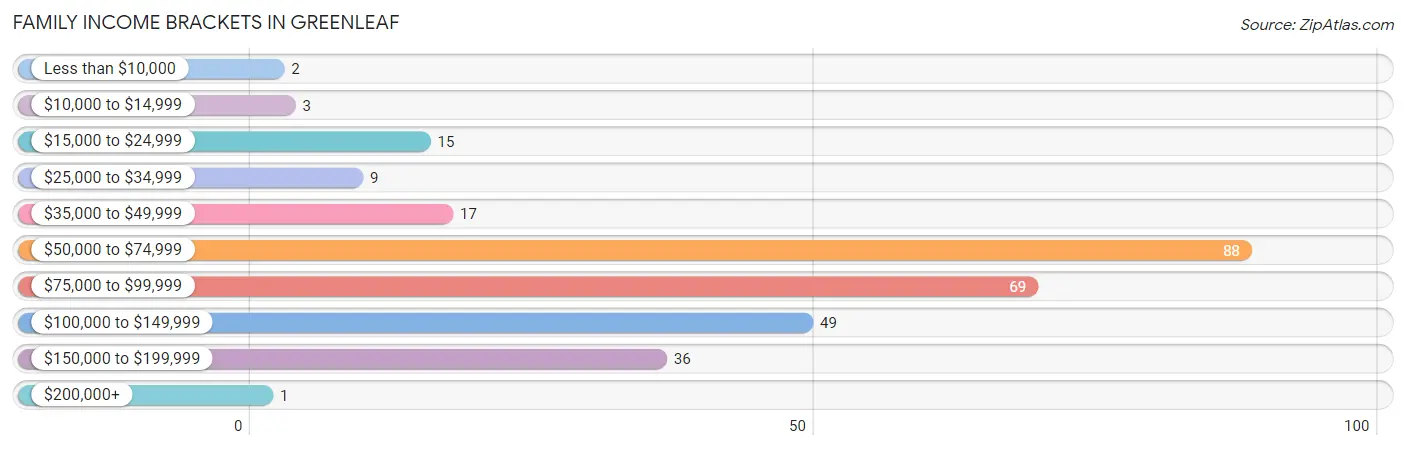
| Income Bracket | # Families | % Families |
| Less than $10,000 | 2 | 0.7% |
| $10,000 to $14,999 | 3 | 1.0% |
| $15,000 to $24,999 | 15 | 5.2% |
| $25,000 to $34,999 | 9 | 3.1% |
| $35,000 to $49,999 | 17 | 5.9% |
| $50,000 to $74,999 | 88 | 30.4% |
| $75,000 to $99,999 | 69 | 23.9% |
| $100,000 to $149,999 | 49 | 17.0% |
| $150,000 to $199,999 | 36 | 12.5% |
| $200,000+ | 1 | 0.3% |
Family Income by Famaliy Size in Greenleaf
3-person families (57 | 19.7%) account for the highest median family income in Greenleaf with $119,583 per family, while 3-person families (57 | 19.7%) have the highest median income of $39,861 per family member.
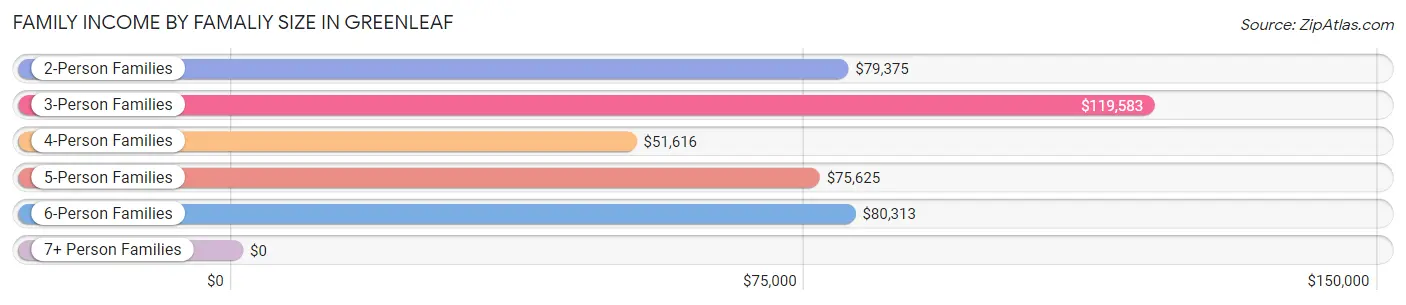
| Income Bracket | # Families | Median Income |
| 2-Person Families | 148 (51.2%) | $79,375 |
| 3-Person Families | 57 (19.7%) | $119,583 |
| 4-Person Families | 61 (21.1%) | $51,616 |
| 5-Person Families | 14 (4.8%) | $75,625 |
| 6-Person Families | 9 (3.1%) | $80,313 |
| 7+ Person Families | 0 (0.0%) | $0 |
| Total | 289 (100.0%) | $79,531 |
Family Income by Number of Earners in Greenleaf
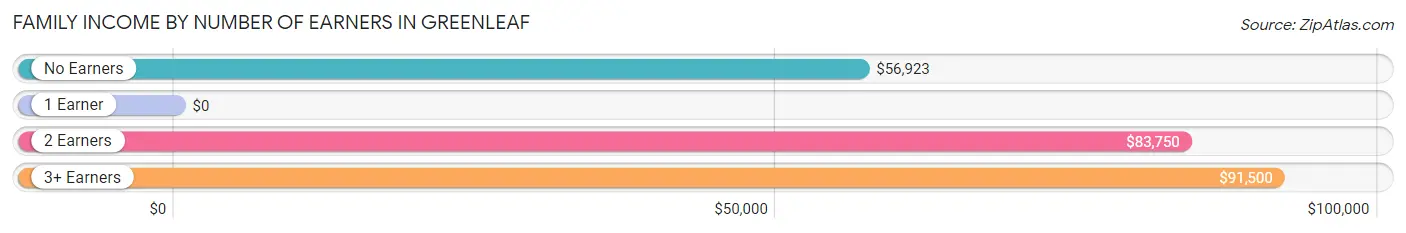
| Number of Earners | # Families | Median Income |
| No Earners | 62 (21.4%) | $56,923 |
| 1 Earner | 96 (33.2%) | $0 |
| 2 Earners | 91 (31.5%) | $83,750 |
| 3+ Earners | 40 (13.8%) | $91,500 |
| Total | 289 (100.0%) | $79,531 |
Household Income in Greenleaf
Household Income Brackets in Greenleaf
With 113 households falling in the category, the $50,000 to $74,999 income range is the most frequent in Greenleaf, accounting for 27.8% of all households. In contrast, only 1 households (0.3%) fall into the $200,000+ income bracket, making it the least populous group.
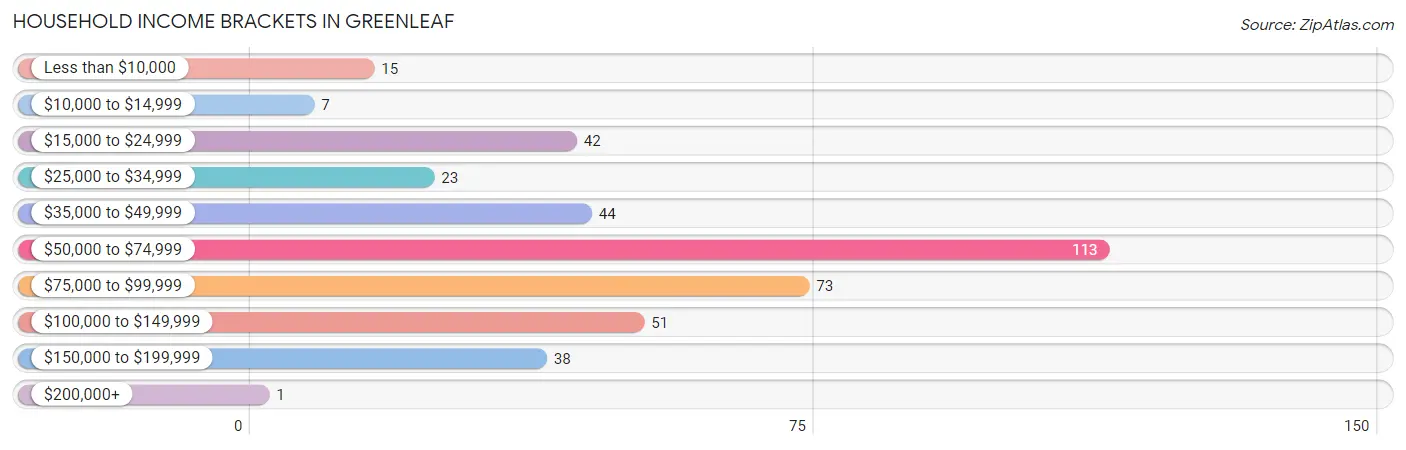
| Income Bracket | # Households | % Households |
| Less than $10,000 | 15 | 3.7% |
| $10,000 to $14,999 | 7 | 1.7% |
| $15,000 to $24,999 | 42 | 10.3% |
| $25,000 to $34,999 | 23 | 5.7% |
| $35,000 to $49,999 | 44 | 10.8% |
| $50,000 to $74,999 | 113 | 27.8% |
| $75,000 to $99,999 | 73 | 17.9% |
| $100,000 to $149,999 | 51 | 12.5% |
| $150,000 to $199,999 | 38 | 9.3% |
| $200,000+ | 1 | 0.2% |
Household Income by Householder Age in Greenleaf
The median household income in Greenleaf is $56,289, with the highest median household income of $80,000 found in the 45 to 64 years age bracket for the primary householder. A total of 142 households (34.9%) fall into this category. Meanwhile, the 25 to 44 years age bracket for the primary householder has the lowest median household income of $51,829, with 124 households (30.5%) in this group.
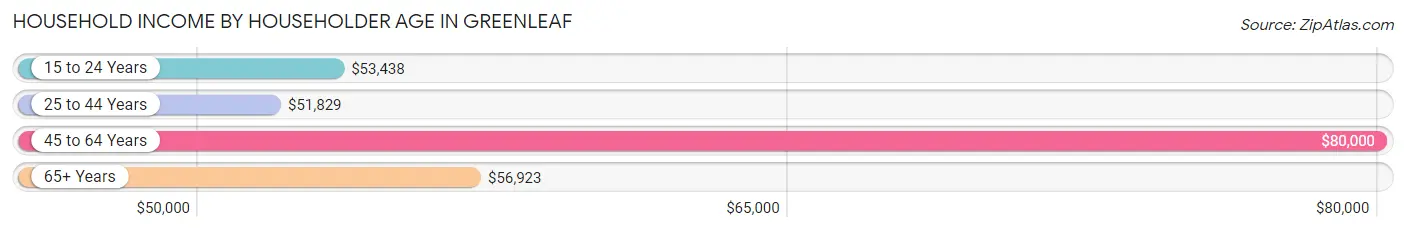
| Income Bracket | # Households | Median Income |
| 15 to 24 Years | 13 (3.2%) | $53,438 |
| 25 to 44 Years | 124 (30.5%) | $51,829 |
| 45 to 64 Years | 142 (34.9%) | $80,000 |
| 65+ Years | 128 (31.5%) | $56,923 |
| Total | 407 (100.0%) | $56,289 |
Poverty in Greenleaf
Income Below Poverty by Sex and Age in Greenleaf
With 12.6% poverty level for males and 7.2% for females among the residents of Greenleaf, 35 to 44 year old males and 25 to 34 year old females are the most vulnerable to poverty, with 22 males (27.5%) and 8 females (25.8%) in their respective age groups living below the poverty level.
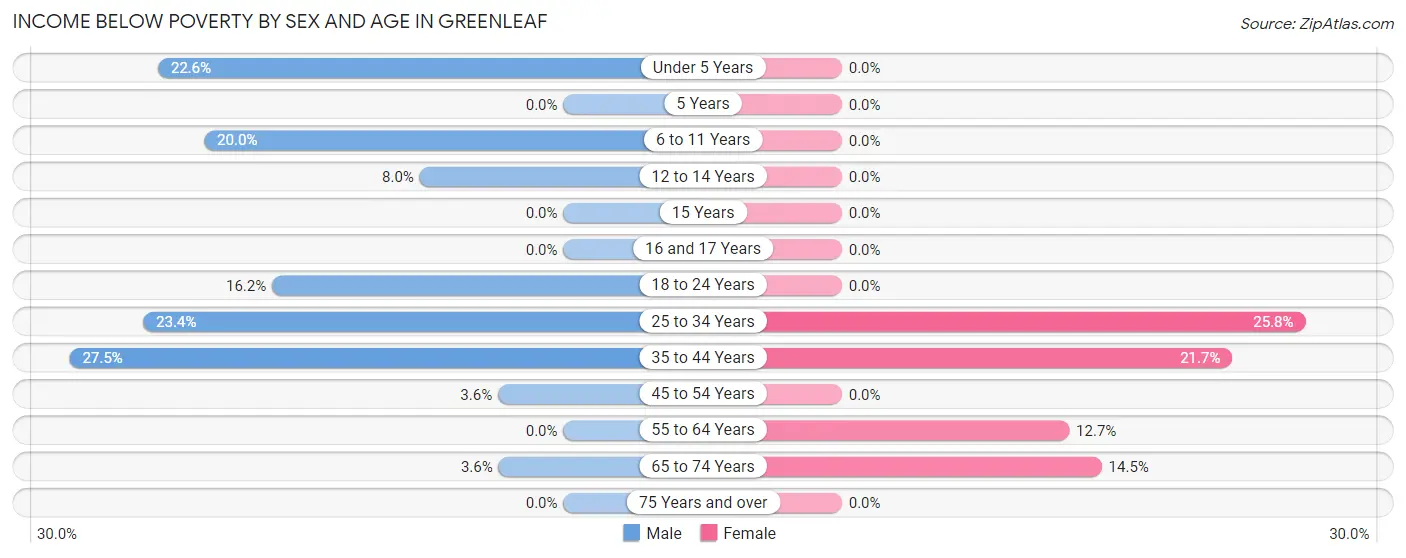
| Age Bracket | Male | Female |
| Under 5 Years | 7 (22.6%) | 0 (0.0%) |
| 5 Years | 0 (0.0%) | 0 (0.0%) |
| 6 to 11 Years | 2 (20.0%) | 0 (0.0%) |
| 12 to 14 Years | 2 (8.0%) | 0 (0.0%) |
| 15 Years | 0 (0.0%) | 0 (0.0%) |
| 16 and 17 Years | 0 (0.0%) | 0 (0.0%) |
| 18 to 24 Years | 6 (16.2%) | 0 (0.0%) |
| 25 to 34 Years | 22 (23.4%) | 8 (25.8%) |
| 35 to 44 Years | 22 (27.5%) | 5 (21.7%) |
| 45 to 54 Years | 2 (3.6%) | 0 (0.0%) |
| 55 to 64 Years | 0 (0.0%) | 10 (12.7%) |
| 65 to 74 Years | 3 (3.6%) | 11 (14.5%) |
| 75 Years and over | 0 (0.0%) | 0 (0.0%) |
| Total | 66 (12.6%) | 34 (7.2%) |
Income Above Poverty by Sex and Age in Greenleaf
According to the poverty statistics in Greenleaf, males aged 16 and 17 years and females aged under 5 years are the age groups that are most secure financially, with 100.0% of males and 100.0% of females in these age groups living above the poverty line.
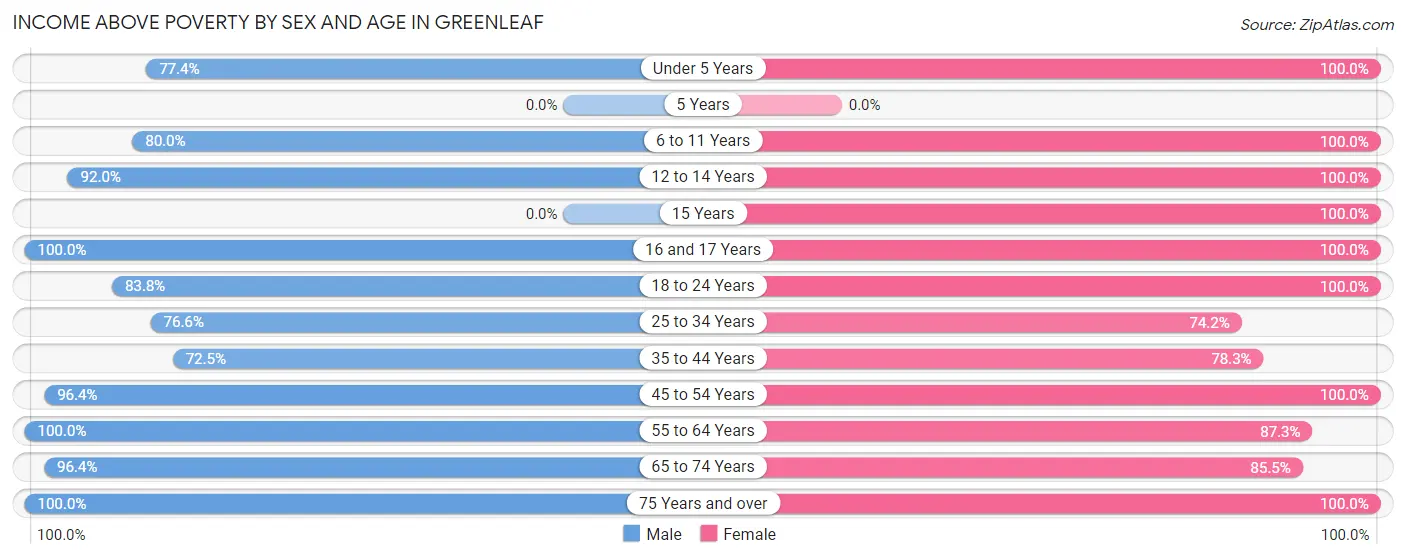
| Age Bracket | Male | Female |
| Under 5 Years | 24 (77.4%) | 7 (100.0%) |
| 5 Years | 0 (0.0%) | 0 (0.0%) |
| 6 to 11 Years | 8 (80.0%) | 50 (100.0%) |
| 12 to 14 Years | 23 (92.0%) | 49 (100.0%) |
| 15 Years | 0 (0.0%) | 5 (100.0%) |
| 16 and 17 Years | 9 (100.0%) | 7 (100.0%) |
| 18 to 24 Years | 31 (83.8%) | 61 (100.0%) |
| 25 to 34 Years | 72 (76.6%) | 23 (74.2%) |
| 35 to 44 Years | 58 (72.5%) | 18 (78.3%) |
| 45 to 54 Years | 53 (96.4%) | 43 (100.0%) |
| 55 to 64 Years | 62 (100.0%) | 69 (87.3%) |
| 65 to 74 Years | 80 (96.4%) | 65 (85.5%) |
| 75 Years and over | 36 (100.0%) | 39 (100.0%) |
| Total | 456 (87.4%) | 436 (92.8%) |
Income Below Poverty Among Married-Couple Families in Greenleaf
The poverty statistics for married-couple families in Greenleaf show that 3.2% or 7 of the total 217 families live below the poverty line. Families with 1 or 2 children have the highest poverty rate of 9.3%, comprising of 4 families. On the other hand, families with 3 or 4 children have the lowest poverty rate of 0.0%, which includes 0 families.
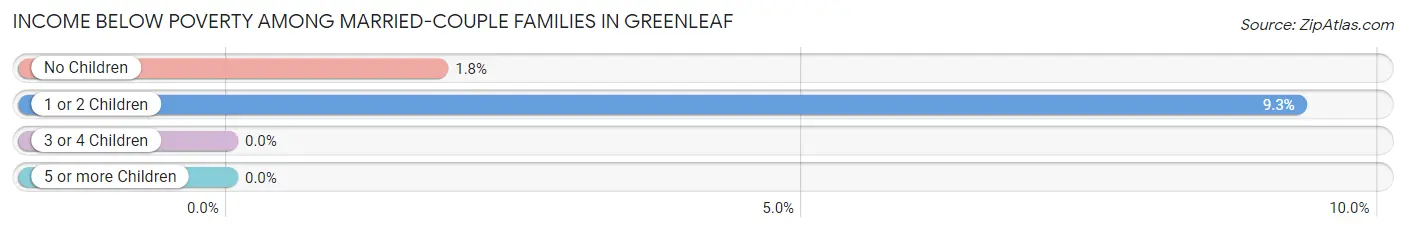
| Children | Above Poverty | Below Poverty |
| No Children | 161 (98.2%) | 3 (1.8%) |
| 1 or 2 Children | 39 (90.7%) | 4 (9.3%) |
| 3 or 4 Children | 10 (100.0%) | 0 (0.0%) |
| 5 or more Children | 0 (0.0%) | 0 (0.0%) |
| Total | 210 (96.8%) | 7 (3.2%) |
Income Below Poverty Among Single-Parent Households in Greenleaf
According to the poverty data in Greenleaf, 5.2% or 3 single-father households and 35.7% or 5 single-mother households are living below the poverty line. Among single-father households, those with 1 or 2 children have the highest poverty rate, with 3 households (6.1%) experiencing poverty. Likewise, among single-mother households, those with 1 or 2 children have the highest poverty rate, with 2 households (40.0%) falling below the poverty line.
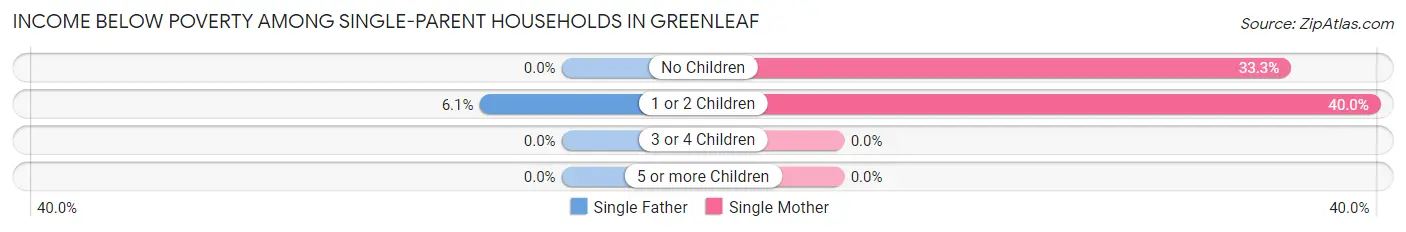
| Children | Single Father | Single Mother |
| No Children | 0 (0.0%) | 3 (33.3%) |
| 1 or 2 Children | 3 (6.1%) | 2 (40.0%) |
| 3 or 4 Children | 0 (0.0%) | 0 (0.0%) |
| 5 or more Children | 0 (0.0%) | 0 (0.0%) |
| Total | 3 (5.2%) | 5 (35.7%) |
Income Below Poverty Among Married-Couple vs Single-Parent Households in Greenleaf
The poverty data for Greenleaf shows that 7 of the married-couple family households (3.2%) and 8 of the single-parent households (11.1%) are living below the poverty level. Within the married-couple family households, those with 1 or 2 children have the highest poverty rate, with 4 households (9.3%) falling below the poverty line. Among the single-parent households, those with no children have the highest poverty rate, with 3 household (16.7%) living below poverty.
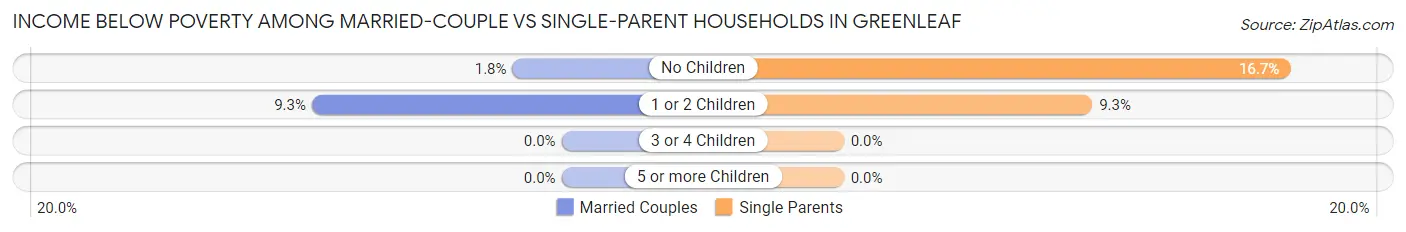
| Children | Married-Couple Families | Single-Parent Households |
| No Children | 3 (1.8%) | 3 (16.7%) |
| 1 or 2 Children | 4 (9.3%) | 5 (9.3%) |
| 3 or 4 Children | 0 (0.0%) | 0 (0.0%) |
| 5 or more Children | 0 (0.0%) | 0 (0.0%) |
| Total | 7 (3.2%) | 8 (11.1%) |
Race in Greenleaf
The most populous races in Greenleaf are White / Caucasian (748 | 75.2%), Hispanic or Latino (200 | 20.1%), and Some other Race (131 | 13.2%).
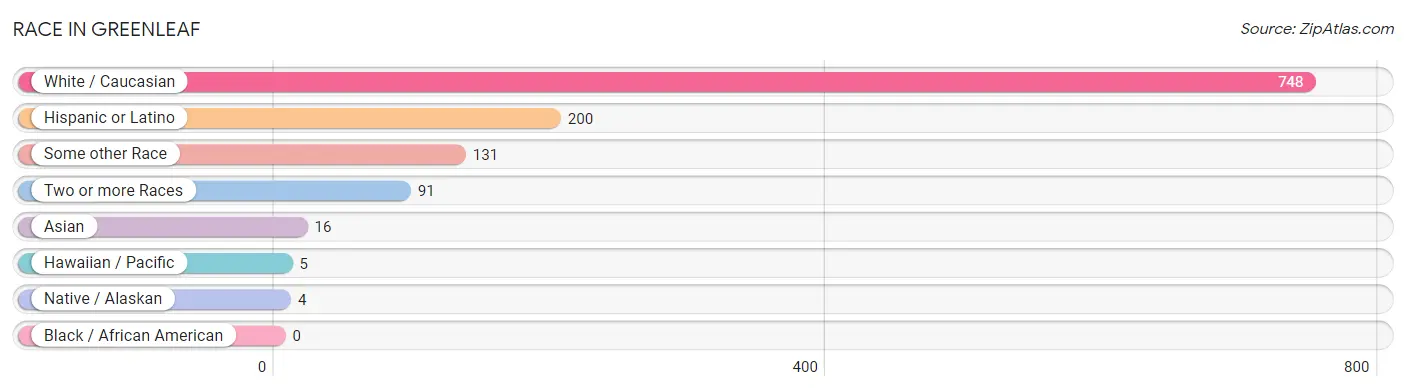
| Race | # Population | % Population |
| Asian | 16 | 1.6% |
| Black / African American | 0 | 0.0% |
| Hawaiian / Pacific | 5 | 0.5% |
| Hispanic or Latino | 200 | 20.1% |
| Native / Alaskan | 4 | 0.4% |
| White / Caucasian | 748 | 75.2% |
| Two or more Races | 91 | 9.1% |
| Some other Race | 131 | 13.2% |
| Total | 995 | 100.0% |
Ancestry in Greenleaf
The most populous ancestries reported in Greenleaf are Irish (219 | 22.0%), American (215 | 21.6%), Mexican (181 | 18.2%), German (146 | 14.7%), and English (96 | 9.7%), together accounting for 86.1% of all Greenleaf residents.
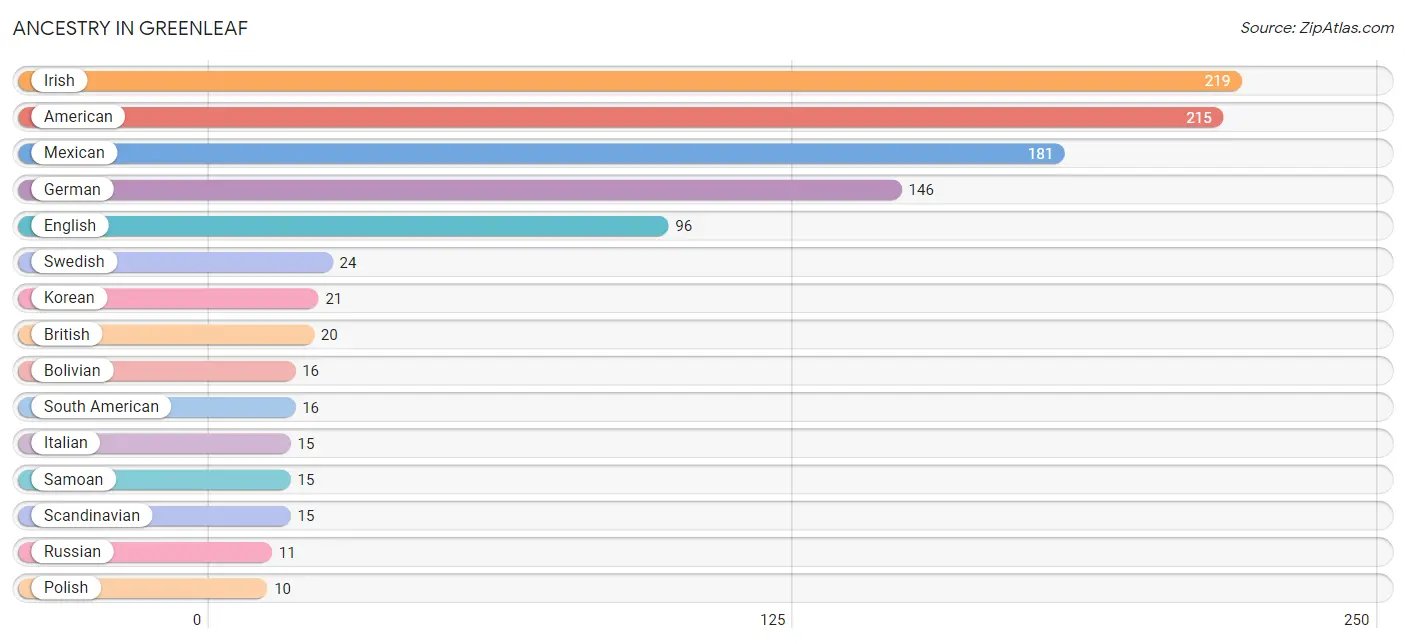
| Ancestry | # Population | % Population |
| American | 215 | 21.6% |
| Armenian | 8 | 0.8% |
| Bhutanese | 5 | 0.5% |
| Bolivian | 16 | 1.6% |
| British | 20 | 2.0% |
| Central American | 3 | 0.3% |
| Croatian | 3 | 0.3% |
| Danish | 5 | 0.5% |
| Dutch | 8 | 0.8% |
| English | 96 | 9.7% |
| European | 5 | 0.5% |
| French Canadian | 3 | 0.3% |
| German | 146 | 14.7% |
| Indian (Asian) | 5 | 0.5% |
| Irish | 219 | 22.0% |
| Italian | 15 | 1.5% |
| Korean | 21 | 2.1% |
| Lithuanian | 8 | 0.8% |
| Mexican | 181 | 18.2% |
| Norwegian | 9 | 0.9% |
| Polish | 10 | 1.0% |
| Portuguese | 4 | 0.4% |
| Russian | 11 | 1.1% |
| Salvadoran | 3 | 0.3% |
| Samoan | 15 | 1.5% |
| Scandinavian | 15 | 1.5% |
| Scottish | 5 | 0.5% |
| South American | 16 | 1.6% |
| Swedish | 24 | 2.4% |
| Thai | 6 | 0.6% |
| U.S. Virgin Islander | 1 | 0.1% |
| Ukrainian | 3 | 0.3% | View All 32 Rows |
Immigrants in Greenleaf
The most numerous immigrant groups reported in Greenleaf came from Central America (58 | 5.8%), Latin America (58 | 5.8%), Mexico (55 | 5.5%), Asia (12 | 1.2%), and Philippines (5 | 0.5%), together accounting for 18.9% of all Greenleaf residents.
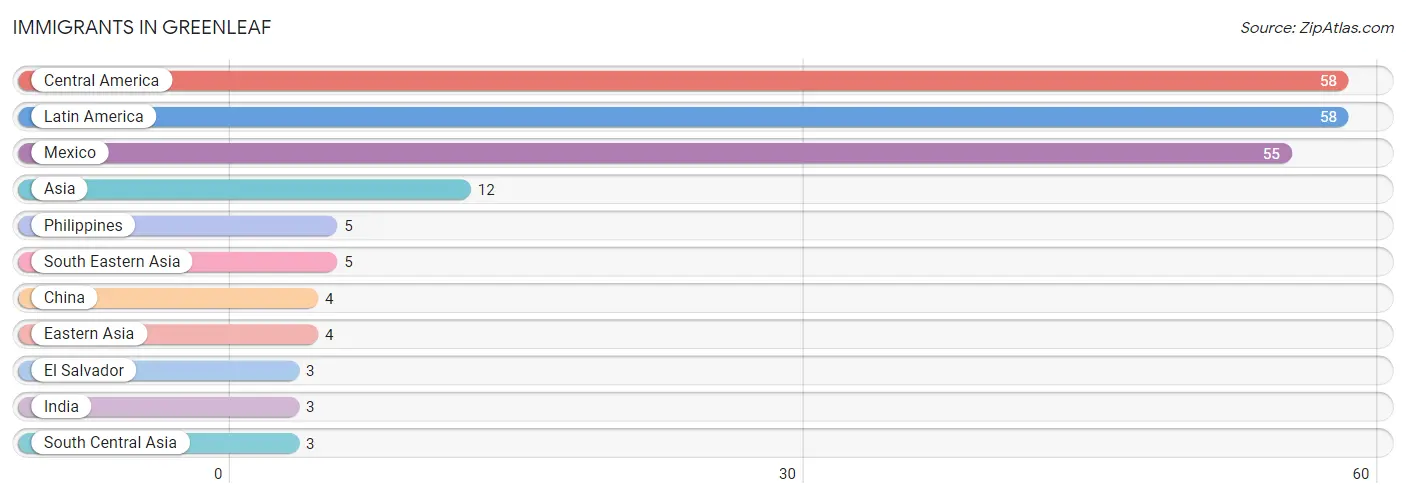
| Immigration Origin | # Population | % Population |
| Asia | 12 | 1.2% |
| Central America | 58 | 5.8% |
| China | 4 | 0.4% |
| Eastern Asia | 4 | 0.4% |
| El Salvador | 3 | 0.3% |
| India | 3 | 0.3% |
| Latin America | 58 | 5.8% |
| Mexico | 55 | 5.5% |
| Philippines | 5 | 0.5% |
| South Central Asia | 3 | 0.3% |
| South Eastern Asia | 5 | 0.5% | View All 11 Rows |
Sex and Age in Greenleaf
Sex and Age in Greenleaf
The most populous age groups in Greenleaf are 40 to 44 Years (66 | 12.6%) for men and 10 to 14 Years (93 | 19.8%) for women.
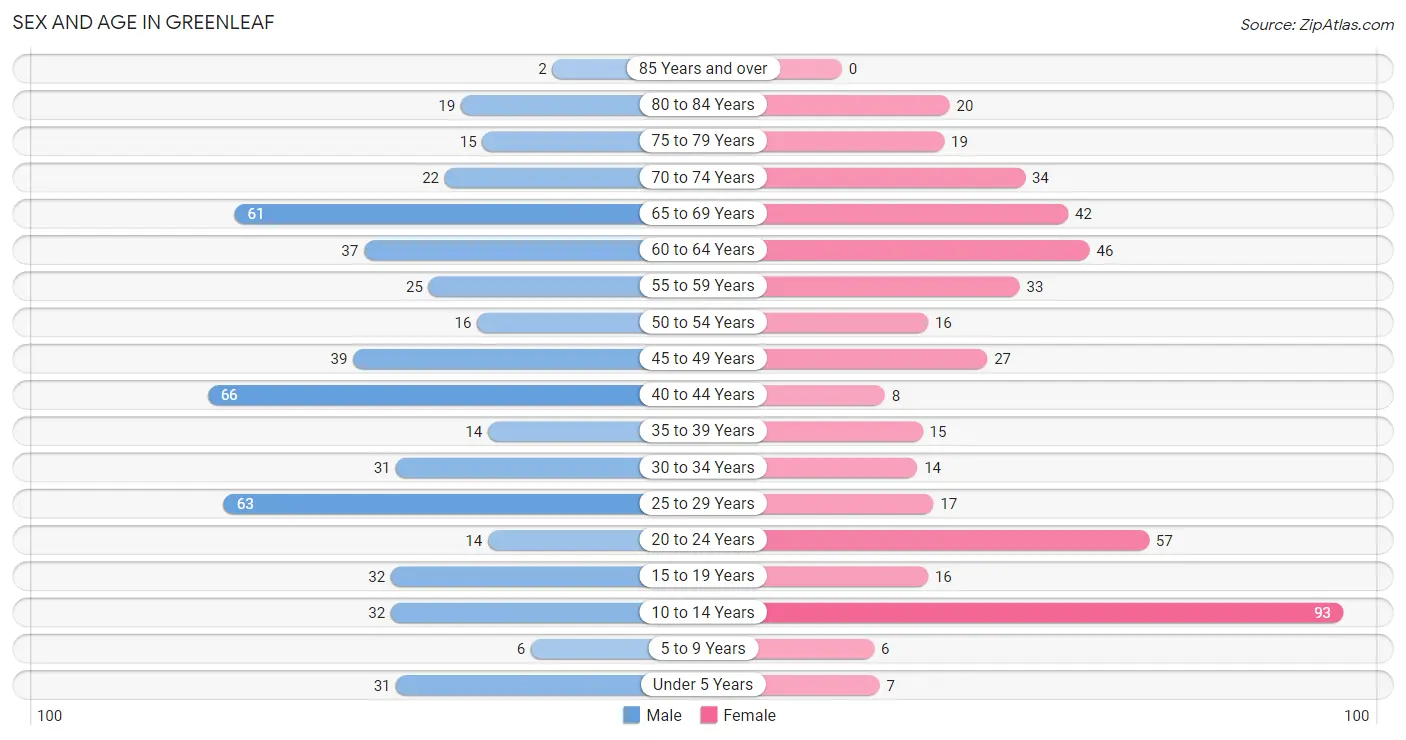
| Age Bracket | Male | Female |
| Under 5 Years | 31 (5.9%) | 7 (1.5%) |
| 5 to 9 Years | 6 (1.1%) | 6 (1.3%) |
| 10 to 14 Years | 32 (6.1%) | 93 (19.8%) |
| 15 to 19 Years | 32 (6.1%) | 16 (3.4%) |
| 20 to 24 Years | 14 (2.7%) | 57 (12.1%) |
| 25 to 29 Years | 63 (12.0%) | 17 (3.6%) |
| 30 to 34 Years | 31 (5.9%) | 14 (3.0%) |
| 35 to 39 Years | 14 (2.7%) | 15 (3.2%) |
| 40 to 44 Years | 66 (12.6%) | 8 (1.7%) |
| 45 to 49 Years | 39 (7.4%) | 27 (5.7%) |
| 50 to 54 Years | 16 (3.0%) | 16 (3.4%) |
| 55 to 59 Years | 25 (4.8%) | 33 (7.0%) |
| 60 to 64 Years | 37 (7.0%) | 46 (9.8%) |
| 65 to 69 Years | 61 (11.6%) | 42 (8.9%) |
| 70 to 74 Years | 22 (4.2%) | 34 (7.2%) |
| 75 to 79 Years | 15 (2.9%) | 19 (4.0%) |
| 80 to 84 Years | 19 (3.6%) | 20 (4.3%) |
| 85 Years and over | 2 (0.4%) | 0 (0.0%) |
| Total | 525 (100.0%) | 470 (100.0%) |
Families and Households in Greenleaf
Median Family Size in Greenleaf
The median family size in Greenleaf is 2.80 persons per family, with single male/father families (58 | 20.1%) accounting for the largest median family size of 3.03 persons per family. On the other hand, single female/mother families (14 | 4.8%) represent the smallest median family size with 2.36 persons per family.
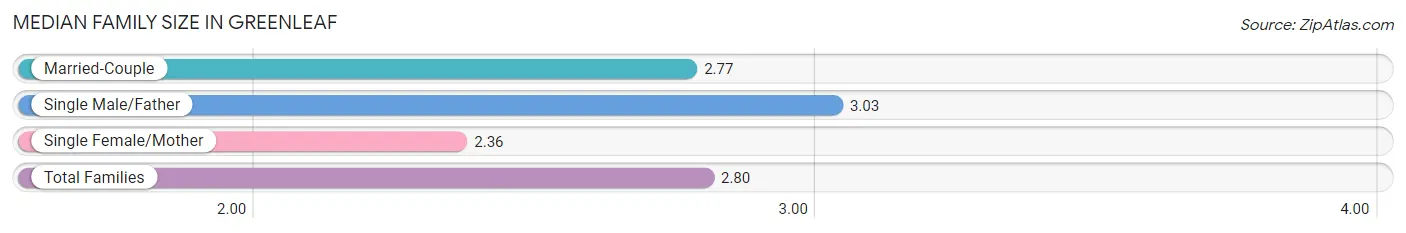
| Family Type | # Families | Family Size |
| Married-Couple | 217 (75.1%) | 2.77 |
| Single Male/Father | 58 (20.1%) | 3.03 |
| Single Female/Mother | 14 (4.8%) | 2.36 |
| Total Families | 289 (100.0%) | 2.80 |
Median Household Size in Greenleaf
The median household size in Greenleaf is 2.44 persons per household, with single male/father households (58 | 14.2%) accounting for the largest median household size of 3.09 persons per household. non-family households (118 | 29.0%) represent the smallest median household size with 1.52 persons per household.
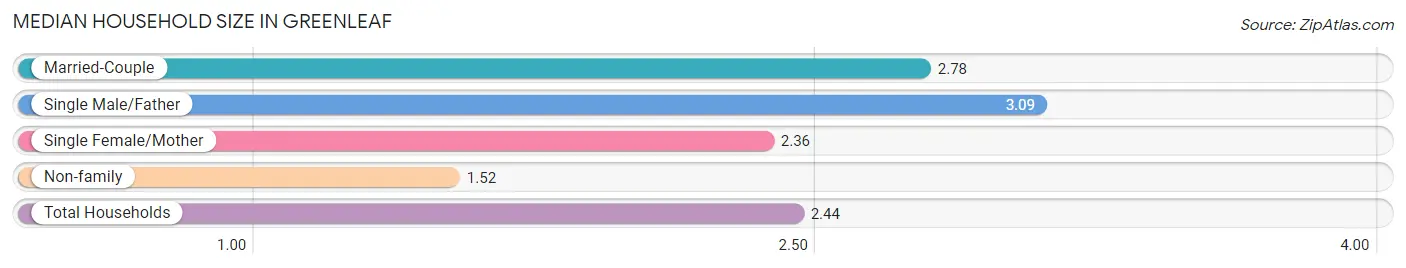
| Household Type | # Households | Household Size |
| Married-Couple | 217 (53.3%) | 2.78 |
| Single Male/Father | 58 (14.2%) | 3.09 |
| Single Female/Mother | 14 (3.4%) | 2.36 |
| Non-family | 118 (29.0%) | 1.52 |
| Total Households | 407 (100.0%) | 2.44 |
Household Size by Marriage Status in Greenleaf
Out of a total of 407 households in Greenleaf, 289 (71.0%) are family households, while 118 (29.0%) are nonfamily households. The most numerous type of family households are 2-person households, comprising 146, and the most common type of nonfamily households are 1-person households, comprising 83.
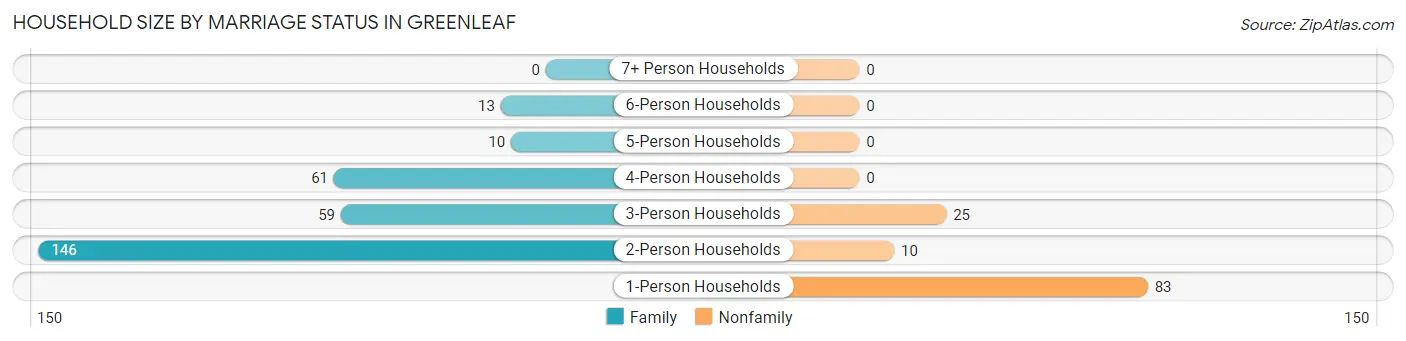
| Household Size | Family Households | Nonfamily Households |
| 1-Person Households | - | 83 (20.4%) |
| 2-Person Households | 146 (35.9%) | 10 (2.5%) |
| 3-Person Households | 59 (14.5%) | 25 (6.1%) |
| 4-Person Households | 61 (15.0%) | 0 (0.0%) |
| 5-Person Households | 10 (2.5%) | 0 (0.0%) |
| 6-Person Households | 13 (3.2%) | 0 (0.0%) |
| 7+ Person Households | 0 (0.0%) | 0 (0.0%) |
| Total | 289 (71.0%) | 118 (29.0%) |
Female Fertility in Greenleaf
Fertility by Age in Greenleaf
Average fertility rate in Greenleaf is 71.0 births per 1,000 women. Women in the age bracket of 20 to 34 years have the highest fertility rate with 125.0 births per 1,000 women. Women in the age bracket of 20 to 34 years acount for 100.0% of all women with births.
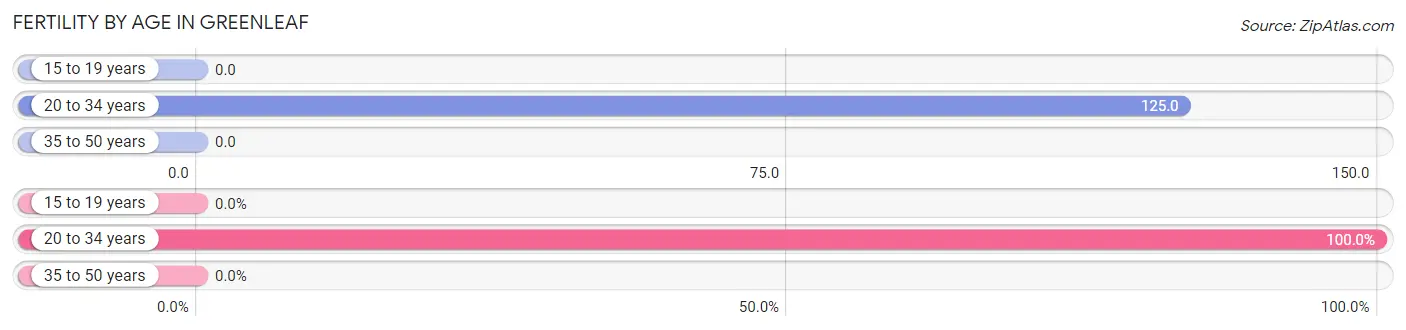
| Age Bracket | Women with Births | Births / 1,000 Women |
| 15 to 19 years | 0 (0.0%) | 0.0 |
| 20 to 34 years | 11 (100.0%) | 125.0 |
| 35 to 50 years | 0 (0.0%) | 0.0 |
| Total | 11 (100.0%) | 71.0 |
Fertility by Age by Marriage Status in Greenleaf
72.7% of women with births (11) in Greenleaf are married. The highest percentage of unmarried women with births falls into 20 to 34 years age bracket with 27.3% of them unmarried at the time of birth, while the lowest percentage of unmarried women with births belong to 20 to 34 years age bracket with 27.3% of them unmarried.
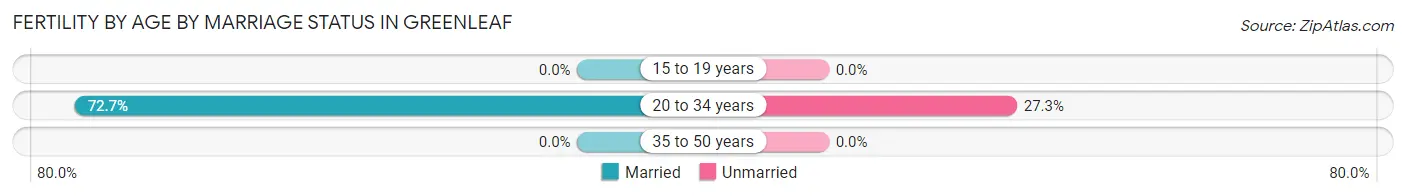
| Age Bracket | Married | Unmarried |
| 15 to 19 years | 0 (0.0%) | 0 (0.0%) |
| 20 to 34 years | 8 (72.7%) | 3 (27.3%) |
| 35 to 50 years | 0 (0.0%) | 0 (0.0%) |
| Total | 8 (72.7%) | 3 (27.3%) |
Fertility by Education in Greenleaf
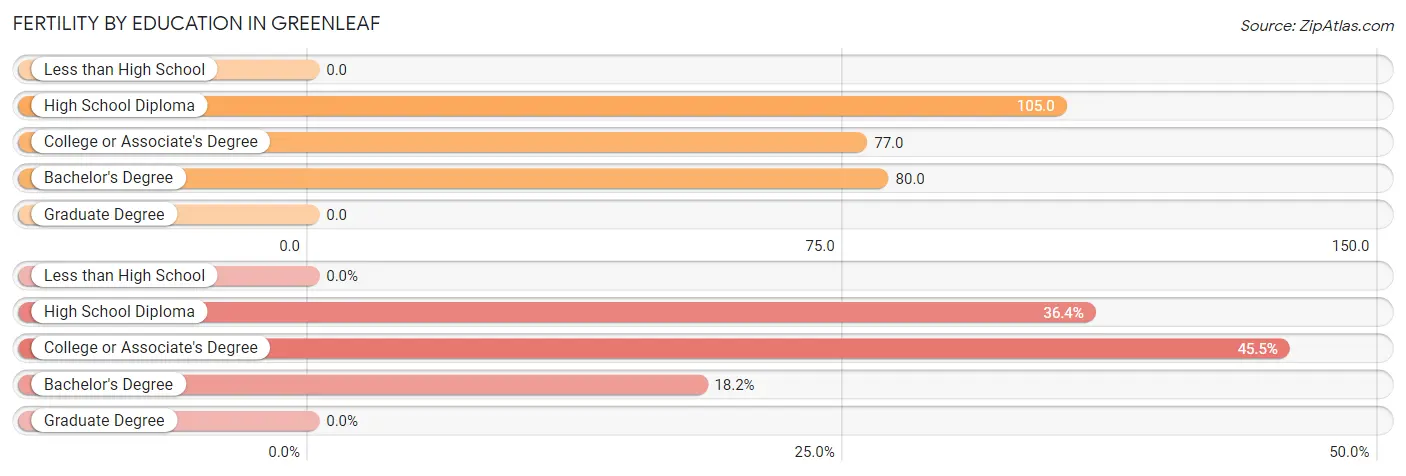
| Educational Attainment | Women with Births | Births / 1,000 Women |
| Less than High School | 0 (0.0%) | 0.0 |
| High School Diploma | 4 (36.4%) | 105.0 |
| College or Associate's Degree | 5 (45.5%) | 77.0 |
| Bachelor's Degree | 2 (18.2%) | 80.0 |
| Graduate Degree | 0 (0.0%) | 0.0 |
| Total | 11 (100.0%) | 71.0 |
Fertility by Education by Marriage Status in Greenleaf
27.3% of women with births in Greenleaf are unmarried. Women with the educational attainment of high school diploma are most likely to be married with 100.0% of them married at childbirth, while women with the educational attainment of college or associate's degree are least likely to be married with 60.0% of them unmarried at childbirth.
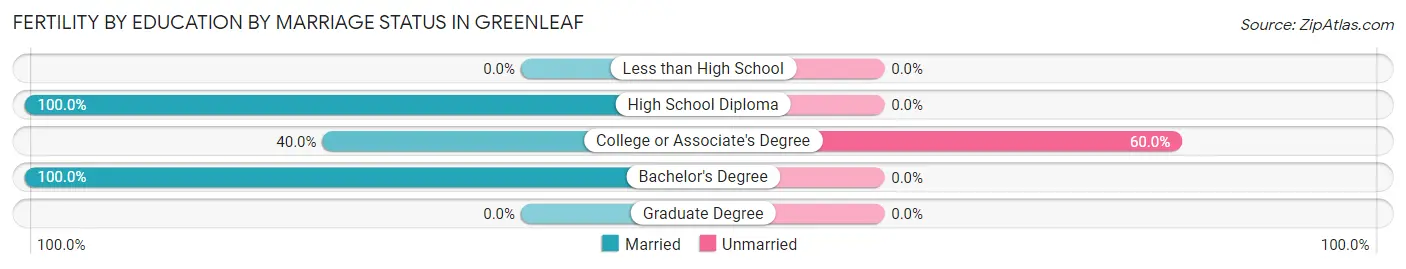
| Educational Attainment | Married | Unmarried |
| Less than High School | 0 (0.0%) | 0 (0.0%) |
| High School Diploma | 4 (100.0%) | 0 (0.0%) |
| College or Associate's Degree | 2 (40.0%) | 3 (60.0%) |
| Bachelor's Degree | 2 (100.0%) | 0 (0.0%) |
| Graduate Degree | 0 (0.0%) | 0 (0.0%) |
| Total | 8 (72.7%) | 3 (27.3%) |
Employment Characteristics in Greenleaf
Employment by Class of Employer in Greenleaf
Among the 442 employed individuals in Greenleaf, private company employees (303 | 68.5%), self-employed (not incorporated) (54 | 12.2%), and not-for-profit organizations (38 | 8.6%) make up the most common classes of employment.
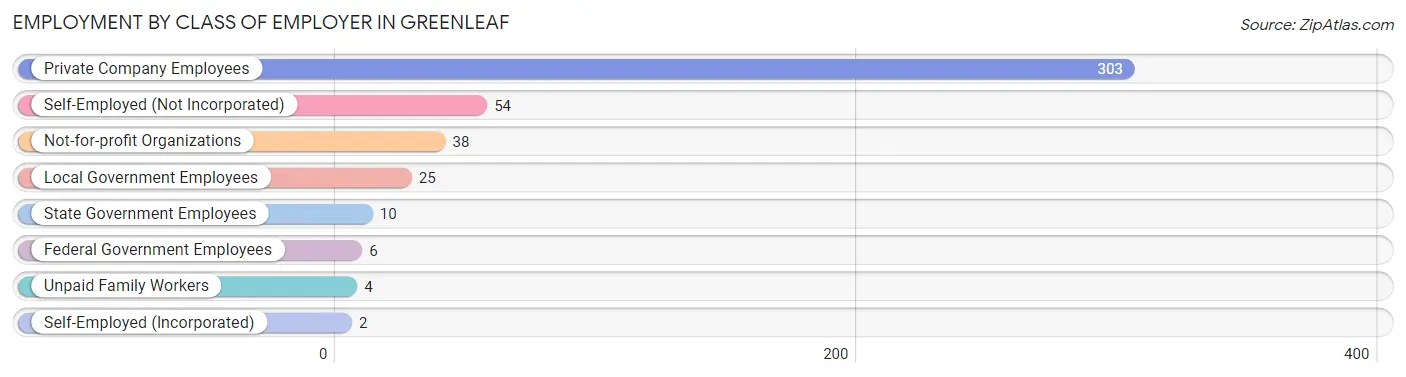
| Employer Class | # Employees | % Employees |
| Private Company Employees | 303 | 68.5% |
| Self-Employed (Incorporated) | 2 | 0.4% |
| Self-Employed (Not Incorporated) | 54 | 12.2% |
| Not-for-profit Organizations | 38 | 8.6% |
| Local Government Employees | 25 | 5.7% |
| State Government Employees | 10 | 2.3% |
| Federal Government Employees | 6 | 1.4% |
| Unpaid Family Workers | 4 | 0.9% |
| Total | 442 | 100.0% |
Employment Status by Age in Greenleaf
According to the labor force statistics for Greenleaf, out of the total population over 16 years of age (815), 63.7% or 519 individuals are in the labor force, with 6.0% or 31 of them unemployed. The age group with the highest labor force participation rate is 20 to 24 years, with 93.0% or 66 individuals in the labor force. Within the labor force, the 25 to 29 years age range has the highest percentage of unemployed individuals, with 22.8% or 13 of them being unemployed.
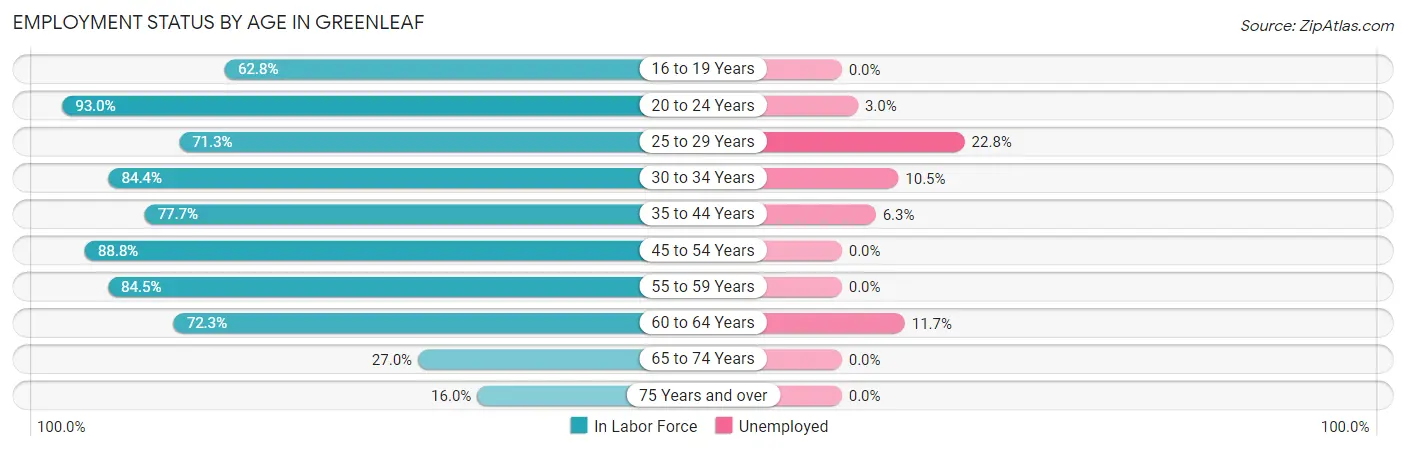
| Age Bracket | In Labor Force | Unemployed |
| 16 to 19 Years | 27 (62.8%) | 0 (0.0%) |
| 20 to 24 Years | 66 (93.0%) | 2 (3.0%) |
| 25 to 29 Years | 57 (71.3%) | 13 (22.8%) |
| 30 to 34 Years | 38 (84.4%) | 4 (10.5%) |
| 35 to 44 Years | 80 (77.7%) | 5 (6.3%) |
| 45 to 54 Years | 87 (88.8%) | 0 (0.0%) |
| 55 to 59 Years | 49 (84.5%) | 0 (0.0%) |
| 60 to 64 Years | 60 (72.3%) | 7 (11.7%) |
| 65 to 74 Years | 43 (27.0%) | 0 (0.0%) |
| 75 Years and over | 12 (16.0%) | 0 (0.0%) |
| Total | 519 (63.7%) | 31 (6.0%) |
Employment Status by Educational Attainment in Greenleaf
According to labor force statistics for Greenleaf, 79.4% of individuals (371) out of the total population between 25 and 64 years of age (467) are in the labor force, with 7.8% or 29 of them being unemployed. The group with the highest labor force participation rate are those with the educational attainment of high school diploma, with 90.8% or 89 individuals in the labor force. Within the labor force, individuals with high school diploma education have the highest percentage of unemployment, with 16.9% or 15 of them being unemployed.
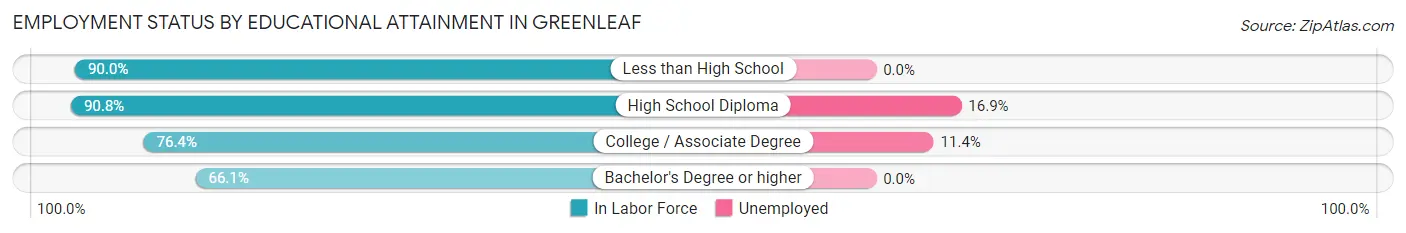
| Educational Attainment | In Labor Force | Unemployed |
| Less than High School | 81 (90.0%) | 0 (0.0%) |
| High School Diploma | 89 (90.8%) | 17 (16.9%) |
| College / Associate Degree | 123 (76.4%) | 18 (11.4%) |
| Bachelor's Degree or higher | 78 (66.1%) | 0 (0.0%) |
| Total | 371 (79.4%) | 36 (7.8%) |
Employment Occupations by Sex in Greenleaf
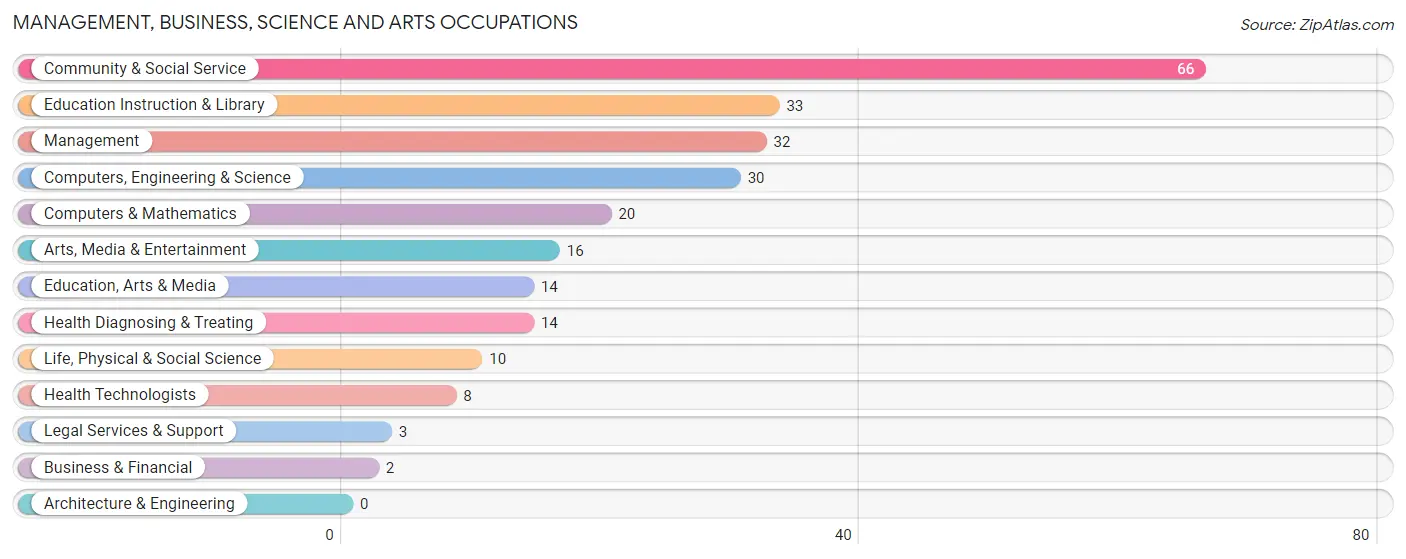
Management, Business, Science and Arts Occupations
The most common Management, Business, Science and Arts occupations in Greenleaf are Community & Social Service (66 | 13.5%), Education Instruction & Library (33 | 6.8%), Management (32 | 6.6%), Computers, Engineering & Science (30 | 6.1%), and Computers & Mathematics (20 | 4.1%).
Management, Business, Science and Arts Occupations by Sex
Within the Management, Business, Science and Arts occupations in Greenleaf, the most male-oriented occupations are Computers & Mathematics (100.0%), Computers, Engineering & Science (66.7%), and Management (53.1%), while the most female-oriented occupations are Business & Financial (100.0%), Life, Physical & Social Science (100.0%), and Legal Services & Support (100.0%).
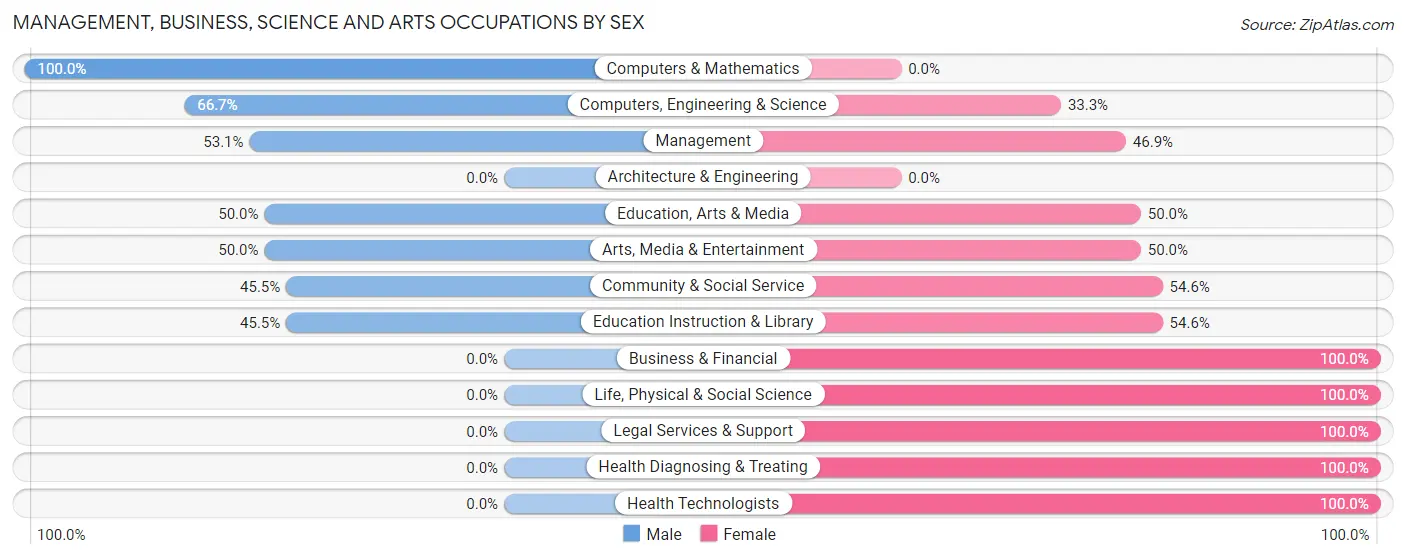
| Occupation | Male | Female |
| Management | 17 (53.1%) | 15 (46.9%) |
| Business & Financial | 0 (0.0%) | 2 (100.0%) |
| Computers, Engineering & Science | 20 (66.7%) | 10 (33.3%) |
| Computers & Mathematics | 20 (100.0%) | 0 (0.0%) |
| Architecture & Engineering | 0 (0.0%) | 0 (0.0%) |
| Life, Physical & Social Science | 0 (0.0%) | 10 (100.0%) |
| Community & Social Service | 30 (45.5%) | 36 (54.5%) |
| Education, Arts & Media | 7 (50.0%) | 7 (50.0%) |
| Legal Services & Support | 0 (0.0%) | 3 (100.0%) |
| Education Instruction & Library | 15 (45.5%) | 18 (54.5%) |
| Arts, Media & Entertainment | 8 (50.0%) | 8 (50.0%) |
| Health Diagnosing & Treating | 0 (0.0%) | 14 (100.0%) |
| Health Technologists | 0 (0.0%) | 8 (100.0%) |
| Total (Category) | 67 (46.5%) | 77 (53.5%) |
| Total (Overall) | 291 (59.6%) | 197 (40.4%) |
Services Occupations
The most common Services occupations in Greenleaf are Healthcare Support (67 | 13.7%), Food Preparation & Serving (44 | 9.0%), Personal Care & Service (26 | 5.3%), Security & Protection (9 | 1.8%), and Firefighting & Prevention (9 | 1.8%).
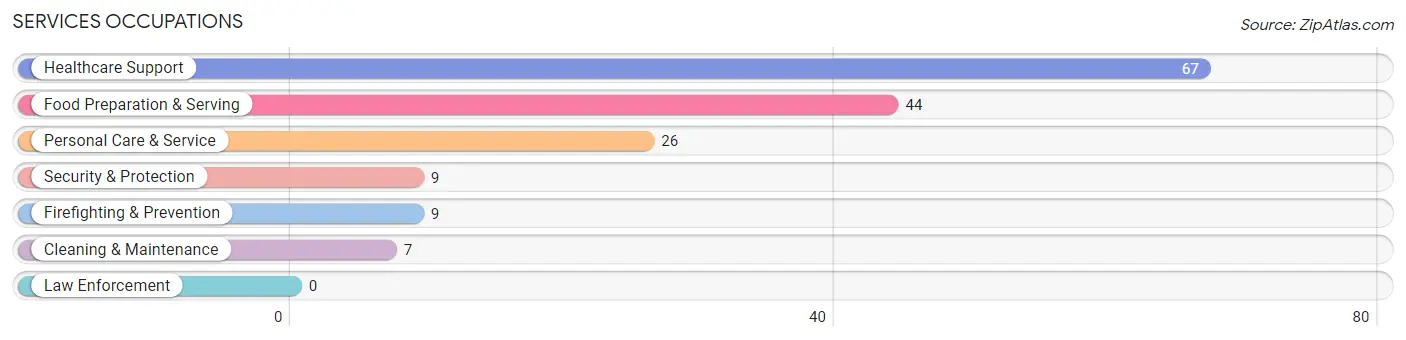
Services Occupations by Sex
Within the Services occupations in Greenleaf, the most male-oriented occupations are Cleaning & Maintenance (85.7%), Healthcare Support (61.2%), and Security & Protection (55.6%), while the most female-oriented occupations are Food Preparation & Serving (86.4%), Personal Care & Service (53.8%), and Security & Protection (44.4%).
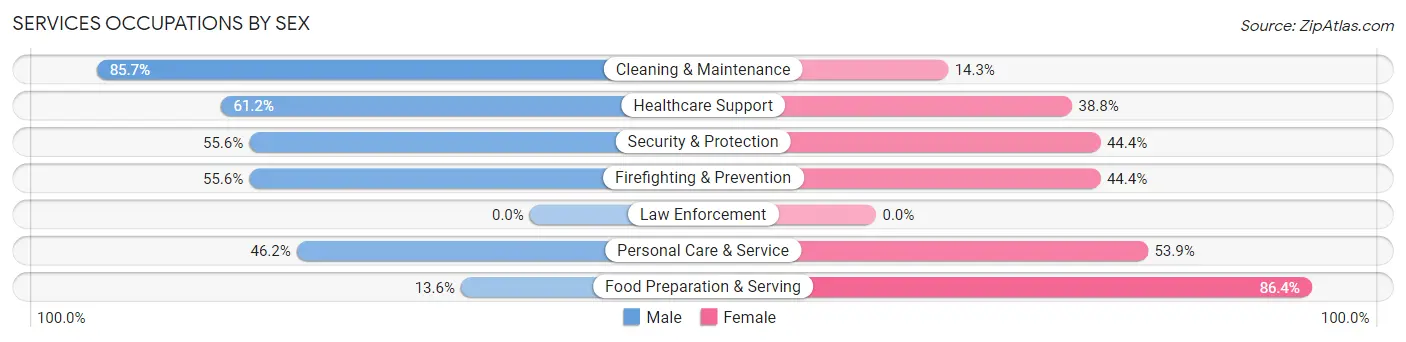
| Occupation | Male | Female |
| Healthcare Support | 41 (61.2%) | 26 (38.8%) |
| Security & Protection | 5 (55.6%) | 4 (44.4%) |
| Firefighting & Prevention | 5 (55.6%) | 4 (44.4%) |
| Law Enforcement | 0 (0.0%) | 0 (0.0%) |
| Food Preparation & Serving | 6 (13.6%) | 38 (86.4%) |
| Cleaning & Maintenance | 6 (85.7%) | 1 (14.3%) |
| Personal Care & Service | 12 (46.2%) | 14 (53.8%) |
| Total (Category) | 70 (45.8%) | 83 (54.2%) |
| Total (Overall) | 291 (59.6%) | 197 (40.4%) |
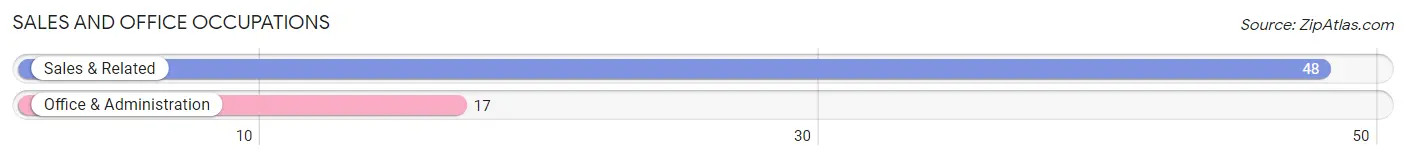
Sales and Office Occupations
The most common Sales and Office occupations in Greenleaf are Sales & Related (48 | 9.8%), and Office & Administration (17 | 3.5%).
Sales and Office Occupations by Sex
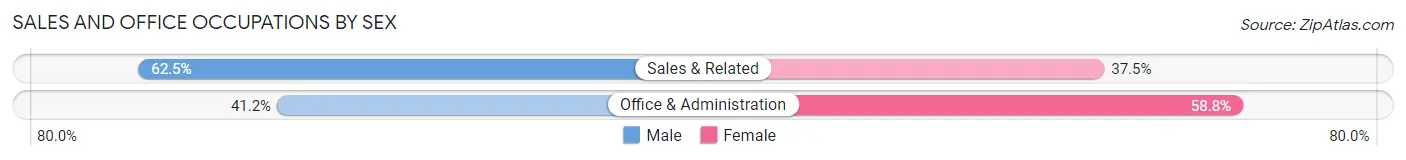
| Occupation | Male | Female |
| Sales & Related | 30 (62.5%) | 18 (37.5%) |
| Office & Administration | 7 (41.2%) | 10 (58.8%) |
| Total (Category) | 37 (56.9%) | 28 (43.1%) |
| Total (Overall) | 291 (59.6%) | 197 (40.4%) |
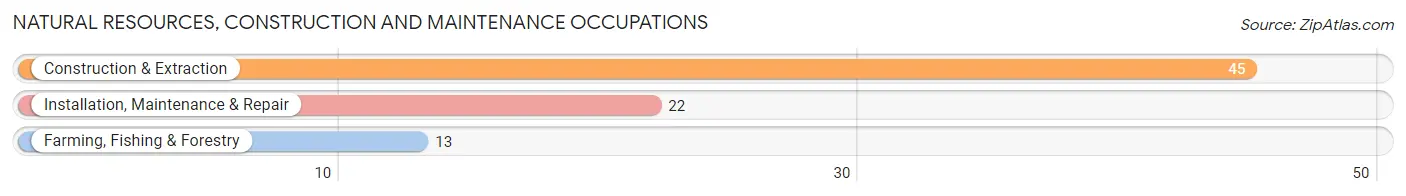
Natural Resources, Construction and Maintenance Occupations
The most common Natural Resources, Construction and Maintenance occupations in Greenleaf are Construction & Extraction (45 | 9.2%), Installation, Maintenance & Repair (22 | 4.5%), and Farming, Fishing & Forestry (13 | 2.7%).
Natural Resources, Construction and Maintenance Occupations by Sex
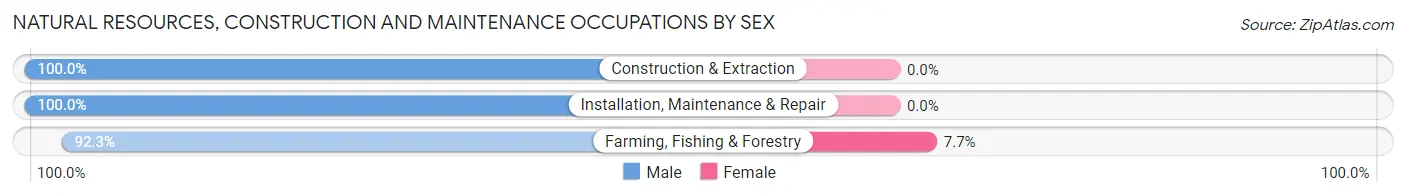
| Occupation | Male | Female |
| Farming, Fishing & Forestry | 12 (92.3%) | 1 (7.7%) |
| Construction & Extraction | 45 (100.0%) | 0 (0.0%) |
| Installation, Maintenance & Repair | 22 (100.0%) | 0 (0.0%) |
| Total (Category) | 79 (98.8%) | 1 (1.3%) |
| Total (Overall) | 291 (59.6%) | 197 (40.4%) |
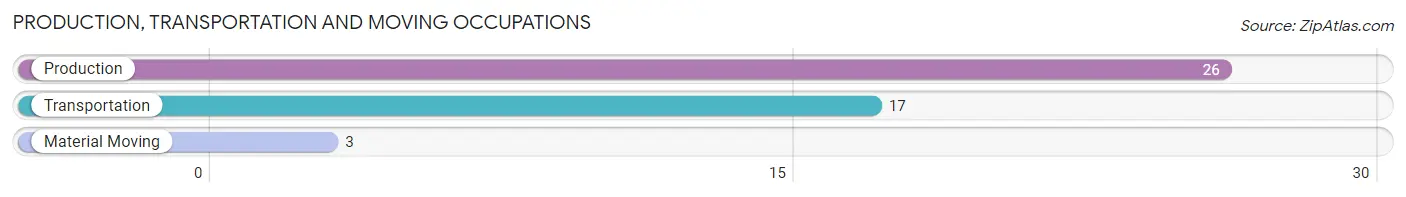
Production, Transportation and Moving Occupations
The most common Production, Transportation and Moving occupations in Greenleaf are Production (26 | 5.3%), Transportation (17 | 3.5%), and Material Moving (3 | 0.6%).
Production, Transportation and Moving Occupations by Sex
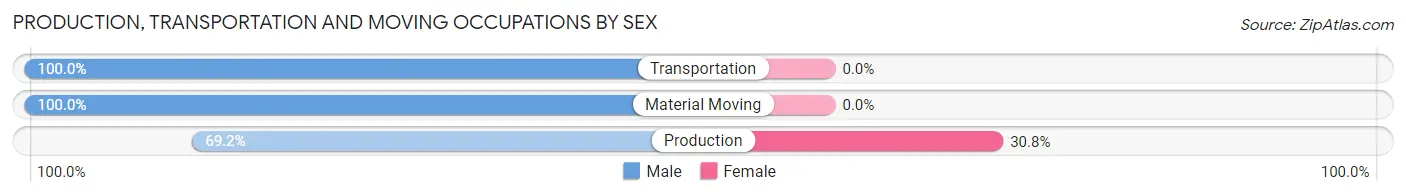
| Occupation | Male | Female |
| Production | 18 (69.2%) | 8 (30.8%) |
| Transportation | 17 (100.0%) | 0 (0.0%) |
| Material Moving | 3 (100.0%) | 0 (0.0%) |
| Total (Category) | 38 (82.6%) | 8 (17.4%) |
| Total (Overall) | 291 (59.6%) | 197 (40.4%) |
Employment Industries by Sex in Greenleaf
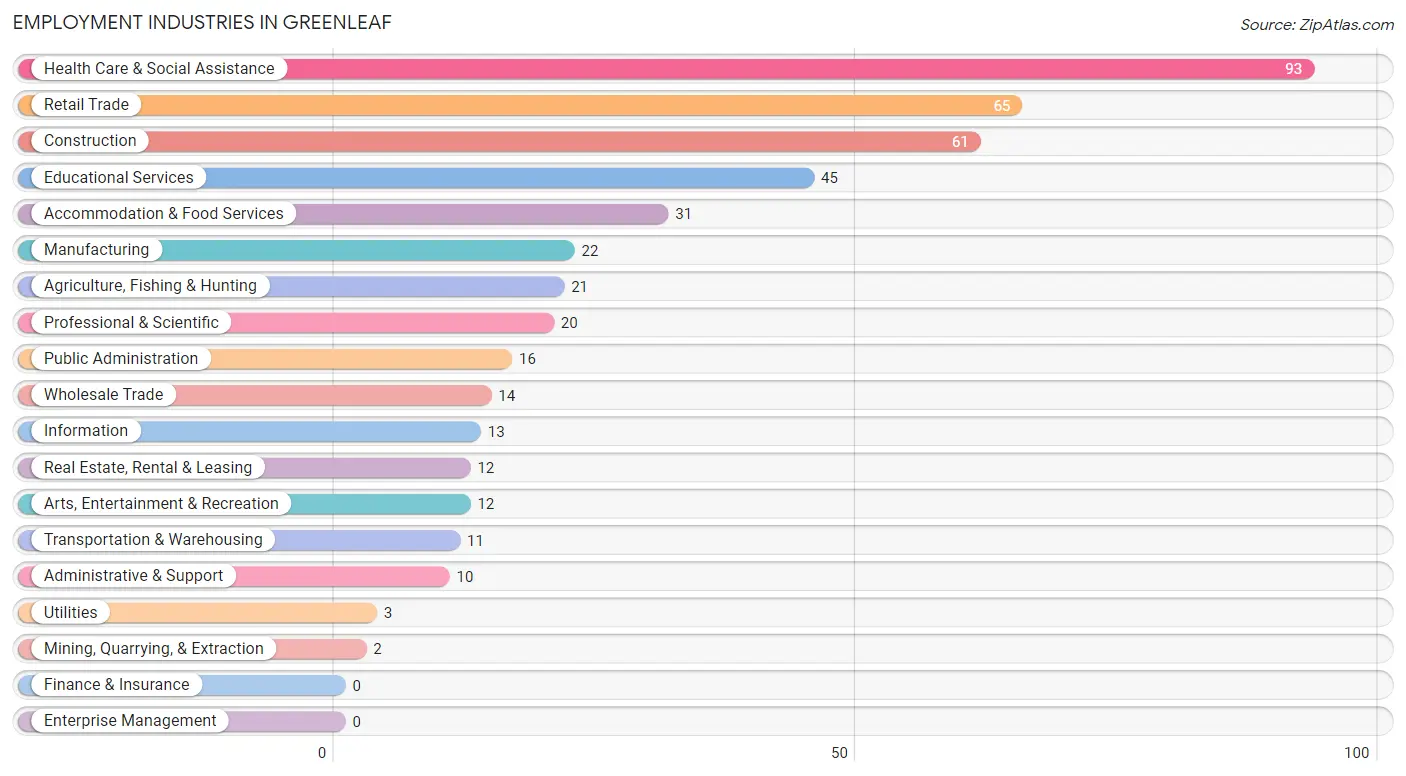
Employment Industries in Greenleaf
The major employment industries in Greenleaf include Health Care & Social Assistance (93 | 19.1%), Retail Trade (65 | 13.3%), Construction (61 | 12.5%), Educational Services (45 | 9.2%), and Accommodation & Food Services (31 | 6.4%).
Employment Industries by Sex in Greenleaf
The Greenleaf industries that see more men than women are Mining, Quarrying, & Extraction (100.0%), Transportation & Warehousing (100.0%), and Utilities (100.0%), whereas the industries that tend to have a higher number of women are Accommodation & Food Services (90.3%), Arts, Entertainment & Recreation (66.7%), and Professional & Scientific (65.0%).
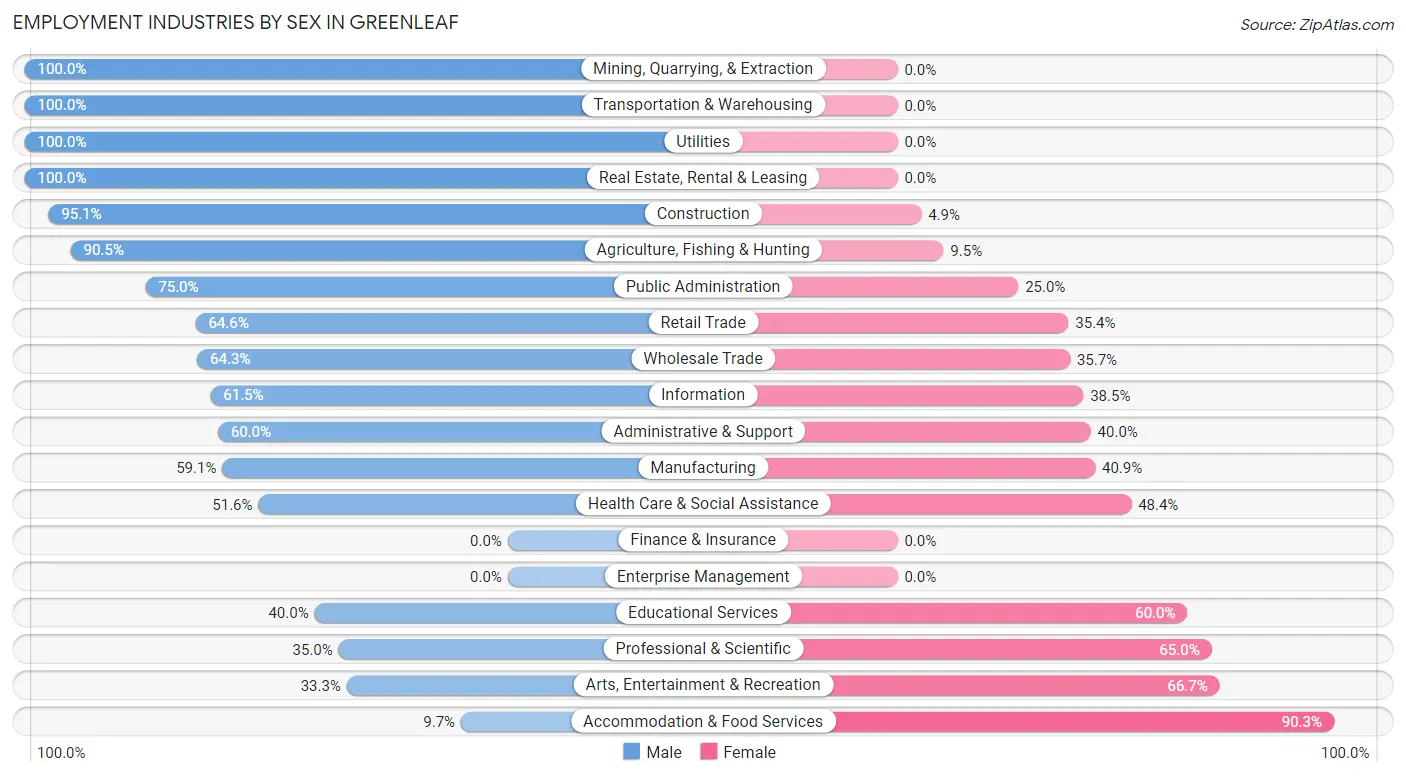
| Industry | Male | Female |
| Agriculture, Fishing & Hunting | 19 (90.5%) | 2 (9.5%) |
| Mining, Quarrying, & Extraction | 2 (100.0%) | 0 (0.0%) |
| Construction | 58 (95.1%) | 3 (4.9%) |
| Manufacturing | 13 (59.1%) | 9 (40.9%) |
| Wholesale Trade | 9 (64.3%) | 5 (35.7%) |
| Retail Trade | 42 (64.6%) | 23 (35.4%) |
| Transportation & Warehousing | 11 (100.0%) | 0 (0.0%) |
| Utilities | 3 (100.0%) | 0 (0.0%) |
| Information | 8 (61.5%) | 5 (38.5%) |
| Finance & Insurance | 0 (0.0%) | 0 (0.0%) |
| Real Estate, Rental & Leasing | 12 (100.0%) | 0 (0.0%) |
| Professional & Scientific | 7 (35.0%) | 13 (65.0%) |
| Enterprise Management | 0 (0.0%) | 0 (0.0%) |
| Administrative & Support | 6 (60.0%) | 4 (40.0%) |
| Educational Services | 18 (40.0%) | 27 (60.0%) |
| Health Care & Social Assistance | 48 (51.6%) | 45 (48.4%) |
| Arts, Entertainment & Recreation | 4 (33.3%) | 8 (66.7%) |
| Accommodation & Food Services | 3 (9.7%) | 28 (90.3%) |
| Public Administration | 12 (75.0%) | 4 (25.0%) |
| Total | 291 (59.6%) | 197 (40.4%) |
Education in Greenleaf
School Enrollment in Greenleaf
The most common levels of schooling among the 237 students in Greenleaf are middle school (124 | 52.3%), high school (46 | 19.4%), and college / undergraduate (44 | 18.6%).
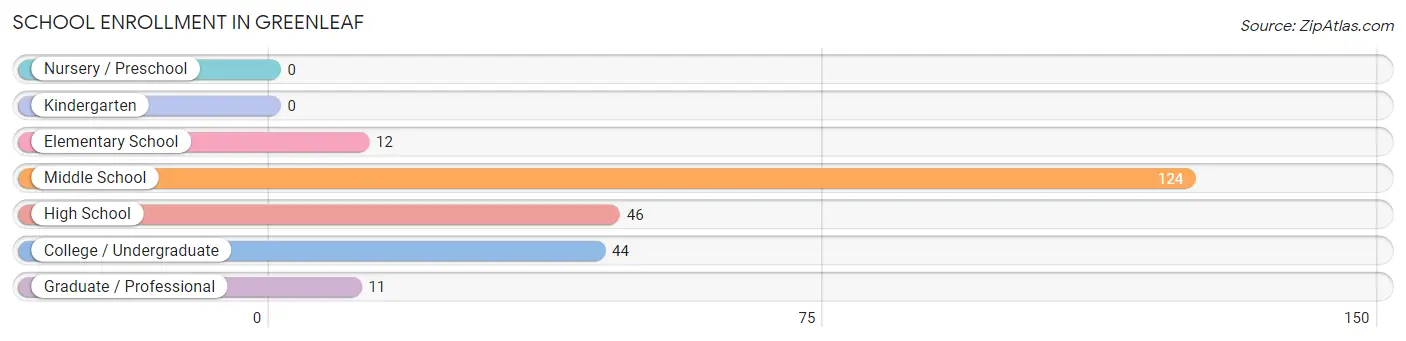
| School Level | # Students | % Students |
| Nursery / Preschool | 0 | 0.0% |
| Kindergarten | 0 | 0.0% |
| Elementary School | 12 | 5.1% |
| Middle School | 124 | 52.3% |
| High School | 46 | 19.4% |
| College / Undergraduate | 44 | 18.6% |
| Graduate / Professional | 11 | 4.6% |
| Total | 237 | 100.0% |
School Enrollment by Age by Funding Source in Greenleaf
Out of a total of 237 students who are enrolled in schools in Greenleaf, 32 (13.5%) attend a private institution, while the remaining 205 (86.5%) are enrolled in public schools. The age group of 20 to 24 year olds has the highest likelihood of being enrolled in private schools, with 13 (72.2% in the age bracket) enrolled. Conversely, the age group of 10 to 14 year olds has the lowest likelihood of being enrolled in a private school, with 121 (96.8% in the age bracket) attending a public institution.
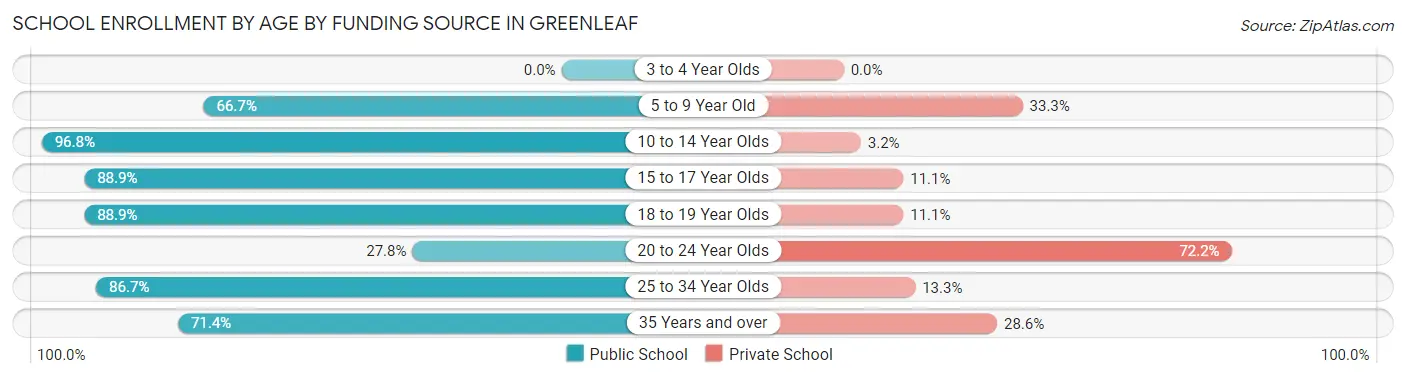
| Age Bracket | Public School | Private School |
| 3 to 4 Year Olds | 0 (0.0%) | 0 (0.0%) |
| 5 to 9 Year Old | 8 (66.7%) | 4 (33.3%) |
| 10 to 14 Year Olds | 121 (96.8%) | 4 (3.2%) |
| 15 to 17 Year Olds | 16 (88.9%) | 2 (11.1%) |
| 18 to 19 Year Olds | 24 (88.9%) | 3 (11.1%) |
| 20 to 24 Year Olds | 5 (27.8%) | 13 (72.2%) |
| 25 to 34 Year Olds | 26 (86.7%) | 4 (13.3%) |
| 35 Years and over | 5 (71.4%) | 2 (28.6%) |
| Total | 205 (86.5%) | 32 (13.5%) |
Educational Attainment by Field of Study in Greenleaf
Business (36 | 20.9%), education (31 | 18.0%), computers & mathematics (29 | 16.9%), liberal arts & history (16 | 9.3%), and arts & humanities (16 | 9.3%) are the most common fields of study among 172 individuals in Greenleaf who have obtained a bachelor's degree or higher.
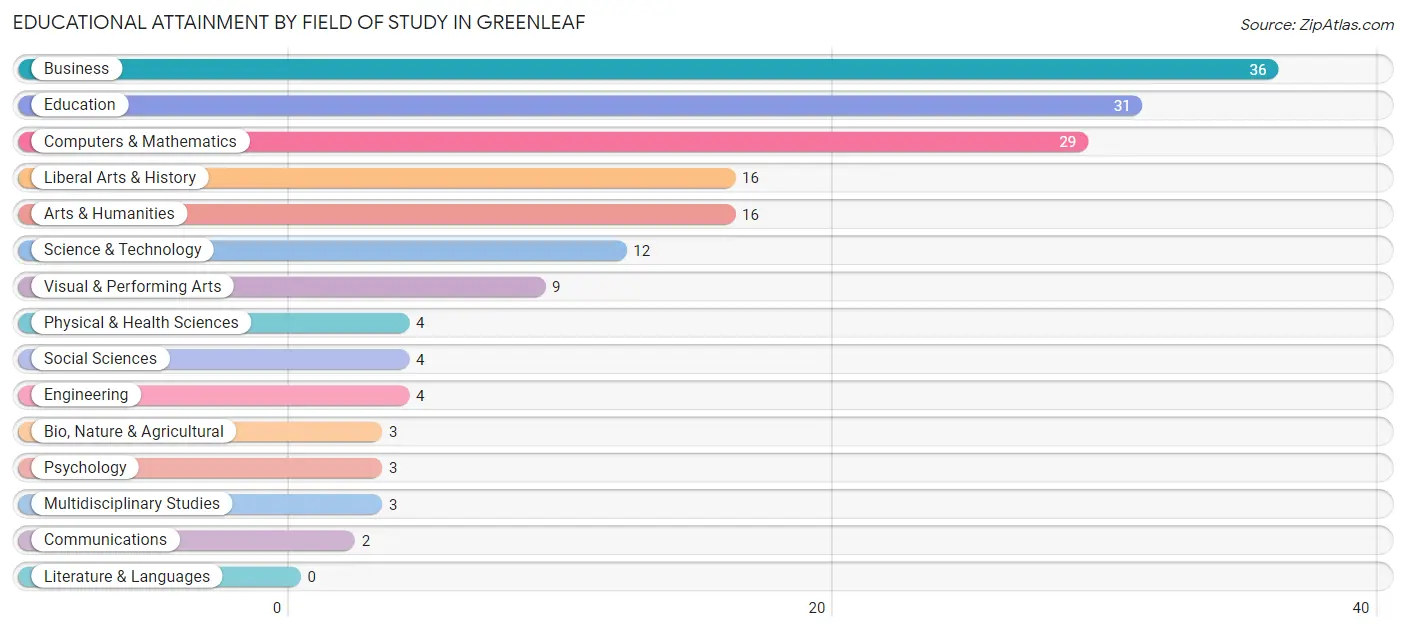
| Field of Study | # Graduates | % Graduates |
| Computers & Mathematics | 29 | 16.9% |
| Bio, Nature & Agricultural | 3 | 1.7% |
| Physical & Health Sciences | 4 | 2.3% |
| Psychology | 3 | 1.7% |
| Social Sciences | 4 | 2.3% |
| Engineering | 4 | 2.3% |
| Multidisciplinary Studies | 3 | 1.7% |
| Science & Technology | 12 | 7.0% |
| Business | 36 | 20.9% |
| Education | 31 | 18.0% |
| Literature & Languages | 0 | 0.0% |
| Liberal Arts & History | 16 | 9.3% |
| Visual & Performing Arts | 9 | 5.2% |
| Communications | 2 | 1.2% |
| Arts & Humanities | 16 | 9.3% |
| Total | 172 | 100.0% |
Transportation & Commute in Greenleaf
Vehicle Availability by Sex in Greenleaf
The most prevalent vehicle ownership categories in Greenleaf are males with 2 vehicles (82, accounting for 32.8%) and females with 2 vehicles (54, making up 42.7%).
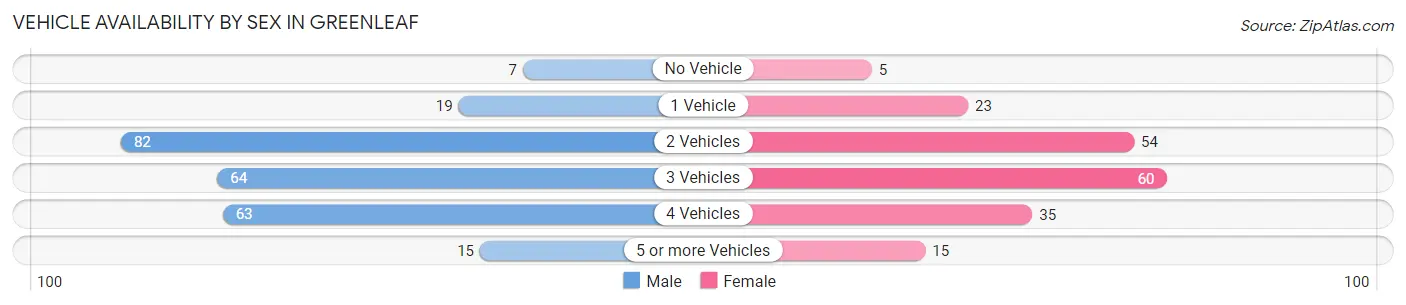
| Vehicles Available | Male | Female |
| No Vehicle | 7 (2.8%) | 5 (2.6%) |
| 1 Vehicle | 19 (7.6%) | 23 (12.0%) |
| 2 Vehicles | 82 (32.8%) | 54 (28.1%) |
| 3 Vehicles | 64 (25.6%) | 60 (31.2%) |
| 4 Vehicles | 63 (25.2%) | 35 (18.2%) |
| 5 or more Vehicles | 15 (6.0%) | 15 (7.8%) |
| Total | 250 (100.0%) | 192 (100.0%) |
Commute Time in Greenleaf
The most frequently occuring commute durations in Greenleaf are 15 to 19 minutes (70 commuters, 17.1%), 20 to 24 minutes (67 commuters, 16.3%), and 5 to 9 minutes (51 commuters, 12.4%).
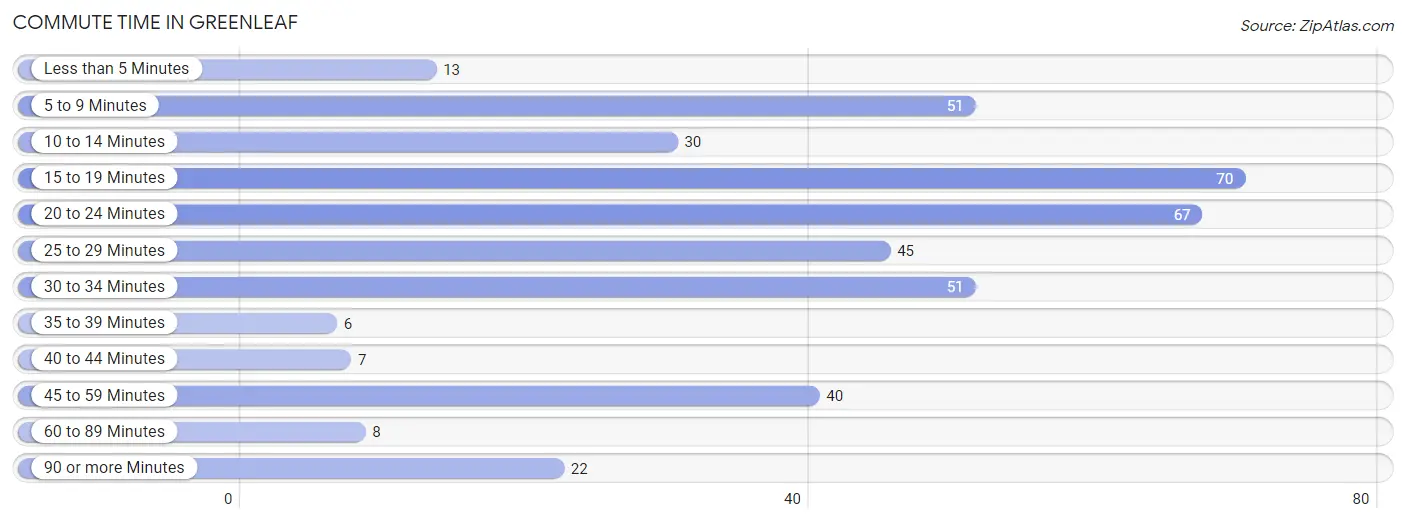
| Commute Time | # Commuters | % Commuters |
| Less than 5 Minutes | 13 | 3.2% |
| 5 to 9 Minutes | 51 | 12.4% |
| 10 to 14 Minutes | 30 | 7.3% |
| 15 to 19 Minutes | 70 | 17.1% |
| 20 to 24 Minutes | 67 | 16.3% |
| 25 to 29 Minutes | 45 | 11.0% |
| 30 to 34 Minutes | 51 | 12.4% |
| 35 to 39 Minutes | 6 | 1.5% |
| 40 to 44 Minutes | 7 | 1.7% |
| 45 to 59 Minutes | 40 | 9.8% |
| 60 to 89 Minutes | 8 | 1.9% |
| 90 or more Minutes | 22 | 5.4% |
Commute Time by Sex in Greenleaf
The most common commute times in Greenleaf are 15 to 19 minutes (45 commuters, 18.4%) for males and 5 to 9 minutes (27 commuters, 16.3%) for females.
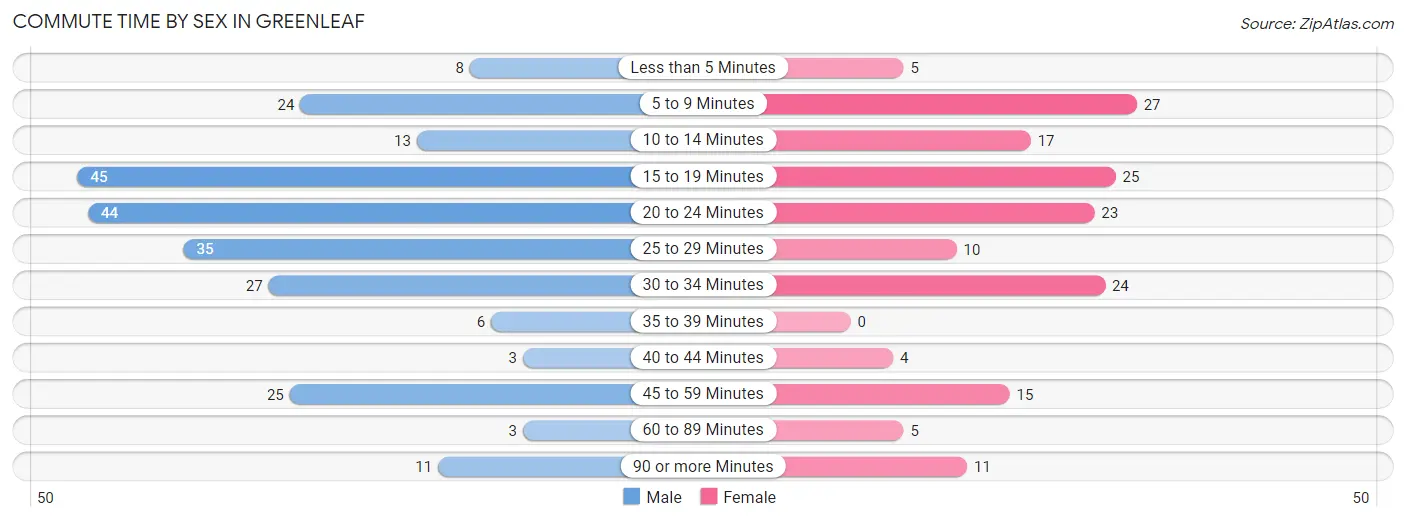
| Commute Time | Male | Female |
| Less than 5 Minutes | 8 (3.3%) | 5 (3.0%) |
| 5 to 9 Minutes | 24 (9.8%) | 27 (16.3%) |
| 10 to 14 Minutes | 13 (5.3%) | 17 (10.2%) |
| 15 to 19 Minutes | 45 (18.4%) | 25 (15.1%) |
| 20 to 24 Minutes | 44 (18.0%) | 23 (13.9%) |
| 25 to 29 Minutes | 35 (14.3%) | 10 (6.0%) |
| 30 to 34 Minutes | 27 (11.1%) | 24 (14.5%) |
| 35 to 39 Minutes | 6 (2.5%) | 0 (0.0%) |
| 40 to 44 Minutes | 3 (1.2%) | 4 (2.4%) |
| 45 to 59 Minutes | 25 (10.2%) | 15 (9.0%) |
| 60 to 89 Minutes | 3 (1.2%) | 5 (3.0%) |
| 90 or more Minutes | 11 (4.5%) | 11 (6.6%) |
Time of Departure to Work by Sex in Greenleaf
The most frequent times of departure to work in Greenleaf are 6:00 AM to 6:29 AM (48, 19.7%) for males and 6:30 AM to 6:59 AM (23, 13.9%) for females.
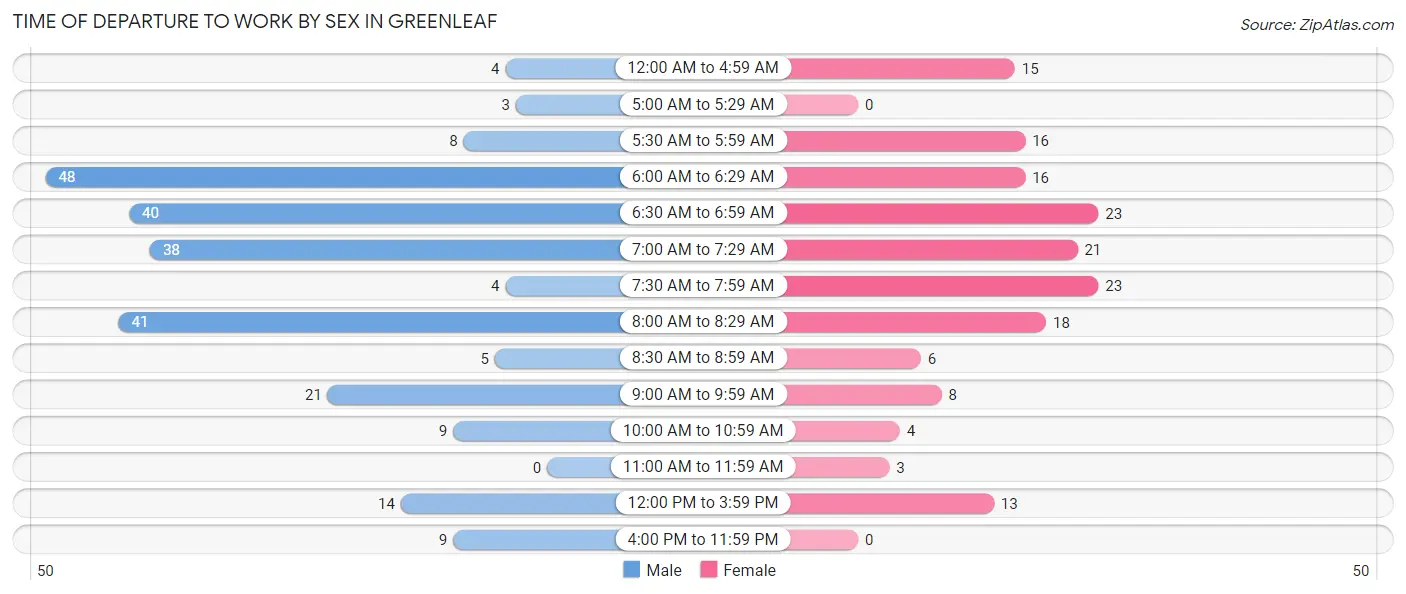
| Time of Departure | Male | Female |
| 12:00 AM to 4:59 AM | 4 (1.6%) | 15 (9.0%) |
| 5:00 AM to 5:29 AM | 3 (1.2%) | 0 (0.0%) |
| 5:30 AM to 5:59 AM | 8 (3.3%) | 16 (9.6%) |
| 6:00 AM to 6:29 AM | 48 (19.7%) | 16 (9.6%) |
| 6:30 AM to 6:59 AM | 40 (16.4%) | 23 (13.9%) |
| 7:00 AM to 7:29 AM | 38 (15.6%) | 21 (12.7%) |
| 7:30 AM to 7:59 AM | 4 (1.6%) | 23 (13.9%) |
| 8:00 AM to 8:29 AM | 41 (16.8%) | 18 (10.8%) |
| 8:30 AM to 8:59 AM | 5 (2.1%) | 6 (3.6%) |
| 9:00 AM to 9:59 AM | 21 (8.6%) | 8 (4.8%) |
| 10:00 AM to 10:59 AM | 9 (3.7%) | 4 (2.4%) |
| 11:00 AM to 11:59 AM | 0 (0.0%) | 3 (1.8%) |
| 12:00 PM to 3:59 PM | 14 (5.7%) | 13 (7.8%) |
| 4:00 PM to 11:59 PM | 9 (3.7%) | 0 (0.0%) |
| Total | 244 (100.0%) | 166 (100.0%) |
Housing Occupancy in Greenleaf
Occupancy by Ownership in Greenleaf
Of the total 407 dwellings in Greenleaf, owner-occupied units account for 277 (68.1%), while renter-occupied units make up 130 (31.9%).
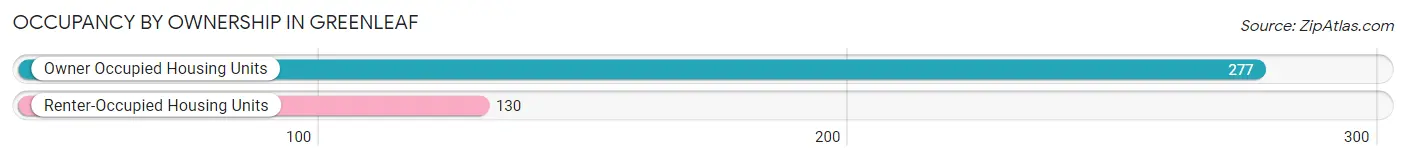
| Occupancy | # Housing Units | % Housing Units |
| Owner Occupied Housing Units | 277 | 68.1% |
| Renter-Occupied Housing Units | 130 | 31.9% |
| Total Occupied Housing Units | 407 | 100.0% |
Occupancy by Household Size in Greenleaf
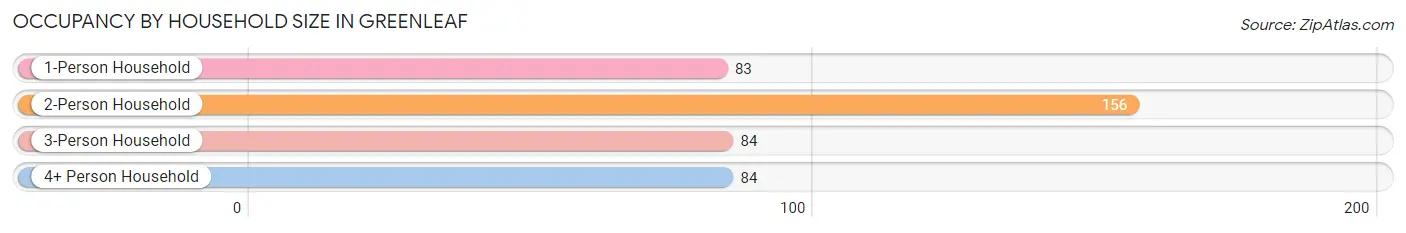
| Household Size | # Housing Units | % Housing Units |
| 1-Person Household | 83 | 20.4% |
| 2-Person Household | 156 | 38.3% |
| 3-Person Household | 84 | 20.6% |
| 4+ Person Household | 84 | 20.6% |
| Total Housing Units | 407 | 100.0% |
Occupancy by Ownership by Household Size in Greenleaf
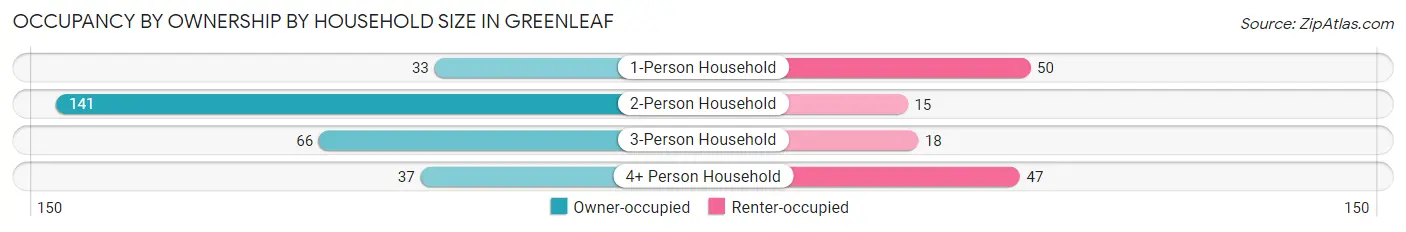
| Household Size | Owner-occupied | Renter-occupied |
| 1-Person Household | 33 (39.8%) | 50 (60.2%) |
| 2-Person Household | 141 (90.4%) | 15 (9.6%) |
| 3-Person Household | 66 (78.6%) | 18 (21.4%) |
| 4+ Person Household | 37 (44.1%) | 47 (55.9%) |
| Total Housing Units | 277 (68.1%) | 130 (31.9%) |
Occupancy by Educational Attainment in Greenleaf
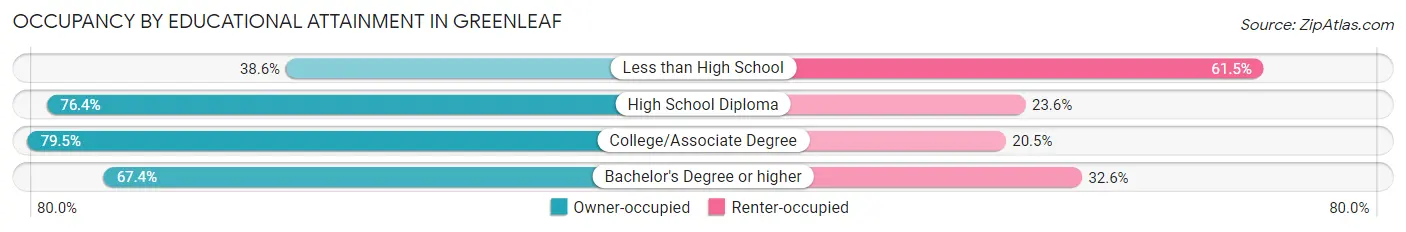
| Household Size | Owner-occupied | Renter-occupied |
| Less than High School | 32 (38.6%) | 51 (61.5%) |
| High School Diploma | 55 (76.4%) | 17 (23.6%) |
| College/Associate Degree | 132 (79.5%) | 34 (20.5%) |
| Bachelor's Degree or higher | 58 (67.4%) | 28 (32.6%) |
Occupancy by Age of Householder in Greenleaf
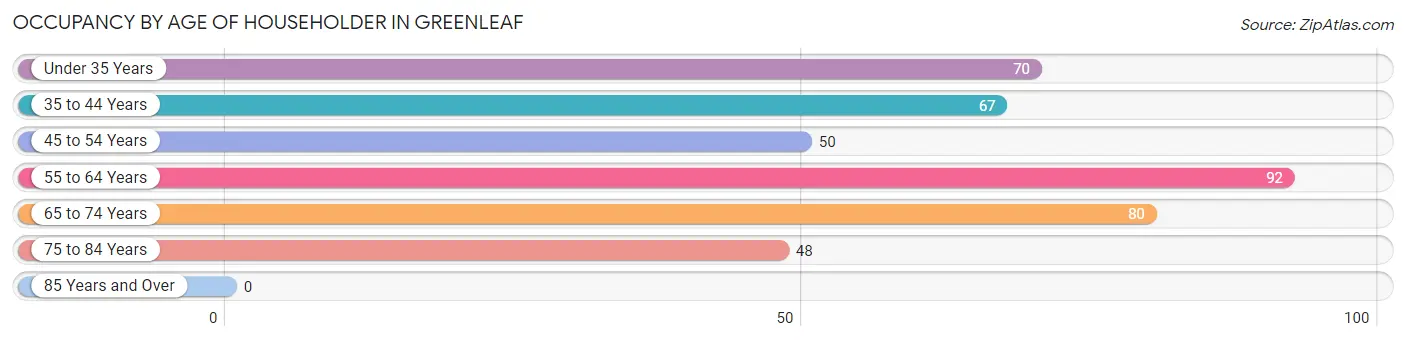
| Age Bracket | # Households | % Households |
| Under 35 Years | 70 | 17.2% |
| 35 to 44 Years | 67 | 16.5% |
| 45 to 54 Years | 50 | 12.3% |
| 55 to 64 Years | 92 | 22.6% |
| 65 to 74 Years | 80 | 19.7% |
| 75 to 84 Years | 48 | 11.8% |
| 85 Years and Over | 0 | 0.0% |
| Total | 407 | 100.0% |
Housing Finances in Greenleaf
Median Income by Occupancy in Greenleaf
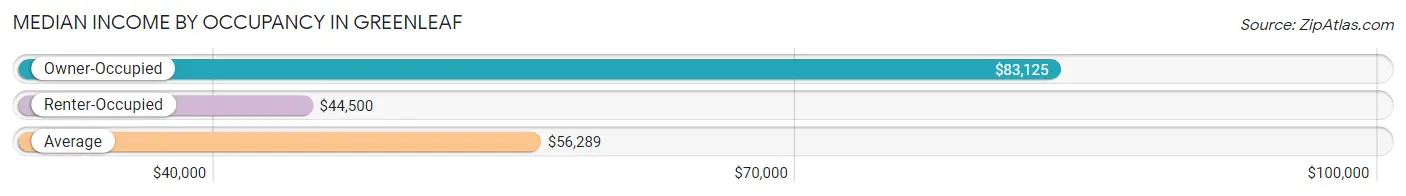
| Occupancy Type | # Households | Median Income |
| Owner-Occupied | 277 (68.1%) | $83,125 |
| Renter-Occupied | 130 (31.9%) | $44,500 |
| Average | 407 (100.0%) | $56,289 |
Occupancy by Householder Income Bracket in Greenleaf
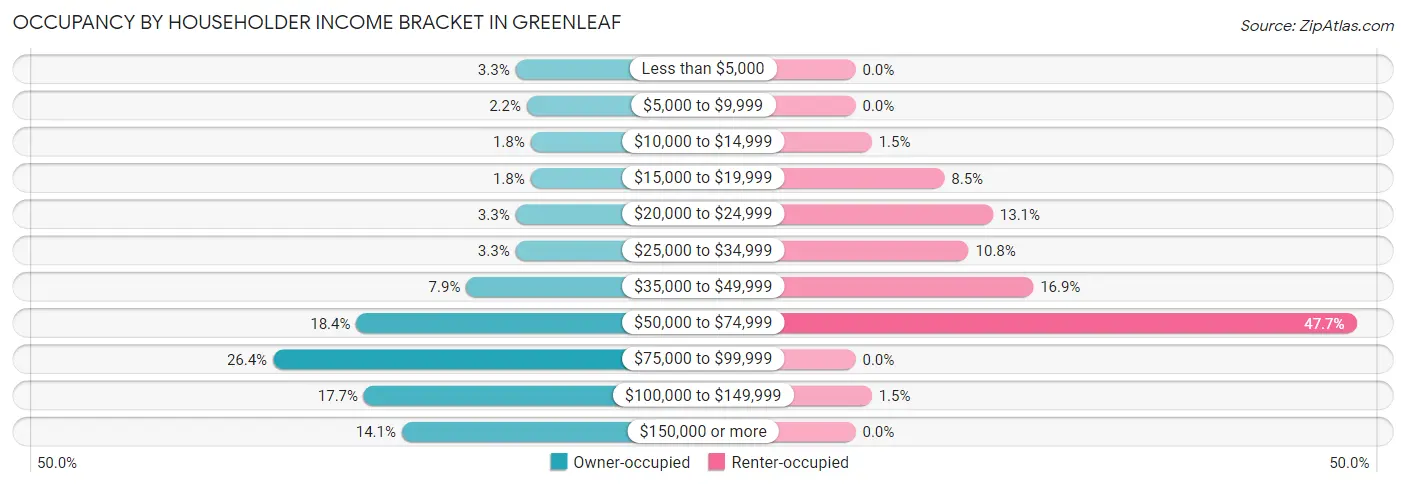
| Income Bracket | Owner-occupied | Renter-occupied |
| Less than $5,000 | 9 (3.3%) | 0 (0.0%) |
| $5,000 to $9,999 | 6 (2.2%) | 0 (0.0%) |
| $10,000 to $14,999 | 5 (1.8%) | 2 (1.5%) |
| $15,000 to $19,999 | 5 (1.8%) | 11 (8.5%) |
| $20,000 to $24,999 | 9 (3.3%) | 17 (13.1%) |
| $25,000 to $34,999 | 9 (3.3%) | 14 (10.8%) |
| $35,000 to $49,999 | 22 (7.9%) | 22 (16.9%) |
| $50,000 to $74,999 | 51 (18.4%) | 62 (47.7%) |
| $75,000 to $99,999 | 73 (26.4%) | 0 (0.0%) |
| $100,000 to $149,999 | 49 (17.7%) | 2 (1.5%) |
| $150,000 or more | 39 (14.1%) | 0 (0.0%) |
| Total | 277 (100.0%) | 130 (100.0%) |
Monthly Housing Cost Tiers in Greenleaf
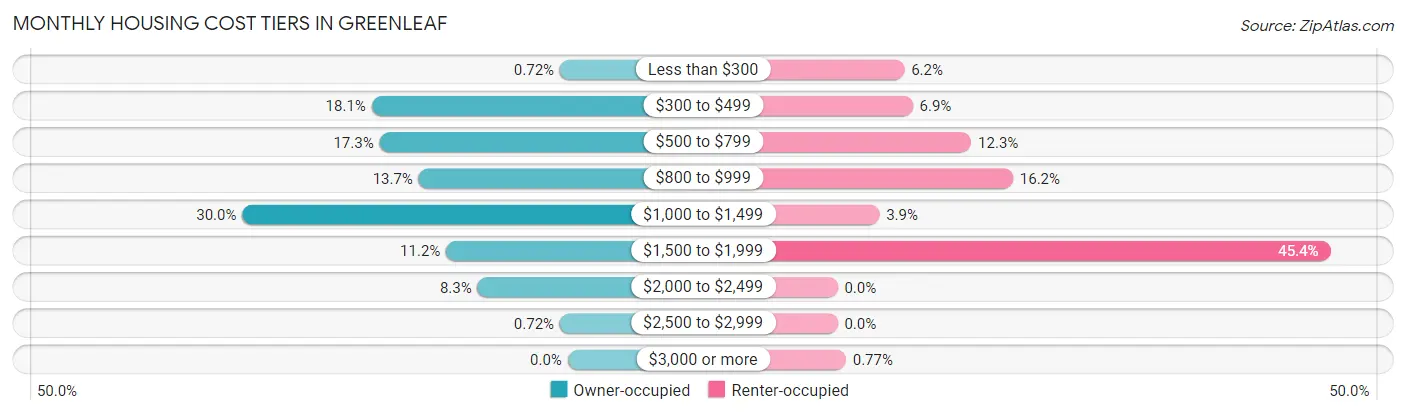
| Monthly Cost | Owner-occupied | Renter-occupied |
| Less than $300 | 2 (0.7%) | 8 (6.1%) |
| $300 to $499 | 50 (18.0%) | 9 (6.9%) |
| $500 to $799 | 48 (17.3%) | 16 (12.3%) |
| $800 to $999 | 38 (13.7%) | 21 (16.2%) |
| $1,000 to $1,499 | 83 (30.0%) | 5 (3.8%) |
| $1,500 to $1,999 | 31 (11.2%) | 59 (45.4%) |
| $2,000 to $2,499 | 23 (8.3%) | 0 (0.0%) |
| $2,500 to $2,999 | 2 (0.7%) | 0 (0.0%) |
| $3,000 or more | 0 (0.0%) | 1 (0.8%) |
| Total | 277 (100.0%) | 130 (100.0%) |
Physical Housing Characteristics in Greenleaf
Housing Structures in Greenleaf
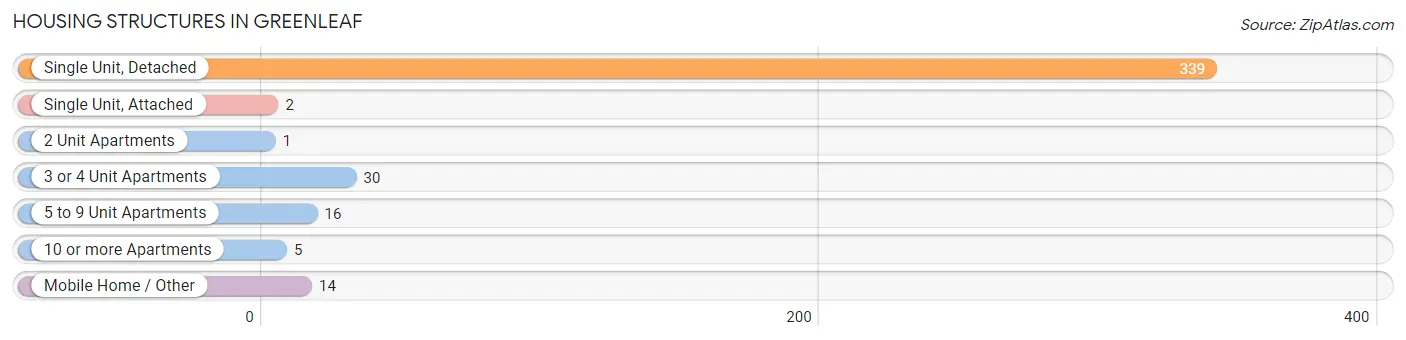
| Structure Type | # Housing Units | % Housing Units |
| Single Unit, Detached | 339 | 83.3% |
| Single Unit, Attached | 2 | 0.5% |
| 2 Unit Apartments | 1 | 0.3% |
| 3 or 4 Unit Apartments | 30 | 7.4% |
| 5 to 9 Unit Apartments | 16 | 3.9% |
| 10 or more Apartments | 5 | 1.2% |
| Mobile Home / Other | 14 | 3.4% |
| Total | 407 | 100.0% |
Housing Structures by Occupancy in Greenleaf
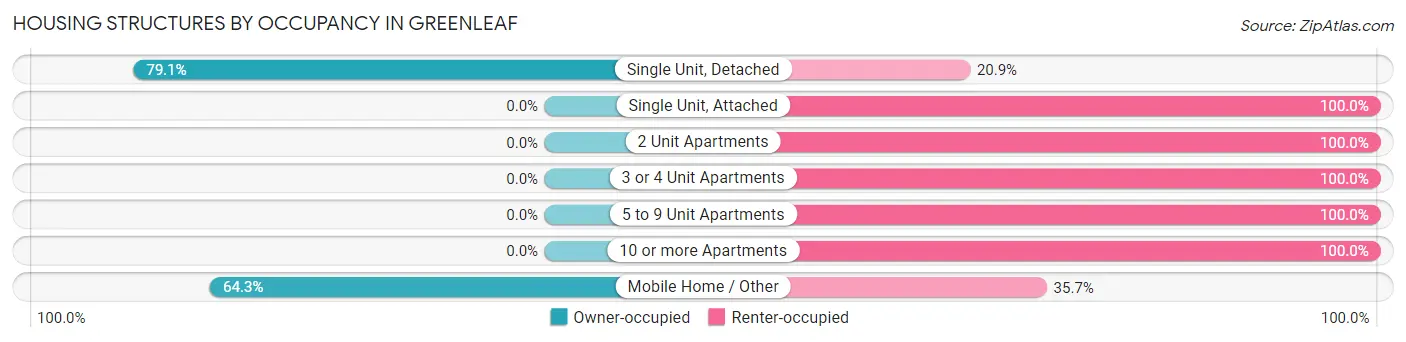
| Structure Type | Owner-occupied | Renter-occupied |
| Single Unit, Detached | 268 (79.1%) | 71 (20.9%) |
| Single Unit, Attached | 0 (0.0%) | 2 (100.0%) |
| 2 Unit Apartments | 0 (0.0%) | 1 (100.0%) |
| 3 or 4 Unit Apartments | 0 (0.0%) | 30 (100.0%) |
| 5 to 9 Unit Apartments | 0 (0.0%) | 16 (100.0%) |
| 10 or more Apartments | 0 (0.0%) | 5 (100.0%) |
| Mobile Home / Other | 9 (64.3%) | 5 (35.7%) |
| Total | 277 (68.1%) | 130 (31.9%) |
Housing Structures by Number of Rooms in Greenleaf
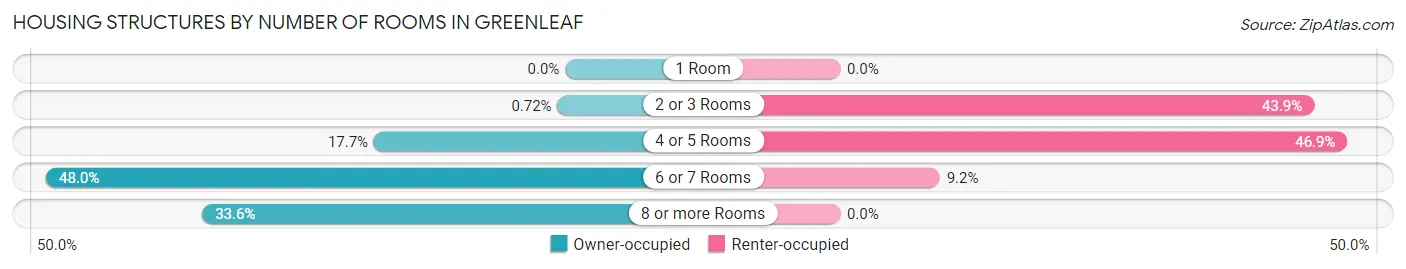
| Number of Rooms | Owner-occupied | Renter-occupied |
| 1 Room | 0 (0.0%) | 0 (0.0%) |
| 2 or 3 Rooms | 2 (0.7%) | 57 (43.9%) |
| 4 or 5 Rooms | 49 (17.7%) | 61 (46.9%) |
| 6 or 7 Rooms | 133 (48.0%) | 12 (9.2%) |
| 8 or more Rooms | 93 (33.6%) | 0 (0.0%) |
| Total | 277 (100.0%) | 130 (100.0%) |
Housing Structure by Heating Type in Greenleaf
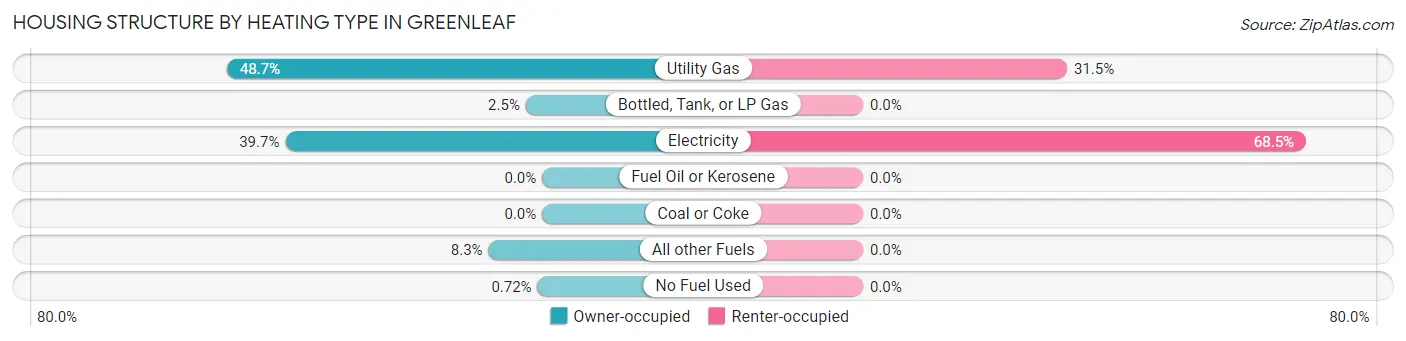
| Heating Type | Owner-occupied | Renter-occupied |
| Utility Gas | 135 (48.7%) | 41 (31.5%) |
| Bottled, Tank, or LP Gas | 7 (2.5%) | 0 (0.0%) |
| Electricity | 110 (39.7%) | 89 (68.5%) |
| Fuel Oil or Kerosene | 0 (0.0%) | 0 (0.0%) |
| Coal or Coke | 0 (0.0%) | 0 (0.0%) |
| All other Fuels | 23 (8.3%) | 0 (0.0%) |
| No Fuel Used | 2 (0.7%) | 0 (0.0%) |
| Total | 277 (100.0%) | 130 (100.0%) |
Household Vehicle Usage in Greenleaf
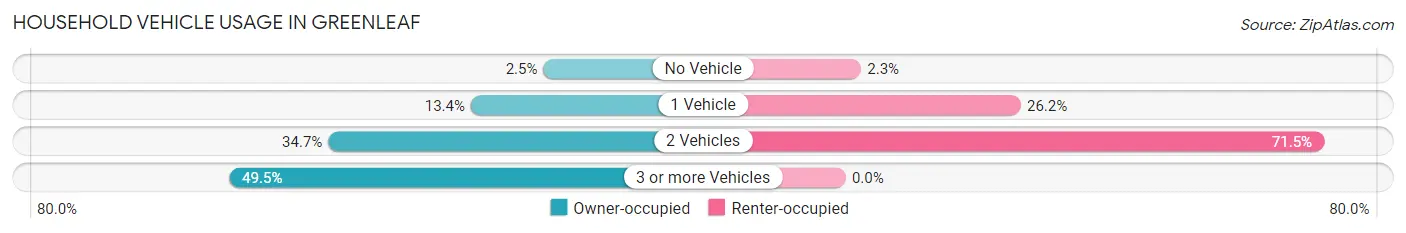
| Vehicles per Household | Owner-occupied | Renter-occupied |
| No Vehicle | 7 (2.5%) | 3 (2.3%) |
| 1 Vehicle | 37 (13.4%) | 34 (26.2%) |
| 2 Vehicles | 96 (34.7%) | 93 (71.5%) |
| 3 or more Vehicles | 137 (49.5%) | 0 (0.0%) |
| Total | 277 (100.0%) | 130 (100.0%) |
Real Estate & Mortgages in Greenleaf
Real Estate and Mortgage Overview in Greenleaf
| Characteristic | Without Mortgage | With Mortgage |
| Housing Units | 94 | 183 |
| Median Property Value | $238,900 | $279,300 |
| Median Household Income | $84,286 | $16 |
| Monthly Housing Costs | $475 | $0 |
| Real Estate Taxes | $1,688 | $16 |
Property Value by Mortgage Status in Greenleaf
| Property Value | Without Mortgage | With Mortgage |
| Less than $50,000 | 1 (1.1%) | 8 (4.4%) |
| $50,000 to $99,999 | 2 (2.1%) | 3 (1.6%) |
| $100,000 to $299,999 | 50 (53.2%) | 95 (51.9%) |
| $300,000 to $499,999 | 31 (33.0%) | 47 (25.7%) |
| $500,000 to $749,999 | 0 (0.0%) | 22 (12.0%) |
| $750,000 to $999,999 | 4 (4.3%) | 6 (3.3%) |
| $1,000,000 or more | 6 (6.4%) | 2 (1.1%) |
| Total | 94 (100.0%) | 183 (100.0%) |
Household Income by Mortgage Status in Greenleaf
| Household Income | Without Mortgage | With Mortgage |
| Less than $10,000 | 3 (3.2%) | 9 (4.9%) |
| $10,000 to $24,999 | 3 (3.2%) | 12 (6.6%) |
| $25,000 to $34,999 | 0 (0.0%) | 16 (8.7%) |
| $35,000 to $49,999 | 5 (5.3%) | 9 (4.9%) |
| $50,000 to $74,999 | 25 (26.6%) | 17 (9.3%) |
| $75,000 to $99,999 | 24 (25.5%) | 26 (14.2%) |
| $100,000 to $149,999 | 11 (11.7%) | 49 (26.8%) |
| $150,000 or more | 23 (24.5%) | 38 (20.8%) |
| Total | 94 (100.0%) | 183 (100.0%) |
Property Value to Household Income Ratio in Greenleaf
| Value-to-Income Ratio | Without Mortgage | With Mortgage |
| Less than 2.0x | 21 (22.3%) | 80,938 (44,228.4%) |
| 2.0x to 2.9x | 21 (22.3%) | 34 (18.6%) |
| 3.0x to 3.9x | 13 (13.8%) | 43 (23.5%) |
| 4.0x or more | 39 (41.5%) | 12 (6.6%) |
| Total | 94 (100.0%) | 183 (100.0%) |
Real Estate Taxes by Mortgage Status in Greenleaf
| Property Taxes | Without Mortgage | With Mortgage |
| Less than $800 | 7 (7.4%) | 2 (1.1%) |
| $800 to $1,499 | 30 (31.9%) | 7 (3.8%) |
| $800 to $1,499 | 55 (58.5%) | 79 (43.2%) |
| Total | 94 (100.0%) | 183 (100.0%) |
Health & Disability in Greenleaf
Health Insurance Coverage by Age in Greenleaf
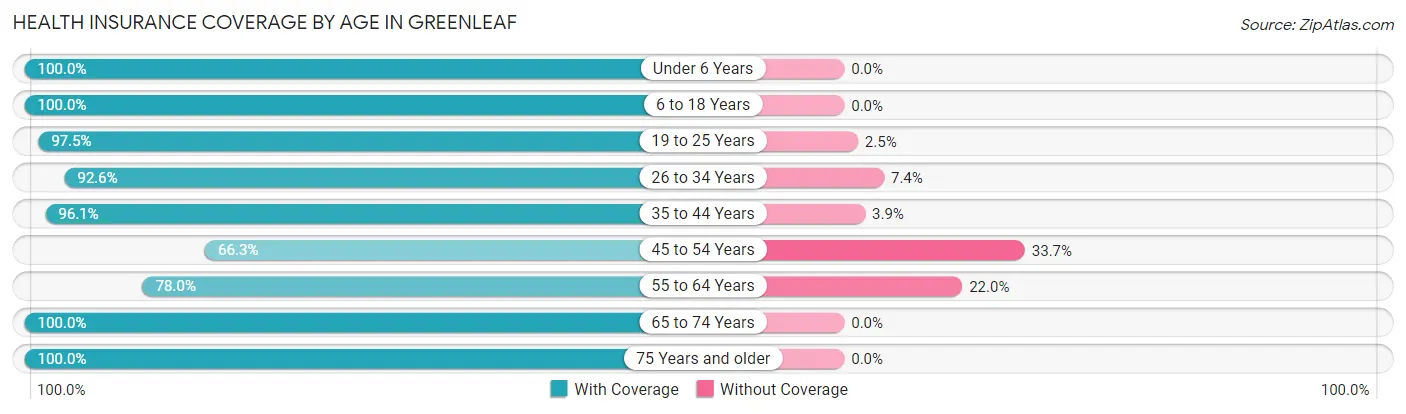
| Age Bracket | With Coverage | Without Coverage |
| Under 6 Years | 38 (100.0%) | 0 (0.0%) |
| 6 to 18 Years | 182 (100.0%) | 0 (0.0%) |
| 19 to 25 Years | 115 (97.5%) | 3 (2.5%) |
| 26 to 34 Years | 75 (92.6%) | 6 (7.4%) |
| 35 to 44 Years | 99 (96.1%) | 4 (3.9%) |
| 45 to 54 Years | 65 (66.3%) | 33 (33.7%) |
| 55 to 64 Years | 110 (78.0%) | 31 (22.0%) |
| 65 to 74 Years | 159 (100.0%) | 0 (0.0%) |
| 75 Years and older | 75 (100.0%) | 0 (0.0%) |
| Total | 918 (92.3%) | 77 (7.7%) |
Health Insurance Coverage by Citizenship Status in Greenleaf
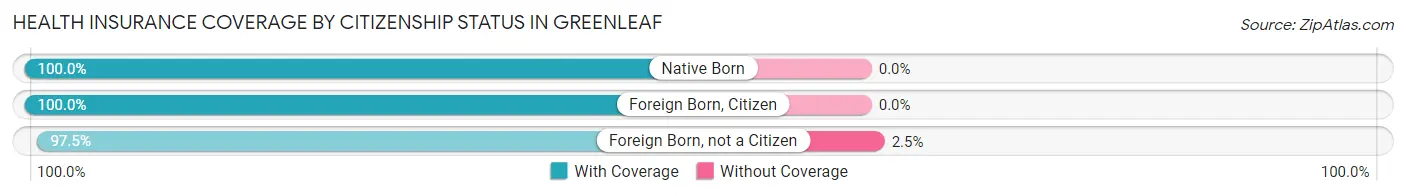
| Citizenship Status | With Coverage | Without Coverage |
| Native Born | 38 (100.0%) | 0 (0.0%) |
| Foreign Born, Citizen | 182 (100.0%) | 0 (0.0%) |
| Foreign Born, not a Citizen | 115 (97.5%) | 3 (2.5%) |
Health Insurance Coverage by Household Income in Greenleaf
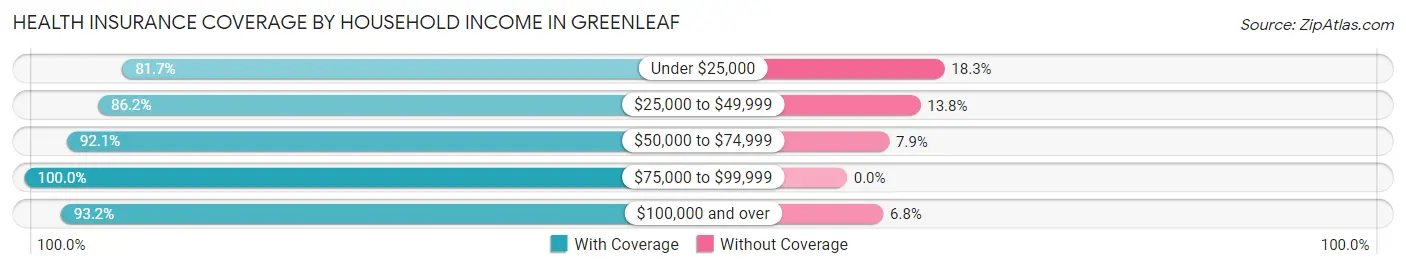
| Household Income | With Coverage | Without Coverage |
| Under $25,000 | 67 (81.7%) | 15 (18.3%) |
| $25,000 to $49,999 | 119 (86.2%) | 19 (13.8%) |
| $50,000 to $74,999 | 302 (92.1%) | 26 (7.9%) |
| $75,000 to $99,999 | 197 (100.0%) | 0 (0.0%) |
| $100,000 and over | 233 (93.2%) | 17 (6.8%) |
Public vs Private Health Insurance Coverage by Age in Greenleaf
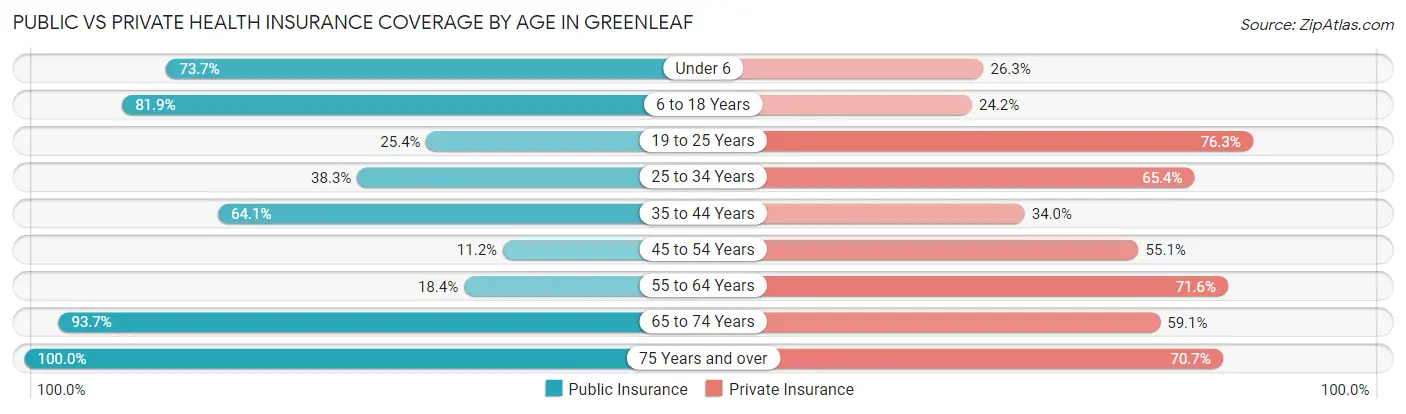
| Age Bracket | Public Insurance | Private Insurance |
| Under 6 | 28 (73.7%) | 10 (26.3%) |
| 6 to 18 Years | 149 (81.9%) | 44 (24.2%) |
| 19 to 25 Years | 30 (25.4%) | 90 (76.3%) |
| 25 to 34 Years | 31 (38.3%) | 53 (65.4%) |
| 35 to 44 Years | 66 (64.1%) | 35 (34.0%) |
| 45 to 54 Years | 11 (11.2%) | 54 (55.1%) |
| 55 to 64 Years | 26 (18.4%) | 101 (71.6%) |
| 65 to 74 Years | 149 (93.7%) | 94 (59.1%) |
| 75 Years and over | 75 (100.0%) | 53 (70.7%) |
| Total | 565 (56.8%) | 534 (53.7%) |
Disability Status by Sex by Age in Greenleaf
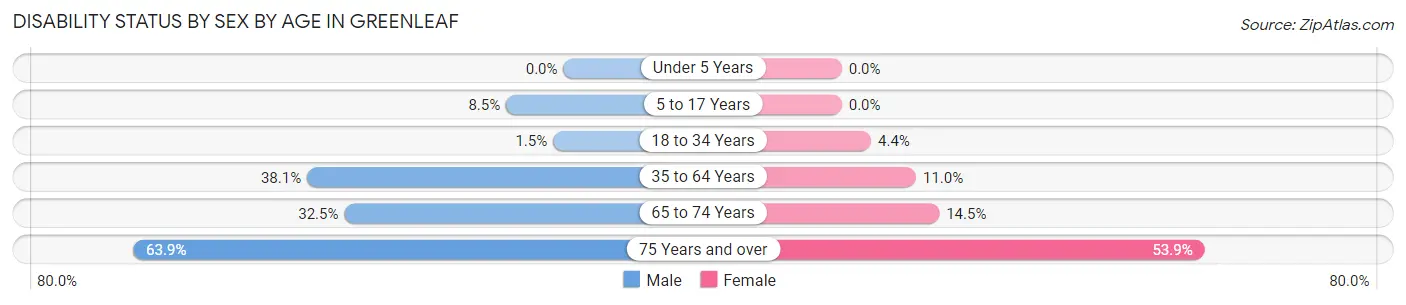
| Age Bracket | Male | Female |
| Under 5 Years | 0 (0.0%) | 0 (0.0%) |
| 5 to 17 Years | 4 (8.5%) | 0 (0.0%) |
| 18 to 34 Years | 2 (1.5%) | 4 (4.3%) |
| 35 to 64 Years | 75 (38.1%) | 16 (11.0%) |
| 65 to 74 Years | 27 (32.5%) | 11 (14.5%) |
| 75 Years and over | 23 (63.9%) | 21 (53.8%) |
Disability Class by Sex by Age in Greenleaf
Disability Class: Hearing Difficulty
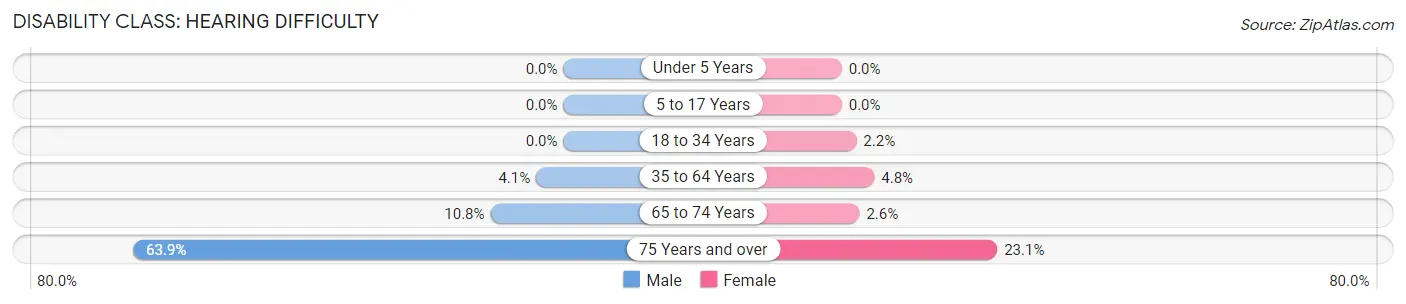
| Age Bracket | Male | Female |
| Under 5 Years | 0 (0.0%) | 0 (0.0%) |
| 5 to 17 Years | 0 (0.0%) | 0 (0.0%) |
| 18 to 34 Years | 0 (0.0%) | 2 (2.2%) |
| 35 to 64 Years | 8 (4.1%) | 7 (4.8%) |
| 65 to 74 Years | 9 (10.8%) | 2 (2.6%) |
| 75 Years and over | 23 (63.9%) | 9 (23.1%) |
Disability Class: Vision Difficulty
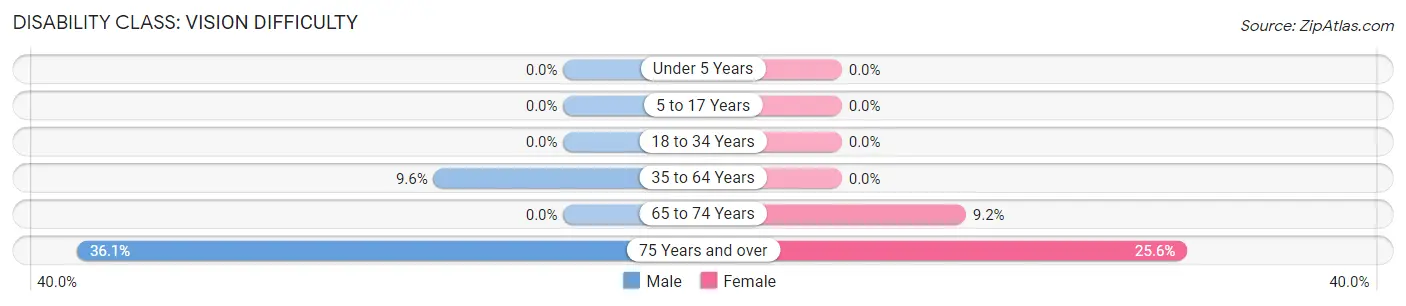
| Age Bracket | Male | Female |
| Under 5 Years | 0 (0.0%) | 0 (0.0%) |
| 5 to 17 Years | 0 (0.0%) | 0 (0.0%) |
| 18 to 34 Years | 0 (0.0%) | 0 (0.0%) |
| 35 to 64 Years | 19 (9.6%) | 0 (0.0%) |
| 65 to 74 Years | 0 (0.0%) | 7 (9.2%) |
| 75 Years and over | 13 (36.1%) | 10 (25.6%) |
Disability Class: Cognitive Difficulty
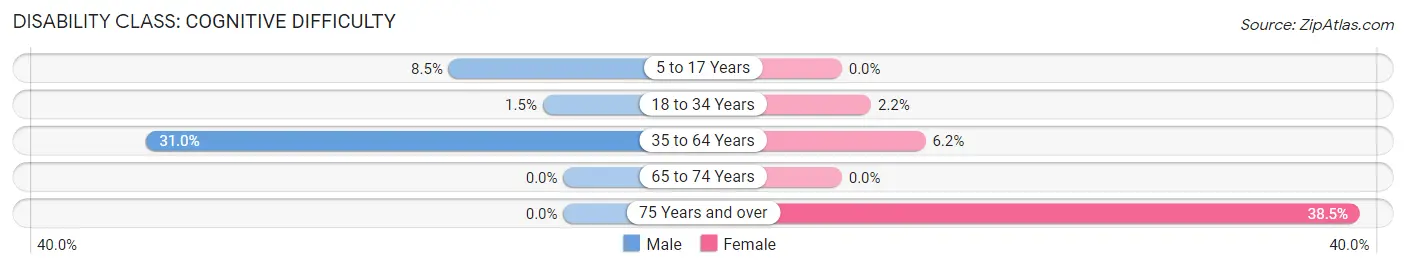
| Age Bracket | Male | Female |
| 5 to 17 Years | 4 (8.5%) | 0 (0.0%) |
| 18 to 34 Years | 2 (1.5%) | 2 (2.2%) |
| 35 to 64 Years | 61 (31.0%) | 9 (6.2%) |
| 65 to 74 Years | 0 (0.0%) | 0 (0.0%) |
| 75 Years and over | 0 (0.0%) | 15 (38.5%) |
Disability Class: Ambulatory Difficulty
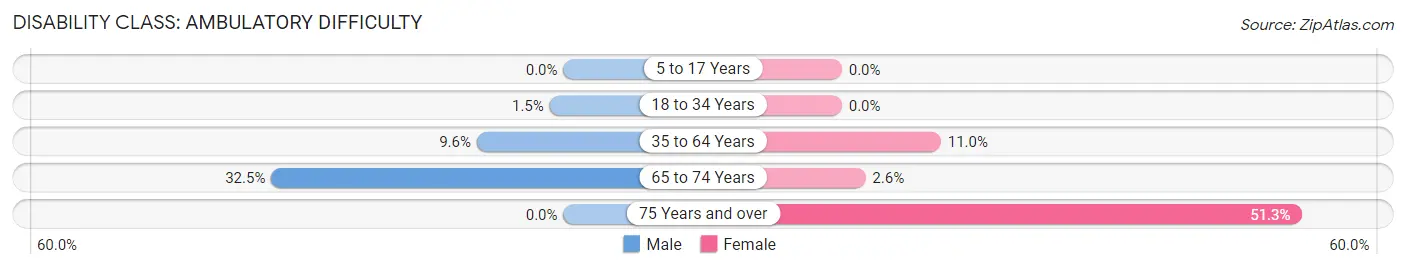
| Age Bracket | Male | Female |
| 5 to 17 Years | 0 (0.0%) | 0 (0.0%) |
| 18 to 34 Years | 2 (1.5%) | 0 (0.0%) |
| 35 to 64 Years | 19 (9.6%) | 16 (11.0%) |
| 65 to 74 Years | 27 (32.5%) | 2 (2.6%) |
| 75 Years and over | 0 (0.0%) | 20 (51.3%) |
Disability Class: Self-Care Difficulty
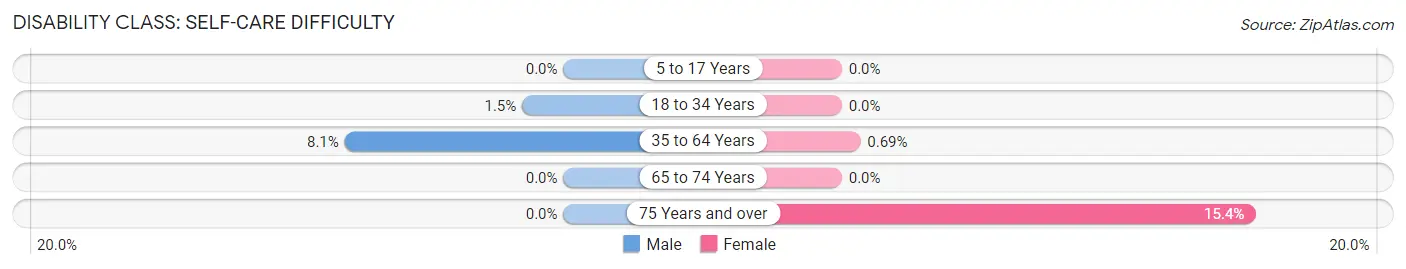
| Age Bracket | Male | Female |
| 5 to 17 Years | 0 (0.0%) | 0 (0.0%) |
| 18 to 34 Years | 2 (1.5%) | 0 (0.0%) |
| 35 to 64 Years | 16 (8.1%) | 1 (0.7%) |
| 65 to 74 Years | 0 (0.0%) | 0 (0.0%) |
| 75 Years and over | 0 (0.0%) | 6 (15.4%) |
Technology Access in Greenleaf
Computing Device Access in Greenleaf
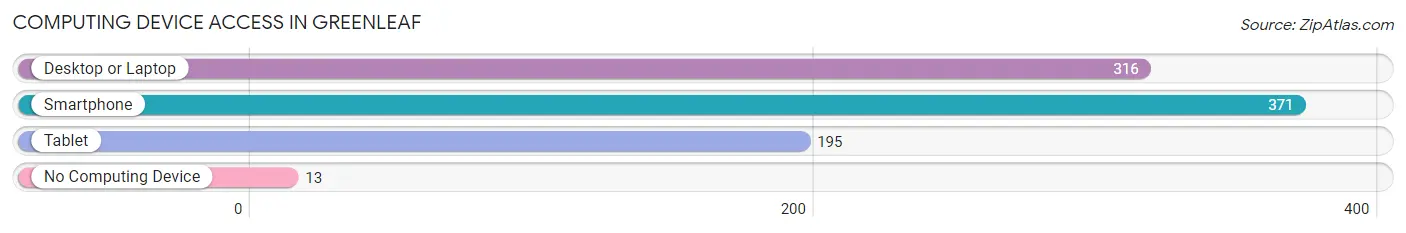
| Device Type | # Households | % Households |
| Desktop or Laptop | 316 | 77.6% |
| Smartphone | 371 | 91.1% |
| Tablet | 195 | 47.9% |
| No Computing Device | 13 | 3.2% |
| Total | 407 | 100.0% |
Internet Access in Greenleaf
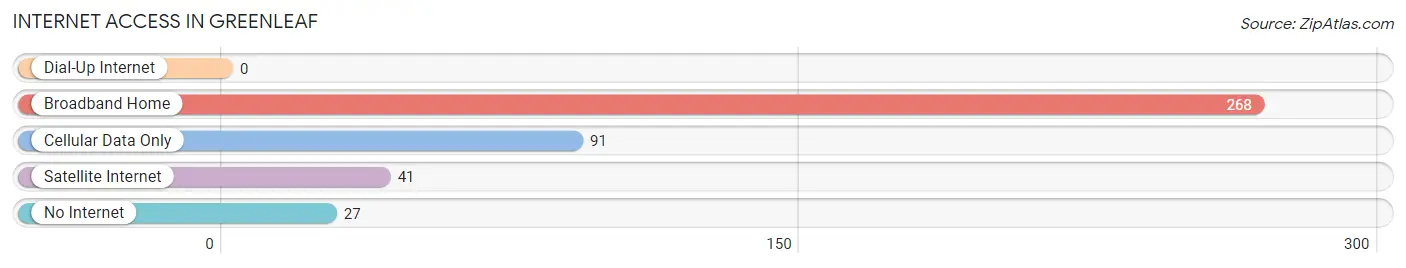
| Internet Type | # Households | % Households |
| Dial-Up Internet | 0 | 0.0% |
| Broadband Home | 268 | 65.8% |
| Cellular Data Only | 91 | 22.4% |
| Satellite Internet | 41 | 10.1% |
| No Internet | 27 | 6.6% |
| Total | 407 | 100.0% |
Greenleaf Summary
Greenleaf, Idaho is a small city located in Canyon County, Idaho. It is situated in the Treasure Valley, approximately 20 miles west of Boise. The city was founded in 1883 and has a population of approximately 1,500 people.
Geography
Greenleaf is located in the Treasure Valley, which is a region of the Snake River Plain in southwestern Idaho. The city is situated in a flat area, with the Boise River running through it. The city is surrounded by agricultural land, with the Boise National Forest to the north and the Owyhee Mountains to the south. The climate in Greenleaf is semi-arid, with hot summers and cold winters.
Economy
Greenleaf’s economy is largely based on agriculture. The city is home to several farms, which produce a variety of crops, including potatoes, corn, wheat, and alfalfa. The city also has a number of small businesses, including restaurants, retail stores, and service providers.
Demographics
As of the 2010 census, Greenleaf had a population of 1,500 people. The racial makeup of the city was 94.2% White, 0.7% African American, 0.7% Native American, 0.7% Asian, 0.7% from other races, and 2.7% from two or more races. The median household income was $41,250, and the median family income was $50,000.
History
Greenleaf was founded in 1883 by a group of settlers from the Midwest. The city was named after a local creek, which was named after a Native American chief. The city was originally a farming community, and the first settlers grew potatoes, wheat, and other crops.
In the early 1900s, the city began to grow and develop. The first school was built in 1906, and the first bank opened in 1908. The city also had a post office, a newspaper, and a hotel.
In the 1950s, the city began to experience a population boom. The city’s population grew from 1,000 in 1950 to 1,500 in 1960. This growth was largely due to the influx of people from other parts of the country who were looking for a better life.
Today, Greenleaf is a small city with a population of 1,500 people. The city is still largely agricultural, but it has also become a popular destination for tourists. The city is home to several parks, including the Greenleaf State Park, which is a popular spot for camping, fishing, and hiking. The city also has a number of restaurants, retail stores, and service providers.
Common Questions
What is Per Capita Income in Greenleaf?
Per Capita income in Greenleaf is $28,467.
What is the Median Family Income in Greenleaf?
Median Family Income in Greenleaf is $79,531.
What is the Median Household income in Greenleaf?
Median Household Income in Greenleaf is $56,289.
What is Income or Wage Gap in Greenleaf?
Income or Wage Gap in Greenleaf is 33.0%.
Women in Greenleaf earn 67.0 cents for every dollar earned by a man.
What is Inequality or Gini Index in Greenleaf?
Inequality or Gini Index in Greenleaf is 0.35.
What is the Total Population of Greenleaf?
Total Population of Greenleaf is 995.
What is the Total Male Population of Greenleaf?
Total Male Population of Greenleaf is 525.
What is the Total Female Population of Greenleaf?
Total Female Population of Greenleaf is 470.
What is the Ratio of Males per 100 Females in Greenleaf?
There are 111.70 Males per 100 Females in Greenleaf.
What is the Ratio of Females per 100 Males in Greenleaf?
There are 89.52 Females per 100 Males in Greenleaf.
What is the Median Population Age in Greenleaf?
Median Population Age in Greenleaf is 44.6 Years.
What is the Average Family Size in Greenleaf
Average Family Size in Greenleaf is 2.8 People.
What is the Average Household Size in Greenleaf
Average Household Size in Greenleaf is 2.4 People.
How Large is the Labor Force in Greenleaf?
There are 519 People in the Labor Forcein in Greenleaf.
What is the Percentage of People in the Labor Force in Greenleaf?
63.7% of People are in the Labor Force in Greenleaf.
What is the Unemployment Rate in Greenleaf?
Unemployment Rate in Greenleaf is 6.0%.