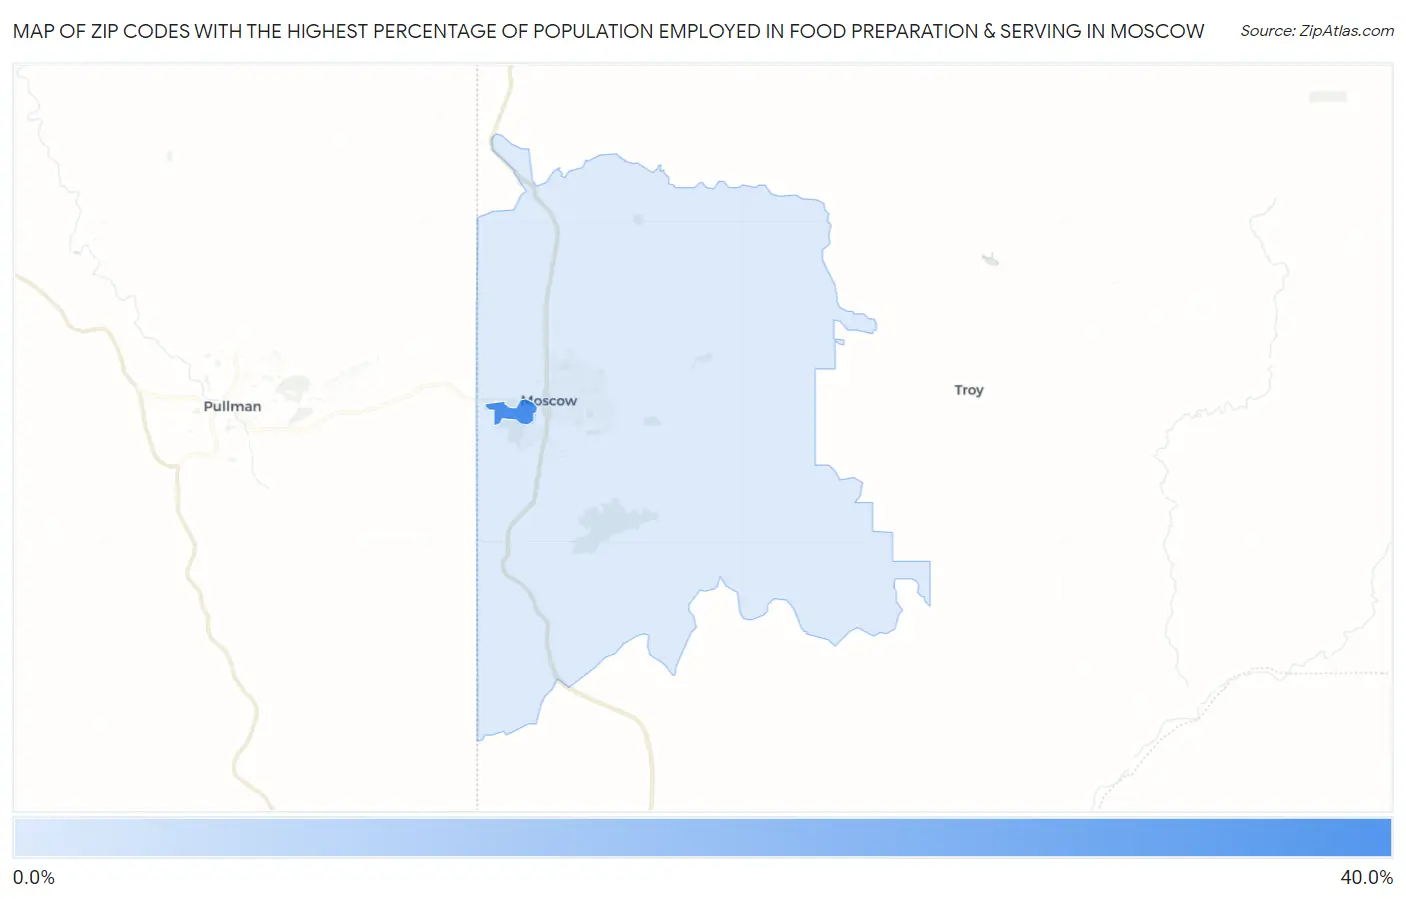
Zip Codes with the Highest Percentage of Population Employed in Food Preparation & Serving in Moscow, ID
RELATED REPORTS & OPTIONS
Food Preparation & Serving
Moscow
Compare Zip Codes
Map of Zip Codes with the Highest Percentage of Population Employed in Food Preparation & Serving in Moscow
6.9%
30.8%
Zip Codes with the Highest Percentage of Population Employed in Food Preparation & Serving in Moscow, ID
| Zip Code | % Employed | vs State | vs National | |
| 1. | 83844 | 30.8% | 5.7%(+25.1)#2 | 5.3%(+25.5)#197 |
| 2. | 83843 | 6.9% | 5.7%(+1.23)#58 | 5.3%(+1.62)#6,809 |
1
Common Questions
What are the Top Zip Codes with the Highest Percentage of Population Employed in Food Preparation & Serving in Moscow, ID?
Top Zip Codes with the Highest Percentage of Population Employed in Food Preparation & Serving in Moscow, ID are:
What zip code has the Highest Percentage of Population Employed in Food Preparation & Serving in Moscow, ID?
83844 has the Highest Percentage of Population Employed in Food Preparation & Serving in Moscow, ID with 30.8%.
What is the Percentage of Population Employed in Food Preparation & Serving in Moscow, ID?
Percentage of Population Employed in Food Preparation & Serving in Moscow is 10.7%.
What is the Percentage of Population Employed in Food Preparation & Serving in Idaho?
Percentage of Population Employed in Food Preparation & Serving in Idaho is 5.7%.
What is the Percentage of Population Employed in Food Preparation & Serving in the United States?
Percentage of Population Employed in Food Preparation & Serving in the United States is 5.3%.