Wallace, ID Map & Demographics
Wallace Map
Wallace Overview
$27,110
PER CAPITA INCOME
$76,583
AVG FAMILY INCOME
$49,052
AVG HOUSEHOLD INCOME
0.40
INEQUALITY / GINI INDEX
1,083
TOTAL POPULATION
619
MALE POPULATION
464
FEMALE POPULATION
133.41
MALES / 100 FEMALES
74.96
FEMALES / 100 MALES
43.1
MEDIAN AGE
3.2
AVG FAMILY SIZE
2.5
AVG HOUSEHOLD SIZE
461
LABOR FORCE [ PEOPLE ]
50.7%
PERCENT IN LABOR FORCE
3.5%
UNEMPLOYMENT RATE
Wallace Zip Codes
Wallace Area Codes
Income in Wallace
Income Overview in Wallace
Per Capita Income in Wallace is $27,110, while median incomes of families and households are $76,583 and $49,052 respectively.
| Characteristic | Number | Measure |
| Per Capita Income | 1,083 | $27,110 |
| Median Family Income | 225 | $76,583 |
| Mean Family Income | 225 | $73,560 |
| Median Household Income | 430 | $49,052 |
| Mean Household Income | 430 | $61,160 |
| Income Deficit | 225 | $0 |
| Wage / Income Gap (%) | 1,083 | 0.00% |
| Wage / Income Gap ($) | 1,083 | 100.00¢ per $1 |
| Gini / Inequality Index | 1,083 | 0.40 |
Earnings by Sex in Wallace
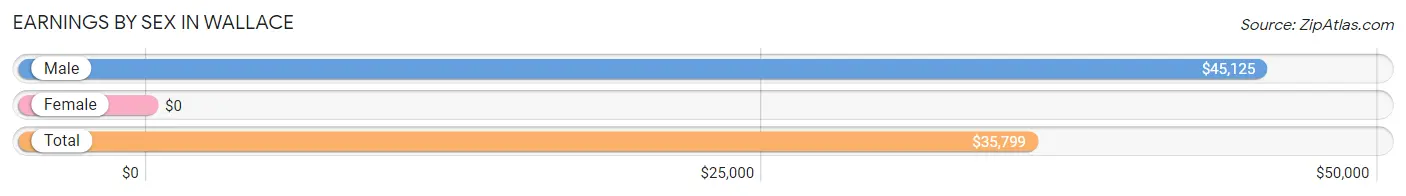
| Sex | Number | Average Earnings |
| Male | 293 (57.1%) | $45,125 |
| Female | 220 (42.9%) | $0 |
| Total | 513 (100.0%) | $35,799 |
Earnings by Sex by Income Bracket in Wallace
The most common earnings brackets in Wallace are $75,000 to $99,999 for men (60 | 20.5%) and $10,000 to $12,499 for women (32 | 14.5%).
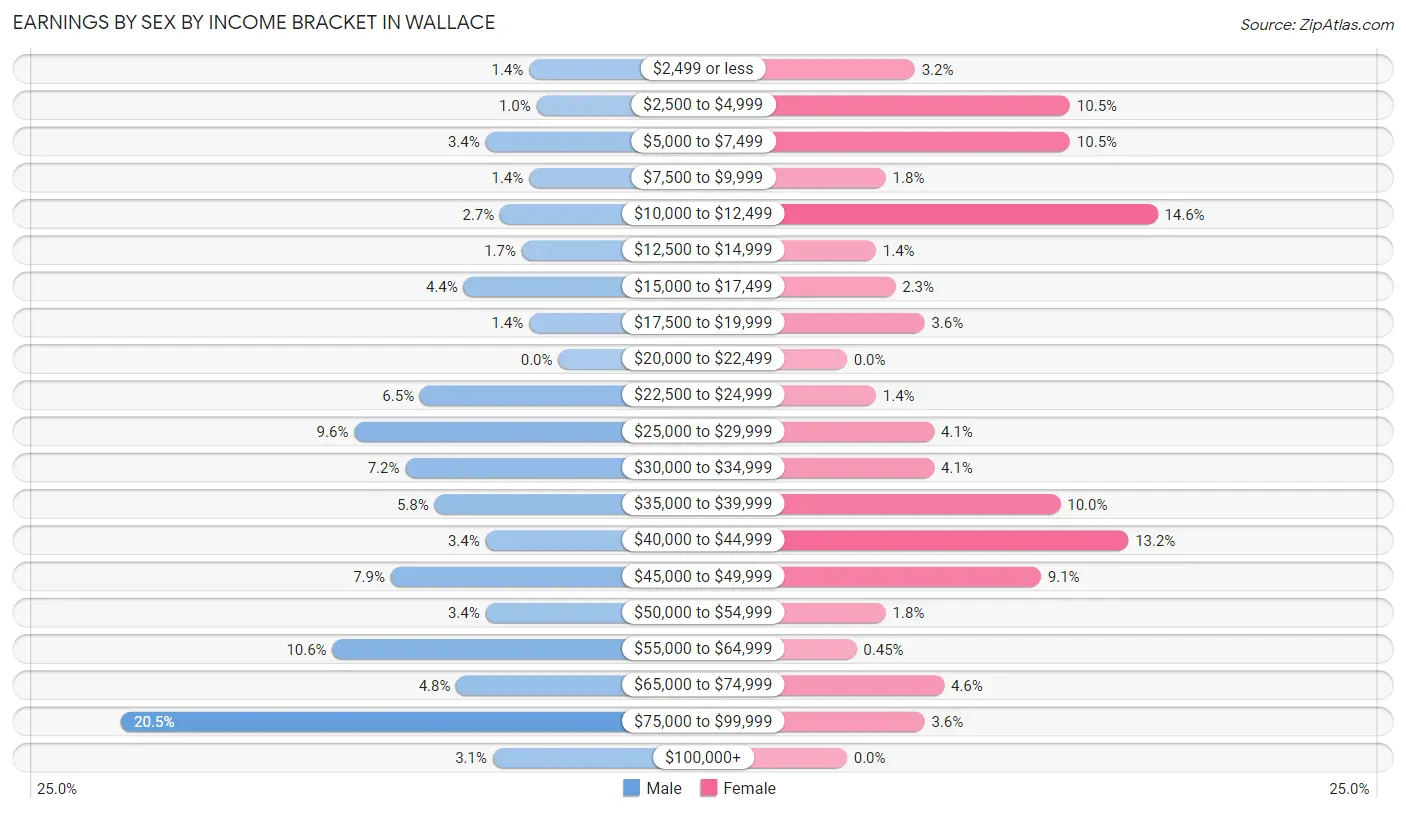
| Income | Male | Female |
| $2,499 or less | 4 (1.4%) | 7 (3.2%) |
| $2,500 to $4,999 | 3 (1.0%) | 23 (10.4%) |
| $5,000 to $7,499 | 10 (3.4%) | 23 (10.4%) |
| $7,500 to $9,999 | 4 (1.4%) | 4 (1.8%) |
| $10,000 to $12,499 | 8 (2.7%) | 32 (14.5%) |
| $12,500 to $14,999 | 5 (1.7%) | 3 (1.4%) |
| $15,000 to $17,499 | 13 (4.4%) | 5 (2.3%) |
| $17,500 to $19,999 | 4 (1.4%) | 8 (3.6%) |
| $20,000 to $22,499 | 0 (0.0%) | 0 (0.0%) |
| $22,500 to $24,999 | 19 (6.5%) | 3 (1.4%) |
| $25,000 to $29,999 | 28 (9.6%) | 9 (4.1%) |
| $30,000 to $34,999 | 21 (7.2%) | 9 (4.1%) |
| $35,000 to $39,999 | 17 (5.8%) | 22 (10.0%) |
| $40,000 to $44,999 | 10 (3.4%) | 29 (13.2%) |
| $45,000 to $49,999 | 23 (7.9%) | 20 (9.1%) |
| $50,000 to $54,999 | 10 (3.4%) | 4 (1.8%) |
| $55,000 to $64,999 | 31 (10.6%) | 1 (0.4%) |
| $65,000 to $74,999 | 14 (4.8%) | 10 (4.5%) |
| $75,000 to $99,999 | 60 (20.5%) | 8 (3.6%) |
| $100,000+ | 9 (3.1%) | 0 (0.0%) |
| Total | 293 (100.0%) | 220 (100.0%) |
Earnings by Sex by Educational Attainment in Wallace
Average earnings in Wallace are $49,135 for men and $32,778 for women, a difference of 33.3%. Men with an educational attainment of high school diploma enjoy the highest average annual earnings of $77,778, while those with bachelor's degree education earn the least with $42,500. Women with an educational attainment of graduate degree earn the most with the average annual earnings of $53,333, while those with high school diploma education have the smallest earnings of $33,333.
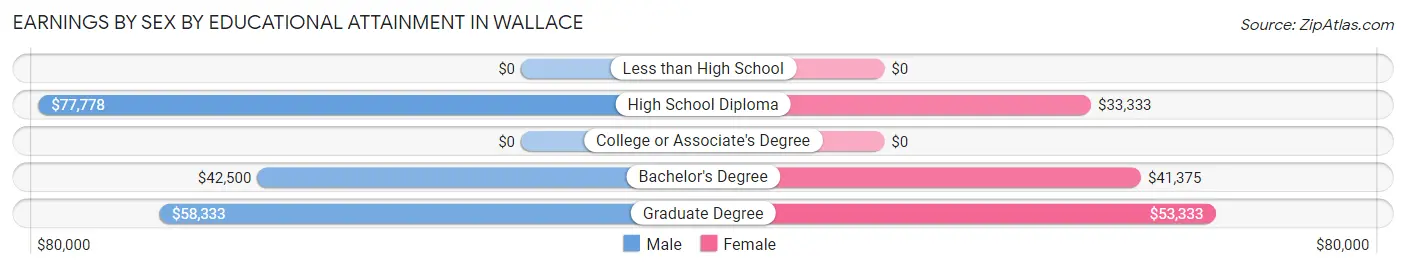
| Educational Attainment | Male Income | Female Income |
| Less than High School | - | - |
| High School Diploma | $77,778 | $33,333 |
| College or Associate's Degree | - | - |
| Bachelor's Degree | $42,500 | $41,375 |
| Graduate Degree | $58,333 | $53,333 |
| Total | $49,135 | $32,778 |
Family Income in Wallace
Family Income Brackets in Wallace
According to the Wallace family income data, there are 73 families falling into the $75,000 to $99,999 income range, which is the most common income bracket and makes up 32.4% of all families.
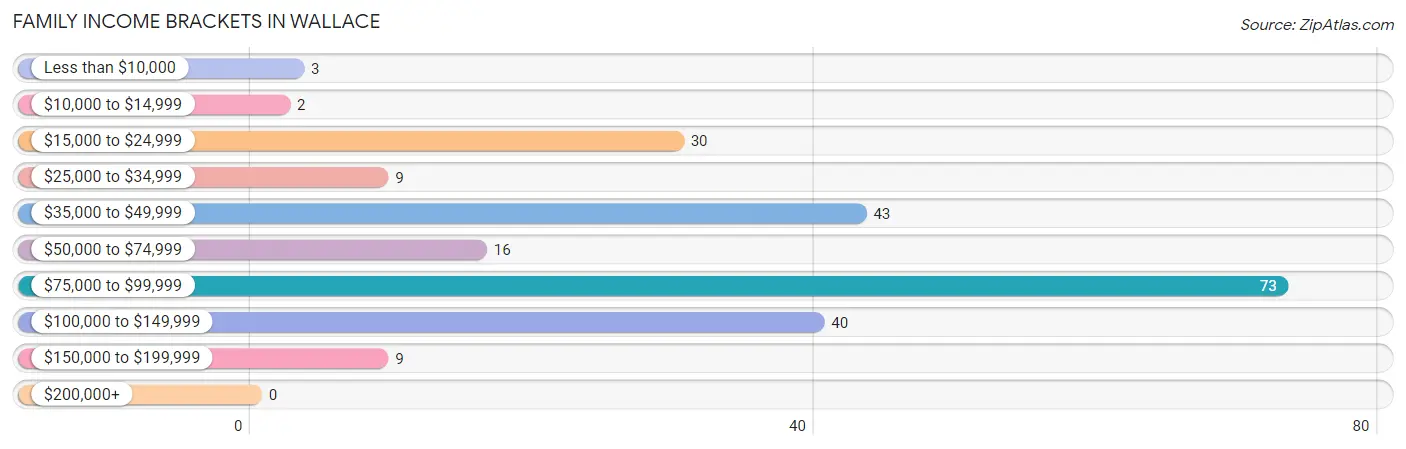
| Income Bracket | # Families | % Families |
| Less than $10,000 | 3 | 1.3% |
| $10,000 to $14,999 | 2 | 0.9% |
| $15,000 to $24,999 | 30 | 13.3% |
| $25,000 to $34,999 | 9 | 4.0% |
| $35,000 to $49,999 | 43 | 19.1% |
| $50,000 to $74,999 | 16 | 7.1% |
| $75,000 to $99,999 | 73 | 32.4% |
| $100,000 to $149,999 | 40 | 17.8% |
| $150,000 to $199,999 | 9 | 4.0% |
| $200,000+ | 0 | 0.0% |
Family Income by Famaliy Size in Wallace
2-person families (138 | 61.3%) account for the highest median family income in Wallace with $93,333 per family, while 2-person families (138 | 61.3%) have the highest median income of $46,666 per family member.
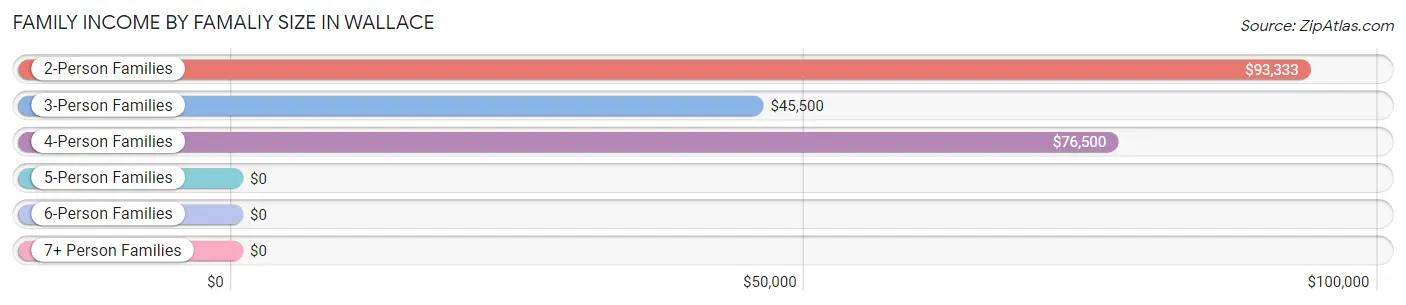
| Income Bracket | # Families | Median Income |
| 2-Person Families | 138 (61.3%) | $93,333 |
| 3-Person Families | 44 (19.6%) | $45,500 |
| 4-Person Families | 14 (6.2%) | $76,500 |
| 5-Person Families | 26 (11.6%) | $0 |
| 6-Person Families | 3 (1.3%) | $0 |
| 7+ Person Families | 0 (0.0%) | $0 |
| Total | 225 (100.0%) | $76,583 |
Family Income by Number of Earners in Wallace
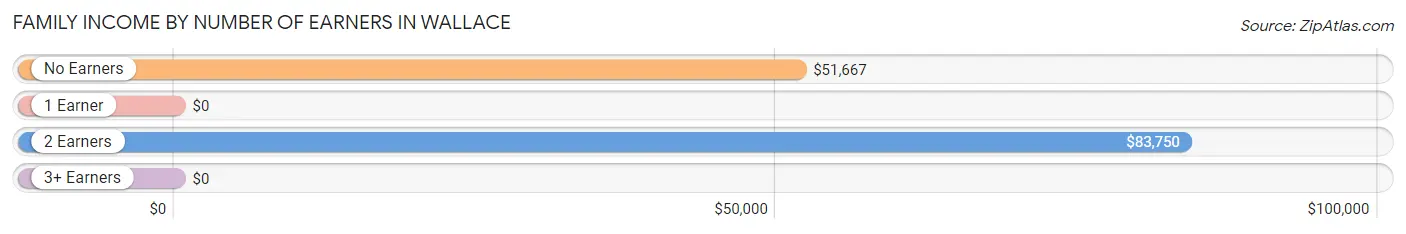
| Number of Earners | # Families | Median Income |
| No Earners | 16 (7.1%) | $51,667 |
| 1 Earner | 107 (47.6%) | $0 |
| 2 Earners | 102 (45.3%) | $83,750 |
| 3+ Earners | 0 (0.0%) | $0 |
| Total | 225 (100.0%) | $76,583 |
Household Income in Wallace
Household Income Brackets in Wallace
With 92 households falling in the category, the $35,000 to $49,999 income range is the most frequent in Wallace, accounting for 21.4% of all households. In contrast, only 4 households (0.9%) fall into the $200,000+ income bracket, making it the least populous group.
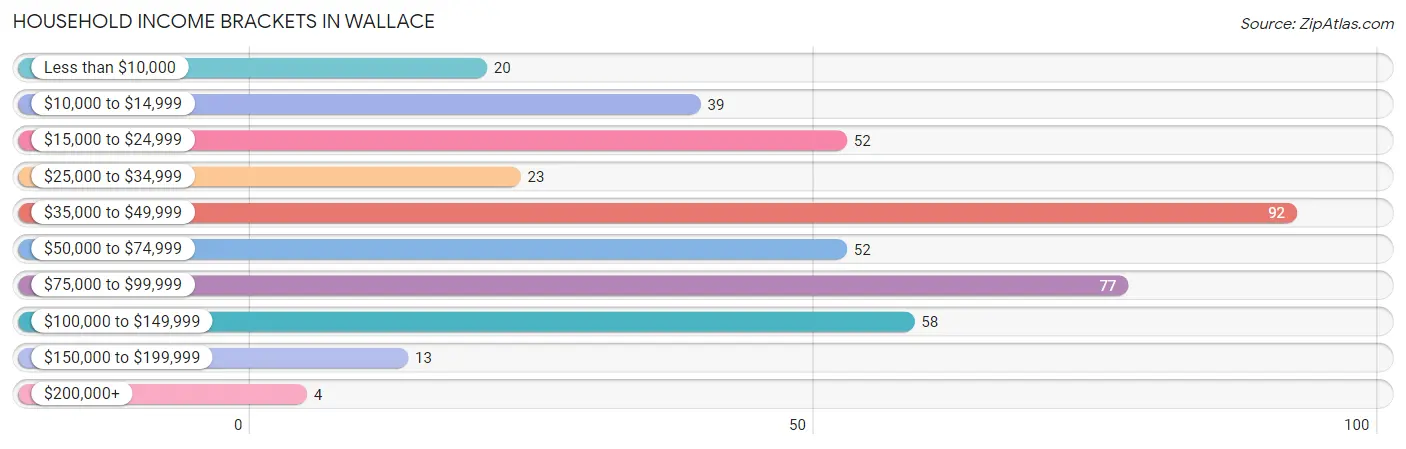
| Income Bracket | # Households | % Households |
| Less than $10,000 | 20 | 4.7% |
| $10,000 to $14,999 | 39 | 9.1% |
| $15,000 to $24,999 | 52 | 12.1% |
| $25,000 to $34,999 | 23 | 5.3% |
| $35,000 to $49,999 | 92 | 21.4% |
| $50,000 to $74,999 | 52 | 12.1% |
| $75,000 to $99,999 | 77 | 17.9% |
| $100,000 to $149,999 | 58 | 13.5% |
| $150,000 to $199,999 | 13 | 3.0% |
| $200,000+ | 4 | 0.9% |
Household Income by Householder Age in Wallace
The median household income in Wallace is $49,052, with the highest median household income of $54,028 found in the 25 to 44 years age bracket for the primary householder. A total of 123 households (28.6%) fall into this category. Meanwhile, the 65+ years age bracket for the primary householder has the lowest median household income of $39,602, with 163 households (37.9%) in this group.
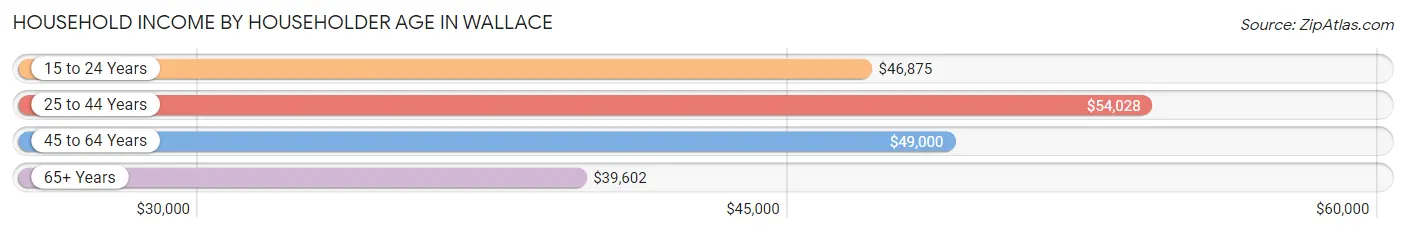
| Income Bracket | # Households | Median Income |
| 15 to 24 Years | 16 (3.7%) | $46,875 |
| 25 to 44 Years | 123 (28.6%) | $54,028 |
| 45 to 64 Years | 128 (29.8%) | $49,000 |
| 65+ Years | 163 (37.9%) | $39,602 |
| Total | 430 (100.0%) | $49,052 |
Poverty in Wallace
Income Below Poverty by Sex and Age in Wallace
With 21.7% poverty level for males and 25.0% for females among the residents of Wallace, 12 to 14 year old males and 35 to 44 year old females are the most vulnerable to poverty, with 25 males (75.8%) and 64 females (60.4%) in their respective age groups living below the poverty level.
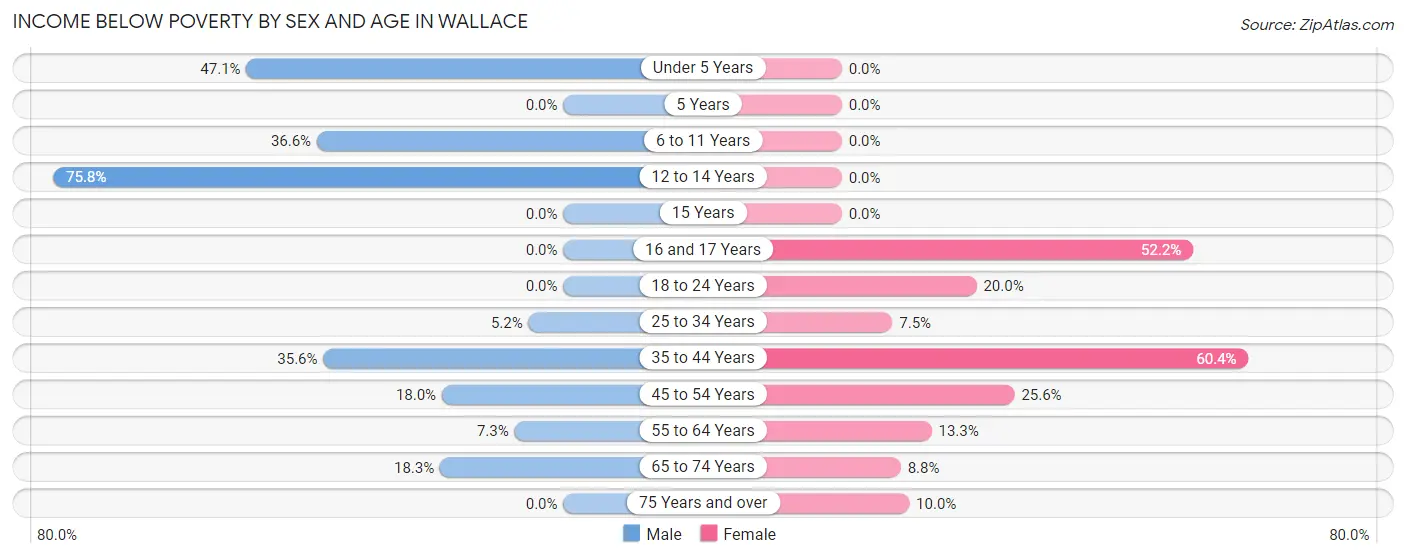
| Age Bracket | Male | Female |
| Under 5 Years | 16 (47.1%) | 0 (0.0%) |
| 5 Years | 0 (0.0%) | 0 (0.0%) |
| 6 to 11 Years | 15 (36.6%) | 0 (0.0%) |
| 12 to 14 Years | 25 (75.8%) | 0 (0.0%) |
| 15 Years | 0 (0.0%) | 0 (0.0%) |
| 16 and 17 Years | 0 (0.0%) | 12 (52.2%) |
| 18 to 24 Years | 0 (0.0%) | 2 (20.0%) |
| 25 to 34 Years | 3 (5.2%) | 3 (7.5%) |
| 35 to 44 Years | 36 (35.6%) | 64 (60.4%) |
| 45 to 54 Years | 11 (18.0%) | 10 (25.6%) |
| 55 to 64 Years | 10 (7.2%) | 10 (13.3%) |
| 65 to 74 Years | 13 (18.3%) | 7 (8.7%) |
| 75 Years and over | 0 (0.0%) | 3 (10.0%) |
| Total | 129 (21.7%) | 111 (25.0%) |
Income Above Poverty by Sex and Age in Wallace
According to the poverty statistics in Wallace, males aged 5 years and females aged under 5 years are the age groups that are most secure financially, with 100.0% of males and 100.0% of females in these age groups living above the poverty line.
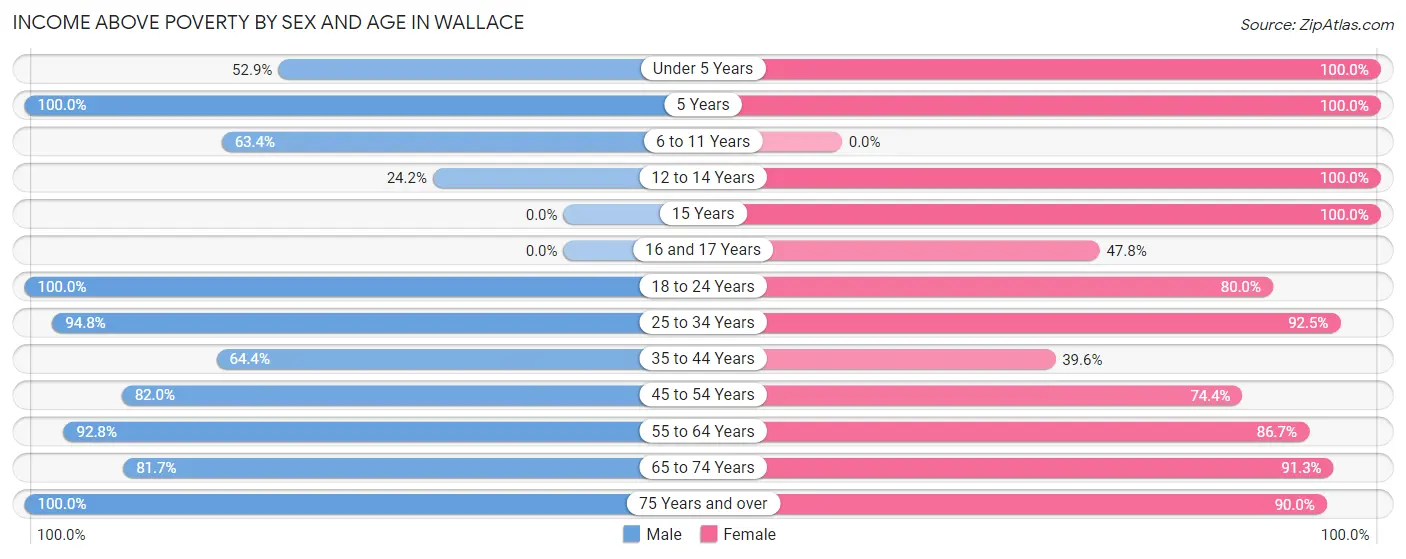
| Age Bracket | Male | Female |
| Under 5 Years | 18 (52.9%) | 27 (100.0%) |
| 5 Years | 11 (100.0%) | 6 (100.0%) |
| 6 to 11 Years | 26 (63.4%) | 0 (0.0%) |
| 12 to 14 Years | 8 (24.2%) | 3 (100.0%) |
| 15 Years | 0 (0.0%) | 5 (100.0%) |
| 16 and 17 Years | 0 (0.0%) | 11 (47.8%) |
| 18 to 24 Years | 30 (100.0%) | 8 (80.0%) |
| 25 to 34 Years | 55 (94.8%) | 37 (92.5%) |
| 35 to 44 Years | 65 (64.4%) | 42 (39.6%) |
| 45 to 54 Years | 50 (82.0%) | 29 (74.4%) |
| 55 to 64 Years | 128 (92.7%) | 65 (86.7%) |
| 65 to 74 Years | 58 (81.7%) | 73 (91.2%) |
| 75 Years and over | 16 (100.0%) | 27 (90.0%) |
| Total | 465 (78.3%) | 333 (75.0%) |
Income Below Poverty Among Married-Couple Families in Wallace
The poverty statistics for married-couple families in Wallace show that 1.9% or 3 of the total 157 families live below the poverty line. Families with no children have the highest poverty rate of 2.4%, comprising of 3 families. On the other hand, families with 1 or 2 children have the lowest poverty rate of 0.0%, which includes 0 families.
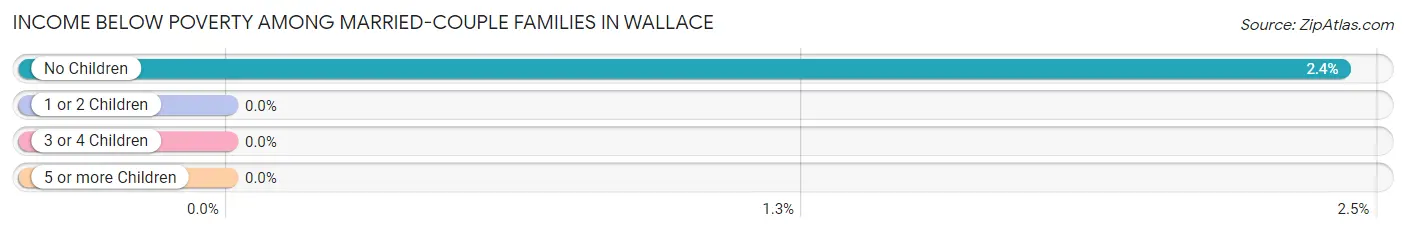
| Children | Above Poverty | Below Poverty |
| No Children | 121 (97.6%) | 3 (2.4%) |
| 1 or 2 Children | 22 (100.0%) | 0 (0.0%) |
| 3 or 4 Children | 11 (100.0%) | 0 (0.0%) |
| 5 or more Children | 0 (0.0%) | 0 (0.0%) |
| Total | 154 (98.1%) | 3 (1.9%) |
Income Below Poverty Among Single-Parent Households in Wallace
According to the poverty data in Wallace, 8.3% or 2 single-father households and 63.6% or 28 single-mother households are living below the poverty line. Among single-father households, those with no children have the highest poverty rate, with 2 households (50.0%) experiencing poverty. Likewise, among single-mother households, those with 1 or 2 children have the highest poverty rate, with 11 households (100.0%) falling below the poverty line.
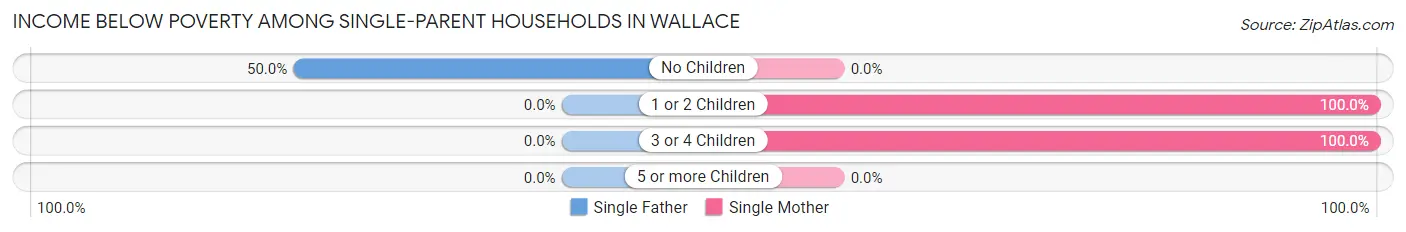
| Children | Single Father | Single Mother |
| No Children | 2 (50.0%) | 0 (0.0%) |
| 1 or 2 Children | 0 (0.0%) | 11 (100.0%) |
| 3 or 4 Children | 0 (0.0%) | 17 (100.0%) |
| 5 or more Children | 0 (0.0%) | 0 (0.0%) |
| Total | 2 (8.3%) | 28 (63.6%) |
Income Below Poverty Among Married-Couple vs Single-Parent Households in Wallace
The poverty data for Wallace shows that 3 of the married-couple family households (1.9%) and 30 of the single-parent households (44.1%) are living below the poverty level. Within the married-couple family households, those with no children have the highest poverty rate, with 3 households (2.4%) falling below the poverty line. Among the single-parent households, those with 3 or 4 children have the highest poverty rate, with 17 household (100.0%) living below poverty.
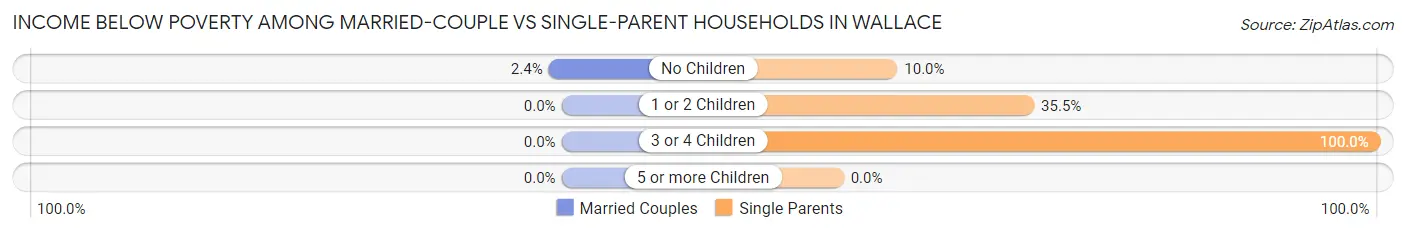
| Children | Married-Couple Families | Single-Parent Households |
| No Children | 3 (2.4%) | 2 (10.0%) |
| 1 or 2 Children | 0 (0.0%) | 11 (35.5%) |
| 3 or 4 Children | 0 (0.0%) | 17 (100.0%) |
| 5 or more Children | 0 (0.0%) | 0 (0.0%) |
| Total | 3 (1.9%) | 30 (44.1%) |
Race in Wallace
The most populous races in Wallace are White / Caucasian (1,008 | 93.1%), Hispanic or Latino (56 | 5.2%), and Two or more Races (55 | 5.1%).
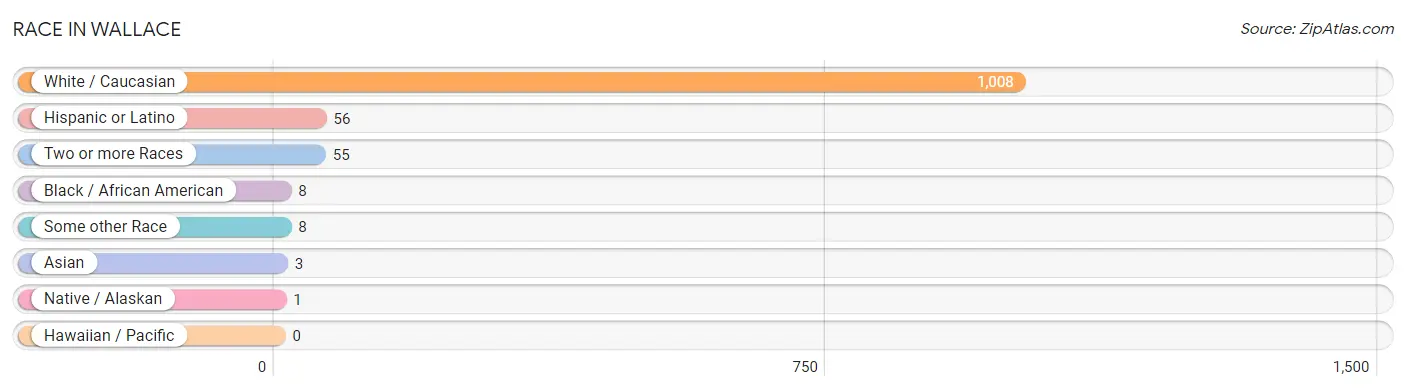
| Race | # Population | % Population |
| Asian | 3 | 0.3% |
| Black / African American | 8 | 0.7% |
| Hawaiian / Pacific | 0 | 0.0% |
| Hispanic or Latino | 56 | 5.2% |
| Native / Alaskan | 1 | 0.1% |
| White / Caucasian | 1,008 | 93.1% |
| Two or more Races | 55 | 5.1% |
| Some other Race | 8 | 0.7% |
| Total | 1,083 | 100.0% |
Ancestry in Wallace
The most populous ancestries reported in Wallace are German (390 | 36.0%), Irish (193 | 17.8%), Scottish (153 | 14.1%), English (92 | 8.5%), and Italian (48 | 4.4%), together accounting for 80.9% of all Wallace residents.
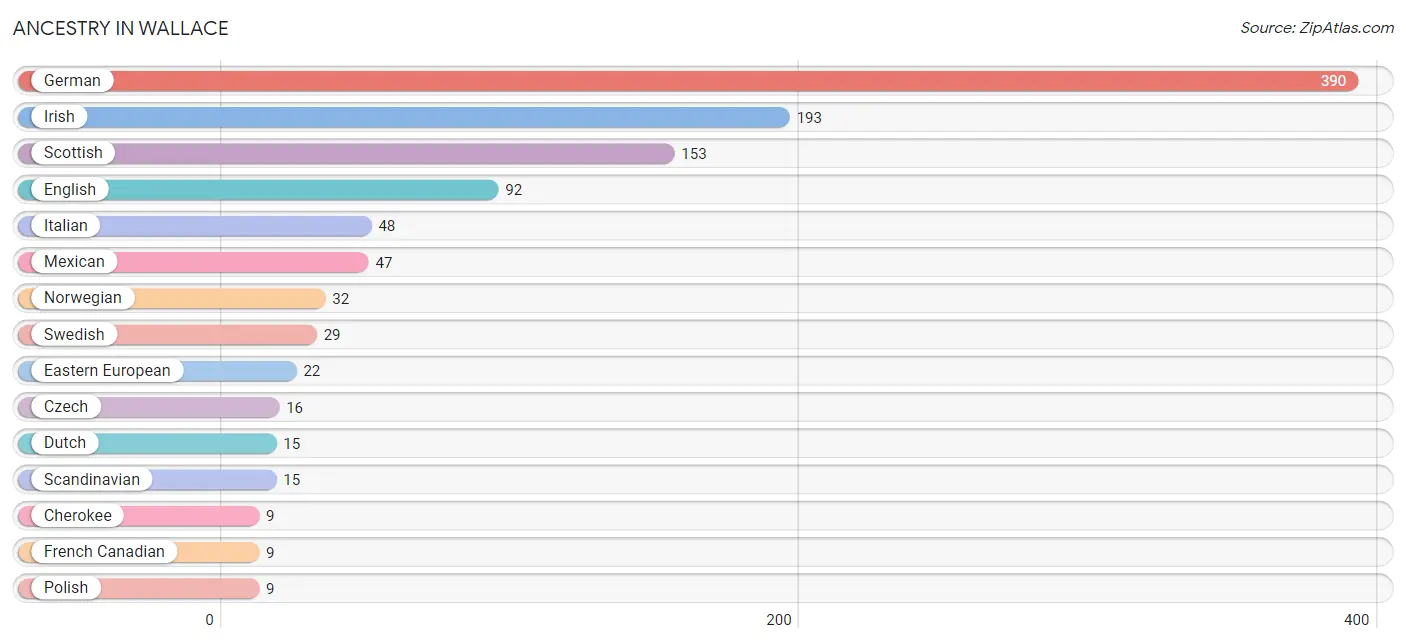
| Ancestry | # Population | % Population |
| American | 6 | 0.5% |
| Arab | 4 | 0.4% |
| Basque | 2 | 0.2% |
| British | 2 | 0.2% |
| Canadian | 5 | 0.5% |
| Central American | 3 | 0.3% |
| Cherokee | 9 | 0.8% |
| Chippewa | 1 | 0.1% |
| Czech | 16 | 1.5% |
| Danish | 3 | 0.3% |
| Dutch | 15 | 1.4% |
| Eastern European | 22 | 2.0% |
| English | 92 | 8.5% |
| European | 2 | 0.2% |
| Finnish | 7 | 0.6% |
| French Canadian | 9 | 0.8% |
| German | 390 | 36.0% |
| Greek | 4 | 0.4% |
| Guatemalan | 3 | 0.3% |
| Irish | 193 | 17.8% |
| Italian | 48 | 4.4% |
| Korean | 3 | 0.3% |
| Lebanese | 4 | 0.4% |
| Mexican | 47 | 4.3% |
| Norwegian | 32 | 2.9% |
| Polish | 9 | 0.8% |
| Portuguese | 2 | 0.2% |
| Scandinavian | 15 | 1.4% |
| Scotch-Irish | 4 | 0.4% |
| Scottish | 153 | 14.1% |
| Swedish | 29 | 2.7% |
| Welsh | 4 | 0.4% | View All 32 Rows |
Immigrants in Wallace
The most numerous immigrant groups reported in Wallace came from Canada (11 | 1.0%), Latin America (10 | 0.9%), Central America (6 | 0.5%), Denmark (6 | 0.5%), and Europe (6 | 0.5%), together accounting for 3.6% of all Wallace residents.
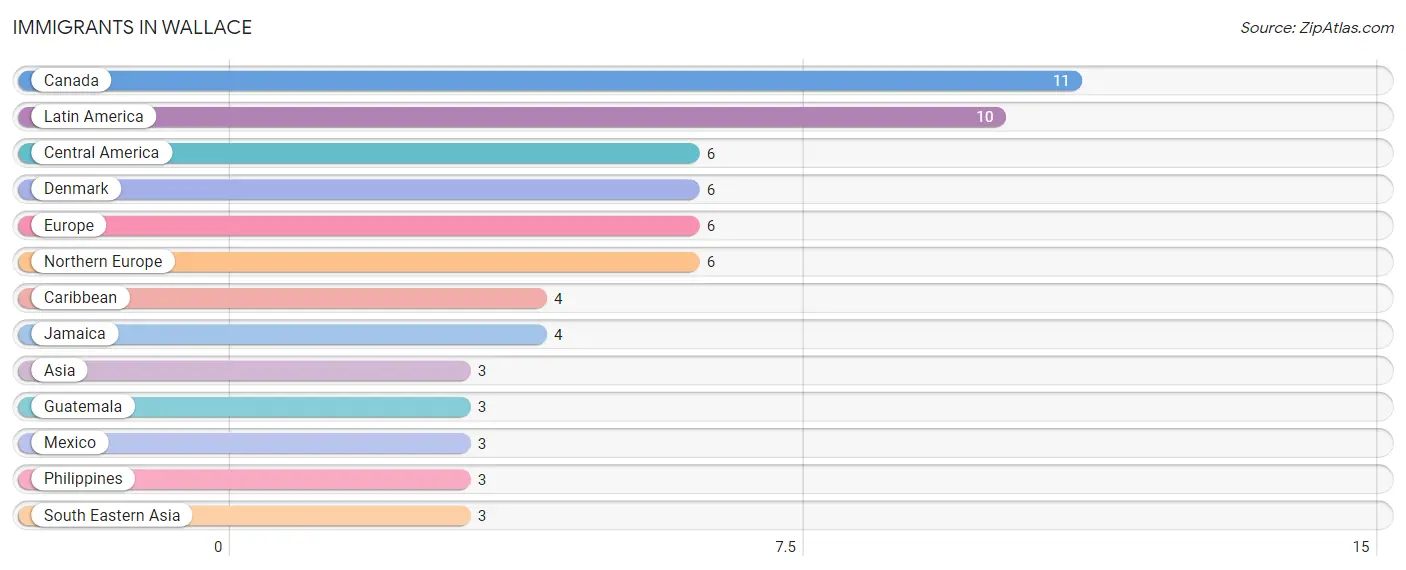
| Immigration Origin | # Population | % Population |
| Asia | 3 | 0.3% |
| Canada | 11 | 1.0% |
| Caribbean | 4 | 0.4% |
| Central America | 6 | 0.5% |
| Denmark | 6 | 0.5% |
| Europe | 6 | 0.5% |
| Guatemala | 3 | 0.3% |
| Jamaica | 4 | 0.4% |
| Latin America | 10 | 0.9% |
| Mexico | 3 | 0.3% |
| Northern Europe | 6 | 0.5% |
| Philippines | 3 | 0.3% |
| South Eastern Asia | 3 | 0.3% | View All 13 Rows |
Sex and Age in Wallace
Sex and Age in Wallace
The most populous age groups in Wallace are 60 to 64 Years (97 | 15.7%) for men and 35 to 39 Years (69 | 14.9%) for women.
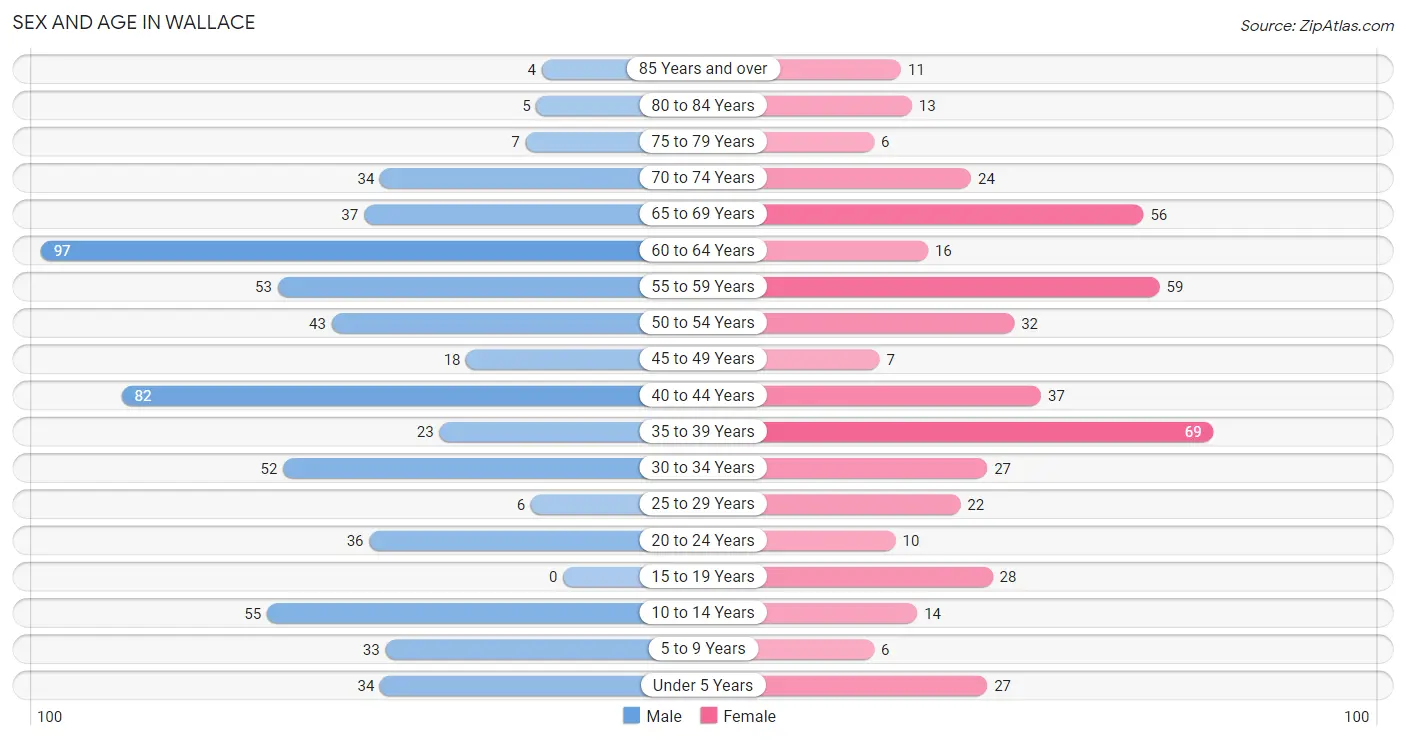
| Age Bracket | Male | Female |
| Under 5 Years | 34 (5.5%) | 27 (5.8%) |
| 5 to 9 Years | 33 (5.3%) | 6 (1.3%) |
| 10 to 14 Years | 55 (8.9%) | 14 (3.0%) |
| 15 to 19 Years | 0 (0.0%) | 28 (6.0%) |
| 20 to 24 Years | 36 (5.8%) | 10 (2.2%) |
| 25 to 29 Years | 6 (1.0%) | 22 (4.7%) |
| 30 to 34 Years | 52 (8.4%) | 27 (5.8%) |
| 35 to 39 Years | 23 (3.7%) | 69 (14.9%) |
| 40 to 44 Years | 82 (13.3%) | 37 (8.0%) |
| 45 to 49 Years | 18 (2.9%) | 7 (1.5%) |
| 50 to 54 Years | 43 (7.0%) | 32 (6.9%) |
| 55 to 59 Years | 53 (8.6%) | 59 (12.7%) |
| 60 to 64 Years | 97 (15.7%) | 16 (3.5%) |
| 65 to 69 Years | 37 (6.0%) | 56 (12.1%) |
| 70 to 74 Years | 34 (5.5%) | 24 (5.2%) |
| 75 to 79 Years | 7 (1.1%) | 6 (1.3%) |
| 80 to 84 Years | 5 (0.8%) | 13 (2.8%) |
| 85 Years and over | 4 (0.6%) | 11 (2.4%) |
| Total | 619 (100.0%) | 464 (100.0%) |
Families and Households in Wallace
Median Family Size in Wallace
The median family size in Wallace is 3.23 persons per family, with single female/mother families (44 | 19.6%) accounting for the largest median family size of 5.34 persons per family. On the other hand, married-couple families (157 | 69.8%) represent the smallest median family size with 2.64 persons per family.
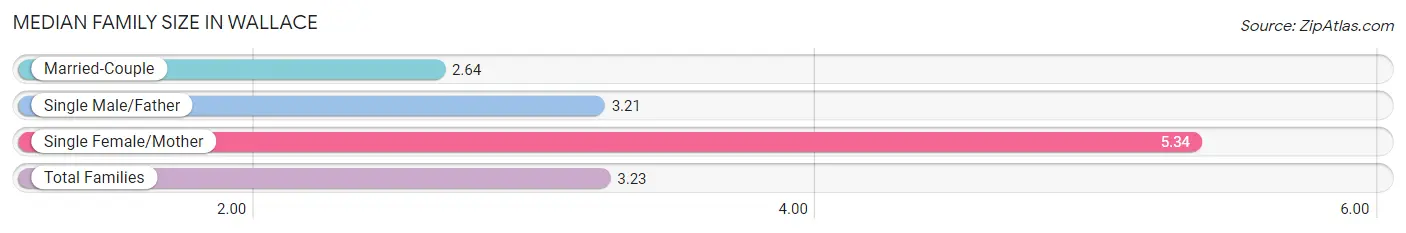
| Family Type | # Families | Family Size |
| Married-Couple | 157 (69.8%) | 2.64 |
| Single Male/Father | 24 (10.7%) | 3.21 |
| Single Female/Mother | 44 (19.6%) | 5.34 |
| Total Families | 225 (100.0%) | 3.23 |
Median Household Size in Wallace
The median household size in Wallace is 2.45 persons per household, with single female/mother households (44 | 10.2%) accounting for the largest median household size of 5.8 persons per household. non-family households (205 | 47.7%) represent the smallest median household size with 1.44 persons per household.
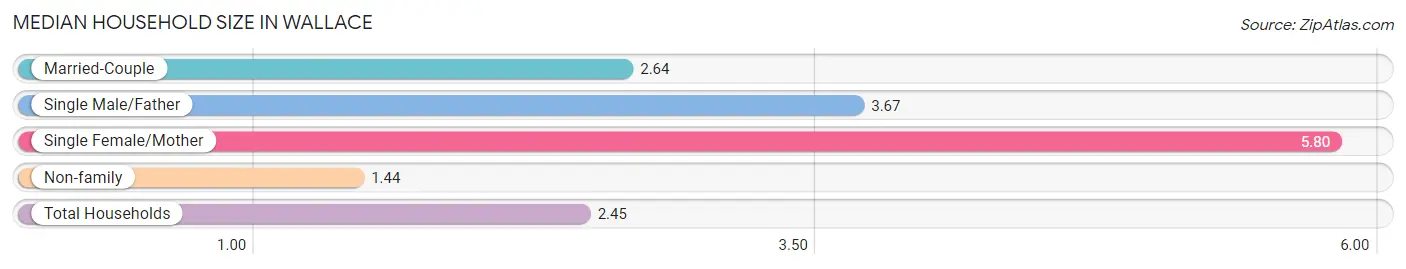
| Household Type | # Households | Household Size |
| Married-Couple | 157 (36.5%) | 2.64 |
| Single Male/Father | 24 (5.6%) | 3.67 |
| Single Female/Mother | 44 (10.2%) | 5.80 |
| Non-family | 205 (47.7%) | 1.44 |
| Total Households | 430 (100.0%) | 2.45 |
Household Size by Marriage Status in Wallace
Out of a total of 430 households in Wallace, 225 (52.3%) are family households, while 205 (47.7%) are nonfamily households. The most numerous type of family households are 2-person households, comprising 131, and the most common type of nonfamily households are 1-person households, comprising 168.
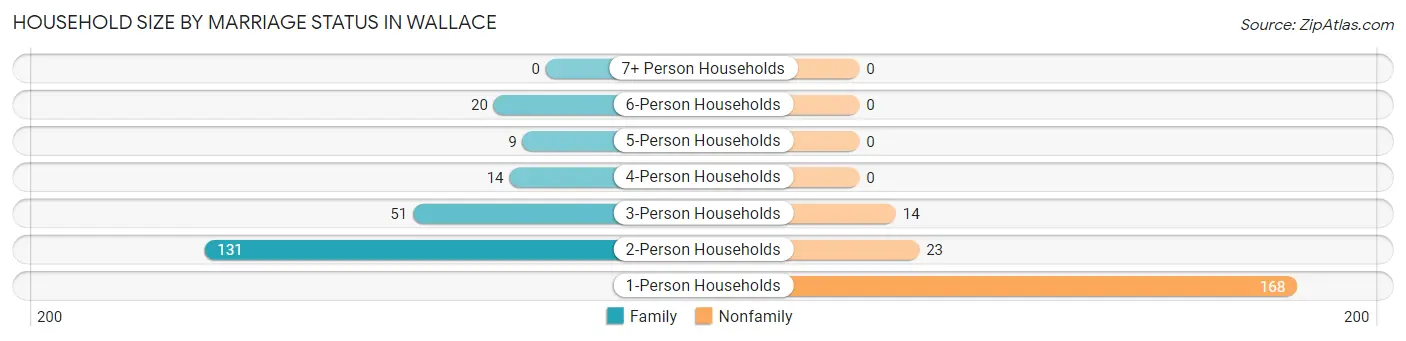
| Household Size | Family Households | Nonfamily Households |
| 1-Person Households | - | 168 (39.1%) |
| 2-Person Households | 131 (30.5%) | 23 (5.3%) |
| 3-Person Households | 51 (11.9%) | 14 (3.3%) |
| 4-Person Households | 14 (3.3%) | 0 (0.0%) |
| 5-Person Households | 9 (2.1%) | 0 (0.0%) |
| 6-Person Households | 20 (4.6%) | 0 (0.0%) |
| 7+ Person Households | 0 (0.0%) | 0 (0.0%) |
| Total | 225 (52.3%) | 205 (47.7%) |
Female Fertility in Wallace
Fertility by Age in Wallace
| Age Bracket | Women with Births | Births / 1,000 Women |
| 15 to 19 years | 0 (0.0%) | 0.0 |
| 20 to 34 years | 0 (0.0%) | 0.0 |
| 35 to 50 years | 0 (0.0%) | 0.0 |
| Total | 0 (0.0%) | 0.0 |
Fertility by Age by Marriage Status in Wallace
| Age Bracket | Married | Unmarried |
| 15 to 19 years | 0 (0.0%) | 0 (0.0%) |
| 20 to 34 years | 0 (0.0%) | 0 (0.0%) |
| 35 to 50 years | 0 (0.0%) | 0 (0.0%) |
| Total | 0 (0.0%) | 0 (0.0%) |
Fertility by Education in Wallace
| Educational Attainment | Women with Births | Births / 1,000 Women |
| Less than High School | 0 (0.0%) | 0.0 |
| High School Diploma | 0 (0.0%) | 0.0 |
| College or Associate's Degree | 0 (0.0%) | 0.0 |
| Bachelor's Degree | 0 (0.0%) | 0.0 |
| Graduate Degree | 0 (0.0%) | 0.0 |
| Total | 0 (0.0%) | 0.0 |
Fertility by Education by Marriage Status in Wallace
| Educational Attainment | Married | Unmarried |
| Less than High School | 0 (0.0%) | 0 (0.0%) |
| High School Diploma | 0 (0.0%) | 0 (0.0%) |
| College or Associate's Degree | 0 (0.0%) | 0 (0.0%) |
| Bachelor's Degree | 0 (0.0%) | 0 (0.0%) |
| Graduate Degree | 0 (0.0%) | 0 (0.0%) |
| Total | 0 (0.0%) | 0 (0.0%) |
Employment Characteristics in Wallace
Employment by Class of Employer in Wallace
Among the 430 employed individuals in Wallace, private company employees (283 | 65.8%), local government employees (48 | 11.2%), and self-employed (not incorporated) (33 | 7.7%) make up the most common classes of employment.
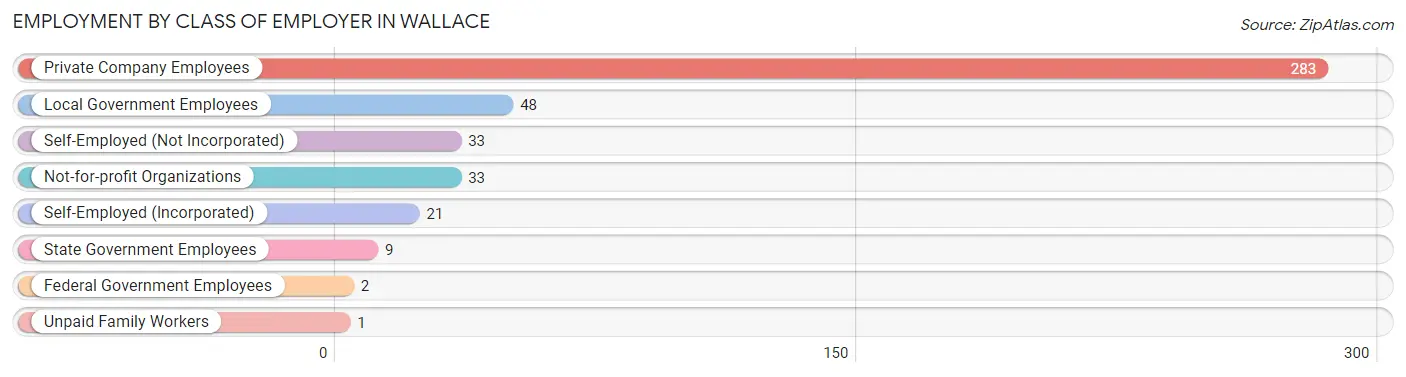
| Employer Class | # Employees | % Employees |
| Private Company Employees | 283 | 65.8% |
| Self-Employed (Incorporated) | 21 | 4.9% |
| Self-Employed (Not Incorporated) | 33 | 7.7% |
| Not-for-profit Organizations | 33 | 7.7% |
| Local Government Employees | 48 | 11.2% |
| State Government Employees | 9 | 2.1% |
| Federal Government Employees | 2 | 0.5% |
| Unpaid Family Workers | 1 | 0.2% |
| Total | 430 | 100.0% |
Employment Status by Age in Wallace
According to the labor force statistics for Wallace, out of the total population over 16 years of age (909), 50.7% or 461 individuals are in the labor force, with 3.5% or 16 of them unemployed. The age group with the highest labor force participation rate is 25 to 29 years, with 100.0% or 28 individuals in the labor force. Within the labor force, the 65 to 74 years age range has the highest percentage of unemployed individuals, with 9.5% or 2 of them being unemployed.
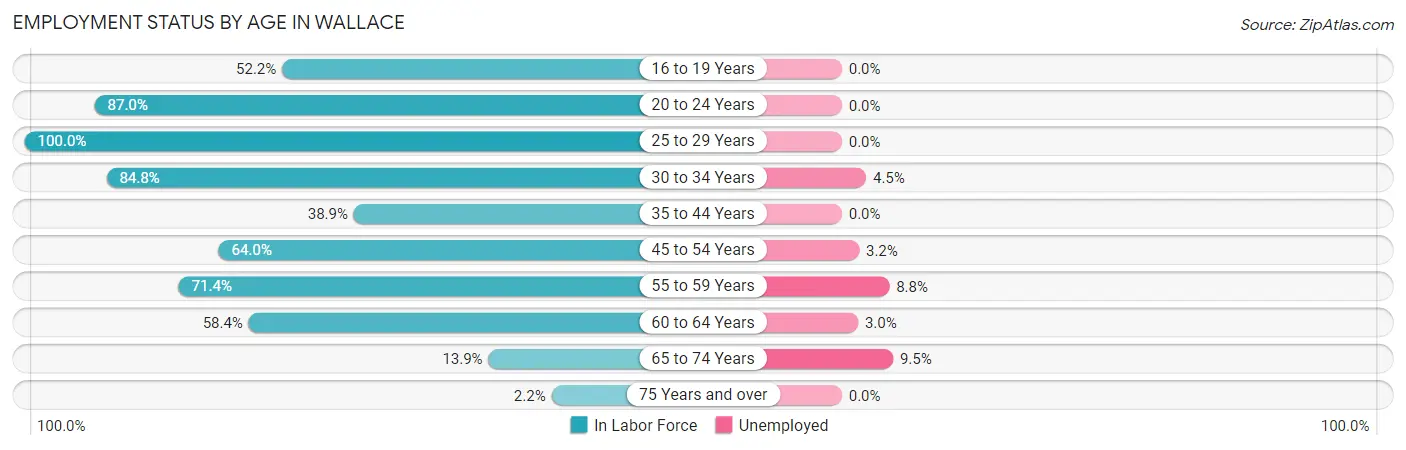
| Age Bracket | In Labor Force | Unemployed |
| 16 to 19 Years | 12 (52.2%) | 0 (0.0%) |
| 20 to 24 Years | 40 (87.0%) | 0 (0.0%) |
| 25 to 29 Years | 28 (100.0%) | 0 (0.0%) |
| 30 to 34 Years | 67 (84.8%) | 3 (4.5%) |
| 35 to 44 Years | 82 (38.9%) | 0 (0.0%) |
| 45 to 54 Years | 64 (64.0%) | 2 (3.2%) |
| 55 to 59 Years | 80 (71.4%) | 7 (8.8%) |
| 60 to 64 Years | 66 (58.4%) | 2 (3.0%) |
| 65 to 74 Years | 21 (13.9%) | 2 (9.5%) |
| 75 Years and over | 1 (2.2%) | 0 (0.0%) |
| Total | 461 (50.7%) | 16 (3.5%) |
Employment Status by Educational Attainment in Wallace
According to labor force statistics for Wallace, 60.2% of individuals (387) out of the total population between 25 and 64 years of age (643) are in the labor force, with 3.6% or 14 of them being unemployed. The group with the highest labor force participation rate are those with the educational attainment of bachelor's degree or higher, with 92.1% or 139 individuals in the labor force. Within the labor force, individuals with college / associate degree education have the highest percentage of unemployment, with 5.9% or 7 of them being unemployed.
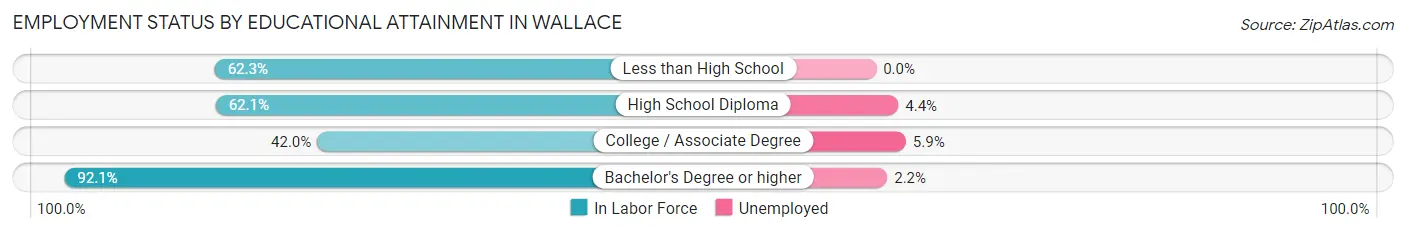
| Educational Attainment | In Labor Force | Unemployed |
| Less than High School | 38 (62.3%) | 0 (0.0%) |
| High School Diploma | 90 (62.1%) | 6 (4.4%) |
| College / Associate Degree | 120 (42.0%) | 17 (5.9%) |
| Bachelor's Degree or higher | 139 (92.1%) | 3 (2.2%) |
| Total | 387 (60.2%) | 23 (3.6%) |
Employment Occupations by Sex in Wallace
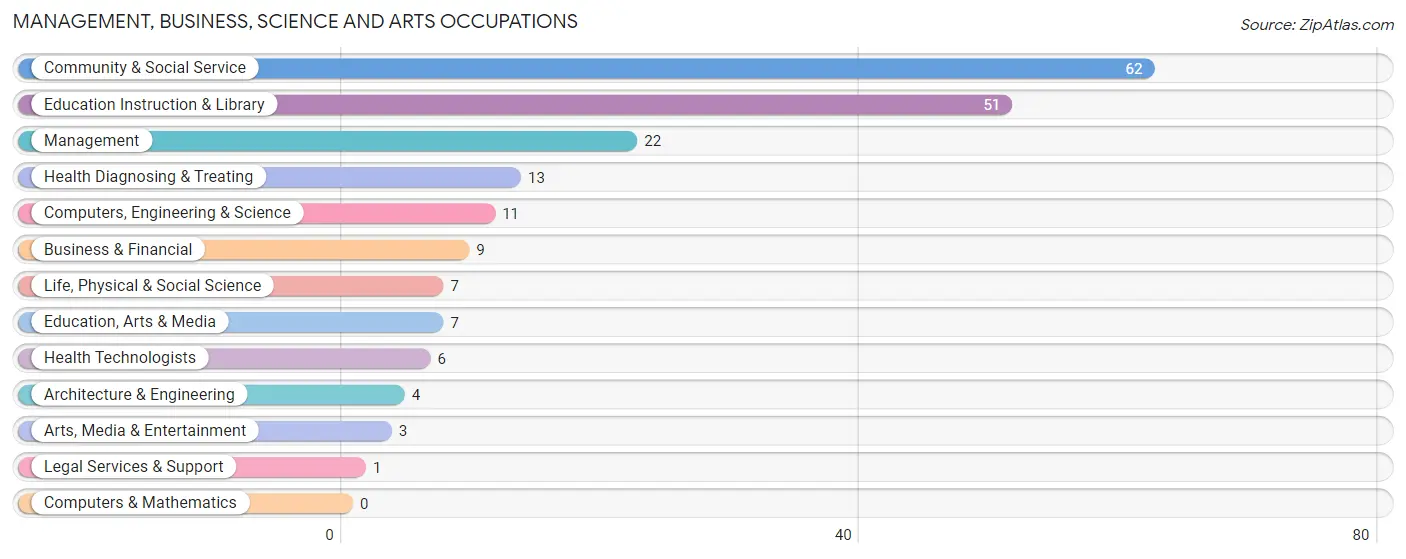
Management, Business, Science and Arts Occupations
The most common Management, Business, Science and Arts occupations in Wallace are Community & Social Service (62 | 14.0%), Education Instruction & Library (51 | 11.5%), Management (22 | 5.0%), Health Diagnosing & Treating (13 | 2.9%), and Computers, Engineering & Science (11 | 2.5%).
Management, Business, Science and Arts Occupations by Sex
Within the Management, Business, Science and Arts occupations in Wallace, the most male-oriented occupations are Business & Financial (100.0%), Architecture & Engineering (100.0%), and Legal Services & Support (100.0%), while the most female-oriented occupations are Health Technologists (100.0%), Management (59.1%), and Education Instruction & Library (52.9%).
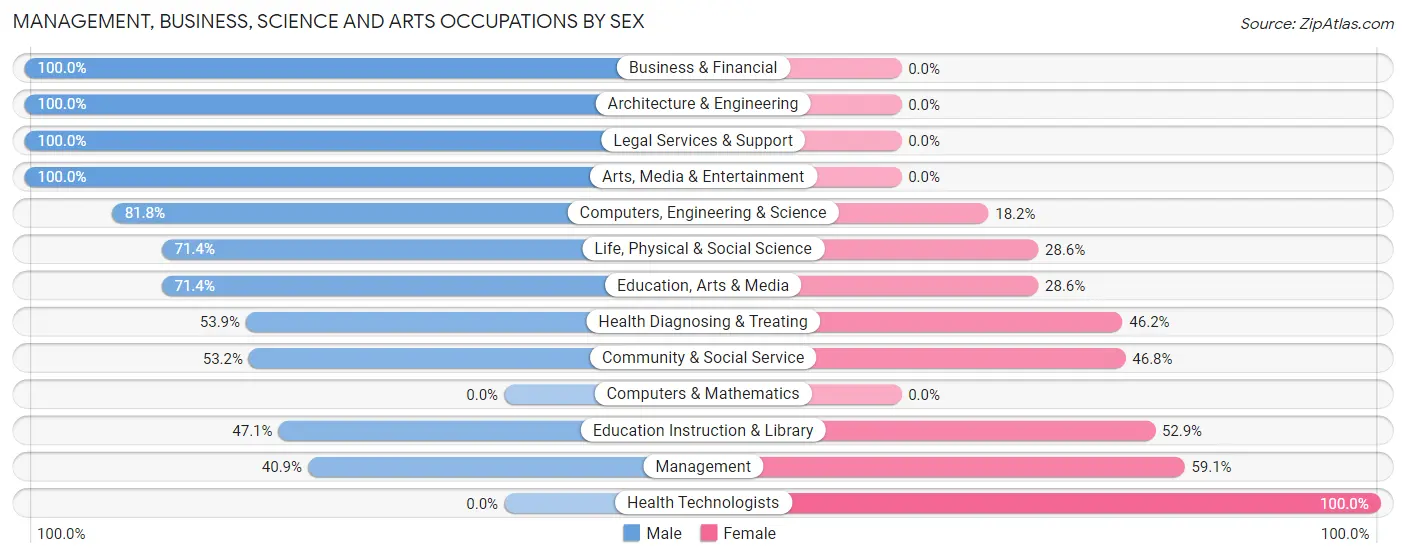
| Occupation | Male | Female |
| Management | 9 (40.9%) | 13 (59.1%) |
| Business & Financial | 9 (100.0%) | 0 (0.0%) |
| Computers, Engineering & Science | 9 (81.8%) | 2 (18.2%) |
| Computers & Mathematics | 0 (0.0%) | 0 (0.0%) |
| Architecture & Engineering | 4 (100.0%) | 0 (0.0%) |
| Life, Physical & Social Science | 5 (71.4%) | 2 (28.6%) |
| Community & Social Service | 33 (53.2%) | 29 (46.8%) |
| Education, Arts & Media | 5 (71.4%) | 2 (28.6%) |
| Legal Services & Support | 1 (100.0%) | 0 (0.0%) |
| Education Instruction & Library | 24 (47.1%) | 27 (52.9%) |
| Arts, Media & Entertainment | 3 (100.0%) | 0 (0.0%) |
| Health Diagnosing & Treating | 7 (53.8%) | 6 (46.2%) |
| Health Technologists | 0 (0.0%) | 6 (100.0%) |
| Total (Category) | 67 (57.3%) | 50 (42.7%) |
| Total (Overall) | 260 (58.7%) | 183 (41.3%) |
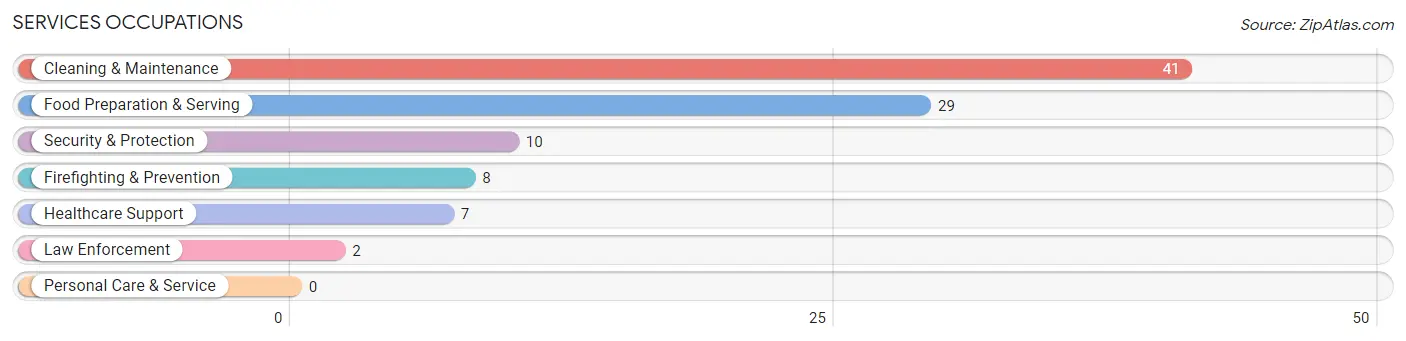
Services Occupations
The most common Services occupations in Wallace are Cleaning & Maintenance (41 | 9.3%), Food Preparation & Serving (29 | 6.6%), Security & Protection (10 | 2.3%), Firefighting & Prevention (8 | 1.8%), and Healthcare Support (7 | 1.6%).
Services Occupations by Sex
Within the Services occupations in Wallace, the most male-oriented occupations are Law Enforcement (100.0%), Security & Protection (70.0%), and Firefighting & Prevention (62.5%), while the most female-oriented occupations are Healthcare Support (100.0%), Food Preparation & Serving (62.1%), and Cleaning & Maintenance (41.5%).
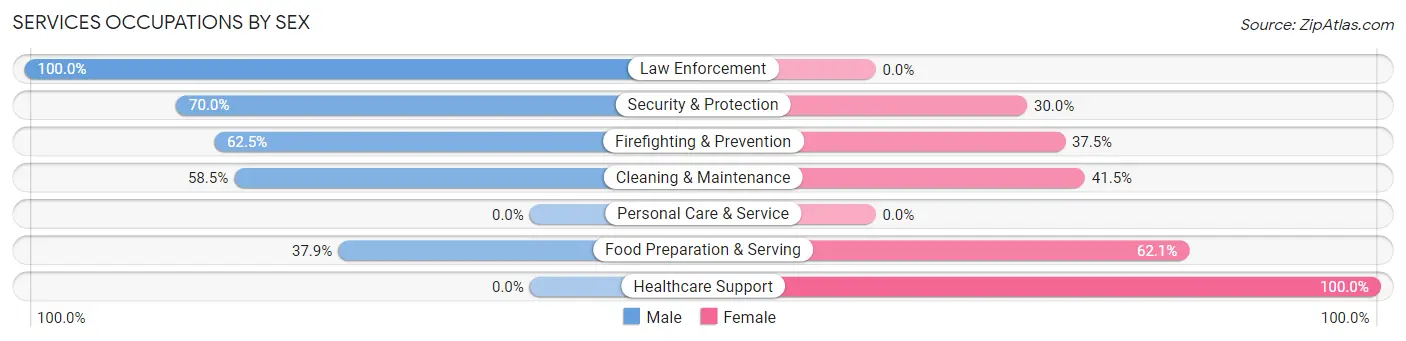
| Occupation | Male | Female |
| Healthcare Support | 0 (0.0%) | 7 (100.0%) |
| Security & Protection | 7 (70.0%) | 3 (30.0%) |
| Firefighting & Prevention | 5 (62.5%) | 3 (37.5%) |
| Law Enforcement | 2 (100.0%) | 0 (0.0%) |
| Food Preparation & Serving | 11 (37.9%) | 18 (62.1%) |
| Cleaning & Maintenance | 24 (58.5%) | 17 (41.5%) |
| Personal Care & Service | 0 (0.0%) | 0 (0.0%) |
| Total (Category) | 42 (48.3%) | 45 (51.7%) |
| Total (Overall) | 260 (58.7%) | 183 (41.3%) |
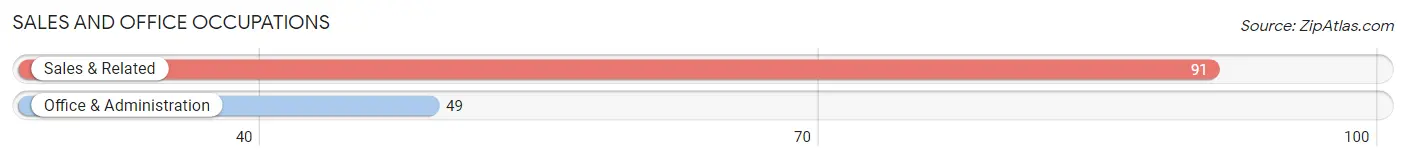
Sales and Office Occupations
The most common Sales and Office occupations in Wallace are Sales & Related (91 | 20.5%), and Office & Administration (49 | 11.1%).
Sales and Office Occupations by Sex
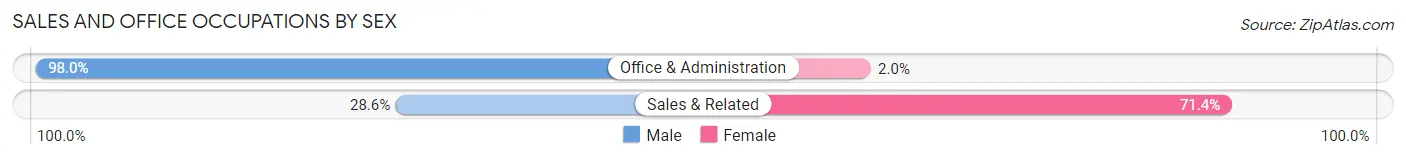
| Occupation | Male | Female |
| Sales & Related | 26 (28.6%) | 65 (71.4%) |
| Office & Administration | 48 (98.0%) | 1 (2.0%) |
| Total (Category) | 74 (52.9%) | 66 (47.1%) |
| Total (Overall) | 260 (58.7%) | 183 (41.3%) |
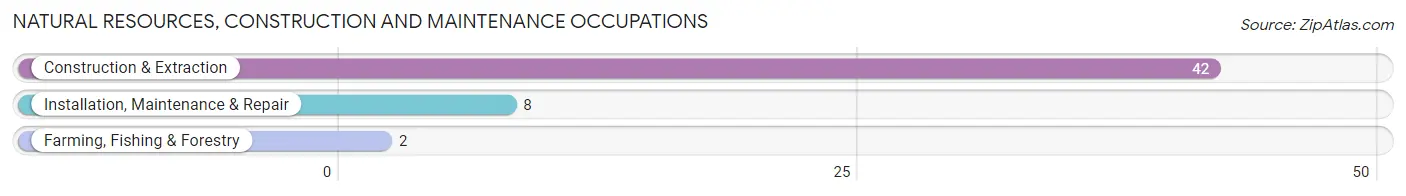
Natural Resources, Construction and Maintenance Occupations
The most common Natural Resources, Construction and Maintenance occupations in Wallace are Construction & Extraction (42 | 9.5%), Installation, Maintenance & Repair (8 | 1.8%), and Farming, Fishing & Forestry (2 | 0.4%).
Natural Resources, Construction and Maintenance Occupations by Sex
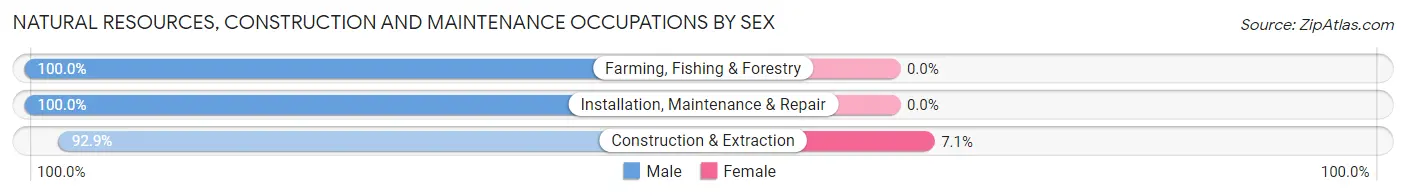
| Occupation | Male | Female |
| Farming, Fishing & Forestry | 2 (100.0%) | 0 (0.0%) |
| Construction & Extraction | 39 (92.9%) | 3 (7.1%) |
| Installation, Maintenance & Repair | 8 (100.0%) | 0 (0.0%) |
| Total (Category) | 49 (94.2%) | 3 (5.8%) |
| Total (Overall) | 260 (58.7%) | 183 (41.3%) |
Production, Transportation and Moving Occupations
The most common Production, Transportation and Moving occupations in Wallace are Transportation (34 | 7.7%), and Production (13 | 2.9%).
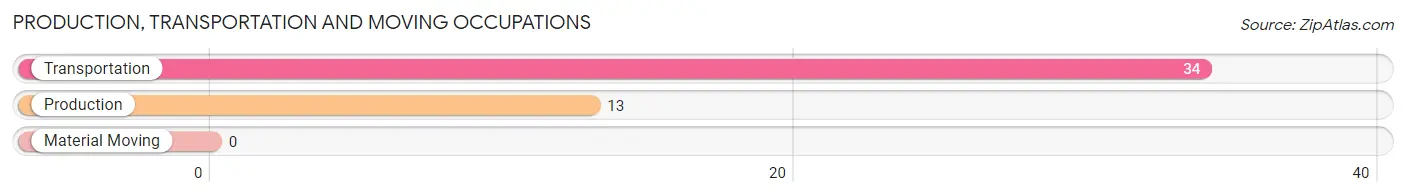
Production, Transportation and Moving Occupations by Sex
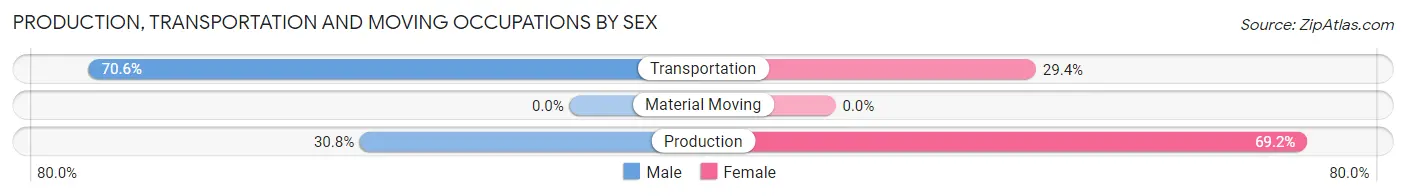
| Occupation | Male | Female |
| Production | 4 (30.8%) | 9 (69.2%) |
| Transportation | 24 (70.6%) | 10 (29.4%) |
| Material Moving | 0 (0.0%) | 0 (0.0%) |
| Total (Category) | 28 (59.6%) | 19 (40.4%) |
| Total (Overall) | 260 (58.7%) | 183 (41.3%) |
Employment Industries by Sex in Wallace
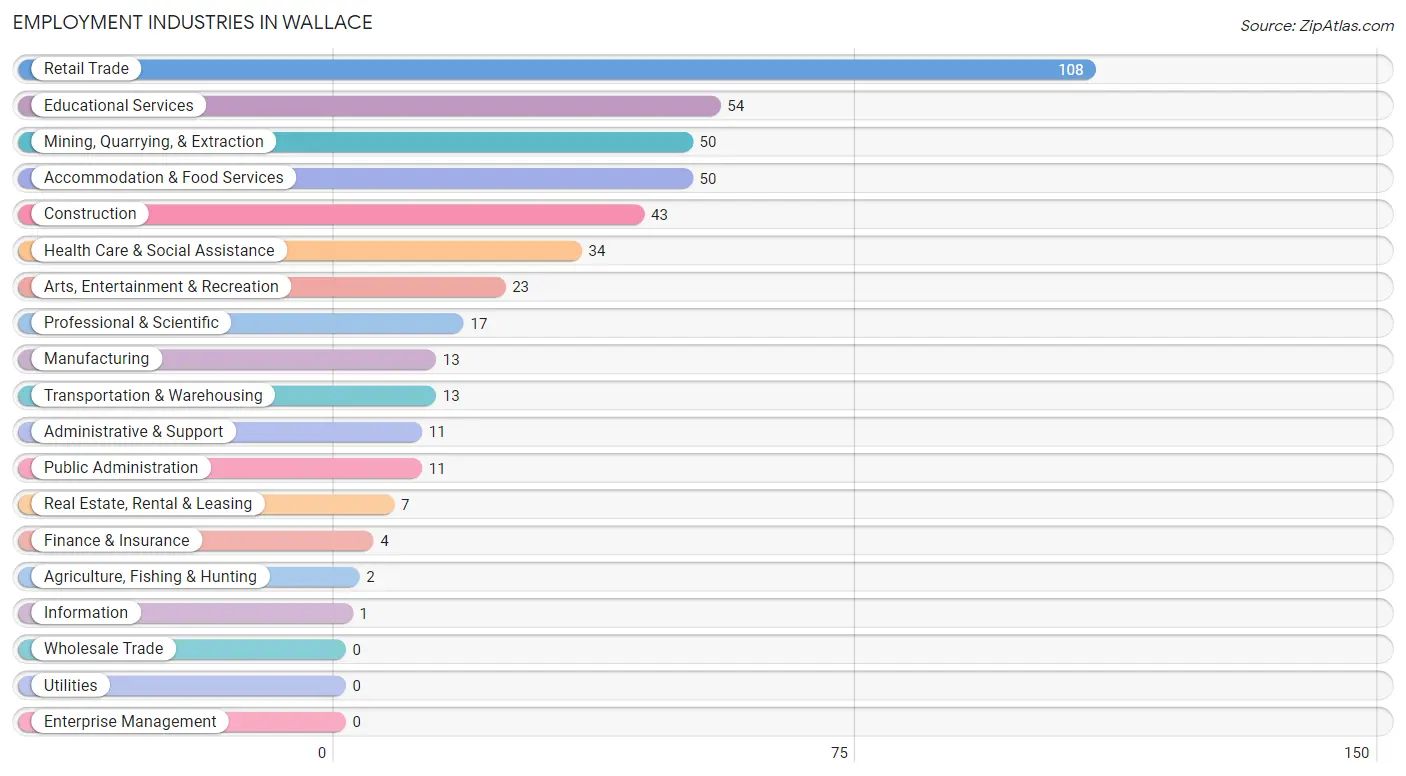
Employment Industries in Wallace
The major employment industries in Wallace include Retail Trade (108 | 24.4%), Educational Services (54 | 12.2%), Mining, Quarrying, & Extraction (50 | 11.3%), Accommodation & Food Services (50 | 11.3%), and Construction (43 | 9.7%).
Employment Industries by Sex in Wallace
The Wallace industries that see more men than women are Agriculture, Fishing & Hunting (100.0%), Mining, Quarrying, & Extraction (100.0%), and Transportation & Warehousing (100.0%), whereas the industries that tend to have a higher number of women are Administrative & Support (100.0%), Health Care & Social Assistance (85.3%), and Retail Trade (65.7%).
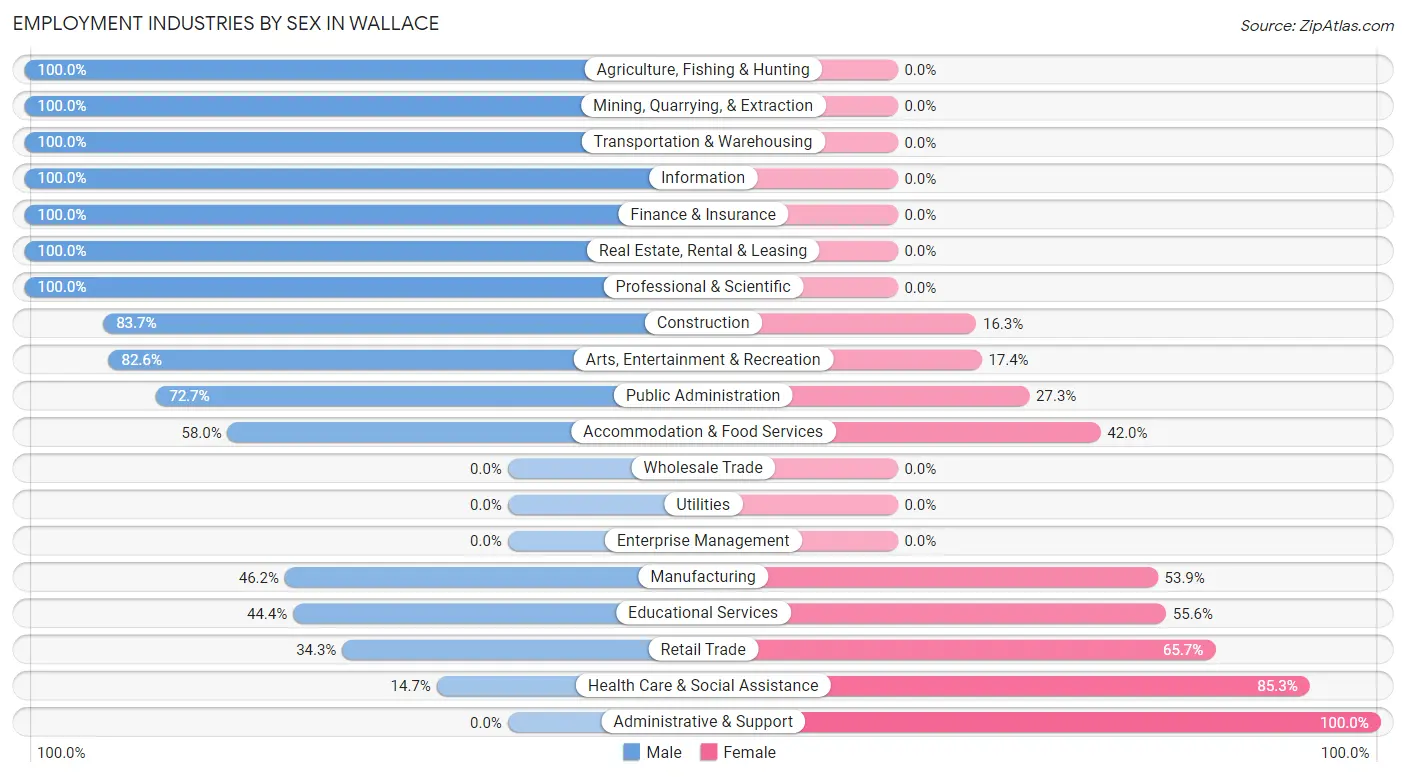
| Industry | Male | Female |
| Agriculture, Fishing & Hunting | 2 (100.0%) | 0 (0.0%) |
| Mining, Quarrying, & Extraction | 50 (100.0%) | 0 (0.0%) |
| Construction | 36 (83.7%) | 7 (16.3%) |
| Manufacturing | 6 (46.2%) | 7 (53.8%) |
| Wholesale Trade | 0 (0.0%) | 0 (0.0%) |
| Retail Trade | 37 (34.3%) | 71 (65.7%) |
| Transportation & Warehousing | 13 (100.0%) | 0 (0.0%) |
| Utilities | 0 (0.0%) | 0 (0.0%) |
| Information | 1 (100.0%) | 0 (0.0%) |
| Finance & Insurance | 4 (100.0%) | 0 (0.0%) |
| Real Estate, Rental & Leasing | 7 (100.0%) | 0 (0.0%) |
| Professional & Scientific | 17 (100.0%) | 0 (0.0%) |
| Enterprise Management | 0 (0.0%) | 0 (0.0%) |
| Administrative & Support | 0 (0.0%) | 11 (100.0%) |
| Educational Services | 24 (44.4%) | 30 (55.6%) |
| Health Care & Social Assistance | 5 (14.7%) | 29 (85.3%) |
| Arts, Entertainment & Recreation | 19 (82.6%) | 4 (17.4%) |
| Accommodation & Food Services | 29 (58.0%) | 21 (42.0%) |
| Public Administration | 8 (72.7%) | 3 (27.3%) |
| Total | 260 (58.7%) | 183 (41.3%) |
Education in Wallace
School Enrollment in Wallace
The most common levels of schooling among the 135 students in Wallace are middle school (43 | 31.9%), high school (35 | 25.9%), and elementary school (22 | 16.3%).
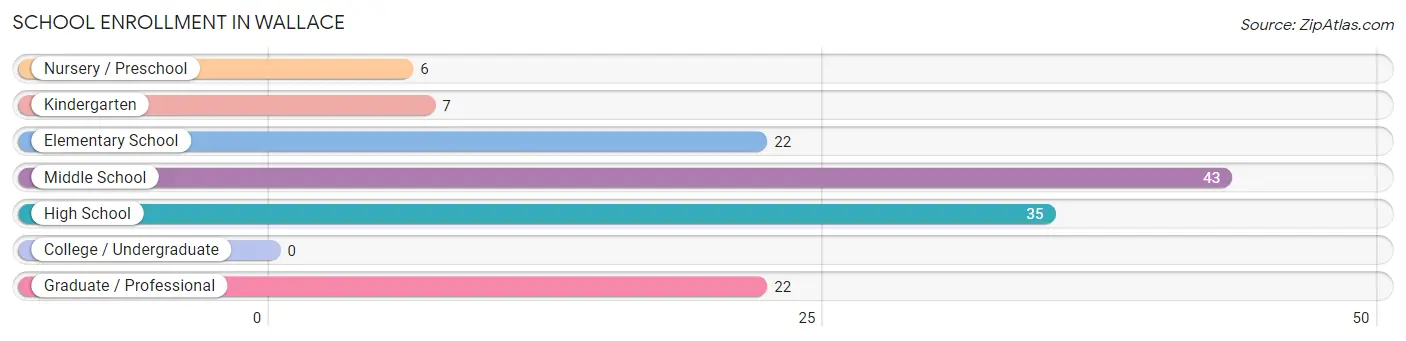
| School Level | # Students | % Students |
| Nursery / Preschool | 6 | 4.4% |
| Kindergarten | 7 | 5.2% |
| Elementary School | 22 | 16.3% |
| Middle School | 43 | 31.9% |
| High School | 35 | 25.9% |
| College / Undergraduate | 0 | 0.0% |
| Graduate / Professional | 22 | 16.3% |
| Total | 135 | 100.0% |
School Enrollment by Age by Funding Source in Wallace
Out of a total of 135 students who are enrolled in schools in Wallace, 10 (7.4%) attend a private institution, while the remaining 125 (92.6%) are enrolled in public schools. The age group of 15 to 17 year olds has the highest likelihood of being enrolled in private schools, with 5 (29.4% in the age bracket) enrolled. Conversely, the age group of 5 to 9 year old has the lowest likelihood of being enrolled in a private school, with 35 (100.0% in the age bracket) attending a public institution.
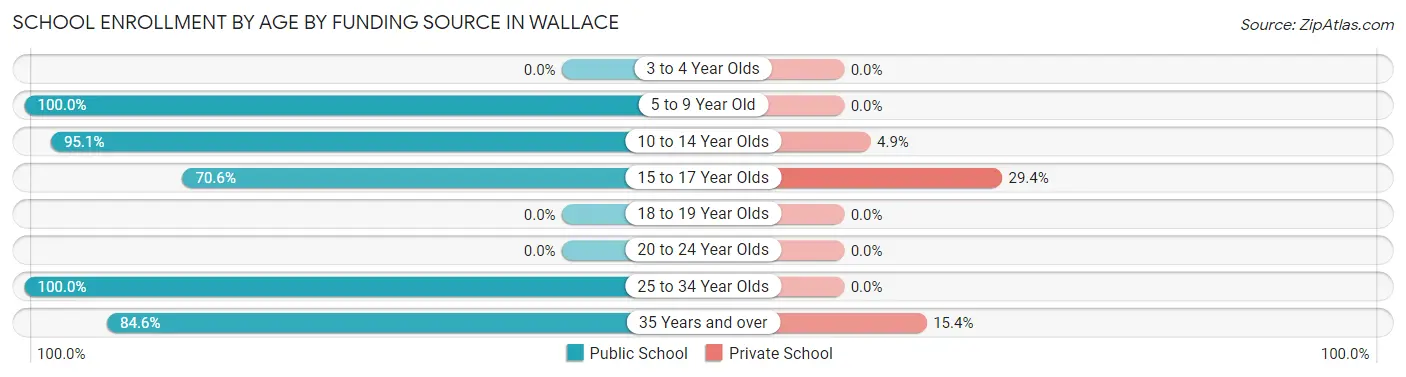
| Age Bracket | Public School | Private School |
| 3 to 4 Year Olds | 0 (0.0%) | 0 (0.0%) |
| 5 to 9 Year Old | 35 (100.0%) | 0 (0.0%) |
| 10 to 14 Year Olds | 58 (95.1%) | 3 (4.9%) |
| 15 to 17 Year Olds | 12 (70.6%) | 5 (29.4%) |
| 18 to 19 Year Olds | 0 (0.0%) | 0 (0.0%) |
| 20 to 24 Year Olds | 0 (0.0%) | 0 (0.0%) |
| 25 to 34 Year Olds | 9 (100.0%) | 0 (0.0%) |
| 35 Years and over | 11 (84.6%) | 2 (15.4%) |
| Total | 125 (92.6%) | 10 (7.4%) |
Educational Attainment by Field of Study in Wallace
Education (43 | 23.1%), business (30 | 16.1%), social sciences (29 | 15.6%), literature & languages (15 | 8.1%), and engineering (13 | 7.0%) are the most common fields of study among 186 individuals in Wallace who have obtained a bachelor's degree or higher.
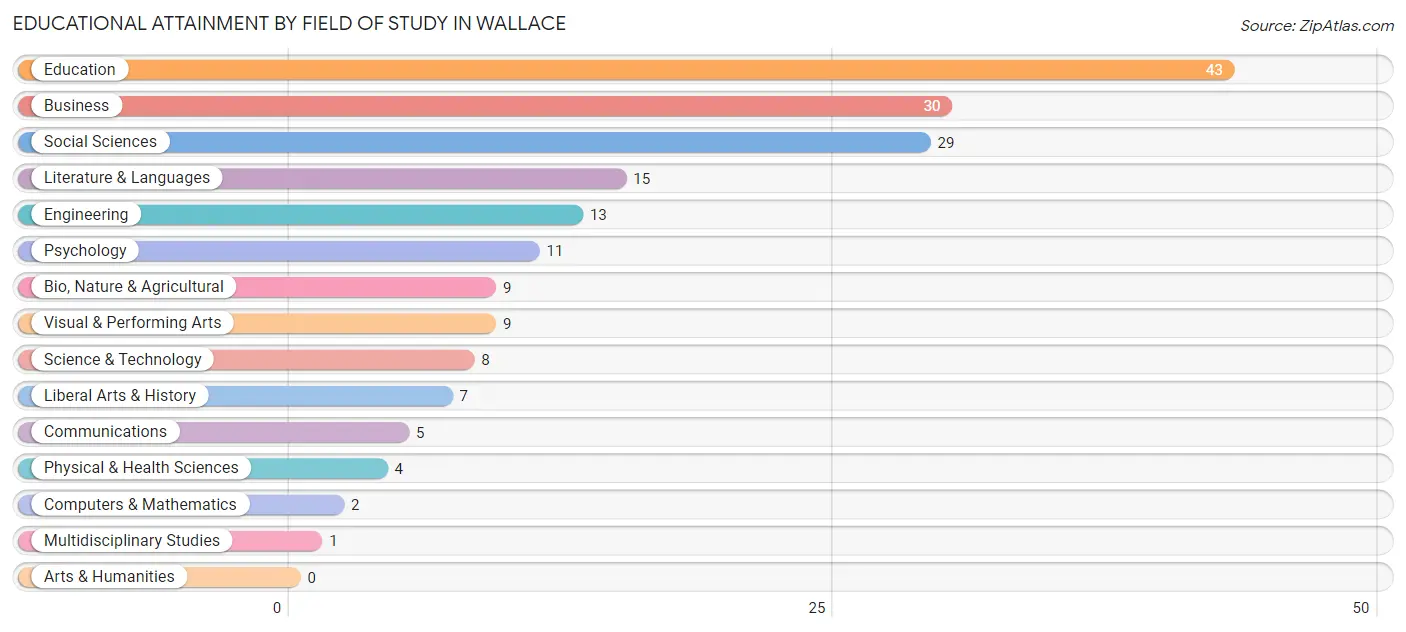
| Field of Study | # Graduates | % Graduates |
| Computers & Mathematics | 2 | 1.1% |
| Bio, Nature & Agricultural | 9 | 4.8% |
| Physical & Health Sciences | 4 | 2.1% |
| Psychology | 11 | 5.9% |
| Social Sciences | 29 | 15.6% |
| Engineering | 13 | 7.0% |
| Multidisciplinary Studies | 1 | 0.5% |
| Science & Technology | 8 | 4.3% |
| Business | 30 | 16.1% |
| Education | 43 | 23.1% |
| Literature & Languages | 15 | 8.1% |
| Liberal Arts & History | 7 | 3.8% |
| Visual & Performing Arts | 9 | 4.8% |
| Communications | 5 | 2.7% |
| Arts & Humanities | 0 | 0.0% |
| Total | 186 | 100.0% |
Transportation & Commute in Wallace
Vehicle Availability by Sex in Wallace
The most prevalent vehicle ownership categories in Wallace are males with 2 vehicles (89, accounting for 35.5%) and females with 2 vehicles (63, making up 49.7%).
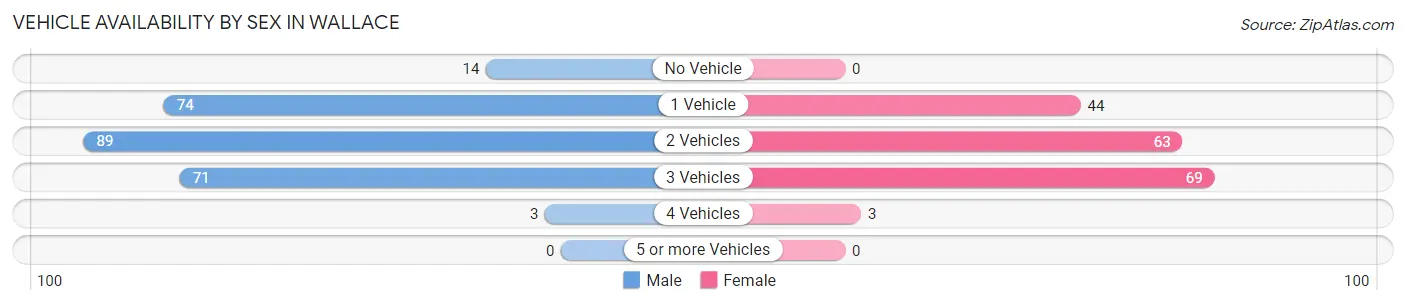
| Vehicles Available | Male | Female |
| No Vehicle | 14 (5.6%) | 0 (0.0%) |
| 1 Vehicle | 74 (29.5%) | 44 (24.6%) |
| 2 Vehicles | 89 (35.5%) | 63 (35.2%) |
| 3 Vehicles | 71 (28.3%) | 69 (38.6%) |
| 4 Vehicles | 3 (1.2%) | 3 (1.7%) |
| 5 or more Vehicles | 0 (0.0%) | 0 (0.0%) |
| Total | 251 (100.0%) | 179 (100.0%) |
Commute Time in Wallace
The most frequently occuring commute durations in Wallace are 15 to 19 minutes (105 commuters, 26.1%), 5 to 9 minutes (91 commuters, 22.6%), and 10 to 14 minutes (64 commuters, 15.9%).
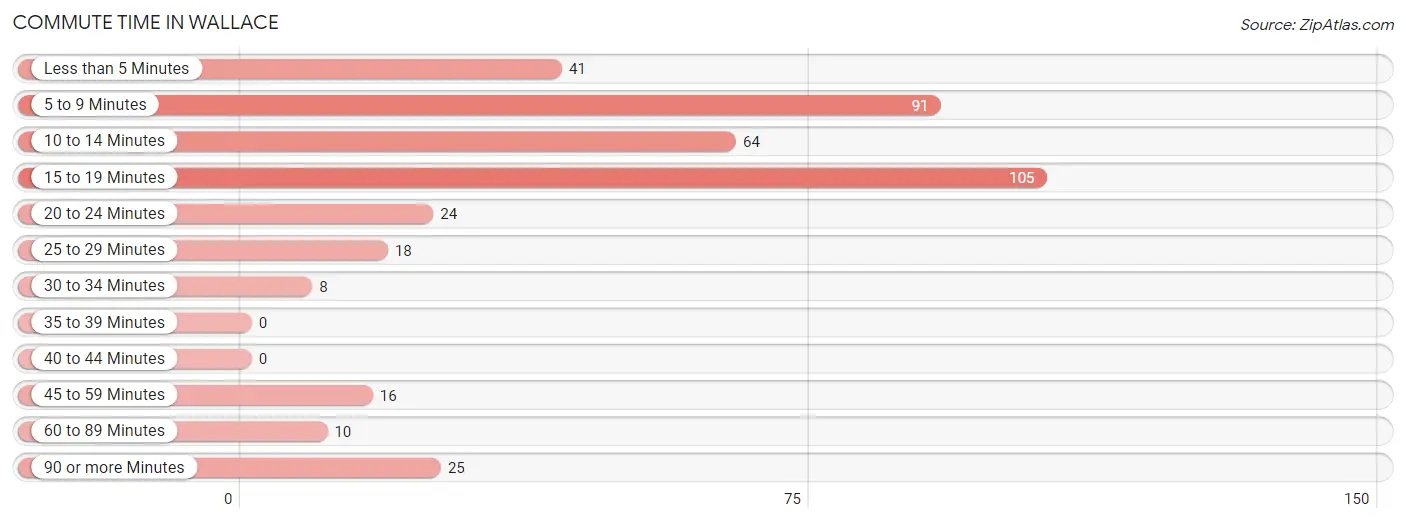
| Commute Time | # Commuters | % Commuters |
| Less than 5 Minutes | 41 | 10.2% |
| 5 to 9 Minutes | 91 | 22.6% |
| 10 to 14 Minutes | 64 | 15.9% |
| 15 to 19 Minutes | 105 | 26.1% |
| 20 to 24 Minutes | 24 | 6.0% |
| 25 to 29 Minutes | 18 | 4.5% |
| 30 to 34 Minutes | 8 | 2.0% |
| 35 to 39 Minutes | 0 | 0.0% |
| 40 to 44 Minutes | 0 | 0.0% |
| 45 to 59 Minutes | 16 | 4.0% |
| 60 to 89 Minutes | 10 | 2.5% |
| 90 or more Minutes | 25 | 6.2% |
Commute Time by Sex in Wallace
The most common commute times in Wallace are 15 to 19 minutes (75 commuters, 32.6%) for males and 5 to 9 minutes (65 commuters, 37.8%) for females.
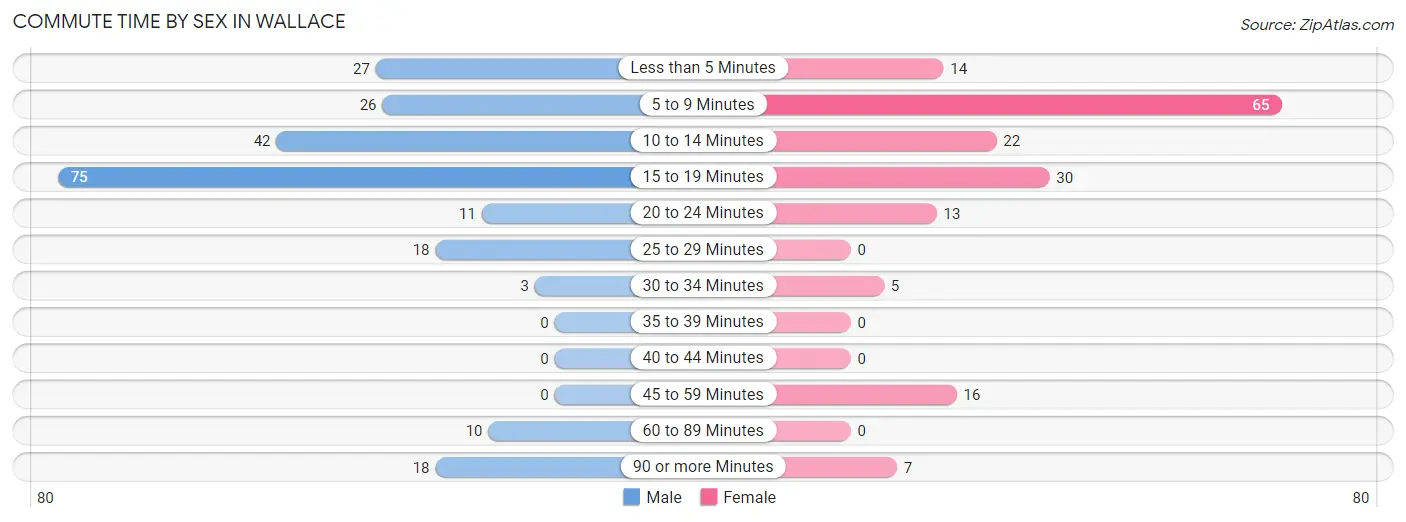
| Commute Time | Male | Female |
| Less than 5 Minutes | 27 (11.7%) | 14 (8.1%) |
| 5 to 9 Minutes | 26 (11.3%) | 65 (37.8%) |
| 10 to 14 Minutes | 42 (18.3%) | 22 (12.8%) |
| 15 to 19 Minutes | 75 (32.6%) | 30 (17.4%) |
| 20 to 24 Minutes | 11 (4.8%) | 13 (7.6%) |
| 25 to 29 Minutes | 18 (7.8%) | 0 (0.0%) |
| 30 to 34 Minutes | 3 (1.3%) | 5 (2.9%) |
| 35 to 39 Minutes | 0 (0.0%) | 0 (0.0%) |
| 40 to 44 Minutes | 0 (0.0%) | 0 (0.0%) |
| 45 to 59 Minutes | 0 (0.0%) | 16 (9.3%) |
| 60 to 89 Minutes | 10 (4.3%) | 0 (0.0%) |
| 90 or more Minutes | 18 (7.8%) | 7 (4.1%) |
Time of Departure to Work by Sex in Wallace
The most frequent times of departure to work in Wallace are 12:00 AM to 4:59 AM (46, 20.0%) for males and 5:30 AM to 5:59 AM (32, 18.6%) for females.
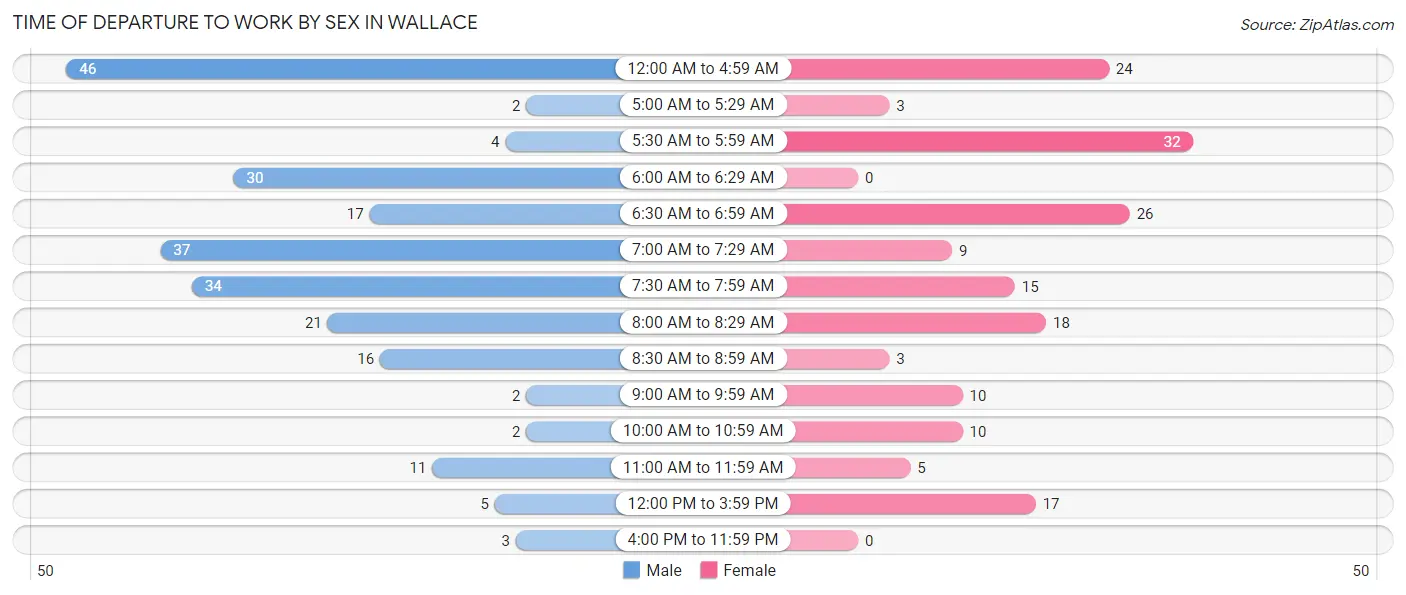
| Time of Departure | Male | Female |
| 12:00 AM to 4:59 AM | 46 (20.0%) | 24 (14.0%) |
| 5:00 AM to 5:29 AM | 2 (0.9%) | 3 (1.7%) |
| 5:30 AM to 5:59 AM | 4 (1.7%) | 32 (18.6%) |
| 6:00 AM to 6:29 AM | 30 (13.0%) | 0 (0.0%) |
| 6:30 AM to 6:59 AM | 17 (7.4%) | 26 (15.1%) |
| 7:00 AM to 7:29 AM | 37 (16.1%) | 9 (5.2%) |
| 7:30 AM to 7:59 AM | 34 (14.8%) | 15 (8.7%) |
| 8:00 AM to 8:29 AM | 21 (9.1%) | 18 (10.5%) |
| 8:30 AM to 8:59 AM | 16 (7.0%) | 3 (1.7%) |
| 9:00 AM to 9:59 AM | 2 (0.9%) | 10 (5.8%) |
| 10:00 AM to 10:59 AM | 2 (0.9%) | 10 (5.8%) |
| 11:00 AM to 11:59 AM | 11 (4.8%) | 5 (2.9%) |
| 12:00 PM to 3:59 PM | 5 (2.2%) | 17 (9.9%) |
| 4:00 PM to 11:59 PM | 3 (1.3%) | 0 (0.0%) |
| Total | 230 (100.0%) | 172 (100.0%) |
Housing Occupancy in Wallace
Occupancy by Ownership in Wallace
Of the total 430 dwellings in Wallace, owner-occupied units account for 239 (55.6%), while renter-occupied units make up 191 (44.4%).
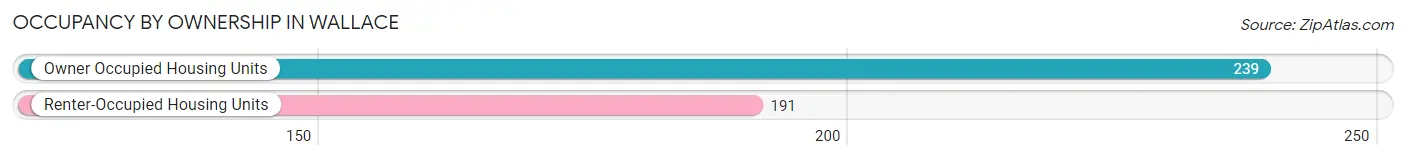
| Occupancy | # Housing Units | % Housing Units |
| Owner Occupied Housing Units | 239 | 55.6% |
| Renter-Occupied Housing Units | 191 | 44.4% |
| Total Occupied Housing Units | 430 | 100.0% |
Occupancy by Household Size in Wallace
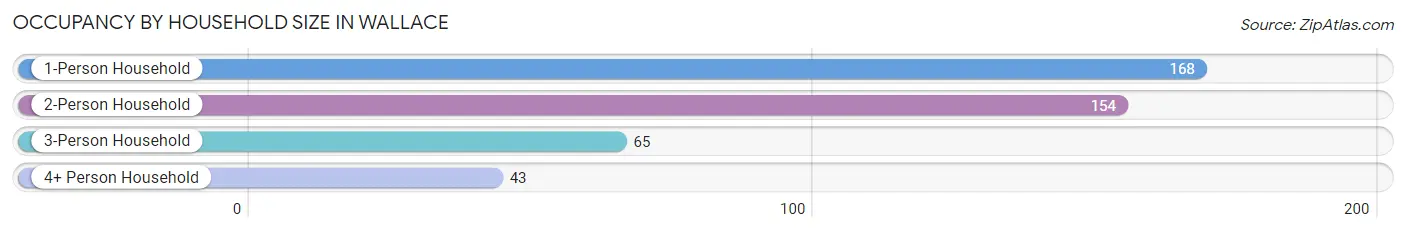
| Household Size | # Housing Units | % Housing Units |
| 1-Person Household | 168 | 39.1% |
| 2-Person Household | 154 | 35.8% |
| 3-Person Household | 65 | 15.1% |
| 4+ Person Household | 43 | 10.0% |
| Total Housing Units | 430 | 100.0% |
Occupancy by Ownership by Household Size in Wallace
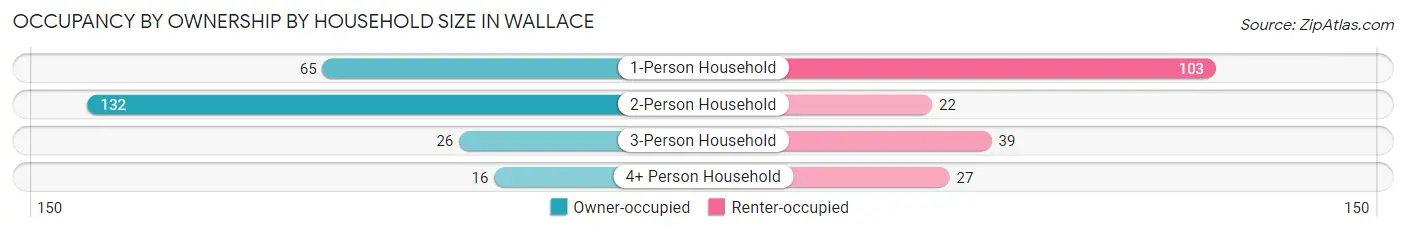
| Household Size | Owner-occupied | Renter-occupied |
| 1-Person Household | 65 (38.7%) | 103 (61.3%) |
| 2-Person Household | 132 (85.7%) | 22 (14.3%) |
| 3-Person Household | 26 (40.0%) | 39 (60.0%) |
| 4+ Person Household | 16 (37.2%) | 27 (62.8%) |
| Total Housing Units | 239 (55.6%) | 191 (44.4%) |
Occupancy by Educational Attainment in Wallace
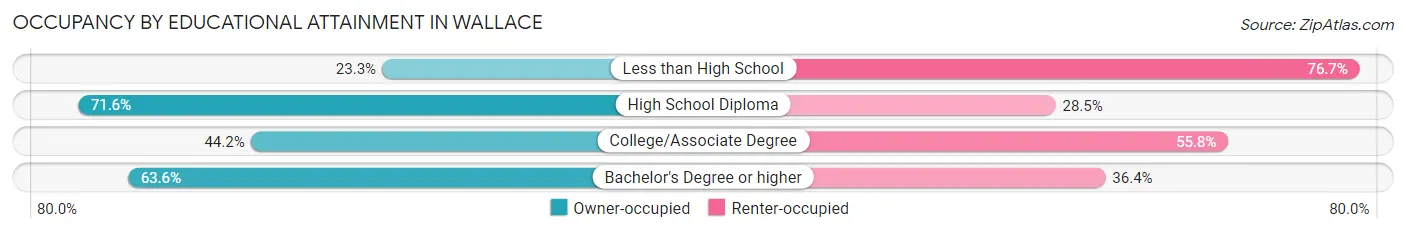
| Household Size | Owner-occupied | Renter-occupied |
| Less than High School | 7 (23.3%) | 23 (76.7%) |
| High School Diploma | 83 (71.6%) | 33 (28.4%) |
| College/Associate Degree | 72 (44.2%) | 91 (55.8%) |
| Bachelor's Degree or higher | 77 (63.6%) | 44 (36.4%) |
Occupancy by Age of Householder in Wallace
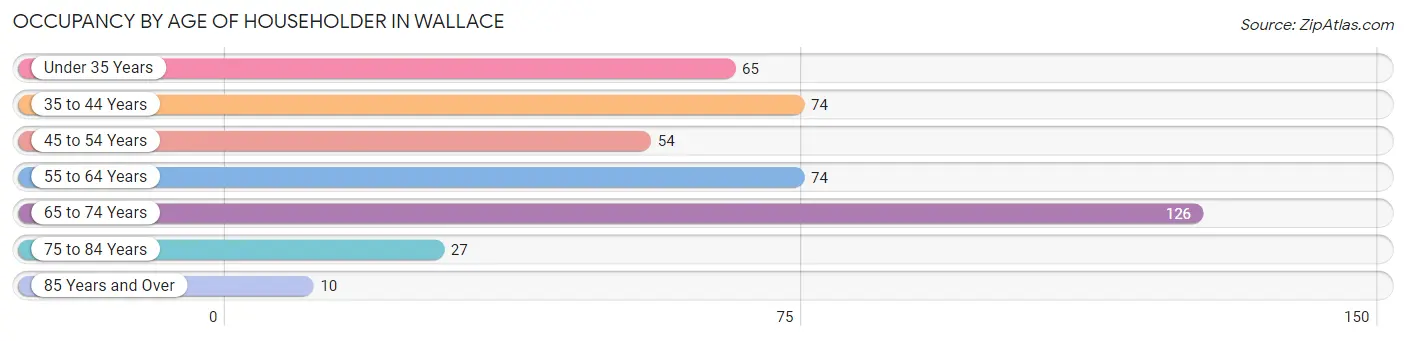
| Age Bracket | # Households | % Households |
| Under 35 Years | 65 | 15.1% |
| 35 to 44 Years | 74 | 17.2% |
| 45 to 54 Years | 54 | 12.6% |
| 55 to 64 Years | 74 | 17.2% |
| 65 to 74 Years | 126 | 29.3% |
| 75 to 84 Years | 27 | 6.3% |
| 85 Years and Over | 10 | 2.3% |
| Total | 430 | 100.0% |
Housing Finances in Wallace
Median Income by Occupancy in Wallace
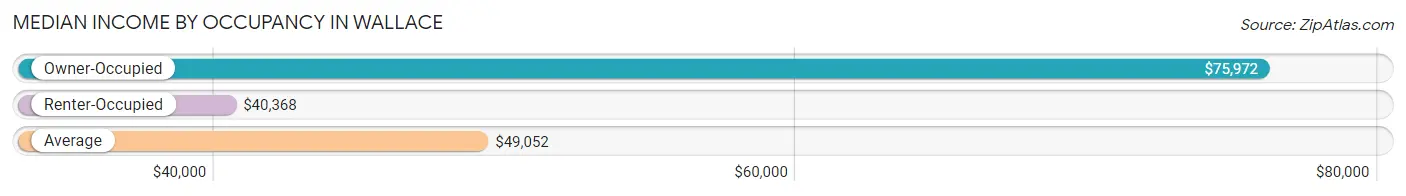
| Occupancy Type | # Households | Median Income |
| Owner-Occupied | 239 (55.6%) | $75,972 |
| Renter-Occupied | 191 (44.4%) | $40,368 |
| Average | 430 (100.0%) | $49,052 |
Occupancy by Householder Income Bracket in Wallace
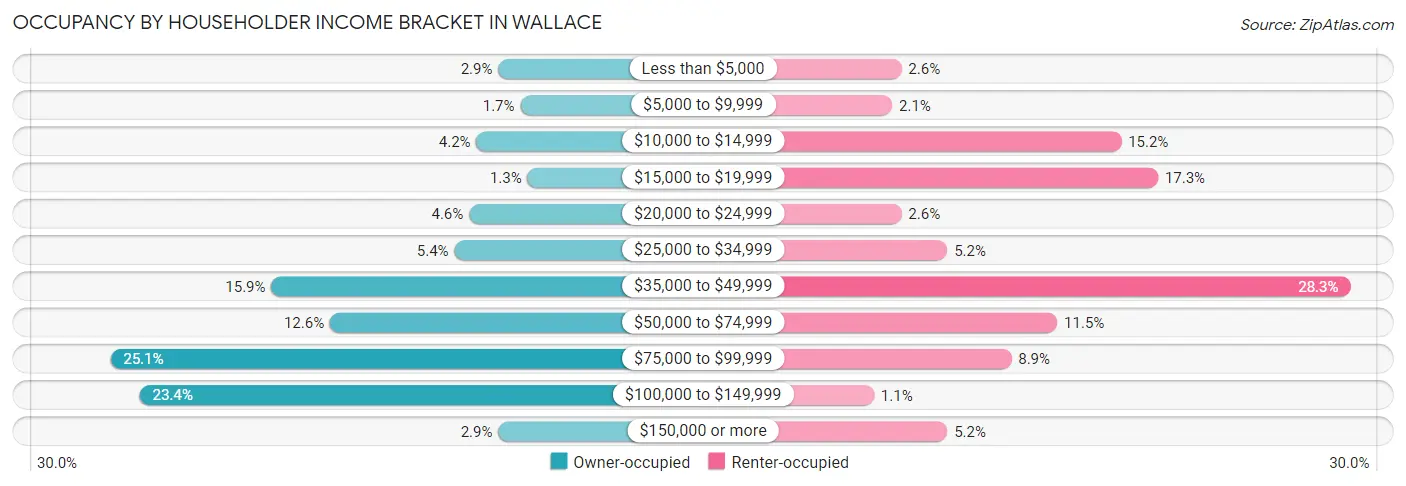
| Income Bracket | Owner-occupied | Renter-occupied |
| Less than $5,000 | 7 (2.9%) | 5 (2.6%) |
| $5,000 to $9,999 | 4 (1.7%) | 4 (2.1%) |
| $10,000 to $14,999 | 10 (4.2%) | 29 (15.2%) |
| $15,000 to $19,999 | 3 (1.3%) | 33 (17.3%) |
| $20,000 to $24,999 | 11 (4.6%) | 5 (2.6%) |
| $25,000 to $34,999 | 13 (5.4%) | 10 (5.2%) |
| $35,000 to $49,999 | 38 (15.9%) | 54 (28.3%) |
| $50,000 to $74,999 | 30 (12.6%) | 22 (11.5%) |
| $75,000 to $99,999 | 60 (25.1%) | 17 (8.9%) |
| $100,000 to $149,999 | 56 (23.4%) | 2 (1.1%) |
| $150,000 or more | 7 (2.9%) | 10 (5.2%) |
| Total | 239 (100.0%) | 191 (100.0%) |
Monthly Housing Cost Tiers in Wallace
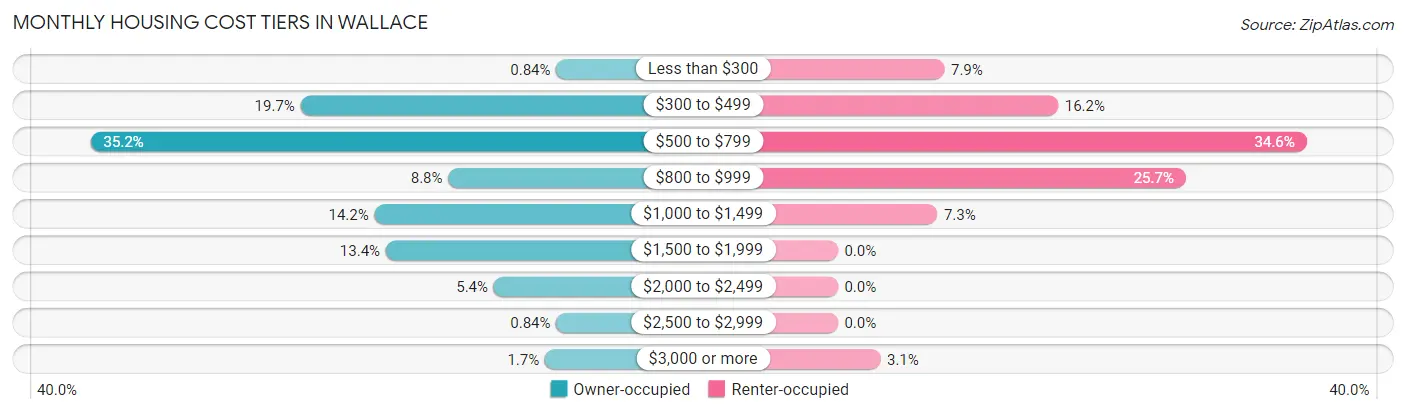
| Monthly Cost | Owner-occupied | Renter-occupied |
| Less than $300 | 2 (0.8%) | 15 (7.9%) |
| $300 to $499 | 47 (19.7%) | 31 (16.2%) |
| $500 to $799 | 84 (35.1%) | 66 (34.5%) |
| $800 to $999 | 21 (8.8%) | 49 (25.7%) |
| $1,000 to $1,499 | 34 (14.2%) | 14 (7.3%) |
| $1,500 to $1,999 | 32 (13.4%) | 0 (0.0%) |
| $2,000 to $2,499 | 13 (5.4%) | 0 (0.0%) |
| $2,500 to $2,999 | 2 (0.8%) | 0 (0.0%) |
| $3,000 or more | 4 (1.7%) | 6 (3.1%) |
| Total | 239 (100.0%) | 191 (100.0%) |
Physical Housing Characteristics in Wallace
Housing Structures in Wallace
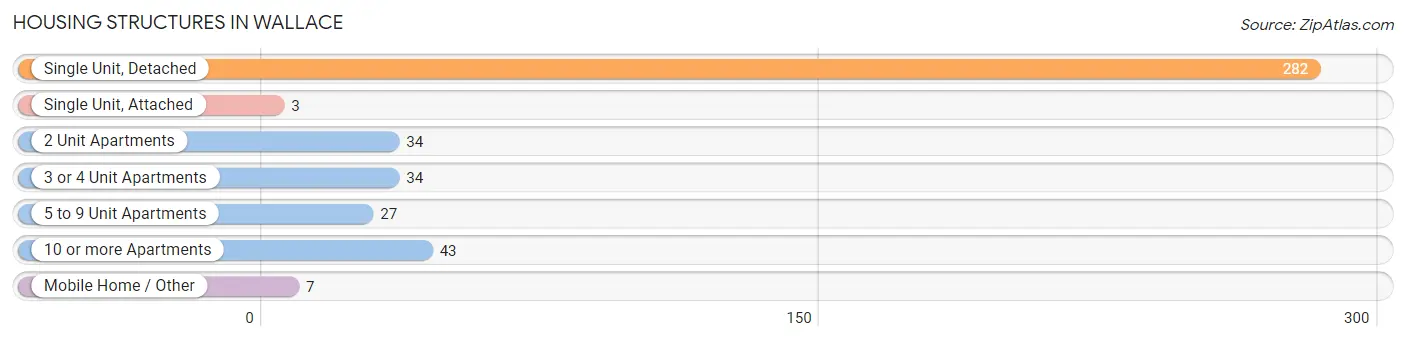
| Structure Type | # Housing Units | % Housing Units |
| Single Unit, Detached | 282 | 65.6% |
| Single Unit, Attached | 3 | 0.7% |
| 2 Unit Apartments | 34 | 7.9% |
| 3 or 4 Unit Apartments | 34 | 7.9% |
| 5 to 9 Unit Apartments | 27 | 6.3% |
| 10 or more Apartments | 43 | 10.0% |
| Mobile Home / Other | 7 | 1.6% |
| Total | 430 | 100.0% |
Housing Structures by Occupancy in Wallace
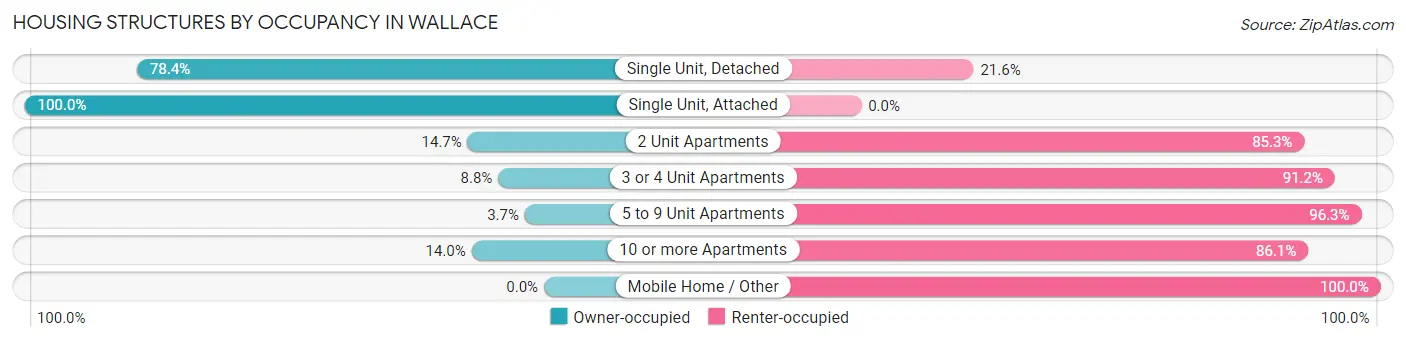
| Structure Type | Owner-occupied | Renter-occupied |
| Single Unit, Detached | 221 (78.4%) | 61 (21.6%) |
| Single Unit, Attached | 3 (100.0%) | 0 (0.0%) |
| 2 Unit Apartments | 5 (14.7%) | 29 (85.3%) |
| 3 or 4 Unit Apartments | 3 (8.8%) | 31 (91.2%) |
| 5 to 9 Unit Apartments | 1 (3.7%) | 26 (96.3%) |
| 10 or more Apartments | 6 (14.0%) | 37 (86.1%) |
| Mobile Home / Other | 0 (0.0%) | 7 (100.0%) |
| Total | 239 (55.6%) | 191 (44.4%) |
Housing Structures by Number of Rooms in Wallace
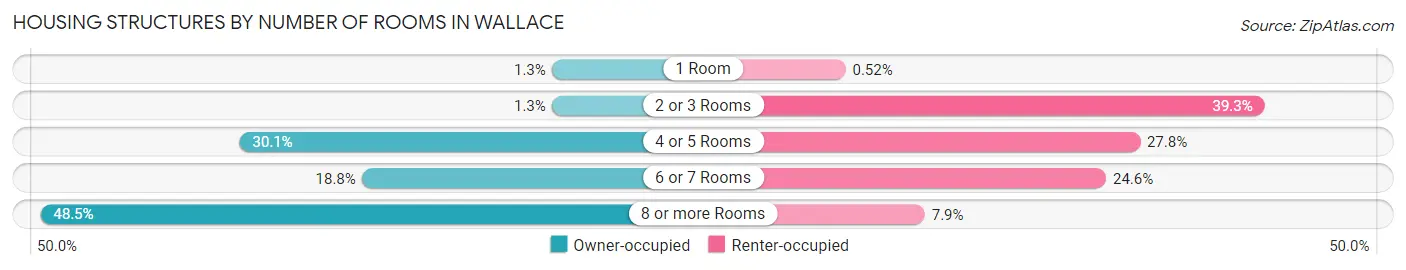
| Number of Rooms | Owner-occupied | Renter-occupied |
| 1 Room | 3 (1.3%) | 1 (0.5%) |
| 2 or 3 Rooms | 3 (1.3%) | 75 (39.3%) |
| 4 or 5 Rooms | 72 (30.1%) | 53 (27.8%) |
| 6 or 7 Rooms | 45 (18.8%) | 47 (24.6%) |
| 8 or more Rooms | 116 (48.5%) | 15 (7.9%) |
| Total | 239 (100.0%) | 191 (100.0%) |
Housing Structure by Heating Type in Wallace
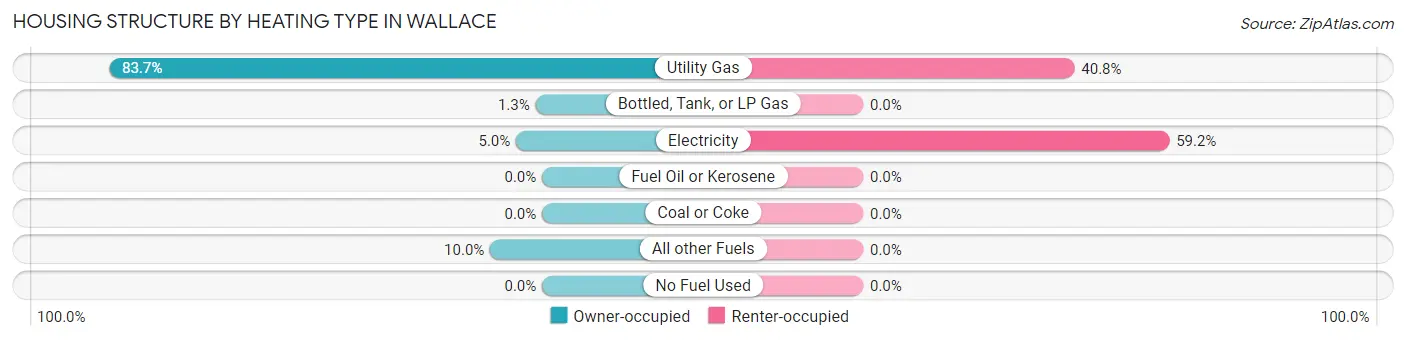
| Heating Type | Owner-occupied | Renter-occupied |
| Utility Gas | 200 (83.7%) | 78 (40.8%) |
| Bottled, Tank, or LP Gas | 3 (1.3%) | 0 (0.0%) |
| Electricity | 12 (5.0%) | 113 (59.2%) |
| Fuel Oil or Kerosene | 0 (0.0%) | 0 (0.0%) |
| Coal or Coke | 0 (0.0%) | 0 (0.0%) |
| All other Fuels | 24 (10.0%) | 0 (0.0%) |
| No Fuel Used | 0 (0.0%) | 0 (0.0%) |
| Total | 239 (100.0%) | 191 (100.0%) |
Household Vehicle Usage in Wallace
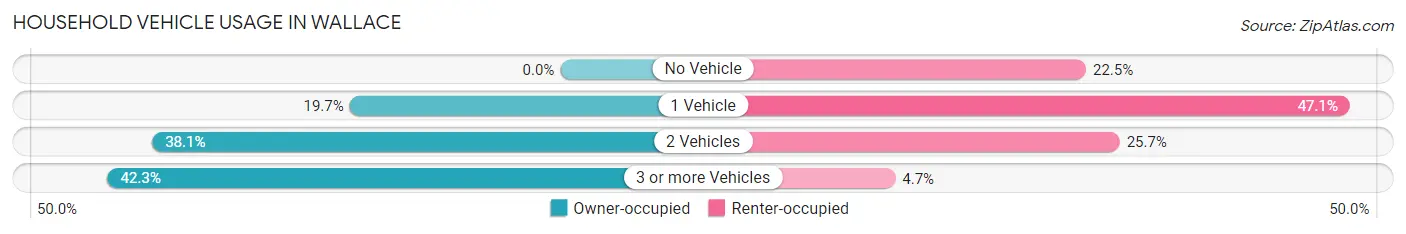
| Vehicles per Household | Owner-occupied | Renter-occupied |
| No Vehicle | 0 (0.0%) | 43 (22.5%) |
| 1 Vehicle | 47 (19.7%) | 90 (47.1%) |
| 2 Vehicles | 91 (38.1%) | 49 (25.7%) |
| 3 or more Vehicles | 101 (42.3%) | 9 (4.7%) |
| Total | 239 (100.0%) | 191 (100.0%) |
Real Estate & Mortgages in Wallace
Real Estate and Mortgage Overview in Wallace
| Characteristic | Without Mortgage | With Mortgage |
| Housing Units | 111 | 128 |
| Median Property Value | $119,600 | $200,000 |
| Median Household Income | $50,417 | $7 |
| Monthly Housing Costs | $513 | $4 |
| Real Estate Taxes | $1,329 | $3 |
Property Value by Mortgage Status in Wallace
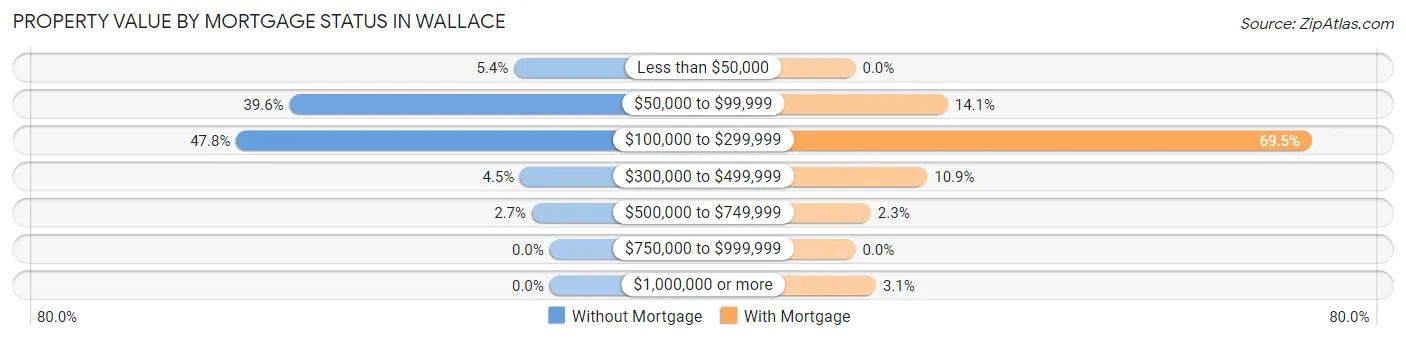
| Property Value | Without Mortgage | With Mortgage |
| Less than $50,000 | 6 (5.4%) | 0 (0.0%) |
| $50,000 to $99,999 | 44 (39.6%) | 18 (14.1%) |
| $100,000 to $299,999 | 53 (47.7%) | 89 (69.5%) |
| $300,000 to $499,999 | 5 (4.5%) | 14 (10.9%) |
| $500,000 to $749,999 | 3 (2.7%) | 3 (2.3%) |
| $750,000 to $999,999 | 0 (0.0%) | 0 (0.0%) |
| $1,000,000 or more | 0 (0.0%) | 4 (3.1%) |
| Total | 111 (100.0%) | 128 (100.0%) |
Household Income by Mortgage Status in Wallace
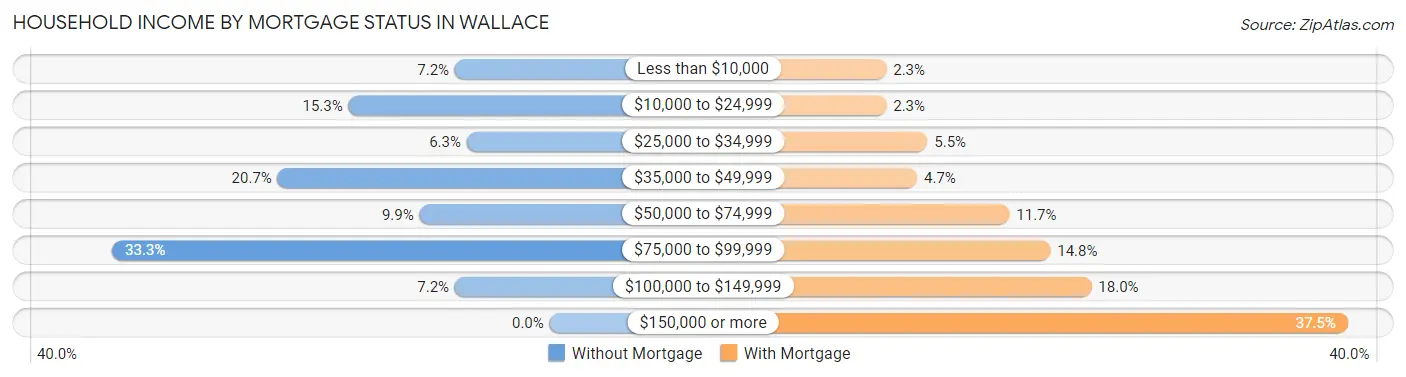
| Household Income | Without Mortgage | With Mortgage |
| Less than $10,000 | 8 (7.2%) | 3 (2.3%) |
| $10,000 to $24,999 | 17 (15.3%) | 3 (2.3%) |
| $25,000 to $34,999 | 7 (6.3%) | 7 (5.5%) |
| $35,000 to $49,999 | 23 (20.7%) | 6 (4.7%) |
| $50,000 to $74,999 | 11 (9.9%) | 15 (11.7%) |
| $75,000 to $99,999 | 37 (33.3%) | 19 (14.8%) |
| $100,000 to $149,999 | 8 (7.2%) | 23 (18.0%) |
| $150,000 or more | 0 (0.0%) | 48 (37.5%) |
| Total | 111 (100.0%) | 128 (100.0%) |
Property Value to Household Income Ratio in Wallace
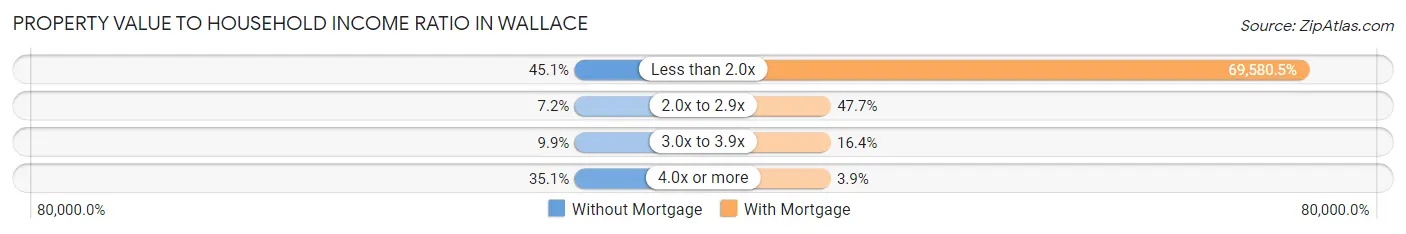
| Value-to-Income Ratio | Without Mortgage | With Mortgage |
| Less than 2.0x | 50 (45.1%) | 89,063 (69,580.5%) |
| 2.0x to 2.9x | 8 (7.2%) | 61 (47.7%) |
| 3.0x to 3.9x | 11 (9.9%) | 21 (16.4%) |
| 4.0x or more | 39 (35.1%) | 5 (3.9%) |
| Total | 111 (100.0%) | 128 (100.0%) |
Real Estate Taxes by Mortgage Status in Wallace
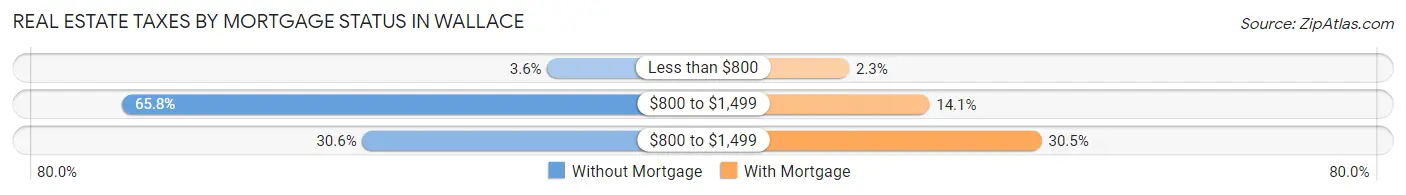
| Property Taxes | Without Mortgage | With Mortgage |
| Less than $800 | 4 (3.6%) | 3 (2.3%) |
| $800 to $1,499 | 73 (65.8%) | 18 (14.1%) |
| $800 to $1,499 | 34 (30.6%) | 39 (30.5%) |
| Total | 111 (100.0%) | 128 (100.0%) |
Health & Disability in Wallace
Health Insurance Coverage by Age in Wallace
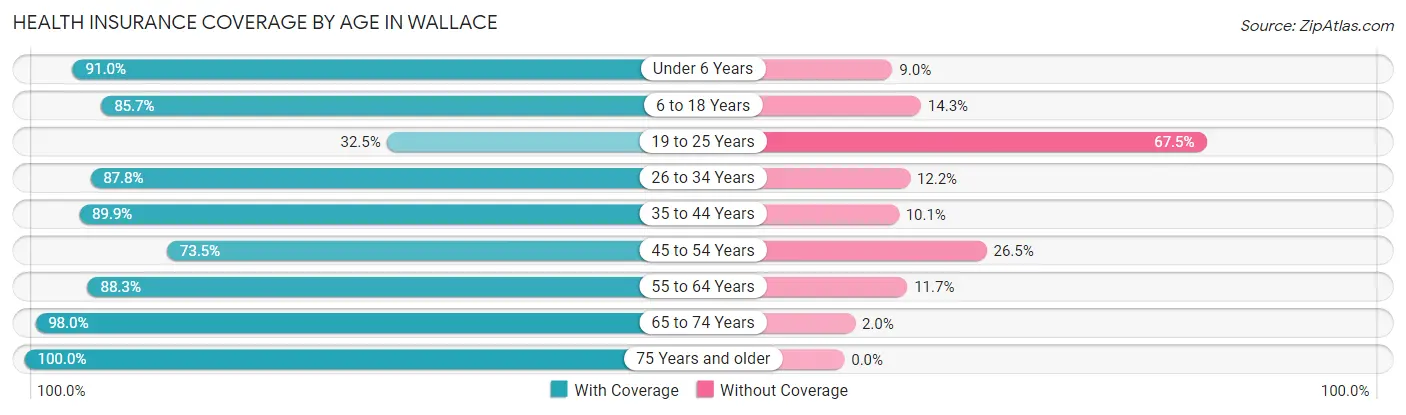
| Age Bracket | With Coverage | Without Coverage |
| Under 6 Years | 71 (91.0%) | 7 (9.0%) |
| 6 to 18 Years | 102 (85.7%) | 17 (14.3%) |
| 19 to 25 Years | 13 (32.5%) | 27 (67.5%) |
| 26 to 34 Years | 86 (87.8%) | 12 (12.2%) |
| 35 to 44 Years | 186 (89.9%) | 21 (10.1%) |
| 45 to 54 Years | 72 (73.5%) | 26 (26.5%) |
| 55 to 64 Years | 188 (88.3%) | 25 (11.7%) |
| 65 to 74 Years | 148 (98.0%) | 3 (2.0%) |
| 75 Years and older | 46 (100.0%) | 0 (0.0%) |
| Total | 912 (86.9%) | 138 (13.1%) |
Health Insurance Coverage by Citizenship Status in Wallace
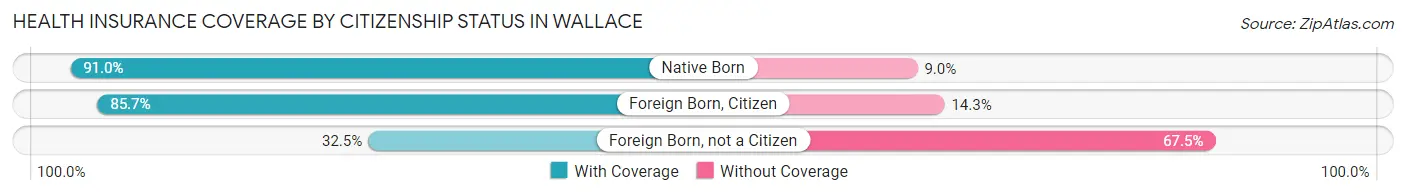
| Citizenship Status | With Coverage | Without Coverage |
| Native Born | 71 (91.0%) | 7 (9.0%) |
| Foreign Born, Citizen | 102 (85.7%) | 17 (14.3%) |
| Foreign Born, not a Citizen | 13 (32.5%) | 27 (67.5%) |
Health Insurance Coverage by Household Income in Wallace
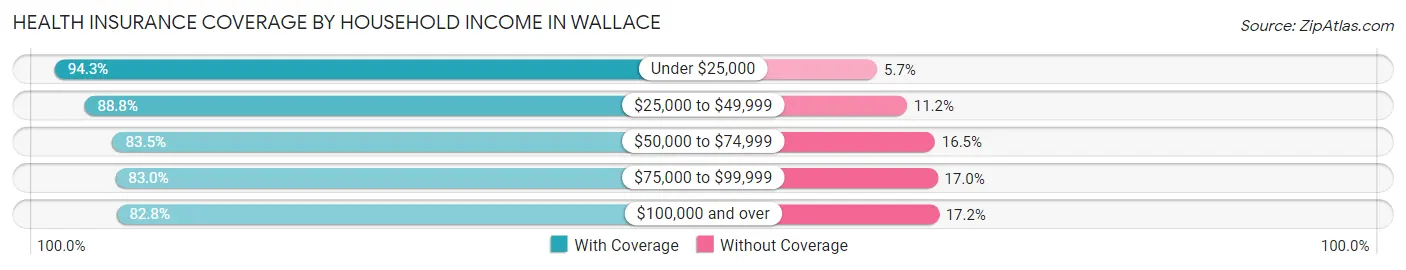
| Household Income | With Coverage | Without Coverage |
| Under $25,000 | 166 (94.3%) | 10 (5.7%) |
| $25,000 to $49,999 | 316 (88.8%) | 40 (11.2%) |
| $50,000 to $74,999 | 86 (83.5%) | 17 (16.5%) |
| $75,000 to $99,999 | 171 (83.0%) | 35 (17.0%) |
| $100,000 and over | 173 (82.8%) | 36 (17.2%) |
Public vs Private Health Insurance Coverage by Age in Wallace
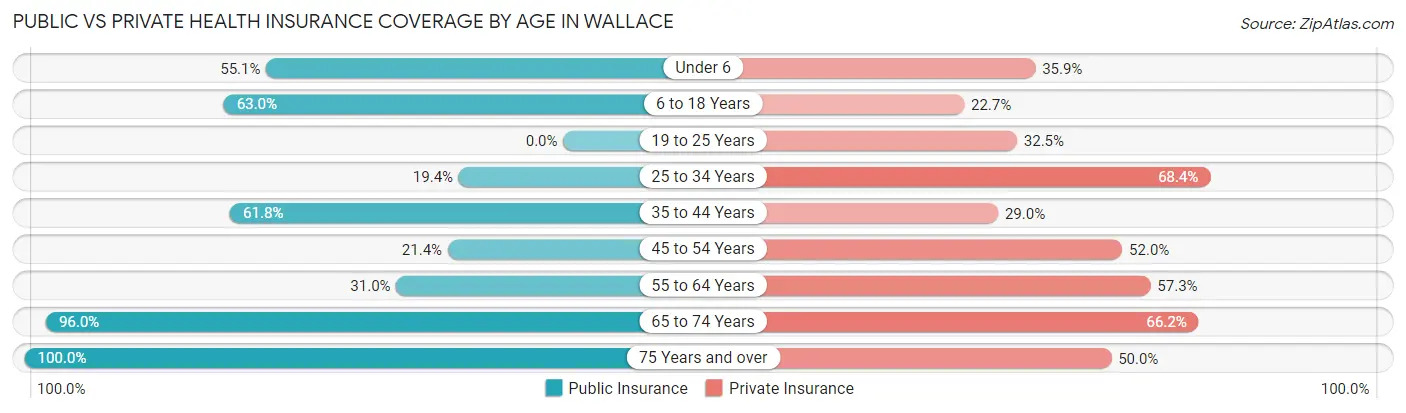
| Age Bracket | Public Insurance | Private Insurance |
| Under 6 | 43 (55.1%) | 28 (35.9%) |
| 6 to 18 Years | 75 (63.0%) | 27 (22.7%) |
| 19 to 25 Years | 0 (0.0%) | 13 (32.5%) |
| 25 to 34 Years | 19 (19.4%) | 67 (68.4%) |
| 35 to 44 Years | 128 (61.8%) | 60 (29.0%) |
| 45 to 54 Years | 21 (21.4%) | 51 (52.0%) |
| 55 to 64 Years | 66 (31.0%) | 122 (57.3%) |
| 65 to 74 Years | 145 (96.0%) | 100 (66.2%) |
| 75 Years and over | 46 (100.0%) | 23 (50.0%) |
| Total | 543 (51.7%) | 491 (46.8%) |
Disability Status by Sex by Age in Wallace
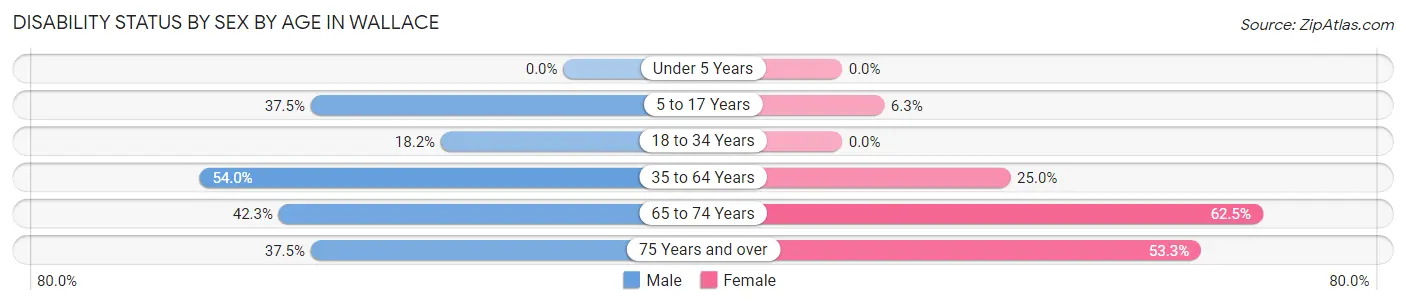
| Age Bracket | Male | Female |
| Under 5 Years | 0 (0.0%) | 0 (0.0%) |
| 5 to 17 Years | 33 (37.5%) | 3 (6.2%) |
| 18 to 34 Years | 16 (18.2%) | 0 (0.0%) |
| 35 to 64 Years | 161 (54.0%) | 55 (25.0%) |
| 65 to 74 Years | 30 (42.2%) | 50 (62.5%) |
| 75 Years and over | 6 (37.5%) | 16 (53.3%) |
Disability Class by Sex by Age in Wallace
Disability Class: Hearing Difficulty
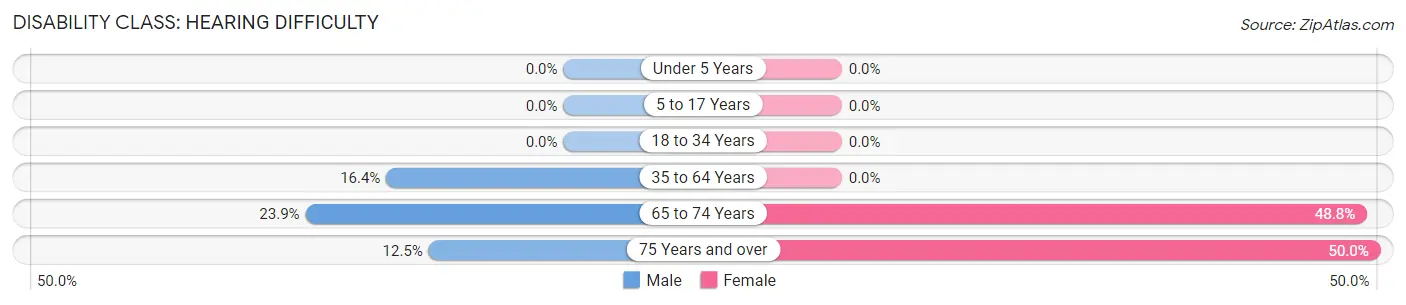
| Age Bracket | Male | Female |
| Under 5 Years | 0 (0.0%) | 0 (0.0%) |
| 5 to 17 Years | 0 (0.0%) | 0 (0.0%) |
| 18 to 34 Years | 0 (0.0%) | 0 (0.0%) |
| 35 to 64 Years | 49 (16.4%) | 0 (0.0%) |
| 65 to 74 Years | 17 (23.9%) | 39 (48.7%) |
| 75 Years and over | 2 (12.5%) | 15 (50.0%) |
Disability Class: Vision Difficulty
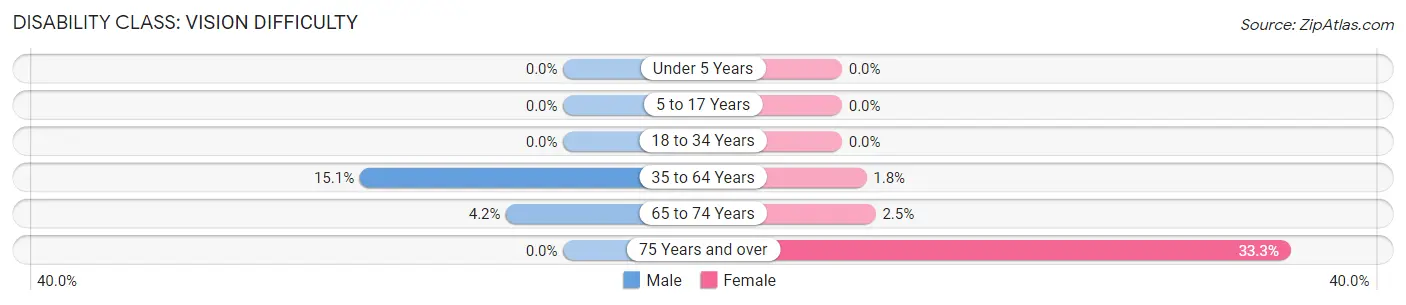
| Age Bracket | Male | Female |
| Under 5 Years | 0 (0.0%) | 0 (0.0%) |
| 5 to 17 Years | 0 (0.0%) | 0 (0.0%) |
| 18 to 34 Years | 0 (0.0%) | 0 (0.0%) |
| 35 to 64 Years | 45 (15.1%) | 4 (1.8%) |
| 65 to 74 Years | 3 (4.2%) | 2 (2.5%) |
| 75 Years and over | 0 (0.0%) | 10 (33.3%) |
Disability Class: Cognitive Difficulty
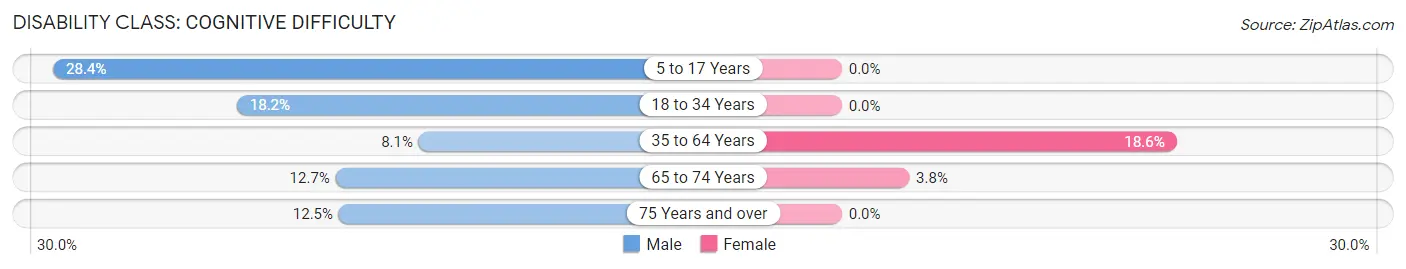
| Age Bracket | Male | Female |
| 5 to 17 Years | 25 (28.4%) | 0 (0.0%) |
| 18 to 34 Years | 16 (18.2%) | 0 (0.0%) |
| 35 to 64 Years | 24 (8.1%) | 41 (18.6%) |
| 65 to 74 Years | 9 (12.7%) | 3 (3.7%) |
| 75 Years and over | 2 (12.5%) | 0 (0.0%) |
Disability Class: Ambulatory Difficulty
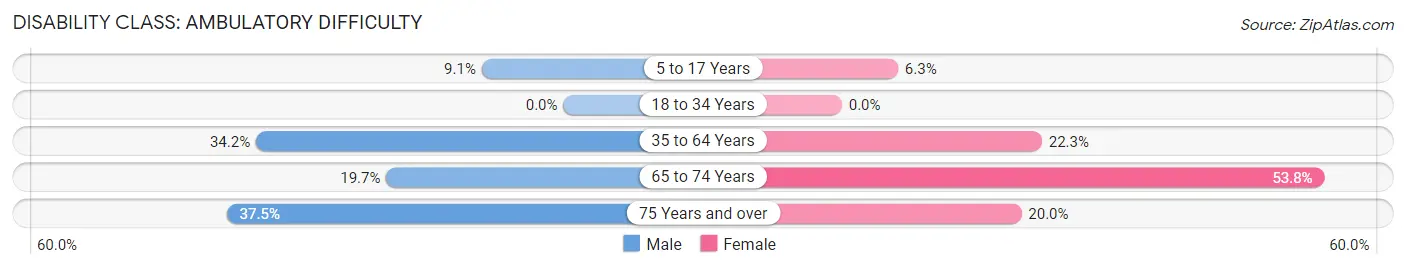
| Age Bracket | Male | Female |
| 5 to 17 Years | 8 (9.1%) | 3 (6.2%) |
| 18 to 34 Years | 0 (0.0%) | 0 (0.0%) |
| 35 to 64 Years | 102 (34.2%) | 49 (22.3%) |
| 65 to 74 Years | 14 (19.7%) | 43 (53.7%) |
| 75 Years and over | 6 (37.5%) | 6 (20.0%) |
Disability Class: Self-Care Difficulty
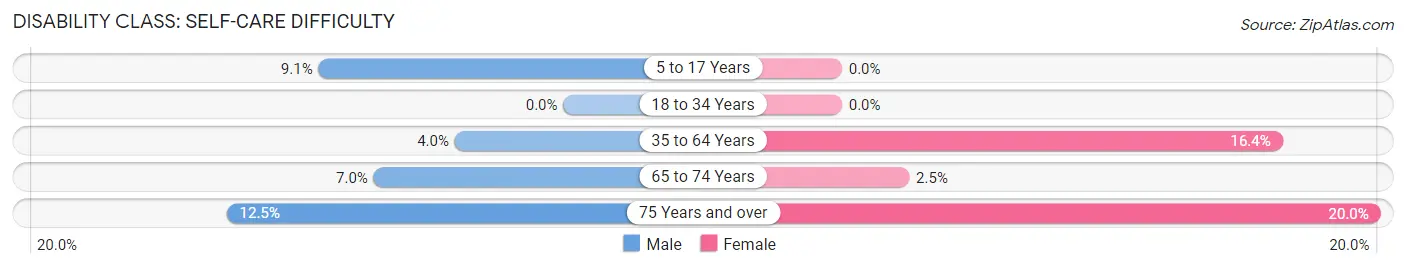
| Age Bracket | Male | Female |
| 5 to 17 Years | 8 (9.1%) | 0 (0.0%) |
| 18 to 34 Years | 0 (0.0%) | 0 (0.0%) |
| 35 to 64 Years | 12 (4.0%) | 36 (16.4%) |
| 65 to 74 Years | 5 (7.0%) | 2 (2.5%) |
| 75 Years and over | 2 (12.5%) | 6 (20.0%) |
Technology Access in Wallace
Computing Device Access in Wallace
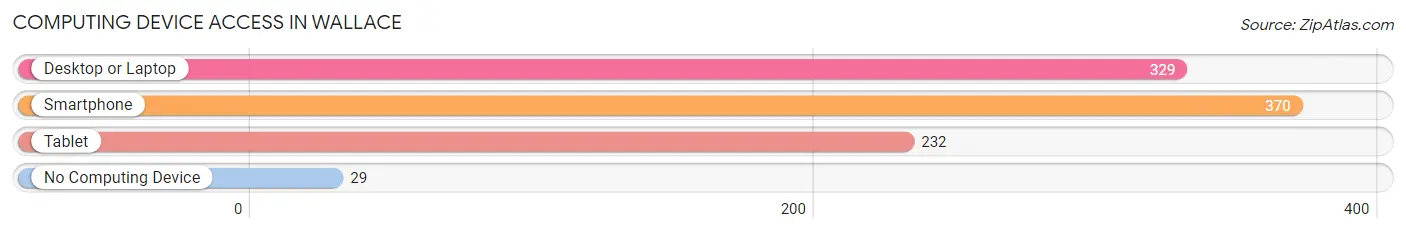
| Device Type | # Households | % Households |
| Desktop or Laptop | 329 | 76.5% |
| Smartphone | 370 | 86.1% |
| Tablet | 232 | 53.9% |
| No Computing Device | 29 | 6.7% |
| Total | 430 | 100.0% |
Internet Access in Wallace
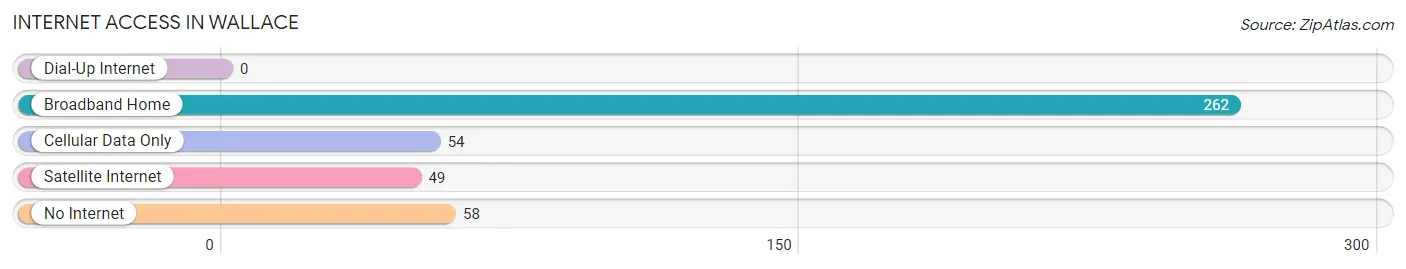
| Internet Type | # Households | % Households |
| Dial-Up Internet | 0 | 0.0% |
| Broadband Home | 262 | 60.9% |
| Cellular Data Only | 54 | 12.6% |
| Satellite Internet | 49 | 11.4% |
| No Internet | 58 | 13.5% |
| Total | 430 | 100.0% |
Wallace Summary
Wallace, Idaho is a small city located in the northern part of the state, in Shoshone County. It is situated in the Coeur d'Alene Mountains, near the Montana border, and is the county seat of Shoshone County. The city has a population of approximately 775 people, according to the 2010 census.
History
The area that is now Wallace was first settled in 1884 by miners who were drawn to the area by the discovery of silver. The city was officially incorporated in 1890, and was named after Colonel W.R. Wallace, who was a prominent figure in the mining industry in the area.
The city quickly grew in size and importance, and by the early 1900s, it was the largest city in the state of Idaho. It was also the center of the mining industry in the region, and was home to several large mining companies.
The city was also the site of the infamous "Battle of the Bulls," which was a shootout between miners and the local sheriff in 1899. The shootout resulted in the death of two miners and the wounding of several others.
Geography
Wallace is located in the northern part of Idaho, in Shoshone County. It is situated in the Coeur d'Alene Mountains, near the Montana border. The city is located at an elevation of 4,945 feet above sea level.
The city is surrounded by mountains and forests, and is home to several lakes and rivers. The nearby Coeur d'Alene River is a popular destination for fishing and other recreational activities.
Economy
The economy of Wallace is largely based on tourism and mining. The city is home to several tourist attractions, including the Wallace Mining Museum, the Northern Pacific Railroad Museum, and the Oasis Bordello Museum.
The city is also home to several mining companies, including Hecla Mining Company, which is the largest silver producer in the United States. The city is also home to several other mining companies, including Coeur d'Alene Mines Corporation and New Jersey Mining Company.
Demographics
According to the 2010 census, the population of Wallace was 775 people. The racial makeup of the city was 95.2% White, 0.4% African American, 0.4% Native American, 0.4% Asian, 0.4% from other races, and 2.2% from two or more races.
The median household income in Wallace was $37,500, and the median family income was $41,250. The per capita income in the city was $19,845. The unemployment rate in Wallace was 6.2%.
Conclusion
Wallace, Idaho is a small city located in the northern part of the state, in Shoshone County. It is situated in the Coeur d'Alene Mountains, near the Montana border, and is the county seat of Shoshone County. The city has a population of approximately 775 people, according to the 2010 census. The economy of Wallace is largely based on tourism and mining, and the city is home to several tourist attractions and mining companies. The racial makeup of the city is 95.2% White, 0.4% African American, 0.4% Native American, 0.4% Asian, 0.4% from other races, and 2.2% from two or more races. The median household income in Wallace was $37,500, and the median family income was $41,250. The per capita income in the city was $19,845. The unemployment rate in Wallace was 6.2%.
Common Questions
What is Per Capita Income in Wallace?
Per Capita income in Wallace is $27,110.
What is the Median Family Income in Wallace?
Median Family Income in Wallace is $76,583.
What is the Median Household income in Wallace?
Median Household Income in Wallace is $49,052.
What is Inequality or Gini Index in Wallace?
Inequality or Gini Index in Wallace is 0.40.
What is the Total Population of Wallace?
Total Population of Wallace is 1,083.
What is the Total Male Population of Wallace?
Total Male Population of Wallace is 619.
What is the Total Female Population of Wallace?
Total Female Population of Wallace is 464.
What is the Ratio of Males per 100 Females in Wallace?
There are 133.41 Males per 100 Females in Wallace.
What is the Ratio of Females per 100 Males in Wallace?
There are 74.96 Females per 100 Males in Wallace.
What is the Median Population Age in Wallace?
Median Population Age in Wallace is 43.1 Years.
What is the Average Family Size in Wallace
Average Family Size in Wallace is 3.2 People.
What is the Average Household Size in Wallace
Average Household Size in Wallace is 2.5 People.
How Large is the Labor Force in Wallace?
There are 461 People in the Labor Forcein in Wallace.
What is the Percentage of People in the Labor Force in Wallace?
50.7% of People are in the Labor Force in Wallace.
What is the Unemployment Rate in Wallace?
Unemployment Rate in Wallace is 3.5%.