Osburn, ID Map & Demographics
Osburn Map
Osburn Overview
$27,350
PER CAPITA INCOME
$49,265
AVG FAMILY INCOME
$41,833
AVG HOUSEHOLD INCOME
68.8%
WAGE / INCOME GAP [ % ]
31.2¢/ $1
WAGE / INCOME GAP [ $ ]
0.39
INEQUALITY / GINI INDEX
1,625
TOTAL POPULATION
787
MALE POPULATION
838
FEMALE POPULATION
93.91
MALES / 100 FEMALES
106.48
FEMALES / 100 MALES
45.6
MEDIAN AGE
2.9
AVG FAMILY SIZE
2.0
AVG HOUSEHOLD SIZE
783
LABOR FORCE [ PEOPLE ]
59.2%
PERCENT IN LABOR FORCE
3.7%
UNEMPLOYMENT RATE
Osburn Zip Codes
Osburn Area Codes
Income in Osburn
Income Overview in Osburn
Per Capita Income in Osburn is $27,350, while median incomes of families and households are $49,265 and $41,833 respectively.
| Characteristic | Number | Measure |
| Per Capita Income | 1,625 | $27,350 |
| Median Family Income | 354 | $49,265 |
| Mean Family Income | 354 | $65,438 |
| Median Household Income | 812 | $41,833 |
| Mean Household Income | 812 | $54,298 |
| Income Deficit | 354 | $0 |
| Wage / Income Gap (%) | 1,625 | 68.79% |
| Wage / Income Gap ($) | 1,625 | 31.21¢ per $1 |
| Gini / Inequality Index | 1,625 | 0.39 |
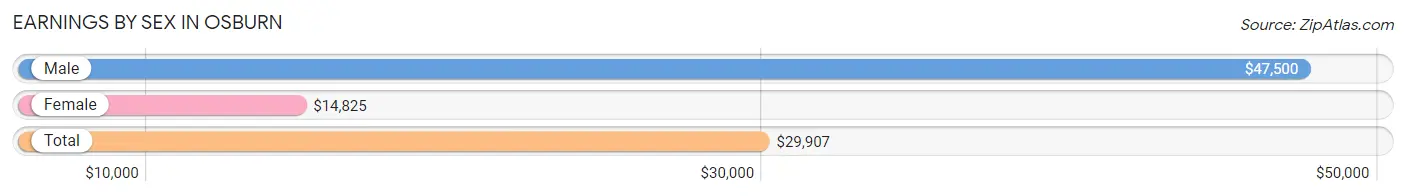
Earnings by Sex in Osburn
Average Earnings in Osburn are $29,907, $47,500 for men and $14,825 for women, a difference of 68.8%.
| Sex | Number | Average Earnings |
| Male | 418 (53.4%) | $47,500 |
| Female | 364 (46.6%) | $14,825 |
| Total | 782 (100.0%) | $29,907 |
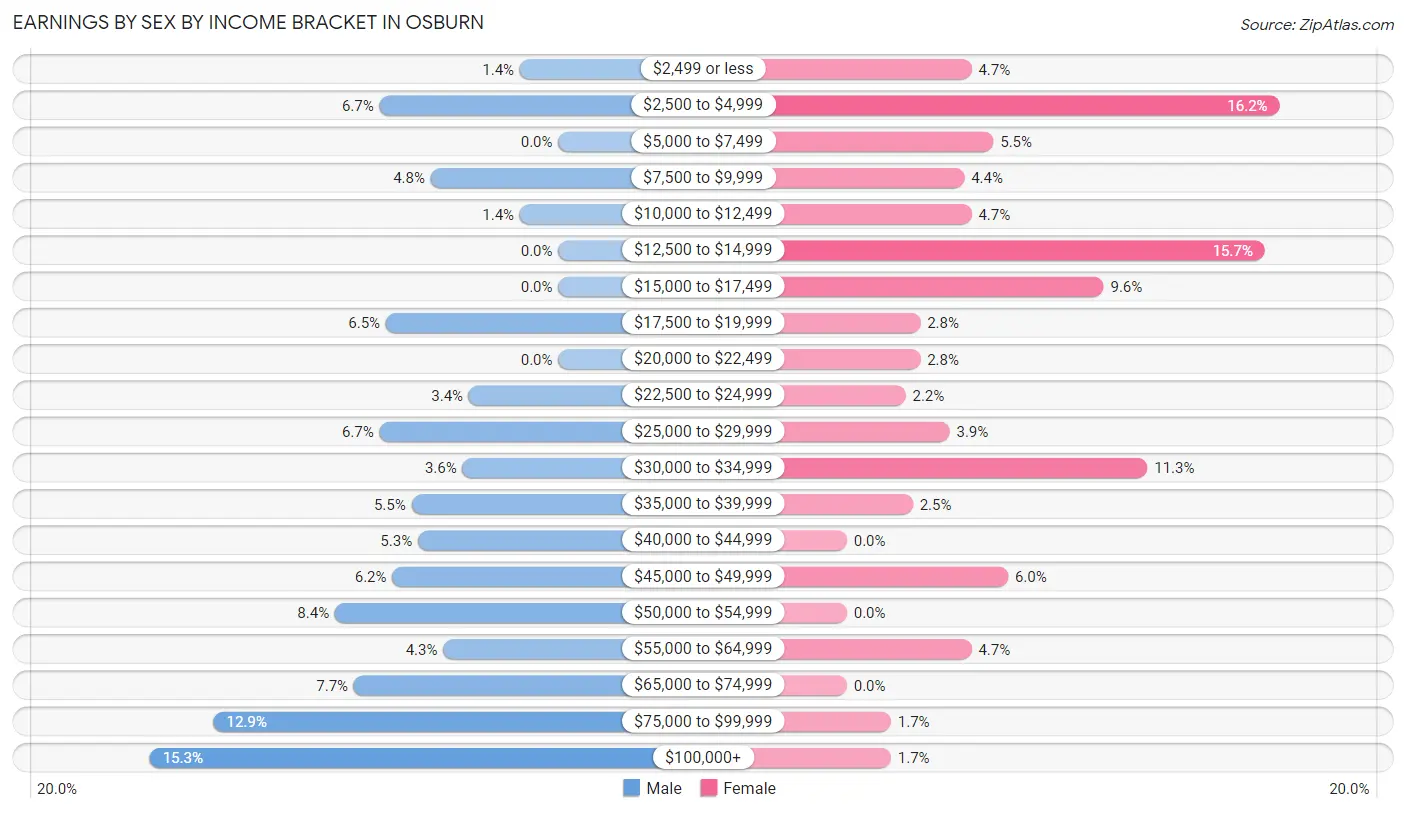
Earnings by Sex by Income Bracket in Osburn
The most common earnings brackets in Osburn are $100,000+ for men (64 | 15.3%) and $2,500 to $4,999 for women (59 | 16.2%).
| Income | Male | Female |
| $2,499 or less | 6 (1.4%) | 17 (4.7%) |
| $2,500 to $4,999 | 28 (6.7%) | 59 (16.2%) |
| $5,000 to $7,499 | 0 (0.0%) | 20 (5.5%) |
| $7,500 to $9,999 | 20 (4.8%) | 16 (4.4%) |
| $10,000 to $12,499 | 6 (1.4%) | 17 (4.7%) |
| $12,500 to $14,999 | 0 (0.0%) | 57 (15.7%) |
| $15,000 to $17,499 | 0 (0.0%) | 35 (9.6%) |
| $17,500 to $19,999 | 27 (6.5%) | 10 (2.8%) |
| $20,000 to $22,499 | 0 (0.0%) | 10 (2.8%) |
| $22,500 to $24,999 | 14 (3.4%) | 8 (2.2%) |
| $25,000 to $29,999 | 28 (6.7%) | 14 (3.8%) |
| $30,000 to $34,999 | 15 (3.6%) | 41 (11.3%) |
| $35,000 to $39,999 | 23 (5.5%) | 9 (2.5%) |
| $40,000 to $44,999 | 22 (5.3%) | 0 (0.0%) |
| $45,000 to $49,999 | 26 (6.2%) | 22 (6.0%) |
| $50,000 to $54,999 | 35 (8.4%) | 0 (0.0%) |
| $55,000 to $64,999 | 18 (4.3%) | 17 (4.7%) |
| $65,000 to $74,999 | 32 (7.7%) | 0 (0.0%) |
| $75,000 to $99,999 | 54 (12.9%) | 6 (1.7%) |
| $100,000+ | 64 (15.3%) | 6 (1.7%) |
| Total | 418 (100.0%) | 364 (100.0%) |
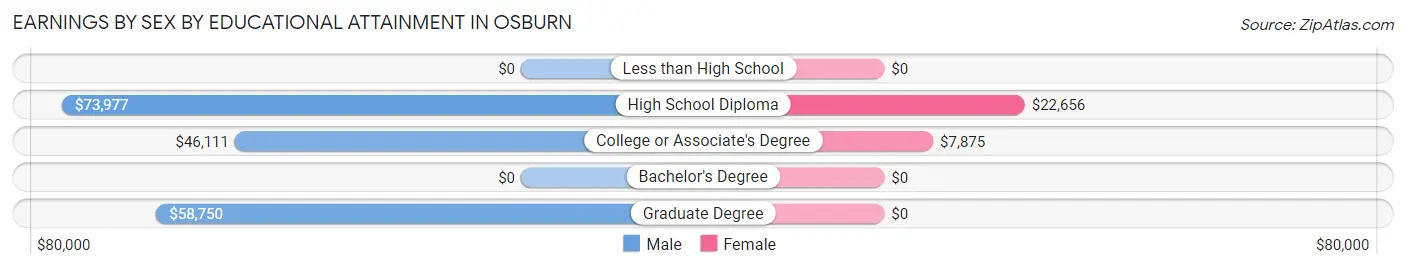
Earnings by Sex by Educational Attainment in Osburn
Average earnings in Osburn are $51,071 for men and $14,496 for women, a difference of 71.6%. Men with an educational attainment of high school diploma enjoy the highest average annual earnings of $73,977, while those with college or associate's degree education earn the least with $46,111. Women with an educational attainment of high school diploma earn the most with the average annual earnings of $22,656, while those with college or associate's degree education have the smallest earnings of $7,875.
| Educational Attainment | Male Income | Female Income |
| Less than High School | - | - |
| High School Diploma | $73,977 | $22,656 |
| College or Associate's Degree | $46,111 | $7,875 |
| Bachelor's Degree | - | - |
| Graduate Degree | $58,750 | $0 |
| Total | $51,071 | $14,496 |
Family Income in Osburn
Family Income Brackets in Osburn
According to the Osburn family income data, there are 83 families falling into the $35,000 to $49,999 income range, which is the most common income bracket and makes up 23.4% of all families.
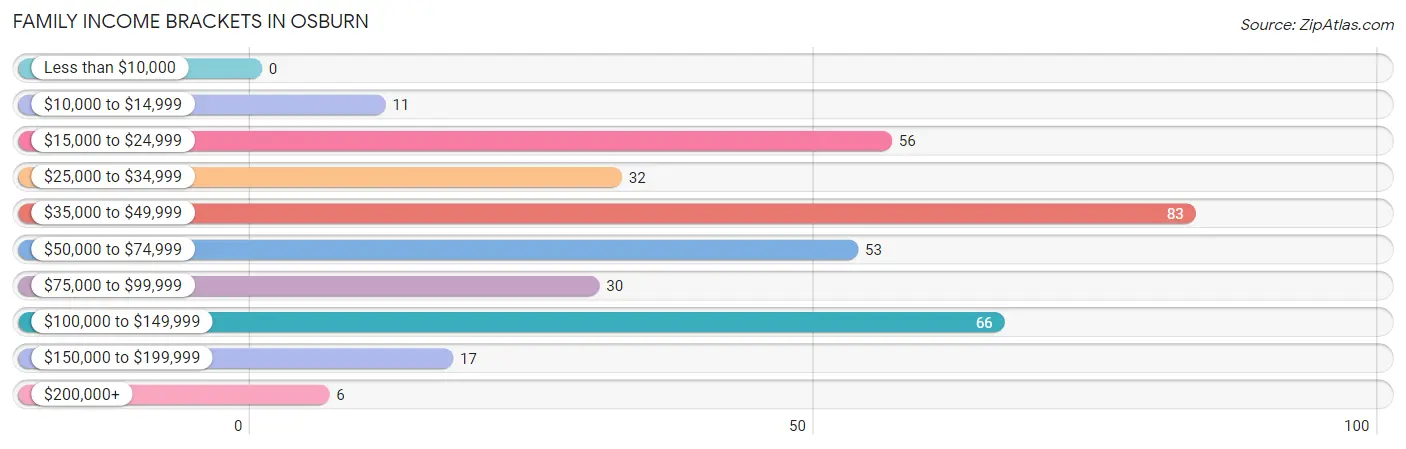
| Income Bracket | # Families | % Families |
| Less than $10,000 | 0 | 0.0% |
| $10,000 to $14,999 | 11 | 3.1% |
| $15,000 to $24,999 | 56 | 15.8% |
| $25,000 to $34,999 | 32 | 9.0% |
| $35,000 to $49,999 | 83 | 23.4% |
| $50,000 to $74,999 | 53 | 15.0% |
| $75,000 to $99,999 | 30 | 8.5% |
| $100,000 to $149,999 | 66 | 18.6% |
| $150,000 to $199,999 | 17 | 4.8% |
| $200,000+ | 6 | 1.7% |
Family Income by Famaliy Size in Osburn
4-person families (20 | 5.7%) account for the highest median family income in Osburn with $83,929 per family, while 3-person families (105 | 29.7%) have the highest median income of $24,120 per family member.
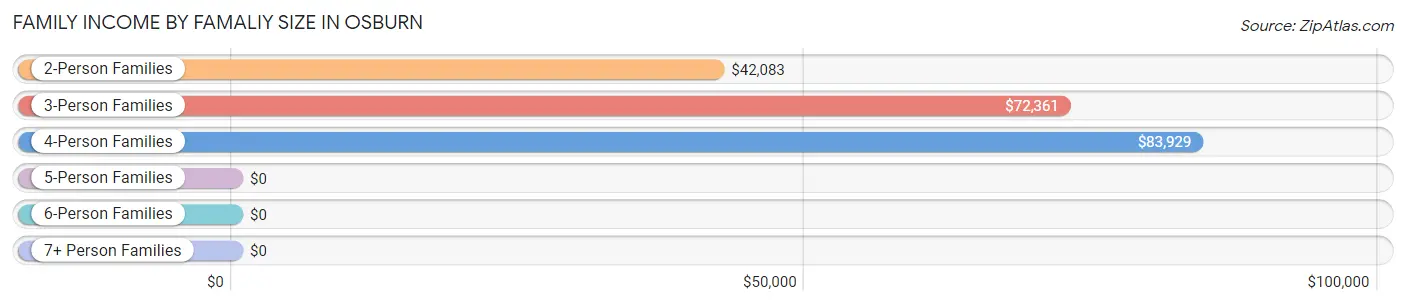
| Income Bracket | # Families | Median Income |
| 2-Person Families | 195 (55.1%) | $42,083 |
| 3-Person Families | 105 (29.7%) | $72,361 |
| 4-Person Families | 20 (5.7%) | $83,929 |
| 5-Person Families | 0 (0.0%) | $0 |
| 6-Person Families | 21 (5.9%) | $0 |
| 7+ Person Families | 13 (3.7%) | $0 |
| Total | 354 (100.0%) | $49,265 |
Family Income by Number of Earners in Osburn
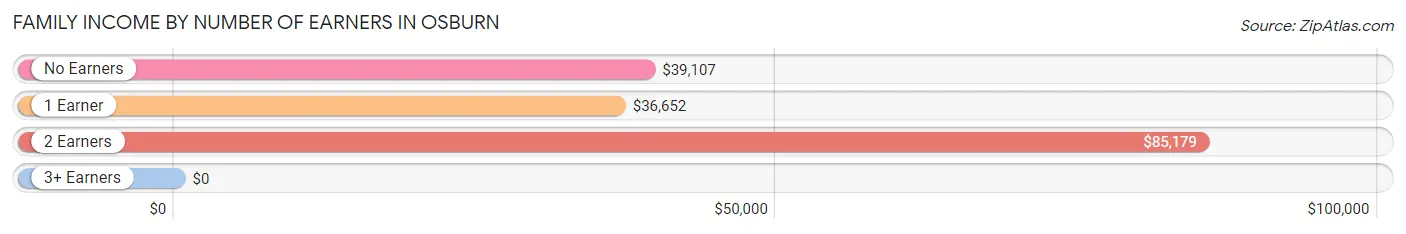
| Number of Earners | # Families | Median Income |
| No Earners | 59 (16.7%) | $39,107 |
| 1 Earner | 177 (50.0%) | $36,652 |
| 2 Earners | 97 (27.4%) | $85,179 |
| 3+ Earners | 21 (5.9%) | $0 |
| Total | 354 (100.0%) | $49,265 |
Household Income in Osburn
Household Income Brackets in Osburn
With 162 households falling in the category, the $35,000 to $49,999 income range is the most frequent in Osburn, accounting for 20.0% of all households. In contrast, only 6 households (0.7%) fall into the $200,000+ income bracket, making it the least populous group.
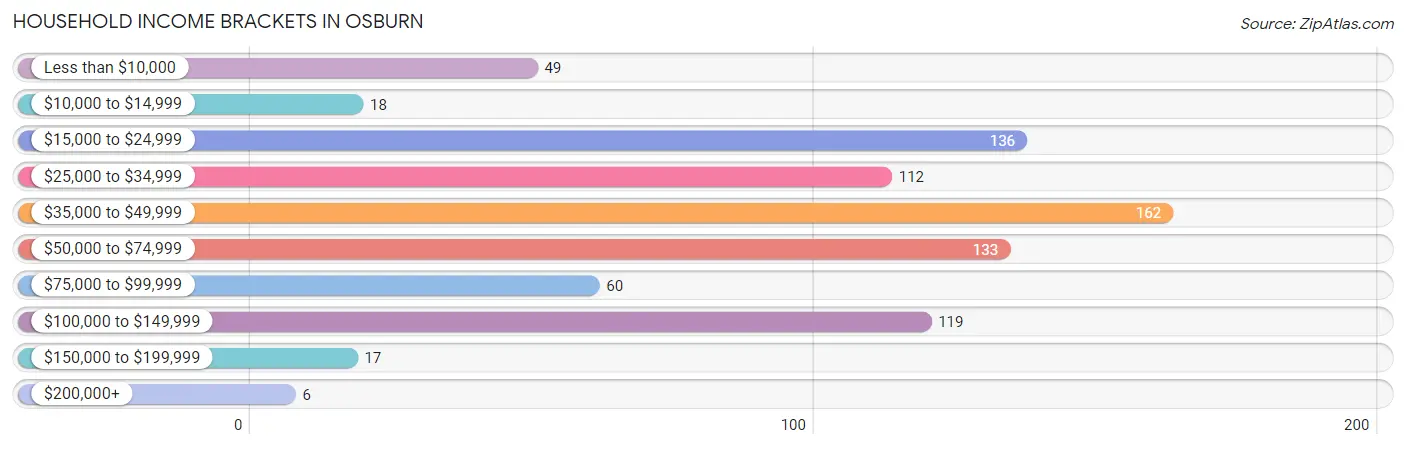
| Income Bracket | # Households | % Households |
| Less than $10,000 | 49 | 6.0% |
| $10,000 to $14,999 | 18 | 2.2% |
| $15,000 to $24,999 | 136 | 16.7% |
| $25,000 to $34,999 | 112 | 13.8% |
| $35,000 to $49,999 | 162 | 20.0% |
| $50,000 to $74,999 | 133 | 16.4% |
| $75,000 to $99,999 | 60 | 7.4% |
| $100,000 to $149,999 | 119 | 14.7% |
| $150,000 to $199,999 | 17 | 2.1% |
| $200,000+ | 6 | 0.7% |
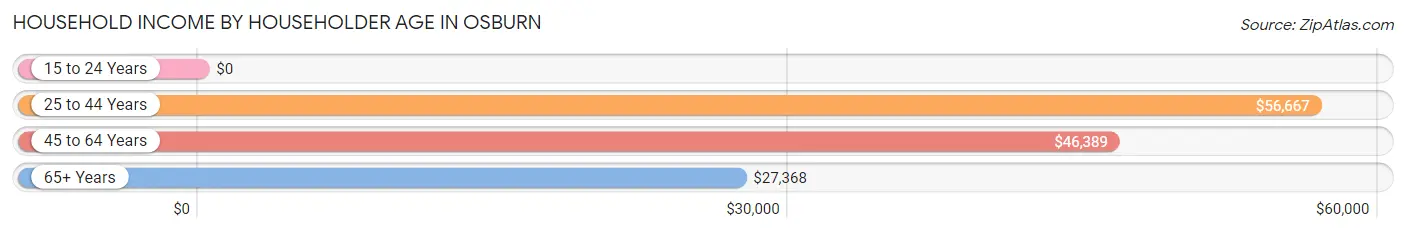
Household Income by Householder Age in Osburn
The median household income in Osburn is $41,833, with the highest median household income of $56,667 found in the 25 to 44 years age bracket for the primary householder. A total of 212 households (26.1%) fall into this category. Meanwhile, the 15 to 24 years age bracket for the primary householder has the lowest median household income of $0, with 10 households (1.2%) in this group.
| Income Bracket | # Households | Median Income |
| 15 to 24 Years | 10 (1.2%) | $0 |
| 25 to 44 Years | 212 (26.1%) | $56,667 |
| 45 to 64 Years | 300 (36.9%) | $46,389 |
| 65+ Years | 290 (35.7%) | $27,368 |
| Total | 812 (100.0%) | $41,833 |
Poverty in Osburn
Income Below Poverty by Sex and Age in Osburn
With 12.7% poverty level for males and 16.6% for females among the residents of Osburn, 12 to 14 year old males and 18 to 24 year old females are the most vulnerable to poverty, with 20 males (100.0%) and 42 females (60.9%) in their respective age groups living below the poverty level.
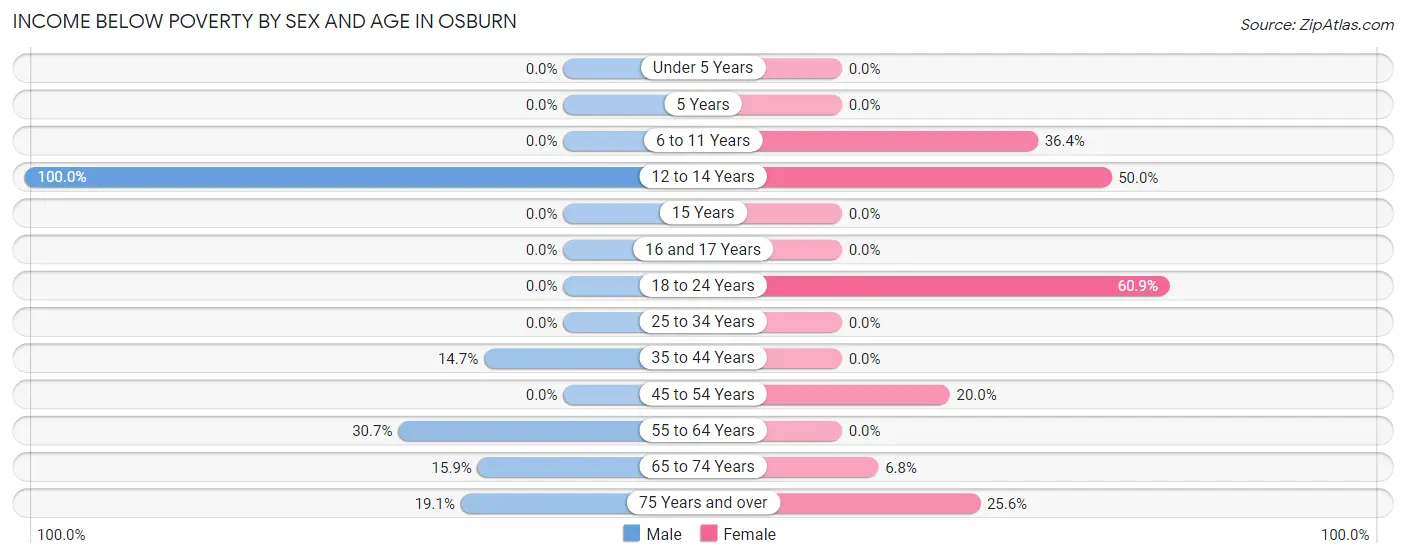
| Age Bracket | Male | Female |
| Under 5 Years | 0 (0.0%) | 0 (0.0%) |
| 5 Years | 0 (0.0%) | 0 (0.0%) |
| 6 to 11 Years | 0 (0.0%) | 16 (36.4%) |
| 12 to 14 Years | 20 (100.0%) | 22 (50.0%) |
| 15 Years | 0 (0.0%) | 0 (0.0%) |
| 16 and 17 Years | 0 (0.0%) | 0 (0.0%) |
| 18 to 24 Years | 0 (0.0%) | 42 (60.9%) |
| 25 to 34 Years | 0 (0.0%) | 0 (0.0%) |
| 35 to 44 Years | 19 (14.7%) | 0 (0.0%) |
| 45 to 54 Years | 0 (0.0%) | 19 (20.0%) |
| 55 to 64 Years | 38 (30.6%) | 0 (0.0%) |
| 65 to 74 Years | 14 (15.9%) | 10 (6.8%) |
| 75 Years and over | 8 (19.1%) | 30 (25.6%) |
| Total | 99 (12.7%) | 139 (16.6%) |
Income Above Poverty by Sex and Age in Osburn
According to the poverty statistics in Osburn, males aged under 5 years and females aged under 5 years are the age groups that are most secure financially, with 100.0% of males and 100.0% of females in these age groups living above the poverty line.
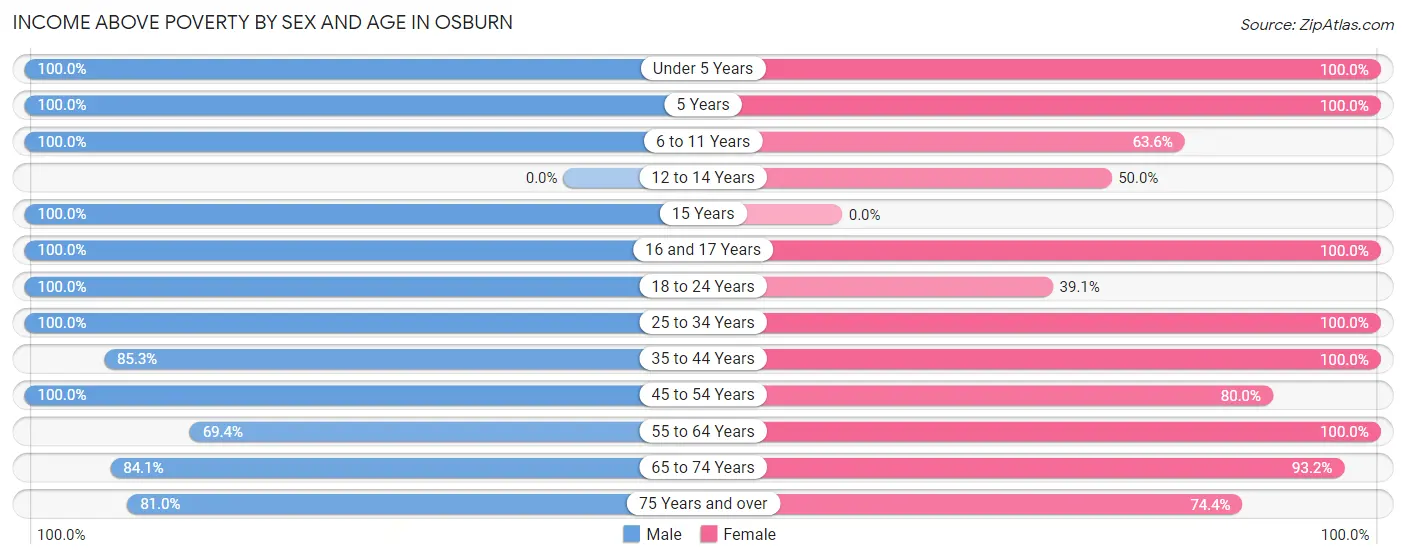
| Age Bracket | Male | Female |
| Under 5 Years | 54 (100.0%) | 57 (100.0%) |
| 5 Years | 11 (100.0%) | 17 (100.0%) |
| 6 to 11 Years | 41 (100.0%) | 28 (63.6%) |
| 12 to 14 Years | 0 (0.0%) | 22 (50.0%) |
| 15 Years | 6 (100.0%) | 0 (0.0%) |
| 16 and 17 Years | 30 (100.0%) | 7 (100.0%) |
| 18 to 24 Years | 42 (100.0%) | 27 (39.1%) |
| 25 to 34 Years | 82 (100.0%) | 49 (100.0%) |
| 35 to 44 Years | 110 (85.3%) | 86 (100.0%) |
| 45 to 54 Years | 110 (100.0%) | 76 (80.0%) |
| 55 to 64 Years | 86 (69.4%) | 105 (100.0%) |
| 65 to 74 Years | 74 (84.1%) | 138 (93.2%) |
| 75 Years and over | 34 (80.9%) | 87 (74.4%) |
| Total | 680 (87.3%) | 699 (83.4%) |
Income Below Poverty Among Married-Couple Families in Osburn
The poverty statistics for married-couple families in Osburn show that 6.4% or 18 of the total 281 families live below the poverty line. Families with no children have the highest poverty rate of 9.2%, comprising of 18 families. On the other hand, families with 1 or 2 children have the lowest poverty rate of 0.0%, which includes 0 families.
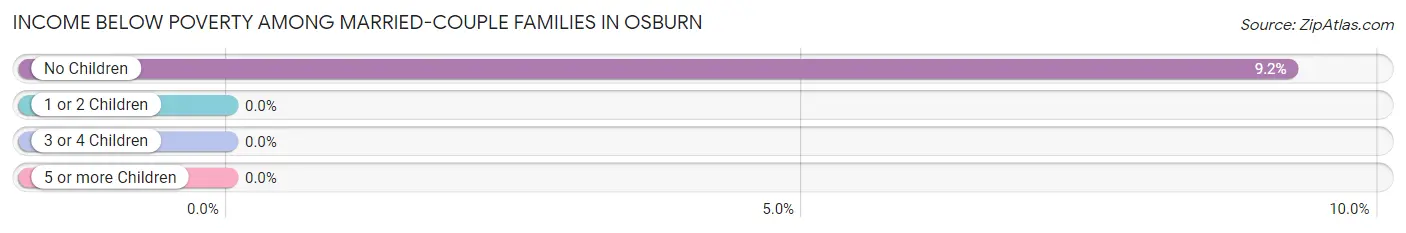
| Children | Above Poverty | Below Poverty |
| No Children | 177 (90.8%) | 18 (9.2%) |
| 1 or 2 Children | 65 (100.0%) | 0 (0.0%) |
| 3 or 4 Children | 21 (100.0%) | 0 (0.0%) |
| 5 or more Children | 0 (0.0%) | 0 (0.0%) |
| Total | 263 (93.6%) | 18 (6.4%) |
Income Below Poverty Among Single-Parent Households in Osburn
According to the poverty data in Osburn, 42.2% or 19 single-father households and 39.3% or 11 single-mother households are living below the poverty line. Among single-father households, those with 1 or 2 children have the highest poverty rate, with 19 households (59.4%) experiencing poverty. Likewise, among single-mother households, those with 1 or 2 children have the highest poverty rate, with 11 households (45.8%) falling below the poverty line.
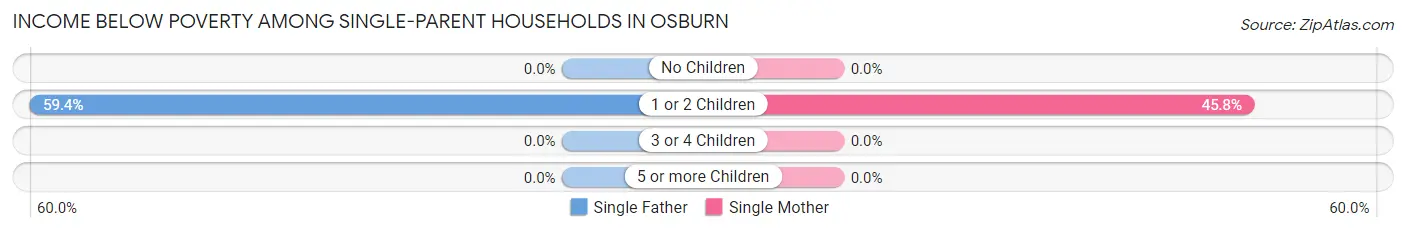
| Children | Single Father | Single Mother |
| No Children | 0 (0.0%) | 0 (0.0%) |
| 1 or 2 Children | 19 (59.4%) | 11 (45.8%) |
| 3 or 4 Children | 0 (0.0%) | 0 (0.0%) |
| 5 or more Children | 0 (0.0%) | 0 (0.0%) |
| Total | 19 (42.2%) | 11 (39.3%) |
Income Below Poverty Among Married-Couple vs Single-Parent Households in Osburn
The poverty data for Osburn shows that 18 of the married-couple family households (6.4%) and 30 of the single-parent households (41.1%) are living below the poverty level. Within the married-couple family households, those with no children have the highest poverty rate, with 18 households (9.2%) falling below the poverty line. Among the single-parent households, those with 1 or 2 children have the highest poverty rate, with 30 household (53.6%) living below poverty.
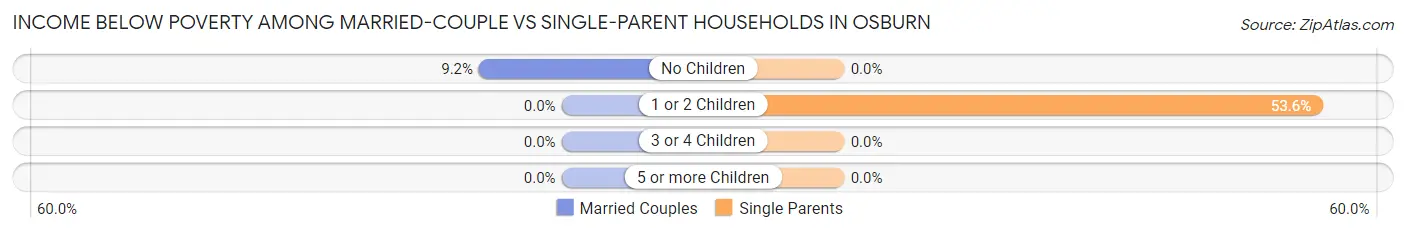
| Children | Married-Couple Families | Single-Parent Households |
| No Children | 18 (9.2%) | 0 (0.0%) |
| 1 or 2 Children | 0 (0.0%) | 30 (53.6%) |
| 3 or 4 Children | 0 (0.0%) | 0 (0.0%) |
| 5 or more Children | 0 (0.0%) | 0 (0.0%) |
| Total | 18 (6.4%) | 30 (41.1%) |
Race in Osburn
The most populous races in Osburn are White / Caucasian (1,516 | 93.3%), Hispanic or Latino (91 | 5.6%), and Two or more Races (60 | 3.7%).
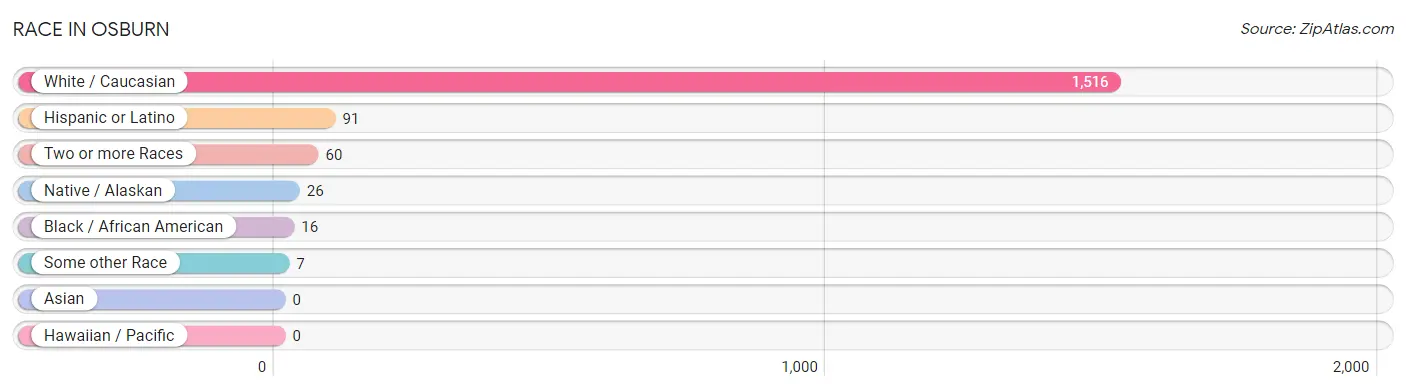
| Race | # Population | % Population |
| Asian | 0 | 0.0% |
| Black / African American | 16 | 1.0% |
| Hawaiian / Pacific | 0 | 0.0% |
| Hispanic or Latino | 91 | 5.6% |
| Native / Alaskan | 26 | 1.6% |
| White / Caucasian | 1,516 | 93.3% |
| Two or more Races | 60 | 3.7% |
| Some other Race | 7 | 0.4% |
| Total | 1,625 | 100.0% |
Ancestry in Osburn
The most populous ancestries reported in Osburn are German (546 | 33.6%), Irish (172 | 10.6%), English (170 | 10.5%), Norwegian (104 | 6.4%), and Italian (92 | 5.7%), together accounting for 66.7% of all Osburn residents.
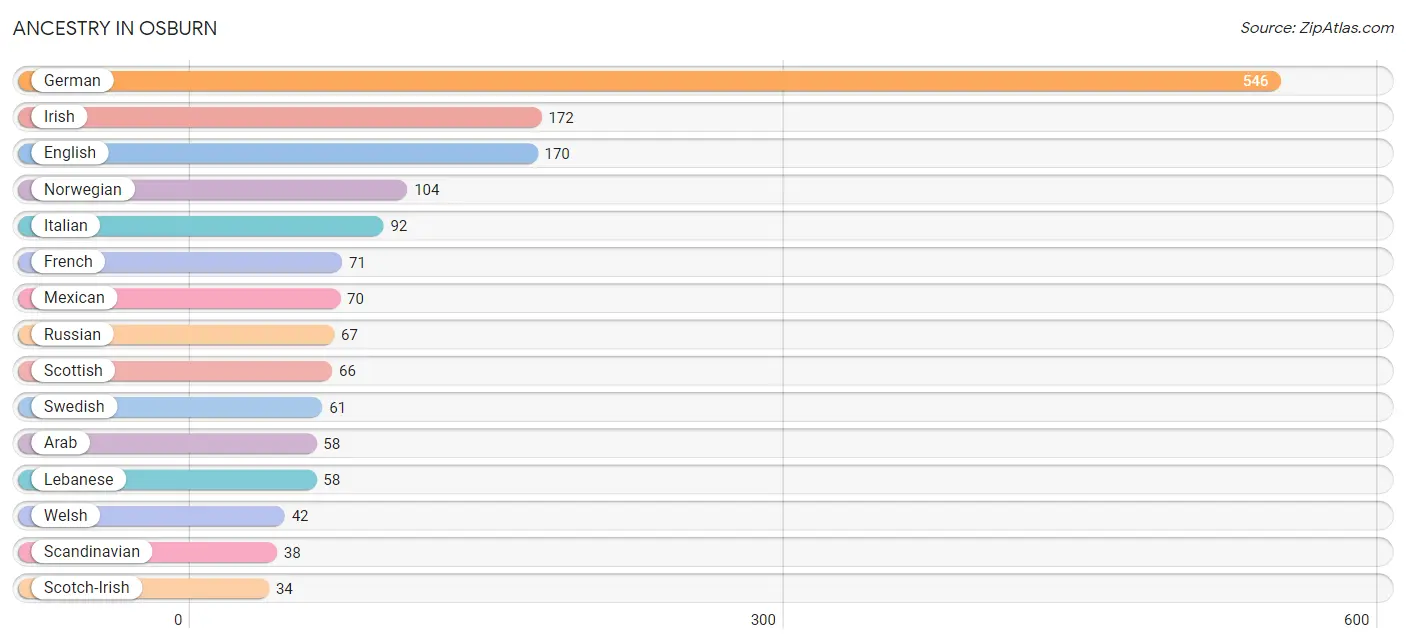
| Ancestry | # Population | % Population |
| American | 33 | 2.0% |
| Arab | 58 | 3.6% |
| British | 17 | 1.1% |
| Cherokee | 27 | 1.7% |
| Dutch | 7 | 0.4% |
| Eastern European | 30 | 1.8% |
| English | 170 | 10.5% |
| Finnish | 5 | 0.3% |
| French | 71 | 4.4% |
| French Canadian | 6 | 0.4% |
| German | 546 | 33.6% |
| Irish | 172 | 10.6% |
| Italian | 92 | 5.7% |
| Lebanese | 58 | 3.6% |
| Mexican | 70 | 4.3% |
| Northern European | 7 | 0.4% |
| Norwegian | 104 | 6.4% |
| Polish | 33 | 2.0% |
| Russian | 67 | 4.1% |
| Scandinavian | 38 | 2.3% |
| Scotch-Irish | 34 | 2.1% |
| Scottish | 66 | 4.1% |
| Spaniard | 10 | 0.6% |
| Spanish | 11 | 0.7% |
| Swedish | 61 | 3.7% |
| Swiss | 3 | 0.2% |
| Welsh | 42 | 2.6% |
| Yugoslavian | 10 | 0.6% | View All 28 Rows |
Immigrants in Osburn
The most numerous immigrant groups reported in Osburn came from Europe (50 | 3.1%), Germany (32 | 2.0%), Western Europe (32 | 2.0%), Bosnia and Herzegovina (10 | 0.6%), and Eastern Europe (10 | 0.6%), together accounting for 8.3% of all Osburn residents.
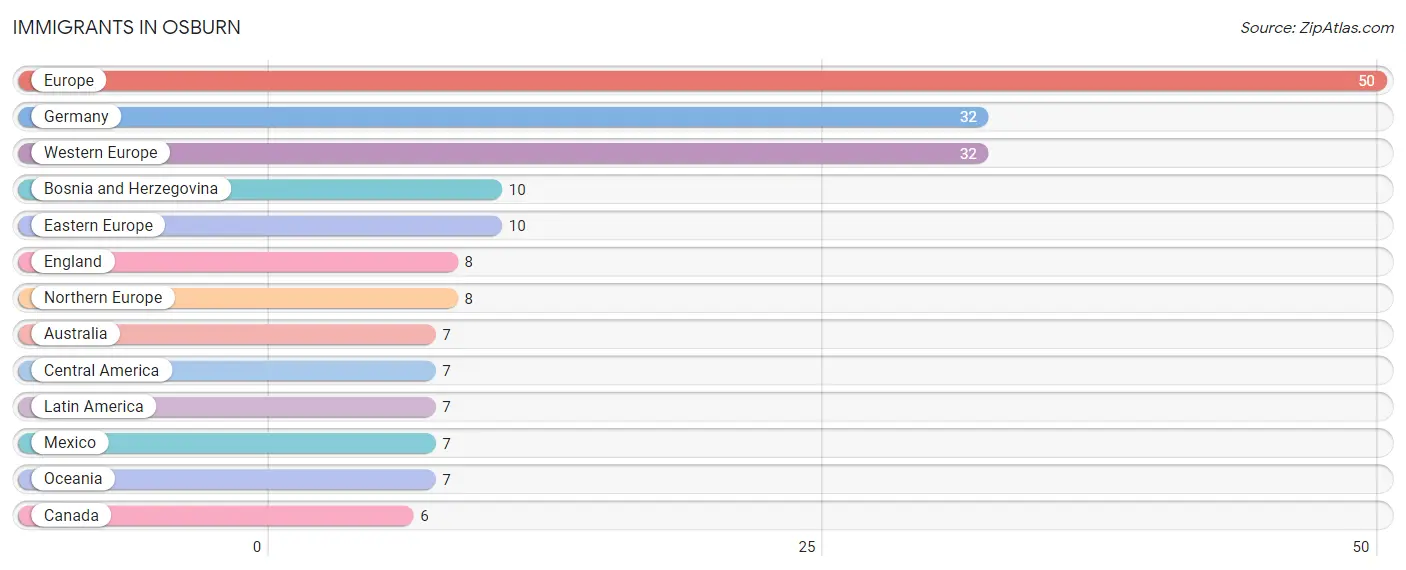
| Immigration Origin | # Population | % Population |
| Australia | 7 | 0.4% |
| Bosnia and Herzegovina | 10 | 0.6% |
| Canada | 6 | 0.4% |
| Central America | 7 | 0.4% |
| Eastern Europe | 10 | 0.6% |
| England | 8 | 0.5% |
| Europe | 50 | 3.1% |
| Germany | 32 | 2.0% |
| Latin America | 7 | 0.4% |
| Mexico | 7 | 0.4% |
| Northern Europe | 8 | 0.5% |
| Oceania | 7 | 0.4% |
| Western Europe | 32 | 2.0% | View All 13 Rows |
Sex and Age in Osburn
Sex and Age in Osburn
The most populous age groups in Osburn are 40 to 44 Years (95 | 12.1%) for men and 70 to 74 Years (122 | 14.6%) for women.
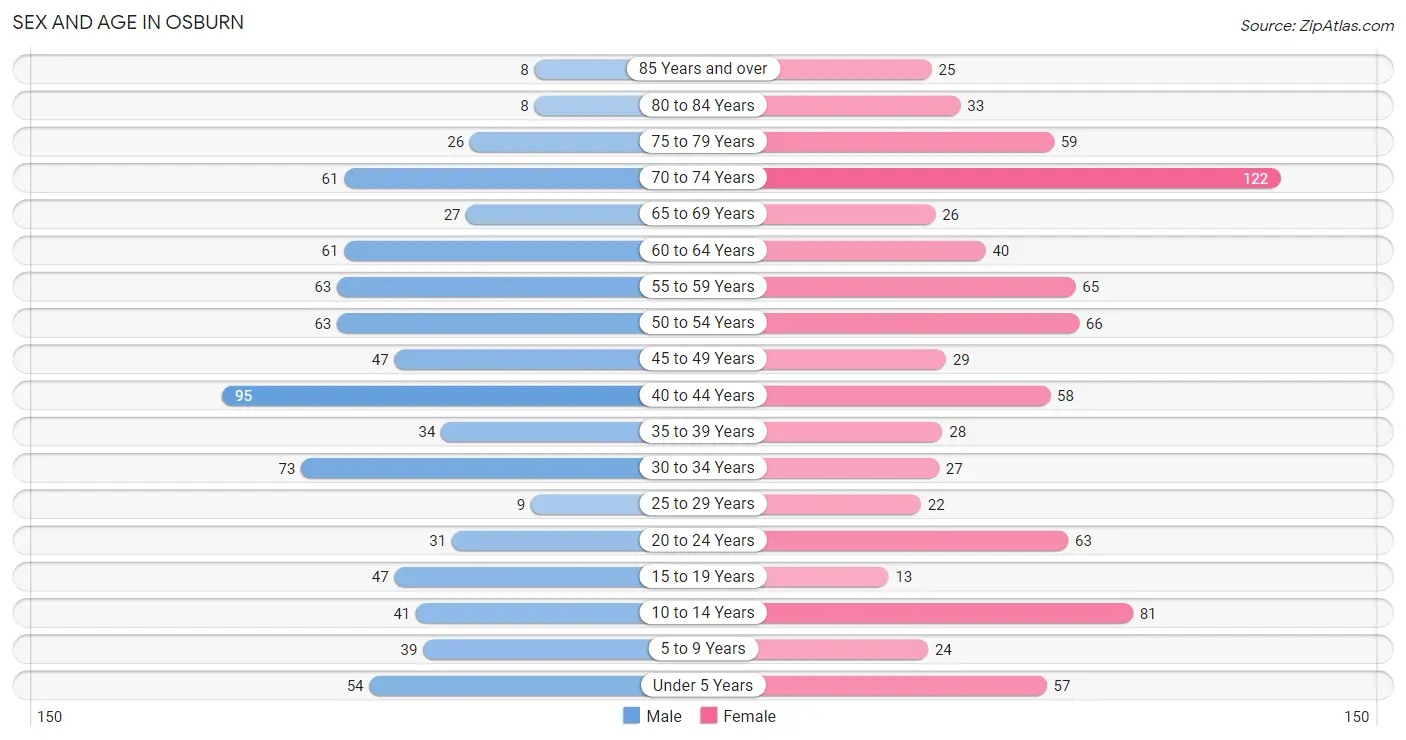
| Age Bracket | Male | Female |
| Under 5 Years | 54 (6.9%) | 57 (6.8%) |
| 5 to 9 Years | 39 (5.0%) | 24 (2.9%) |
| 10 to 14 Years | 41 (5.2%) | 81 (9.7%) |
| 15 to 19 Years | 47 (6.0%) | 13 (1.5%) |
| 20 to 24 Years | 31 (3.9%) | 63 (7.5%) |
| 25 to 29 Years | 9 (1.1%) | 22 (2.6%) |
| 30 to 34 Years | 73 (9.3%) | 27 (3.2%) |
| 35 to 39 Years | 34 (4.3%) | 28 (3.3%) |
| 40 to 44 Years | 95 (12.1%) | 58 (6.9%) |
| 45 to 49 Years | 47 (6.0%) | 29 (3.5%) |
| 50 to 54 Years | 63 (8.0%) | 66 (7.9%) |
| 55 to 59 Years | 63 (8.0%) | 65 (7.8%) |
| 60 to 64 Years | 61 (7.7%) | 40 (4.8%) |
| 65 to 69 Years | 27 (3.4%) | 26 (3.1%) |
| 70 to 74 Years | 61 (7.7%) | 122 (14.6%) |
| 75 to 79 Years | 26 (3.3%) | 59 (7.0%) |
| 80 to 84 Years | 8 (1.0%) | 33 (3.9%) |
| 85 Years and over | 8 (1.0%) | 25 (3.0%) |
| Total | 787 (100.0%) | 838 (100.0%) |
Families and Households in Osburn
Median Family Size in Osburn
The median family size in Osburn is 2.92 persons per family, with single male/father families (45 | 12.7%) accounting for the largest median family size of 4.44 persons per family. On the other hand, single female/mother families (28 | 7.9%) represent the smallest median family size with 2.00 persons per family.
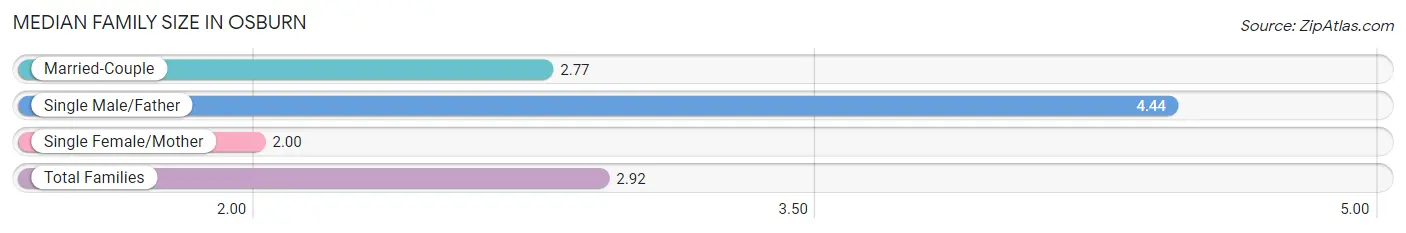
| Family Type | # Families | Family Size |
| Married-Couple | 281 (79.4%) | 2.77 |
| Single Male/Father | 45 (12.7%) | 4.44 |
| Single Female/Mother | 28 (7.9%) | 2.00 |
| Total Families | 354 (100.0%) | 2.92 |
Median Household Size in Osburn
The median household size in Osburn is 2.00 persons per household, with single male/father households (45 | 5.5%) accounting for the largest median household size of 5.18 persons per household. non-family households (458 | 56.4%) represent the smallest median household size with 1.22 persons per household.
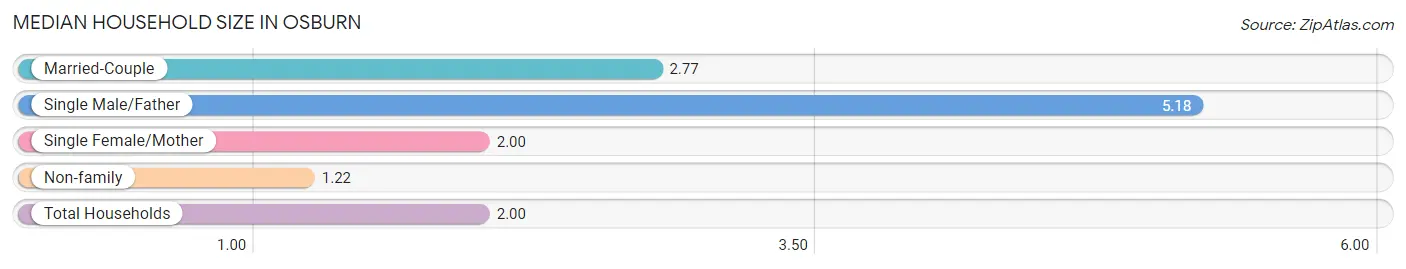
| Household Type | # Households | Household Size |
| Married-Couple | 281 (34.6%) | 2.77 |
| Single Male/Father | 45 (5.5%) | 5.18 |
| Single Female/Mother | 28 (3.5%) | 2.00 |
| Non-family | 458 (56.4%) | 1.22 |
| Total Households | 812 (100.0%) | 2.00 |
Household Size by Marriage Status in Osburn
Out of a total of 812 households in Osburn, 354 (43.6%) are family households, while 458 (56.4%) are nonfamily households. The most numerous type of family households are 2-person households, comprising 195, and the most common type of nonfamily households are 1-person households, comprising 408.
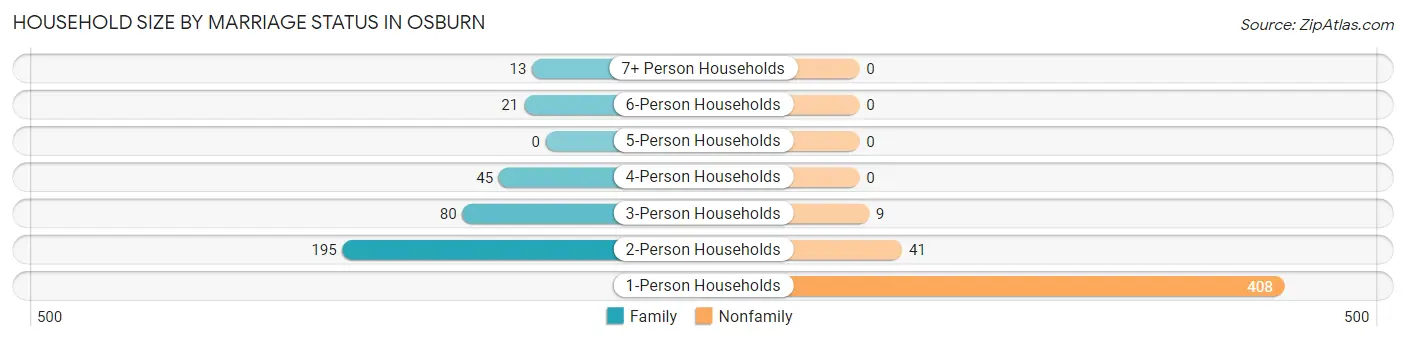
| Household Size | Family Households | Nonfamily Households |
| 1-Person Households | - | 408 (50.2%) |
| 2-Person Households | 195 (24.0%) | 41 (5.1%) |
| 3-Person Households | 80 (9.9%) | 9 (1.1%) |
| 4-Person Households | 45 (5.5%) | 0 (0.0%) |
| 5-Person Households | 0 (0.0%) | 0 (0.0%) |
| 6-Person Households | 21 (2.6%) | 0 (0.0%) |
| 7+ Person Households | 13 (1.6%) | 0 (0.0%) |
| Total | 354 (43.6%) | 458 (56.4%) |
Female Fertility in Osburn
Fertility by Age in Osburn
Average fertility rate in Osburn is 48.0 births per 1,000 women. Women in the age bracket of 20 to 34 years have the highest fertility rate with 107.0 births per 1,000 women. Women in the age bracket of 20 to 34 years acount for 100.0% of all women with births.
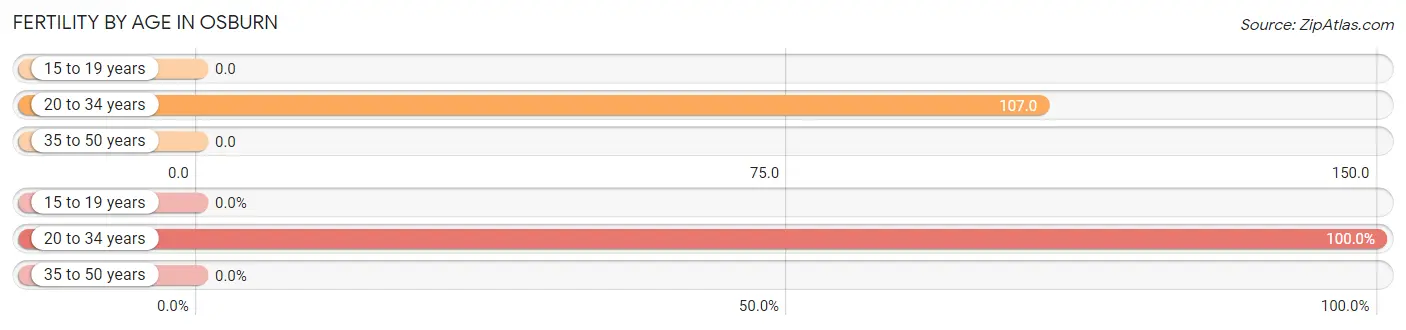
| Age Bracket | Women with Births | Births / 1,000 Women |
| 15 to 19 years | 0 (0.0%) | 0.0 |
| 20 to 34 years | 12 (100.0%) | 107.0 |
| 35 to 50 years | 0 (0.0%) | 0.0 |
| Total | 12 (100.0%) | 48.0 |
Fertility by Age by Marriage Status in Osburn
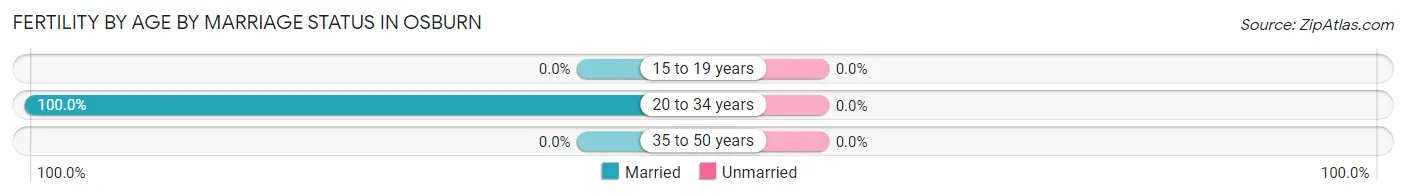
| Age Bracket | Married | Unmarried |
| 15 to 19 years | 0 (0.0%) | 0 (0.0%) |
| 20 to 34 years | 12 (100.0%) | 0 (0.0%) |
| 35 to 50 years | 0 (0.0%) | 0 (0.0%) |
| Total | 12 (100.0%) | 0 (0.0%) |
Fertility by Education in Osburn
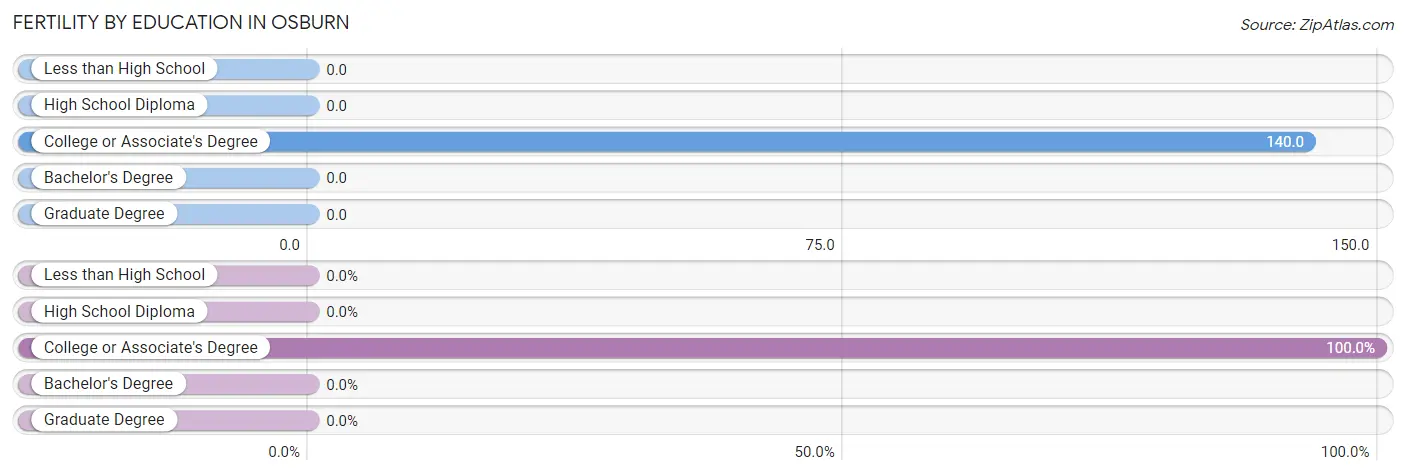
| Educational Attainment | Women with Births | Births / 1,000 Women |
| Less than High School | 0 (0.0%) | 0.0 |
| High School Diploma | 0 (0.0%) | 0.0 |
| College or Associate's Degree | 12 (100.0%) | 140.0 |
| Bachelor's Degree | 0 (0.0%) | 0.0 |
| Graduate Degree | 0 (0.0%) | 0.0 |
| Total | 12 (100.0%) | 48.0 |
Fertility by Education by Marriage Status in Osburn
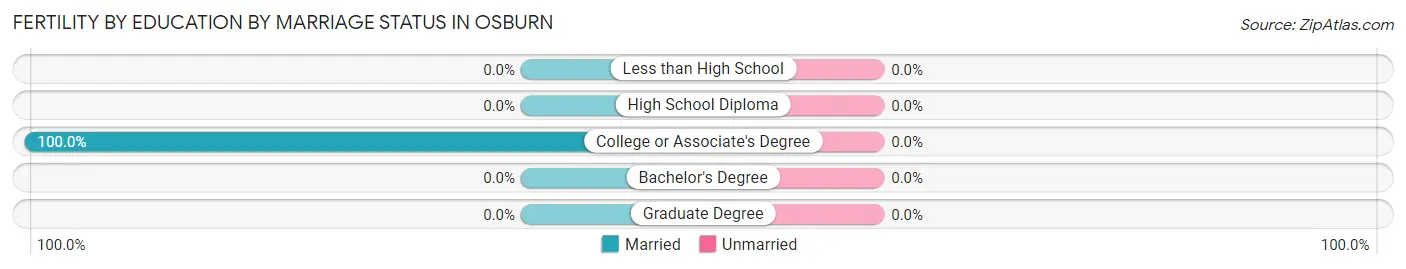
| Educational Attainment | Married | Unmarried |
| Less than High School | 0 (0.0%) | 0 (0.0%) |
| High School Diploma | 0 (0.0%) | 0 (0.0%) |
| College or Associate's Degree | 12 (100.0%) | 0 (0.0%) |
| Bachelor's Degree | 0 (0.0%) | 0 (0.0%) |
| Graduate Degree | 0 (0.0%) | 0 (0.0%) |
| Total | 12 (100.0%) | 0 (0.0%) |
Employment Characteristics in Osburn
Employment by Class of Employer in Osburn
Among the 725 employed individuals in Osburn, private company employees (558 | 77.0%), not-for-profit organizations (38 | 5.2%), and local government employees (31 | 4.3%) make up the most common classes of employment.
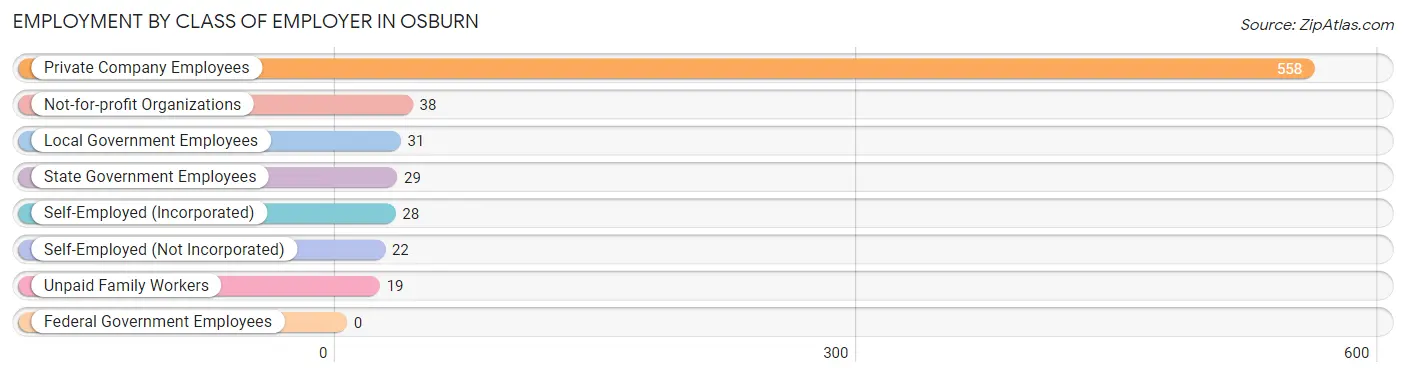
| Employer Class | # Employees | % Employees |
| Private Company Employees | 558 | 77.0% |
| Self-Employed (Incorporated) | 28 | 3.9% |
| Self-Employed (Not Incorporated) | 22 | 3.0% |
| Not-for-profit Organizations | 38 | 5.2% |
| Local Government Employees | 31 | 4.3% |
| State Government Employees | 29 | 4.0% |
| Federal Government Employees | 0 | 0.0% |
| Unpaid Family Workers | 19 | 2.6% |
| Total | 725 | 100.0% |
Employment Status by Age in Osburn
According to the labor force statistics for Osburn, out of the total population over 16 years of age (1,323), 59.2% or 783 individuals are in the labor force, with 3.7% or 29 of them unemployed. The age group with the highest labor force participation rate is 35 to 44 years, with 94.9% or 204 individuals in the labor force. Within the labor force, the 16 to 19 years age range has the highest percentage of unemployed individuals, with 18.4% or 7 of them being unemployed.
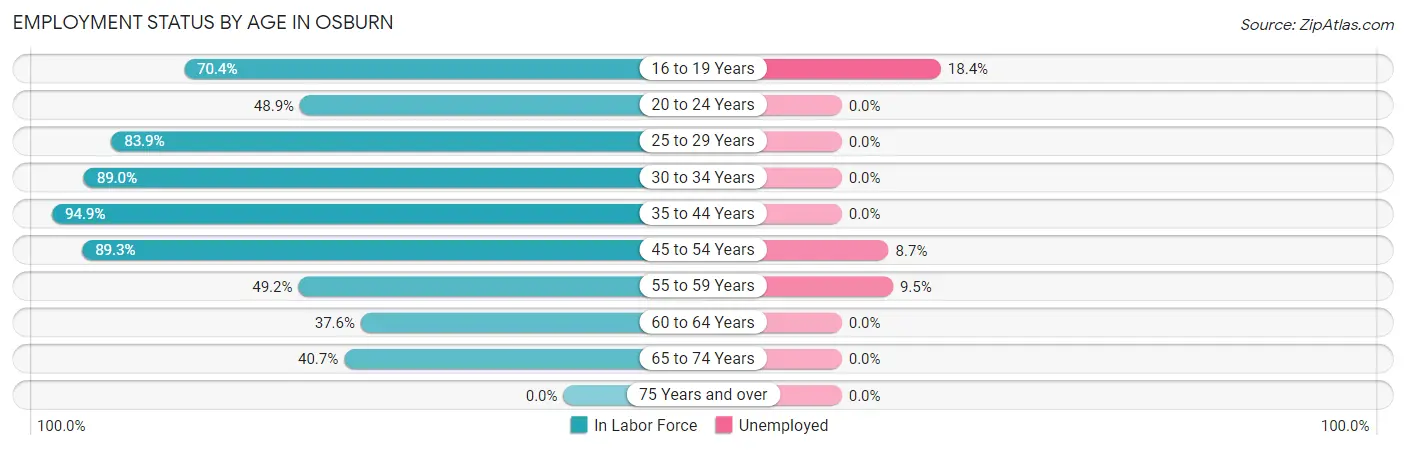
| Age Bracket | In Labor Force | Unemployed |
| 16 to 19 Years | 38 (70.4%) | 7 (18.4%) |
| 20 to 24 Years | 46 (48.9%) | 0 (0.0%) |
| 25 to 29 Years | 26 (83.9%) | 0 (0.0%) |
| 30 to 34 Years | 89 (89.0%) | 0 (0.0%) |
| 35 to 44 Years | 204 (94.9%) | 0 (0.0%) |
| 45 to 54 Years | 183 (89.3%) | 16 (8.7%) |
| 55 to 59 Years | 63 (49.2%) | 6 (9.5%) |
| 60 to 64 Years | 38 (37.6%) | 0 (0.0%) |
| 65 to 74 Years | 96 (40.7%) | 0 (0.0%) |
| 75 Years and over | 0 (0.0%) | 0 (0.0%) |
| Total | 783 (59.2%) | 29 (3.7%) |
Employment Status by Educational Attainment in Osburn
According to labor force statistics for Osburn, 77.3% of individuals (603) out of the total population between 25 and 64 years of age (780) are in the labor force, with 3.6% or 22 of them being unemployed. The group with the highest labor force participation rate are those with the educational attainment of college / associate degree, with 83.5% or 264 individuals in the labor force. Within the labor force, individuals with bachelor's degree or higher education have the highest percentage of unemployment, with 10.3% or 7 of them being unemployed.
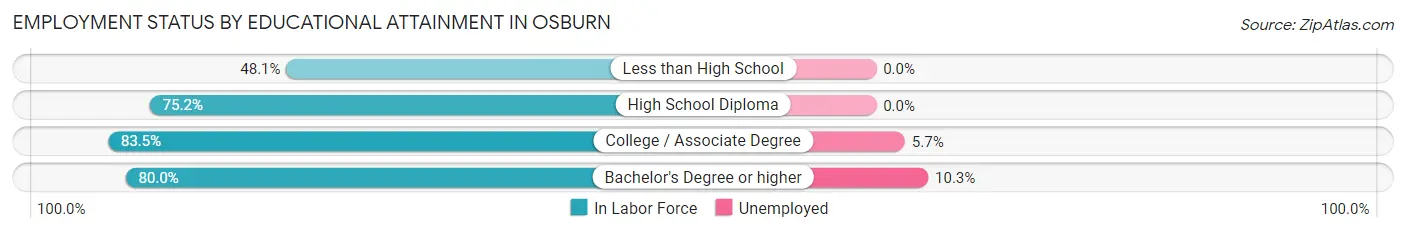
| Educational Attainment | In Labor Force | Unemployed |
| Less than High School | 25 (48.1%) | 0 (0.0%) |
| High School Diploma | 246 (75.2%) | 0 (0.0%) |
| College / Associate Degree | 264 (83.5%) | 18 (5.7%) |
| Bachelor's Degree or higher | 68 (80.0%) | 9 (10.3%) |
| Total | 603 (77.3%) | 28 (3.6%) |
Employment Occupations by Sex in Osburn
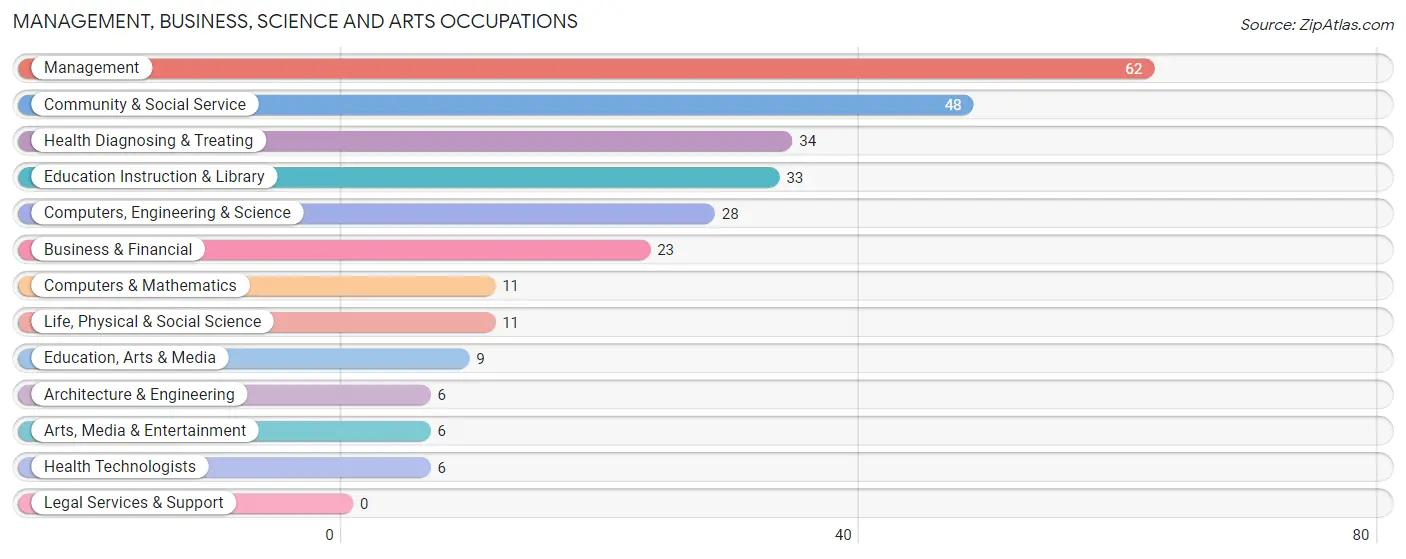
Management, Business, Science and Arts Occupations
The most common Management, Business, Science and Arts occupations in Osburn are Management (62 | 8.2%), Community & Social Service (48 | 6.4%), Health Diagnosing & Treating (34 | 4.5%), Education Instruction & Library (33 | 4.4%), and Computers, Engineering & Science (28 | 3.7%).
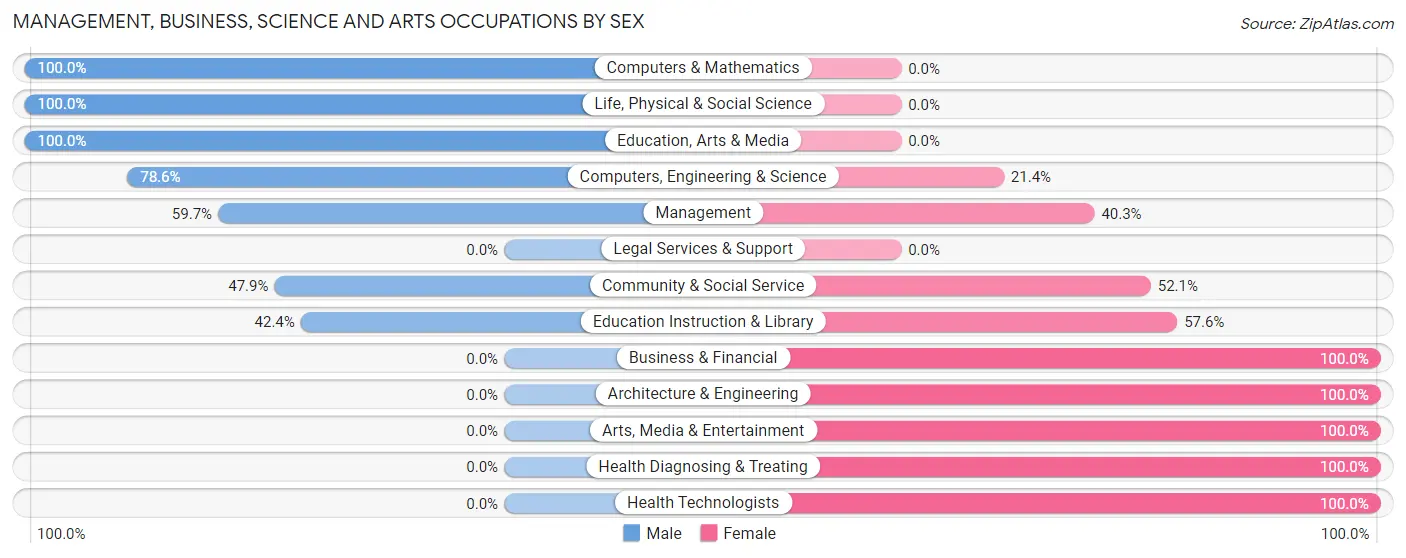
Management, Business, Science and Arts Occupations by Sex
Within the Management, Business, Science and Arts occupations in Osburn, the most male-oriented occupations are Computers & Mathematics (100.0%), Life, Physical & Social Science (100.0%), and Education, Arts & Media (100.0%), while the most female-oriented occupations are Business & Financial (100.0%), Architecture & Engineering (100.0%), and Arts, Media & Entertainment (100.0%).
| Occupation | Male | Female |
| Management | 37 (59.7%) | 25 (40.3%) |
| Business & Financial | 0 (0.0%) | 23 (100.0%) |
| Computers, Engineering & Science | 22 (78.6%) | 6 (21.4%) |
| Computers & Mathematics | 11 (100.0%) | 0 (0.0%) |
| Architecture & Engineering | 0 (0.0%) | 6 (100.0%) |
| Life, Physical & Social Science | 11 (100.0%) | 0 (0.0%) |
| Community & Social Service | 23 (47.9%) | 25 (52.1%) |
| Education, Arts & Media | 9 (100.0%) | 0 (0.0%) |
| Legal Services & Support | 0 (0.0%) | 0 (0.0%) |
| Education Instruction & Library | 14 (42.4%) | 19 (57.6%) |
| Arts, Media & Entertainment | 0 (0.0%) | 6 (100.0%) |
| Health Diagnosing & Treating | 0 (0.0%) | 34 (100.0%) |
| Health Technologists | 0 (0.0%) | 6 (100.0%) |
| Total (Category) | 82 (42.0%) | 113 (58.0%) |
| Total (Overall) | 421 (55.8%) | 333 (44.2%) |
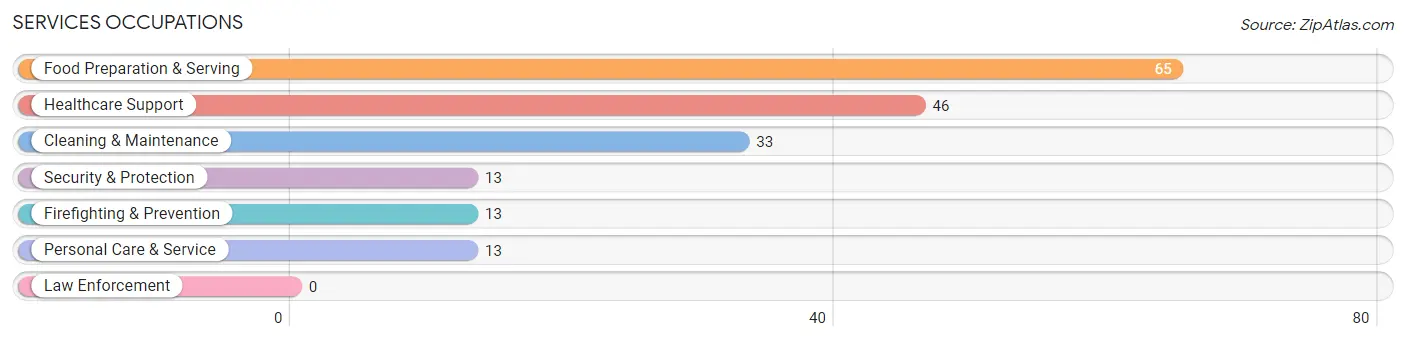
Services Occupations
The most common Services occupations in Osburn are Food Preparation & Serving (65 | 8.6%), Healthcare Support (46 | 6.1%), Cleaning & Maintenance (33 | 4.4%), Security & Protection (13 | 1.7%), and Firefighting & Prevention (13 | 1.7%).
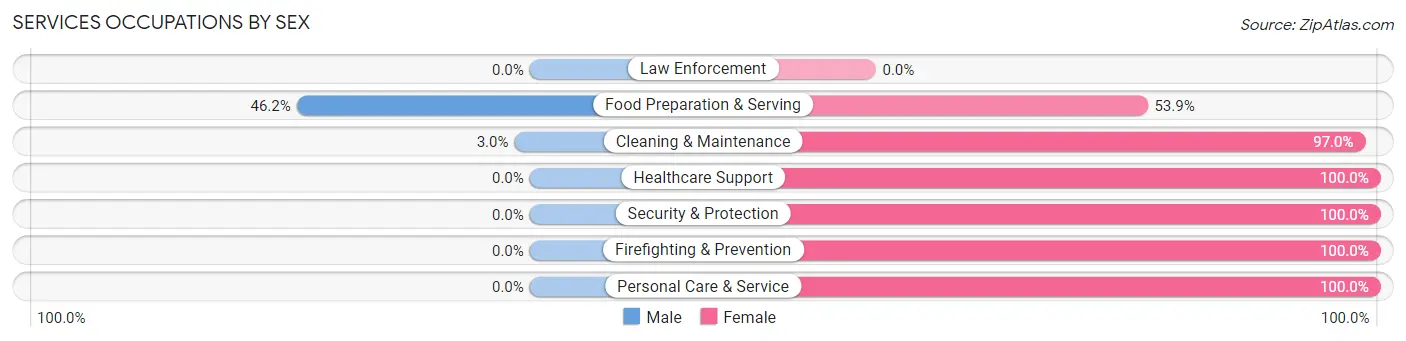
Services Occupations by Sex
Within the Services occupations in Osburn, the most male-oriented occupations are Food Preparation & Serving (46.2%), and Cleaning & Maintenance (3.0%), while the most female-oriented occupations are Healthcare Support (100.0%), Security & Protection (100.0%), and Firefighting & Prevention (100.0%).
| Occupation | Male | Female |
| Healthcare Support | 0 (0.0%) | 46 (100.0%) |
| Security & Protection | 0 (0.0%) | 13 (100.0%) |
| Firefighting & Prevention | 0 (0.0%) | 13 (100.0%) |
| Law Enforcement | 0 (0.0%) | 0 (0.0%) |
| Food Preparation & Serving | 30 (46.2%) | 35 (53.8%) |
| Cleaning & Maintenance | 1 (3.0%) | 32 (97.0%) |
| Personal Care & Service | 0 (0.0%) | 13 (100.0%) |
| Total (Category) | 31 (18.2%) | 139 (81.8%) |
| Total (Overall) | 421 (55.8%) | 333 (44.2%) |
Sales and Office Occupations
The most common Sales and Office occupations in Osburn are Office & Administration (91 | 12.1%), and Sales & Related (10 | 1.3%).
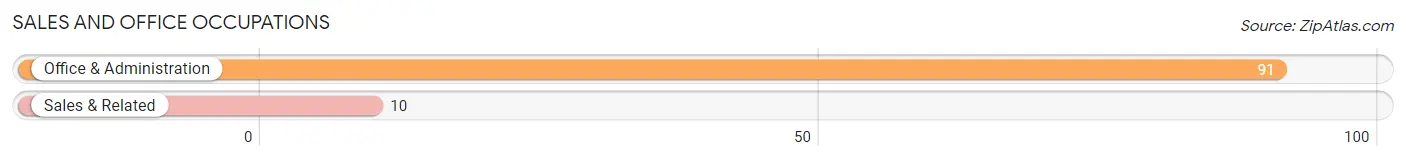
Sales and Office Occupations by Sex

| Occupation | Male | Female |
| Sales & Related | 0 (0.0%) | 10 (100.0%) |
| Office & Administration | 47 (51.6%) | 44 (48.3%) |
| Total (Category) | 47 (46.5%) | 54 (53.5%) |
| Total (Overall) | 421 (55.8%) | 333 (44.2%) |
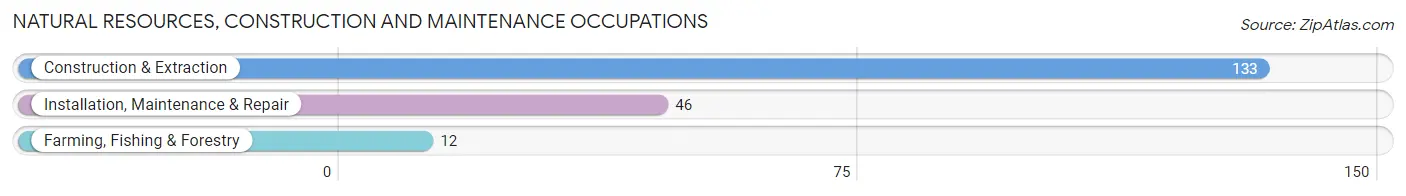
Natural Resources, Construction and Maintenance Occupations
The most common Natural Resources, Construction and Maintenance occupations in Osburn are Construction & Extraction (133 | 17.6%), Installation, Maintenance & Repair (46 | 6.1%), and Farming, Fishing & Forestry (12 | 1.6%).
Natural Resources, Construction and Maintenance Occupations by Sex
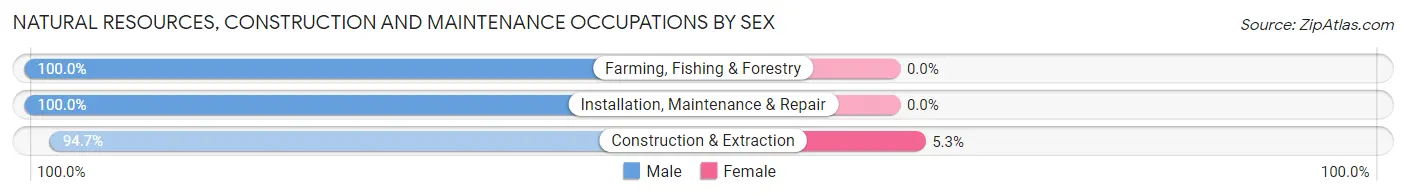
| Occupation | Male | Female |
| Farming, Fishing & Forestry | 12 (100.0%) | 0 (0.0%) |
| Construction & Extraction | 126 (94.7%) | 7 (5.3%) |
| Installation, Maintenance & Repair | 46 (100.0%) | 0 (0.0%) |
| Total (Category) | 184 (96.3%) | 7 (3.7%) |
| Total (Overall) | 421 (55.8%) | 333 (44.2%) |
Production, Transportation and Moving Occupations
The most common Production, Transportation and Moving occupations in Osburn are Production (41 | 5.4%), Transportation (41 | 5.4%), and Material Moving (15 | 2.0%).
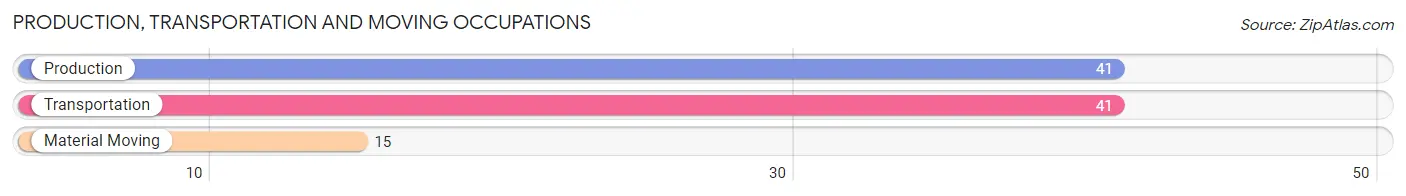
Production, Transportation and Moving Occupations by Sex
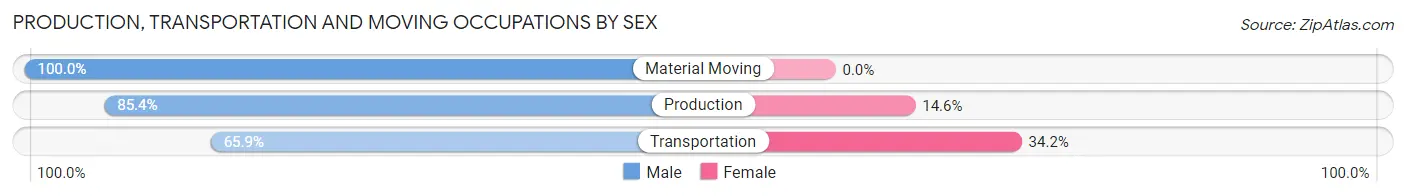
| Occupation | Male | Female |
| Production | 35 (85.4%) | 6 (14.6%) |
| Transportation | 27 (65.8%) | 14 (34.2%) |
| Material Moving | 15 (100.0%) | 0 (0.0%) |
| Total (Category) | 77 (79.4%) | 20 (20.6%) |
| Total (Overall) | 421 (55.8%) | 333 (44.2%) |
Employment Industries by Sex in Osburn
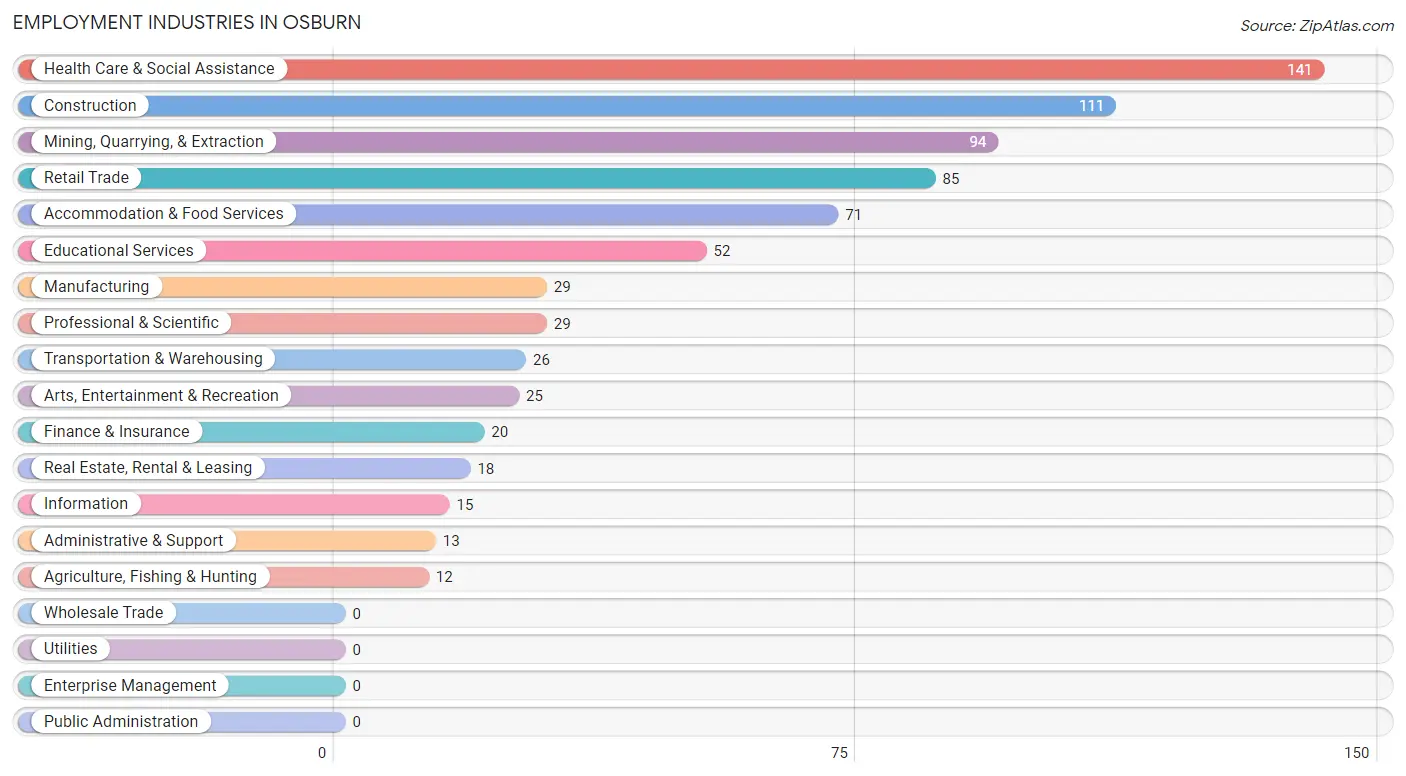
Employment Industries in Osburn
The major employment industries in Osburn include Health Care & Social Assistance (141 | 18.7%), Construction (111 | 14.7%), Mining, Quarrying, & Extraction (94 | 12.5%), Retail Trade (85 | 11.3%), and Accommodation & Food Services (71 | 9.4%).
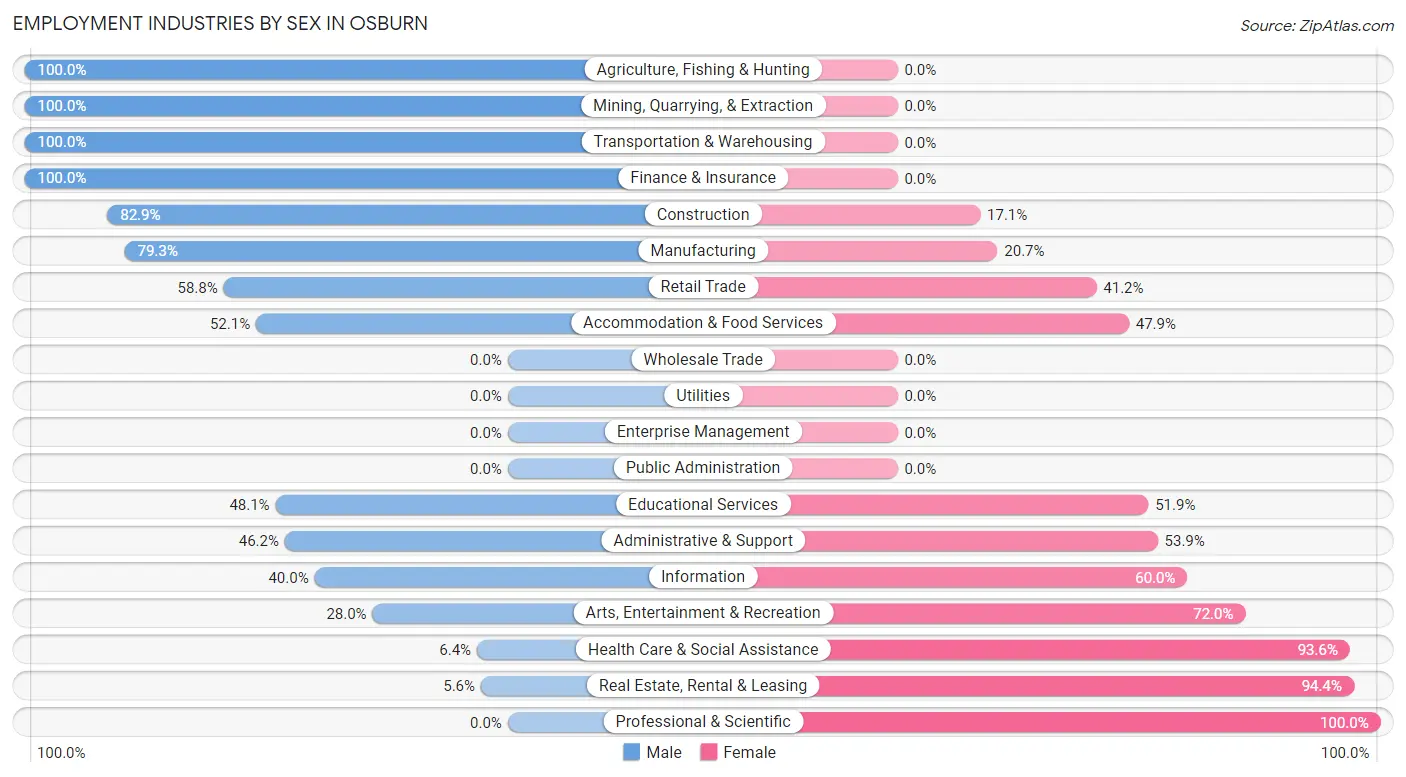
Employment Industries by Sex in Osburn
The Osburn industries that see more men than women are Agriculture, Fishing & Hunting (100.0%), Mining, Quarrying, & Extraction (100.0%), and Transportation & Warehousing (100.0%), whereas the industries that tend to have a higher number of women are Professional & Scientific (100.0%), Real Estate, Rental & Leasing (94.4%), and Health Care & Social Assistance (93.6%).
| Industry | Male | Female |
| Agriculture, Fishing & Hunting | 12 (100.0%) | 0 (0.0%) |
| Mining, Quarrying, & Extraction | 94 (100.0%) | 0 (0.0%) |
| Construction | 92 (82.9%) | 19 (17.1%) |
| Manufacturing | 23 (79.3%) | 6 (20.7%) |
| Wholesale Trade | 0 (0.0%) | 0 (0.0%) |
| Retail Trade | 50 (58.8%) | 35 (41.2%) |
| Transportation & Warehousing | 26 (100.0%) | 0 (0.0%) |
| Utilities | 0 (0.0%) | 0 (0.0%) |
| Information | 6 (40.0%) | 9 (60.0%) |
| Finance & Insurance | 20 (100.0%) | 0 (0.0%) |
| Real Estate, Rental & Leasing | 1 (5.6%) | 17 (94.4%) |
| Professional & Scientific | 0 (0.0%) | 29 (100.0%) |
| Enterprise Management | 0 (0.0%) | 0 (0.0%) |
| Administrative & Support | 6 (46.2%) | 7 (53.8%) |
| Educational Services | 25 (48.1%) | 27 (51.9%) |
| Health Care & Social Assistance | 9 (6.4%) | 132 (93.6%) |
| Arts, Entertainment & Recreation | 7 (28.0%) | 18 (72.0%) |
| Accommodation & Food Services | 37 (52.1%) | 34 (47.9%) |
| Public Administration | 0 (0.0%) | 0 (0.0%) |
| Total | 421 (55.8%) | 333 (44.2%) |
Education in Osburn
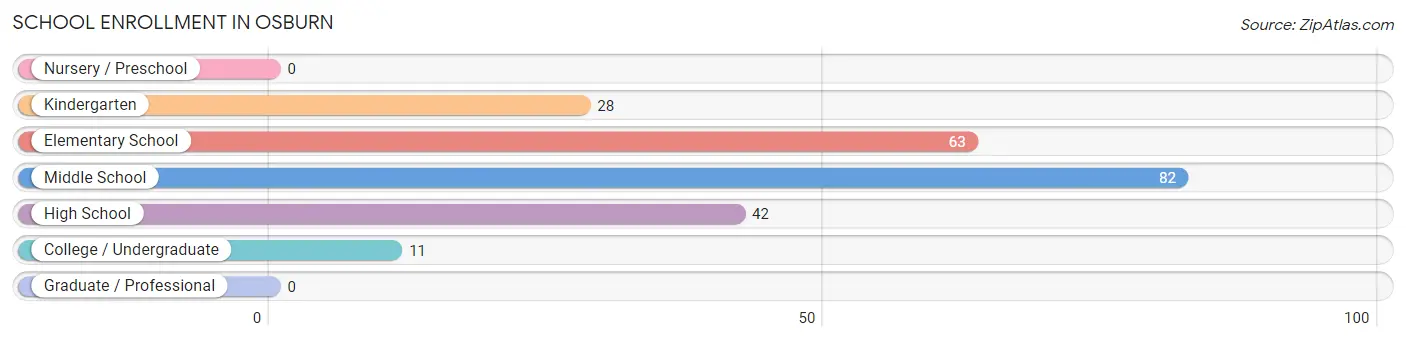
School Enrollment in Osburn
The most common levels of schooling among the 226 students in Osburn are middle school (82 | 36.3%), elementary school (63 | 27.9%), and high school (42 | 18.6%).
| School Level | # Students | % Students |
| Nursery / Preschool | 0 | 0.0% |
| Kindergarten | 28 | 12.4% |
| Elementary School | 63 | 27.9% |
| Middle School | 82 | 36.3% |
| High School | 42 | 18.6% |
| College / Undergraduate | 11 | 4.9% |
| Graduate / Professional | 0 | 0.0% |
| Total | 226 | 100.0% |
School Enrollment by Age by Funding Source in Osburn
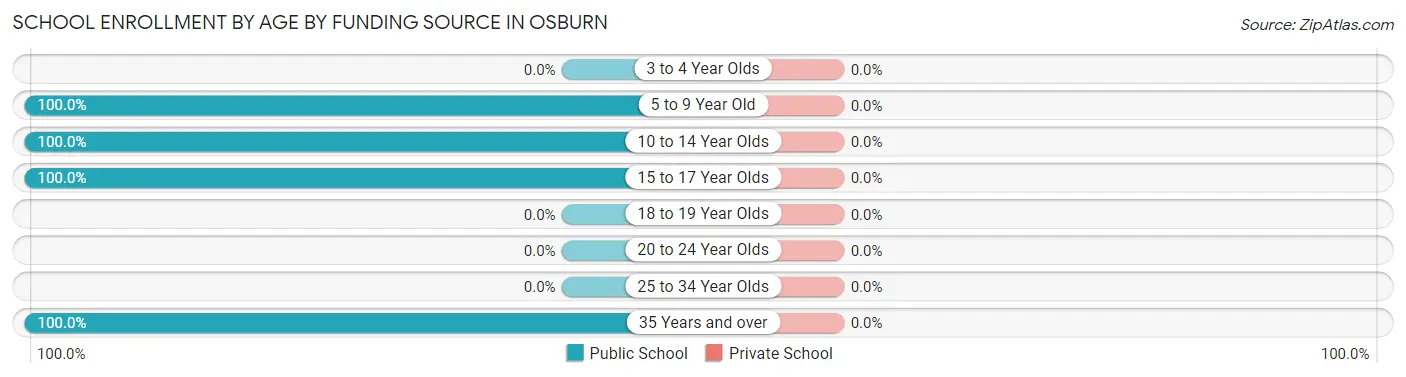
| Age Bracket | Public School | Private School |
| 3 to 4 Year Olds | 0 (0.0%) | 0 (0.0%) |
| 5 to 9 Year Old | 63 (100.0%) | 0 (0.0%) |
| 10 to 14 Year Olds | 122 (100.0%) | 0 (0.0%) |
| 15 to 17 Year Olds | 30 (100.0%) | 0 (0.0%) |
| 18 to 19 Year Olds | 0 (0.0%) | 0 (0.0%) |
| 20 to 24 Year Olds | 0 (0.0%) | 0 (0.0%) |
| 25 to 34 Year Olds | 0 (0.0%) | 0 (0.0%) |
| 35 Years and over | 11 (100.0%) | 0 (0.0%) |
| Total | 226 (100.0%) | 0 (0.0%) |
Educational Attainment by Field of Study in Osburn
Education (39 | 27.1%), literature & languages (24 | 16.7%), science & technology (19 | 13.2%), business (14 | 9.7%), and arts & humanities (13 | 9.0%) are the most common fields of study among 144 individuals in Osburn who have obtained a bachelor's degree or higher.
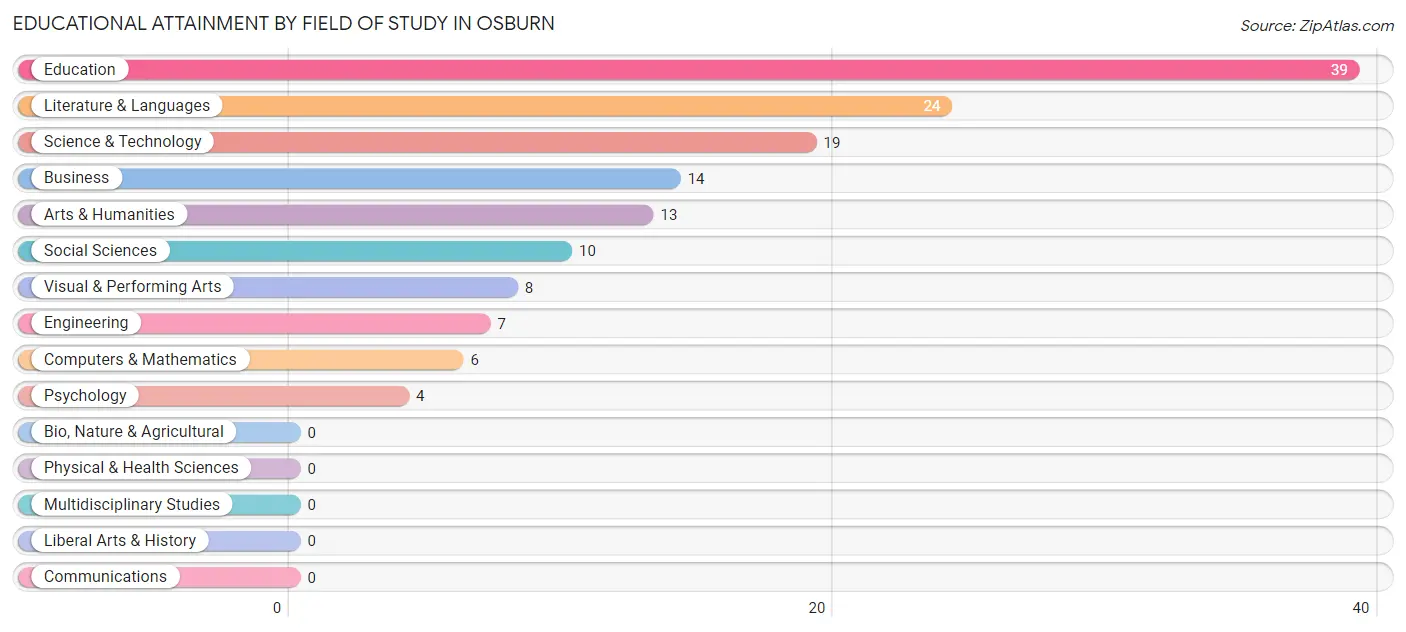
| Field of Study | # Graduates | % Graduates |
| Computers & Mathematics | 6 | 4.2% |
| Bio, Nature & Agricultural | 0 | 0.0% |
| Physical & Health Sciences | 0 | 0.0% |
| Psychology | 4 | 2.8% |
| Social Sciences | 10 | 6.9% |
| Engineering | 7 | 4.9% |
| Multidisciplinary Studies | 0 | 0.0% |
| Science & Technology | 19 | 13.2% |
| Business | 14 | 9.7% |
| Education | 39 | 27.1% |
| Literature & Languages | 24 | 16.7% |
| Liberal Arts & History | 0 | 0.0% |
| Visual & Performing Arts | 8 | 5.6% |
| Communications | 0 | 0.0% |
| Arts & Humanities | 13 | 9.0% |
| Total | 144 | 100.0% |
Transportation & Commute in Osburn
Vehicle Availability by Sex in Osburn
The most prevalent vehicle ownership categories in Osburn are males with 2 vehicles (165, accounting for 39.6%) and females with 2 vehicles (186, making up 53.6%).
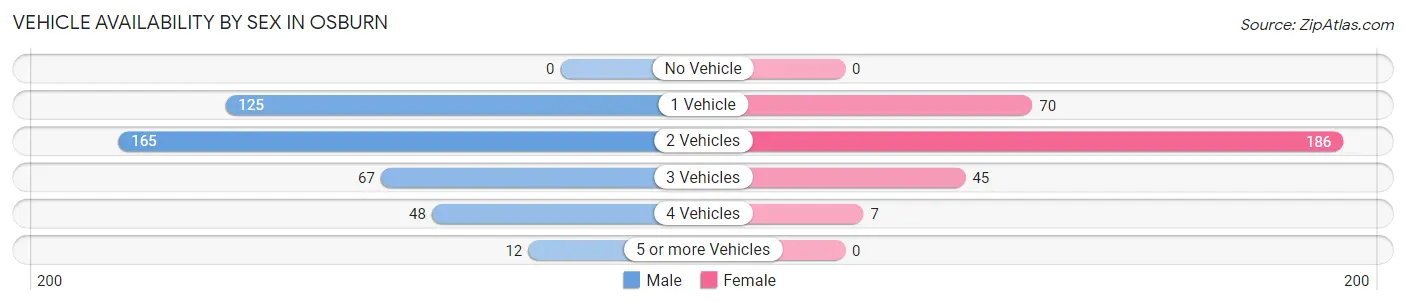
| Vehicles Available | Male | Female |
| No Vehicle | 0 (0.0%) | 0 (0.0%) |
| 1 Vehicle | 125 (30.0%) | 70 (22.7%) |
| 2 Vehicles | 165 (39.6%) | 186 (60.4%) |
| 3 Vehicles | 67 (16.1%) | 45 (14.6%) |
| 4 Vehicles | 48 (11.5%) | 7 (2.3%) |
| 5 or more Vehicles | 12 (2.9%) | 0 (0.0%) |
| Total | 417 (100.0%) | 308 (100.0%) |
Commute Time in Osburn
The most frequently occuring commute durations in Osburn are 10 to 14 minutes (175 commuters, 25.9%), 5 to 9 minutes (154 commuters, 22.8%), and 45 to 59 minutes (124 commuters, 18.3%).
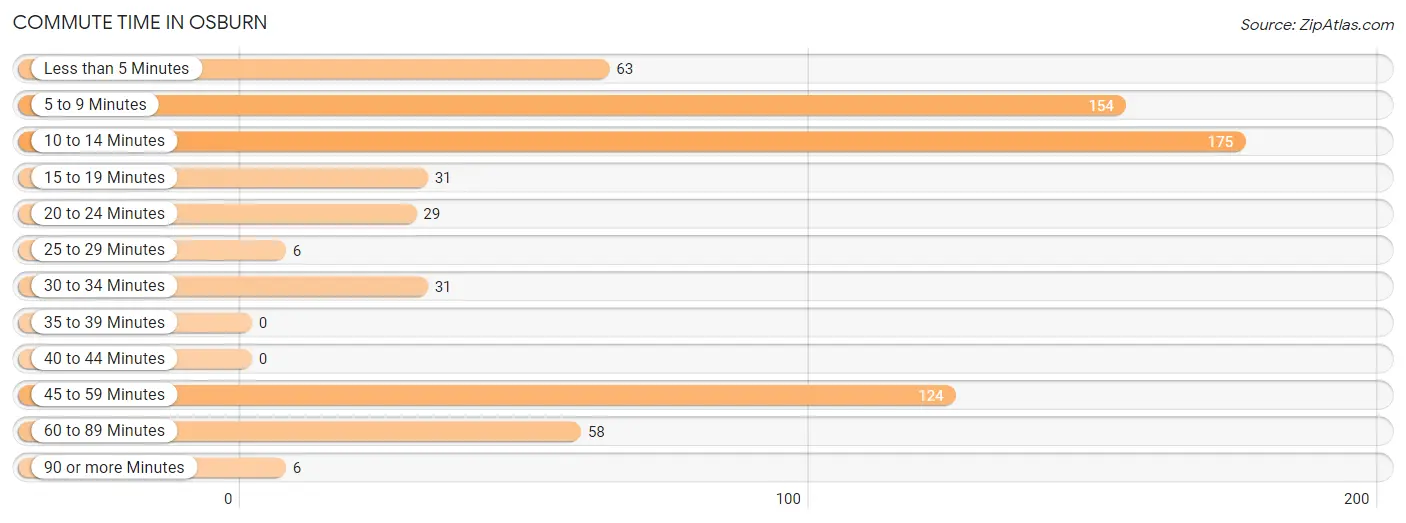
| Commute Time | # Commuters | % Commuters |
| Less than 5 Minutes | 63 | 9.3% |
| 5 to 9 Minutes | 154 | 22.8% |
| 10 to 14 Minutes | 175 | 25.9% |
| 15 to 19 Minutes | 31 | 4.6% |
| 20 to 24 Minutes | 29 | 4.3% |
| 25 to 29 Minutes | 6 | 0.9% |
| 30 to 34 Minutes | 31 | 4.6% |
| 35 to 39 Minutes | 0 | 0.0% |
| 40 to 44 Minutes | 0 | 0.0% |
| 45 to 59 Minutes | 124 | 18.3% |
| 60 to 89 Minutes | 58 | 8.6% |
| 90 or more Minutes | 6 | 0.9% |
Commute Time by Sex in Osburn
The most common commute times in Osburn are 10 to 14 minutes (111 commuters, 28.5%) for males and 10 to 14 minutes (64 commuters, 22.2%) for females.
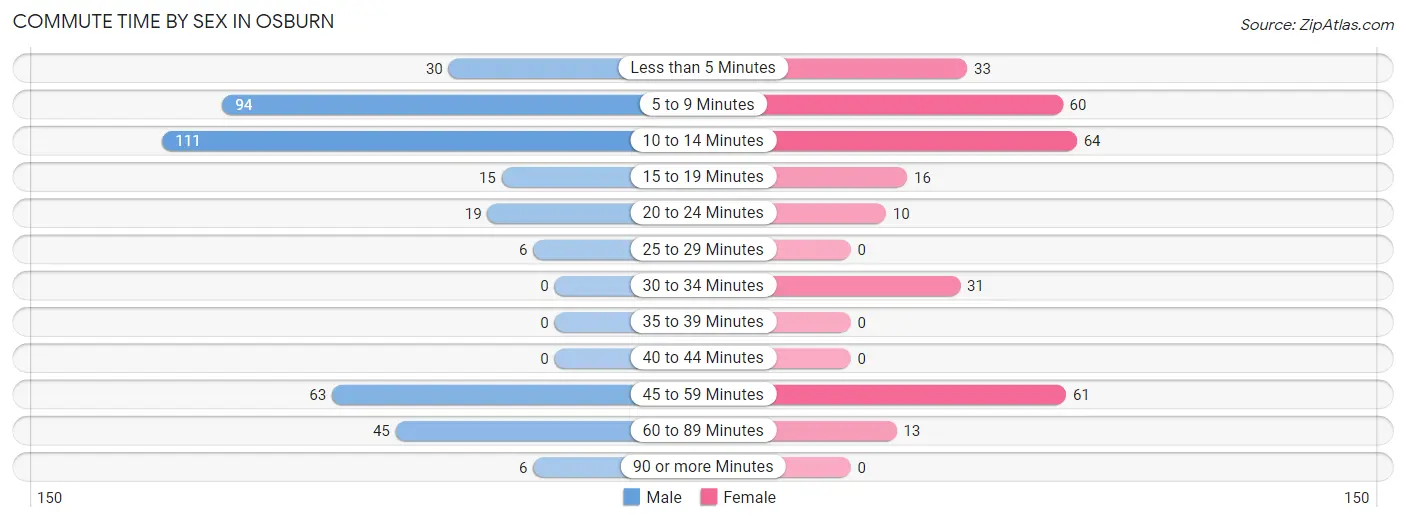
| Commute Time | Male | Female |
| Less than 5 Minutes | 30 (7.7%) | 33 (11.5%) |
| 5 to 9 Minutes | 94 (24.2%) | 60 (20.8%) |
| 10 to 14 Minutes | 111 (28.5%) | 64 (22.2%) |
| 15 to 19 Minutes | 15 (3.9%) | 16 (5.6%) |
| 20 to 24 Minutes | 19 (4.9%) | 10 (3.5%) |
| 25 to 29 Minutes | 6 (1.5%) | 0 (0.0%) |
| 30 to 34 Minutes | 0 (0.0%) | 31 (10.8%) |
| 35 to 39 Minutes | 0 (0.0%) | 0 (0.0%) |
| 40 to 44 Minutes | 0 (0.0%) | 0 (0.0%) |
| 45 to 59 Minutes | 63 (16.2%) | 61 (21.2%) |
| 60 to 89 Minutes | 45 (11.6%) | 13 (4.5%) |
| 90 or more Minutes | 6 (1.5%) | 0 (0.0%) |
Time of Departure to Work by Sex in Osburn
The most frequent times of departure to work in Osburn are 8:00 AM to 8:29 AM (81, 20.8%) for males and 6:30 AM to 6:59 AM (55, 19.1%) for females.
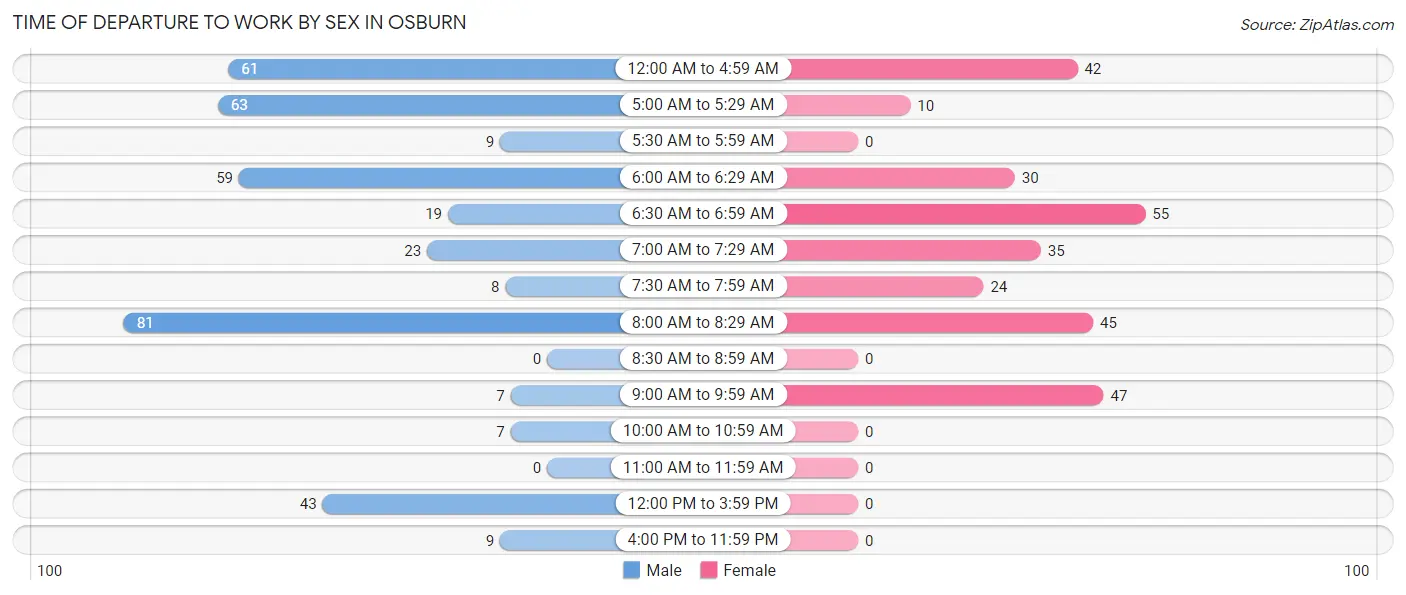
| Time of Departure | Male | Female |
| 12:00 AM to 4:59 AM | 61 (15.7%) | 42 (14.6%) |
| 5:00 AM to 5:29 AM | 63 (16.2%) | 10 (3.5%) |
| 5:30 AM to 5:59 AM | 9 (2.3%) | 0 (0.0%) |
| 6:00 AM to 6:29 AM | 59 (15.2%) | 30 (10.4%) |
| 6:30 AM to 6:59 AM | 19 (4.9%) | 55 (19.1%) |
| 7:00 AM to 7:29 AM | 23 (5.9%) | 35 (12.1%) |
| 7:30 AM to 7:59 AM | 8 (2.1%) | 24 (8.3%) |
| 8:00 AM to 8:29 AM | 81 (20.8%) | 45 (15.6%) |
| 8:30 AM to 8:59 AM | 0 (0.0%) | 0 (0.0%) |
| 9:00 AM to 9:59 AM | 7 (1.8%) | 47 (16.3%) |
| 10:00 AM to 10:59 AM | 7 (1.8%) | 0 (0.0%) |
| 11:00 AM to 11:59 AM | 0 (0.0%) | 0 (0.0%) |
| 12:00 PM to 3:59 PM | 43 (11.1%) | 0 (0.0%) |
| 4:00 PM to 11:59 PM | 9 (2.3%) | 0 (0.0%) |
| Total | 389 (100.0%) | 288 (100.0%) |
Housing Occupancy in Osburn
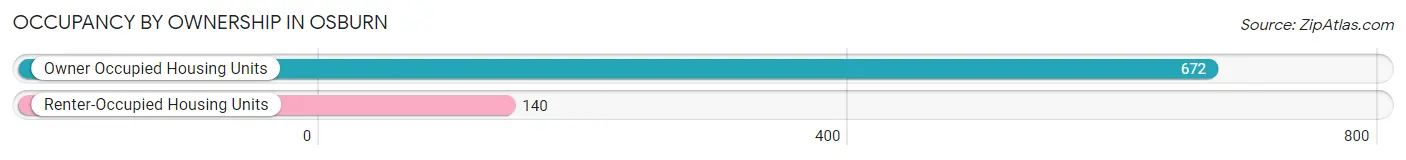
Occupancy by Ownership in Osburn
Of the total 812 dwellings in Osburn, owner-occupied units account for 672 (82.8%), while renter-occupied units make up 140 (17.2%).
| Occupancy | # Housing Units | % Housing Units |
| Owner Occupied Housing Units | 672 | 82.8% |
| Renter-Occupied Housing Units | 140 | 17.2% |
| Total Occupied Housing Units | 812 | 100.0% |
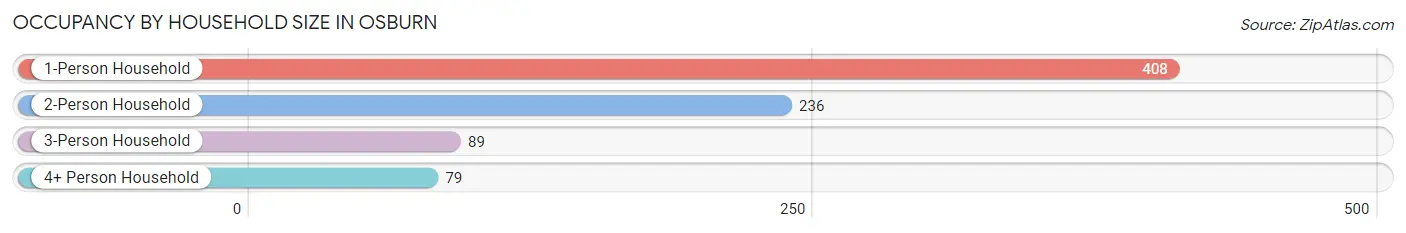
Occupancy by Household Size in Osburn
| Household Size | # Housing Units | % Housing Units |
| 1-Person Household | 408 | 50.2% |
| 2-Person Household | 236 | 29.1% |
| 3-Person Household | 89 | 11.0% |
| 4+ Person Household | 79 | 9.7% |
| Total Housing Units | 812 | 100.0% |
Occupancy by Ownership by Household Size in Osburn
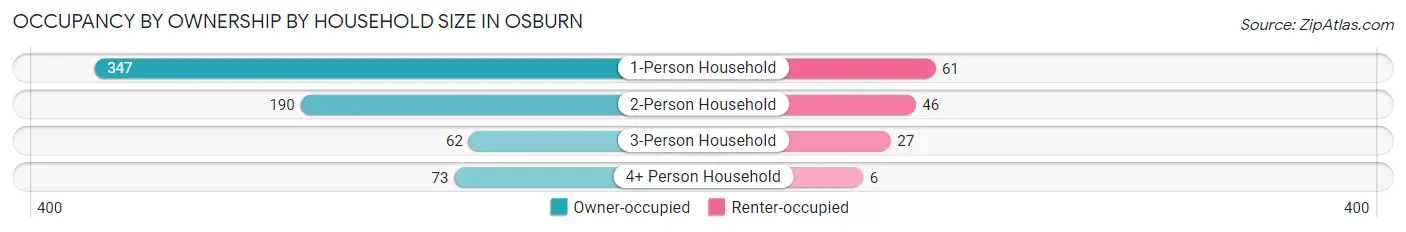
| Household Size | Owner-occupied | Renter-occupied |
| 1-Person Household | 347 (85.1%) | 61 (14.9%) |
| 2-Person Household | 190 (80.5%) | 46 (19.5%) |
| 3-Person Household | 62 (69.7%) | 27 (30.3%) |
| 4+ Person Household | 73 (92.4%) | 6 (7.6%) |
| Total Housing Units | 672 (82.8%) | 140 (17.2%) |
Occupancy by Educational Attainment in Osburn
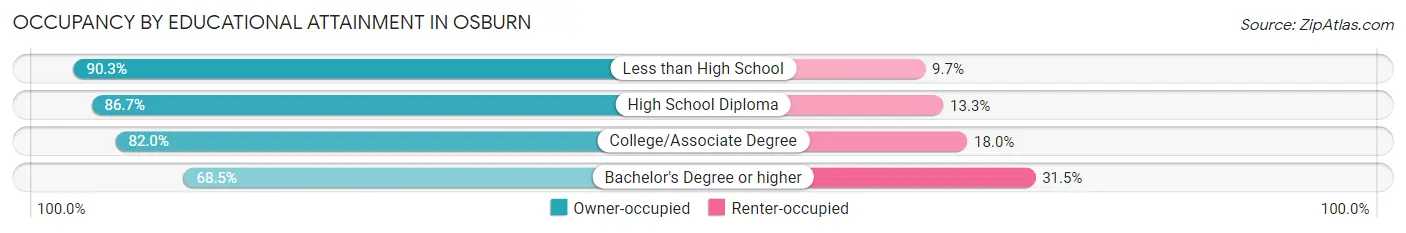
| Household Size | Owner-occupied | Renter-occupied |
| Less than High School | 93 (90.3%) | 10 (9.7%) |
| High School Diploma | 235 (86.7%) | 36 (13.3%) |
| College/Associate Degree | 268 (82.0%) | 59 (18.0%) |
| Bachelor's Degree or higher | 76 (68.5%) | 35 (31.5%) |
Occupancy by Age of Householder in Osburn
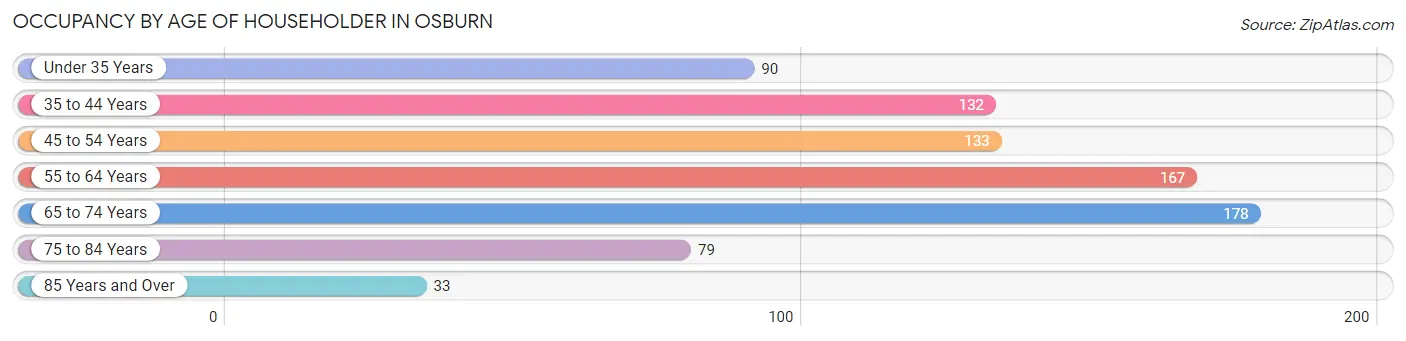
| Age Bracket | # Households | % Households |
| Under 35 Years | 90 | 11.1% |
| 35 to 44 Years | 132 | 16.3% |
| 45 to 54 Years | 133 | 16.4% |
| 55 to 64 Years | 167 | 20.6% |
| 65 to 74 Years | 178 | 21.9% |
| 75 to 84 Years | 79 | 9.7% |
| 85 Years and Over | 33 | 4.1% |
| Total | 812 | 100.0% |
Housing Finances in Osburn
Median Income by Occupancy in Osburn
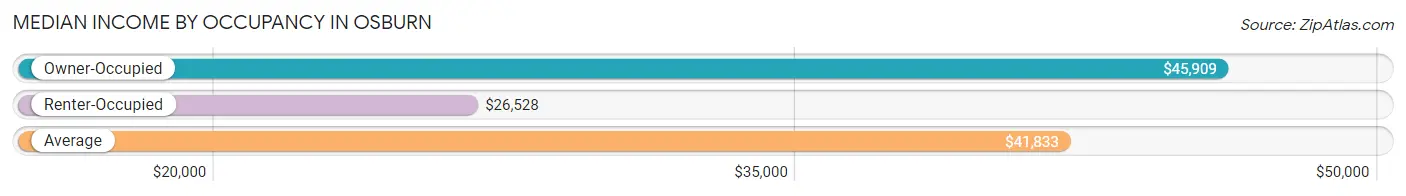
| Occupancy Type | # Households | Median Income |
| Owner-Occupied | 672 (82.8%) | $45,909 |
| Renter-Occupied | 140 (17.2%) | $26,528 |
| Average | 812 (100.0%) | $41,833 |
Occupancy by Householder Income Bracket in Osburn
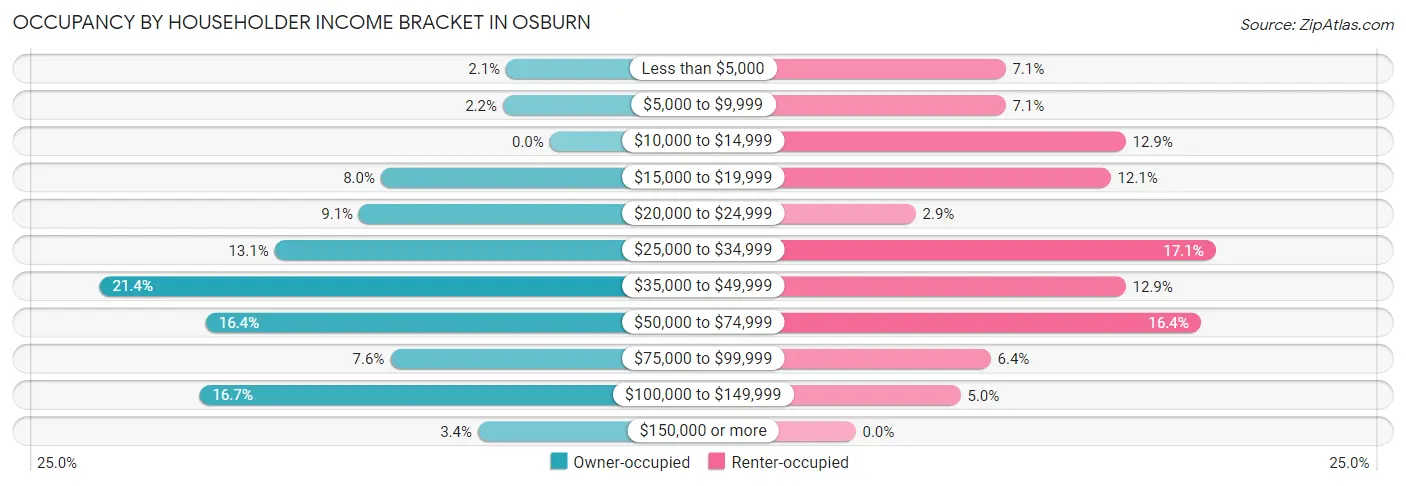
| Income Bracket | Owner-occupied | Renter-occupied |
| Less than $5,000 | 14 (2.1%) | 10 (7.1%) |
| $5,000 to $9,999 | 15 (2.2%) | 10 (7.1%) |
| $10,000 to $14,999 | 0 (0.0%) | 18 (12.9%) |
| $15,000 to $19,999 | 54 (8.0%) | 17 (12.1%) |
| $20,000 to $24,999 | 61 (9.1%) | 4 (2.9%) |
| $25,000 to $34,999 | 88 (13.1%) | 24 (17.1%) |
| $35,000 to $49,999 | 144 (21.4%) | 18 (12.9%) |
| $50,000 to $74,999 | 110 (16.4%) | 23 (16.4%) |
| $75,000 to $99,999 | 51 (7.6%) | 9 (6.4%) |
| $100,000 to $149,999 | 112 (16.7%) | 7 (5.0%) |
| $150,000 or more | 23 (3.4%) | 0 (0.0%) |
| Total | 672 (100.0%) | 140 (100.0%) |
Monthly Housing Cost Tiers in Osburn
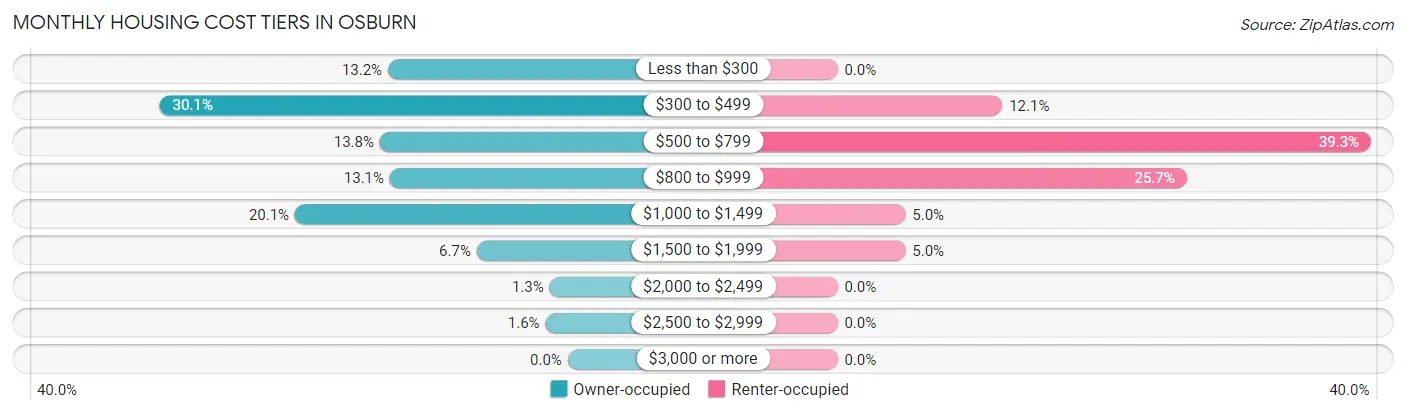
| Monthly Cost | Owner-occupied | Renter-occupied |
| Less than $300 | 89 (13.2%) | 0 (0.0%) |
| $300 to $499 | 202 (30.1%) | 17 (12.1%) |
| $500 to $799 | 93 (13.8%) | 55 (39.3%) |
| $800 to $999 | 88 (13.1%) | 36 (25.7%) |
| $1,000 to $1,499 | 135 (20.1%) | 7 (5.0%) |
| $1,500 to $1,999 | 45 (6.7%) | 7 (5.0%) |
| $2,000 to $2,499 | 9 (1.3%) | 0 (0.0%) |
| $2,500 to $2,999 | 11 (1.6%) | 0 (0.0%) |
| $3,000 or more | 0 (0.0%) | 0 (0.0%) |
| Total | 672 (100.0%) | 140 (100.0%) |
Physical Housing Characteristics in Osburn
Housing Structures in Osburn
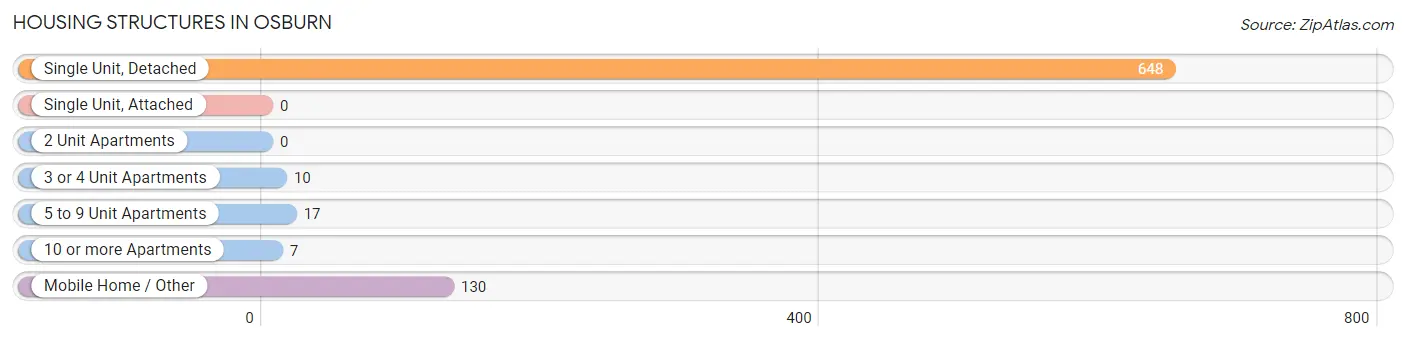
| Structure Type | # Housing Units | % Housing Units |
| Single Unit, Detached | 648 | 79.8% |
| Single Unit, Attached | 0 | 0.0% |
| 2 Unit Apartments | 0 | 0.0% |
| 3 or 4 Unit Apartments | 10 | 1.2% |
| 5 to 9 Unit Apartments | 17 | 2.1% |
| 10 or more Apartments | 7 | 0.9% |
| Mobile Home / Other | 130 | 16.0% |
| Total | 812 | 100.0% |
Housing Structures by Occupancy in Osburn
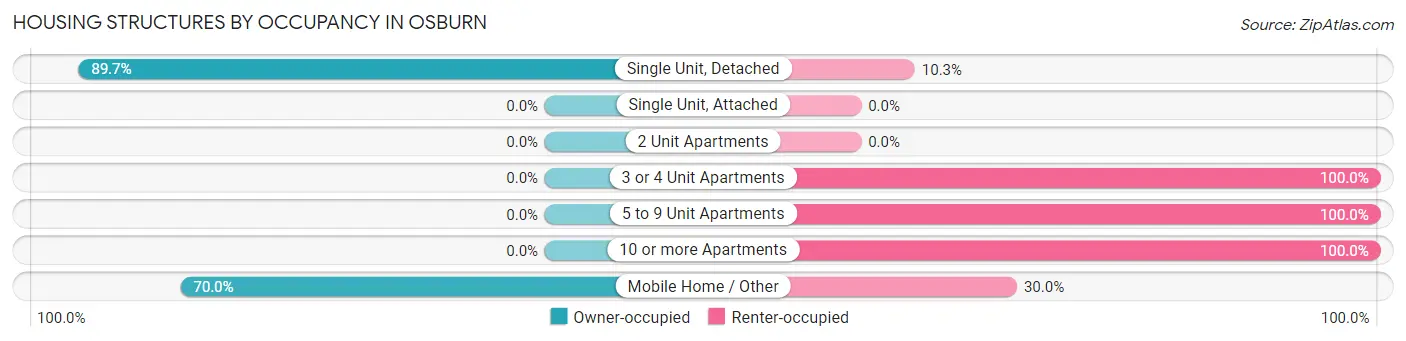
| Structure Type | Owner-occupied | Renter-occupied |
| Single Unit, Detached | 581 (89.7%) | 67 (10.3%) |
| Single Unit, Attached | 0 (0.0%) | 0 (0.0%) |
| 2 Unit Apartments | 0 (0.0%) | 0 (0.0%) |
| 3 or 4 Unit Apartments | 0 (0.0%) | 10 (100.0%) |
| 5 to 9 Unit Apartments | 0 (0.0%) | 17 (100.0%) |
| 10 or more Apartments | 0 (0.0%) | 7 (100.0%) |
| Mobile Home / Other | 91 (70.0%) | 39 (30.0%) |
| Total | 672 (82.8%) | 140 (17.2%) |
Housing Structures by Number of Rooms in Osburn
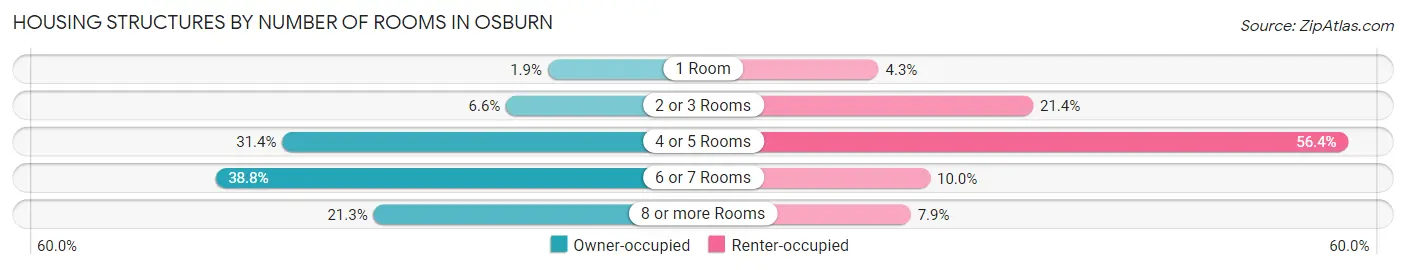
| Number of Rooms | Owner-occupied | Renter-occupied |
| 1 Room | 13 (1.9%) | 6 (4.3%) |
| 2 or 3 Rooms | 44 (6.6%) | 30 (21.4%) |
| 4 or 5 Rooms | 211 (31.4%) | 79 (56.4%) |
| 6 or 7 Rooms | 261 (38.8%) | 14 (10.0%) |
| 8 or more Rooms | 143 (21.3%) | 11 (7.9%) |
| Total | 672 (100.0%) | 140 (100.0%) |
Housing Structure by Heating Type in Osburn
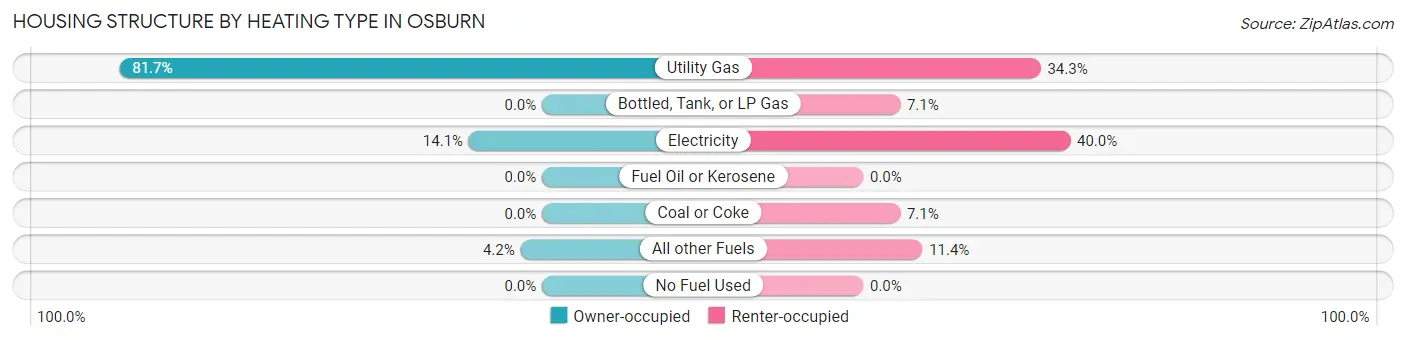
| Heating Type | Owner-occupied | Renter-occupied |
| Utility Gas | 549 (81.7%) | 48 (34.3%) |
| Bottled, Tank, or LP Gas | 0 (0.0%) | 10 (7.1%) |
| Electricity | 95 (14.1%) | 56 (40.0%) |
| Fuel Oil or Kerosene | 0 (0.0%) | 0 (0.0%) |
| Coal or Coke | 0 (0.0%) | 10 (7.1%) |
| All other Fuels | 28 (4.2%) | 16 (11.4%) |
| No Fuel Used | 0 (0.0%) | 0 (0.0%) |
| Total | 672 (100.0%) | 140 (100.0%) |
Household Vehicle Usage in Osburn
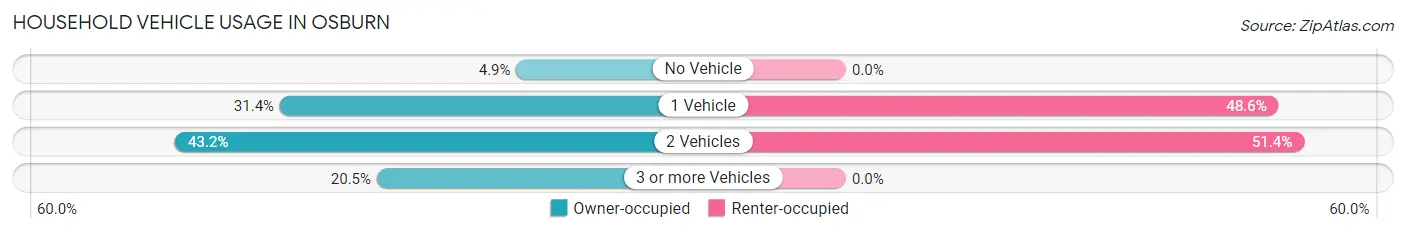
| Vehicles per Household | Owner-occupied | Renter-occupied |
| No Vehicle | 33 (4.9%) | 0 (0.0%) |
| 1 Vehicle | 211 (31.4%) | 68 (48.6%) |
| 2 Vehicles | 290 (43.1%) | 72 (51.4%) |
| 3 or more Vehicles | 138 (20.5%) | 0 (0.0%) |
| Total | 672 (100.0%) | 140 (100.0%) |
Real Estate & Mortgages in Osburn
Real Estate and Mortgage Overview in Osburn
| Characteristic | Without Mortgage | With Mortgage |
| Housing Units | 360 | 312 |
| Median Property Value | $118,200 | $182,600 |
| Median Household Income | $32,045 | $23 |
| Monthly Housing Costs | $382 | $0 |
| Real Estate Taxes | $1,221 | $13 |
Property Value by Mortgage Status in Osburn
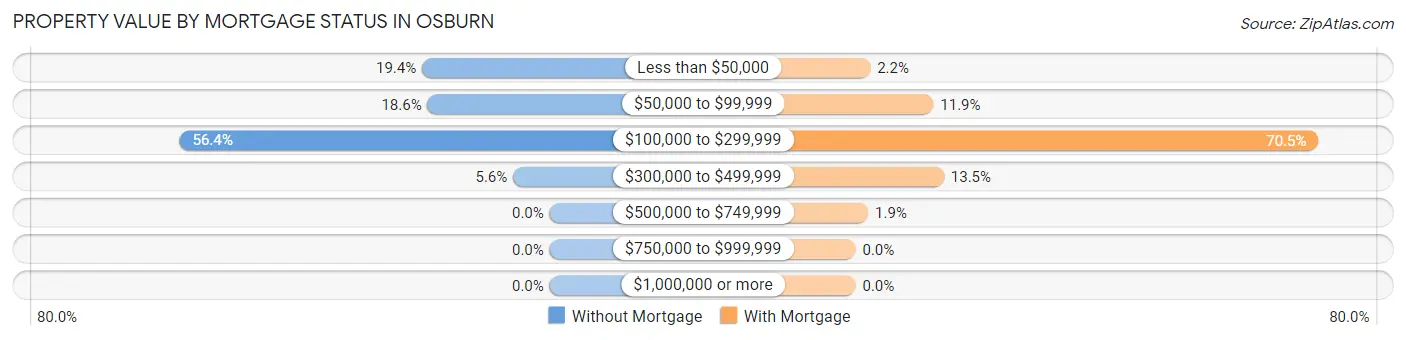
| Property Value | Without Mortgage | With Mortgage |
| Less than $50,000 | 70 (19.4%) | 7 (2.2%) |
| $50,000 to $99,999 | 67 (18.6%) | 37 (11.9%) |
| $100,000 to $299,999 | 203 (56.4%) | 220 (70.5%) |
| $300,000 to $499,999 | 20 (5.6%) | 42 (13.5%) |
| $500,000 to $749,999 | 0 (0.0%) | 6 (1.9%) |
| $750,000 to $999,999 | 0 (0.0%) | 0 (0.0%) |
| $1,000,000 or more | 0 (0.0%) | 0 (0.0%) |
| Total | 360 (100.0%) | 312 (100.0%) |
Household Income by Mortgage Status in Osburn
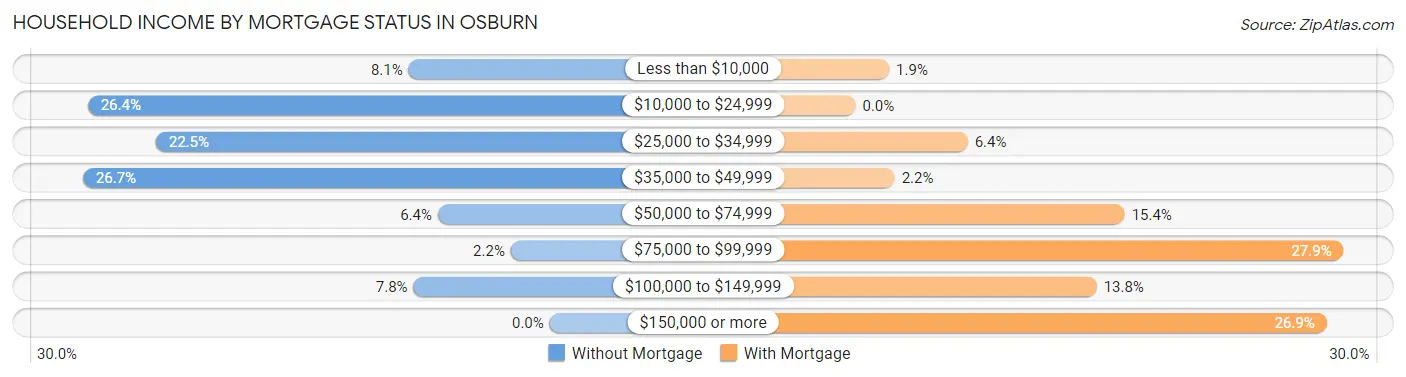
| Household Income | Without Mortgage | With Mortgage |
| Less than $10,000 | 29 (8.1%) | 6 (1.9%) |
| $10,000 to $24,999 | 95 (26.4%) | 0 (0.0%) |
| $25,000 to $34,999 | 81 (22.5%) | 20 (6.4%) |
| $35,000 to $49,999 | 96 (26.7%) | 7 (2.2%) |
| $50,000 to $74,999 | 23 (6.4%) | 48 (15.4%) |
| $75,000 to $99,999 | 8 (2.2%) | 87 (27.9%) |
| $100,000 to $149,999 | 28 (7.8%) | 43 (13.8%) |
| $150,000 or more | 0 (0.0%) | 84 (26.9%) |
| Total | 360 (100.0%) | 312 (100.0%) |
Property Value to Household Income Ratio in Osburn
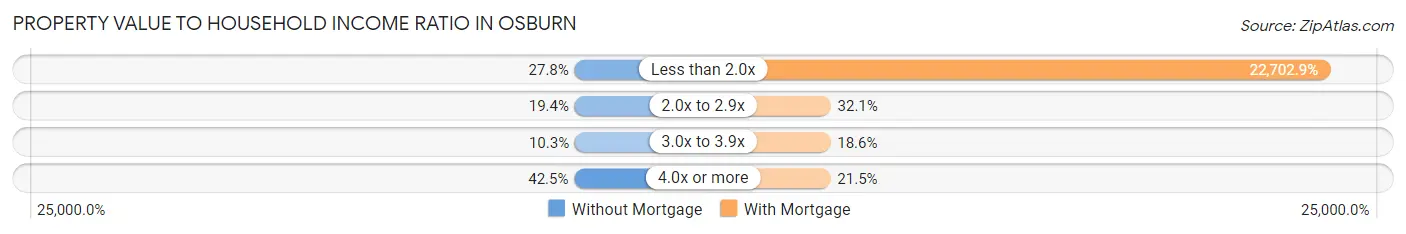
| Value-to-Income Ratio | Without Mortgage | With Mortgage |
| Less than 2.0x | 100 (27.8%) | 70,833 (22,702.9%) |
| 2.0x to 2.9x | 70 (19.4%) | 100 (32.1%) |
| 3.0x to 3.9x | 37 (10.3%) | 58 (18.6%) |
| 4.0x or more | 153 (42.5%) | 67 (21.5%) |
| Total | 360 (100.0%) | 312 (100.0%) |
Real Estate Taxes by Mortgage Status in Osburn
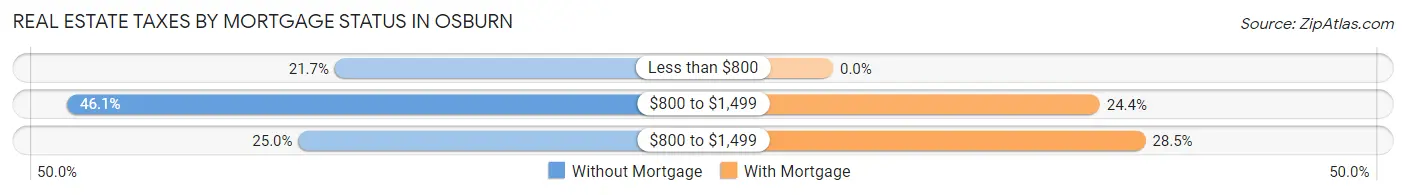
| Property Taxes | Without Mortgage | With Mortgage |
| Less than $800 | 78 (21.7%) | 0 (0.0%) |
| $800 to $1,499 | 166 (46.1%) | 76 (24.4%) |
| $800 to $1,499 | 90 (25.0%) | 89 (28.5%) |
| Total | 360 (100.0%) | 312 (100.0%) |
Health & Disability in Osburn
Health Insurance Coverage by Age in Osburn
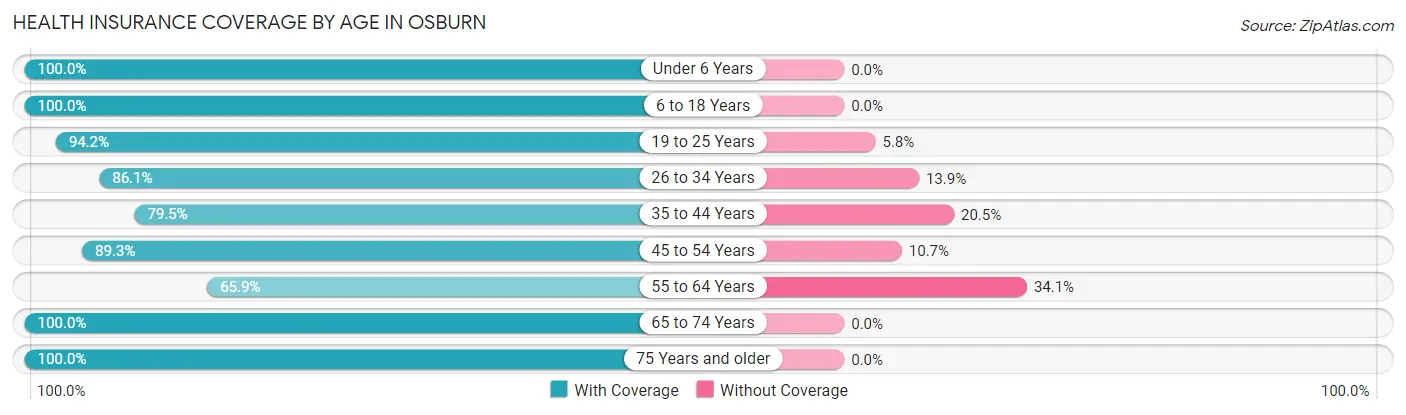
| Age Bracket | With Coverage | Without Coverage |
| Under 6 Years | 139 (100.0%) | 0 (0.0%) |
| 6 to 18 Years | 217 (100.0%) | 0 (0.0%) |
| 19 to 25 Years | 97 (94.2%) | 6 (5.8%) |
| 26 to 34 Years | 105 (86.1%) | 17 (13.9%) |
| 35 to 44 Years | 171 (79.5%) | 44 (20.5%) |
| 45 to 54 Years | 183 (89.3%) | 22 (10.7%) |
| 55 to 64 Years | 151 (65.9%) | 78 (34.1%) |
| 65 to 74 Years | 236 (100.0%) | 0 (0.0%) |
| 75 Years and older | 159 (100.0%) | 0 (0.0%) |
| Total | 1,458 (89.7%) | 167 (10.3%) |
Health Insurance Coverage by Citizenship Status in Osburn
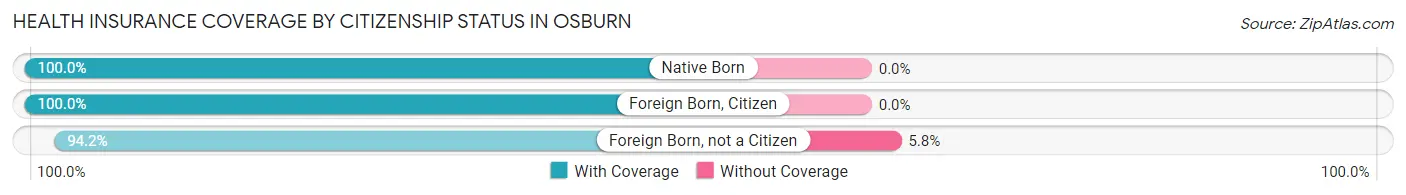
| Citizenship Status | With Coverage | Without Coverage |
| Native Born | 139 (100.0%) | 0 (0.0%) |
| Foreign Born, Citizen | 217 (100.0%) | 0 (0.0%) |
| Foreign Born, not a Citizen | 97 (94.2%) | 6 (5.8%) |
Health Insurance Coverage by Household Income in Osburn
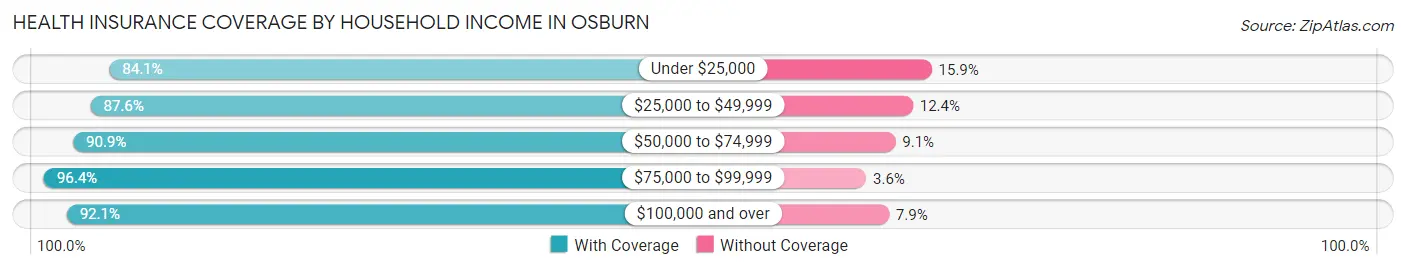
| Household Income | With Coverage | Without Coverage |
| Under $25,000 | 217 (84.1%) | 41 (15.9%) |
| $25,000 to $49,999 | 468 (87.6%) | 66 (12.4%) |
| $50,000 to $74,999 | 280 (90.9%) | 28 (9.1%) |
| $75,000 to $99,999 | 213 (96.4%) | 8 (3.6%) |
| $100,000 and over | 280 (92.1%) | 24 (7.9%) |
Public vs Private Health Insurance Coverage by Age in Osburn
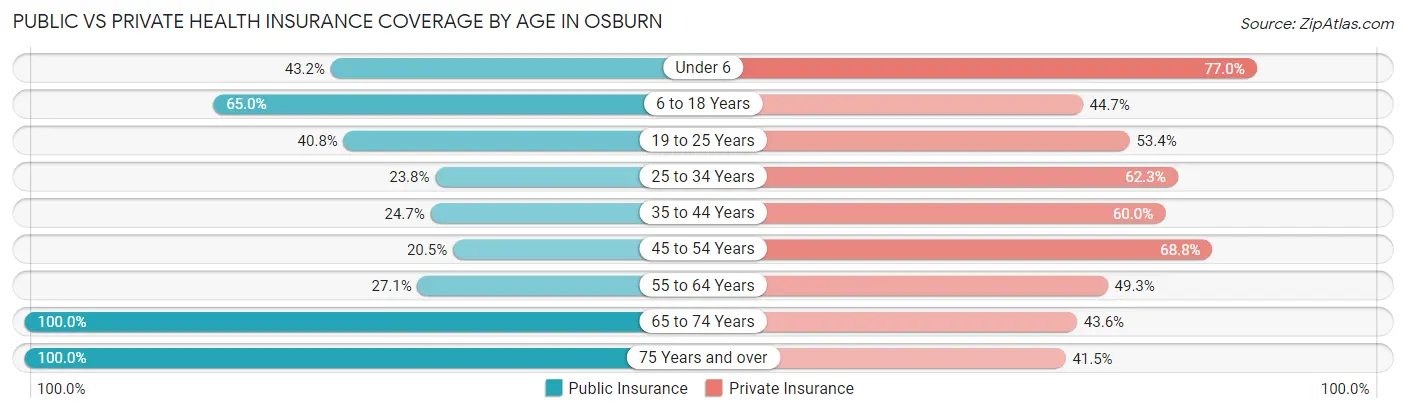
| Age Bracket | Public Insurance | Private Insurance |
| Under 6 | 60 (43.2%) | 107 (77.0%) |
| 6 to 18 Years | 141 (65.0%) | 97 (44.7%) |
| 19 to 25 Years | 42 (40.8%) | 55 (53.4%) |
| 25 to 34 Years | 29 (23.8%) | 76 (62.3%) |
| 35 to 44 Years | 53 (24.6%) | 129 (60.0%) |
| 45 to 54 Years | 42 (20.5%) | 141 (68.8%) |
| 55 to 64 Years | 62 (27.1%) | 113 (49.3%) |
| 65 to 74 Years | 236 (100.0%) | 103 (43.6%) |
| 75 Years and over | 159 (100.0%) | 66 (41.5%) |
| Total | 824 (50.7%) | 887 (54.6%) |
Disability Status by Sex by Age in Osburn
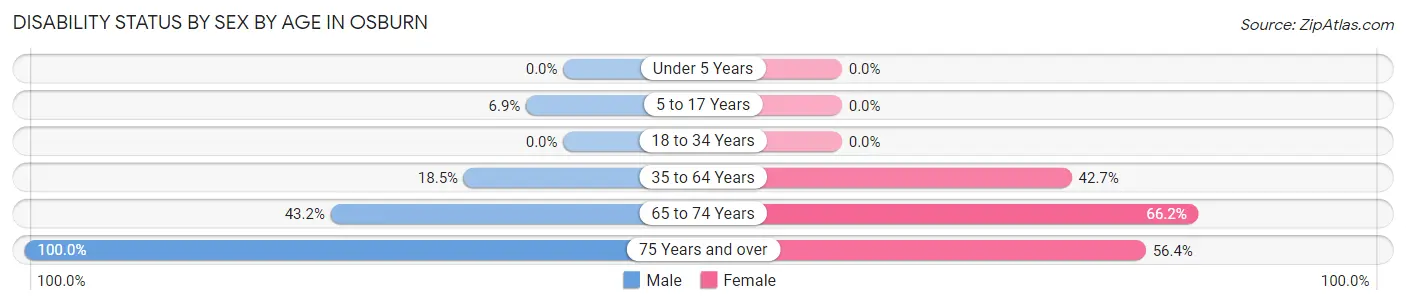
| Age Bracket | Male | Female |
| Under 5 Years | 0 (0.0%) | 0 (0.0%) |
| 5 to 17 Years | 8 (6.9%) | 0 (0.0%) |
| 18 to 34 Years | 0 (0.0%) | 0 (0.0%) |
| 35 to 64 Years | 67 (18.5%) | 122 (42.7%) |
| 65 to 74 Years | 38 (43.2%) | 98 (66.2%) |
| 75 Years and over | 42 (100.0%) | 66 (56.4%) |
Disability Class by Sex by Age in Osburn
Disability Class: Hearing Difficulty
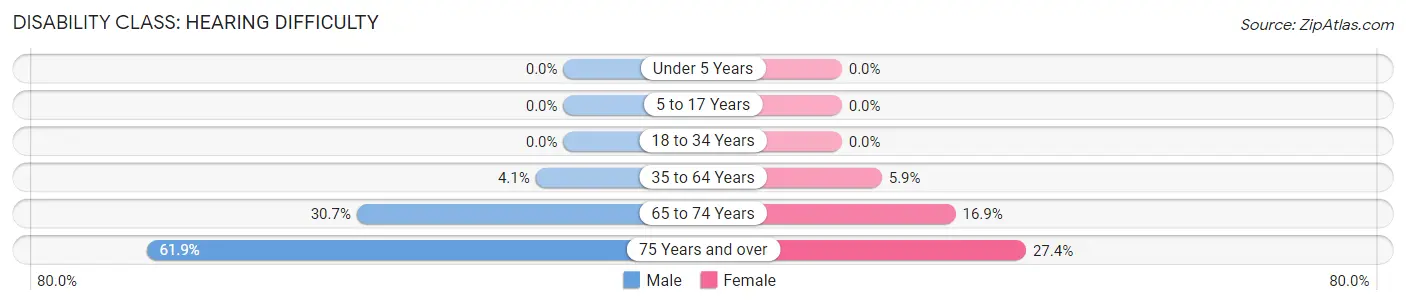
| Age Bracket | Male | Female |
| Under 5 Years | 0 (0.0%) | 0 (0.0%) |
| 5 to 17 Years | 0 (0.0%) | 0 (0.0%) |
| 18 to 34 Years | 0 (0.0%) | 0 (0.0%) |
| 35 to 64 Years | 15 (4.1%) | 17 (5.9%) |
| 65 to 74 Years | 27 (30.7%) | 25 (16.9%) |
| 75 Years and over | 26 (61.9%) | 32 (27.4%) |
Disability Class: Vision Difficulty
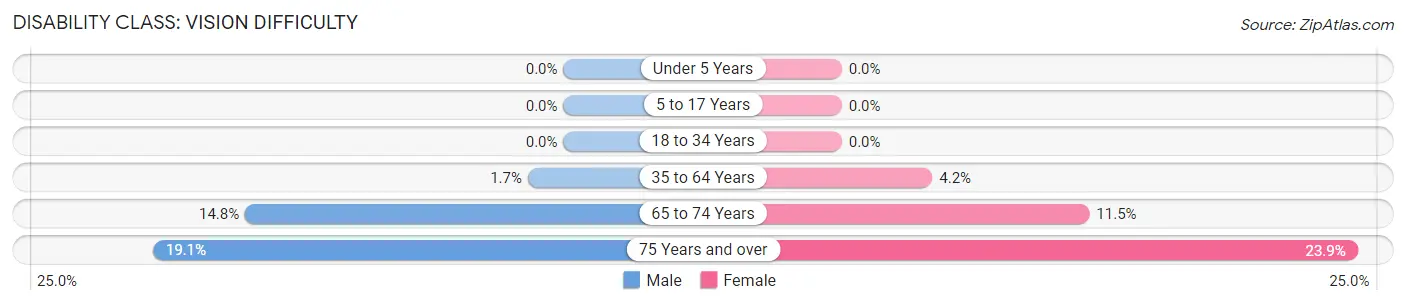
| Age Bracket | Male | Female |
| Under 5 Years | 0 (0.0%) | 0 (0.0%) |
| 5 to 17 Years | 0 (0.0%) | 0 (0.0%) |
| 18 to 34 Years | 0 (0.0%) | 0 (0.0%) |
| 35 to 64 Years | 6 (1.7%) | 12 (4.2%) |
| 65 to 74 Years | 13 (14.8%) | 17 (11.5%) |
| 75 Years and over | 8 (19.1%) | 28 (23.9%) |
Disability Class: Cognitive Difficulty
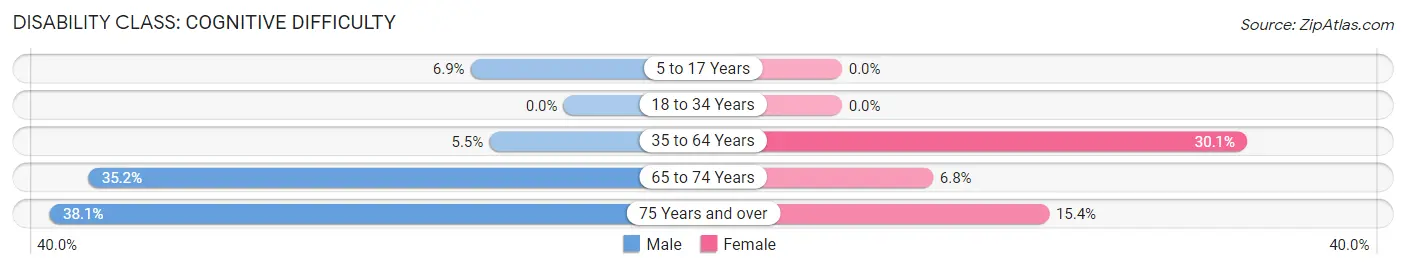
| Age Bracket | Male | Female |
| 5 to 17 Years | 8 (6.9%) | 0 (0.0%) |
| 18 to 34 Years | 0 (0.0%) | 0 (0.0%) |
| 35 to 64 Years | 20 (5.5%) | 86 (30.1%) |
| 65 to 74 Years | 31 (35.2%) | 10 (6.8%) |
| 75 Years and over | 16 (38.1%) | 18 (15.4%) |
Disability Class: Ambulatory Difficulty
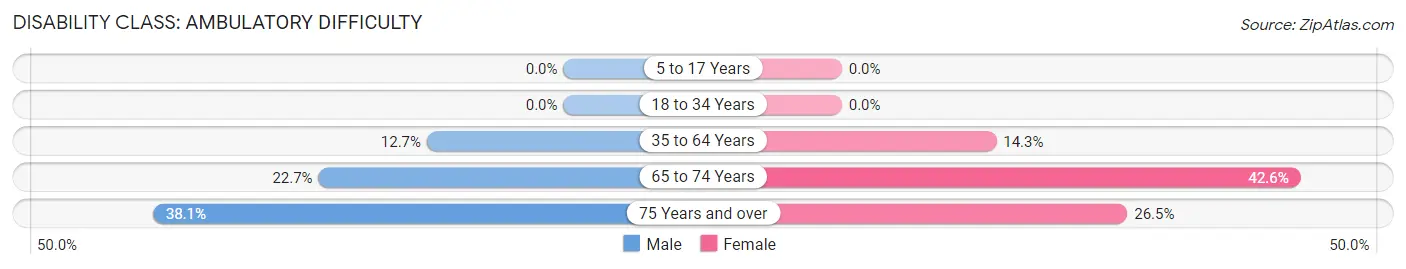
| Age Bracket | Male | Female |
| 5 to 17 Years | 0 (0.0%) | 0 (0.0%) |
| 18 to 34 Years | 0 (0.0%) | 0 (0.0%) |
| 35 to 64 Years | 46 (12.7%) | 41 (14.3%) |
| 65 to 74 Years | 20 (22.7%) | 63 (42.6%) |
| 75 Years and over | 16 (38.1%) | 31 (26.5%) |
Disability Class: Self-Care Difficulty
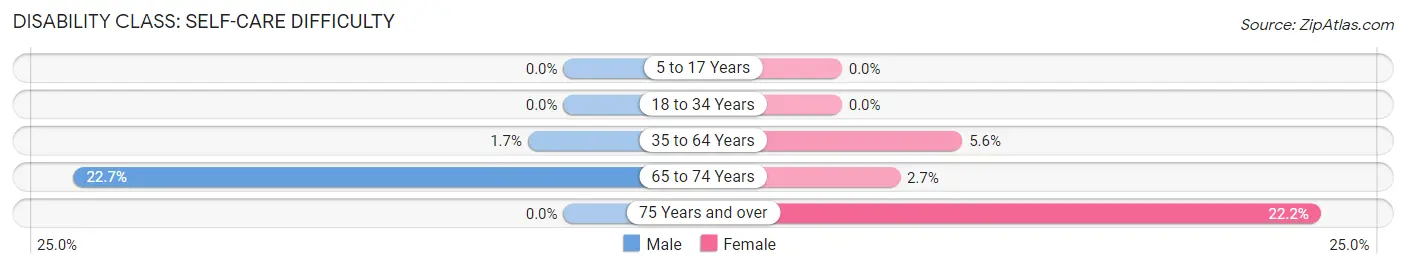
| Age Bracket | Male | Female |
| 5 to 17 Years | 0 (0.0%) | 0 (0.0%) |
| 18 to 34 Years | 0 (0.0%) | 0 (0.0%) |
| 35 to 64 Years | 6 (1.7%) | 16 (5.6%) |
| 65 to 74 Years | 20 (22.7%) | 4 (2.7%) |
| 75 Years and over | 0 (0.0%) | 26 (22.2%) |
Technology Access in Osburn
Computing Device Access in Osburn
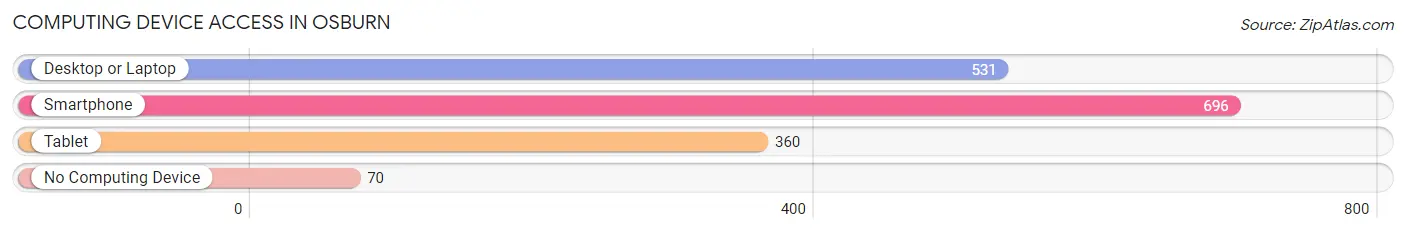
| Device Type | # Households | % Households |
| Desktop or Laptop | 531 | 65.4% |
| Smartphone | 696 | 85.7% |
| Tablet | 360 | 44.3% |
| No Computing Device | 70 | 8.6% |
| Total | 812 | 100.0% |
Internet Access in Osburn
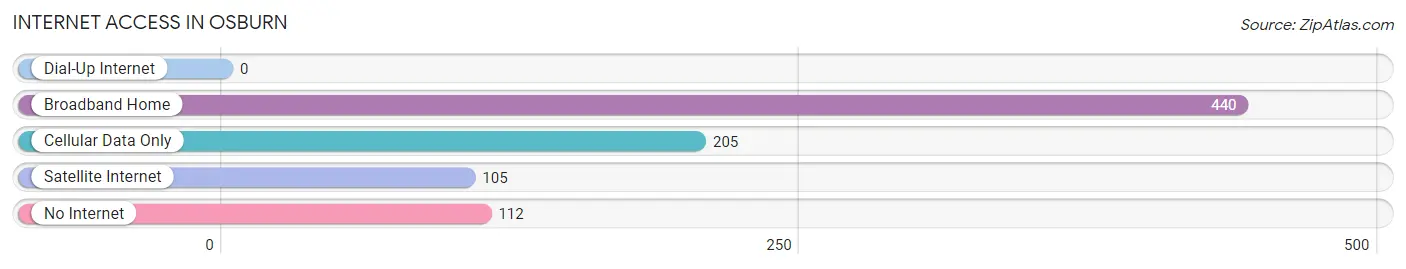
| Internet Type | # Households | % Households |
| Dial-Up Internet | 0 | 0.0% |
| Broadband Home | 440 | 54.2% |
| Cellular Data Only | 205 | 25.3% |
| Satellite Internet | 105 | 12.9% |
| No Internet | 112 | 13.8% |
| Total | 812 | 100.0% |
Osburn Summary
Osburn, Idaho is a small city located in Shoshone County in the northern part of the state. It is situated in the Coeur d'Alene Mountains, about 20 miles east of the city of Coeur d'Alene. The city has a population of about 1,500 people and is the county seat of Shoshone County.
History
Osburn was founded in 1883 by a group of miners who were looking for gold in the area. The town was named after a local prospector, William Osburn. The town quickly grew and by the early 1900s, it had become a bustling mining town with a population of over 1,000 people. The town was home to several saloons, hotels, and stores.
In the early 1900s, the mining industry began to decline and the population of Osburn began to decrease. In the 1920s, the town was hit hard by the Great Depression and many of the businesses closed. However, the town was able to survive and in the 1940s, the population began to increase again.
In the 1950s, the town began to experience a resurgence as the mining industry began to pick up again. The town was also home to a large lumber mill, which provided jobs for many of the residents. The town continued to grow and by the 1970s, the population had reached over 1,500 people.
Geography
Osburn is located in the northern part of Idaho, in Shoshone County. It is situated in the Coeur d'Alene Mountains, about 20 miles east of the city of Coeur d'Alene. The city is located at an elevation of 2,845 feet above sea level. The city is surrounded by forests and mountains, and is home to several lakes and rivers.
Economy
Osburn's economy is largely based on the mining industry. The town is home to several mining companies, which provide jobs for many of the residents. The town is also home to a large lumber mill, which provides jobs for many of the residents. In addition, the town is home to several small businesses, such as restaurants, stores, and other services.
Demographics
As of the 2010 census, the population of Osburn was 1,521 people. The racial makeup of the city was 95.3% White, 0.3% African American, 0.7% Native American, 0.3% Asian, 0.1% Pacific Islander, 0.7% from other races, and 2.0% from two or more races. Hispanic or Latino of any race were 2.3% of the population.
The median income for a household in the city was $35,938, and the median income for a family was $41,250. The per capita income for the city was $17,845. About 11.3% of families and 14.2% of the population were below the poverty line, including 18.2% of those under age 18 and 8.3% of those age 65 or over.
Common Questions
What is Per Capita Income in Osburn?
Per Capita income in Osburn is $27,350.
What is the Median Family Income in Osburn?
Median Family Income in Osburn is $49,265.
What is the Median Household income in Osburn?
Median Household Income in Osburn is $41,833.
What is Income or Wage Gap in Osburn?
Income or Wage Gap in Osburn is 68.8%.
Women in Osburn earn 31.2 cents for every dollar earned by a man.
What is Inequality or Gini Index in Osburn?
Inequality or Gini Index in Osburn is 0.39.
What is the Total Population of Osburn?
Total Population of Osburn is 1,625.
What is the Total Male Population of Osburn?
Total Male Population of Osburn is 787.
What is the Total Female Population of Osburn?
Total Female Population of Osburn is 838.
What is the Ratio of Males per 100 Females in Osburn?
There are 93.91 Males per 100 Females in Osburn.
What is the Ratio of Females per 100 Males in Osburn?
There are 106.48 Females per 100 Males in Osburn.
What is the Median Population Age in Osburn?
Median Population Age in Osburn is 45.6 Years.
What is the Average Family Size in Osburn
Average Family Size in Osburn is 2.9 People.
What is the Average Household Size in Osburn
Average Household Size in Osburn is 2.0 People.
How Large is the Labor Force in Osburn?
There are 783 People in the Labor Forcein in Osburn.
What is the Percentage of People in the Labor Force in Osburn?
59.2% of People are in the Labor Force in Osburn.
What is the Unemployment Rate in Osburn?
Unemployment Rate in Osburn is 3.7%.