Orofino, ID Map & Demographics
Orofino Map
Orofino Overview
$25,735
PER CAPITA INCOME
$75,865
AVG FAMILY INCOME
$51,518
AVG HOUSEHOLD INCOME
20.7%
WAGE / INCOME GAP [ % ]
79.3¢/ $1
WAGE / INCOME GAP [ $ ]
0.42
INEQUALITY / GINI INDEX
3,251
TOTAL POPULATION
1,939
MALE POPULATION
1,312
FEMALE POPULATION
147.79
MALES / 100 FEMALES
67.66
FEMALES / 100 MALES
42.1
MEDIAN AGE
3.2
AVG FAMILY SIZE
2.4
AVG HOUSEHOLD SIZE
1,226
LABOR FORCE [ PEOPLE ]
43.3%
PERCENT IN LABOR FORCE
3.7%
UNEMPLOYMENT RATE
Orofino Zip Codes
Orofino Area Codes
Income in Orofino
Income Overview in Orofino
Per Capita Income in Orofino is $25,735, while median incomes of families and households are $75,865 and $51,518 respectively.
| Characteristic | Number | Measure |
| Per Capita Income | 3,251 | $25,735 |
| Median Family Income | 571 | $75,865 |
| Mean Family Income | 571 | $78,785 |
| Median Household Income | 1,015 | $51,518 |
| Mean Household Income | 1,015 | $72,245 |
| Income Deficit | 571 | $0 |
| Wage / Income Gap (%) | 3,251 | 20.70% |
| Wage / Income Gap ($) | 3,251 | 79.30¢ per $1 |
| Gini / Inequality Index | 3,251 | 0.42 |
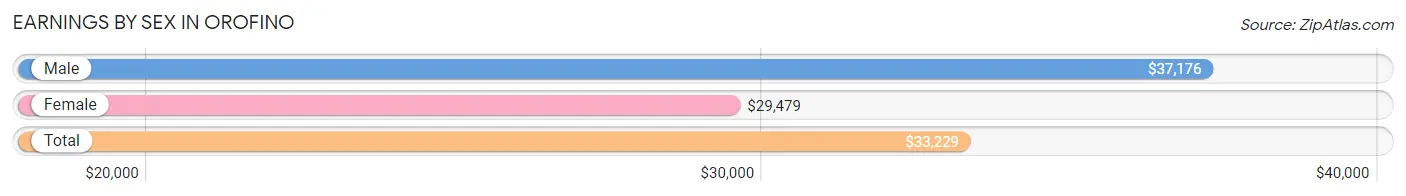
Earnings by Sex in Orofino
Average Earnings in Orofino are $33,229, $37,176 for men and $29,479 for women, a difference of 20.7%.
| Sex | Number | Average Earnings |
| Male | 715 (50.7%) | $37,176 |
| Female | 696 (49.3%) | $29,479 |
| Total | 1,411 (100.0%) | $33,229 |
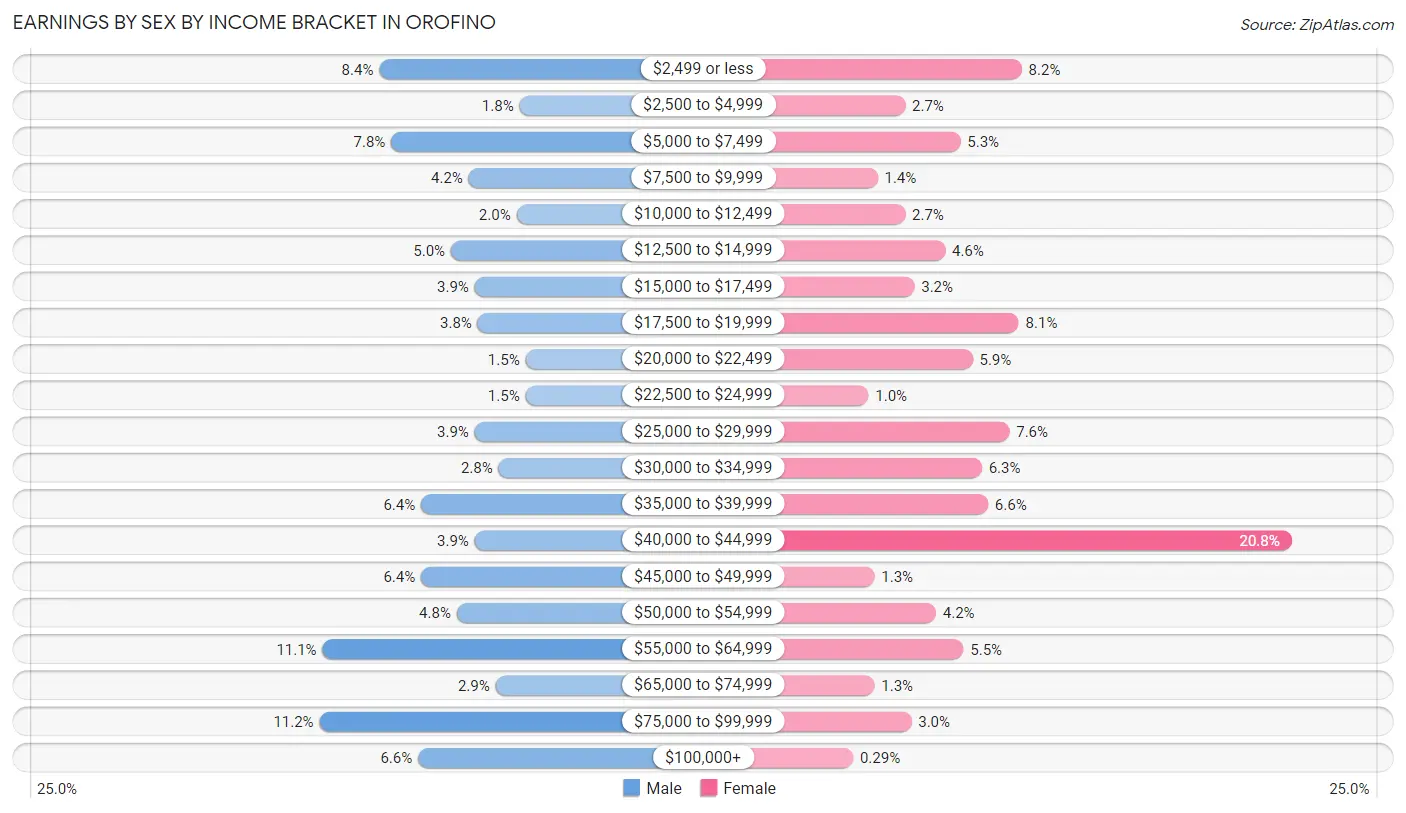
Earnings by Sex by Income Bracket in Orofino
The most common earnings brackets in Orofino are $75,000 to $99,999 for men (80 | 11.2%) and $40,000 to $44,999 for women (145 | 20.8%).
| Income | Male | Female |
| $2,499 or less | 60 (8.4%) | 57 (8.2%) |
| $2,500 to $4,999 | 13 (1.8%) | 19 (2.7%) |
| $5,000 to $7,499 | 56 (7.8%) | 37 (5.3%) |
| $7,500 to $9,999 | 30 (4.2%) | 10 (1.4%) |
| $10,000 to $12,499 | 14 (2.0%) | 19 (2.7%) |
| $12,500 to $14,999 | 36 (5.0%) | 32 (4.6%) |
| $15,000 to $17,499 | 28 (3.9%) | 22 (3.2%) |
| $17,500 to $19,999 | 27 (3.8%) | 56 (8.1%) |
| $20,000 to $22,499 | 11 (1.5%) | 41 (5.9%) |
| $22,500 to $24,999 | 11 (1.5%) | 7 (1.0%) |
| $25,000 to $29,999 | 28 (3.9%) | 53 (7.6%) |
| $30,000 to $34,999 | 20 (2.8%) | 44 (6.3%) |
| $35,000 to $39,999 | 46 (6.4%) | 46 (6.6%) |
| $40,000 to $44,999 | 28 (3.9%) | 145 (20.8%) |
| $45,000 to $49,999 | 46 (6.4%) | 9 (1.3%) |
| $50,000 to $54,999 | 34 (4.8%) | 29 (4.2%) |
| $55,000 to $64,999 | 79 (11.1%) | 38 (5.5%) |
| $65,000 to $74,999 | 21 (2.9%) | 9 (1.3%) |
| $75,000 to $99,999 | 80 (11.2%) | 21 (3.0%) |
| $100,000+ | 47 (6.6%) | 2 (0.3%) |
| Total | 715 (100.0%) | 696 (100.0%) |
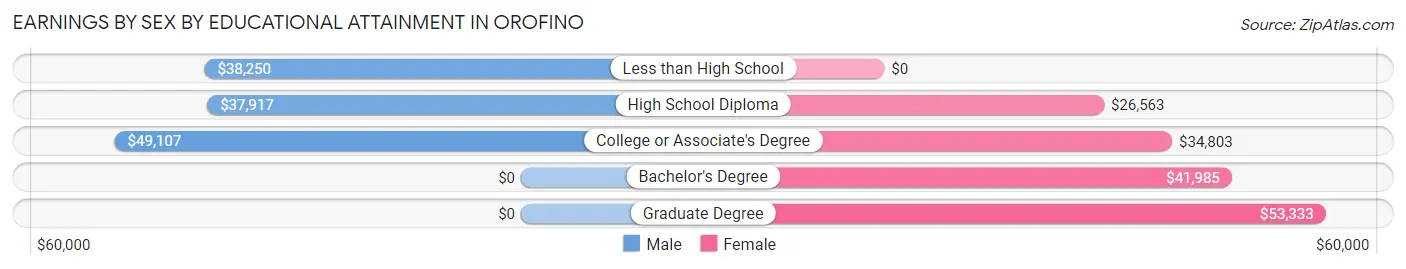
Earnings by Sex by Educational Attainment in Orofino
Average earnings in Orofino are $40,865 for men and $33,664 for women, a difference of 17.6%. Men with an educational attainment of college or associate's degree enjoy the highest average annual earnings of $49,107, while those with high school diploma education earn the least with $37,917. Women with an educational attainment of graduate degree earn the most with the average annual earnings of $53,333, while those with high school diploma education have the smallest earnings of $26,563.
| Educational Attainment | Male Income | Female Income |
| Less than High School | $38,250 | $0 |
| High School Diploma | $37,917 | $26,563 |
| College or Associate's Degree | $49,107 | $34,803 |
| Bachelor's Degree | - | - |
| Graduate Degree | - | - |
| Total | $40,865 | $33,664 |
Family Income in Orofino
Family Income Brackets in Orofino
According to the Orofino family income data, there are 145 families falling into the $75,000 to $99,999 income range, which is the most common income bracket and makes up 25.4% of all families. Conversely, the less than $10,000 income bracket is the least frequent group with only 6 families (1.1%) belonging to this category.
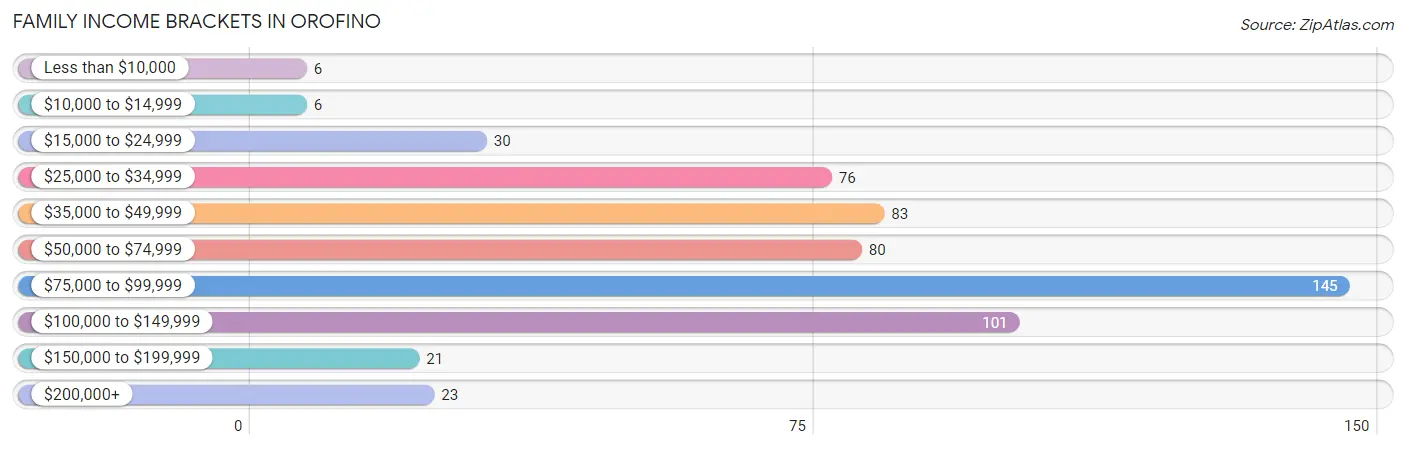
| Income Bracket | # Families | % Families |
| Less than $10,000 | 6 | 1.1% |
| $10,000 to $14,999 | 6 | 1.1% |
| $15,000 to $24,999 | 30 | 5.3% |
| $25,000 to $34,999 | 76 | 13.3% |
| $35,000 to $49,999 | 83 | 14.5% |
| $50,000 to $74,999 | 80 | 14.0% |
| $75,000 to $99,999 | 145 | 25.4% |
| $100,000 to $149,999 | 101 | 17.7% |
| $150,000 to $199,999 | 21 | 3.7% |
| $200,000+ | 23 | 4.0% |
Family Income by Famaliy Size in Orofino
5-person families (59 | 10.3%) account for the highest median family income in Orofino with $116,719 per family, while 2-person families (331 | 58.0%) have the highest median income of $37,448 per family member.
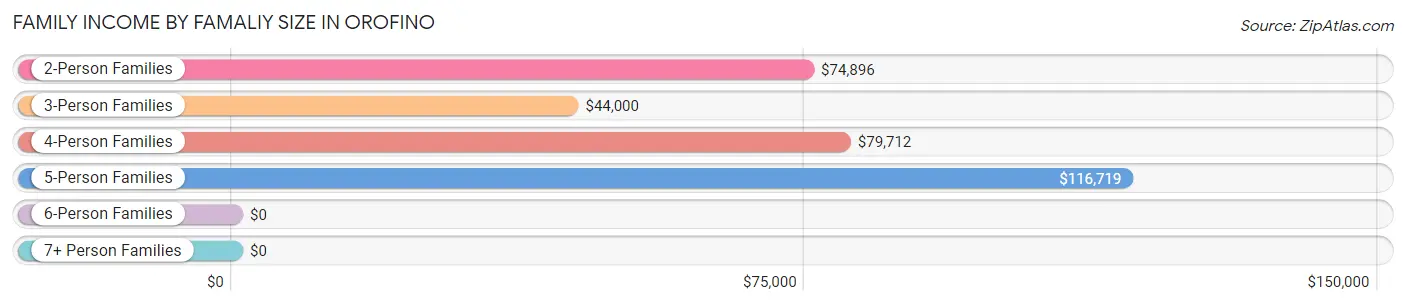
| Income Bracket | # Families | Median Income |
| 2-Person Families | 331 (58.0%) | $74,896 |
| 3-Person Families | 126 (22.1%) | $44,000 |
| 4-Person Families | 41 (7.2%) | $79,712 |
| 5-Person Families | 59 (10.3%) | $116,719 |
| 6-Person Families | 10 (1.8%) | $0 |
| 7+ Person Families | 4 (0.7%) | $0 |
| Total | 571 (100.0%) | $75,865 |
Family Income by Number of Earners in Orofino
The median family income in Orofino is $75,865, with families comprising 3+ earners (21) having the highest median family income of $129,792, while families with 1 earner (172) have the lowest median family income of $48,000, accounting for 3.7% and 30.1% of families, respectively.
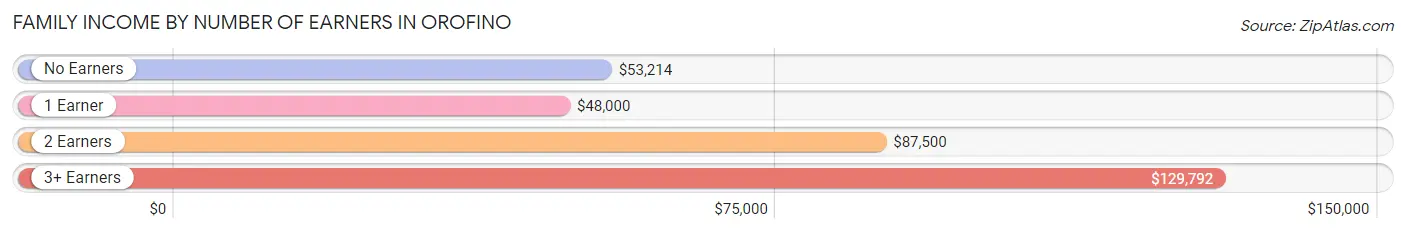
| Number of Earners | # Families | Median Income |
| No Earners | 106 (18.6%) | $53,214 |
| 1 Earner | 172 (30.1%) | $48,000 |
| 2 Earners | 272 (47.6%) | $87,500 |
| 3+ Earners | 21 (3.7%) | $129,792 |
| Total | 571 (100.0%) | $75,865 |
Household Income in Orofino
Household Income Brackets in Orofino
With 206 households falling in the category, the $75,000 to $99,999 income range is the most frequent in Orofino, accounting for 20.3% of all households. In contrast, only 10 households (1.0%) fall into the less than $10,000 income bracket, making it the least populous group.
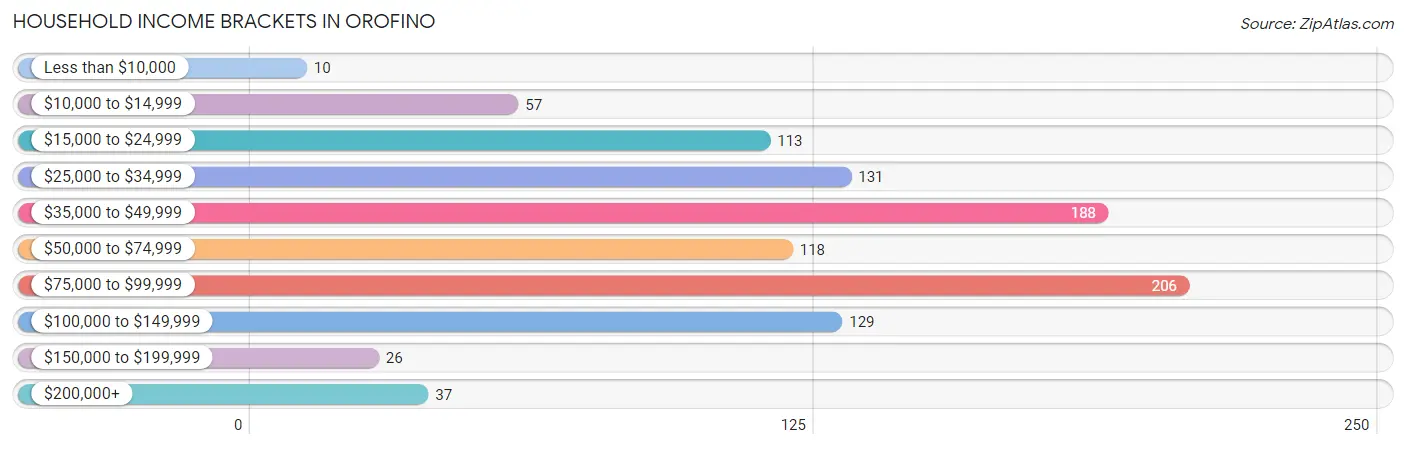
| Income Bracket | # Households | % Households |
| Less than $10,000 | 10 | 1.0% |
| $10,000 to $14,999 | 57 | 5.6% |
| $15,000 to $24,999 | 113 | 11.1% |
| $25,000 to $34,999 | 131 | 12.9% |
| $35,000 to $49,999 | 188 | 18.5% |
| $50,000 to $74,999 | 118 | 11.6% |
| $75,000 to $99,999 | 206 | 20.3% |
| $100,000 to $149,999 | 129 | 12.7% |
| $150,000 to $199,999 | 26 | 2.6% |
| $200,000+ | 37 | 3.6% |
Household Income by Householder Age in Orofino
The median household income in Orofino is $51,518, with the highest median household income of $74,038 found in the 25 to 44 years age bracket for the primary householder. A total of 282 households (27.8%) fall into this category. Meanwhile, the 15 to 24 years age bracket for the primary householder has the lowest median household income of $0, with 16 households (1.6%) in this group.
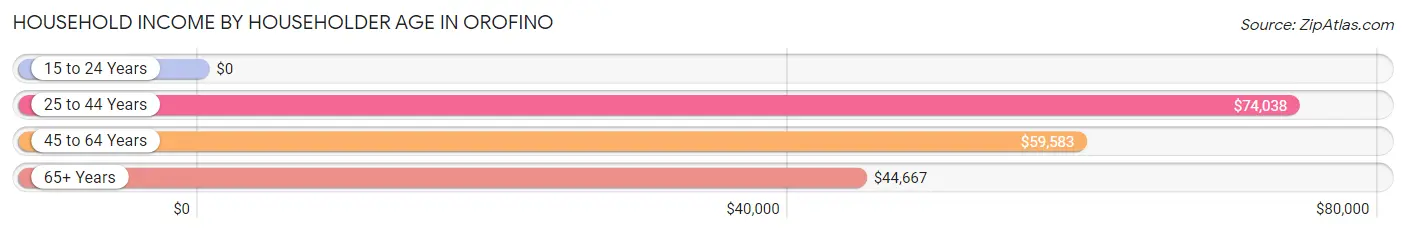
| Income Bracket | # Households | Median Income |
| 15 to 24 Years | 16 (1.6%) | $0 |
| 25 to 44 Years | 282 (27.8%) | $74,038 |
| 45 to 64 Years | 391 (38.5%) | $59,583 |
| 65+ Years | 326 (32.1%) | $44,667 |
| Total | 1,015 (100.0%) | $51,518 |
Poverty in Orofino
Income Below Poverty by Sex and Age in Orofino
With 4.5% poverty level for males and 11.5% for females among the residents of Orofino, 12 to 14 year old males and 12 to 14 year old females are the most vulnerable to poverty, with 6 males (11.3%) and 5 females (41.7%) in their respective age groups living below the poverty level.
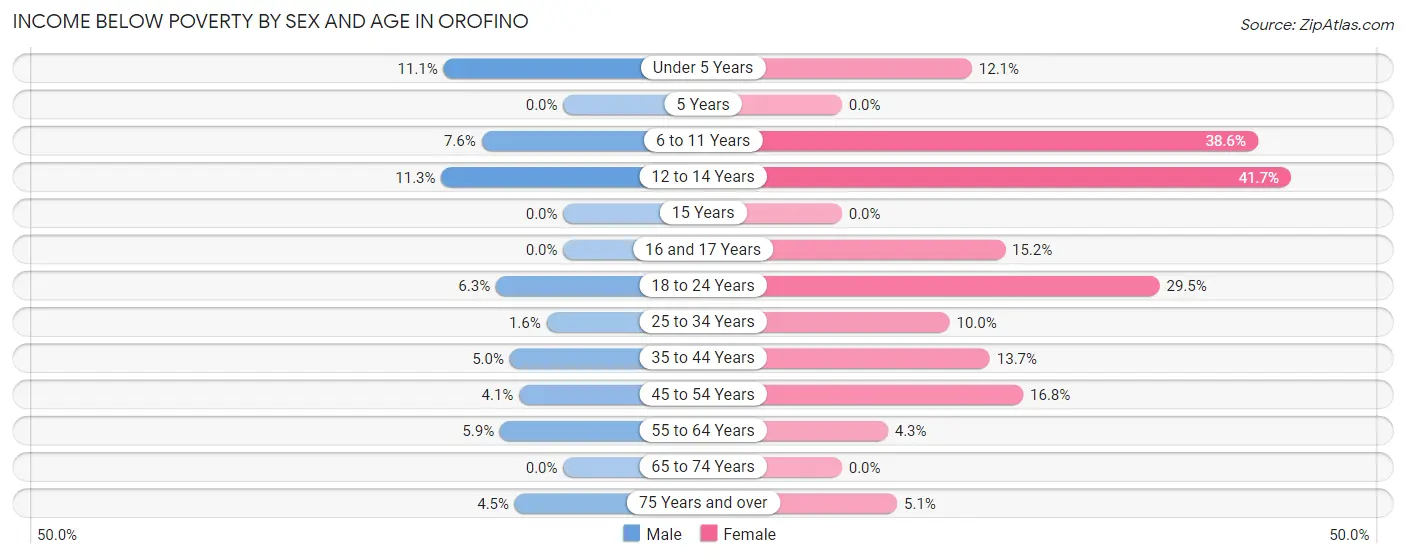
| Age Bracket | Male | Female |
| Under 5 Years | 6 (11.1%) | 7 (12.1%) |
| 5 Years | 0 (0.0%) | 0 (0.0%) |
| 6 to 11 Years | 6 (7.6%) | 22 (38.6%) |
| 12 to 14 Years | 6 (11.3%) | 5 (41.7%) |
| 15 Years | 0 (0.0%) | 0 (0.0%) |
| 16 and 17 Years | 0 (0.0%) | 5 (15.1%) |
| 18 to 24 Years | 5 (6.2%) | 23 (29.5%) |
| 25 to 34 Years | 2 (1.6%) | 15 (10.0%) |
| 35 to 44 Years | 8 (5.0%) | 29 (13.7%) |
| 45 to 54 Years | 5 (4.1%) | 17 (16.8%) |
| 55 to 64 Years | 11 (5.9%) | 10 (4.3%) |
| 65 to 74 Years | 0 (0.0%) | 0 (0.0%) |
| 75 Years and over | 5 (4.5%) | 8 (5.1%) |
| Total | 54 (4.5%) | 141 (11.5%) |
Income Above Poverty by Sex and Age in Orofino
According to the poverty statistics in Orofino, males aged 5 years and females aged 5 years are the age groups that are most secure financially, with 100.0% of males and 100.0% of females in these age groups living above the poverty line.
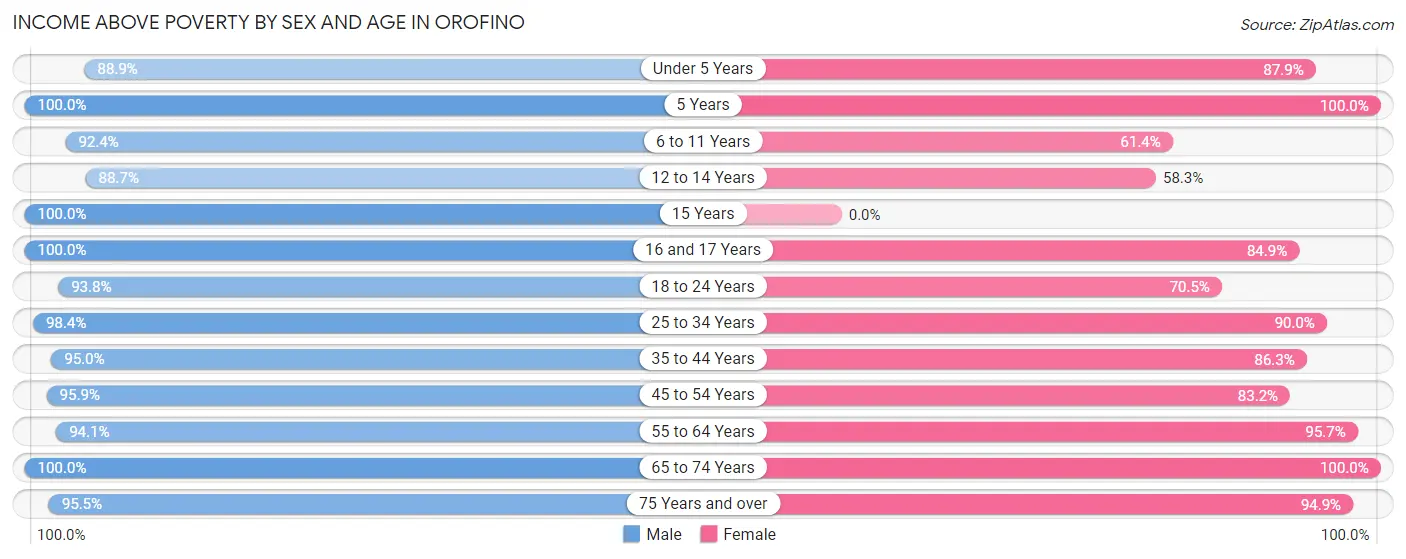
| Age Bracket | Male | Female |
| Under 5 Years | 48 (88.9%) | 51 (87.9%) |
| 5 Years | 35 (100.0%) | 17 (100.0%) |
| 6 to 11 Years | 73 (92.4%) | 35 (61.4%) |
| 12 to 14 Years | 47 (88.7%) | 7 (58.3%) |
| 15 Years | 43 (100.0%) | 0 (0.0%) |
| 16 and 17 Years | 13 (100.0%) | 28 (84.9%) |
| 18 to 24 Years | 75 (93.8%) | 55 (70.5%) |
| 25 to 34 Years | 126 (98.4%) | 135 (90.0%) |
| 35 to 44 Years | 153 (95.0%) | 182 (86.3%) |
| 45 to 54 Years | 117 (95.9%) | 84 (83.2%) |
| 55 to 64 Years | 176 (94.1%) | 224 (95.7%) |
| 65 to 74 Years | 146 (100.0%) | 119 (100.0%) |
| 75 Years and over | 106 (95.5%) | 148 (94.9%) |
| Total | 1,158 (95.5%) | 1,085 (88.5%) |
Income Below Poverty Among Married-Couple Families in Orofino
The poverty statistics for married-couple families in Orofino show that 1.8% or 8 of the total 455 families live below the poverty line. Families with 1 or 2 children have the highest poverty rate of 8.4%, comprising of 8 families. On the other hand, families with no children have the lowest poverty rate of 0.0%, which includes 0 families.
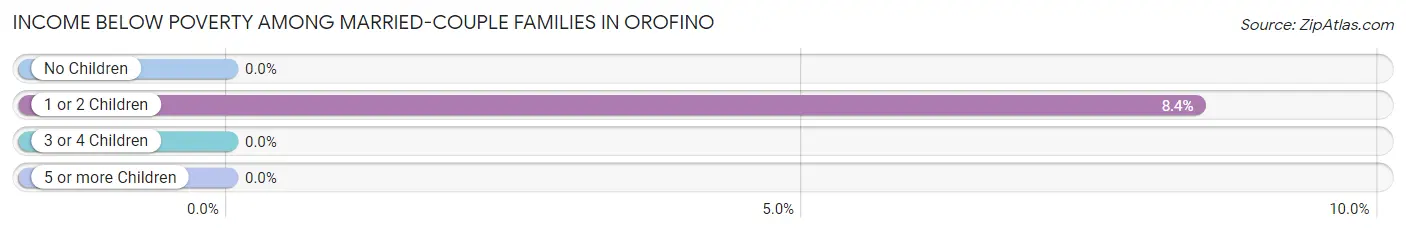
| Children | Above Poverty | Below Poverty |
| No Children | 314 (100.0%) | 0 (0.0%) |
| 1 or 2 Children | 87 (91.6%) | 8 (8.4%) |
| 3 or 4 Children | 46 (100.0%) | 0 (0.0%) |
| 5 or more Children | 0 (0.0%) | 0 (0.0%) |
| Total | 447 (98.2%) | 8 (1.8%) |
Income Below Poverty Among Single-Parent Households in Orofino
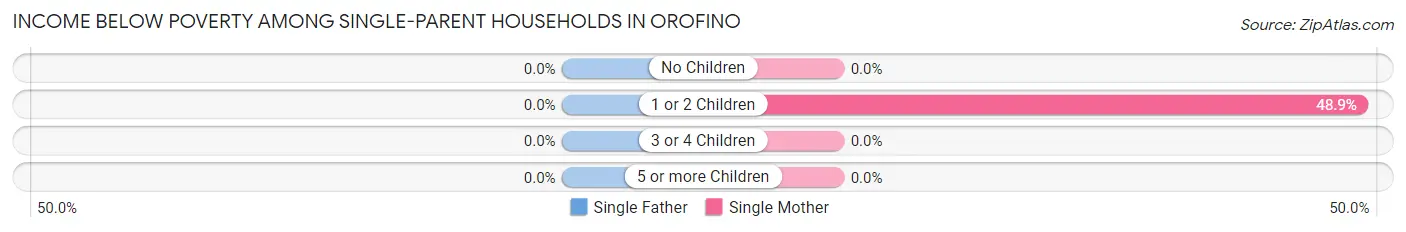
| Children | Single Father | Single Mother |
| No Children | 0 (0.0%) | 0 (0.0%) |
| 1 or 2 Children | 0 (0.0%) | 22 (48.9%) |
| 3 or 4 Children | 0 (0.0%) | 0 (0.0%) |
| 5 or more Children | 0 (0.0%) | 0 (0.0%) |
| Total | 0 (0.0%) | 22 (36.1%) |
Income Below Poverty Among Married-Couple vs Single-Parent Households in Orofino
The poverty data for Orofino shows that 8 of the married-couple family households (1.8%) and 22 of the single-parent households (19.0%) are living below the poverty level. Within the married-couple family households, those with 1 or 2 children have the highest poverty rate, with 8 households (8.4%) falling below the poverty line. Among the single-parent households, those with 1 or 2 children have the highest poverty rate, with 22 household (25.0%) living below poverty.
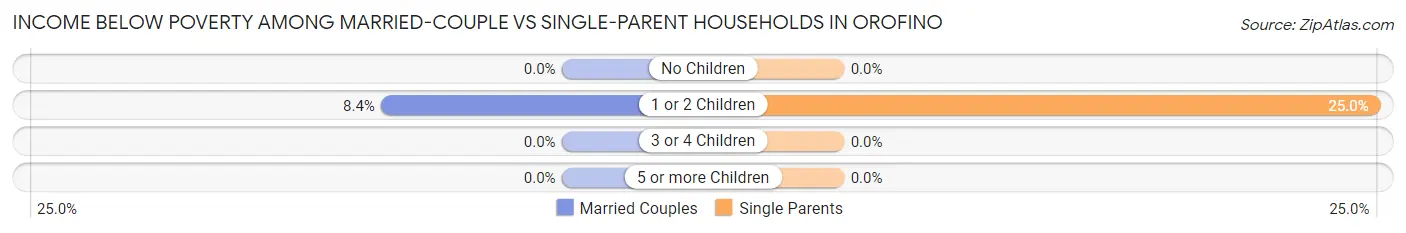
| Children | Married-Couple Families | Single-Parent Households |
| No Children | 0 (0.0%) | 0 (0.0%) |
| 1 or 2 Children | 8 (8.4%) | 22 (25.0%) |
| 3 or 4 Children | 0 (0.0%) | 0 (0.0%) |
| 5 or more Children | 0 (0.0%) | 0 (0.0%) |
| Total | 8 (1.8%) | 22 (19.0%) |
Race in Orofino
The most populous races in Orofino are White / Caucasian (2,833 | 87.1%), Two or more Races (273 | 8.4%), and Hispanic or Latino (145 | 4.5%).
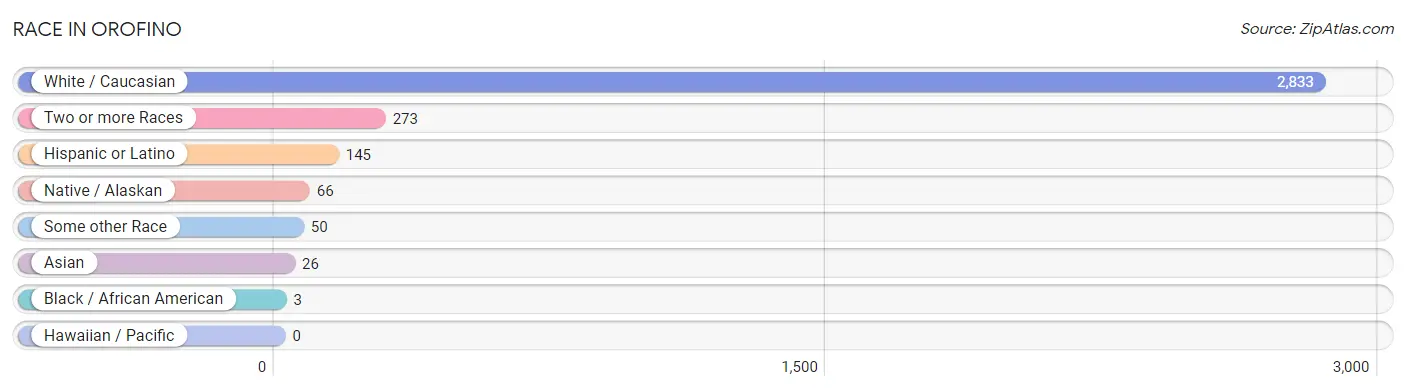
| Race | # Population | % Population |
| Asian | 26 | 0.8% |
| Black / African American | 3 | 0.1% |
| Hawaiian / Pacific | 0 | 0.0% |
| Hispanic or Latino | 145 | 4.5% |
| Native / Alaskan | 66 | 2.0% |
| White / Caucasian | 2,833 | 87.1% |
| Two or more Races | 273 | 8.4% |
| Some other Race | 50 | 1.5% |
| Total | 3,251 | 100.0% |
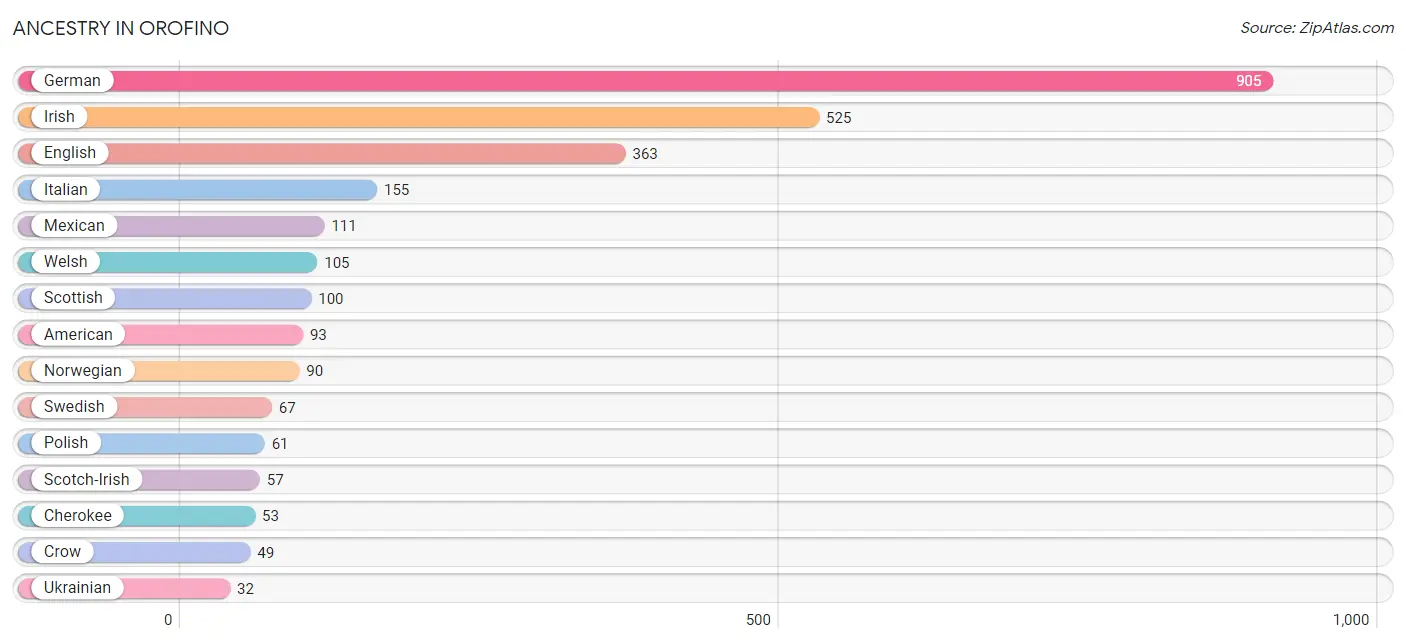
Ancestry in Orofino
The most populous ancestries reported in Orofino are German (905 | 27.8%), Irish (525 | 16.2%), English (363 | 11.2%), Italian (155 | 4.8%), and Mexican (111 | 3.4%), together accounting for 63.3% of all Orofino residents.
| Ancestry | # Population | % Population |
| African | 3 | 0.1% |
| Alaska Native | 1 | 0.0% |
| American | 93 | 2.9% |
| Arab | 6 | 0.2% |
| Austrian | 5 | 0.2% |
| Blackfeet | 5 | 0.2% |
| British | 8 | 0.3% |
| Burmese | 16 | 0.5% |
| Celtic | 1 | 0.0% |
| Cherokee | 53 | 1.6% |
| Cheyenne | 4 | 0.1% |
| Choctaw | 6 | 0.2% |
| Croatian | 10 | 0.3% |
| Crow | 49 | 1.5% |
| Czech | 7 | 0.2% |
| Czechoslovakian | 4 | 0.1% |
| Danish | 27 | 0.8% |
| Dutch | 20 | 0.6% |
| English | 363 | 11.2% |
| European | 8 | 0.3% |
| Finnish | 12 | 0.4% |
| French | 28 | 0.9% |
| French Canadian | 18 | 0.5% |
| German | 905 | 27.8% |
| Indian (Asian) | 3 | 0.1% |
| Irish | 525 | 16.2% |
| Italian | 155 | 4.8% |
| Korean | 19 | 0.6% |
| Lebanese | 6 | 0.2% |
| Mexican | 111 | 3.4% |
| Northern European | 20 | 0.6% |
| Norwegian | 90 | 2.8% |
| Paiute | 16 | 0.5% |
| Polish | 61 | 1.9% |
| Portuguese | 2 | 0.1% |
| Puerto Rican | 3 | 0.1% |
| Russian | 9 | 0.3% |
| Scandinavian | 31 | 0.9% |
| Scotch-Irish | 57 | 1.8% |
| Scottish | 100 | 3.1% |
| Sioux | 5 | 0.2% |
| Slavic | 6 | 0.2% |
| Spanish | 23 | 0.7% |
| Subsaharan African | 3 | 0.1% |
| Swedish | 67 | 2.1% |
| Swiss | 2 | 0.1% |
| Tlingit-Haida | 9 | 0.3% |
| Ukrainian | 32 | 1.0% |
| Welsh | 105 | 3.2% |
| Yugoslavian | 7 | 0.2% | View All 50 Rows |
Immigrants in Orofino
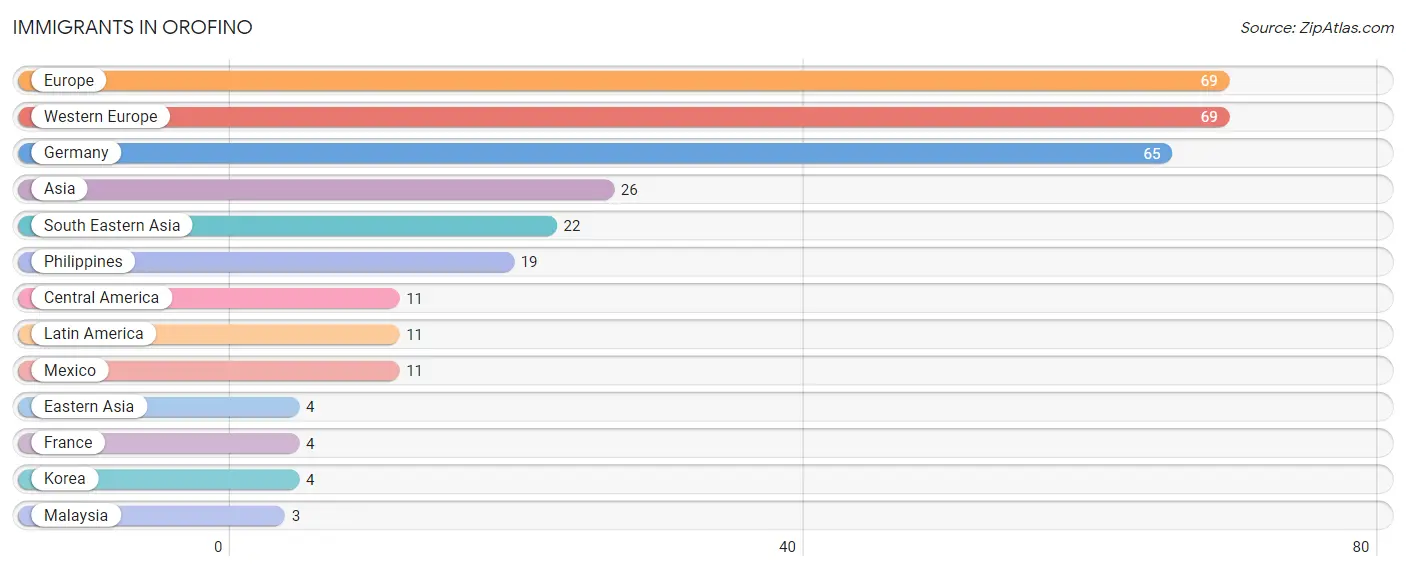
The most numerous immigrant groups reported in Orofino came from Europe (69 | 2.1%), Western Europe (69 | 2.1%), Germany (65 | 2.0%), Asia (26 | 0.8%), and South Eastern Asia (22 | 0.7%), together accounting for 7.7% of all Orofino residents.
| Immigration Origin | # Population | % Population |
| Asia | 26 | 0.8% |
| Central America | 11 | 0.3% |
| Eastern Asia | 4 | 0.1% |
| Europe | 69 | 2.1% |
| France | 4 | 0.1% |
| Germany | 65 | 2.0% |
| Korea | 4 | 0.1% |
| Latin America | 11 | 0.3% |
| Malaysia | 3 | 0.1% |
| Mexico | 11 | 0.3% |
| Philippines | 19 | 0.6% |
| South Eastern Asia | 22 | 0.7% |
| Western Europe | 69 | 2.1% | View All 13 Rows |
Sex and Age in Orofino
Sex and Age in Orofino
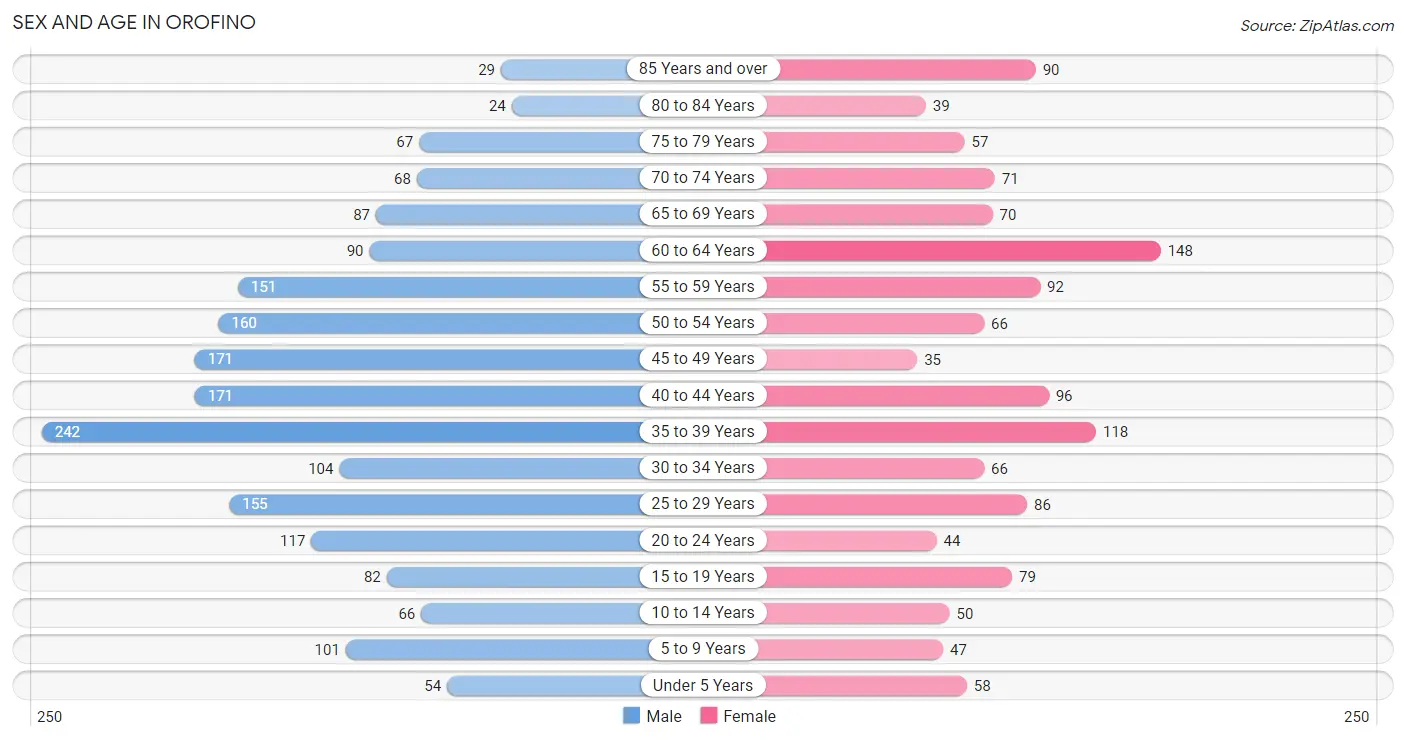
The most populous age groups in Orofino are 35 to 39 Years (242 | 12.5%) for men and 60 to 64 Years (148 | 11.3%) for women.
| Age Bracket | Male | Female |
| Under 5 Years | 54 (2.8%) | 58 (4.4%) |
| 5 to 9 Years | 101 (5.2%) | 47 (3.6%) |
| 10 to 14 Years | 66 (3.4%) | 50 (3.8%) |
| 15 to 19 Years | 82 (4.2%) | 79 (6.0%) |
| 20 to 24 Years | 117 (6.0%) | 44 (3.4%) |
| 25 to 29 Years | 155 (8.0%) | 86 (6.6%) |
| 30 to 34 Years | 104 (5.4%) | 66 (5.0%) |
| 35 to 39 Years | 242 (12.5%) | 118 (9.0%) |
| 40 to 44 Years | 171 (8.8%) | 96 (7.3%) |
| 45 to 49 Years | 171 (8.8%) | 35 (2.7%) |
| 50 to 54 Years | 160 (8.3%) | 66 (5.0%) |
| 55 to 59 Years | 151 (7.8%) | 92 (7.0%) |
| 60 to 64 Years | 90 (4.6%) | 148 (11.3%) |
| 65 to 69 Years | 87 (4.5%) | 70 (5.3%) |
| 70 to 74 Years | 68 (3.5%) | 71 (5.4%) |
| 75 to 79 Years | 67 (3.5%) | 57 (4.3%) |
| 80 to 84 Years | 24 (1.2%) | 39 (3.0%) |
| 85 Years and over | 29 (1.5%) | 90 (6.9%) |
| Total | 1,939 (100.0%) | 1,312 (100.0%) |
Families and Households in Orofino
Median Family Size in Orofino
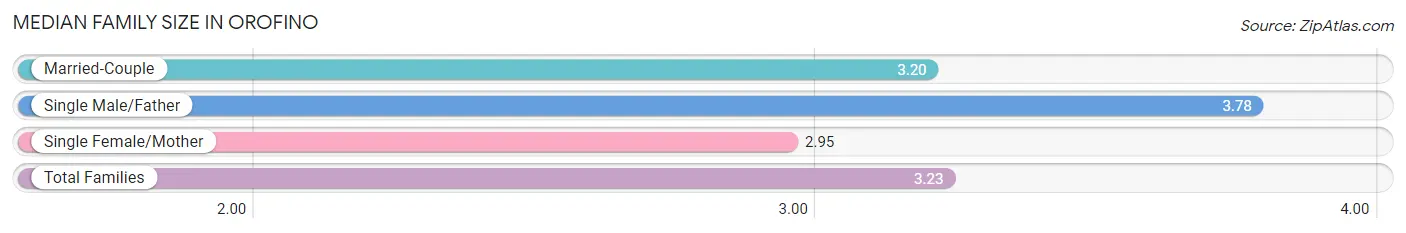
The median family size in Orofino is 3.23 persons per family, with single male/father families (55 | 9.6%) accounting for the largest median family size of 3.78 persons per family. On the other hand, single female/mother families (61 | 10.7%) represent the smallest median family size with 2.95 persons per family.
| Family Type | # Families | Family Size |
| Married-Couple | 455 (79.7%) | 3.20 |
| Single Male/Father | 55 (9.6%) | 3.78 |
| Single Female/Mother | 61 (10.7%) | 2.95 |
| Total Families | 571 (100.0%) | 3.23 |
Median Household Size in Orofino
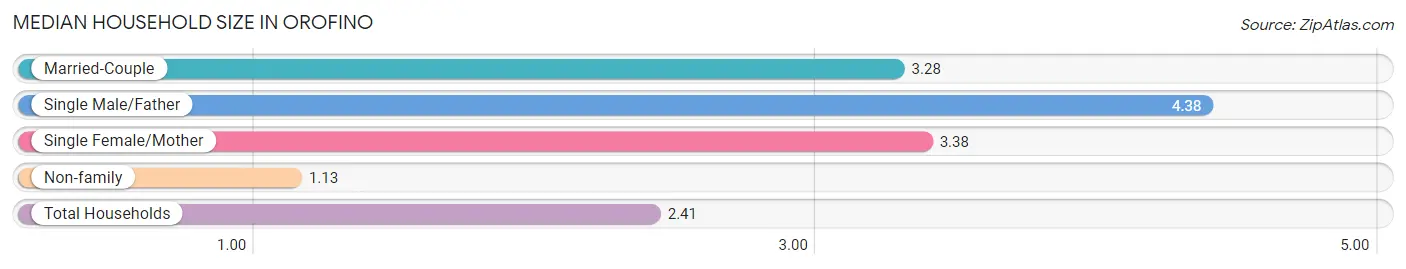
The median household size in Orofino is 2.41 persons per household, with single male/father households (55 | 5.4%) accounting for the largest median household size of 4.38 persons per household. non-family households (444 | 43.7%) represent the smallest median household size with 1.13 persons per household.
| Household Type | # Households | Household Size |
| Married-Couple | 455 (44.8%) | 3.28 |
| Single Male/Father | 55 (5.4%) | 4.38 |
| Single Female/Mother | 61 (6.0%) | 3.38 |
| Non-family | 444 (43.7%) | 1.13 |
| Total Households | 1,015 (100.0%) | 2.41 |
Household Size by Marriage Status in Orofino
Out of a total of 1,015 households in Orofino, 571 (56.3%) are family households, while 444 (43.7%) are nonfamily households. The most numerous type of family households are 2-person households, comprising 299, and the most common type of nonfamily households are 1-person households, comprising 401.
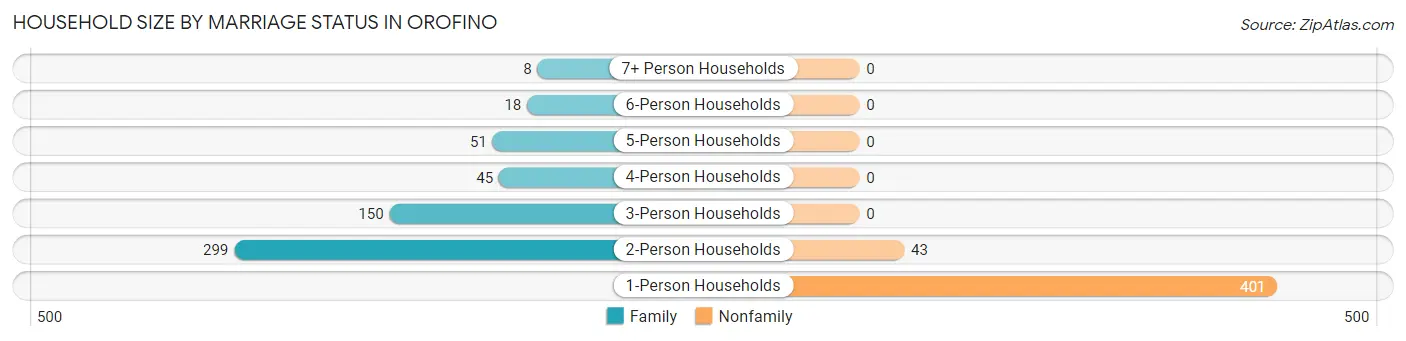
| Household Size | Family Households | Nonfamily Households |
| 1-Person Households | - | 401 (39.5%) |
| 2-Person Households | 299 (29.5%) | 43 (4.2%) |
| 3-Person Households | 150 (14.8%) | 0 (0.0%) |
| 4-Person Households | 45 (4.4%) | 0 (0.0%) |
| 5-Person Households | 51 (5.0%) | 0 (0.0%) |
| 6-Person Households | 18 (1.8%) | 0 (0.0%) |
| 7+ Person Households | 8 (0.8%) | 0 (0.0%) |
| Total | 571 (56.3%) | 444 (43.7%) |
Female Fertility in Orofino
Fertility by Age in Orofino
Average fertility rate in Orofino is 37.0 births per 1,000 women. Women in the age bracket of 20 to 34 years have the highest fertility rate with 102.0 births per 1,000 women. Women in the age bracket of 20 to 34 years acount for 100.0% of all women with births.
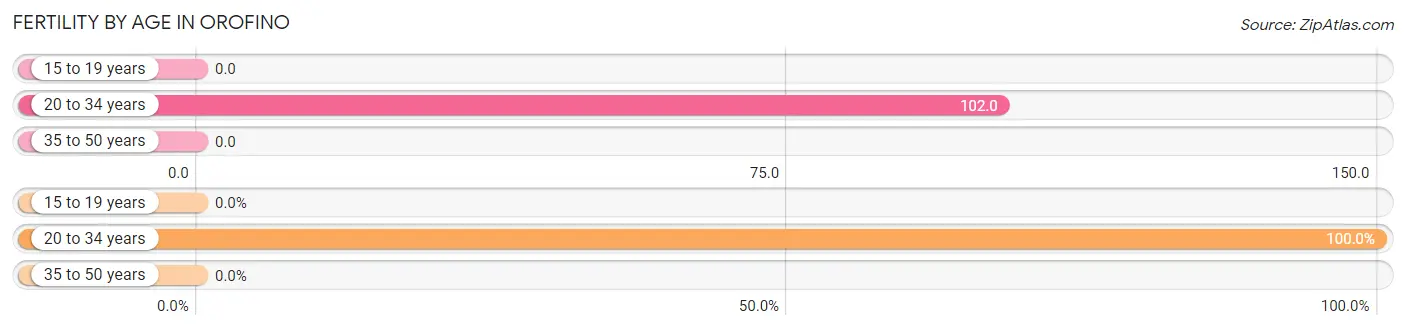
| Age Bracket | Women with Births | Births / 1,000 Women |
| 15 to 19 years | 0 (0.0%) | 0.0 |
| 20 to 34 years | 20 (100.0%) | 102.0 |
| 35 to 50 years | 0 (0.0%) | 0.0 |
| Total | 20 (100.0%) | 37.0 |
Fertility by Age by Marriage Status in Orofino
30.0% of women with births (20) in Orofino are married. The highest percentage of unmarried women with births falls into 20 to 34 years age bracket with 70.0% of them unmarried at the time of birth, while the lowest percentage of unmarried women with births belong to 20 to 34 years age bracket with 70.0% of them unmarried.
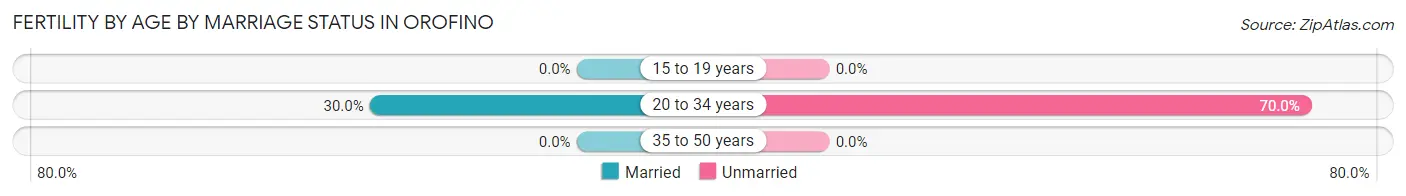
| Age Bracket | Married | Unmarried |
| 15 to 19 years | 0 (0.0%) | 0 (0.0%) |
| 20 to 34 years | 6 (30.0%) | 14 (70.0%) |
| 35 to 50 years | 0 (0.0%) | 0 (0.0%) |
| Total | 6 (30.0%) | 14 (70.0%) |
Fertility by Education in Orofino
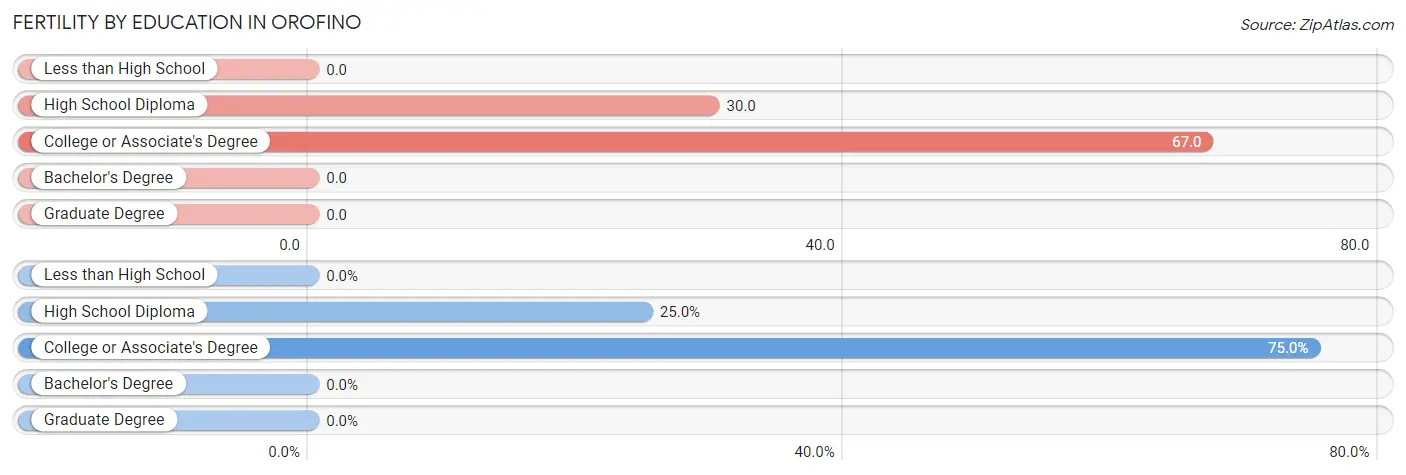
| Educational Attainment | Women with Births | Births / 1,000 Women |
| Less than High School | 0 (0.0%) | 0.0 |
| High School Diploma | 5 (25.0%) | 30.0 |
| College or Associate's Degree | 15 (75.0%) | 67.0 |
| Bachelor's Degree | 0 (0.0%) | 0.0 |
| Graduate Degree | 0 (0.0%) | 0.0 |
| Total | 20 (100.0%) | 37.0 |
Fertility by Education by Marriage Status in Orofino
70.0% of women with births in Orofino are unmarried. Women with the educational attainment of college or associate's degree are most likely to be married with 40.0% of them married at childbirth, while women with the educational attainment of high school diploma are least likely to be married with 100.0% of them unmarried at childbirth.
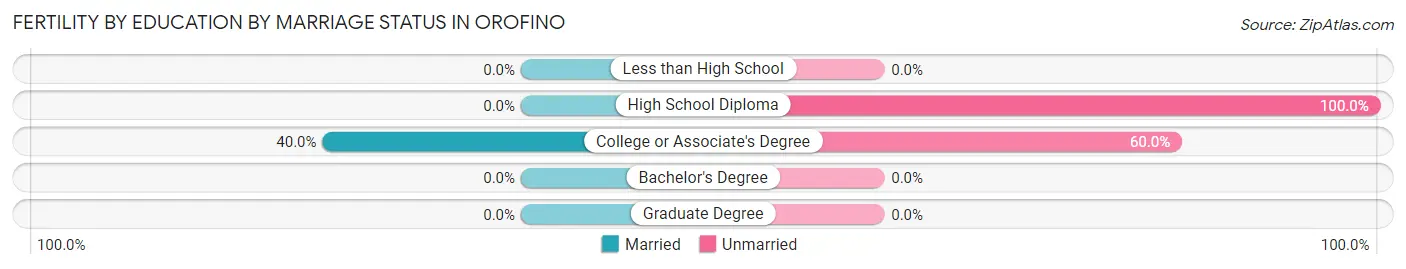
| Educational Attainment | Married | Unmarried |
| Less than High School | 0 (0.0%) | 0 (0.0%) |
| High School Diploma | 0 (0.0%) | 5 (100.0%) |
| College or Associate's Degree | 6 (40.0%) | 9 (60.0%) |
| Bachelor's Degree | 0 (0.0%) | 0 (0.0%) |
| Graduate Degree | 0 (0.0%) | 0 (0.0%) |
| Total | 6 (30.0%) | 14 (70.0%) |
Employment Characteristics in Orofino
Employment by Class of Employer in Orofino
Among the 1,162 employed individuals in Orofino, private company employees (621 | 53.4%), state government employees (212 | 18.2%), and self-employed (not incorporated) (85 | 7.3%) make up the most common classes of employment.
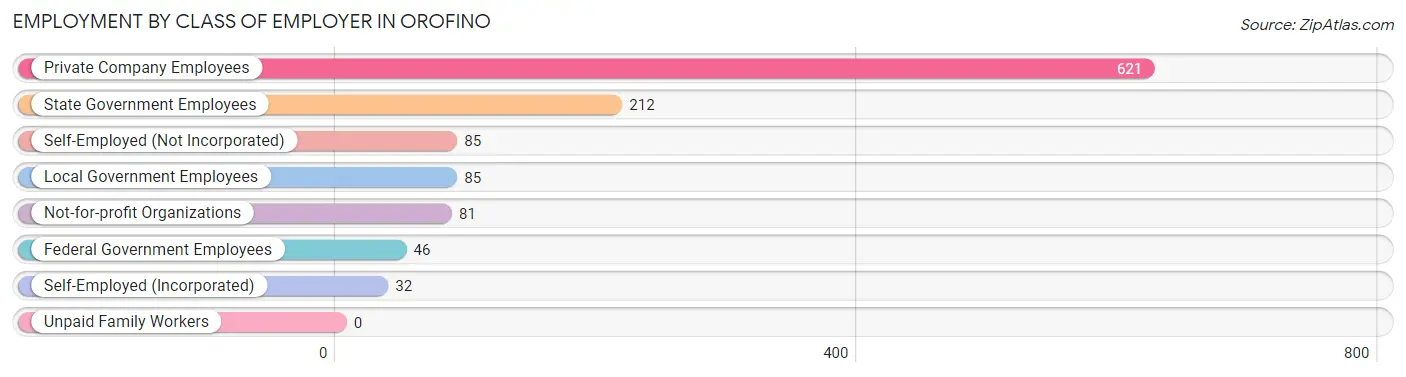
| Employer Class | # Employees | % Employees |
| Private Company Employees | 621 | 53.4% |
| Self-Employed (Incorporated) | 32 | 2.8% |
| Self-Employed (Not Incorporated) | 85 | 7.3% |
| Not-for-profit Organizations | 81 | 7.0% |
| Local Government Employees | 85 | 7.3% |
| State Government Employees | 212 | 18.2% |
| Federal Government Employees | 46 | 4.0% |
| Unpaid Family Workers | 0 | 0.0% |
| Total | 1,162 | 100.0% |
Employment Status by Age in Orofino
According to the labor force statistics for Orofino, out of the total population over 16 years of age (2,832), 43.3% or 1,226 individuals are in the labor force, with 3.7% or 45 of them unemployed. The age group with the highest labor force participation rate is 60 to 64 years, with 71.0% or 169 individuals in the labor force. Within the labor force, the 16 to 19 years age range has the highest percentage of unemployed individuals, with 13.5% or 7 of them being unemployed.
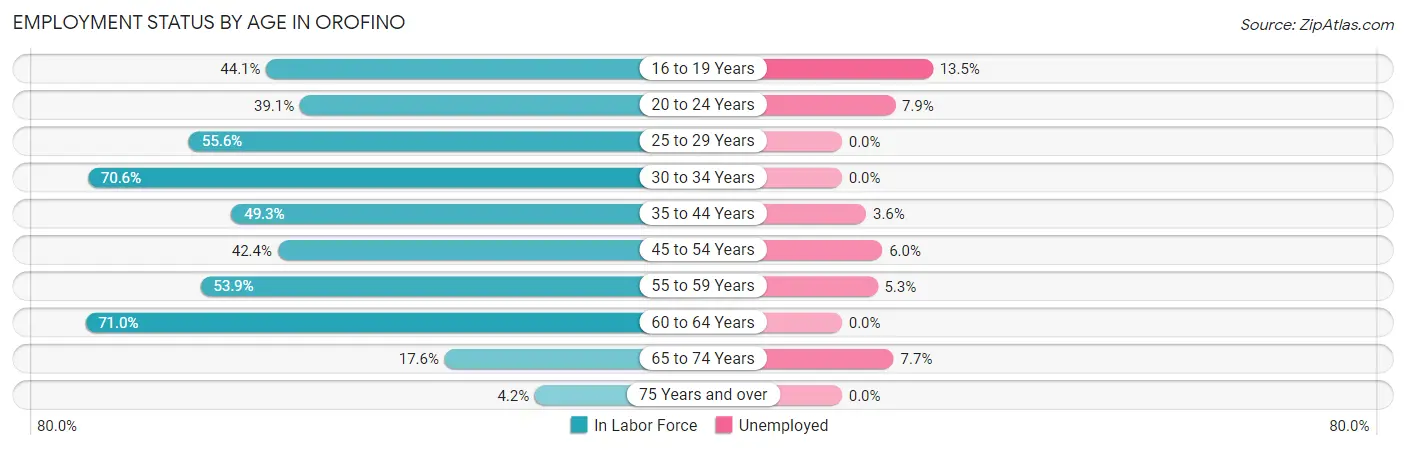
| Age Bracket | In Labor Force | Unemployed |
| 16 to 19 Years | 52 (44.1%) | 7 (13.5%) |
| 20 to 24 Years | 63 (39.1%) | 5 (7.9%) |
| 25 to 29 Years | 134 (55.6%) | 0 (0.0%) |
| 30 to 34 Years | 120 (70.6%) | 0 (0.0%) |
| 35 to 44 Years | 309 (49.3%) | 11 (3.6%) |
| 45 to 54 Years | 183 (42.4%) | 11 (6.0%) |
| 55 to 59 Years | 131 (53.9%) | 7 (5.3%) |
| 60 to 64 Years | 169 (71.0%) | 0 (0.0%) |
| 65 to 74 Years | 52 (17.6%) | 4 (7.7%) |
| 75 Years and over | 13 (4.2%) | 0 (0.0%) |
| Total | 1,226 (43.3%) | 45 (3.7%) |
Employment Status by Educational Attainment in Orofino
According to labor force statistics for Orofino, 53.6% of individuals (1,046) out of the total population between 25 and 64 years of age (1,951) are in the labor force, with 2.8% or 29 of them being unemployed. The group with the highest labor force participation rate are those with the educational attainment of bachelor's degree or higher, with 69.6% or 197 individuals in the labor force. Within the labor force, individuals with college / associate degree education have the highest percentage of unemployment, with 4.2% or 18 of them being unemployed.
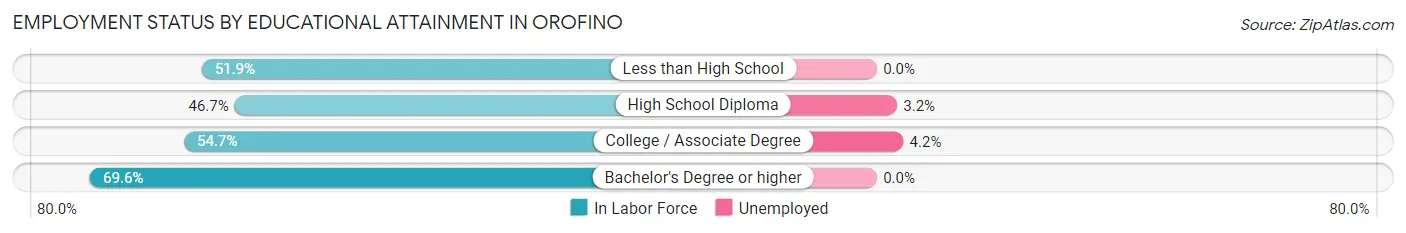
| Educational Attainment | In Labor Force | Unemployed |
| Less than High School | 70 (51.9%) | 0 (0.0%) |
| High School Diploma | 346 (46.7%) | 24 (3.2%) |
| College / Associate Degree | 433 (54.7%) | 33 (4.2%) |
| Bachelor's Degree or higher | 197 (69.6%) | 0 (0.0%) |
| Total | 1,046 (53.6%) | 55 (2.8%) |
Employment Occupations by Sex in Orofino
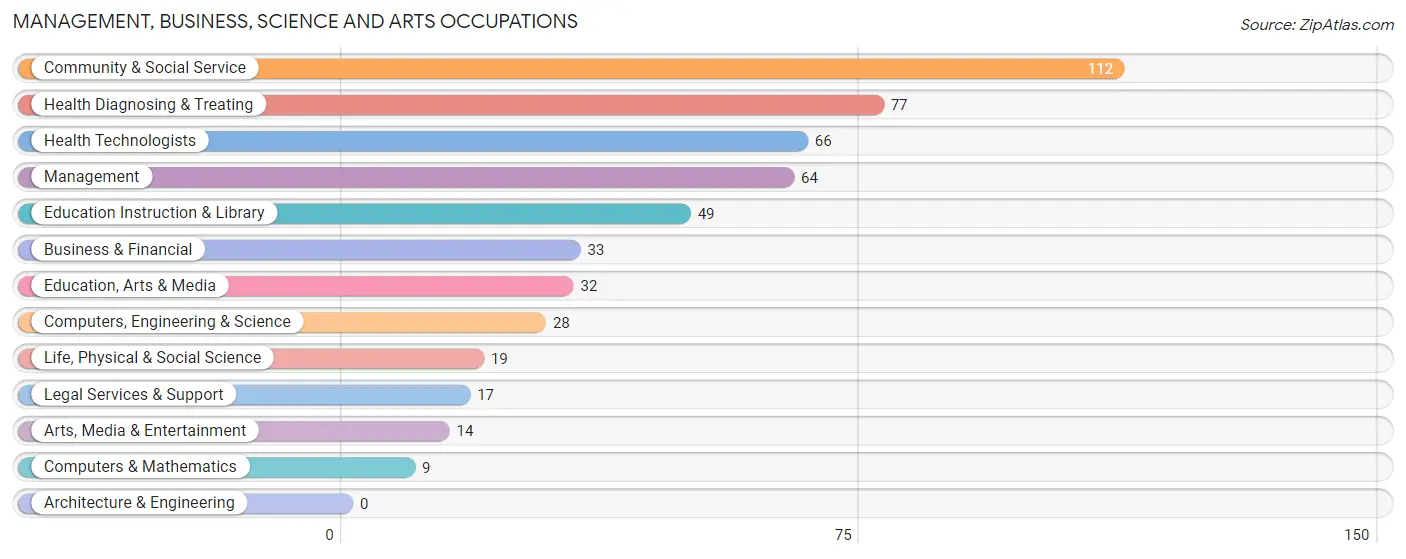
Management, Business, Science and Arts Occupations
The most common Management, Business, Science and Arts occupations in Orofino are Community & Social Service (112 | 9.5%), Health Diagnosing & Treating (77 | 6.5%), Health Technologists (66 | 5.6%), Management (64 | 5.4%), and Education Instruction & Library (49 | 4.2%).
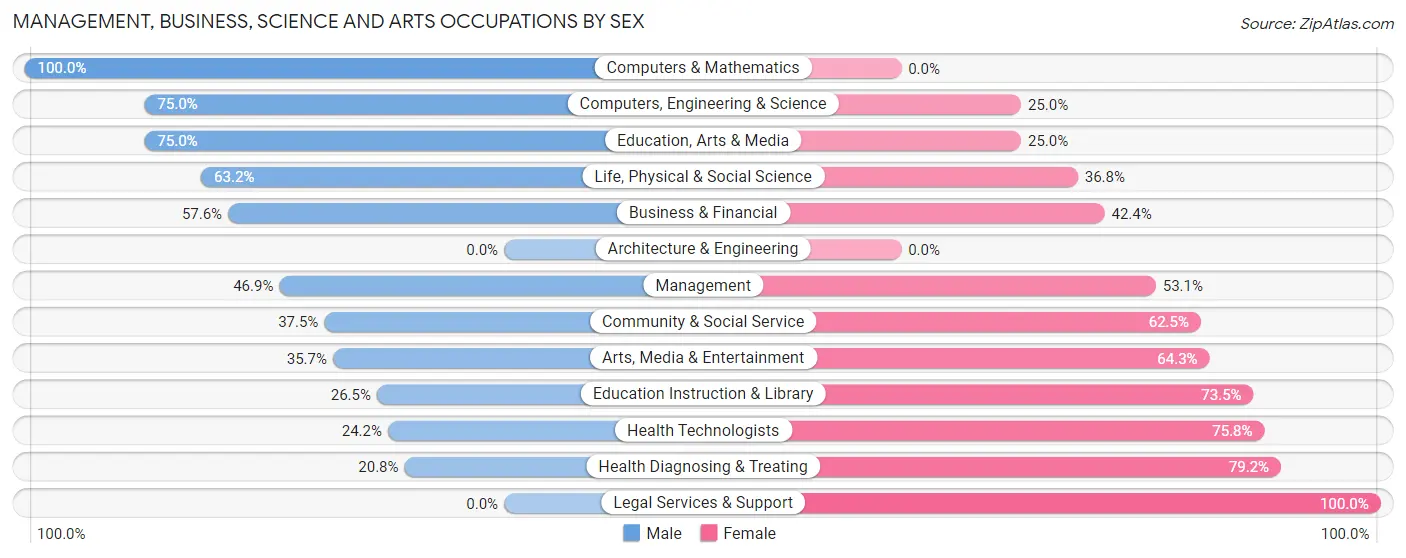
Management, Business, Science and Arts Occupations by Sex
Within the Management, Business, Science and Arts occupations in Orofino, the most male-oriented occupations are Computers & Mathematics (100.0%), Computers, Engineering & Science (75.0%), and Education, Arts & Media (75.0%), while the most female-oriented occupations are Legal Services & Support (100.0%), Health Diagnosing & Treating (79.2%), and Health Technologists (75.8%).
| Occupation | Male | Female |
| Management | 30 (46.9%) | 34 (53.1%) |
| Business & Financial | 19 (57.6%) | 14 (42.4%) |
| Computers, Engineering & Science | 21 (75.0%) | 7 (25.0%) |
| Computers & Mathematics | 9 (100.0%) | 0 (0.0%) |
| Architecture & Engineering | 0 (0.0%) | 0 (0.0%) |
| Life, Physical & Social Science | 12 (63.2%) | 7 (36.8%) |
| Community & Social Service | 42 (37.5%) | 70 (62.5%) |
| Education, Arts & Media | 24 (75.0%) | 8 (25.0%) |
| Legal Services & Support | 0 (0.0%) | 17 (100.0%) |
| Education Instruction & Library | 13 (26.5%) | 36 (73.5%) |
| Arts, Media & Entertainment | 5 (35.7%) | 9 (64.3%) |
| Health Diagnosing & Treating | 16 (20.8%) | 61 (79.2%) |
| Health Technologists | 16 (24.2%) | 50 (75.8%) |
| Total (Category) | 128 (40.8%) | 186 (59.2%) |
| Total (Overall) | 521 (44.1%) | 660 (55.9%) |
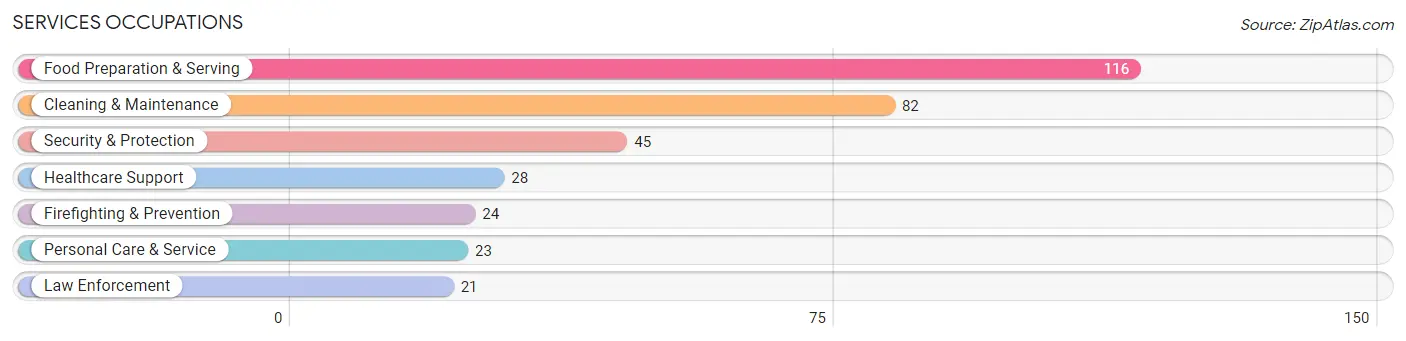
Services Occupations
The most common Services occupations in Orofino are Food Preparation & Serving (116 | 9.8%), Cleaning & Maintenance (82 | 6.9%), Security & Protection (45 | 3.8%), Healthcare Support (28 | 2.4%), and Firefighting & Prevention (24 | 2.0%).
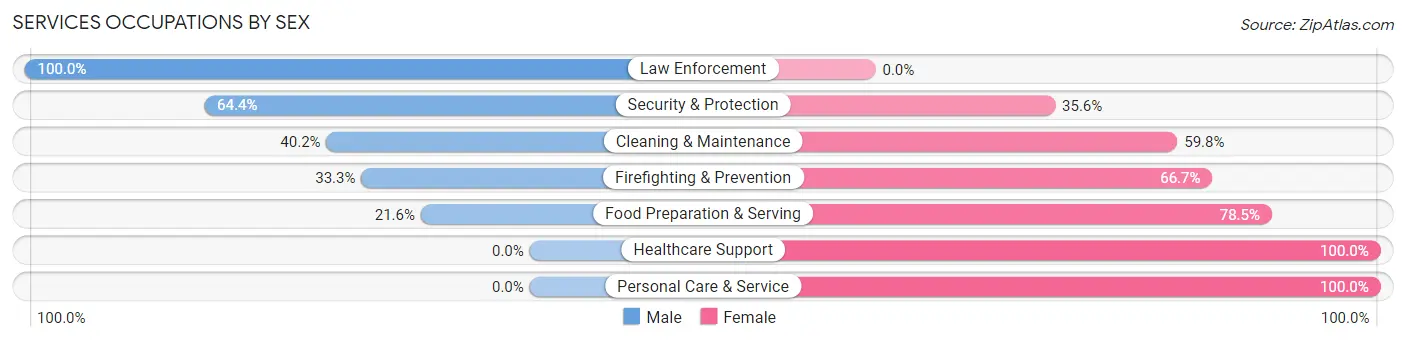
Services Occupations by Sex
Within the Services occupations in Orofino, the most male-oriented occupations are Law Enforcement (100.0%), Security & Protection (64.4%), and Cleaning & Maintenance (40.2%), while the most female-oriented occupations are Healthcare Support (100.0%), Personal Care & Service (100.0%), and Food Preparation & Serving (78.4%).
| Occupation | Male | Female |
| Healthcare Support | 0 (0.0%) | 28 (100.0%) |
| Security & Protection | 29 (64.4%) | 16 (35.6%) |
| Firefighting & Prevention | 8 (33.3%) | 16 (66.7%) |
| Law Enforcement | 21 (100.0%) | 0 (0.0%) |
| Food Preparation & Serving | 25 (21.5%) | 91 (78.4%) |
| Cleaning & Maintenance | 33 (40.2%) | 49 (59.8%) |
| Personal Care & Service | 0 (0.0%) | 23 (100.0%) |
| Total (Category) | 87 (29.6%) | 207 (70.4%) |
| Total (Overall) | 521 (44.1%) | 660 (55.9%) |
Sales and Office Occupations
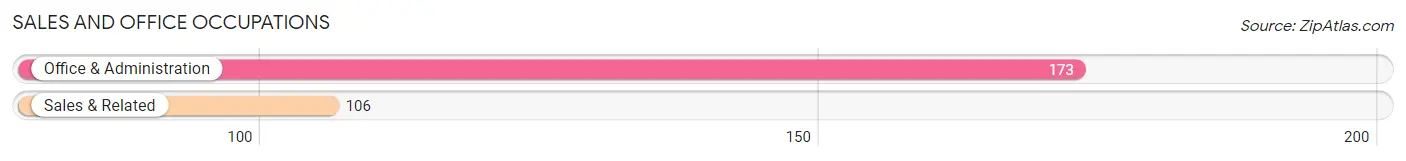
The most common Sales and Office occupations in Orofino are Office & Administration (173 | 14.6%), and Sales & Related (106 | 9.0%).
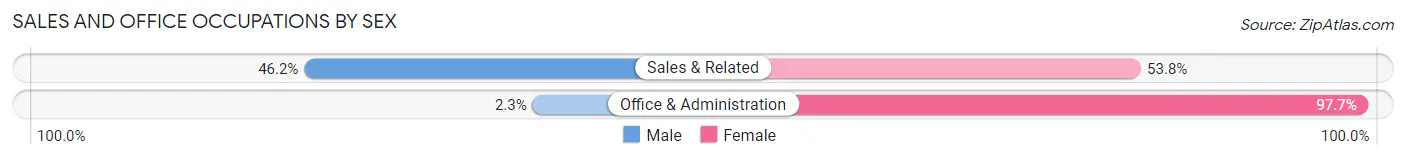
Sales and Office Occupations by Sex
| Occupation | Male | Female |
| Sales & Related | 49 (46.2%) | 57 (53.8%) |
| Office & Administration | 4 (2.3%) | 169 (97.7%) |
| Total (Category) | 53 (19.0%) | 226 (81.0%) |
| Total (Overall) | 521 (44.1%) | 660 (55.9%) |
Natural Resources, Construction and Maintenance Occupations
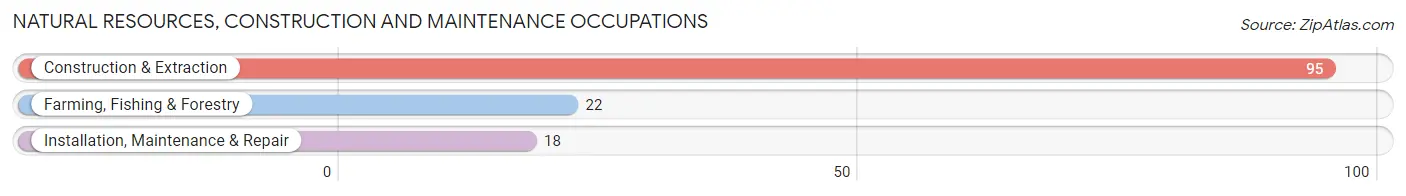
The most common Natural Resources, Construction and Maintenance occupations in Orofino are Construction & Extraction (95 | 8.0%), Farming, Fishing & Forestry (22 | 1.9%), and Installation, Maintenance & Repair (18 | 1.5%).
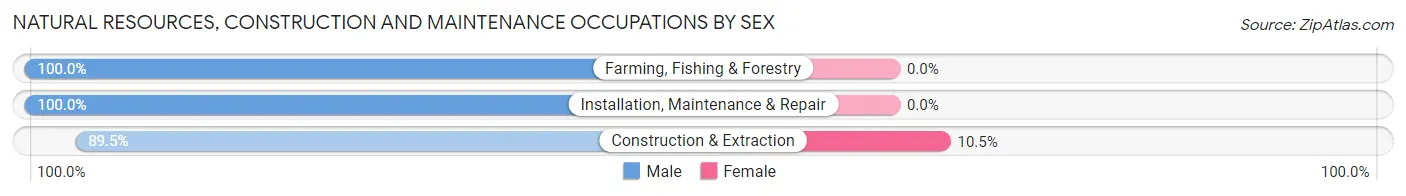
Natural Resources, Construction and Maintenance Occupations by Sex
| Occupation | Male | Female |
| Farming, Fishing & Forestry | 22 (100.0%) | 0 (0.0%) |
| Construction & Extraction | 85 (89.5%) | 10 (10.5%) |
| Installation, Maintenance & Repair | 18 (100.0%) | 0 (0.0%) |
| Total (Category) | 125 (92.6%) | 10 (7.4%) |
| Total (Overall) | 521 (44.1%) | 660 (55.9%) |
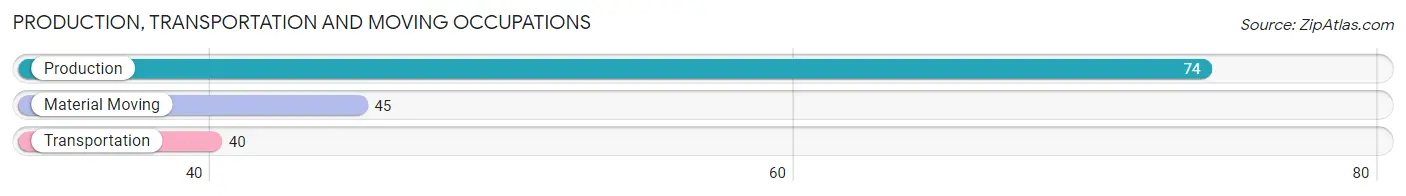
Production, Transportation and Moving Occupations
The most common Production, Transportation and Moving occupations in Orofino are Production (74 | 6.3%), Material Moving (45 | 3.8%), and Transportation (40 | 3.4%).
Production, Transportation and Moving Occupations by Sex
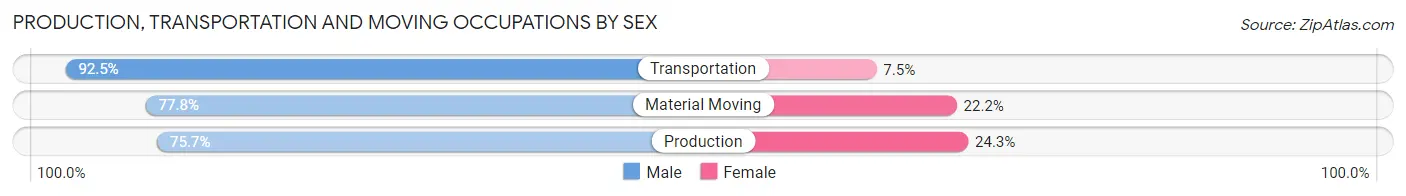
| Occupation | Male | Female |
| Production | 56 (75.7%) | 18 (24.3%) |
| Transportation | 37 (92.5%) | 3 (7.5%) |
| Material Moving | 35 (77.8%) | 10 (22.2%) |
| Total (Category) | 128 (80.5%) | 31 (19.5%) |
| Total (Overall) | 521 (44.1%) | 660 (55.9%) |
Employment Industries by Sex in Orofino
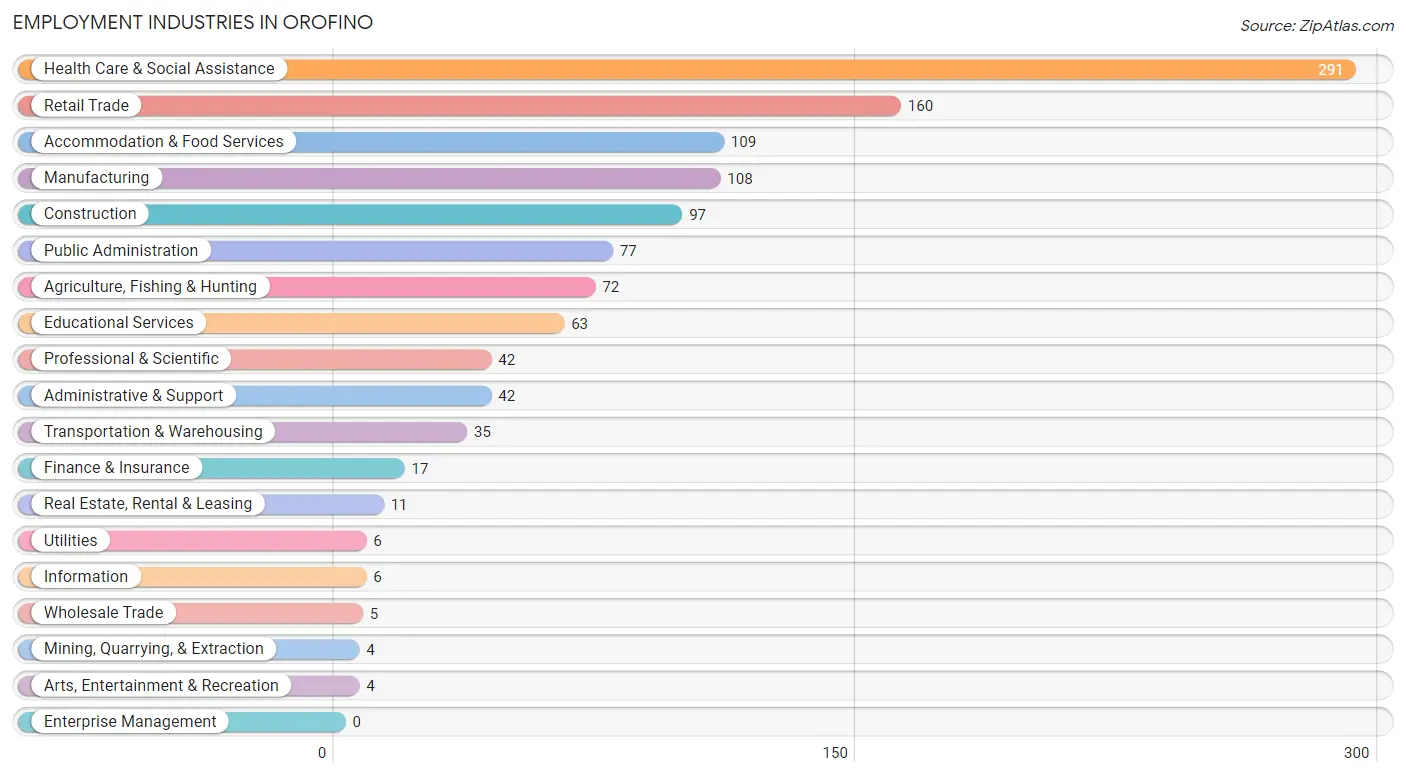
Employment Industries in Orofino
The major employment industries in Orofino include Health Care & Social Assistance (291 | 24.6%), Retail Trade (160 | 13.6%), Accommodation & Food Services (109 | 9.2%), Manufacturing (108 | 9.1%), and Construction (97 | 8.2%).
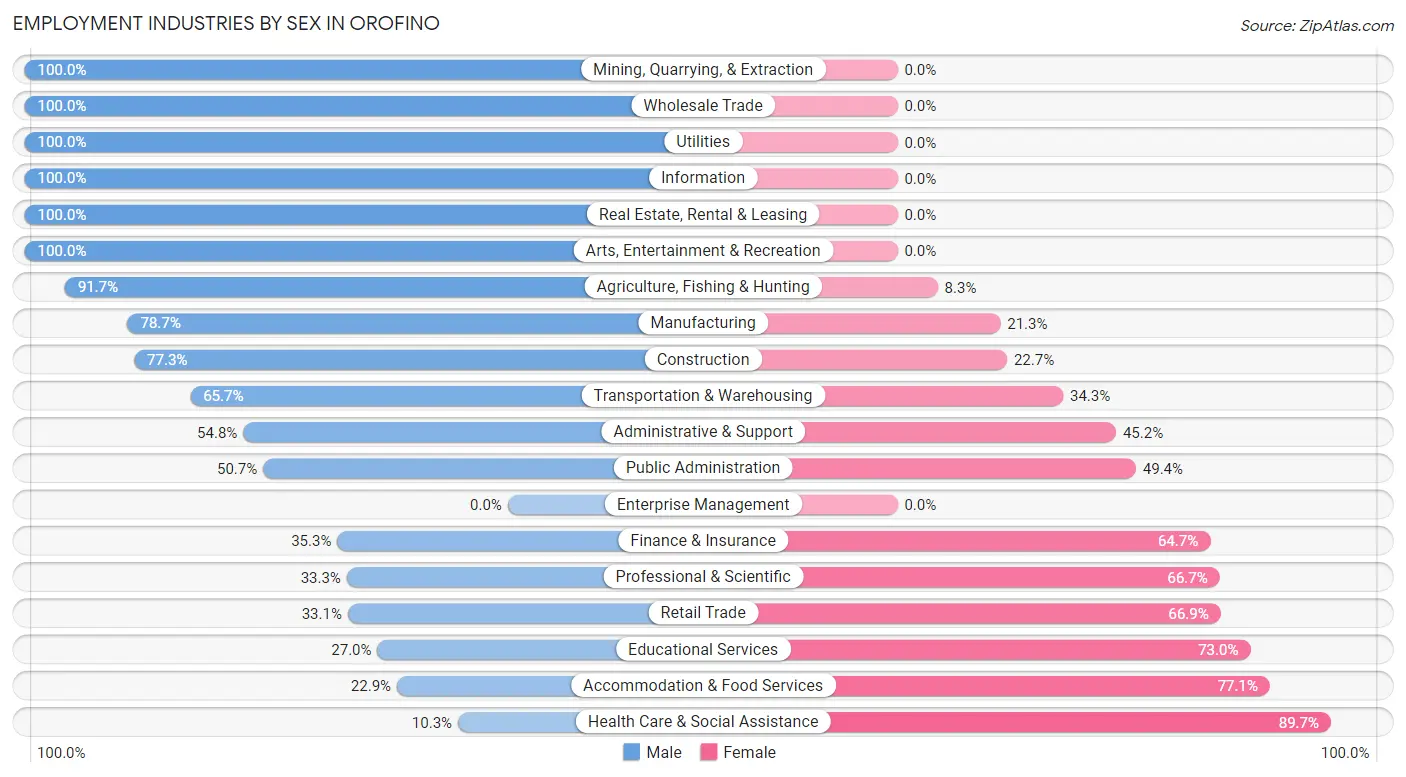
Employment Industries by Sex in Orofino
The Orofino industries that see more men than women are Mining, Quarrying, & Extraction (100.0%), Wholesale Trade (100.0%), and Utilities (100.0%), whereas the industries that tend to have a higher number of women are Health Care & Social Assistance (89.7%), Accommodation & Food Services (77.1%), and Educational Services (73.0%).
| Industry | Male | Female |
| Agriculture, Fishing & Hunting | 66 (91.7%) | 6 (8.3%) |
| Mining, Quarrying, & Extraction | 4 (100.0%) | 0 (0.0%) |
| Construction | 75 (77.3%) | 22 (22.7%) |
| Manufacturing | 85 (78.7%) | 23 (21.3%) |
| Wholesale Trade | 5 (100.0%) | 0 (0.0%) |
| Retail Trade | 53 (33.1%) | 107 (66.9%) |
| Transportation & Warehousing | 23 (65.7%) | 12 (34.3%) |
| Utilities | 6 (100.0%) | 0 (0.0%) |
| Information | 6 (100.0%) | 0 (0.0%) |
| Finance & Insurance | 6 (35.3%) | 11 (64.7%) |
| Real Estate, Rental & Leasing | 11 (100.0%) | 0 (0.0%) |
| Professional & Scientific | 14 (33.3%) | 28 (66.7%) |
| Enterprise Management | 0 (0.0%) | 0 (0.0%) |
| Administrative & Support | 23 (54.8%) | 19 (45.2%) |
| Educational Services | 17 (27.0%) | 46 (73.0%) |
| Health Care & Social Assistance | 30 (10.3%) | 261 (89.7%) |
| Arts, Entertainment & Recreation | 4 (100.0%) | 0 (0.0%) |
| Accommodation & Food Services | 25 (22.9%) | 84 (77.1%) |
| Public Administration | 39 (50.6%) | 38 (49.3%) |
| Total | 521 (44.1%) | 660 (55.9%) |
Education in Orofino
School Enrollment in Orofino
The most common levels of schooling among the 570 students in Orofino are high school (161 | 28.2%), college / undergraduate (144 | 25.3%), and middle school (117 | 20.5%).
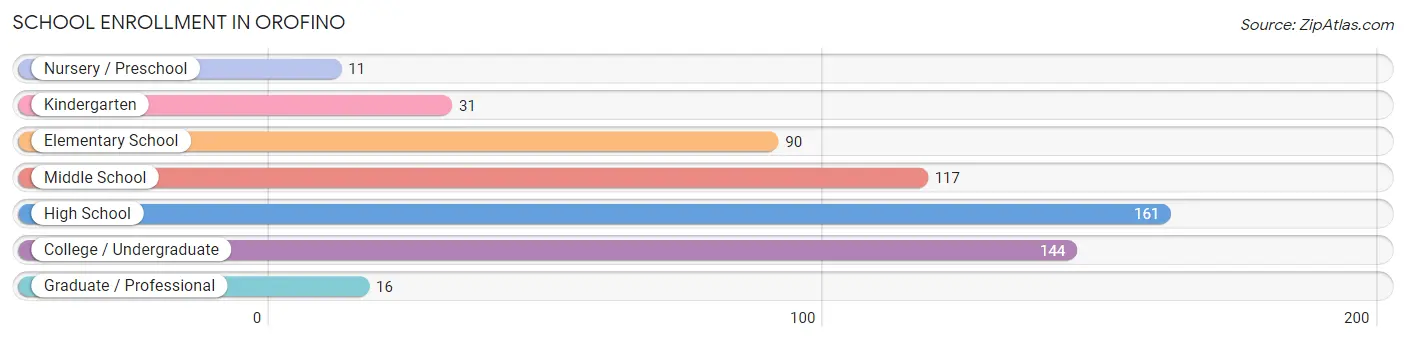
| School Level | # Students | % Students |
| Nursery / Preschool | 11 | 1.9% |
| Kindergarten | 31 | 5.4% |
| Elementary School | 90 | 15.8% |
| Middle School | 117 | 20.5% |
| High School | 161 | 28.2% |
| College / Undergraduate | 144 | 25.3% |
| Graduate / Professional | 16 | 2.8% |
| Total | 570 | 100.0% |
School Enrollment by Age by Funding Source in Orofino
Out of a total of 570 students who are enrolled in schools in Orofino, 35 (6.1%) attend a private institution, while the remaining 535 (93.9%) are enrolled in public schools. The age group of 3 to 4 year olds has the highest likelihood of being enrolled in private schools, with 11 (100.0% in the age bracket) enrolled. Conversely, the age group of 20 to 24 year olds has the lowest likelihood of being enrolled in a private school, with 13 (100.0% in the age bracket) attending a public institution.
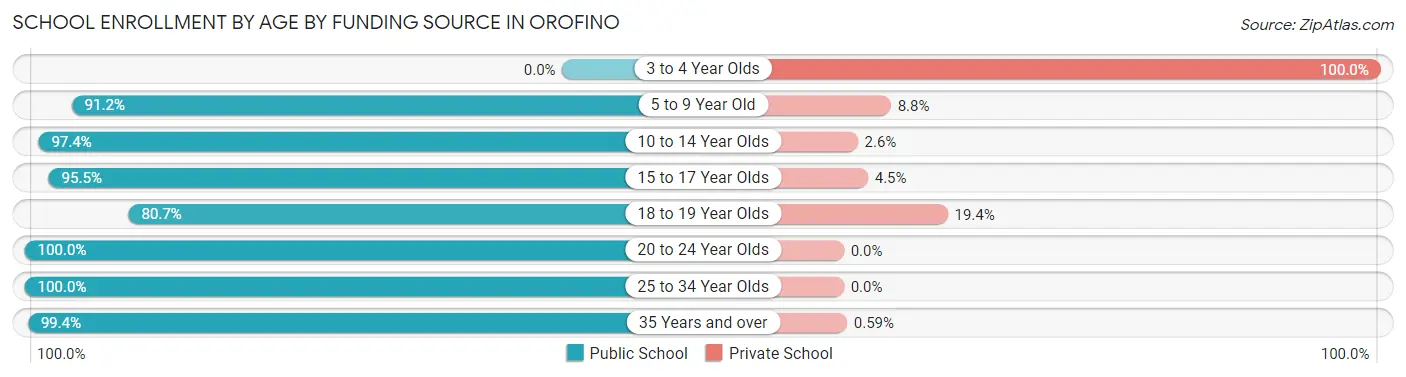
| Age Bracket | Public School | Private School |
| 3 to 4 Year Olds | 0 (0.0%) | 11 (100.0%) |
| 5 to 9 Year Old | 104 (91.2%) | 10 (8.8%) |
| 10 to 14 Year Olds | 113 (97.4%) | 3 (2.6%) |
| 15 to 17 Year Olds | 85 (95.5%) | 4 (4.5%) |
| 18 to 19 Year Olds | 25 (80.6%) | 6 (19.4%) |
| 20 to 24 Year Olds | 13 (100.0%) | 0 (0.0%) |
| 25 to 34 Year Olds | 26 (100.0%) | 0 (0.0%) |
| 35 Years and over | 169 (99.4%) | 1 (0.6%) |
| Total | 535 (93.9%) | 35 (6.1%) |
Educational Attainment by Field of Study in Orofino
Arts & humanities (74 | 18.9%), education (66 | 16.9%), bio, nature & agricultural (49 | 12.5%), computers & mathematics (38 | 9.7%), and business (38 | 9.7%) are the most common fields of study among 391 individuals in Orofino who have obtained a bachelor's degree or higher.
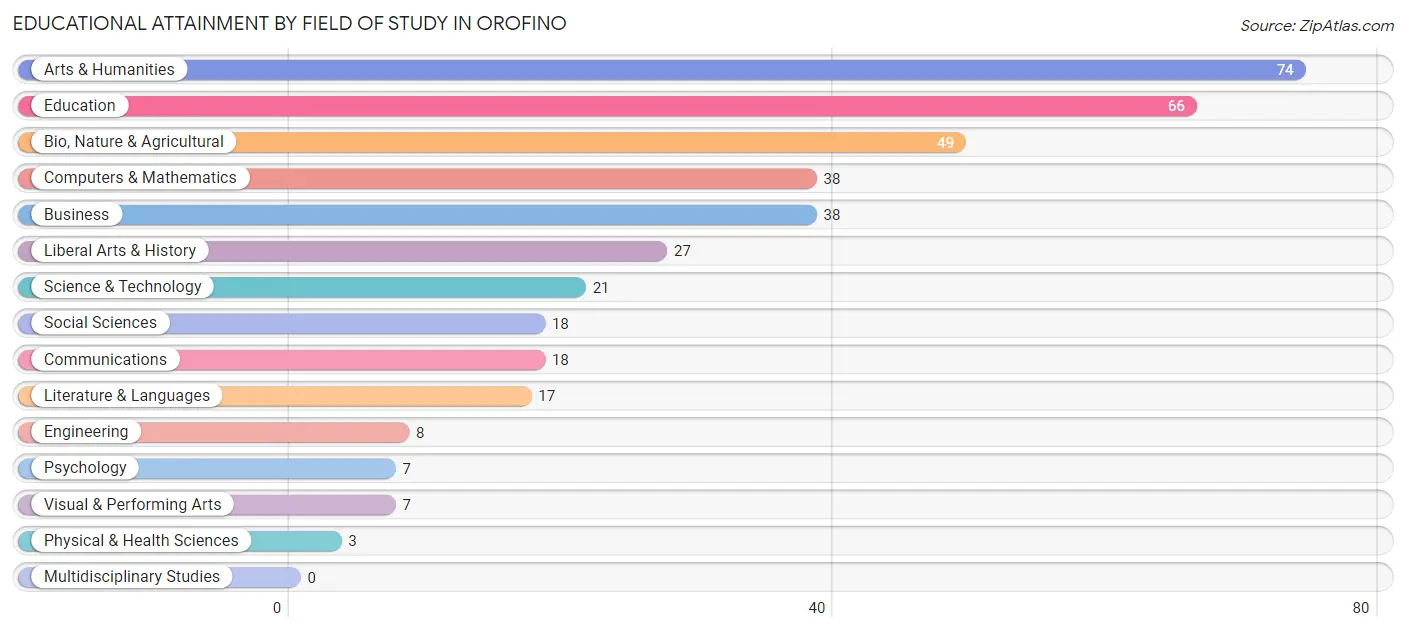
| Field of Study | # Graduates | % Graduates |
| Computers & Mathematics | 38 | 9.7% |
| Bio, Nature & Agricultural | 49 | 12.5% |
| Physical & Health Sciences | 3 | 0.8% |
| Psychology | 7 | 1.8% |
| Social Sciences | 18 | 4.6% |
| Engineering | 8 | 2.1% |
| Multidisciplinary Studies | 0 | 0.0% |
| Science & Technology | 21 | 5.4% |
| Business | 38 | 9.7% |
| Education | 66 | 16.9% |
| Literature & Languages | 17 | 4.3% |
| Liberal Arts & History | 27 | 6.9% |
| Visual & Performing Arts | 7 | 1.8% |
| Communications | 18 | 4.6% |
| Arts & Humanities | 74 | 18.9% |
| Total | 391 | 100.0% |
Transportation & Commute in Orofino
Vehicle Availability by Sex in Orofino
The most prevalent vehicle ownership categories in Orofino are males with 3 vehicles (192, accounting for 37.1%) and females with 3 vehicles (163, making up 29.8%).
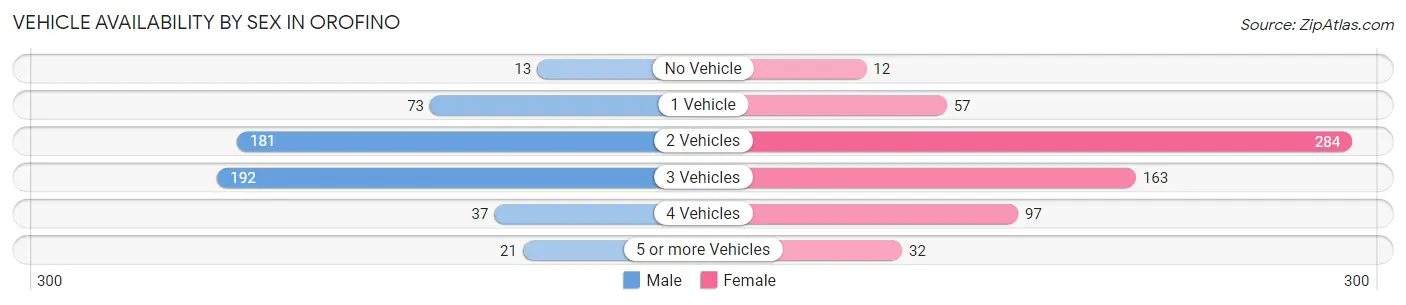
| Vehicles Available | Male | Female |
| No Vehicle | 13 (2.5%) | 12 (1.9%) |
| 1 Vehicle | 73 (14.1%) | 57 (8.8%) |
| 2 Vehicles | 181 (35.0%) | 284 (44.0%) |
| 3 Vehicles | 192 (37.1%) | 163 (25.3%) |
| 4 Vehicles | 37 (7.2%) | 97 (15.0%) |
| 5 or more Vehicles | 21 (4.1%) | 32 (5.0%) |
| Total | 517 (100.0%) | 645 (100.0%) |
Commute Time in Orofino
The most frequently occuring commute durations in Orofino are 5 to 9 minutes (391 commuters, 36.8%), 10 to 14 minutes (221 commuters, 20.8%), and less than 5 minutes (144 commuters, 13.6%).
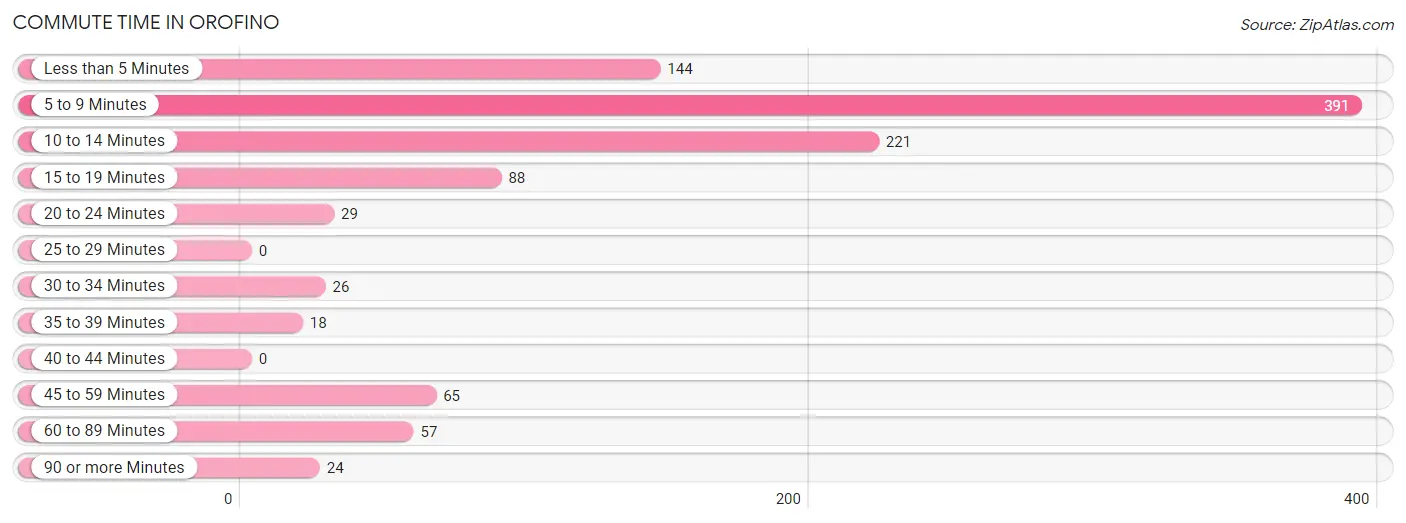
| Commute Time | # Commuters | % Commuters |
| Less than 5 Minutes | 144 | 13.6% |
| 5 to 9 Minutes | 391 | 36.8% |
| 10 to 14 Minutes | 221 | 20.8% |
| 15 to 19 Minutes | 88 | 8.3% |
| 20 to 24 Minutes | 29 | 2.7% |
| 25 to 29 Minutes | 0 | 0.0% |
| 30 to 34 Minutes | 26 | 2.5% |
| 35 to 39 Minutes | 18 | 1.7% |
| 40 to 44 Minutes | 0 | 0.0% |
| 45 to 59 Minutes | 65 | 6.1% |
| 60 to 89 Minutes | 57 | 5.4% |
| 90 or more Minutes | 24 | 2.3% |
Commute Time by Sex in Orofino
The most common commute times in Orofino are 5 to 9 minutes (147 commuters, 32.0%) for males and 5 to 9 minutes (244 commuters, 40.5%) for females.
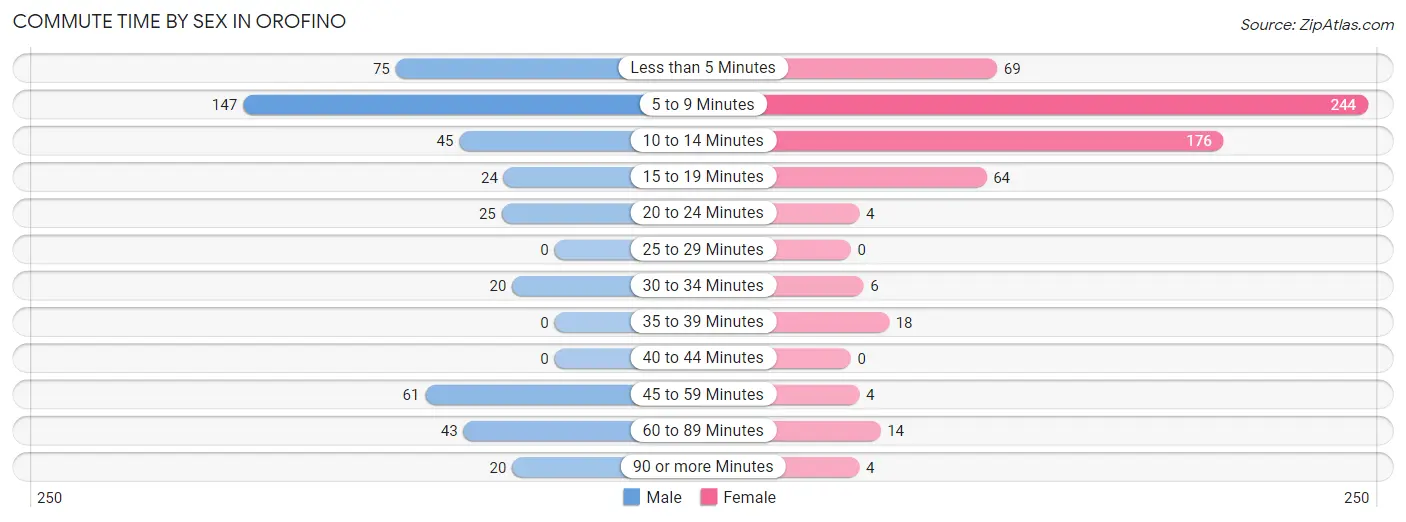
| Commute Time | Male | Female |
| Less than 5 Minutes | 75 (16.3%) | 69 (11.4%) |
| 5 to 9 Minutes | 147 (32.0%) | 244 (40.5%) |
| 10 to 14 Minutes | 45 (9.8%) | 176 (29.2%) |
| 15 to 19 Minutes | 24 (5.2%) | 64 (10.6%) |
| 20 to 24 Minutes | 25 (5.4%) | 4 (0.7%) |
| 25 to 29 Minutes | 0 (0.0%) | 0 (0.0%) |
| 30 to 34 Minutes | 20 (4.3%) | 6 (1.0%) |
| 35 to 39 Minutes | 0 (0.0%) | 18 (3.0%) |
| 40 to 44 Minutes | 0 (0.0%) | 0 (0.0%) |
| 45 to 59 Minutes | 61 (13.3%) | 4 (0.7%) |
| 60 to 89 Minutes | 43 (9.3%) | 14 (2.3%) |
| 90 or more Minutes | 20 (4.3%) | 4 (0.7%) |
Time of Departure to Work by Sex in Orofino
The most frequent times of departure to work in Orofino are 6:30 AM to 6:59 AM (76, 16.5%) for males and 7:30 AM to 7:59 AM (185, 30.7%) for females.
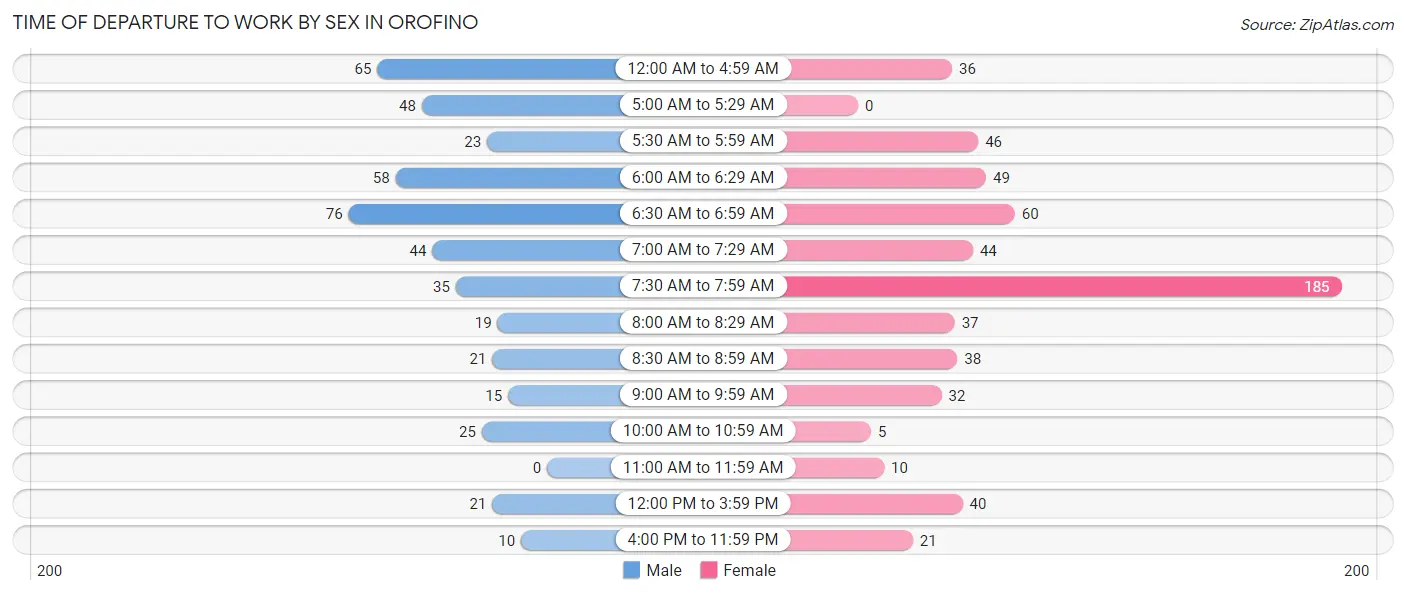
| Time of Departure | Male | Female |
| 12:00 AM to 4:59 AM | 65 (14.1%) | 36 (6.0%) |
| 5:00 AM to 5:29 AM | 48 (10.4%) | 0 (0.0%) |
| 5:30 AM to 5:59 AM | 23 (5.0%) | 46 (7.6%) |
| 6:00 AM to 6:29 AM | 58 (12.6%) | 49 (8.1%) |
| 6:30 AM to 6:59 AM | 76 (16.5%) | 60 (10.0%) |
| 7:00 AM to 7:29 AM | 44 (9.6%) | 44 (7.3%) |
| 7:30 AM to 7:59 AM | 35 (7.6%) | 185 (30.7%) |
| 8:00 AM to 8:29 AM | 19 (4.1%) | 37 (6.1%) |
| 8:30 AM to 8:59 AM | 21 (4.6%) | 38 (6.3%) |
| 9:00 AM to 9:59 AM | 15 (3.3%) | 32 (5.3%) |
| 10:00 AM to 10:59 AM | 25 (5.4%) | 5 (0.8%) |
| 11:00 AM to 11:59 AM | 0 (0.0%) | 10 (1.7%) |
| 12:00 PM to 3:59 PM | 21 (4.6%) | 40 (6.6%) |
| 4:00 PM to 11:59 PM | 10 (2.2%) | 21 (3.5%) |
| Total | 460 (100.0%) | 603 (100.0%) |
Housing Occupancy in Orofino
Occupancy by Ownership in Orofino
Of the total 1,015 dwellings in Orofino, owner-occupied units account for 728 (71.7%), while renter-occupied units make up 287 (28.3%).
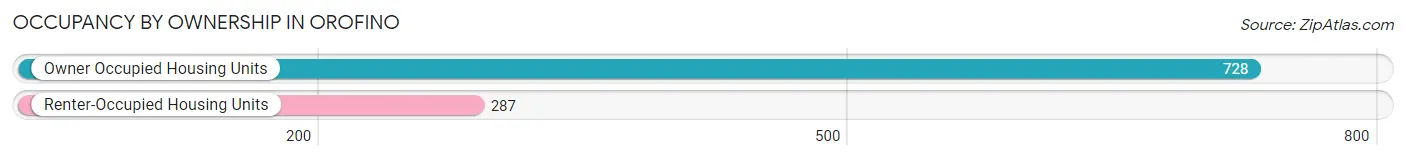
| Occupancy | # Housing Units | % Housing Units |
| Owner Occupied Housing Units | 728 | 71.7% |
| Renter-Occupied Housing Units | 287 | 28.3% |
| Total Occupied Housing Units | 1,015 | 100.0% |
Occupancy by Household Size in Orofino
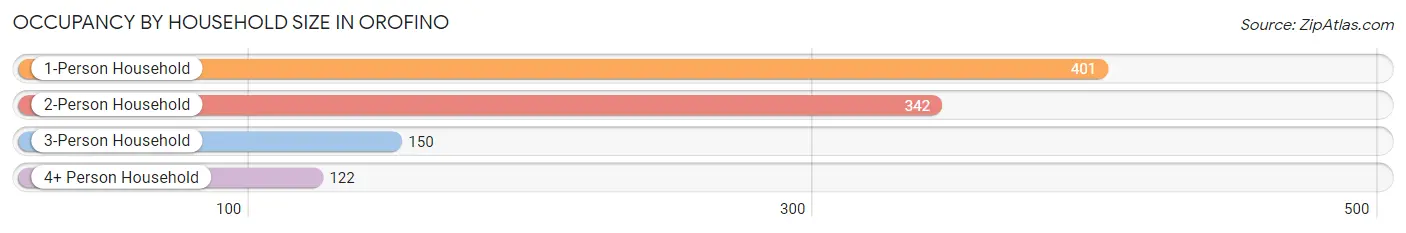
| Household Size | # Housing Units | % Housing Units |
| 1-Person Household | 401 | 39.5% |
| 2-Person Household | 342 | 33.7% |
| 3-Person Household | 150 | 14.8% |
| 4+ Person Household | 122 | 12.0% |
| Total Housing Units | 1,015 | 100.0% |
Occupancy by Ownership by Household Size in Orofino
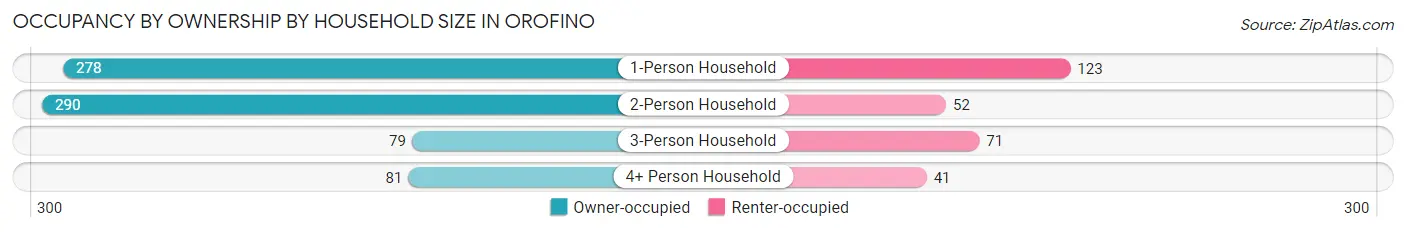
| Household Size | Owner-occupied | Renter-occupied |
| 1-Person Household | 278 (69.3%) | 123 (30.7%) |
| 2-Person Household | 290 (84.8%) | 52 (15.2%) |
| 3-Person Household | 79 (52.7%) | 71 (47.3%) |
| 4+ Person Household | 81 (66.4%) | 41 (33.6%) |
| Total Housing Units | 728 (71.7%) | 287 (28.3%) |
Occupancy by Educational Attainment in Orofino
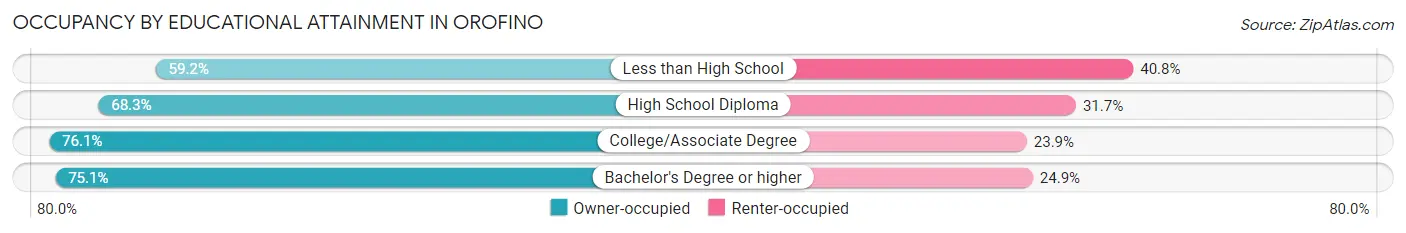
| Household Size | Owner-occupied | Renter-occupied |
| Less than High School | 61 (59.2%) | 42 (40.8%) |
| High School Diploma | 222 (68.3%) | 103 (31.7%) |
| College/Associate Degree | 312 (76.1%) | 98 (23.9%) |
| Bachelor's Degree or higher | 133 (75.1%) | 44 (24.9%) |
Occupancy by Age of Householder in Orofino
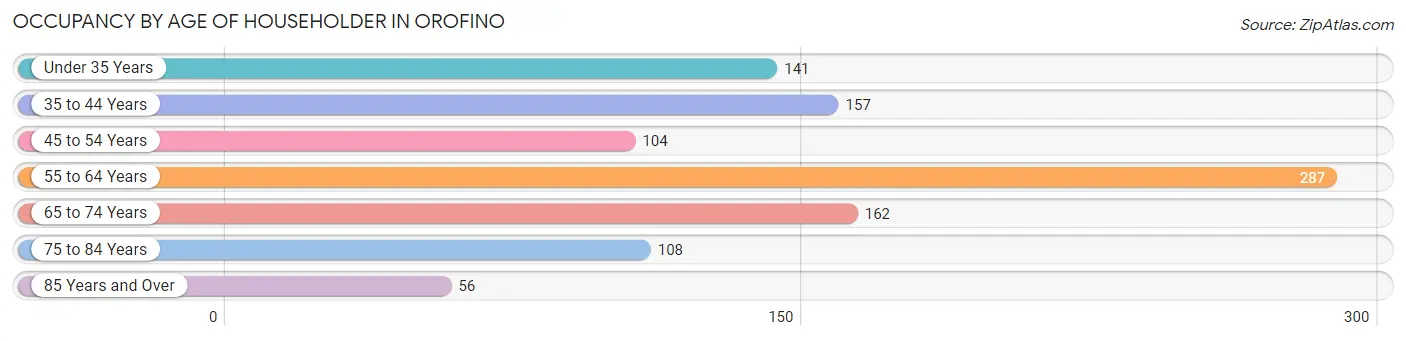
| Age Bracket | # Households | % Households |
| Under 35 Years | 141 | 13.9% |
| 35 to 44 Years | 157 | 15.5% |
| 45 to 54 Years | 104 | 10.2% |
| 55 to 64 Years | 287 | 28.3% |
| 65 to 74 Years | 162 | 16.0% |
| 75 to 84 Years | 108 | 10.6% |
| 85 Years and Over | 56 | 5.5% |
| Total | 1,015 | 100.0% |
Housing Finances in Orofino
Median Income by Occupancy in Orofino
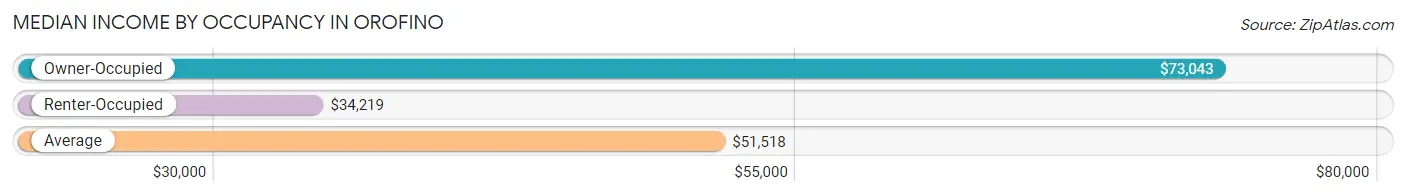
| Occupancy Type | # Households | Median Income |
| Owner-Occupied | 728 (71.7%) | $73,043 |
| Renter-Occupied | 287 (28.3%) | $34,219 |
| Average | 1,015 (100.0%) | $51,518 |
Occupancy by Householder Income Bracket in Orofino
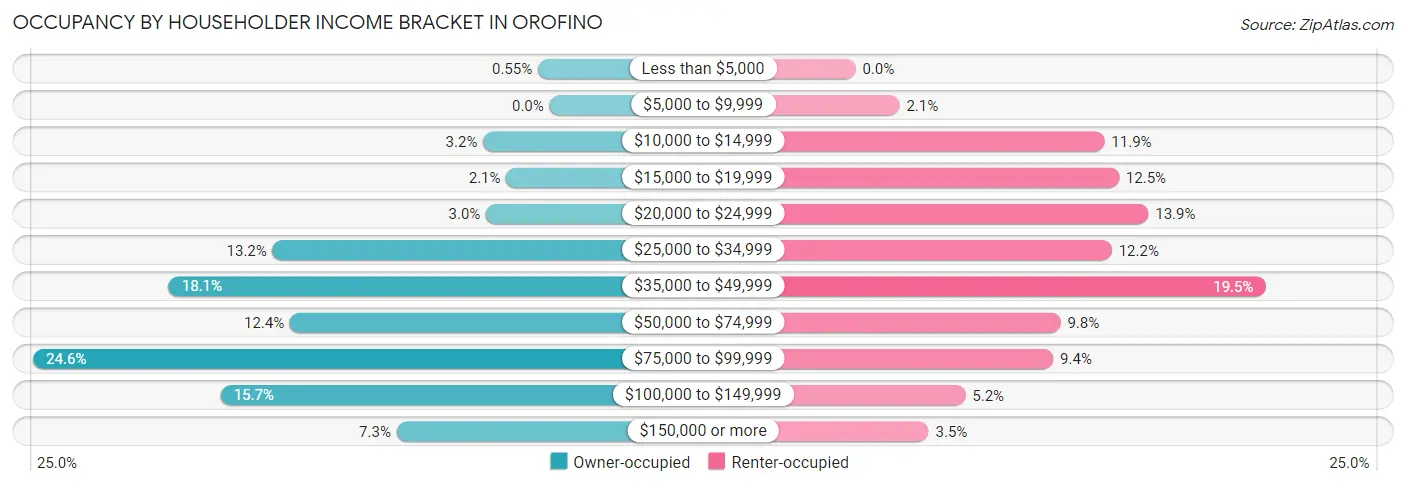
| Income Bracket | Owner-occupied | Renter-occupied |
| Less than $5,000 | 4 (0.5%) | 0 (0.0%) |
| $5,000 to $9,999 | 0 (0.0%) | 6 (2.1%) |
| $10,000 to $14,999 | 23 (3.2%) | 34 (11.8%) |
| $15,000 to $19,999 | 15 (2.1%) | 36 (12.5%) |
| $20,000 to $24,999 | 22 (3.0%) | 40 (13.9%) |
| $25,000 to $34,999 | 96 (13.2%) | 35 (12.2%) |
| $35,000 to $49,999 | 132 (18.1%) | 56 (19.5%) |
| $50,000 to $74,999 | 90 (12.4%) | 28 (9.8%) |
| $75,000 to $99,999 | 179 (24.6%) | 27 (9.4%) |
| $100,000 to $149,999 | 114 (15.7%) | 15 (5.2%) |
| $150,000 or more | 53 (7.3%) | 10 (3.5%) |
| Total | 728 (100.0%) | 287 (100.0%) |
Monthly Housing Cost Tiers in Orofino
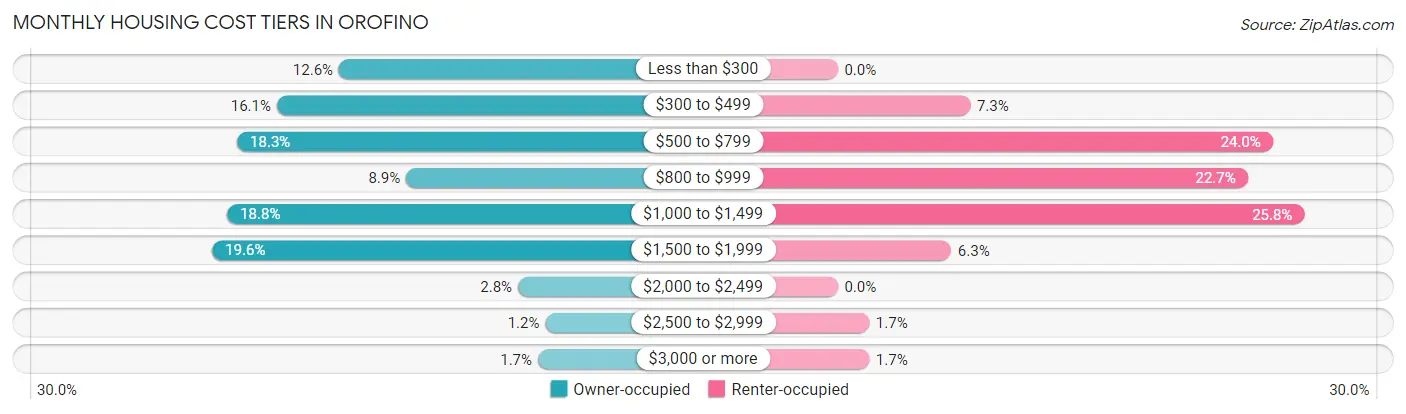
| Monthly Cost | Owner-occupied | Renter-occupied |
| Less than $300 | 92 (12.6%) | 0 (0.0%) |
| $300 to $499 | 117 (16.1%) | 21 (7.3%) |
| $500 to $799 | 133 (18.3%) | 69 (24.0%) |
| $800 to $999 | 65 (8.9%) | 65 (22.7%) |
| $1,000 to $1,499 | 137 (18.8%) | 74 (25.8%) |
| $1,500 to $1,999 | 143 (19.6%) | 18 (6.3%) |
| $2,000 to $2,499 | 20 (2.8%) | 0 (0.0%) |
| $2,500 to $2,999 | 9 (1.2%) | 5 (1.7%) |
| $3,000 or more | 12 (1.7%) | 5 (1.7%) |
| Total | 728 (100.0%) | 287 (100.0%) |
Physical Housing Characteristics in Orofino
Housing Structures in Orofino
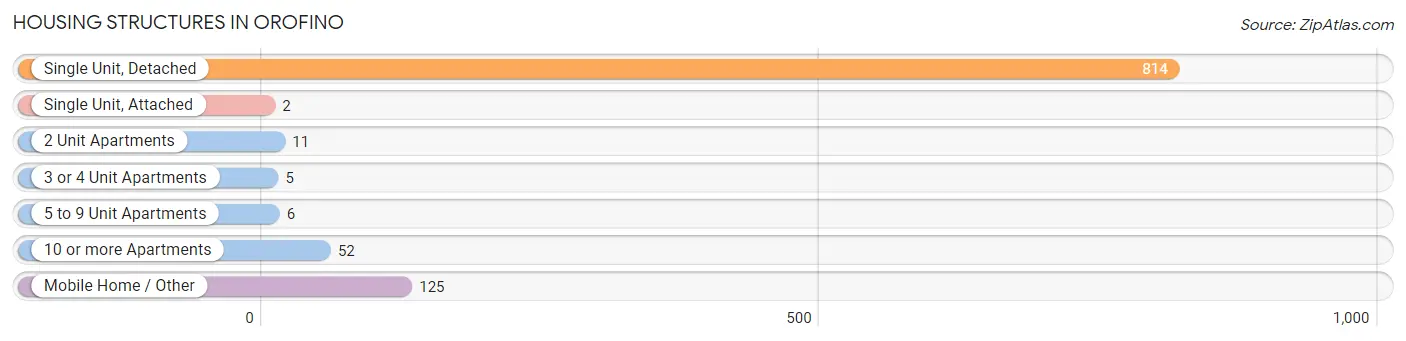
| Structure Type | # Housing Units | % Housing Units |
| Single Unit, Detached | 814 | 80.2% |
| Single Unit, Attached | 2 | 0.2% |
| 2 Unit Apartments | 11 | 1.1% |
| 3 or 4 Unit Apartments | 5 | 0.5% |
| 5 to 9 Unit Apartments | 6 | 0.6% |
| 10 or more Apartments | 52 | 5.1% |
| Mobile Home / Other | 125 | 12.3% |
| Total | 1,015 | 100.0% |
Housing Structures by Occupancy in Orofino
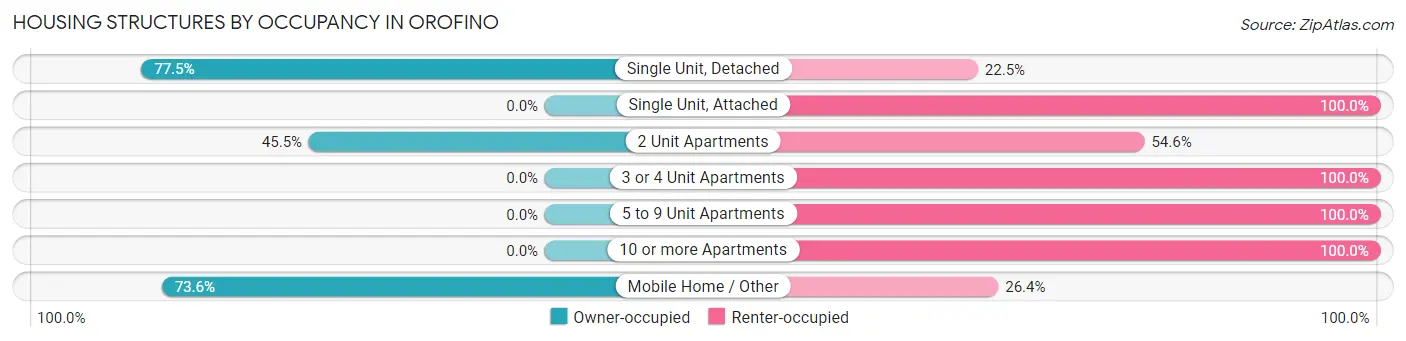
| Structure Type | Owner-occupied | Renter-occupied |
| Single Unit, Detached | 631 (77.5%) | 183 (22.5%) |
| Single Unit, Attached | 0 (0.0%) | 2 (100.0%) |
| 2 Unit Apartments | 5 (45.5%) | 6 (54.5%) |
| 3 or 4 Unit Apartments | 0 (0.0%) | 5 (100.0%) |
| 5 to 9 Unit Apartments | 0 (0.0%) | 6 (100.0%) |
| 10 or more Apartments | 0 (0.0%) | 52 (100.0%) |
| Mobile Home / Other | 92 (73.6%) | 33 (26.4%) |
| Total | 728 (71.7%) | 287 (28.3%) |
Housing Structures by Number of Rooms in Orofino
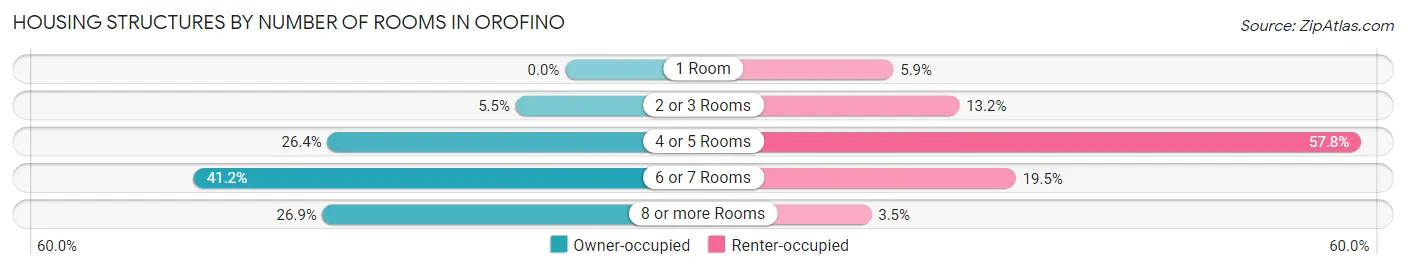
| Number of Rooms | Owner-occupied | Renter-occupied |
| 1 Room | 0 (0.0%) | 17 (5.9%) |
| 2 or 3 Rooms | 40 (5.5%) | 38 (13.2%) |
| 4 or 5 Rooms | 192 (26.4%) | 166 (57.8%) |
| 6 or 7 Rooms | 300 (41.2%) | 56 (19.5%) |
| 8 or more Rooms | 196 (26.9%) | 10 (3.5%) |
| Total | 728 (100.0%) | 287 (100.0%) |
Housing Structure by Heating Type in Orofino
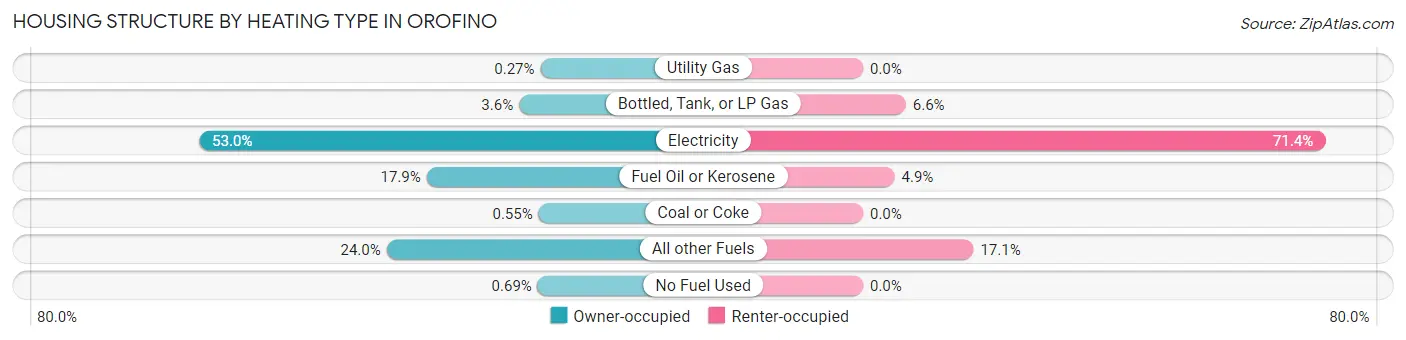
| Heating Type | Owner-occupied | Renter-occupied |
| Utility Gas | 2 (0.3%) | 0 (0.0%) |
| Bottled, Tank, or LP Gas | 26 (3.6%) | 19 (6.6%) |
| Electricity | 386 (53.0%) | 205 (71.4%) |
| Fuel Oil or Kerosene | 130 (17.9%) | 14 (4.9%) |
| Coal or Coke | 4 (0.5%) | 0 (0.0%) |
| All other Fuels | 175 (24.0%) | 49 (17.1%) |
| No Fuel Used | 5 (0.7%) | 0 (0.0%) |
| Total | 728 (100.0%) | 287 (100.0%) |
Household Vehicle Usage in Orofino
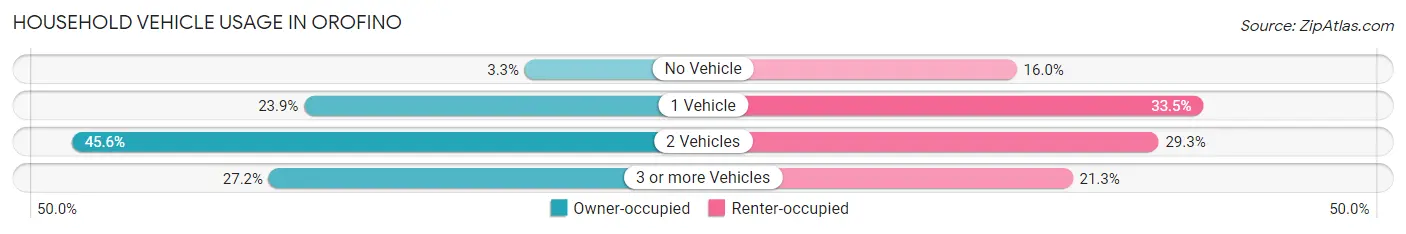
| Vehicles per Household | Owner-occupied | Renter-occupied |
| No Vehicle | 24 (3.3%) | 46 (16.0%) |
| 1 Vehicle | 174 (23.9%) | 96 (33.5%) |
| 2 Vehicles | 332 (45.6%) | 84 (29.3%) |
| 3 or more Vehicles | 198 (27.2%) | 61 (21.2%) |
| Total | 728 (100.0%) | 287 (100.0%) |
Real Estate & Mortgages in Orofino
Real Estate and Mortgage Overview in Orofino
| Characteristic | Without Mortgage | With Mortgage |
| Housing Units | 327 | 401 |
| Median Property Value | $161,100 | $219,300 |
| Median Household Income | $58,750 | $27 |
| Monthly Housing Costs | $435 | $12 |
| Real Estate Taxes | $1,326 | $5 |
Property Value by Mortgage Status in Orofino
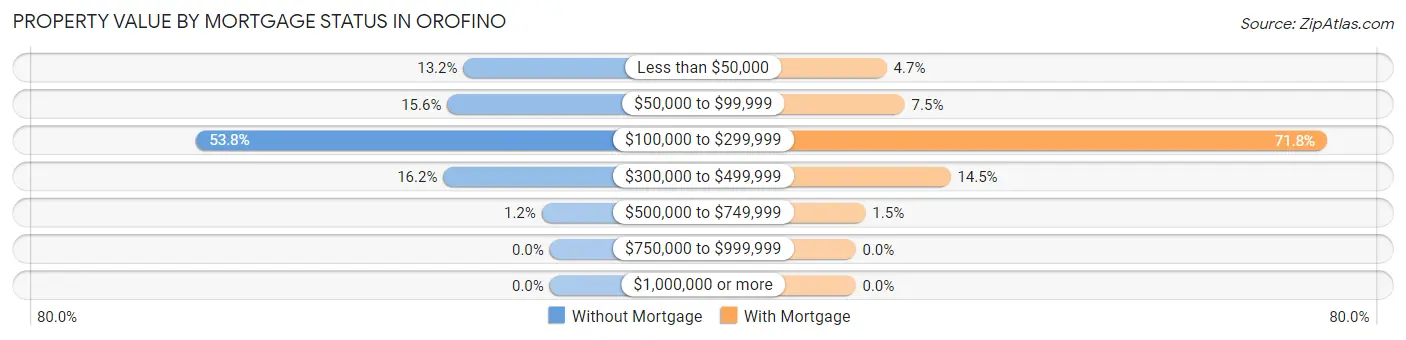
| Property Value | Without Mortgage | With Mortgage |
| Less than $50,000 | 43 (13.2%) | 19 (4.7%) |
| $50,000 to $99,999 | 51 (15.6%) | 30 (7.5%) |
| $100,000 to $299,999 | 176 (53.8%) | 288 (71.8%) |
| $300,000 to $499,999 | 53 (16.2%) | 58 (14.5%) |
| $500,000 to $749,999 | 4 (1.2%) | 6 (1.5%) |
| $750,000 to $999,999 | 0 (0.0%) | 0 (0.0%) |
| $1,000,000 or more | 0 (0.0%) | 0 (0.0%) |
| Total | 327 (100.0%) | 401 (100.0%) |
Household Income by Mortgage Status in Orofino
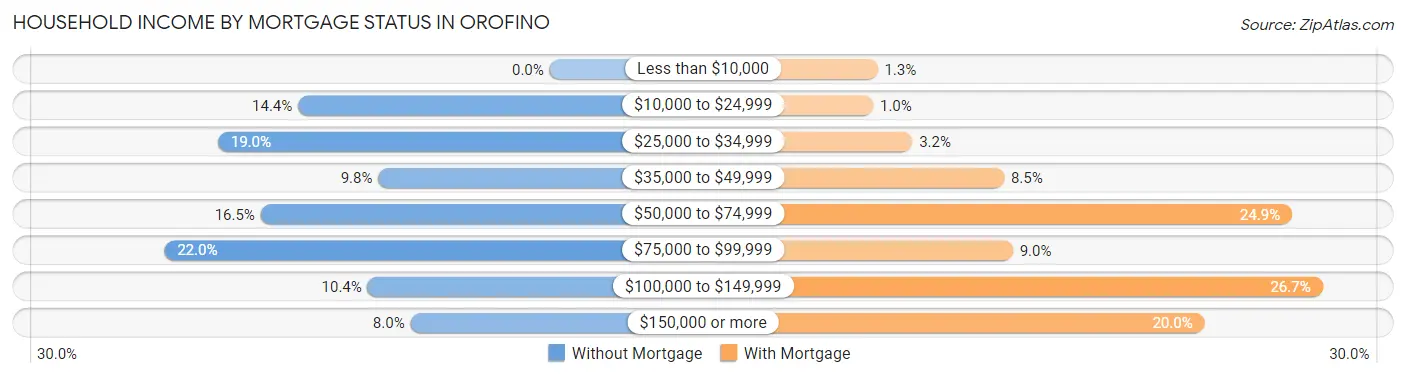
| Household Income | Without Mortgage | With Mortgage |
| Less than $10,000 | 0 (0.0%) | 5 (1.3%) |
| $10,000 to $24,999 | 47 (14.4%) | 4 (1.0%) |
| $25,000 to $34,999 | 62 (19.0%) | 13 (3.2%) |
| $35,000 to $49,999 | 32 (9.8%) | 34 (8.5%) |
| $50,000 to $74,999 | 54 (16.5%) | 100 (24.9%) |
| $75,000 to $99,999 | 72 (22.0%) | 36 (9.0%) |
| $100,000 to $149,999 | 34 (10.4%) | 107 (26.7%) |
| $150,000 or more | 26 (8.0%) | 80 (20.0%) |
| Total | 327 (100.0%) | 401 (100.0%) |
Property Value to Household Income Ratio in Orofino
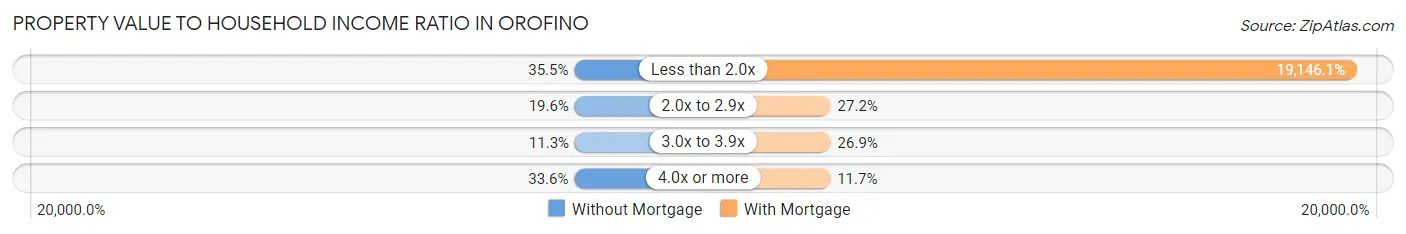
| Value-to-Income Ratio | Without Mortgage | With Mortgage |
| Less than 2.0x | 116 (35.5%) | 76,776 (19,146.1%) |
| 2.0x to 2.9x | 64 (19.6%) | 109 (27.2%) |
| 3.0x to 3.9x | 37 (11.3%) | 108 (26.9%) |
| 4.0x or more | 110 (33.6%) | 47 (11.7%) |
| Total | 327 (100.0%) | 401 (100.0%) |
Real Estate Taxes by Mortgage Status in Orofino
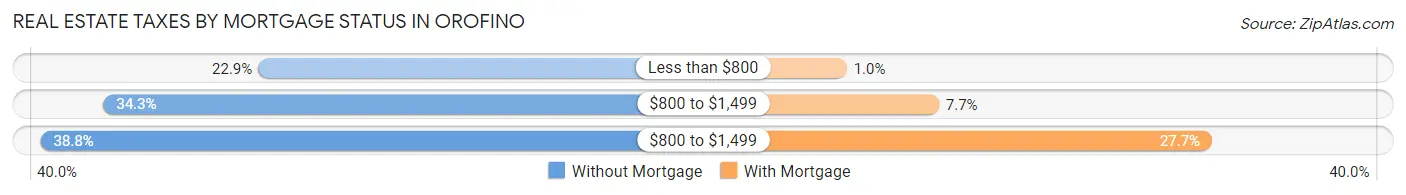
| Property Taxes | Without Mortgage | With Mortgage |
| Less than $800 | 75 (22.9%) | 4 (1.0%) |
| $800 to $1,499 | 112 (34.3%) | 31 (7.7%) |
| $800 to $1,499 | 127 (38.8%) | 111 (27.7%) |
| Total | 327 (100.0%) | 401 (100.0%) |
Health & Disability in Orofino
Health Insurance Coverage by Age in Orofino
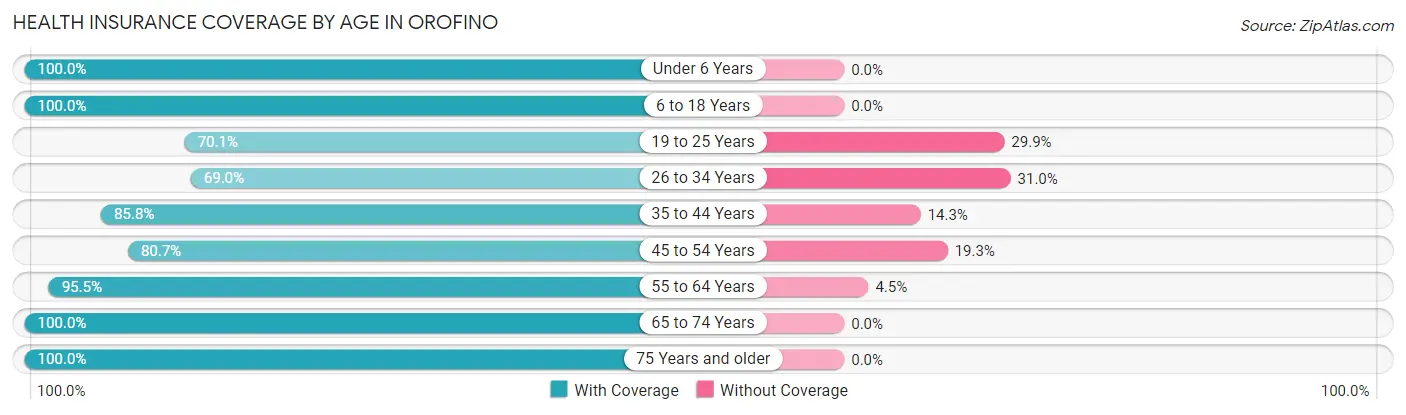
| Age Bracket | With Coverage | Without Coverage |
| Under 6 Years | 164 (100.0%) | 0 (0.0%) |
| 6 to 18 Years | 328 (100.0%) | 0 (0.0%) |
| 19 to 25 Years | 101 (70.1%) | 43 (29.9%) |
| 26 to 34 Years | 178 (69.0%) | 80 (31.0%) |
| 35 to 44 Years | 319 (85.8%) | 53 (14.2%) |
| 45 to 54 Years | 180 (80.7%) | 43 (19.3%) |
| 55 to 64 Years | 402 (95.5%) | 19 (4.5%) |
| 65 to 74 Years | 265 (100.0%) | 0 (0.0%) |
| 75 Years and older | 267 (100.0%) | 0 (0.0%) |
| Total | 2,204 (90.2%) | 238 (9.8%) |
Health Insurance Coverage by Citizenship Status in Orofino
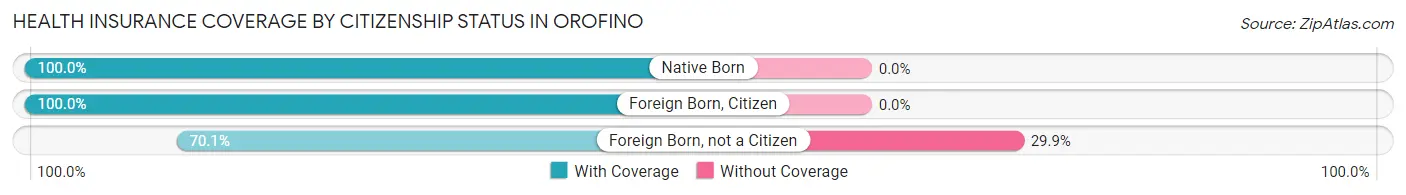
| Citizenship Status | With Coverage | Without Coverage |
| Native Born | 164 (100.0%) | 0 (0.0%) |
| Foreign Born, Citizen | 328 (100.0%) | 0 (0.0%) |
| Foreign Born, not a Citizen | 101 (70.1%) | 43 (29.9%) |
Health Insurance Coverage by Household Income in Orofino
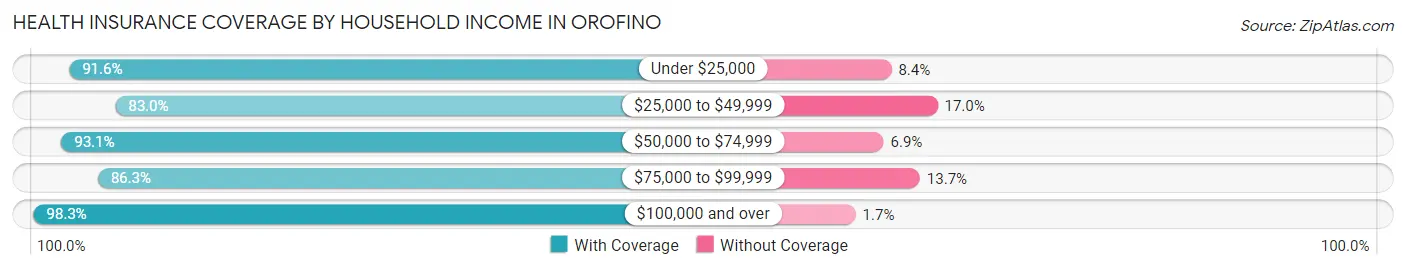
| Household Income | With Coverage | Without Coverage |
| Under $25,000 | 230 (91.6%) | 21 (8.4%) |
| $25,000 to $49,999 | 542 (83.0%) | 111 (17.0%) |
| $50,000 to $74,999 | 338 (93.1%) | 25 (6.9%) |
| $75,000 to $99,999 | 441 (86.3%) | 70 (13.7%) |
| $100,000 and over | 653 (98.3%) | 11 (1.7%) |
Public vs Private Health Insurance Coverage by Age in Orofino
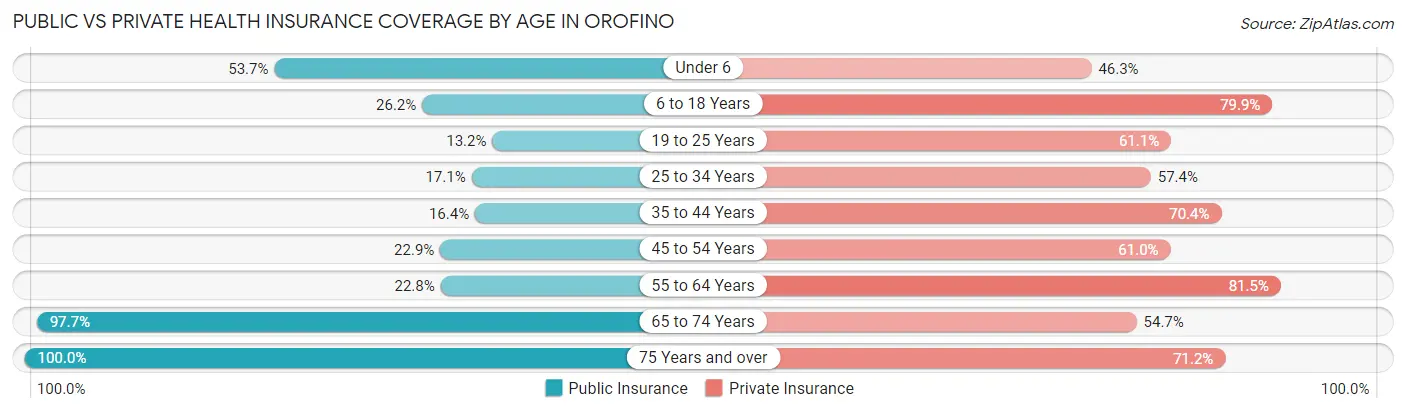
| Age Bracket | Public Insurance | Private Insurance |
| Under 6 | 88 (53.7%) | 76 (46.3%) |
| 6 to 18 Years | 86 (26.2%) | 262 (79.9%) |
| 19 to 25 Years | 19 (13.2%) | 88 (61.1%) |
| 25 to 34 Years | 44 (17.1%) | 148 (57.4%) |
| 35 to 44 Years | 61 (16.4%) | 262 (70.4%) |
| 45 to 54 Years | 51 (22.9%) | 136 (61.0%) |
| 55 to 64 Years | 96 (22.8%) | 343 (81.5%) |
| 65 to 74 Years | 259 (97.7%) | 145 (54.7%) |
| 75 Years and over | 267 (100.0%) | 190 (71.2%) |
| Total | 971 (39.8%) | 1,650 (67.6%) |
Disability Status by Sex by Age in Orofino
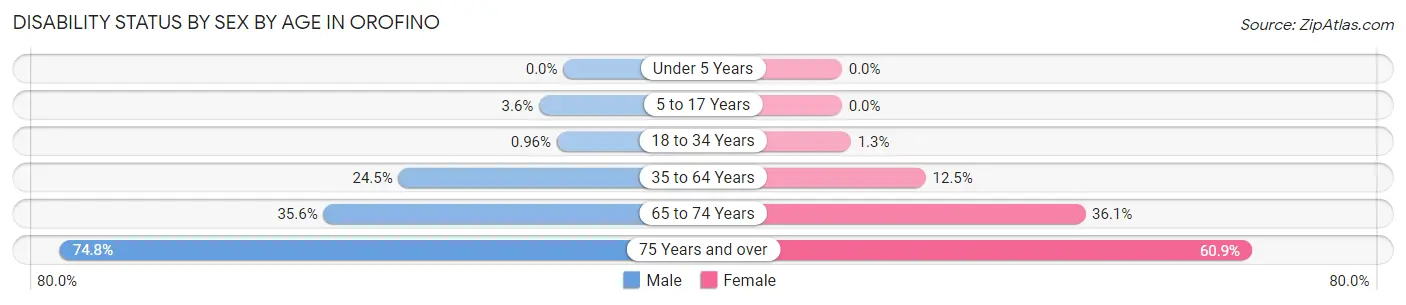
| Age Bracket | Male | Female |
| Under 5 Years | 0 (0.0%) | 0 (0.0%) |
| 5 to 17 Years | 8 (3.6%) | 0 (0.0%) |
| 18 to 34 Years | 2 (1.0%) | 3 (1.3%) |
| 35 to 64 Years | 115 (24.5%) | 68 (12.4%) |
| 65 to 74 Years | 52 (35.6%) | 43 (36.1%) |
| 75 Years and over | 83 (74.8%) | 95 (60.9%) |
Disability Class by Sex by Age in Orofino
Disability Class: Hearing Difficulty
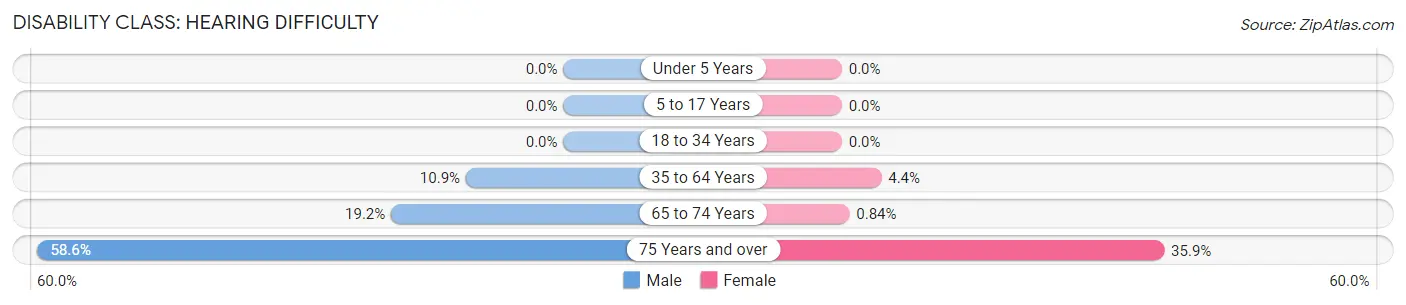
| Age Bracket | Male | Female |
| Under 5 Years | 0 (0.0%) | 0 (0.0%) |
| 5 to 17 Years | 0 (0.0%) | 0 (0.0%) |
| 18 to 34 Years | 0 (0.0%) | 0 (0.0%) |
| 35 to 64 Years | 51 (10.8%) | 24 (4.4%) |
| 65 to 74 Years | 28 (19.2%) | 1 (0.8%) |
| 75 Years and over | 65 (58.6%) | 56 (35.9%) |
Disability Class: Vision Difficulty
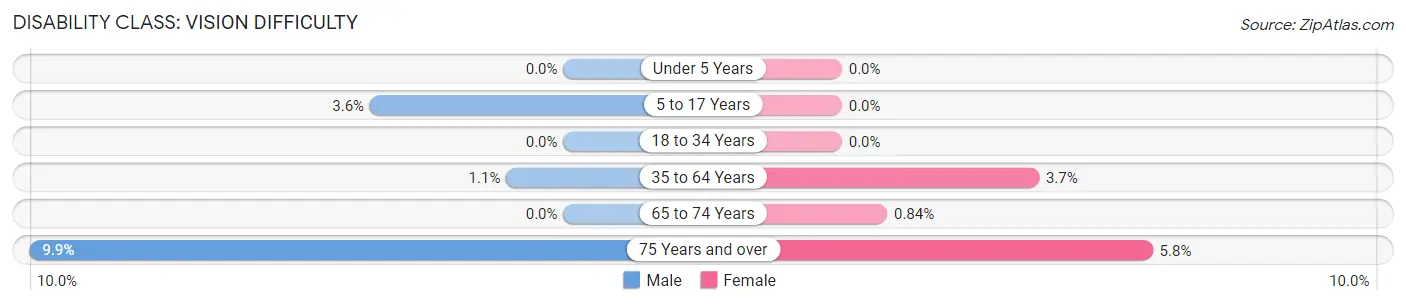
| Age Bracket | Male | Female |
| Under 5 Years | 0 (0.0%) | 0 (0.0%) |
| 5 to 17 Years | 8 (3.6%) | 0 (0.0%) |
| 18 to 34 Years | 0 (0.0%) | 0 (0.0%) |
| 35 to 64 Years | 5 (1.1%) | 20 (3.7%) |
| 65 to 74 Years | 0 (0.0%) | 1 (0.8%) |
| 75 Years and over | 11 (9.9%) | 9 (5.8%) |
Disability Class: Cognitive Difficulty
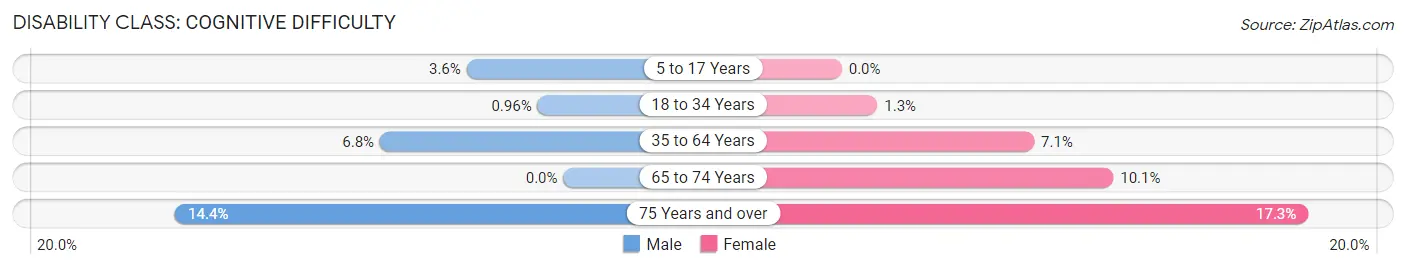
| Age Bracket | Male | Female |
| 5 to 17 Years | 8 (3.6%) | 0 (0.0%) |
| 18 to 34 Years | 2 (1.0%) | 3 (1.3%) |
| 35 to 64 Years | 32 (6.8%) | 39 (7.1%) |
| 65 to 74 Years | 0 (0.0%) | 12 (10.1%) |
| 75 Years and over | 16 (14.4%) | 27 (17.3%) |
Disability Class: Ambulatory Difficulty
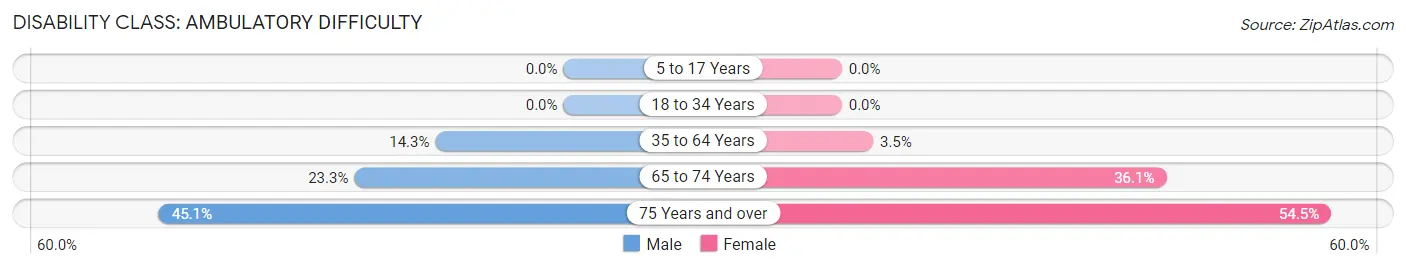
| Age Bracket | Male | Female |
| 5 to 17 Years | 0 (0.0%) | 0 (0.0%) |
| 18 to 34 Years | 0 (0.0%) | 0 (0.0%) |
| 35 to 64 Years | 67 (14.3%) | 19 (3.5%) |
| 65 to 74 Years | 34 (23.3%) | 43 (36.1%) |
| 75 Years and over | 50 (45.1%) | 85 (54.5%) |
Disability Class: Self-Care Difficulty
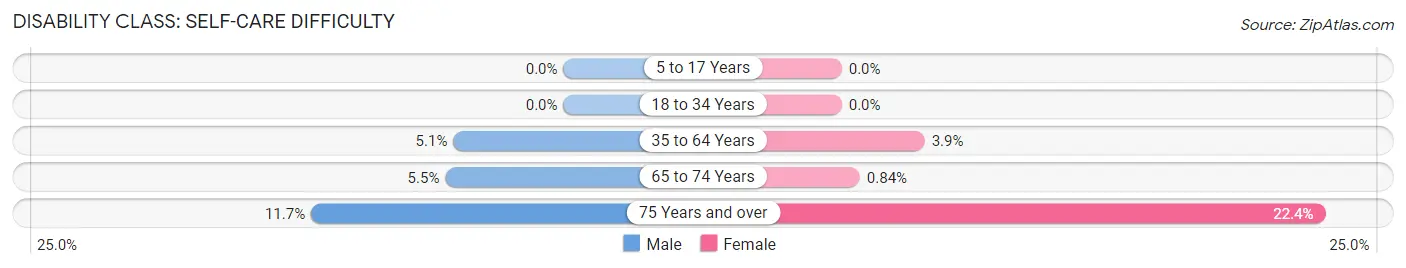
| Age Bracket | Male | Female |
| 5 to 17 Years | 0 (0.0%) | 0 (0.0%) |
| 18 to 34 Years | 0 (0.0%) | 0 (0.0%) |
| 35 to 64 Years | 24 (5.1%) | 21 (3.8%) |
| 65 to 74 Years | 8 (5.5%) | 1 (0.8%) |
| 75 Years and over | 13 (11.7%) | 35 (22.4%) |
Technology Access in Orofino
Computing Device Access in Orofino
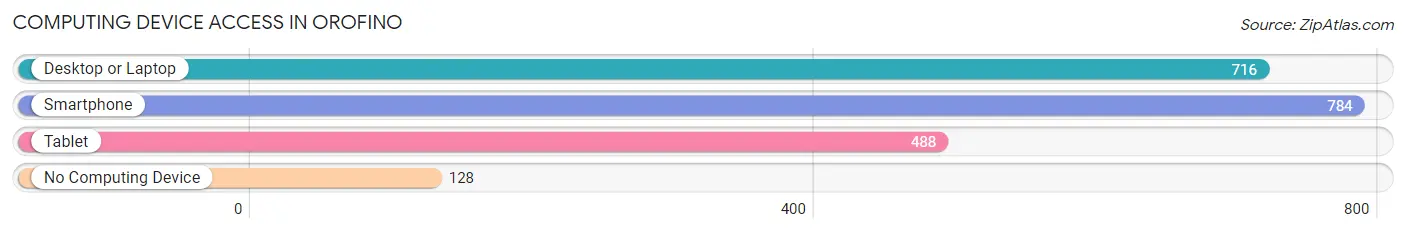
| Device Type | # Households | % Households |
| Desktop or Laptop | 716 | 70.5% |
| Smartphone | 784 | 77.2% |
| Tablet | 488 | 48.1% |
| No Computing Device | 128 | 12.6% |
| Total | 1,015 | 100.0% |
Internet Access in Orofino
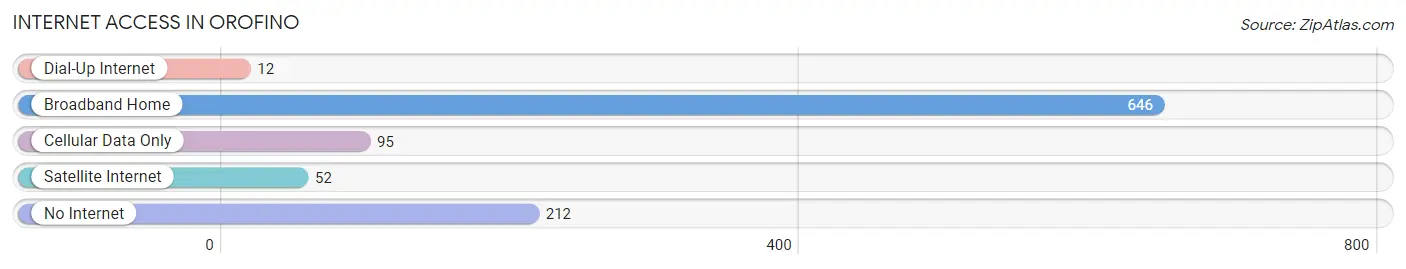
| Internet Type | # Households | % Households |
| Dial-Up Internet | 12 | 1.2% |
| Broadband Home | 646 | 63.6% |
| Cellular Data Only | 95 | 9.4% |
| Satellite Internet | 52 | 5.1% |
| No Internet | 212 | 20.9% |
| Total | 1,015 | 100.0% |
Orofino Summary
Orofino is a small city located in Clearwater County, Idaho, United States. It is situated along the Clearwater River, approximately 50 miles east of Lewiston. The city is the county seat of Clearwater County and has a population of 2,611 as of the 2010 census.
History
Orofino was founded in 1891 by the Northern Pacific Railroad. The city was named after the Spanish word for “fine gold”, in reference to the gold that was discovered in the area. The city was incorporated in 1901 and has since grown to become the county seat of Clearwater County.
Geography
Orofino is located in the Clearwater River Valley, at an elevation of 1,845 feet. The city is situated along the Clearwater River, approximately 50 miles east of Lewiston. The city is surrounded by the Nez Perce National Forest and is located near the Dworshak Reservoir.
Climate
Orofino has a humid continental climate, with cold winters and hot summers. The average annual temperature is 44.3°F, with an average high of 68.2°F in July and an average low of 20.4°F in January. The average annual precipitation is 22.3 inches, with an average of 48.3 inches of snowfall per year.
Economy
Orofino’s economy is largely based on timber and agriculture. The city is home to several lumber mills, as well as a number of farms and ranches. The city is also home to a number of small businesses, including restaurants, retail stores, and service providers.
Demographics
As of the 2010 census, there were 2,611 people, 1,093 households, and 690 families residing in the city. The population density was 1,093.2 people per square mile. The racial makeup of the city was 94.2% White, 0.2% African American, 1.2% Native American, 0.4% Asian, 0.1% Pacific Islander, 0.7% from other races, and 2.3% from two or more races. Hispanic or Latino of any race were 2.7% of the population.
The median income for a household in the city was $30,938, and the median income for a family was $37,917. The per capita income for the city was $17,845. About 17.2% of families and 20.2% of the population were below the poverty line, including 28.2% of those under age 18 and 11.2% of those age 65 or over.
Conclusion
Orofino is a small city located in Clearwater County, Idaho, United States. It is situated along the Clearwater River, approximately 50 miles east of Lewiston. The city was founded in 1891 by the Northern Pacific Railroad and has since grown to become the county seat of Clearwater County. The city’s economy is largely based on timber and agriculture, and it is home to several lumber mills, farms, and ranches. As of the 2010 census, the population of Orofino was 2,611. The city has a humid continental climate, with cold winters and hot summers.
Common Questions
What is Per Capita Income in Orofino?
Per Capita income in Orofino is $25,735.
What is the Median Family Income in Orofino?
Median Family Income in Orofino is $75,865.
What is the Median Household income in Orofino?
Median Household Income in Orofino is $51,518.
What is Income or Wage Gap in Orofino?
Income or Wage Gap in Orofino is 20.7%.
Women in Orofino earn 79.3 cents for every dollar earned by a man.
What is Inequality or Gini Index in Orofino?
Inequality or Gini Index in Orofino is 0.42.
What is the Total Population of Orofino?
Total Population of Orofino is 3,251.
What is the Total Male Population of Orofino?
Total Male Population of Orofino is 1,939.
What is the Total Female Population of Orofino?
Total Female Population of Orofino is 1,312.
What is the Ratio of Males per 100 Females in Orofino?
There are 147.79 Males per 100 Females in Orofino.
What is the Ratio of Females per 100 Males in Orofino?
There are 67.66 Females per 100 Males in Orofino.
What is the Median Population Age in Orofino?
Median Population Age in Orofino is 42.1 Years.
What is the Average Family Size in Orofino
Average Family Size in Orofino is 3.2 People.
What is the Average Household Size in Orofino
Average Household Size in Orofino is 2.4 People.
How Large is the Labor Force in Orofino?
There are 1,226 People in the Labor Forcein in Orofino.
What is the Percentage of People in the Labor Force in Orofino?
43.3% of People are in the Labor Force in Orofino.
What is the Unemployment Rate in Orofino?
Unemployment Rate in Orofino is 3.7%.