Oxford, ID Map & Demographics
Oxford Map
Oxford Overview
$22,332
PER CAPITA INCOME
$81,250
AVG FAMILY INCOME
$56,250
AVG HOUSEHOLD INCOME
0.40
INEQUALITY / GINI INDEX
38
TOTAL POPULATION
19
MALE POPULATION
19
FEMALE POPULATION
100.00
MALES / 100 FEMALES
100.00
FEMALES / 100 MALES
49.5
MEDIAN AGE
3.8
AVG FAMILY SIZE
2.5
AVG HOUSEHOLD SIZE
12
LABOR FORCE [ PEOPLE ]
42.9%
PERCENT IN LABOR FORCE
Oxford Area Codes
Income in Oxford
Income Overview in Oxford
Per Capita Income in Oxford is $22,332, while median incomes of families and households are $81,250 and $56,250 respectively.
| Characteristic | Number | Measure |
| Per Capita Income | 38 | $22,332 |
| Median Family Income | 8 | $81,250 |
| Mean Family Income | 8 | $85,500 |
| Median Household Income | 15 | $56,250 |
| Mean Household Income | 15 | $60,360 |
| Income Deficit | 8 | $0 |
| Wage / Income Gap (%) | 38 | 0.00% |
| Wage / Income Gap ($) | 38 | 100.00¢ per $1 |
| Gini / Inequality Index | 38 | 0.40 |
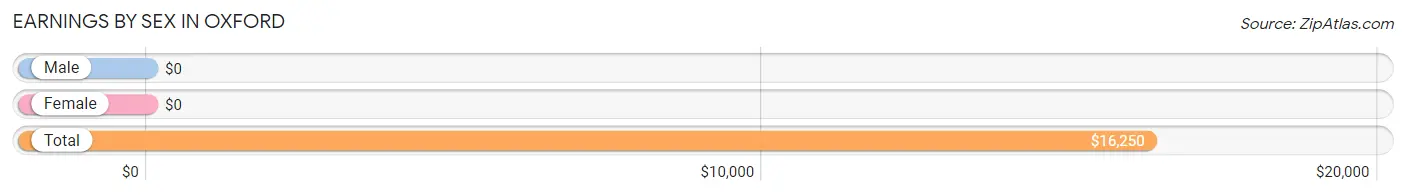
Earnings by Sex in Oxford
| Sex | Number | Average Earnings |
| Male | 10 (55.6%) | $0 |
| Female | 8 (44.4%) | $0 |
| Total | 18 (100.0%) | $16,250 |
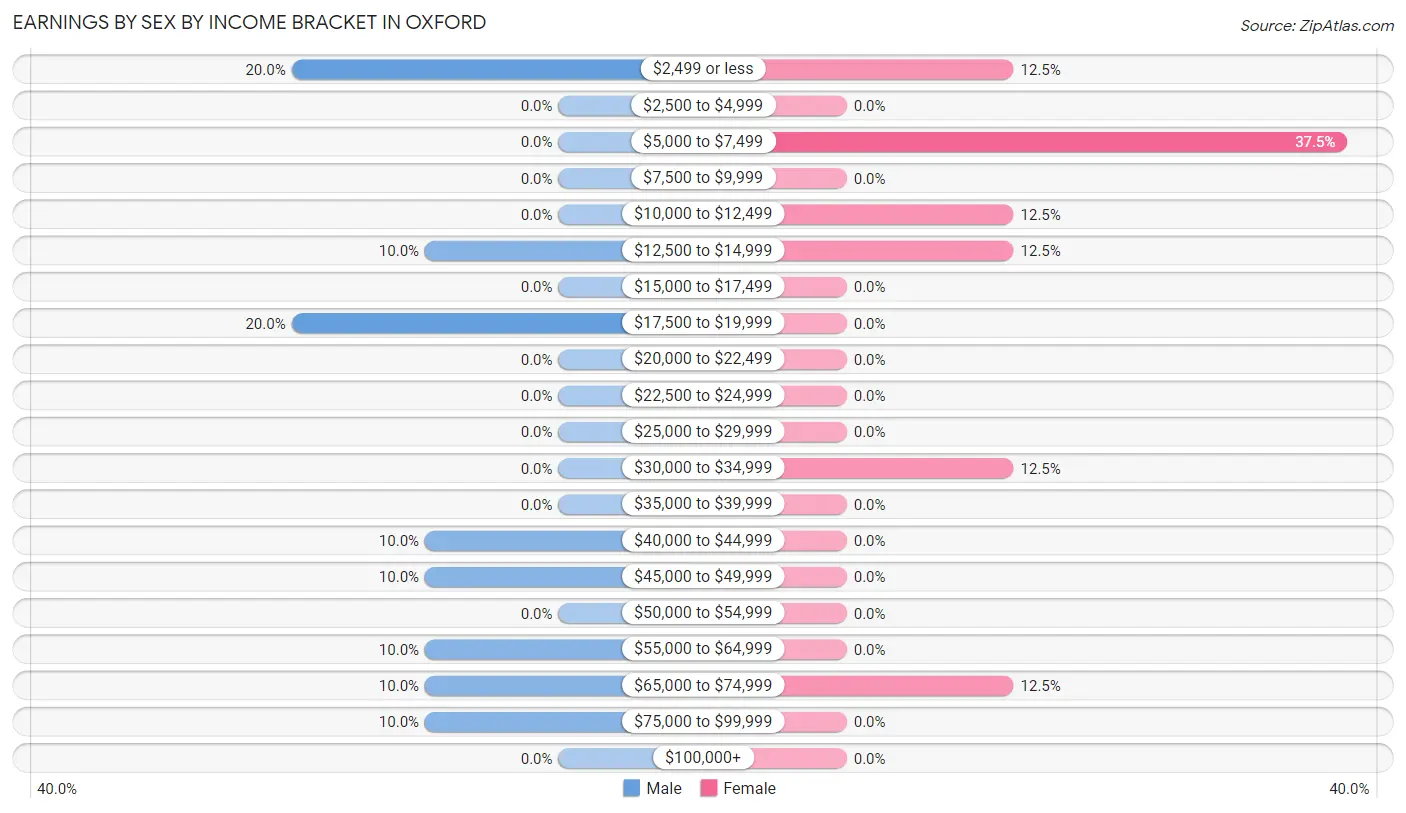
Earnings by Sex by Income Bracket in Oxford
The most common earnings brackets in Oxford are $2,499 or less for men (2 | 20.0%) and $5,000 to $7,499 for women (3 | 37.5%).
| Income | Male | Female |
| $2,499 or less | 2 (20.0%) | 1 (12.5%) |
| $2,500 to $4,999 | 0 (0.0%) | 0 (0.0%) |
| $5,000 to $7,499 | 0 (0.0%) | 3 (37.5%) |
| $7,500 to $9,999 | 0 (0.0%) | 0 (0.0%) |
| $10,000 to $12,499 | 0 (0.0%) | 1 (12.5%) |
| $12,500 to $14,999 | 1 (10.0%) | 1 (12.5%) |
| $15,000 to $17,499 | 0 (0.0%) | 0 (0.0%) |
| $17,500 to $19,999 | 2 (20.0%) | 0 (0.0%) |
| $20,000 to $22,499 | 0 (0.0%) | 0 (0.0%) |
| $22,500 to $24,999 | 0 (0.0%) | 0 (0.0%) |
| $25,000 to $29,999 | 0 (0.0%) | 0 (0.0%) |
| $30,000 to $34,999 | 0 (0.0%) | 1 (12.5%) |
| $35,000 to $39,999 | 0 (0.0%) | 0 (0.0%) |
| $40,000 to $44,999 | 1 (10.0%) | 0 (0.0%) |
| $45,000 to $49,999 | 1 (10.0%) | 0 (0.0%) |
| $50,000 to $54,999 | 0 (0.0%) | 0 (0.0%) |
| $55,000 to $64,999 | 1 (10.0%) | 0 (0.0%) |
| $65,000 to $74,999 | 1 (10.0%) | 1 (12.5%) |
| $75,000 to $99,999 | 1 (10.0%) | 0 (0.0%) |
| $100,000+ | 0 (0.0%) | 0 (0.0%) |
| Total | 10 (100.0%) | 8 (100.0%) |
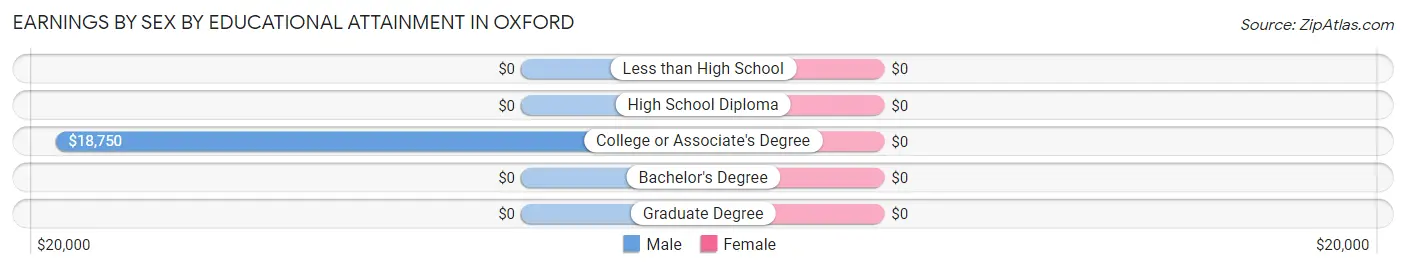
Earnings by Sex by Educational Attainment in Oxford
| Educational Attainment | Male Income | Female Income |
| Less than High School | - | - |
| High School Diploma | - | - |
| College or Associate's Degree | $18,750 | $0 |
| Bachelor's Degree | - | - |
| Graduate Degree | - | - |
| Total | - | - |
Family Income in Oxford
Family Income Brackets in Oxford
According to the Oxford family income data, there are 2 families falling into the $50,000 to $74,999 income range, which is the most common income bracket and makes up 25.0% of all families.
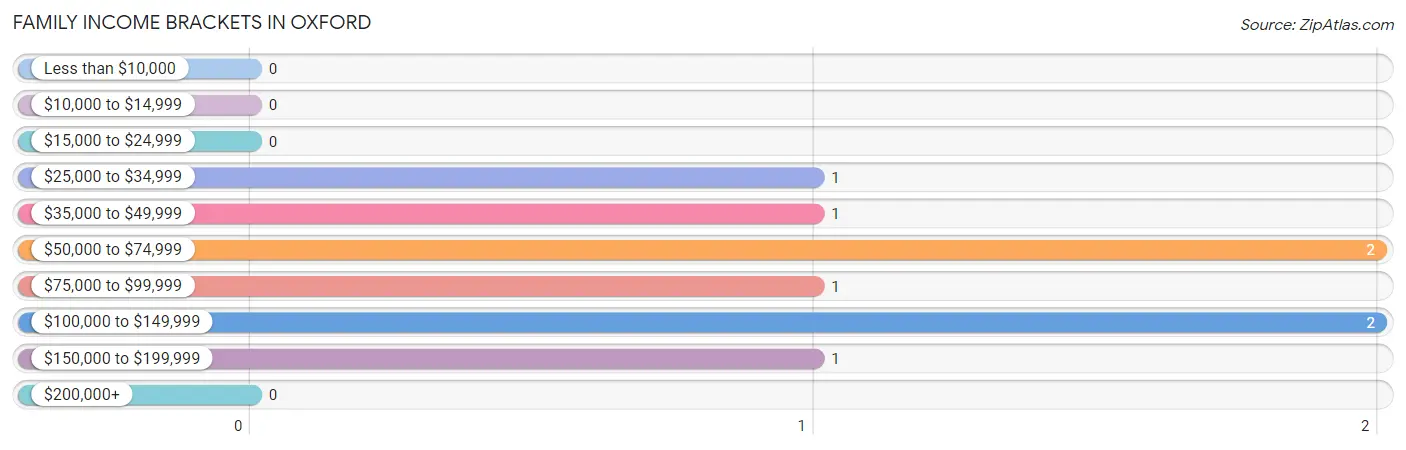
| Income Bracket | # Families | % Families |
| Less than $10,000 | 0 | 0.0% |
| $10,000 to $14,999 | 0 | 0.0% |
| $15,000 to $24,999 | 0 | 0.0% |
| $25,000 to $34,999 | 1 | 12.5% |
| $35,000 to $49,999 | 1 | 12.5% |
| $50,000 to $74,999 | 2 | 25.0% |
| $75,000 to $99,999 | 1 | 12.5% |
| $100,000 to $149,999 | 2 | 25.0% |
| $150,000 to $199,999 | 1 | 12.5% |
| $200,000+ | 0 | 0.0% |
Family Income by Famaliy Size in Oxford
2-person families (5 | 62.5%) account for the highest median family income in Oxford with $105,625 per family, while 2-person families (5 | 62.5%) have the highest median income of $52,812 per family member.
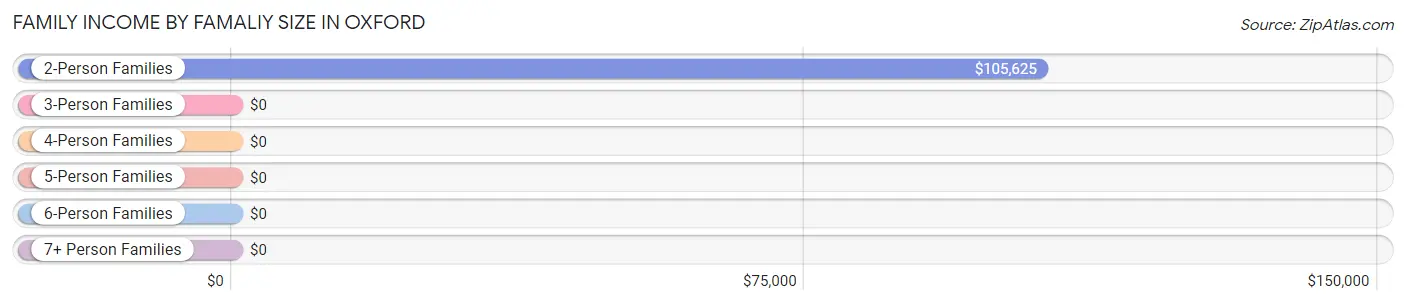
| Income Bracket | # Families | Median Income |
| 2-Person Families | 5 (62.5%) | $105,625 |
| 3-Person Families | 0 (0.0%) | $0 |
| 4-Person Families | 0 (0.0%) | $0 |
| 5-Person Families | 2 (25.0%) | $0 |
| 6-Person Families | 1 (12.5%) | $0 |
| 7+ Person Families | 0 (0.0%) | $0 |
| Total | 8 (100.0%) | $81,250 |
Family Income by Number of Earners in Oxford
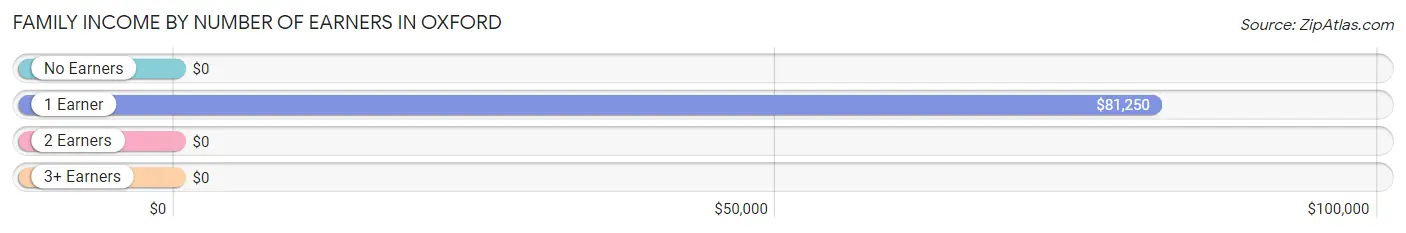
| Number of Earners | # Families | Median Income |
| No Earners | 1 (12.5%) | $0 |
| 1 Earner | 4 (50.0%) | $81,250 |
| 2 Earners | 1 (12.5%) | $0 |
| 3+ Earners | 2 (25.0%) | $0 |
| Total | 8 (100.0%) | $81,250 |
Household Income in Oxford
Household Income Brackets in Oxford
With 3 households falling in the category, the $10,000 to $14,999 income range is the most frequent in Oxford, accounting for 20.0% of all households.
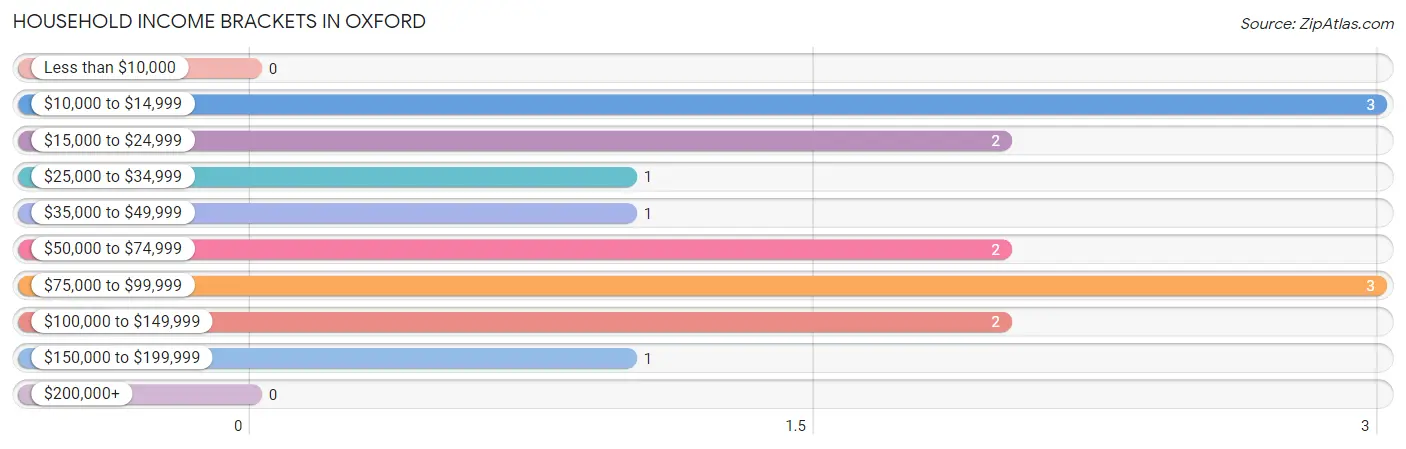
| Income Bracket | # Households | % Households |
| Less than $10,000 | 0 | 0.0% |
| $10,000 to $14,999 | 3 | 20.0% |
| $15,000 to $24,999 | 2 | 13.3% |
| $25,000 to $34,999 | 1 | 6.7% |
| $35,000 to $49,999 | 1 | 6.7% |
| $50,000 to $74,999 | 2 | 13.3% |
| $75,000 to $99,999 | 3 | 20.0% |
| $100,000 to $149,999 | 2 | 13.3% |
| $150,000 to $199,999 | 1 | 6.7% |
| $200,000+ | 0 | 0.0% |
Household Income by Householder Age in Oxford
The median household income in Oxford is $56,250, with the highest median household income of $72,500 found in the 45 to 64 years age bracket for the primary householder. A total of 8 households (53.3%) fall into this category.
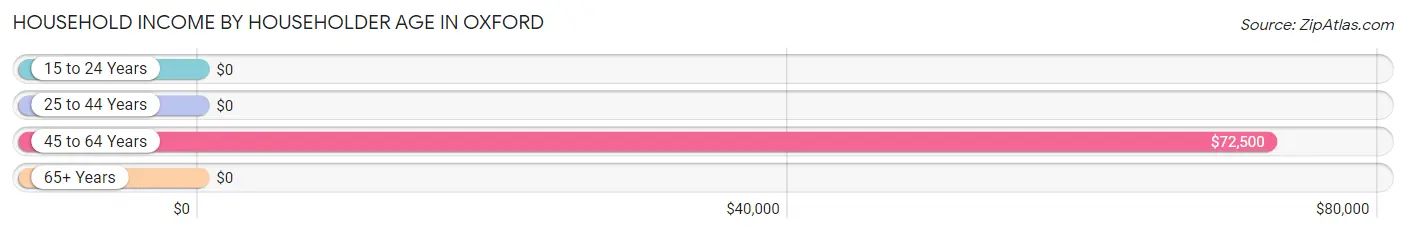
| Income Bracket | # Households | Median Income |
| 15 to 24 Years | 0 (0.0%) | $0 |
| 25 to 44 Years | 1 (6.7%) | $0 |
| 45 to 64 Years | 8 (53.3%) | $72,500 |
| 65+ Years | 6 (40.0%) | $0 |
| Total | 15 (100.0%) | $56,250 |
Poverty in Oxford
Income Below Poverty by Sex and Age in Oxford
With 5.3% poverty level for males and 10.5% for females among the residents of Oxford, 65 to 74 year old males and 75 year old and over females are the most vulnerable to poverty, with 1 males (20.0%) and 2 females (100.0%) in their respective age groups living below the poverty level.
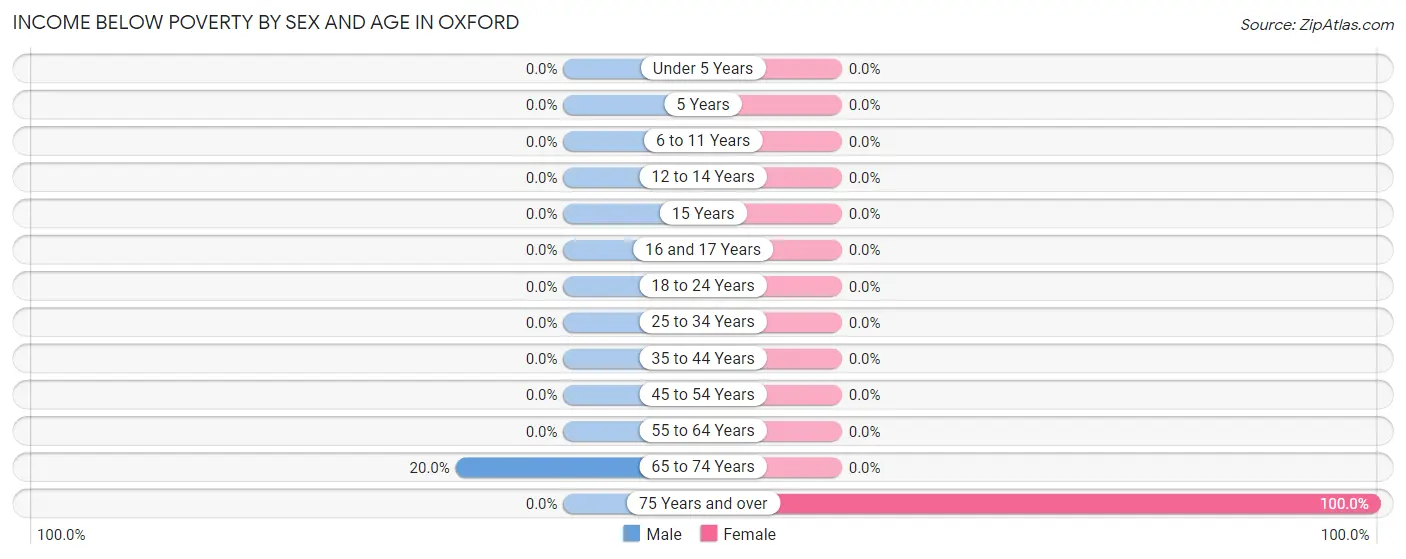
| Age Bracket | Male | Female |
| Under 5 Years | 0 (0.0%) | 0 (0.0%) |
| 5 Years | 0 (0.0%) | 0 (0.0%) |
| 6 to 11 Years | 0 (0.0%) | 0 (0.0%) |
| 12 to 14 Years | 0 (0.0%) | 0 (0.0%) |
| 15 Years | 0 (0.0%) | 0 (0.0%) |
| 16 and 17 Years | 0 (0.0%) | 0 (0.0%) |
| 18 to 24 Years | 0 (0.0%) | 0 (0.0%) |
| 25 to 34 Years | 0 (0.0%) | 0 (0.0%) |
| 35 to 44 Years | 0 (0.0%) | 0 (0.0%) |
| 45 to 54 Years | 0 (0.0%) | 0 (0.0%) |
| 55 to 64 Years | 0 (0.0%) | 0 (0.0%) |
| 65 to 74 Years | 1 (20.0%) | 0 (0.0%) |
| 75 Years and over | 0 (0.0%) | 2 (100.0%) |
| Total | 1 (5.3%) | 2 (10.5%) |
Income Above Poverty by Sex and Age in Oxford
According to the poverty statistics in Oxford, males aged 6 to 11 years and females aged 5 years are the age groups that are most secure financially, with 100.0% of males and 100.0% of females in these age groups living above the poverty line.
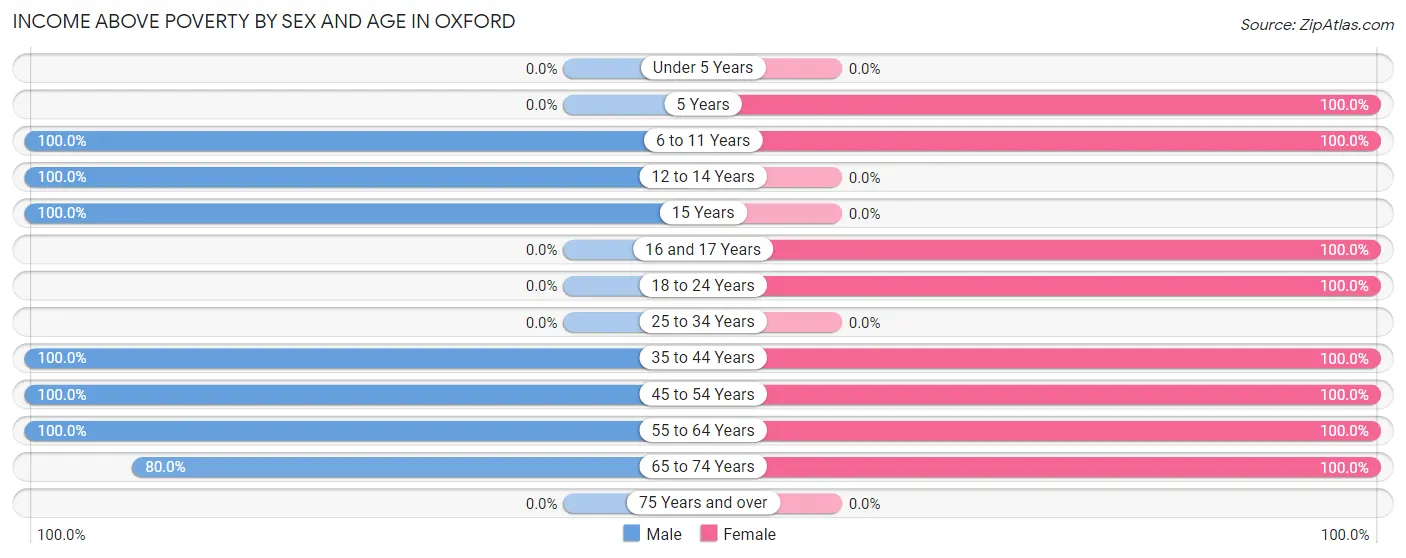
| Age Bracket | Male | Female |
| Under 5 Years | 0 (0.0%) | 0 (0.0%) |
| 5 Years | 0 (0.0%) | 1 (100.0%) |
| 6 to 11 Years | 3 (100.0%) | 2 (100.0%) |
| 12 to 14 Years | 3 (100.0%) | 0 (0.0%) |
| 15 Years | 1 (100.0%) | 0 (0.0%) |
| 16 and 17 Years | 0 (0.0%) | 2 (100.0%) |
| 18 to 24 Years | 0 (0.0%) | 3 (100.0%) |
| 25 to 34 Years | 0 (0.0%) | 0 (0.0%) |
| 35 to 44 Years | 2 (100.0%) | 1 (100.0%) |
| 45 to 54 Years | 3 (100.0%) | 2 (100.0%) |
| 55 to 64 Years | 2 (100.0%) | 2 (100.0%) |
| 65 to 74 Years | 4 (80.0%) | 4 (100.0%) |
| 75 Years and over | 0 (0.0%) | 0 (0.0%) |
| Total | 18 (94.7%) | 17 (89.5%) |
Income Below Poverty Among Married-Couple Families in Oxford
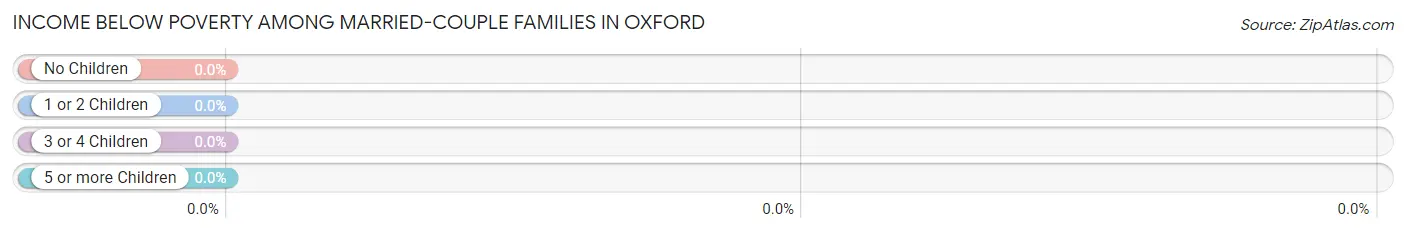
| Children | Above Poverty | Below Poverty |
| No Children | 5 (100.0%) | 0 (0.0%) |
| 1 or 2 Children | 0 (0.0%) | 0 (0.0%) |
| 3 or 4 Children | 2 (100.0%) | 0 (0.0%) |
| 5 or more Children | 0 (0.0%) | 0 (0.0%) |
| Total | 7 (100.0%) | 0 (0.0%) |
Income Below Poverty Among Single-Parent Households in Oxford
| Children | Single Father | Single Mother |
| No Children | 0 (0.0%) | 0 (0.0%) |
| 1 or 2 Children | 0 (0.0%) | 0 (0.0%) |
| 3 or 4 Children | 0 (0.0%) | 0 (0.0%) |
| 5 or more Children | 0 (0.0%) | 0 (0.0%) |
| Total | 0 (0.0%) | 0 (0.0%) |
Income Below Poverty Among Married-Couple vs Single-Parent Households in Oxford
| Children | Married-Couple Families | Single-Parent Households |
| No Children | 0 (0.0%) | 0 (0.0%) |
| 1 or 2 Children | 0 (0.0%) | 0 (0.0%) |
| 3 or 4 Children | 0 (0.0%) | 0 (0.0%) |
| 5 or more Children | 0 (0.0%) | 0 (0.0%) |
| Total | 0 (0.0%) | 0 (0.0%) |
Race in Oxford
The most populous races in Oxford are White / Caucasian (37 | 97.4%), and Native / Alaskan (1 | 2.6%).
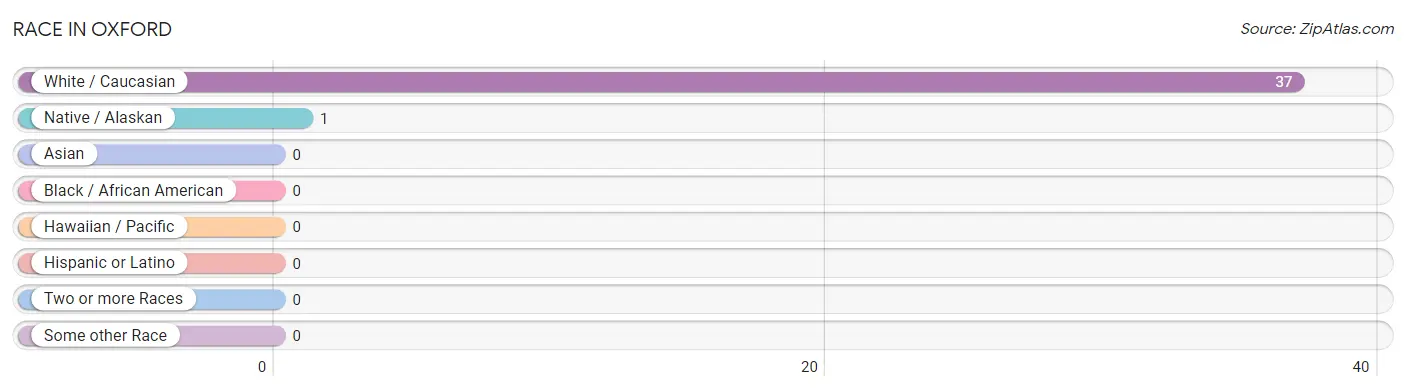
| Race | # Population | % Population |
| Asian | 0 | 0.0% |
| Black / African American | 0 | 0.0% |
| Hawaiian / Pacific | 0 | 0.0% |
| Hispanic or Latino | 0 | 0.0% |
| Native / Alaskan | 1 | 2.6% |
| White / Caucasian | 37 | 97.4% |
| Two or more Races | 0 | 0.0% |
| Some other Race | 0 | 0.0% |
| Total | 38 | 100.0% |
Ancestry in Oxford
The most populous ancestries reported in Oxford are English (21 | 55.3%), American (7 | 18.4%), European (4 | 10.5%), German (2 | 5.3%), and Irish (2 | 5.3%), together accounting for 94.7% of all Oxford residents.
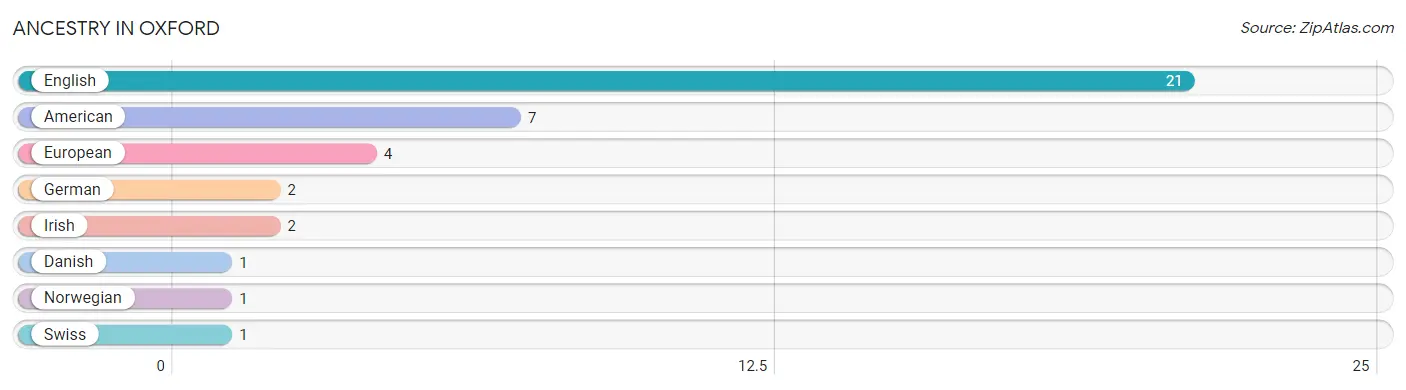
| Ancestry | # Population | % Population |
| American | 7 | 18.4% |
| Danish | 1 | 2.6% |
| English | 21 | 55.3% |
| European | 4 | 10.5% |
| German | 2 | 5.3% |
| Irish | 2 | 5.3% |
| Norwegian | 1 | 2.6% |
| Swiss | 1 | 2.6% | View All 8 Rows |
Immigrants in Oxford

| Immigration Origin | # Population | % Population | View All 0 Rows |
Sex and Age in Oxford
Sex and Age in Oxford
The most populous age groups in Oxford are 10 to 14 Years (5 | 26.3%) for men and 15 to 19 Years (5 | 26.3%) for women.
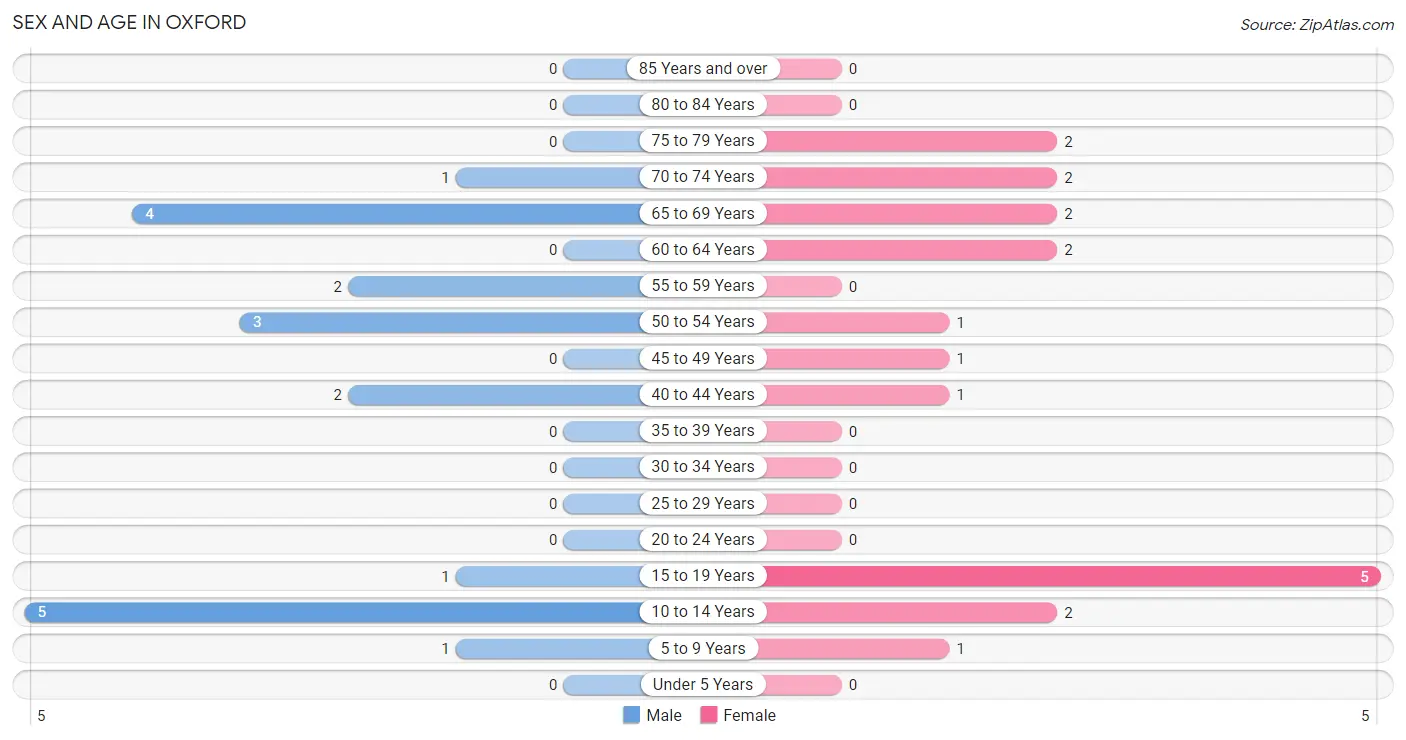
| Age Bracket | Male | Female |
| Under 5 Years | 0 (0.0%) | 0 (0.0%) |
| 5 to 9 Years | 1 (5.3%) | 1 (5.3%) |
| 10 to 14 Years | 5 (26.3%) | 2 (10.5%) |
| 15 to 19 Years | 1 (5.3%) | 5 (26.3%) |
| 20 to 24 Years | 0 (0.0%) | 0 (0.0%) |
| 25 to 29 Years | 0 (0.0%) | 0 (0.0%) |
| 30 to 34 Years | 0 (0.0%) | 0 (0.0%) |
| 35 to 39 Years | 0 (0.0%) | 0 (0.0%) |
| 40 to 44 Years | 2 (10.5%) | 1 (5.3%) |
| 45 to 49 Years | 0 (0.0%) | 1 (5.3%) |
| 50 to 54 Years | 3 (15.8%) | 1 (5.3%) |
| 55 to 59 Years | 2 (10.5%) | 0 (0.0%) |
| 60 to 64 Years | 0 (0.0%) | 2 (10.5%) |
| 65 to 69 Years | 4 (21.0%) | 2 (10.5%) |
| 70 to 74 Years | 1 (5.3%) | 2 (10.5%) |
| 75 to 79 Years | 0 (0.0%) | 2 (10.5%) |
| 80 to 84 Years | 0 (0.0%) | 0 (0.0%) |
| 85 Years and over | 0 (0.0%) | 0 (0.0%) |
| Total | 19 (100.0%) | 19 (100.0%) |
Families and Households in Oxford
Median Family Size in Oxford
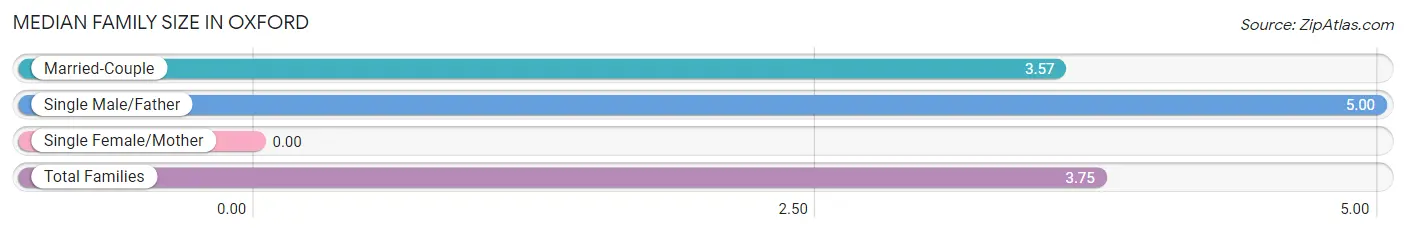
| Family Type | # Families | Family Size |
| Married-Couple | 7 (87.5%) | 3.57 |
| Single Male/Father | 1 (12.5%) | 5.00 |
| Single Female/Mother | 0 (0.0%) | - |
| Total Families | 8 (100.0%) | 3.75 |
Median Household Size in Oxford
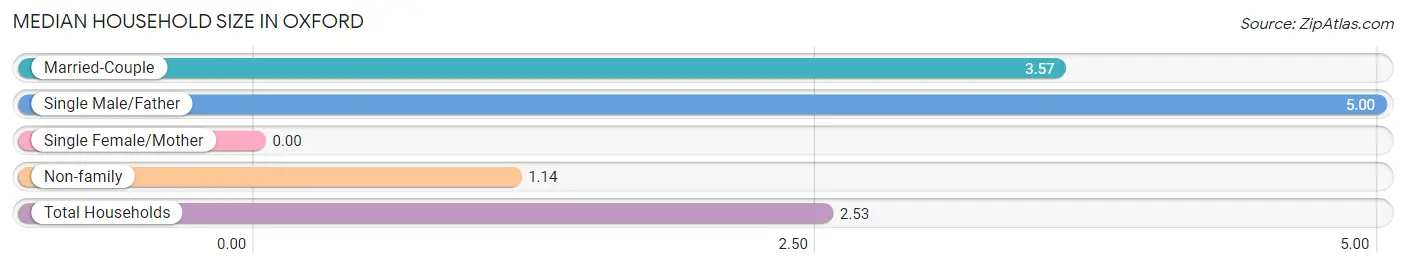
| Household Type | # Households | Household Size |
| Married-Couple | 7 (46.7%) | 3.57 |
| Single Male/Father | 1 (6.7%) | 5.00 |
| Single Female/Mother | 0 (0.0%) | - |
| Non-family | 7 (46.7%) | 1.14 |
| Total Households | 15 (100.0%) | 2.53 |
Household Size by Marriage Status in Oxford
Out of a total of 15 households in Oxford, 8 (53.3%) are family households, while 7 (46.7%) are nonfamily households. The most numerous type of family households are 2-person households, comprising 5, and the most common type of nonfamily households are 1-person households, comprising 5.
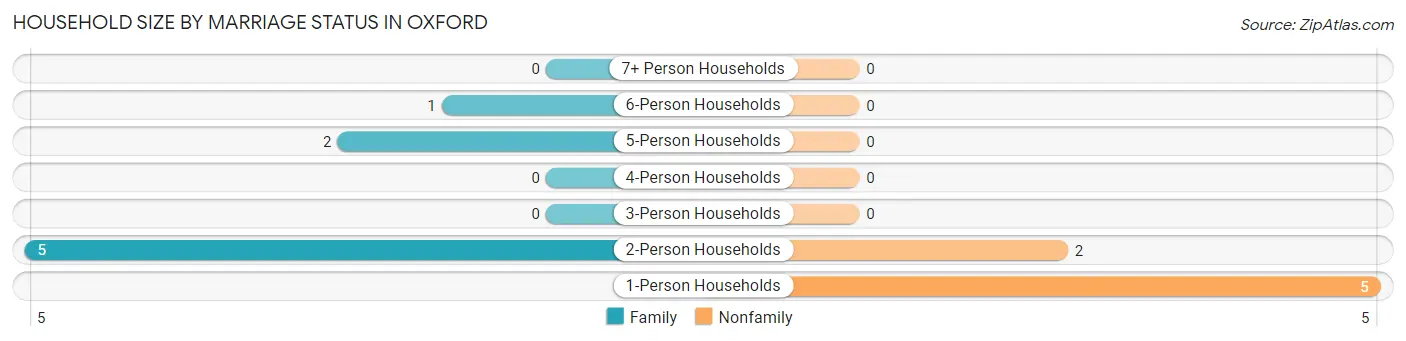
| Household Size | Family Households | Nonfamily Households |
| 1-Person Households | - | 5 (33.3%) |
| 2-Person Households | 5 (33.3%) | 2 (13.3%) |
| 3-Person Households | 0 (0.0%) | 0 (0.0%) |
| 4-Person Households | 0 (0.0%) | 0 (0.0%) |
| 5-Person Households | 2 (13.3%) | 0 (0.0%) |
| 6-Person Households | 1 (6.7%) | 0 (0.0%) |
| 7+ Person Households | 0 (0.0%) | 0 (0.0%) |
| Total | 8 (53.3%) | 7 (46.7%) |
Female Fertility in Oxford
Fertility by Age in Oxford
| Age Bracket | Women with Births | Births / 1,000 Women |
| 15 to 19 years | 0 (0.0%) | 0.0 |
| 20 to 34 years | 0 (0.0%) | 0.0 |
| 35 to 50 years | 0 (0.0%) | 0.0 |
| Total | 0 (0.0%) | 0.0 |
Fertility by Age by Marriage Status in Oxford
| Age Bracket | Married | Unmarried |
| 15 to 19 years | 0 (0.0%) | 0 (0.0%) |
| 20 to 34 years | 0 (0.0%) | 0 (0.0%) |
| 35 to 50 years | 0 (0.0%) | 0 (0.0%) |
| Total | 0 (0.0%) | 0 (0.0%) |
Fertility by Education in Oxford
| Educational Attainment | Women with Births | Births / 1,000 Women |
| Less than High School | 0 (0.0%) | 0.0 |
| High School Diploma | 0 (0.0%) | 0.0 |
| College or Associate's Degree | 0 (0.0%) | 0.0 |
| Bachelor's Degree | 0 (0.0%) | 0.0 |
| Graduate Degree | 0 (0.0%) | 0.0 |
| Total | 0 (0.0%) | 0.0 |
Fertility by Education by Marriage Status in Oxford
| Educational Attainment | Married | Unmarried |
| Less than High School | 0 (0.0%) | 0 (0.0%) |
| High School Diploma | 0 (0.0%) | 0 (0.0%) |
| College or Associate's Degree | 0 (0.0%) | 0 (0.0%) |
| Bachelor's Degree | 0 (0.0%) | 0 (0.0%) |
| Graduate Degree | 0 (0.0%) | 0 (0.0%) |
| Total | 0 (0.0%) | 0 (0.0%) |
Employment Characteristics in Oxford
Employment by Class of Employer in Oxford
Among the 12 employed individuals in Oxford, private company employees (7 | 58.3%), and local government employees (5 | 41.7%) make up the most common classes of employment.
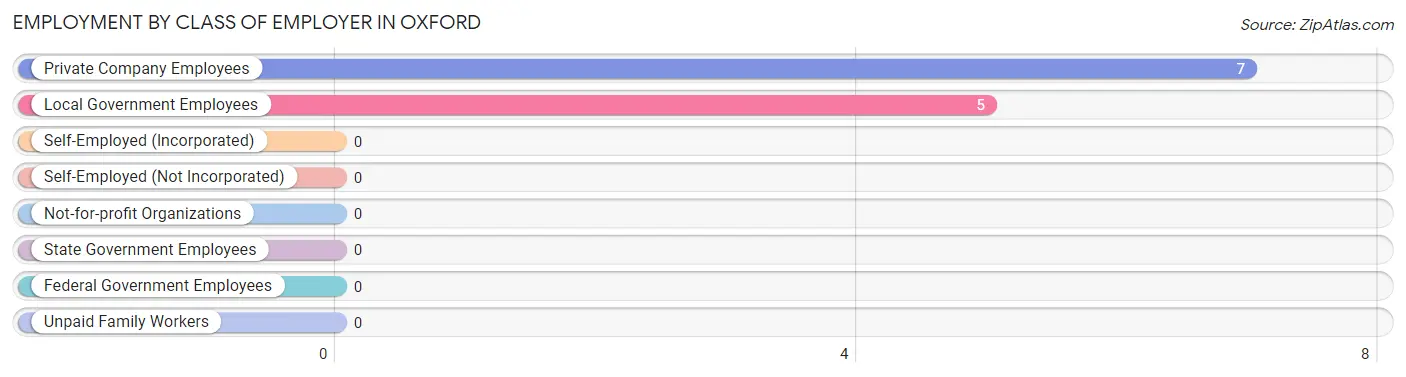
| Employer Class | # Employees | % Employees |
| Private Company Employees | 7 | 58.3% |
| Self-Employed (Incorporated) | 0 | 0.0% |
| Self-Employed (Not Incorporated) | 0 | 0.0% |
| Not-for-profit Organizations | 0 | 0.0% |
| Local Government Employees | 5 | 41.7% |
| State Government Employees | 0 | 0.0% |
| Federal Government Employees | 0 | 0.0% |
| Unpaid Family Workers | 0 | 0.0% |
| Total | 12 | 100.0% |
Employment Status by Age in Oxford
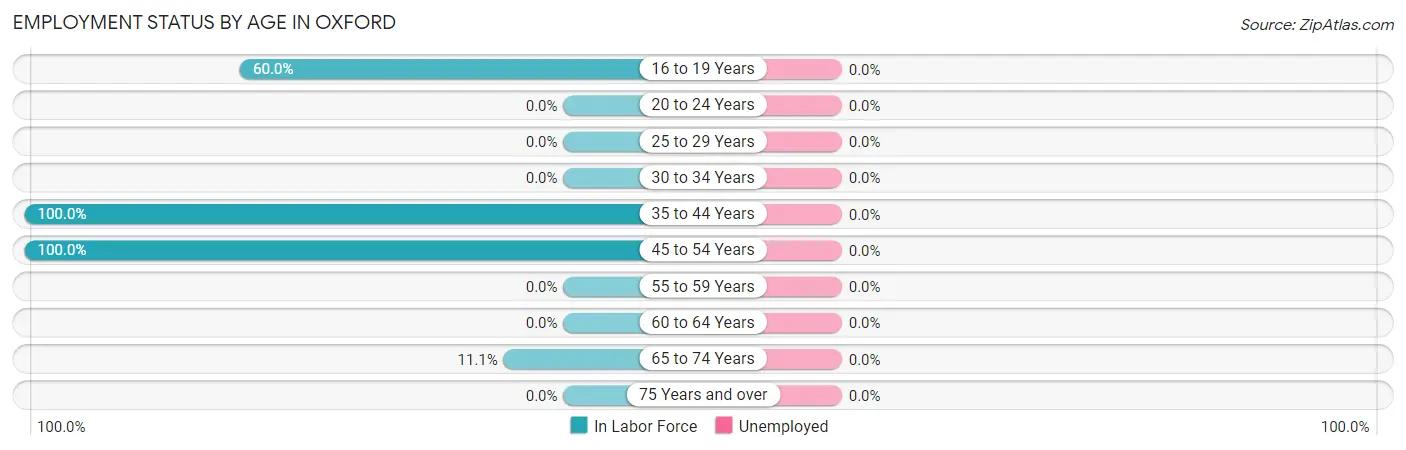
| Age Bracket | In Labor Force | Unemployed |
| 16 to 19 Years | 3 (60.0%) | 0 (0.0%) |
| 20 to 24 Years | 0 (0.0%) | 0 (0.0%) |
| 25 to 29 Years | 0 (0.0%) | 0 (0.0%) |
| 30 to 34 Years | 0 (0.0%) | 0 (0.0%) |
| 35 to 44 Years | 3 (100.0%) | 0 (0.0%) |
| 45 to 54 Years | 5 (100.0%) | 0 (0.0%) |
| 55 to 59 Years | 0 (0.0%) | 0 (0.0%) |
| 60 to 64 Years | 0 (0.0%) | 0 (0.0%) |
| 65 to 74 Years | 1 (11.1%) | 0 (0.0%) |
| 75 Years and over | 0 (0.0%) | 0 (0.0%) |
| Total | 12 (42.9%) | 0 (0.0%) |
Employment Status by Educational Attainment in Oxford
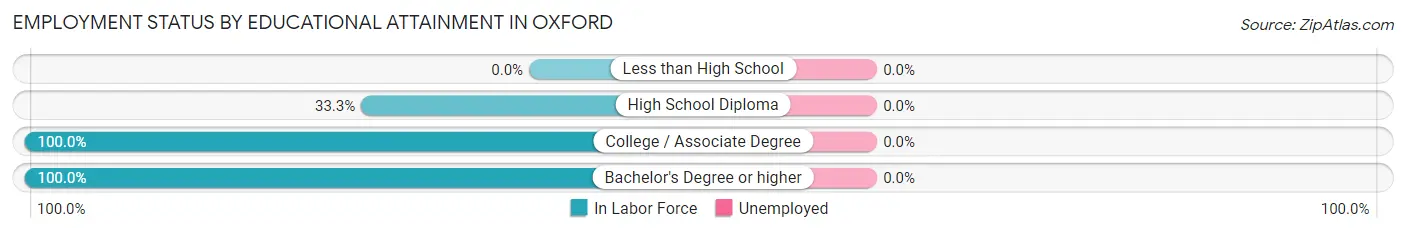
| Educational Attainment | In Labor Force | Unemployed |
| Less than High School | 0 (0.0%) | 0 (0.0%) |
| High School Diploma | 2 (33.3%) | 0 (0.0%) |
| College / Associate Degree | 2 (100.0%) | 0 (0.0%) |
| Bachelor's Degree or higher | 4 (100.0%) | 0 (0.0%) |
| Total | 8 (66.7%) | 0 (0.0%) |
Employment Occupations by Sex in Oxford
Management, Business, Science and Arts Occupations
The most common Management, Business, Science and Arts occupations in Oxford are Community & Social Service (4 | 33.3%), Education, Arts & Media (3 | 25.0%), Management (1 | 8.3%), Business & Financial (1 | 8.3%), and Computers, Engineering & Science (1 | 8.3%).
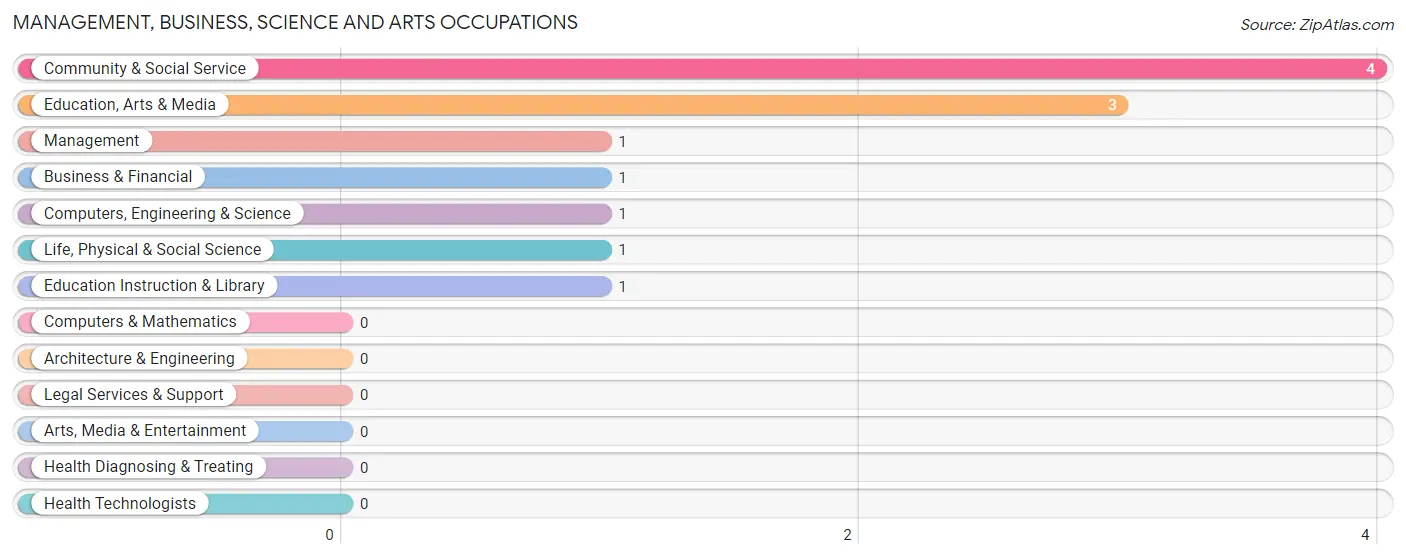
Management, Business, Science and Arts Occupations by Sex
Within the Management, Business, Science and Arts occupations in Oxford, the most male-oriented occupations are Computers, Engineering & Science (100.0%), Life, Physical & Social Science (100.0%), and Education Instruction & Library (100.0%), while the most female-oriented occupations are Management (100.0%), Business & Financial (100.0%), and Education, Arts & Media (100.0%).
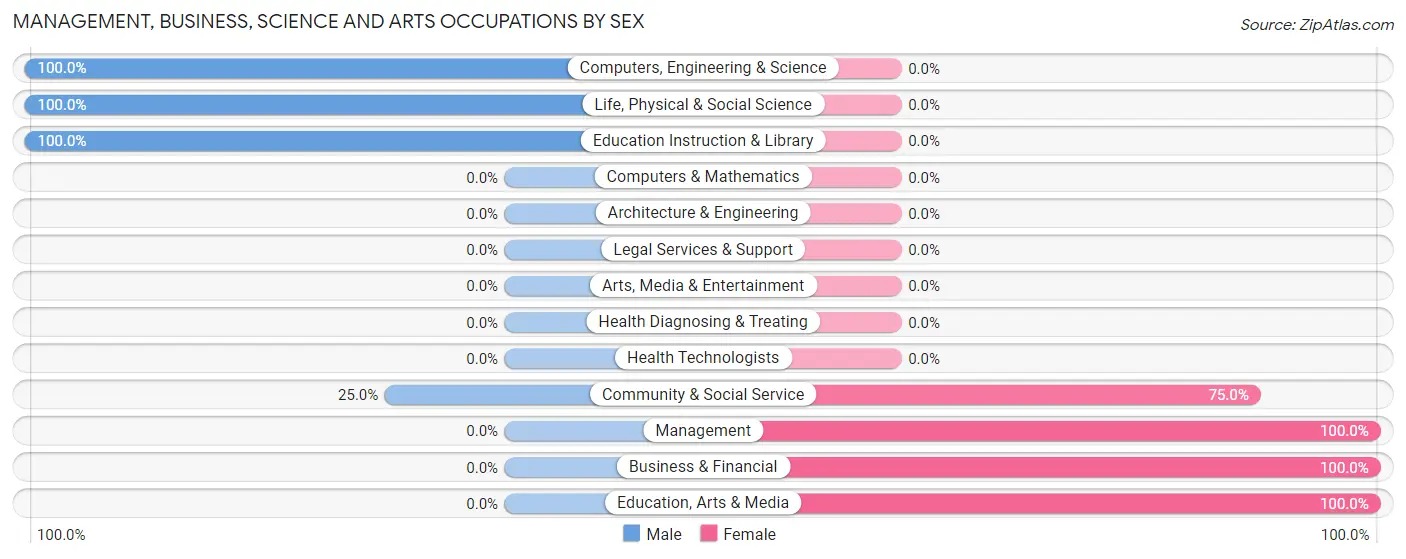
| Occupation | Male | Female |
| Management | 0 (0.0%) | 1 (100.0%) |
| Business & Financial | 0 (0.0%) | 1 (100.0%) |
| Computers, Engineering & Science | 1 (100.0%) | 0 (0.0%) |
| Computers & Mathematics | 0 (0.0%) | 0 (0.0%) |
| Architecture & Engineering | 0 (0.0%) | 0 (0.0%) |
| Life, Physical & Social Science | 1 (100.0%) | 0 (0.0%) |
| Community & Social Service | 1 (25.0%) | 3 (75.0%) |
| Education, Arts & Media | 0 (0.0%) | 3 (100.0%) |
| Legal Services & Support | 0 (0.0%) | 0 (0.0%) |
| Education Instruction & Library | 1 (100.0%) | 0 (0.0%) |
| Arts, Media & Entertainment | 0 (0.0%) | 0 (0.0%) |
| Health Diagnosing & Treating | 0 (0.0%) | 0 (0.0%) |
| Health Technologists | 0 (0.0%) | 0 (0.0%) |
| Total (Category) | 2 (28.6%) | 5 (71.4%) |
| Total (Overall) | 6 (50.0%) | 6 (50.0%) |
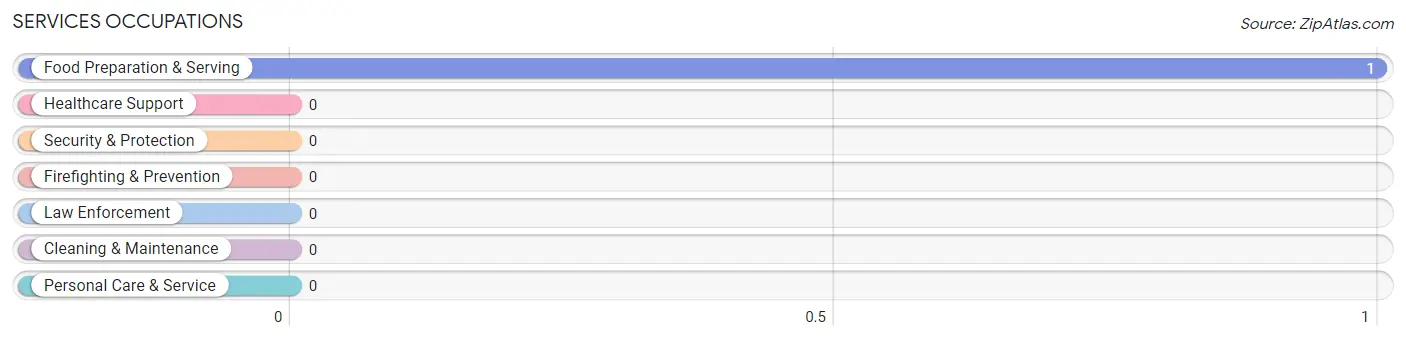
Services Occupations
The most common Services occupations in Oxford are , and Food Preparation & Serving (1 | 8.3%).
Services Occupations by Sex
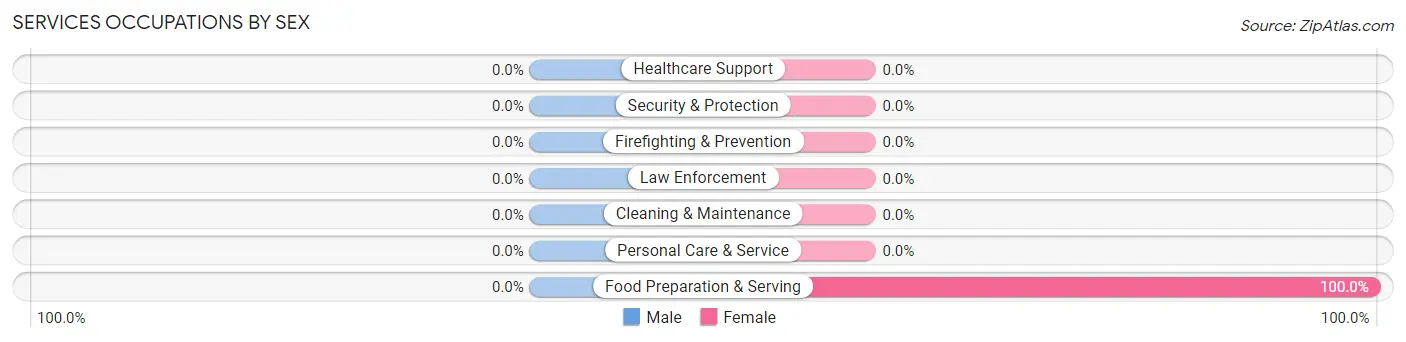
| Occupation | Male | Female |
| Healthcare Support | 0 (0.0%) | 0 (0.0%) |
| Security & Protection | 0 (0.0%) | 0 (0.0%) |
| Firefighting & Prevention | 0 (0.0%) | 0 (0.0%) |
| Law Enforcement | 0 (0.0%) | 0 (0.0%) |
| Food Preparation & Serving | 0 (0.0%) | 1 (100.0%) |
| Cleaning & Maintenance | 0 (0.0%) | 0 (0.0%) |
| Personal Care & Service | 0 (0.0%) | 0 (0.0%) |
| Total (Category) | 0 (0.0%) | 1 (100.0%) |
| Total (Overall) | 6 (50.0%) | 6 (50.0%) |
Sales and Office Occupations
Sales and Office Occupations by Sex
| Occupation | Male | Female |
| Sales & Related | 0 (0.0%) | 0 (0.0%) |
| Office & Administration | 0 (0.0%) | 0 (0.0%) |
| Total (Category) | 0 (0.0%) | 0 (0.0%) |
| Total (Overall) | 6 (50.0%) | 6 (50.0%) |
Natural Resources, Construction and Maintenance Occupations
Natural Resources, Construction and Maintenance Occupations by Sex
| Occupation | Male | Female |
| Farming, Fishing & Forestry | 0 (0.0%) | 0 (0.0%) |
| Construction & Extraction | 0 (0.0%) | 0 (0.0%) |
| Installation, Maintenance & Repair | 0 (0.0%) | 0 (0.0%) |
| Total (Category) | 0 (0.0%) | 0 (0.0%) |
| Total (Overall) | 6 (50.0%) | 6 (50.0%) |
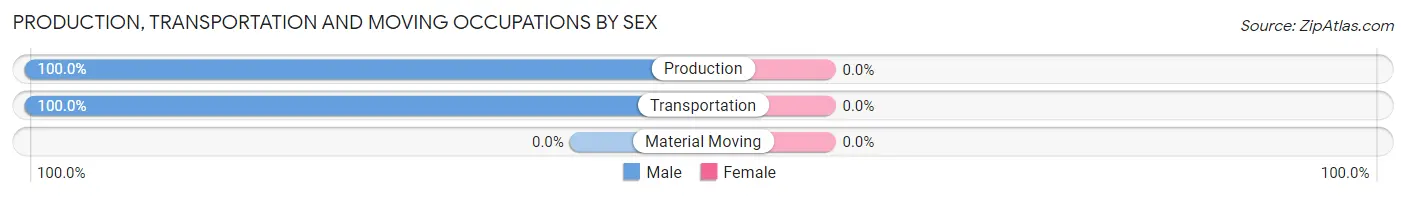
Production, Transportation and Moving Occupations
The most common Production, Transportation and Moving occupations in Oxford are Production (3 | 25.0%), and Transportation (1 | 8.3%).
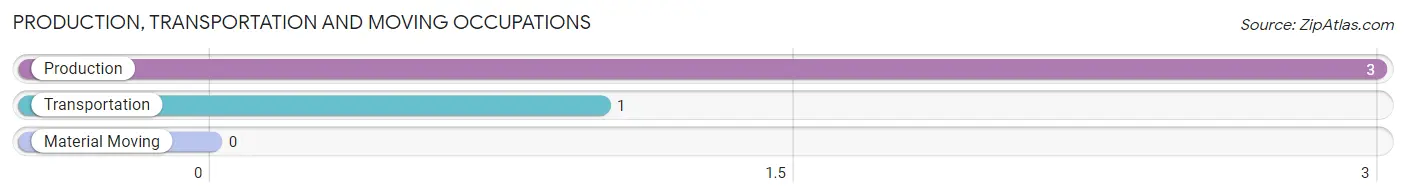
Production, Transportation and Moving Occupations by Sex
| Occupation | Male | Female |
| Production | 3 (100.0%) | 0 (0.0%) |
| Transportation | 1 (100.0%) | 0 (0.0%) |
| Material Moving | 0 (0.0%) | 0 (0.0%) |
| Total (Category) | 4 (100.0%) | 0 (0.0%) |
| Total (Overall) | 6 (50.0%) | 6 (50.0%) |
Employment Industries by Sex in Oxford
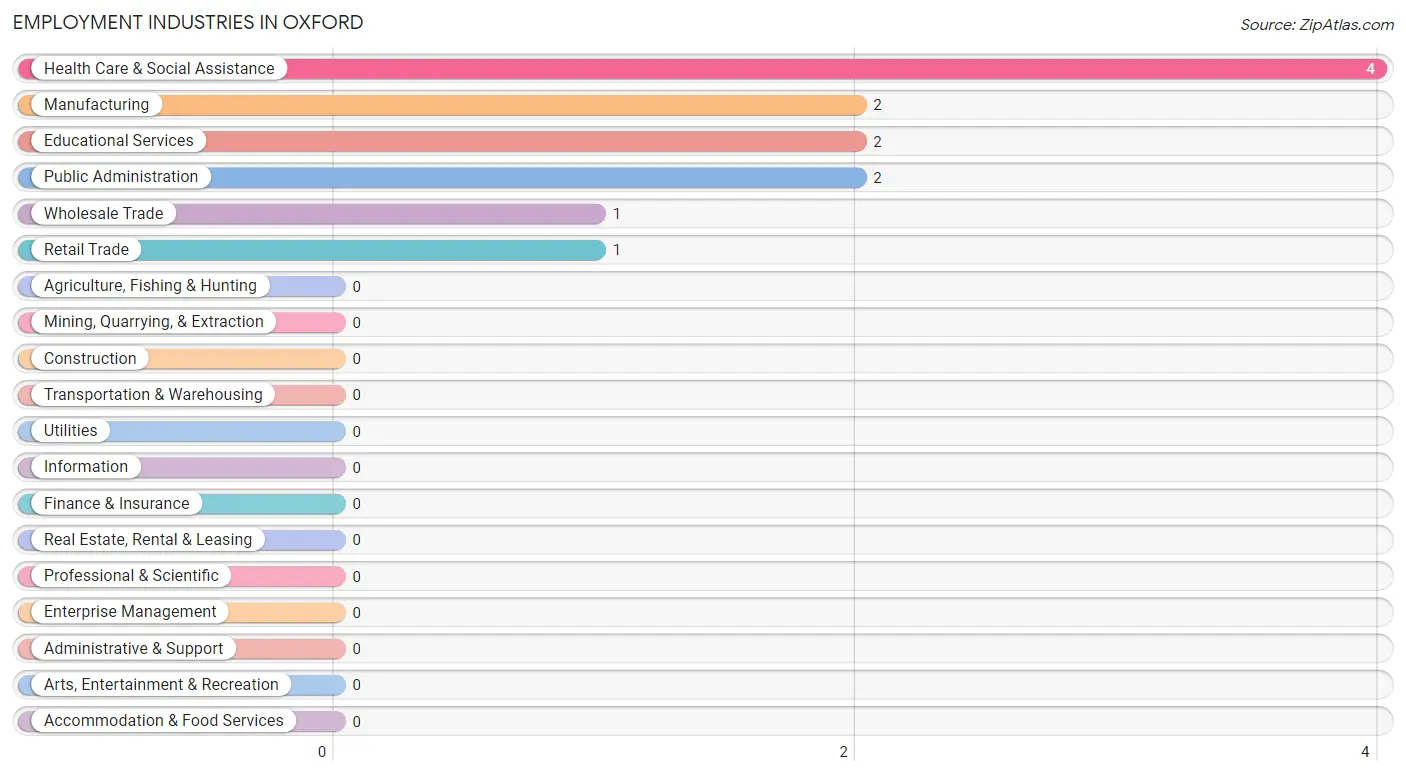
Employment Industries in Oxford
The major employment industries in Oxford include Health Care & Social Assistance (4 | 33.3%), Manufacturing (2 | 16.7%), Educational Services (2 | 16.7%), Public Administration (2 | 16.7%), and Wholesale Trade (1 | 8.3%).
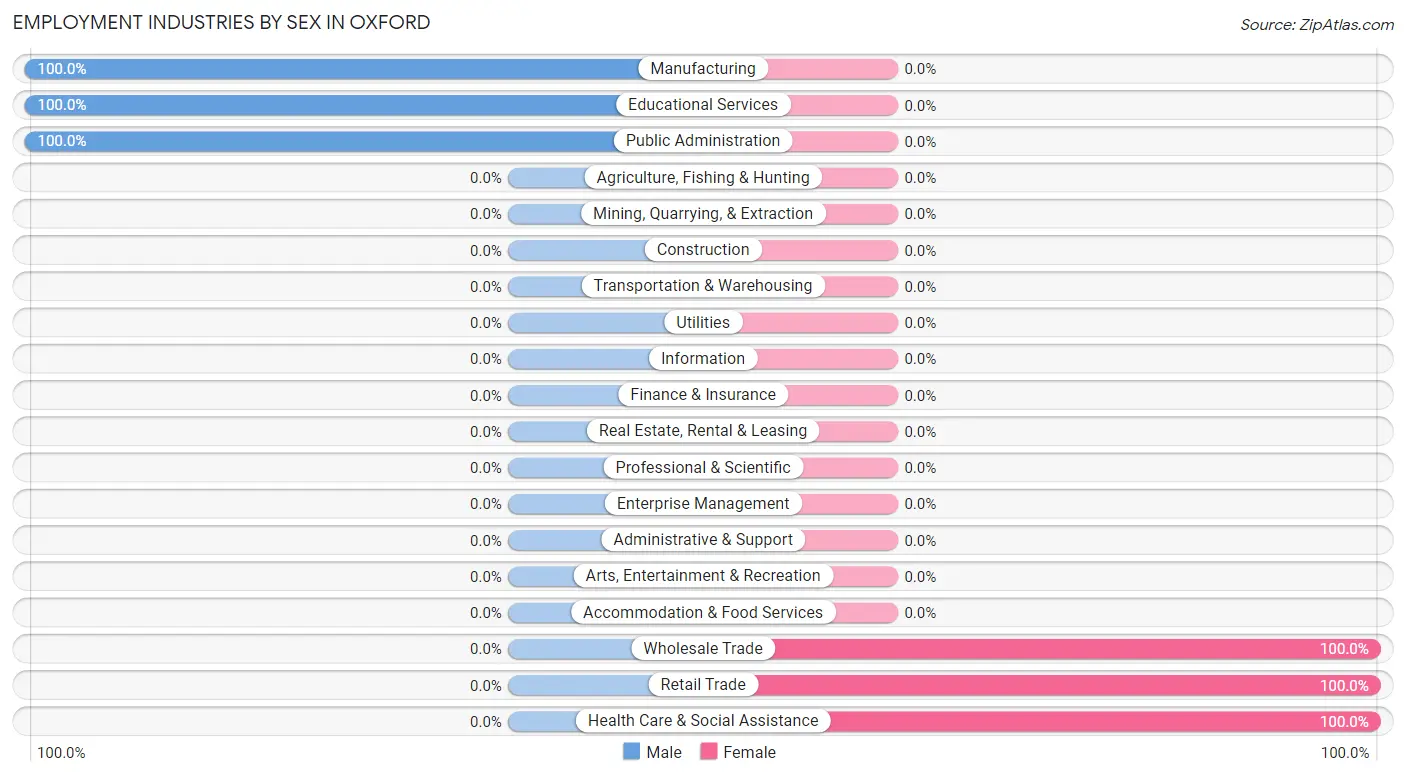
Employment Industries by Sex in Oxford
The Oxford industries that see more men than women are Manufacturing (100.0%), Educational Services (100.0%), and Public Administration (100.0%), whereas the industries that tend to have a higher number of women are Wholesale Trade (100.0%), Retail Trade (100.0%), and Health Care & Social Assistance (100.0%).
| Industry | Male | Female |
| Agriculture, Fishing & Hunting | 0 (0.0%) | 0 (0.0%) |
| Mining, Quarrying, & Extraction | 0 (0.0%) | 0 (0.0%) |
| Construction | 0 (0.0%) | 0 (0.0%) |
| Manufacturing | 2 (100.0%) | 0 (0.0%) |
| Wholesale Trade | 0 (0.0%) | 1 (100.0%) |
| Retail Trade | 0 (0.0%) | 1 (100.0%) |
| Transportation & Warehousing | 0 (0.0%) | 0 (0.0%) |
| Utilities | 0 (0.0%) | 0 (0.0%) |
| Information | 0 (0.0%) | 0 (0.0%) |
| Finance & Insurance | 0 (0.0%) | 0 (0.0%) |
| Real Estate, Rental & Leasing | 0 (0.0%) | 0 (0.0%) |
| Professional & Scientific | 0 (0.0%) | 0 (0.0%) |
| Enterprise Management | 0 (0.0%) | 0 (0.0%) |
| Administrative & Support | 0 (0.0%) | 0 (0.0%) |
| Educational Services | 2 (100.0%) | 0 (0.0%) |
| Health Care & Social Assistance | 0 (0.0%) | 4 (100.0%) |
| Arts, Entertainment & Recreation | 0 (0.0%) | 0 (0.0%) |
| Accommodation & Food Services | 0 (0.0%) | 0 (0.0%) |
| Public Administration | 2 (100.0%) | 0 (0.0%) |
| Total | 6 (50.0%) | 6 (50.0%) |
Education in Oxford
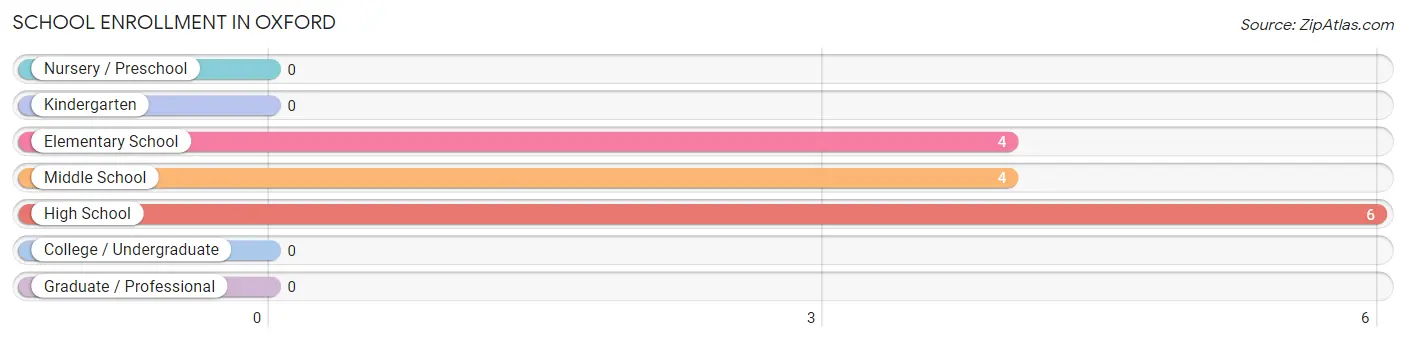
School Enrollment in Oxford
The most common levels of schooling among the 14 students in Oxford are high school (6 | 42.9%), elementary school (4 | 28.6%), and middle school (4 | 28.6%).
| School Level | # Students | % Students |
| Nursery / Preschool | 0 | 0.0% |
| Kindergarten | 0 | 0.0% |
| Elementary School | 4 | 28.6% |
| Middle School | 4 | 28.6% |
| High School | 6 | 42.9% |
| College / Undergraduate | 0 | 0.0% |
| Graduate / Professional | 0 | 0.0% |
| Total | 14 | 100.0% |
School Enrollment by Age by Funding Source in Oxford
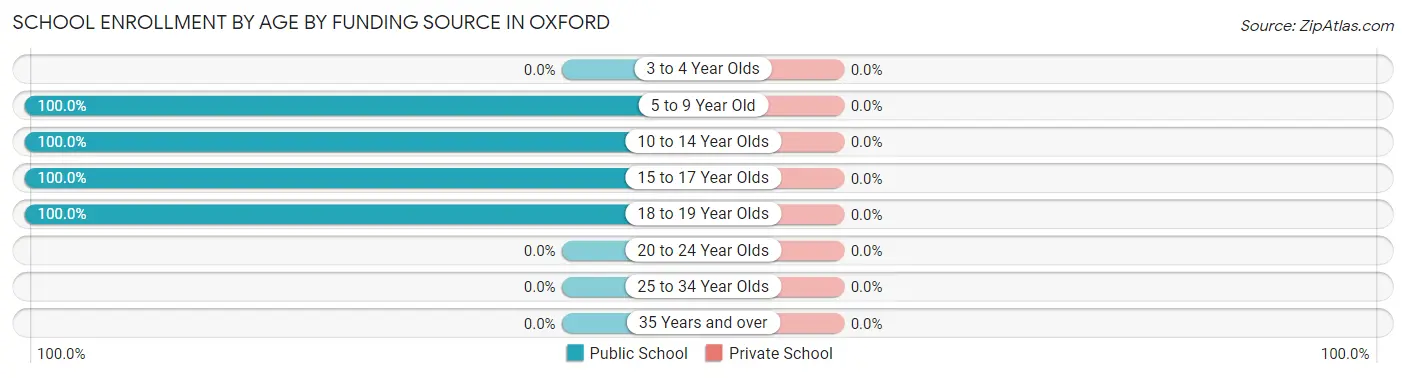
| Age Bracket | Public School | Private School |
| 3 to 4 Year Olds | 0 (0.0%) | 0 (0.0%) |
| 5 to 9 Year Old | 1 (100.0%) | 0 (0.0%) |
| 10 to 14 Year Olds | 7 (100.0%) | 0 (0.0%) |
| 15 to 17 Year Olds | 3 (100.0%) | 0 (0.0%) |
| 18 to 19 Year Olds | 3 (100.0%) | 0 (0.0%) |
| 20 to 24 Year Olds | 0 (0.0%) | 0 (0.0%) |
| 25 to 34 Year Olds | 0 (0.0%) | 0 (0.0%) |
| 35 Years and over | 0 (0.0%) | 0 (0.0%) |
| Total | 14 (100.0%) | 0 (0.0%) |
Educational Attainment by Field of Study in Oxford
Social sciences (3 | 50.0%), engineering (1 | 16.7%), science & technology (1 | 16.7%), and education (1 | 16.7%) are the most common fields of study among 6 individuals in Oxford who have obtained a bachelor's degree or higher.
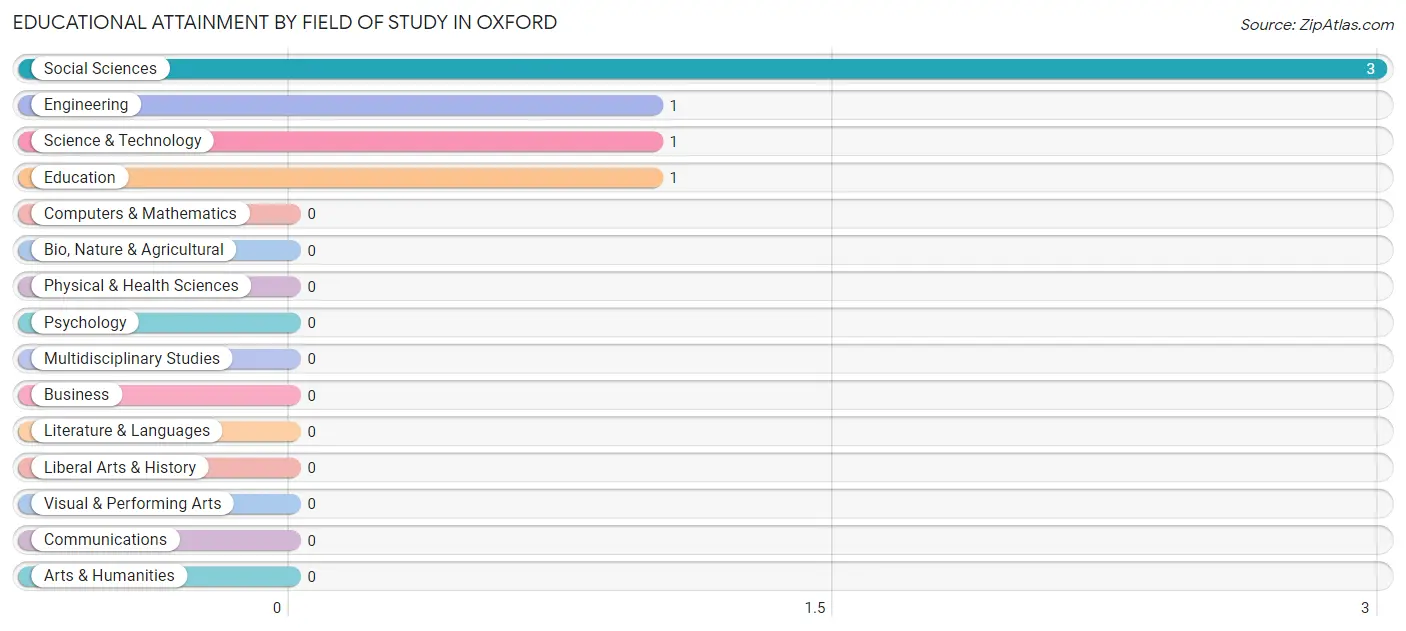
| Field of Study | # Graduates | % Graduates |
| Computers & Mathematics | 0 | 0.0% |
| Bio, Nature & Agricultural | 0 | 0.0% |
| Physical & Health Sciences | 0 | 0.0% |
| Psychology | 0 | 0.0% |
| Social Sciences | 3 | 50.0% |
| Engineering | 1 | 16.7% |
| Multidisciplinary Studies | 0 | 0.0% |
| Science & Technology | 1 | 16.7% |
| Business | 0 | 0.0% |
| Education | 1 | 16.7% |
| Literature & Languages | 0 | 0.0% |
| Liberal Arts & History | 0 | 0.0% |
| Visual & Performing Arts | 0 | 0.0% |
| Communications | 0 | 0.0% |
| Arts & Humanities | 0 | 0.0% |
| Total | 6 | 100.0% |
Transportation & Commute in Oxford
Vehicle Availability by Sex in Oxford
The most prevalent vehicle ownership categories in Oxford are males with 3 vehicles (2, accounting for 33.3%) and females with 3 vehicles (1, making up 33.3%).
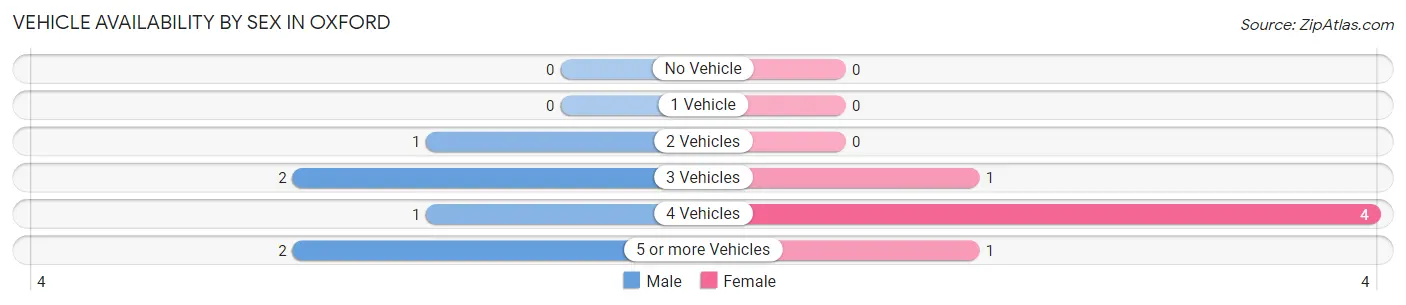
| Vehicles Available | Male | Female |
| No Vehicle | 0 (0.0%) | 0 (0.0%) |
| 1 Vehicle | 0 (0.0%) | 0 (0.0%) |
| 2 Vehicles | 1 (16.7%) | 0 (0.0%) |
| 3 Vehicles | 2 (33.3%) | 1 (16.7%) |
| 4 Vehicles | 1 (16.7%) | 4 (66.7%) |
| 5 or more Vehicles | 2 (33.3%) | 1 (16.7%) |
| Total | 6 (100.0%) | 6 (100.0%) |
Commute Time in Oxford
The most frequently occuring commute durations in Oxford are 20 to 24 minutes (2 commuters, 25.0%), 30 to 34 minutes (2 commuters, 25.0%), and 5 to 9 minutes (1 commuters, 12.5%).
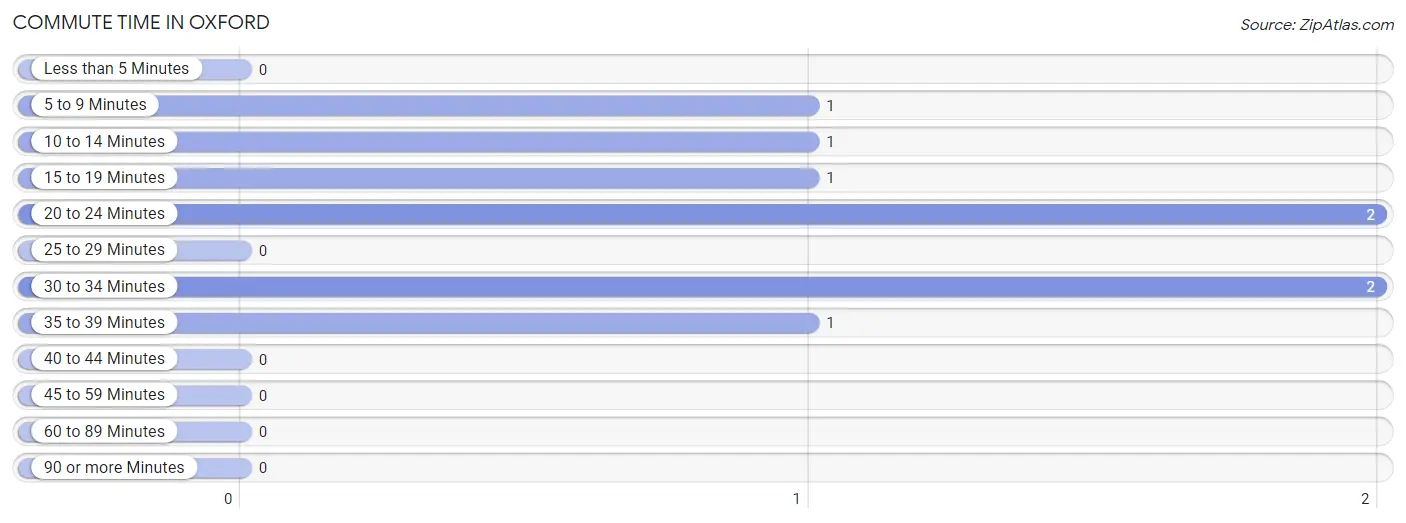
| Commute Time | # Commuters | % Commuters |
| Less than 5 Minutes | 0 | 0.0% |
| 5 to 9 Minutes | 1 | 12.5% |
| 10 to 14 Minutes | 1 | 12.5% |
| 15 to 19 Minutes | 1 | 12.5% |
| 20 to 24 Minutes | 2 | 25.0% |
| 25 to 29 Minutes | 0 | 0.0% |
| 30 to 34 Minutes | 2 | 25.0% |
| 35 to 39 Minutes | 1 | 12.5% |
| 40 to 44 Minutes | 0 | 0.0% |
| 45 to 59 Minutes | 0 | 0.0% |
| 60 to 89 Minutes | 0 | 0.0% |
| 90 or more Minutes | 0 | 0.0% |
Commute Time by Sex in Oxford
The most common commute times in Oxford are 20 to 24 minutes (2 commuters, 33.3%) for males and 5 to 9 minutes (1 commuters, 50.0%) for females.
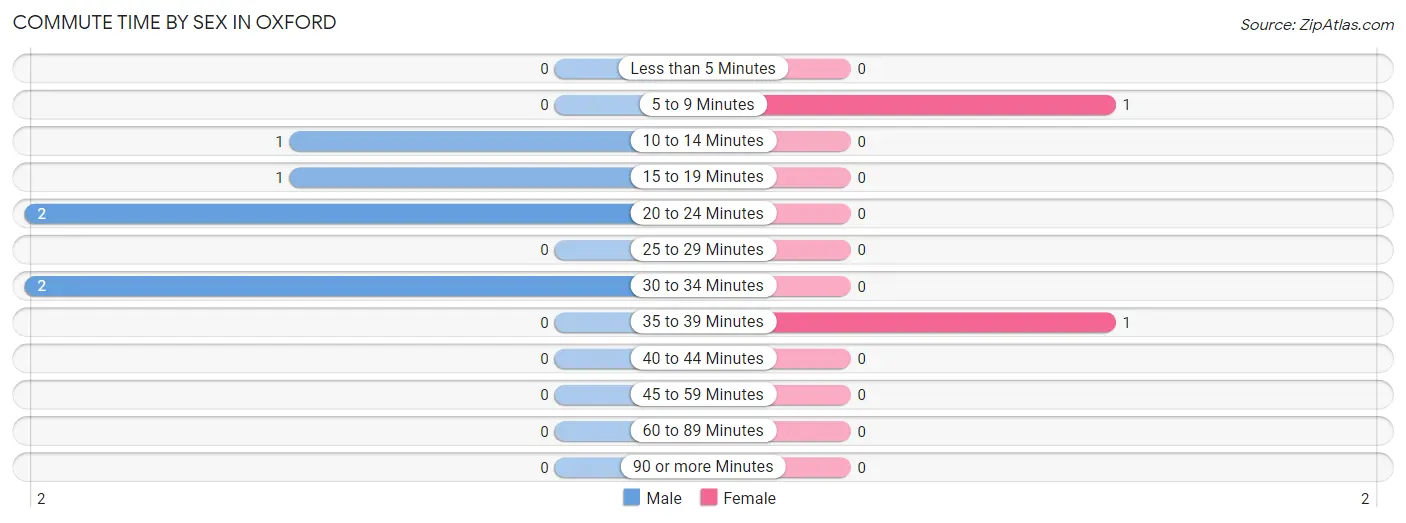
| Commute Time | Male | Female |
| Less than 5 Minutes | 0 (0.0%) | 0 (0.0%) |
| 5 to 9 Minutes | 0 (0.0%) | 1 (50.0%) |
| 10 to 14 Minutes | 1 (16.7%) | 0 (0.0%) |
| 15 to 19 Minutes | 1 (16.7%) | 0 (0.0%) |
| 20 to 24 Minutes | 2 (33.3%) | 0 (0.0%) |
| 25 to 29 Minutes | 0 (0.0%) | 0 (0.0%) |
| 30 to 34 Minutes | 2 (33.3%) | 0 (0.0%) |
| 35 to 39 Minutes | 0 (0.0%) | 1 (50.0%) |
| 40 to 44 Minutes | 0 (0.0%) | 0 (0.0%) |
| 45 to 59 Minutes | 0 (0.0%) | 0 (0.0%) |
| 60 to 89 Minutes | 0 (0.0%) | 0 (0.0%) |
| 90 or more Minutes | 0 (0.0%) | 0 (0.0%) |
Time of Departure to Work by Sex in Oxford
The most frequent times of departure to work in Oxford are 6:30 AM to 6:59 AM (3, 50.0%) for males and 6:00 AM to 6:29 AM (1, 50.0%) for females.
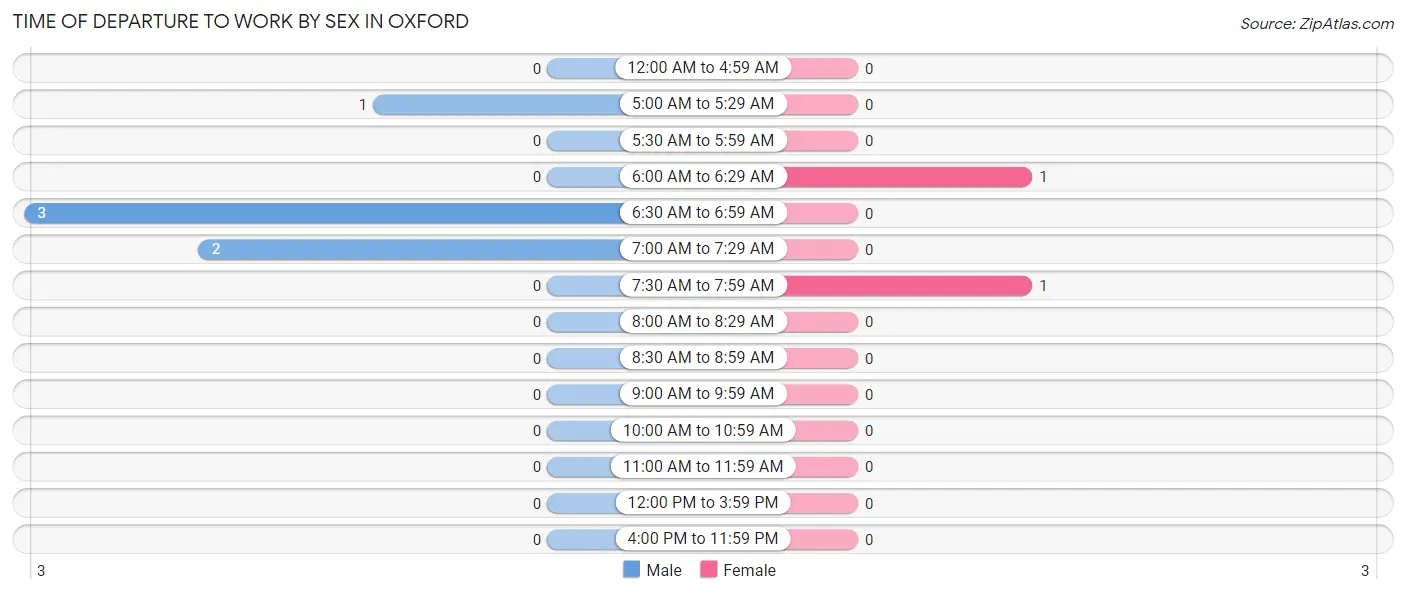
| Time of Departure | Male | Female |
| 12:00 AM to 4:59 AM | 0 (0.0%) | 0 (0.0%) |
| 5:00 AM to 5:29 AM | 1 (16.7%) | 0 (0.0%) |
| 5:30 AM to 5:59 AM | 0 (0.0%) | 0 (0.0%) |
| 6:00 AM to 6:29 AM | 0 (0.0%) | 1 (50.0%) |
| 6:30 AM to 6:59 AM | 3 (50.0%) | 0 (0.0%) |
| 7:00 AM to 7:29 AM | 2 (33.3%) | 0 (0.0%) |
| 7:30 AM to 7:59 AM | 0 (0.0%) | 1 (50.0%) |
| 8:00 AM to 8:29 AM | 0 (0.0%) | 0 (0.0%) |
| 8:30 AM to 8:59 AM | 0 (0.0%) | 0 (0.0%) |
| 9:00 AM to 9:59 AM | 0 (0.0%) | 0 (0.0%) |
| 10:00 AM to 10:59 AM | 0 (0.0%) | 0 (0.0%) |
| 11:00 AM to 11:59 AM | 0 (0.0%) | 0 (0.0%) |
| 12:00 PM to 3:59 PM | 0 (0.0%) | 0 (0.0%) |
| 4:00 PM to 11:59 PM | 0 (0.0%) | 0 (0.0%) |
| Total | 6 (100.0%) | 2 (100.0%) |
Housing Occupancy in Oxford
Occupancy by Ownership in Oxford
Of the total 15 dwellings in Oxford, owner-occupied units account for 14 (93.3%), while renter-occupied units make up 1 (6.7%).
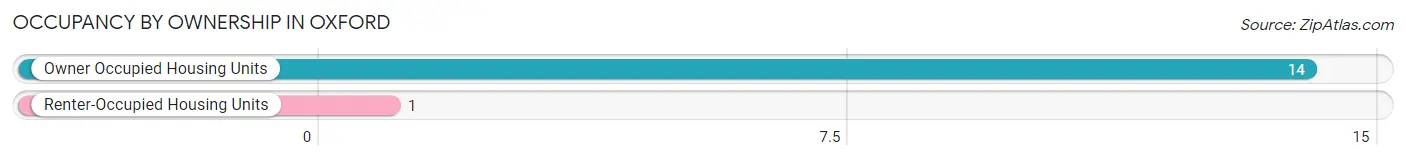
| Occupancy | # Housing Units | % Housing Units |
| Owner Occupied Housing Units | 14 | 93.3% |
| Renter-Occupied Housing Units | 1 | 6.7% |
| Total Occupied Housing Units | 15 | 100.0% |
Occupancy by Household Size in Oxford
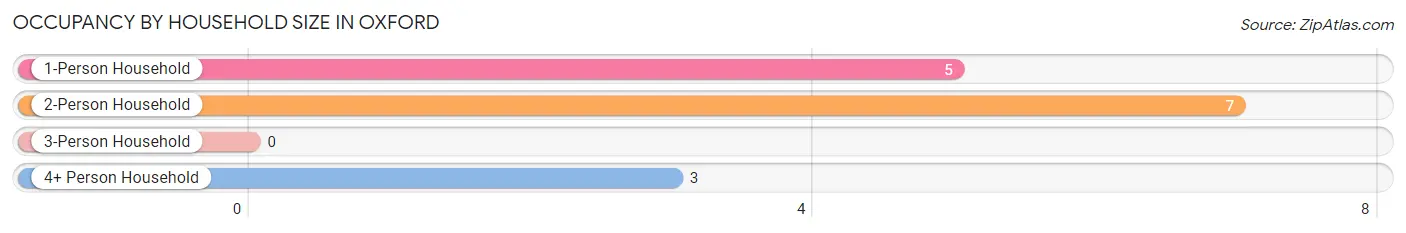
| Household Size | # Housing Units | % Housing Units |
| 1-Person Household | 5 | 33.3% |
| 2-Person Household | 7 | 46.7% |
| 3-Person Household | 0 | 0.0% |
| 4+ Person Household | 3 | 20.0% |
| Total Housing Units | 15 | 100.0% |
Occupancy by Ownership by Household Size in Oxford
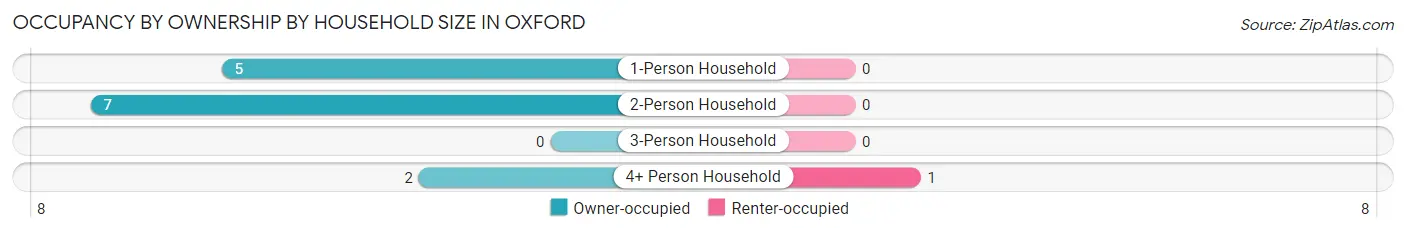
| Household Size | Owner-occupied | Renter-occupied |
| 1-Person Household | 5 (100.0%) | 0 (0.0%) |
| 2-Person Household | 7 (100.0%) | 0 (0.0%) |
| 3-Person Household | 0 (0.0%) | 0 (0.0%) |
| 4+ Person Household | 2 (66.7%) | 1 (33.3%) |
| Total Housing Units | 14 (93.3%) | 1 (6.7%) |
Occupancy by Educational Attainment in Oxford
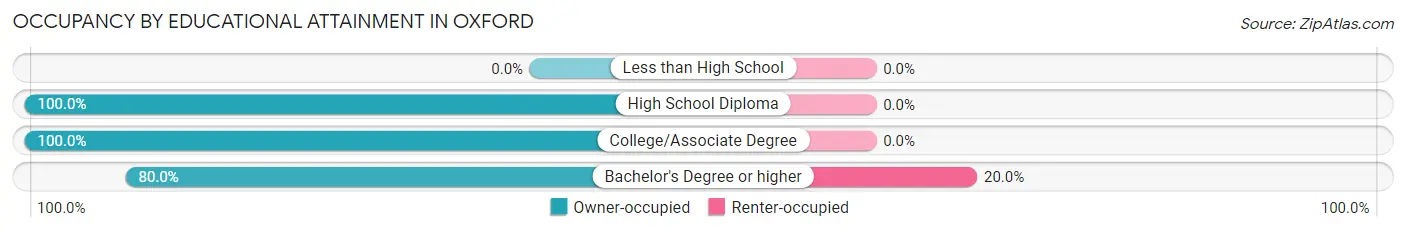
| Household Size | Owner-occupied | Renter-occupied |
| Less than High School | 0 (0.0%) | 0 (0.0%) |
| High School Diploma | 7 (100.0%) | 0 (0.0%) |
| College/Associate Degree | 3 (100.0%) | 0 (0.0%) |
| Bachelor's Degree or higher | 4 (80.0%) | 1 (20.0%) |
Occupancy by Age of Householder in Oxford
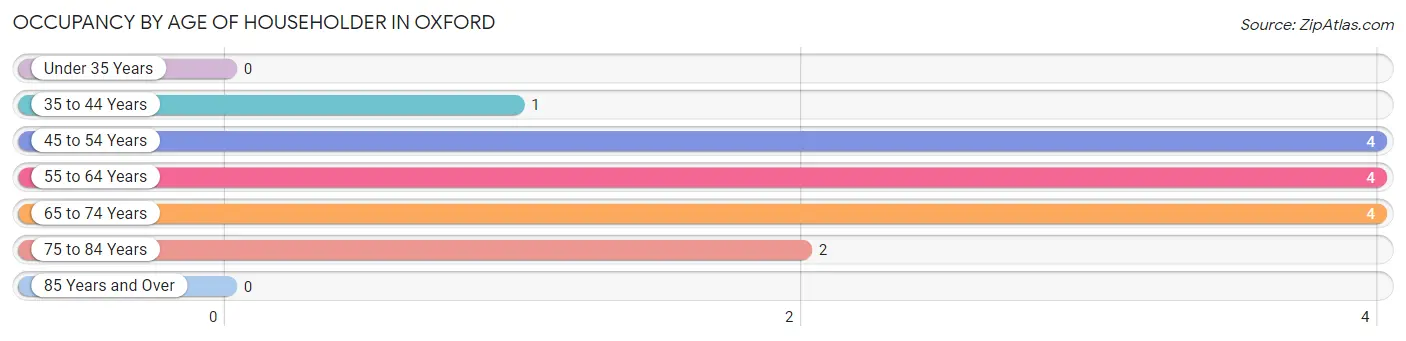
| Age Bracket | # Households | % Households |
| Under 35 Years | 0 | 0.0% |
| 35 to 44 Years | 1 | 6.7% |
| 45 to 54 Years | 4 | 26.7% |
| 55 to 64 Years | 4 | 26.7% |
| 65 to 74 Years | 4 | 26.7% |
| 75 to 84 Years | 2 | 13.3% |
| 85 Years and Over | 0 | 0.0% |
| Total | 15 | 100.0% |
Housing Finances in Oxford
Median Income by Occupancy in Oxford
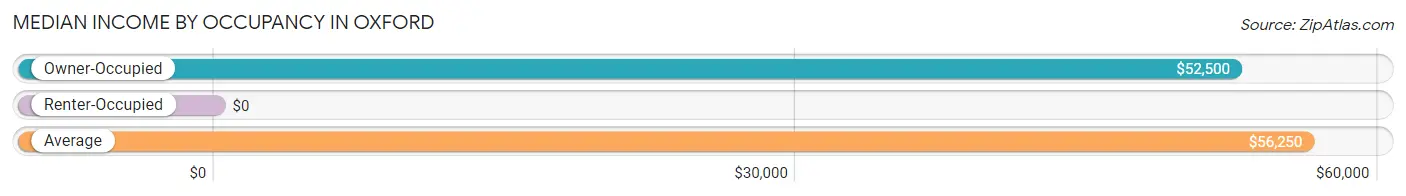
| Occupancy Type | # Households | Median Income |
| Owner-Occupied | 14 (93.3%) | $52,500 |
| Renter-Occupied | 1 (6.7%) | $0 |
| Average | 15 (100.0%) | $56,250 |
Occupancy by Householder Income Bracket in Oxford
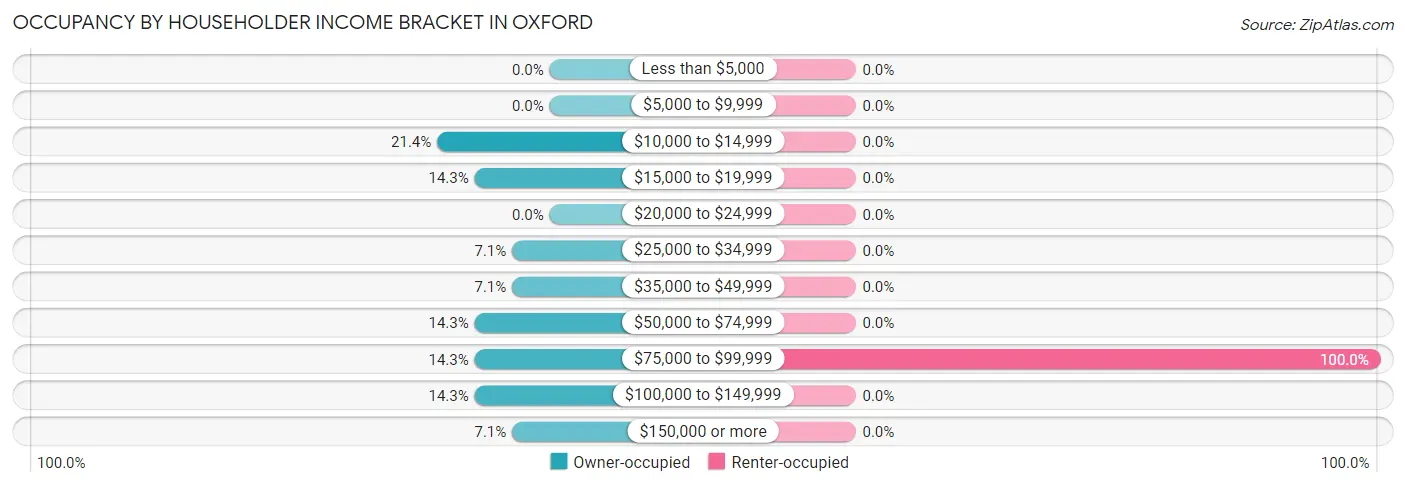
| Income Bracket | Owner-occupied | Renter-occupied |
| Less than $5,000 | 0 (0.0%) | 0 (0.0%) |
| $5,000 to $9,999 | 0 (0.0%) | 0 (0.0%) |
| $10,000 to $14,999 | 3 (21.4%) | 0 (0.0%) |
| $15,000 to $19,999 | 2 (14.3%) | 0 (0.0%) |
| $20,000 to $24,999 | 0 (0.0%) | 0 (0.0%) |
| $25,000 to $34,999 | 1 (7.1%) | 0 (0.0%) |
| $35,000 to $49,999 | 1 (7.1%) | 0 (0.0%) |
| $50,000 to $74,999 | 2 (14.3%) | 0 (0.0%) |
| $75,000 to $99,999 | 2 (14.3%) | 1 (100.0%) |
| $100,000 to $149,999 | 2 (14.3%) | 0 (0.0%) |
| $150,000 or more | 1 (7.1%) | 0 (0.0%) |
| Total | 14 (100.0%) | 1 (100.0%) |
Monthly Housing Cost Tiers in Oxford
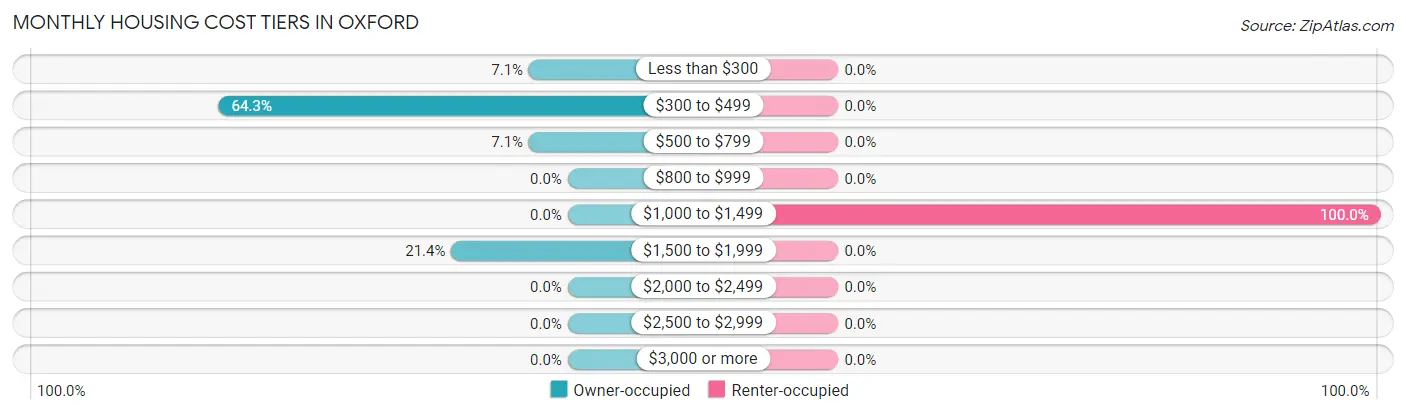
| Monthly Cost | Owner-occupied | Renter-occupied |
| Less than $300 | 1 (7.1%) | 0 (0.0%) |
| $300 to $499 | 9 (64.3%) | 0 (0.0%) |
| $500 to $799 | 1 (7.1%) | 0 (0.0%) |
| $800 to $999 | 0 (0.0%) | 0 (0.0%) |
| $1,000 to $1,499 | 0 (0.0%) | 1 (100.0%) |
| $1,500 to $1,999 | 3 (21.4%) | 0 (0.0%) |
| $2,000 to $2,499 | 0 (0.0%) | 0 (0.0%) |
| $2,500 to $2,999 | 0 (0.0%) | 0 (0.0%) |
| $3,000 or more | 0 (0.0%) | 0 (0.0%) |
| Total | 14 (100.0%) | 1 (100.0%) |
Physical Housing Characteristics in Oxford
Housing Structures in Oxford
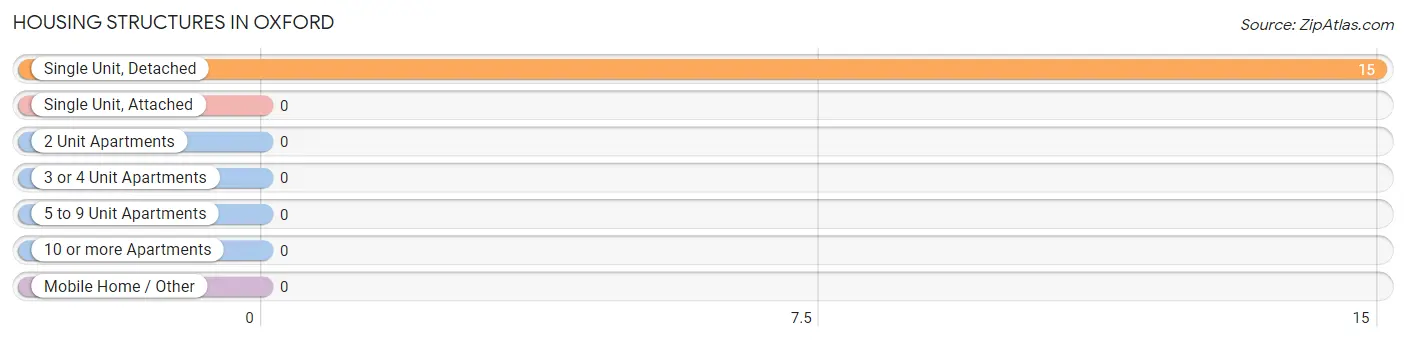
| Structure Type | # Housing Units | % Housing Units |
| Single Unit, Detached | 15 | 100.0% |
| Single Unit, Attached | 0 | 0.0% |
| 2 Unit Apartments | 0 | 0.0% |
| 3 or 4 Unit Apartments | 0 | 0.0% |
| 5 to 9 Unit Apartments | 0 | 0.0% |
| 10 or more Apartments | 0 | 0.0% |
| Mobile Home / Other | 0 | 0.0% |
| Total | 15 | 100.0% |
Housing Structures by Occupancy in Oxford
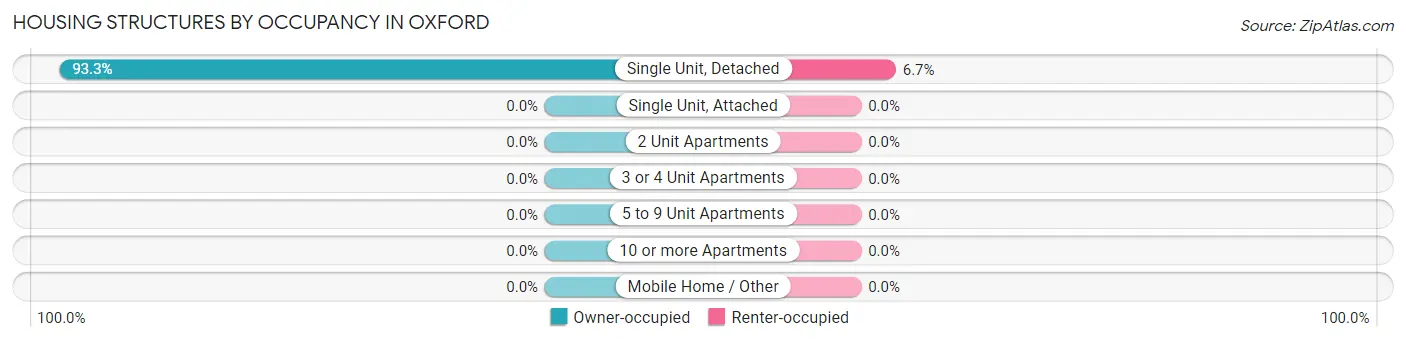
| Structure Type | Owner-occupied | Renter-occupied |
| Single Unit, Detached | 14 (93.3%) | 1 (6.7%) |
| Single Unit, Attached | 0 (0.0%) | 0 (0.0%) |
| 2 Unit Apartments | 0 (0.0%) | 0 (0.0%) |
| 3 or 4 Unit Apartments | 0 (0.0%) | 0 (0.0%) |
| 5 to 9 Unit Apartments | 0 (0.0%) | 0 (0.0%) |
| 10 or more Apartments | 0 (0.0%) | 0 (0.0%) |
| Mobile Home / Other | 0 (0.0%) | 0 (0.0%) |
| Total | 14 (93.3%) | 1 (6.7%) |
Housing Structures by Number of Rooms in Oxford
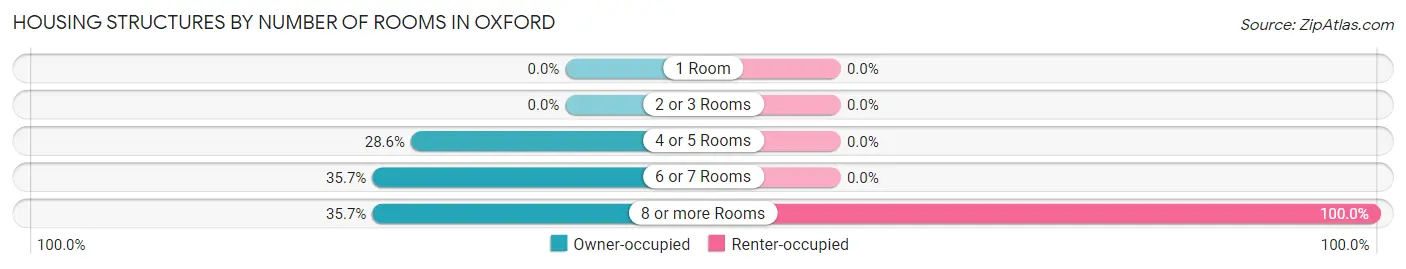
| Number of Rooms | Owner-occupied | Renter-occupied |
| 1 Room | 0 (0.0%) | 0 (0.0%) |
| 2 or 3 Rooms | 0 (0.0%) | 0 (0.0%) |
| 4 or 5 Rooms | 4 (28.6%) | 0 (0.0%) |
| 6 or 7 Rooms | 5 (35.7%) | 0 (0.0%) |
| 8 or more Rooms | 5 (35.7%) | 1 (100.0%) |
| Total | 14 (100.0%) | 1 (100.0%) |
Housing Structure by Heating Type in Oxford
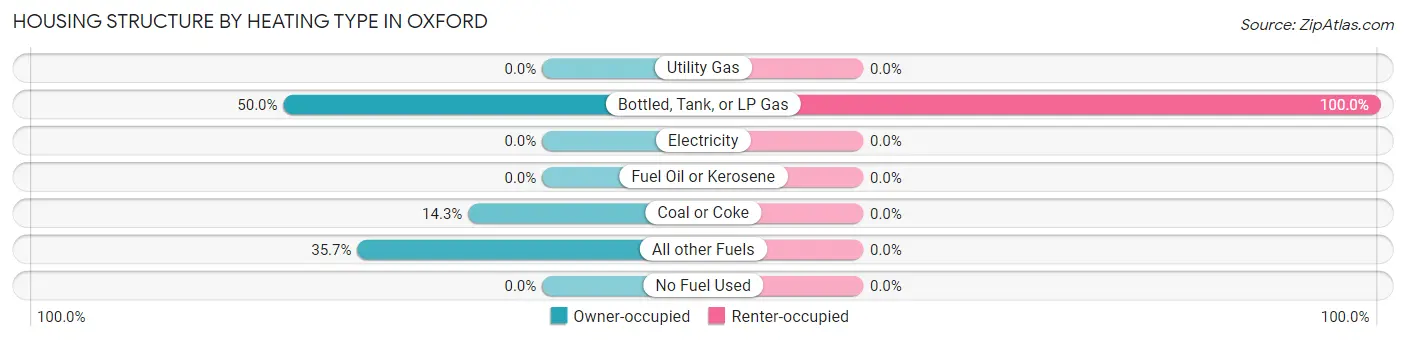
| Heating Type | Owner-occupied | Renter-occupied |
| Utility Gas | 0 (0.0%) | 0 (0.0%) |
| Bottled, Tank, or LP Gas | 7 (50.0%) | 1 (100.0%) |
| Electricity | 0 (0.0%) | 0 (0.0%) |
| Fuel Oil or Kerosene | 0 (0.0%) | 0 (0.0%) |
| Coal or Coke | 2 (14.3%) | 0 (0.0%) |
| All other Fuels | 5 (35.7%) | 0 (0.0%) |
| No Fuel Used | 0 (0.0%) | 0 (0.0%) |
| Total | 14 (100.0%) | 1 (100.0%) |
Household Vehicle Usage in Oxford
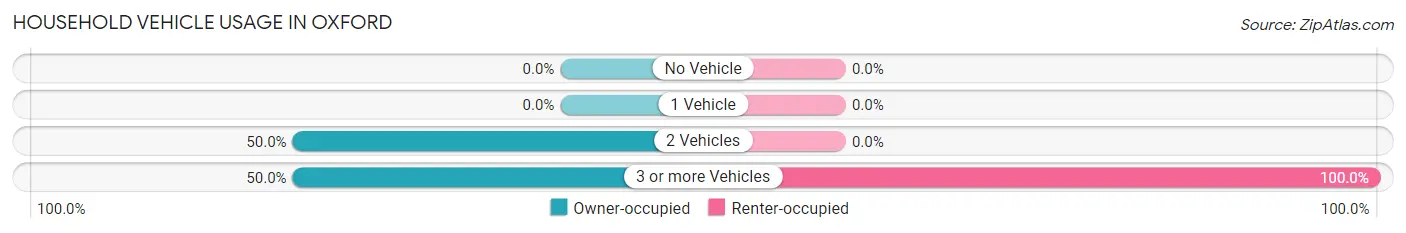
| Vehicles per Household | Owner-occupied | Renter-occupied |
| No Vehicle | 0 (0.0%) | 0 (0.0%) |
| 1 Vehicle | 0 (0.0%) | 0 (0.0%) |
| 2 Vehicles | 7 (50.0%) | 0 (0.0%) |
| 3 or more Vehicles | 7 (50.0%) | 1 (100.0%) |
| Total | 14 (100.0%) | 1 (100.0%) |
Real Estate & Mortgages in Oxford
Real Estate and Mortgage Overview in Oxford
| Characteristic | Without Mortgage | With Mortgage |
| Housing Units | 11 | 3 |
| Median Property Value | $193,800 | $0 |
| Median Household Income | - | - |
| Monthly Housing Costs | $358 | $0 |
| Real Estate Taxes | $900 | $0 |
Property Value by Mortgage Status in Oxford
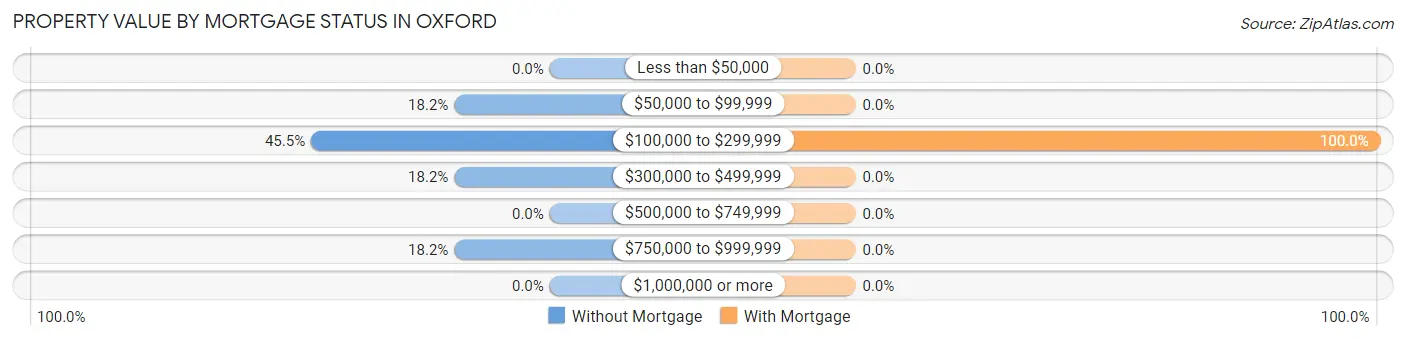
| Property Value | Without Mortgage | With Mortgage |
| Less than $50,000 | 0 (0.0%) | 0 (0.0%) |
| $50,000 to $99,999 | 2 (18.2%) | 0 (0.0%) |
| $100,000 to $299,999 | 5 (45.5%) | 3 (100.0%) |
| $300,000 to $499,999 | 2 (18.2%) | 0 (0.0%) |
| $500,000 to $749,999 | 0 (0.0%) | 0 (0.0%) |
| $750,000 to $999,999 | 2 (18.2%) | 0 (0.0%) |
| $1,000,000 or more | 0 (0.0%) | 0 (0.0%) |
| Total | 11 (100.0%) | 3 (100.0%) |
Household Income by Mortgage Status in Oxford
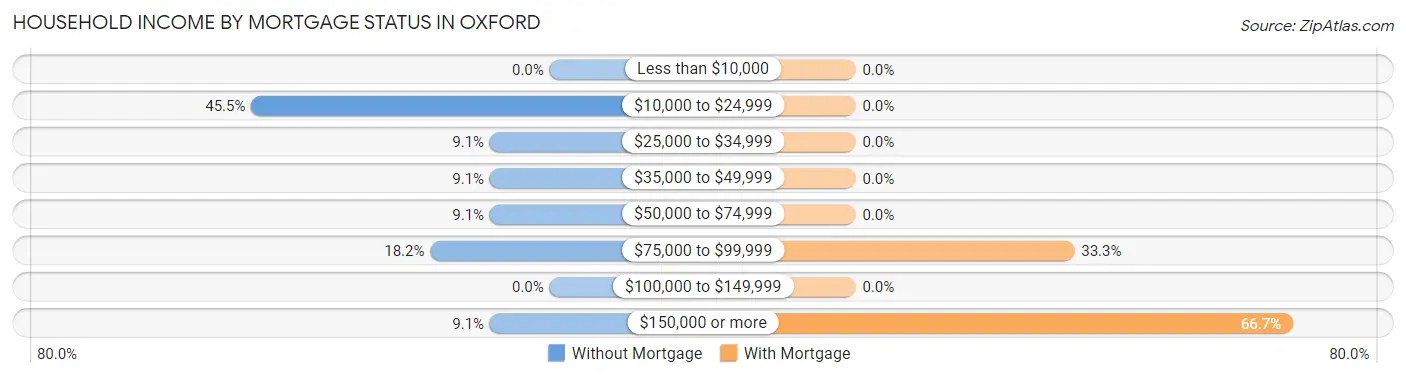
| Household Income | Without Mortgage | With Mortgage |
| Less than $10,000 | 0 (0.0%) | 0 (0.0%) |
| $10,000 to $24,999 | 5 (45.5%) | 0 (0.0%) |
| $25,000 to $34,999 | 1 (9.1%) | 0 (0.0%) |
| $35,000 to $49,999 | 1 (9.1%) | 0 (0.0%) |
| $50,000 to $74,999 | 1 (9.1%) | 0 (0.0%) |
| $75,000 to $99,999 | 2 (18.2%) | 1 (33.3%) |
| $100,000 to $149,999 | 0 (0.0%) | 0 (0.0%) |
| $150,000 or more | 1 (9.1%) | 2 (66.7%) |
| Total | 11 (100.0%) | 3 (100.0%) |
Property Value to Household Income Ratio in Oxford
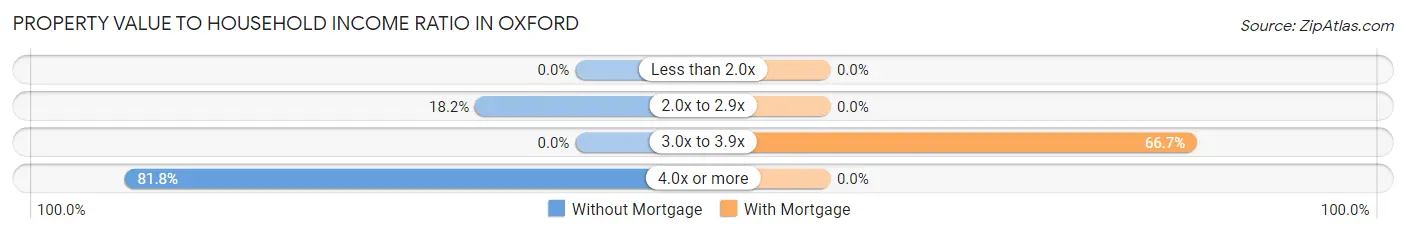
| Value-to-Income Ratio | Without Mortgage | With Mortgage |
| Less than 2.0x | 0 (0.0%) | 0 (0.0%) |
| 2.0x to 2.9x | 2 (18.2%) | 0 (0.0%) |
| 3.0x to 3.9x | 0 (0.0%) | 2 (66.7%) |
| 4.0x or more | 9 (81.8%) | 0 (0.0%) |
| Total | 11 (100.0%) | 3 (100.0%) |
Real Estate Taxes by Mortgage Status in Oxford
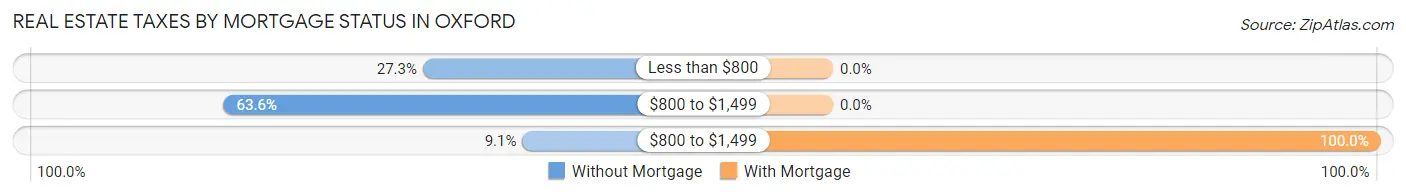
| Property Taxes | Without Mortgage | With Mortgage |
| Less than $800 | 3 (27.3%) | 0 (0.0%) |
| $800 to $1,499 | 7 (63.6%) | 0 (0.0%) |
| $800 to $1,499 | 1 (9.1%) | 3 (100.0%) |
| Total | 11 (100.0%) | 3 (100.0%) |
Health & Disability in Oxford
Health Insurance Coverage by Age in Oxford
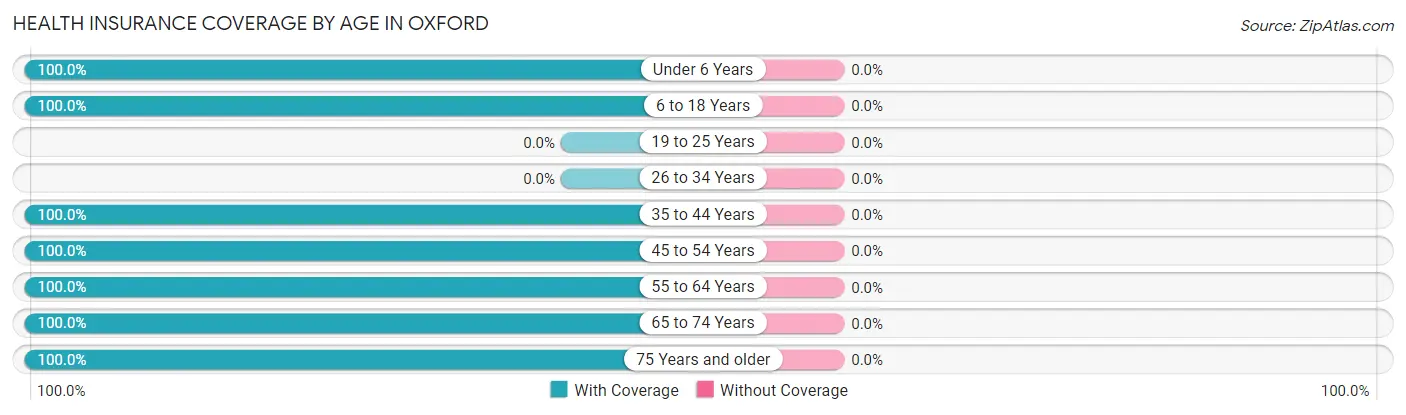
| Age Bracket | With Coverage | Without Coverage |
| Under 6 Years | 1 (100.0%) | 0 (0.0%) |
| 6 to 18 Years | 14 (100.0%) | 0 (0.0%) |
| 19 to 25 Years | 0 (0.0%) | 0 (0.0%) |
| 26 to 34 Years | 0 (0.0%) | 0 (0.0%) |
| 35 to 44 Years | 3 (100.0%) | 0 (0.0%) |
| 45 to 54 Years | 5 (100.0%) | 0 (0.0%) |
| 55 to 64 Years | 4 (100.0%) | 0 (0.0%) |
| 65 to 74 Years | 9 (100.0%) | 0 (0.0%) |
| 75 Years and older | 2 (100.0%) | 0 (0.0%) |
| Total | 38 (100.0%) | 0 (0.0%) |
Health Insurance Coverage by Citizenship Status in Oxford
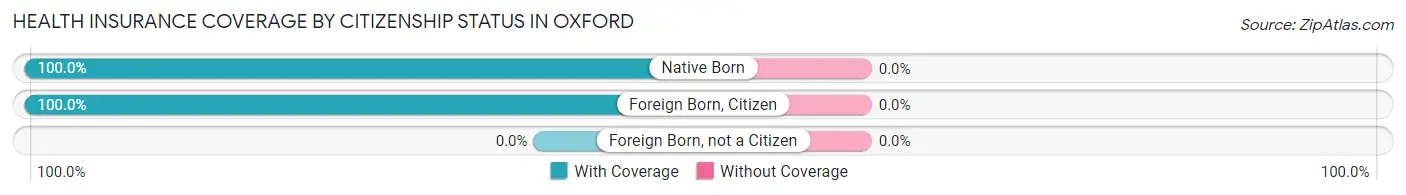
| Citizenship Status | With Coverage | Without Coverage |
| Native Born | 1 (100.0%) | 0 (0.0%) |
| Foreign Born, Citizen | 14 (100.0%) | 0 (0.0%) |
| Foreign Born, not a Citizen | 0 (0.0%) | 0 (0.0%) |
Health Insurance Coverage by Household Income in Oxford
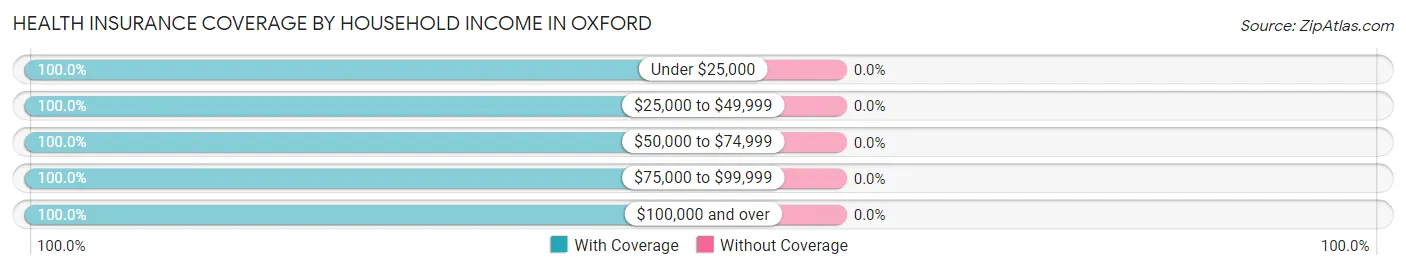
| Household Income | With Coverage | Without Coverage |
| Under $25,000 | 5 (100.0%) | 0 (0.0%) |
| $25,000 to $49,999 | 5 (100.0%) | 0 (0.0%) |
| $50,000 to $74,999 | 11 (100.0%) | 0 (0.0%) |
| $75,000 to $99,999 | 12 (100.0%) | 0 (0.0%) |
| $100,000 and over | 5 (100.0%) | 0 (0.0%) |
Public vs Private Health Insurance Coverage by Age in Oxford
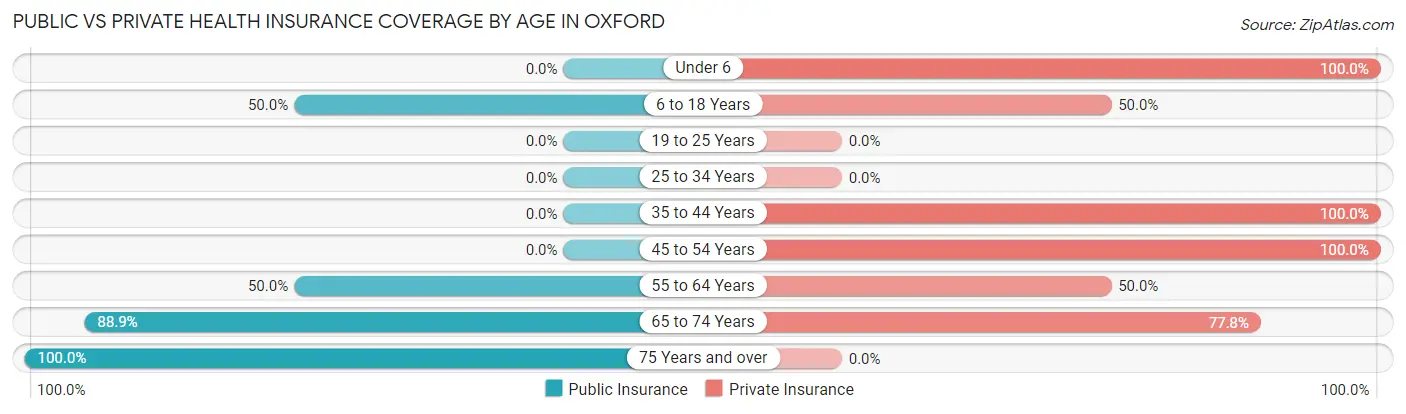
| Age Bracket | Public Insurance | Private Insurance |
| Under 6 | 0 (0.0%) | 1 (100.0%) |
| 6 to 18 Years | 7 (50.0%) | 7 (50.0%) |
| 19 to 25 Years | 0 (0.0%) | 0 (0.0%) |
| 25 to 34 Years | 0 (0.0%) | 0 (0.0%) |
| 35 to 44 Years | 0 (0.0%) | 3 (100.0%) |
| 45 to 54 Years | 0 (0.0%) | 5 (100.0%) |
| 55 to 64 Years | 2 (50.0%) | 2 (50.0%) |
| 65 to 74 Years | 8 (88.9%) | 7 (77.8%) |
| 75 Years and over | 2 (100.0%) | 0 (0.0%) |
| Total | 19 (50.0%) | 25 (65.8%) |
Disability Status by Sex by Age in Oxford
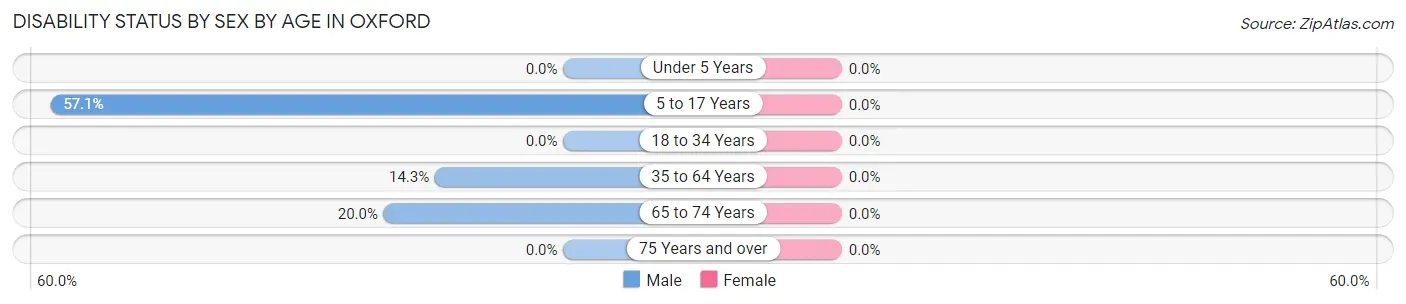
| Age Bracket | Male | Female |
| Under 5 Years | 0 (0.0%) | 0 (0.0%) |
| 5 to 17 Years | 4 (57.1%) | 0 (0.0%) |
| 18 to 34 Years | 0 (0.0%) | 0 (0.0%) |
| 35 to 64 Years | 1 (14.3%) | 0 (0.0%) |
| 65 to 74 Years | 1 (20.0%) | 0 (0.0%) |
| 75 Years and over | 0 (0.0%) | 0 (0.0%) |
Disability Class by Sex by Age in Oxford
Disability Class: Hearing Difficulty
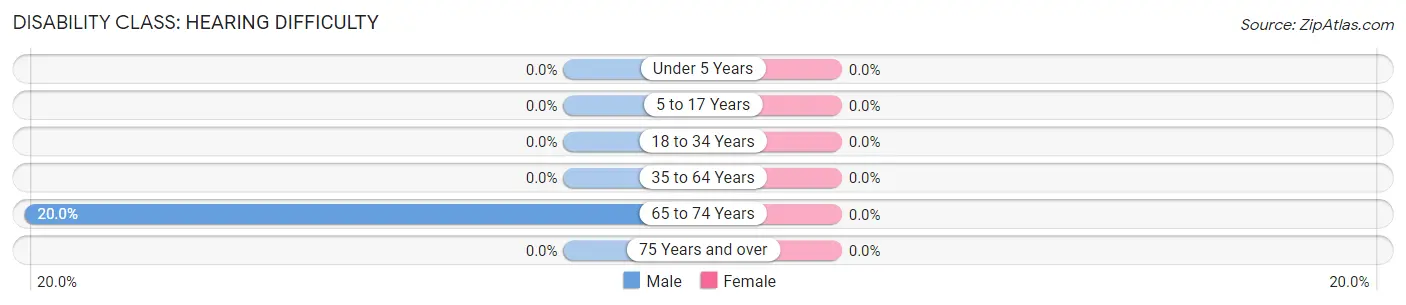
| Age Bracket | Male | Female |
| Under 5 Years | 0 (0.0%) | 0 (0.0%) |
| 5 to 17 Years | 0 (0.0%) | 0 (0.0%) |
| 18 to 34 Years | 0 (0.0%) | 0 (0.0%) |
| 35 to 64 Years | 0 (0.0%) | 0 (0.0%) |
| 65 to 74 Years | 1 (20.0%) | 0 (0.0%) |
| 75 Years and over | 0 (0.0%) | 0 (0.0%) |
Disability Class: Vision Difficulty
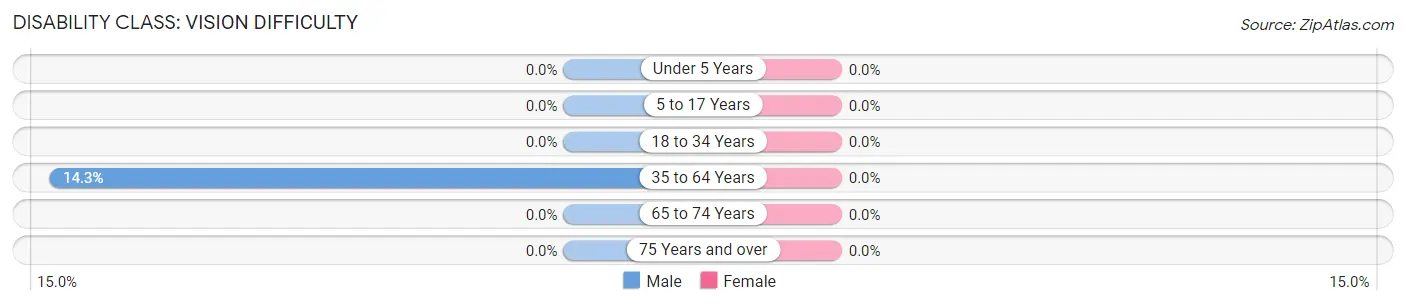
| Age Bracket | Male | Female |
| Under 5 Years | 0 (0.0%) | 0 (0.0%) |
| 5 to 17 Years | 0 (0.0%) | 0 (0.0%) |
| 18 to 34 Years | 0 (0.0%) | 0 (0.0%) |
| 35 to 64 Years | 1 (14.3%) | 0 (0.0%) |
| 65 to 74 Years | 0 (0.0%) | 0 (0.0%) |
| 75 Years and over | 0 (0.0%) | 0 (0.0%) |
Disability Class: Cognitive Difficulty
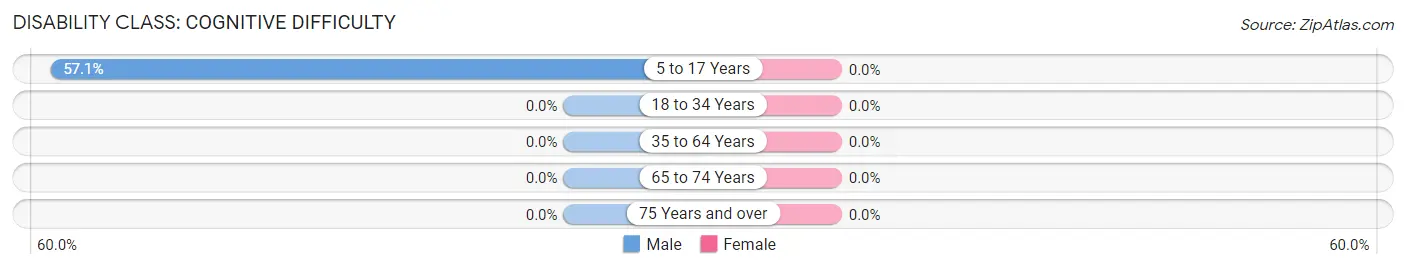
| Age Bracket | Male | Female |
| 5 to 17 Years | 4 (57.1%) | 0 (0.0%) |
| 18 to 34 Years | 0 (0.0%) | 0 (0.0%) |
| 35 to 64 Years | 0 (0.0%) | 0 (0.0%) |
| 65 to 74 Years | 0 (0.0%) | 0 (0.0%) |
| 75 Years and over | 0 (0.0%) | 0 (0.0%) |
Disability Class: Ambulatory Difficulty
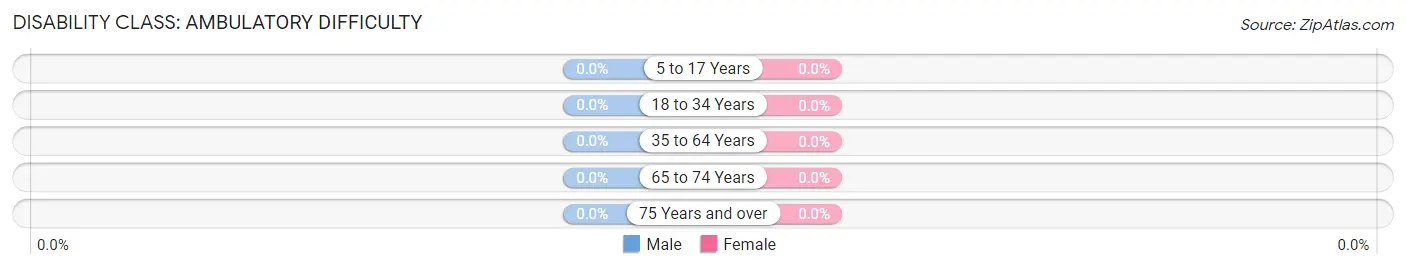
| Age Bracket | Male | Female |
| 5 to 17 Years | 0 (0.0%) | 0 (0.0%) |
| 18 to 34 Years | 0 (0.0%) | 0 (0.0%) |
| 35 to 64 Years | 0 (0.0%) | 0 (0.0%) |
| 65 to 74 Years | 0 (0.0%) | 0 (0.0%) |
| 75 Years and over | 0 (0.0%) | 0 (0.0%) |
Disability Class: Self-Care Difficulty
| Age Bracket | Male | Female |
| 5 to 17 Years | 0 (0.0%) | 0 (0.0%) |
| 18 to 34 Years | 0 (0.0%) | 0 (0.0%) |
| 35 to 64 Years | 0 (0.0%) | 0 (0.0%) |
| 65 to 74 Years | 0 (0.0%) | 0 (0.0%) |
| 75 Years and over | 0 (0.0%) | 0 (0.0%) |
Technology Access in Oxford
Computing Device Access in Oxford
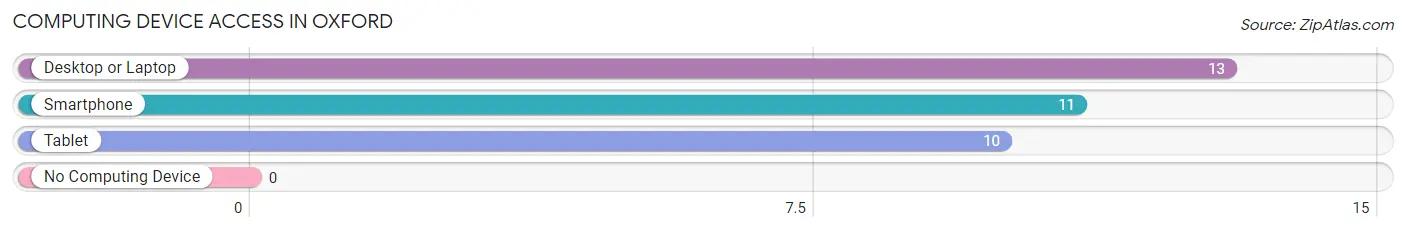
| Device Type | # Households | % Households |
| Desktop or Laptop | 13 | 86.7% |
| Smartphone | 11 | 73.3% |
| Tablet | 10 | 66.7% |
| No Computing Device | 0 | 0.0% |
| Total | 15 | 100.0% |
Internet Access in Oxford
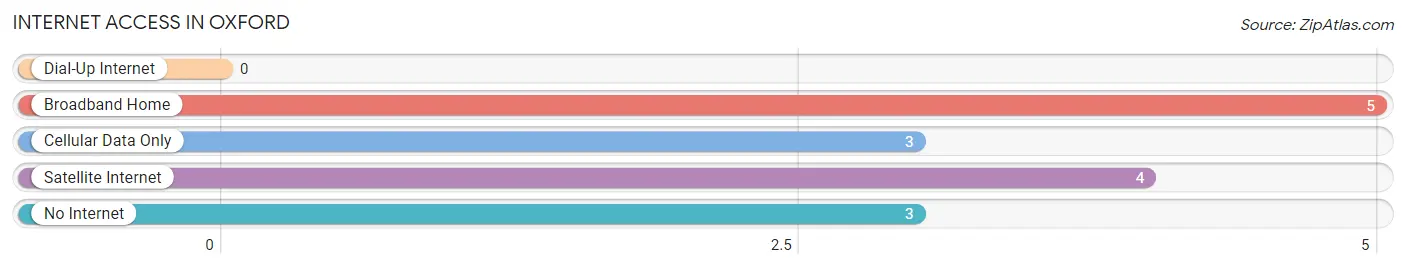
| Internet Type | # Households | % Households |
| Dial-Up Internet | 0 | 0.0% |
| Broadband Home | 5 | 33.3% |
| Cellular Data Only | 3 | 20.0% |
| Satellite Internet | 4 | 26.7% |
| No Internet | 3 | 20.0% |
| Total | 15 | 100.0% |
Oxford Summary
Oxford, Idaho is a small city located in the western part of the state, in the foothills of the Rocky Mountains. It is situated in the Payette River Valley, and is the county seat of Gem County. The city has a population of approximately 1,000 people, and is located about 40 miles northwest of Boise, the state capital.
History
Oxford was founded in 1883 by a group of settlers from Oxford, Maine. The settlers were looking for a place to settle and start a new life, and they chose the Payette River Valley because of its fertile soil and abundant water supply. The town was originally called Oxford Station, and was a stop on the Oregon Short Line Railroad. The town was officially incorporated in 1891, and the name was changed to Oxford.
Geography
Oxford is located in the Payette River Valley, in the foothills of the Rocky Mountains. The city is situated at an elevation of 2,890 feet, and is surrounded by rolling hills and mountains. The city is located about 40 miles northwest of Boise, the state capital. The city is located in a semi-arid climate, with hot summers and cold winters.
Economy
Oxford’s economy is largely based on agriculture and tourism. The city is home to several farms and ranches, which produce a variety of crops, including potatoes, corn, wheat, and hay. The city is also home to several wineries, which produce a variety of wines. Tourism is also an important part of the local economy, as the city is home to several attractions, including the Payette River Scenic Byway, the Oxford Historical Museum, and the Oxford Golf Course.
Demographics
As of the 2010 census, the population of Oxford was 1,000 people. The racial makeup of the city was 95.2% White, 0.7% Native American, 0.3% Asian, 0.2% African American, 0.1% Pacific Islander, and 3.5% from other races. The median household income was $37,500, and the median family income was $45,000. The per capita income was $18,000.
Oxford is a small city with a rich history and a vibrant economy. The city is home to a diverse population, and is a great place to live, work, and play. With its beautiful scenery and friendly people, Oxford is a great place to call home.
Common Questions
What is Per Capita Income in Oxford?
Per Capita income in Oxford is $22,332.
What is the Median Family Income in Oxford?
Median Family Income in Oxford is $81,250.
What is the Median Household income in Oxford?
Median Household Income in Oxford is $56,250.
What is Inequality or Gini Index in Oxford?
Inequality or Gini Index in Oxford is 0.40.
What is the Total Population of Oxford?
Total Population of Oxford is 38.
What is the Total Male Population of Oxford?
Total Male Population of Oxford is 19.
What is the Total Female Population of Oxford?
Total Female Population of Oxford is 19.
What is the Ratio of Males per 100 Females in Oxford?
There are 100.00 Males per 100 Females in Oxford.
What is the Ratio of Females per 100 Males in Oxford?
There are 100.00 Females per 100 Males in Oxford.
What is the Median Population Age in Oxford?
Median Population Age in Oxford is 49.5 Years.
What is the Average Family Size in Oxford
Average Family Size in Oxford is 3.8 People.
What is the Average Household Size in Oxford
Average Household Size in Oxford is 2.5 People.
How Large is the Labor Force in Oxford?
There are 12 People in the Labor Forcein in Oxford.
What is the Percentage of People in the Labor Force in Oxford?
42.9% of People are in the Labor Force in Oxford.