Stites, ID Map & Demographics
Stites Map
Stites Overview
$21,540
PER CAPITA INCOME
$43,750
AVG FAMILY INCOME
$31,250
AVG HOUSEHOLD INCOME
67.6%
WAGE / INCOME GAP [ % ]
32.4¢/ $1
WAGE / INCOME GAP [ $ ]
0.44
INEQUALITY / GINI INDEX
163
TOTAL POPULATION
86
MALE POPULATION
77
FEMALE POPULATION
111.69
MALES / 100 FEMALES
89.53
FEMALES / 100 MALES
53.8
MEDIAN AGE
2.7
AVG FAMILY SIZE
2.1
AVG HOUSEHOLD SIZE
52
LABOR FORCE [ PEOPLE ]
36.1%
PERCENT IN LABOR FORCE
Stites Zip Codes
Stites Area Codes
Income in Stites
Income Overview in Stites
Per Capita Income in Stites is $21,540, while median incomes of families and households are $43,750 and $31,250 respectively.
| Characteristic | Number | Measure |
| Per Capita Income | 163 | $21,540 |
| Median Family Income | 38 | $43,750 |
| Mean Family Income | 38 | $58,218 |
| Median Household Income | 78 | $31,250 |
| Mean Household Income | 78 | $42,274 |
| Income Deficit | 38 | $0 |
| Wage / Income Gap (%) | 163 | 67.62% |
| Wage / Income Gap ($) | 163 | 32.38¢ per $1 |
| Gini / Inequality Index | 163 | 0.44 |
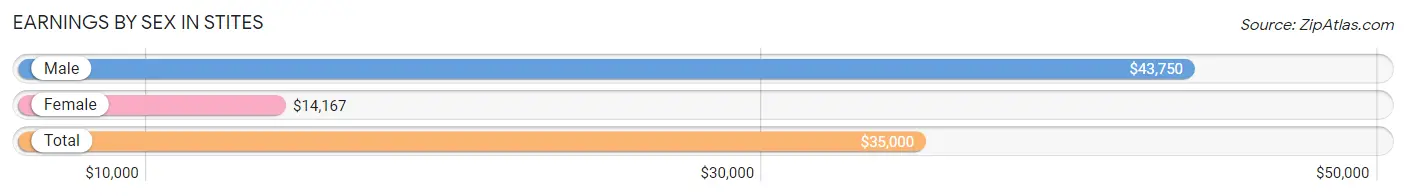
Earnings by Sex in Stites
Average Earnings in Stites are $35,000, $43,750 for men and $14,167 for women, a difference of 67.6%.
| Sex | Number | Average Earnings |
| Male | 36 (64.3%) | $43,750 |
| Female | 20 (35.7%) | $14,167 |
| Total | 56 (100.0%) | $35,000 |
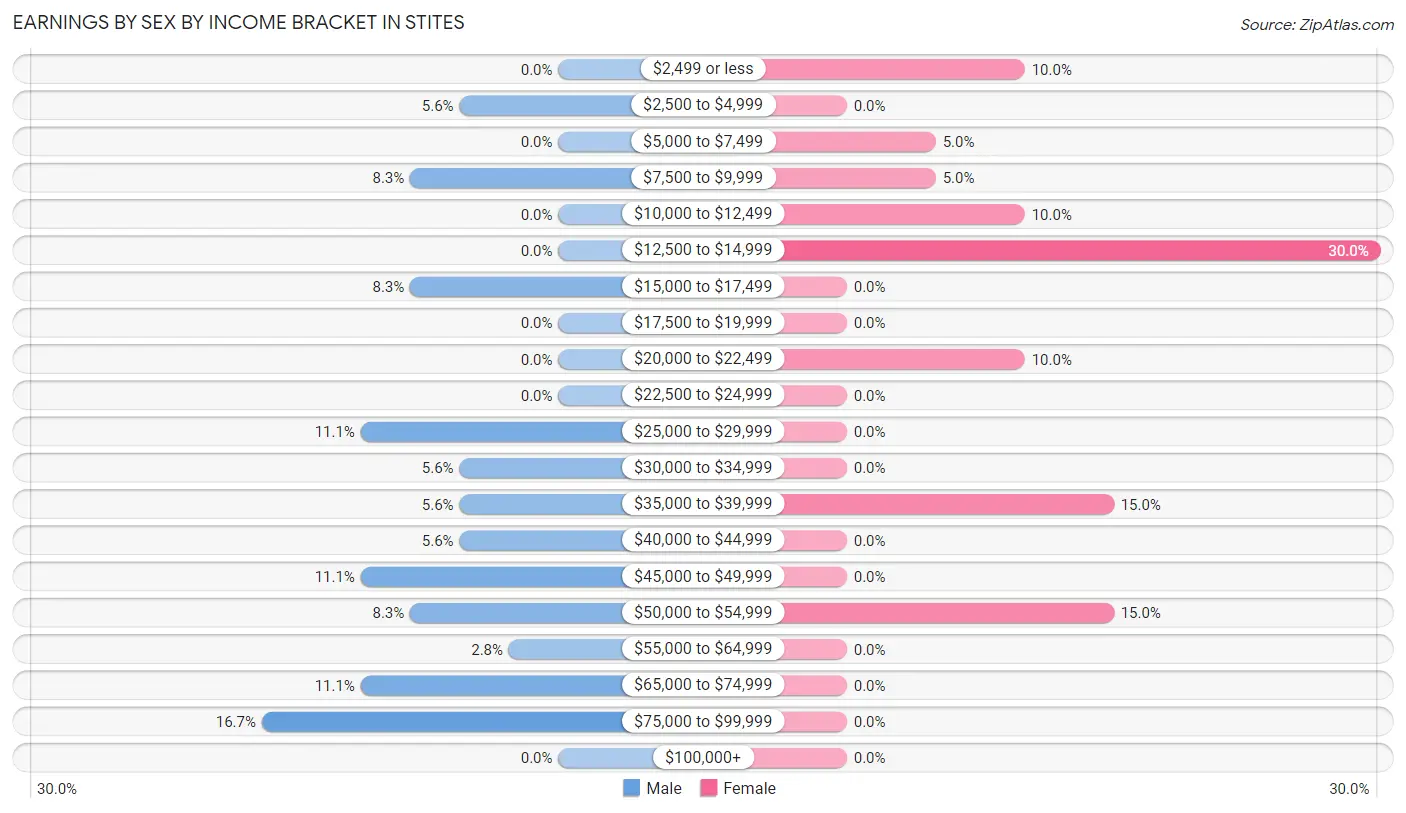
Earnings by Sex by Income Bracket in Stites
The most common earnings brackets in Stites are $75,000 to $99,999 for men (6 | 16.7%) and $12,500 to $14,999 for women (6 | 30.0%).
| Income | Male | Female |
| $2,499 or less | 0 (0.0%) | 2 (10.0%) |
| $2,500 to $4,999 | 2 (5.6%) | 0 (0.0%) |
| $5,000 to $7,499 | 0 (0.0%) | 1 (5.0%) |
| $7,500 to $9,999 | 3 (8.3%) | 1 (5.0%) |
| $10,000 to $12,499 | 0 (0.0%) | 2 (10.0%) |
| $12,500 to $14,999 | 0 (0.0%) | 6 (30.0%) |
| $15,000 to $17,499 | 3 (8.3%) | 0 (0.0%) |
| $17,500 to $19,999 | 0 (0.0%) | 0 (0.0%) |
| $20,000 to $22,499 | 0 (0.0%) | 2 (10.0%) |
| $22,500 to $24,999 | 0 (0.0%) | 0 (0.0%) |
| $25,000 to $29,999 | 4 (11.1%) | 0 (0.0%) |
| $30,000 to $34,999 | 2 (5.6%) | 0 (0.0%) |
| $35,000 to $39,999 | 2 (5.6%) | 3 (15.0%) |
| $40,000 to $44,999 | 2 (5.6%) | 0 (0.0%) |
| $45,000 to $49,999 | 4 (11.1%) | 0 (0.0%) |
| $50,000 to $54,999 | 3 (8.3%) | 3 (15.0%) |
| $55,000 to $64,999 | 1 (2.8%) | 0 (0.0%) |
| $65,000 to $74,999 | 4 (11.1%) | 0 (0.0%) |
| $75,000 to $99,999 | 6 (16.7%) | 0 (0.0%) |
| $100,000+ | 0 (0.0%) | 0 (0.0%) |
| Total | 36 (100.0%) | 20 (100.0%) |
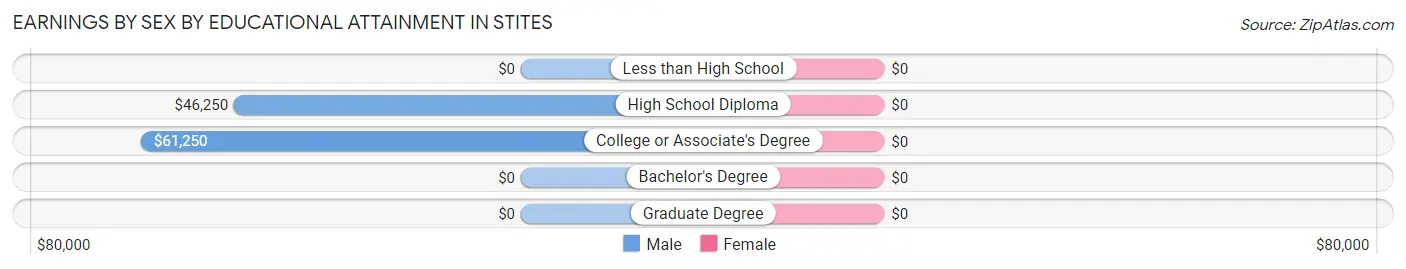
Earnings by Sex by Educational Attainment in Stites
| Educational Attainment | Male Income | Female Income |
| Less than High School | - | - |
| High School Diploma | $46,250 | $0 |
| College or Associate's Degree | $61,250 | $0 |
| Bachelor's Degree | - | - |
| Graduate Degree | - | - |
| Total | $46,875 | $14,583 |
Family Income in Stites
Family Income Brackets in Stites
According to the Stites family income data, there are 7 families falling into the $15,000 to $24,999 income range, which is the most common income bracket and makes up 18.4% of all families.
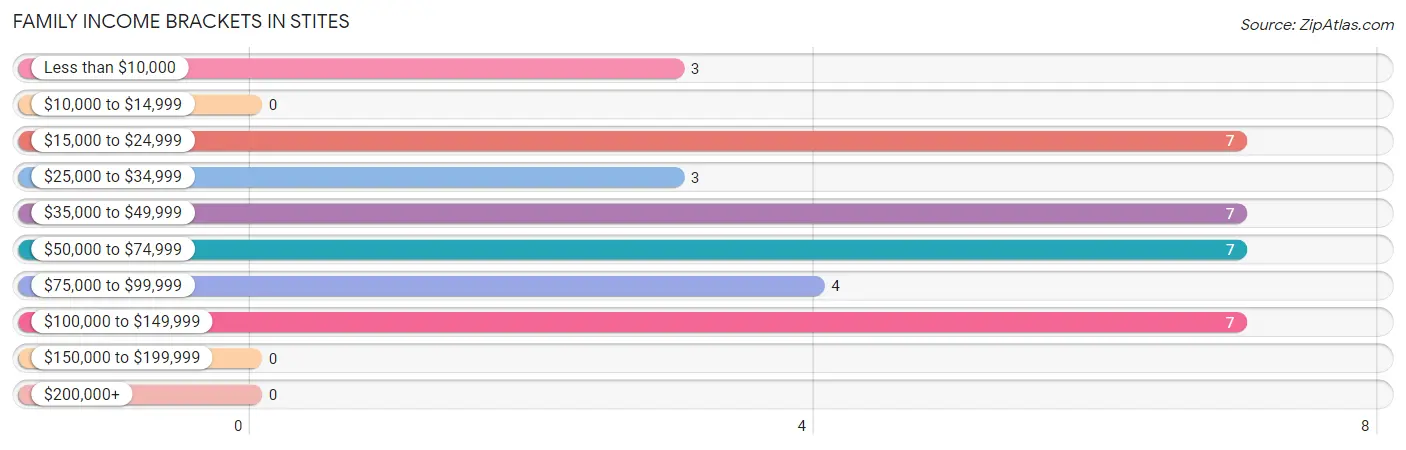
| Income Bracket | # Families | % Families |
| Less than $10,000 | 3 | 7.9% |
| $10,000 to $14,999 | 0 | 0.0% |
| $15,000 to $24,999 | 7 | 18.4% |
| $25,000 to $34,999 | 3 | 7.9% |
| $35,000 to $49,999 | 7 | 18.4% |
| $50,000 to $74,999 | 7 | 18.4% |
| $75,000 to $99,999 | 4 | 10.5% |
| $100,000 to $149,999 | 7 | 18.4% |
| $150,000 to $199,999 | 0 | 0.0% |
| $200,000+ | 0 | 0.0% |
Family Income by Famaliy Size in Stites
2-person families (27 | 71.1%) account for the highest median family income in Stites with $37,813 per family, while 2-person families (27 | 71.1%) have the highest median income of $18,906 per family member.
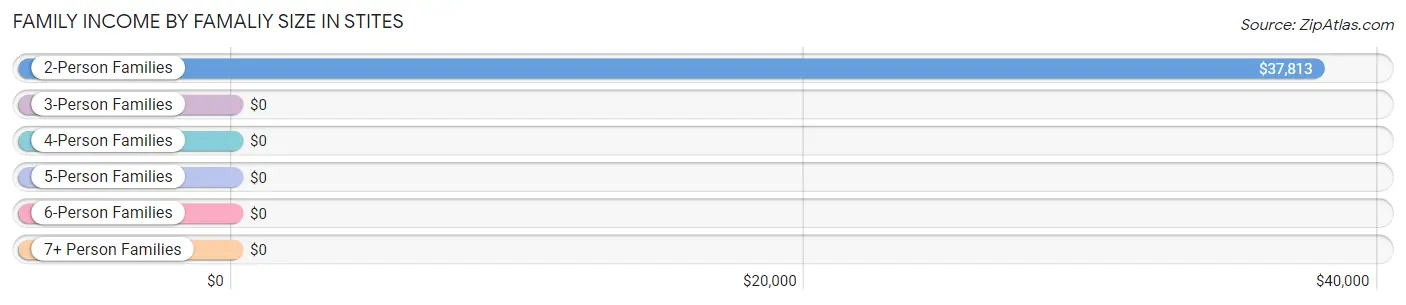
| Income Bracket | # Families | Median Income |
| 2-Person Families | 27 (71.1%) | $37,813 |
| 3-Person Families | 1 (2.6%) | $0 |
| 4-Person Families | 4 (10.5%) | $0 |
| 5-Person Families | 6 (15.8%) | $0 |
| 6-Person Families | 0 (0.0%) | $0 |
| 7+ Person Families | 0 (0.0%) | $0 |
| Total | 38 (100.0%) | $43,750 |
Family Income by Number of Earners in Stites
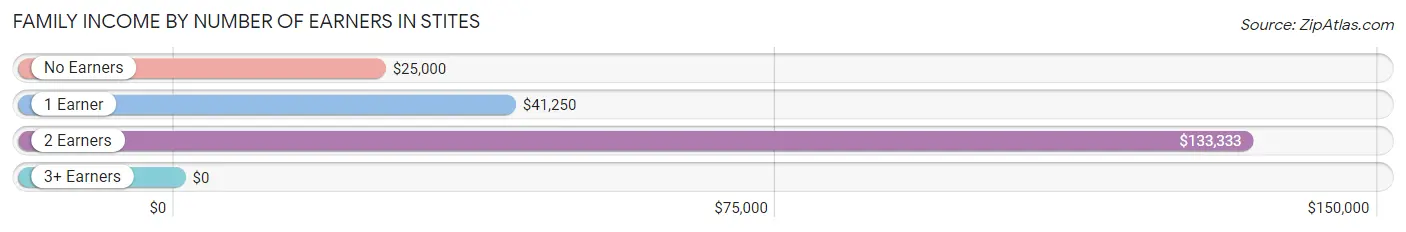
| Number of Earners | # Families | Median Income |
| No Earners | 10 (26.3%) | $25,000 |
| 1 Earner | 20 (52.6%) | $41,250 |
| 2 Earners | 8 (21.0%) | $133,333 |
| 3+ Earners | 0 (0.0%) | $0 |
| Total | 38 (100.0%) | $43,750 |
Household Income in Stites
Household Income Brackets in Stites
With 17 households falling in the category, the $35,000 to $49,999 income range is the most frequent in Stites, accounting for 21.8% of all households.
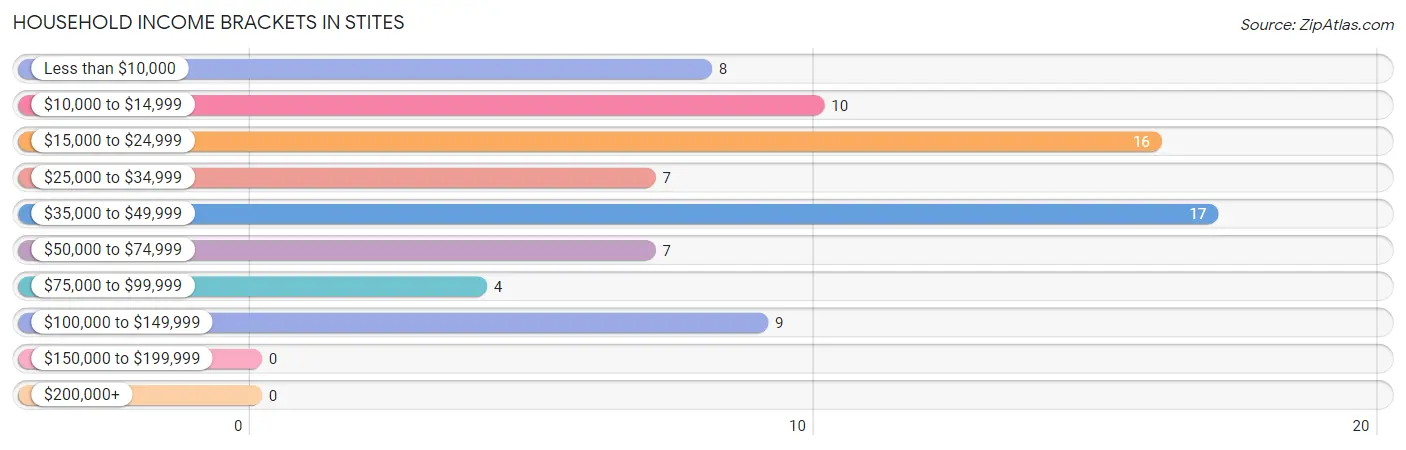
| Income Bracket | # Households | % Households |
| Less than $10,000 | 8 | 10.3% |
| $10,000 to $14,999 | 10 | 12.8% |
| $15,000 to $24,999 | 16 | 20.5% |
| $25,000 to $34,999 | 7 | 9.0% |
| $35,000 to $49,999 | 17 | 21.8% |
| $50,000 to $74,999 | 7 | 9.0% |
| $75,000 to $99,999 | 4 | 5.1% |
| $100,000 to $149,999 | 9 | 11.5% |
| $150,000 to $199,999 | 0 | 0.0% |
| $200,000+ | 0 | 0.0% |
Household Income by Householder Age in Stites
The median household income in Stites is $31,250, with the highest median household income of $33,750 found in the 45 to 64 years age bracket for the primary householder. A total of 30 households (38.5%) fall into this category. Meanwhile, the 15 to 24 years age bracket for the primary householder has the lowest median household income of $0, with 3 households (3.8%) in this group.
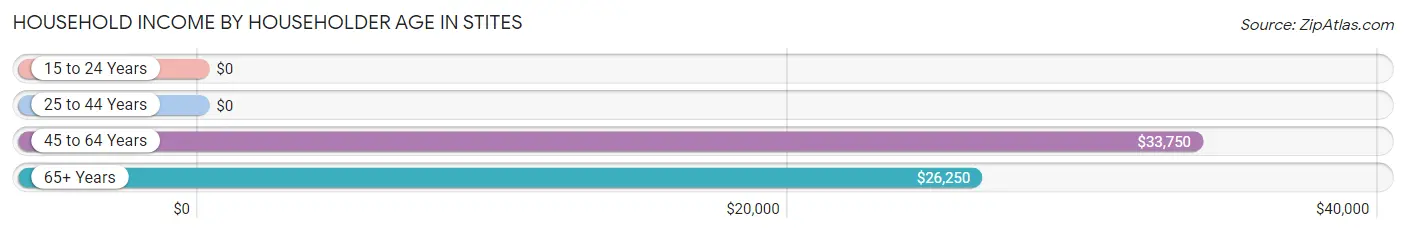
| Income Bracket | # Households | Median Income |
| 15 to 24 Years | 3 (3.8%) | $0 |
| 25 to 44 Years | 17 (21.8%) | $0 |
| 45 to 64 Years | 30 (38.5%) | $33,750 |
| 65+ Years | 28 (35.9%) | $26,250 |
| Total | 78 (100.0%) | $31,250 |
Poverty in Stites
Income Below Poverty by Sex and Age in Stites
With 11.6% poverty level for males and 39.0% for females among the residents of Stites, 35 to 44 year old males and 45 to 54 year old females are the most vulnerable to poverty, with 2 males (40.0%) and 6 females (66.7%) in their respective age groups living below the poverty level.
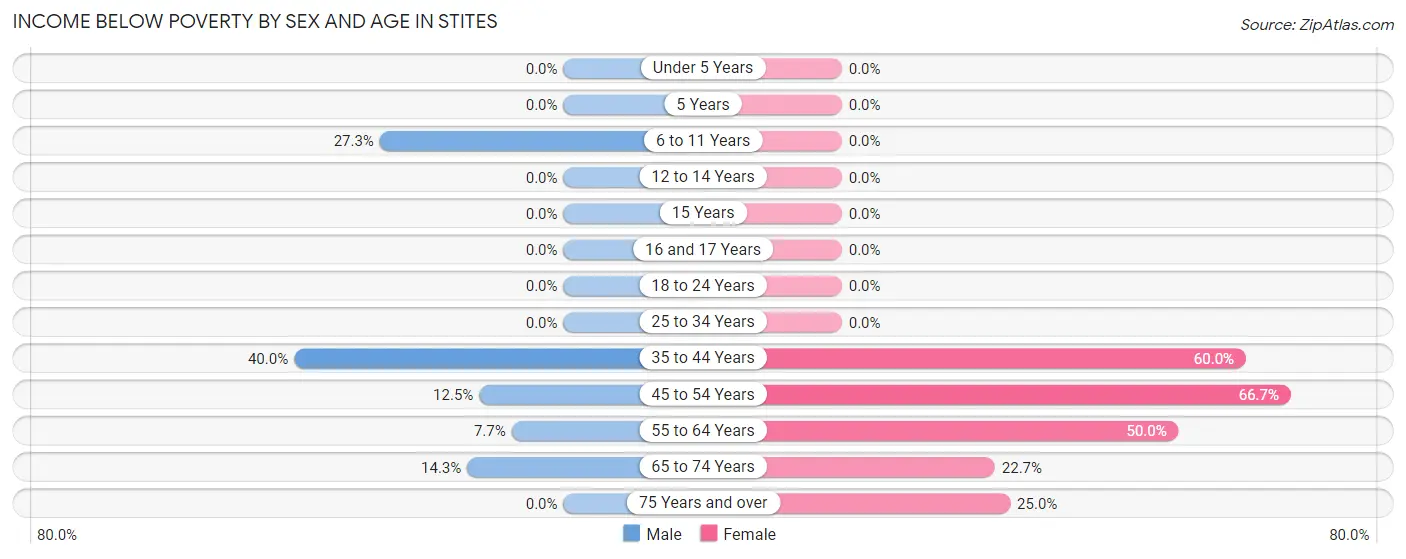
| Age Bracket | Male | Female |
| Under 5 Years | 0 (0.0%) | 0 (0.0%) |
| 5 Years | 0 (0.0%) | 0 (0.0%) |
| 6 to 11 Years | 3 (27.3%) | 0 (0.0%) |
| 12 to 14 Years | 0 (0.0%) | 0 (0.0%) |
| 15 Years | 0 (0.0%) | 0 (0.0%) |
| 16 and 17 Years | 0 (0.0%) | 0 (0.0%) |
| 18 to 24 Years | 0 (0.0%) | 0 (0.0%) |
| 25 to 34 Years | 0 (0.0%) | 0 (0.0%) |
| 35 to 44 Years | 2 (40.0%) | 9 (60.0%) |
| 45 to 54 Years | 2 (12.5%) | 6 (66.7%) |
| 55 to 64 Years | 1 (7.7%) | 9 (50.0%) |
| 65 to 74 Years | 2 (14.3%) | 5 (22.7%) |
| 75 Years and over | 0 (0.0%) | 1 (25.0%) |
| Total | 10 (11.6%) | 30 (39.0%) |
Income Above Poverty by Sex and Age in Stites
According to the poverty statistics in Stites, males aged under 5 years and females aged 6 to 11 years are the age groups that are most secure financially, with 100.0% of males and 100.0% of females in these age groups living above the poverty line.
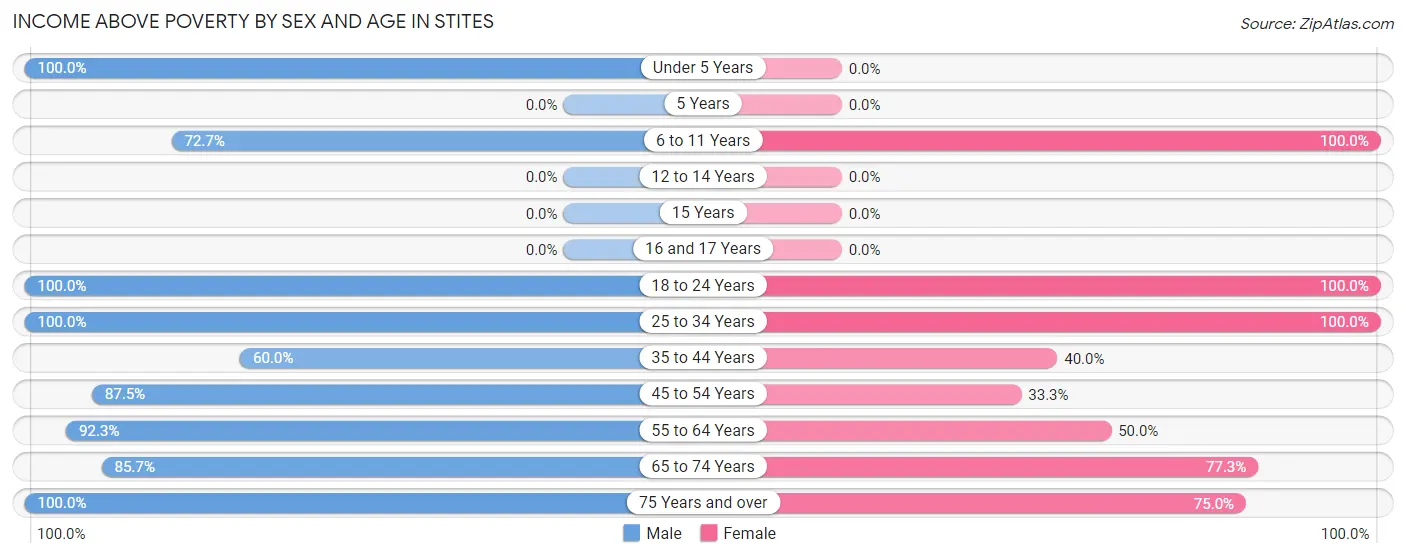
| Age Bracket | Male | Female |
| Under 5 Years | 4 (100.0%) | 0 (0.0%) |
| 5 Years | 0 (0.0%) | 0 (0.0%) |
| 6 to 11 Years | 8 (72.7%) | 4 (100.0%) |
| 12 to 14 Years | 0 (0.0%) | 0 (0.0%) |
| 15 Years | 0 (0.0%) | 0 (0.0%) |
| 16 and 17 Years | 0 (0.0%) | 0 (0.0%) |
| 18 to 24 Years | 6 (100.0%) | 2 (100.0%) |
| 25 to 34 Years | 9 (100.0%) | 3 (100.0%) |
| 35 to 44 Years | 3 (60.0%) | 6 (40.0%) |
| 45 to 54 Years | 14 (87.5%) | 3 (33.3%) |
| 55 to 64 Years | 12 (92.3%) | 9 (50.0%) |
| 65 to 74 Years | 12 (85.7%) | 17 (77.3%) |
| 75 Years and over | 8 (100.0%) | 3 (75.0%) |
| Total | 76 (88.4%) | 47 (61.0%) |
Income Below Poverty Among Married-Couple Families in Stites
The poverty statistics for married-couple families in Stites show that 10.3% or 3 of the total 29 families live below the poverty line. Families with no children have the highest poverty rate of 15.8%, comprising of 3 families. On the other hand, families with 1 or 2 children have the lowest poverty rate of 0.0%, which includes 0 families.
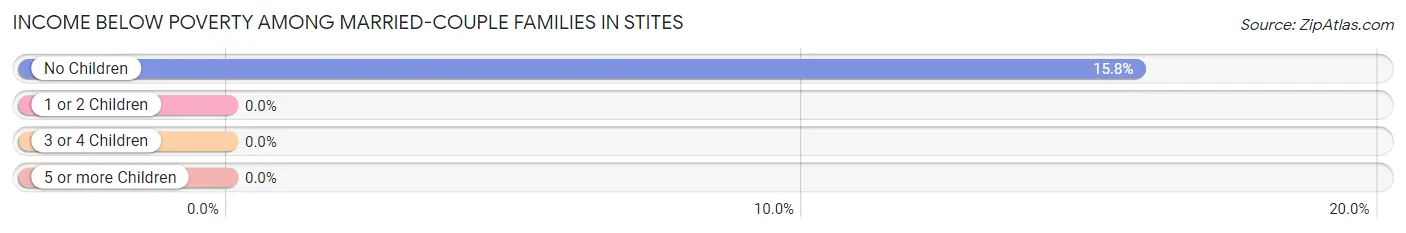
| Children | Above Poverty | Below Poverty |
| No Children | 16 (84.2%) | 3 (15.8%) |
| 1 or 2 Children | 4 (100.0%) | 0 (0.0%) |
| 3 or 4 Children | 6 (100.0%) | 0 (0.0%) |
| 5 or more Children | 0 (0.0%) | 0 (0.0%) |
| Total | 26 (89.7%) | 3 (10.3%) |
Income Below Poverty Among Single-Parent Households in Stites
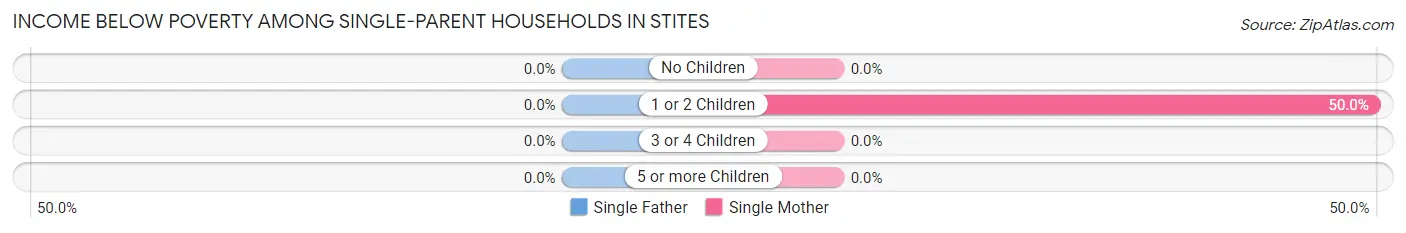
| Children | Single Father | Single Mother |
| No Children | 0 (0.0%) | 0 (0.0%) |
| 1 or 2 Children | 0 (0.0%) | 2 (50.0%) |
| 3 or 4 Children | 0 (0.0%) | 0 (0.0%) |
| 5 or more Children | 0 (0.0%) | 0 (0.0%) |
| Total | 0 (0.0%) | 2 (28.6%) |
Income Below Poverty Among Married-Couple vs Single-Parent Households in Stites
The poverty data for Stites shows that 3 of the married-couple family households (10.3%) and 2 of the single-parent households (22.2%) are living below the poverty level. Within the married-couple family households, those with no children have the highest poverty rate, with 3 households (15.8%) falling below the poverty line. Among the single-parent households, those with 1 or 2 children have the highest poverty rate, with 2 household (50.0%) living below poverty.
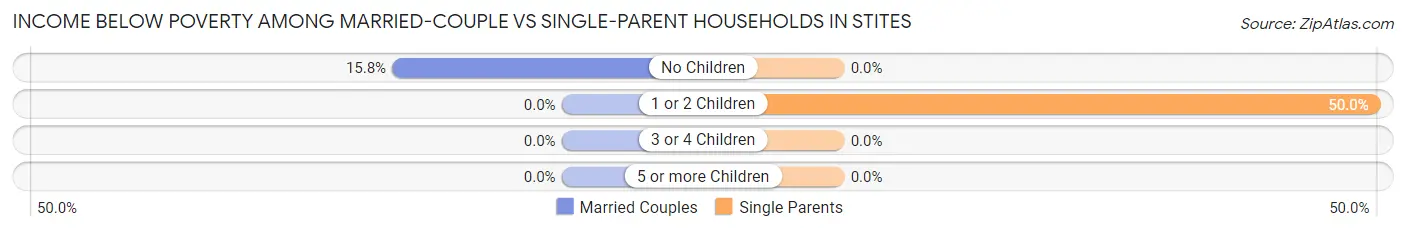
| Children | Married-Couple Families | Single-Parent Households |
| No Children | 3 (15.8%) | 0 (0.0%) |
| 1 or 2 Children | 0 (0.0%) | 2 (50.0%) |
| 3 or 4 Children | 0 (0.0%) | 0 (0.0%) |
| 5 or more Children | 0 (0.0%) | 0 (0.0%) |
| Total | 3 (10.3%) | 2 (22.2%) |
Race in Stites
The most populous races in Stites are White / Caucasian (158 | 96.9%), Two or more Races (3 | 1.8%), and Native / Alaskan (2 | 1.2%).
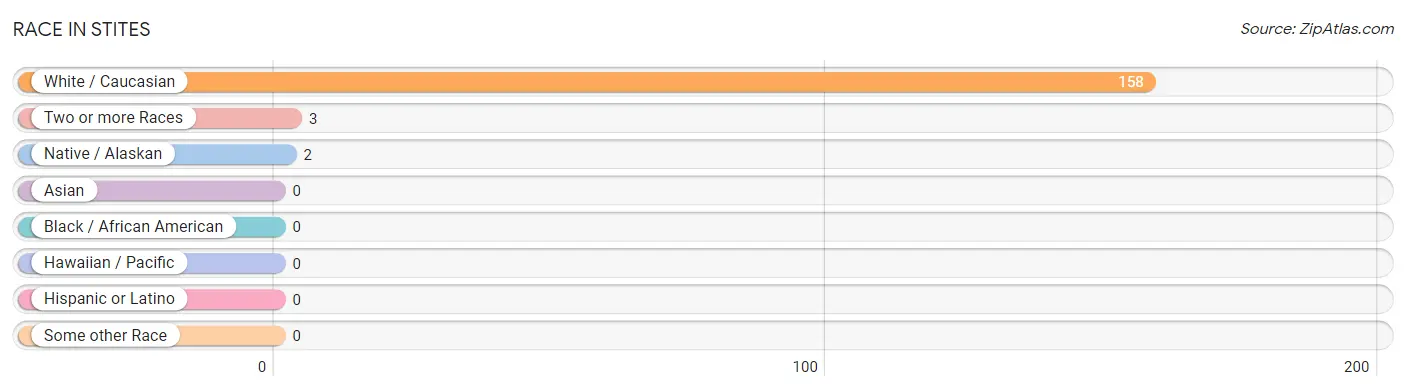
| Race | # Population | % Population |
| Asian | 0 | 0.0% |
| Black / African American | 0 | 0.0% |
| Hawaiian / Pacific | 0 | 0.0% |
| Hispanic or Latino | 0 | 0.0% |
| Native / Alaskan | 2 | 1.2% |
| White / Caucasian | 158 | 96.9% |
| Two or more Races | 3 | 1.8% |
| Some other Race | 0 | 0.0% |
| Total | 163 | 100.0% |
Ancestry in Stites
The most populous ancestries reported in Stites are German (39 | 23.9%), English (19 | 11.7%), Irish (19 | 11.7%), Italian (14 | 8.6%), and Scotch-Irish (8 | 4.9%), together accounting for 60.8% of all Stites residents.
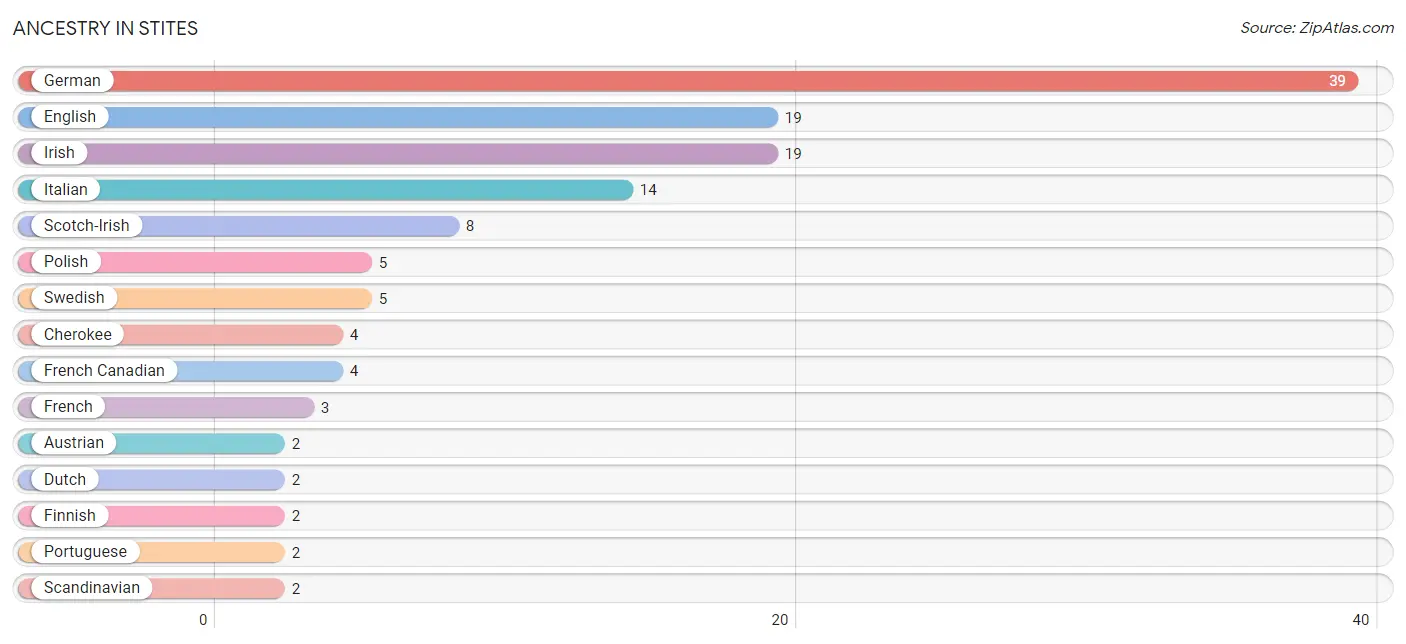
| Ancestry | # Population | % Population |
| Austrian | 2 | 1.2% |
| Cherokee | 4 | 2.5% |
| Dutch | 2 | 1.2% |
| English | 19 | 11.7% |
| Finnish | 2 | 1.2% |
| French | 3 | 1.8% |
| French Canadian | 4 | 2.5% |
| German | 39 | 23.9% |
| Irish | 19 | 11.7% |
| Italian | 14 | 8.6% |
| Norwegian | 1 | 0.6% |
| Polish | 5 | 3.1% |
| Portuguese | 2 | 1.2% |
| Scandinavian | 2 | 1.2% |
| Scotch-Irish | 8 | 4.9% |
| Scottish | 1 | 0.6% |
| Swedish | 5 | 3.1% | View All 17 Rows |
Immigrants in Stites

| Immigration Origin | # Population | % Population | View All 0 Rows |
Sex and Age in Stites
Sex and Age in Stites
The most populous age groups in Stites are 50 to 54 Years (15 | 17.4%) for men and 60 to 64 Years (15 | 19.5%) for women.
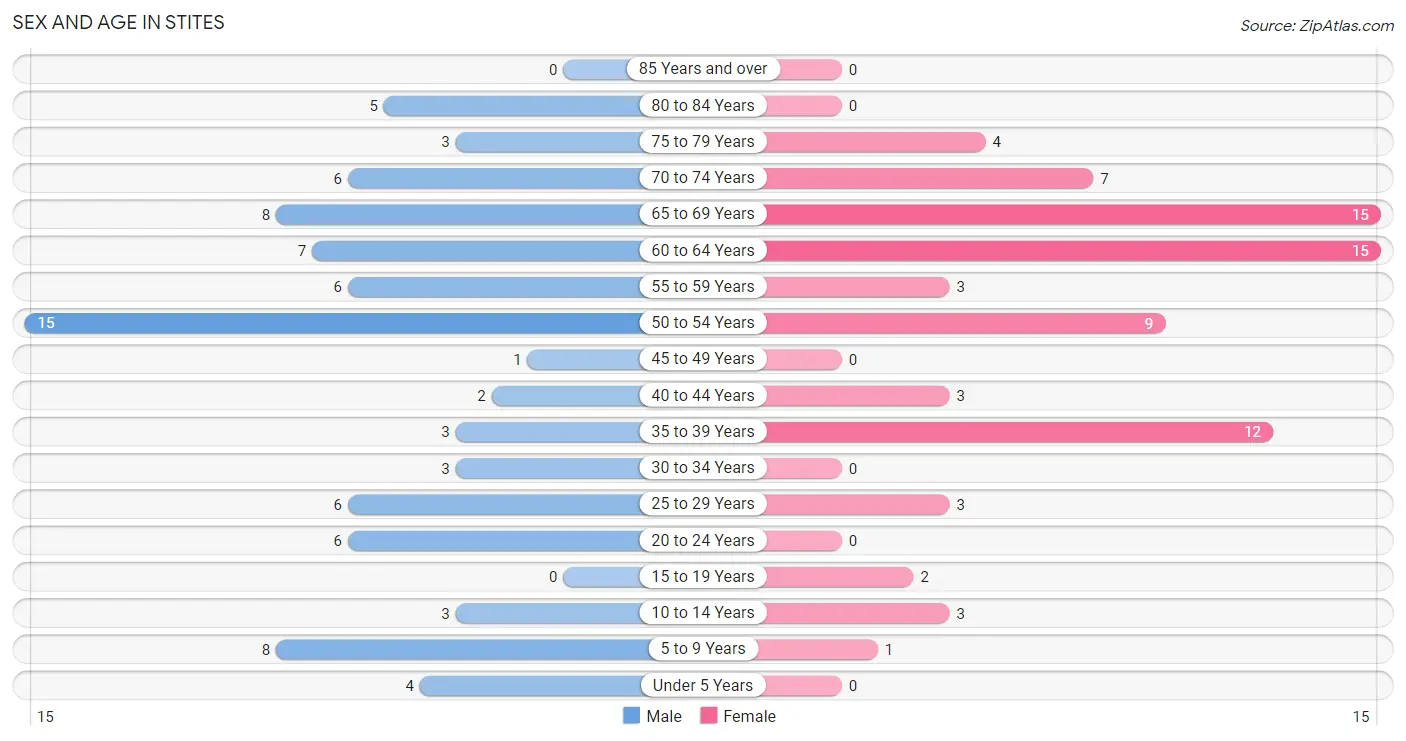
| Age Bracket | Male | Female |
| Under 5 Years | 4 (4.6%) | 0 (0.0%) |
| 5 to 9 Years | 8 (9.3%) | 1 (1.3%) |
| 10 to 14 Years | 3 (3.5%) | 3 (3.9%) |
| 15 to 19 Years | 0 (0.0%) | 2 (2.6%) |
| 20 to 24 Years | 6 (7.0%) | 0 (0.0%) |
| 25 to 29 Years | 6 (7.0%) | 3 (3.9%) |
| 30 to 34 Years | 3 (3.5%) | 0 (0.0%) |
| 35 to 39 Years | 3 (3.5%) | 12 (15.6%) |
| 40 to 44 Years | 2 (2.3%) | 3 (3.9%) |
| 45 to 49 Years | 1 (1.2%) | 0 (0.0%) |
| 50 to 54 Years | 15 (17.4%) | 9 (11.7%) |
| 55 to 59 Years | 6 (7.0%) | 3 (3.9%) |
| 60 to 64 Years | 7 (8.1%) | 15 (19.5%) |
| 65 to 69 Years | 8 (9.3%) | 15 (19.5%) |
| 70 to 74 Years | 6 (7.0%) | 7 (9.1%) |
| 75 to 79 Years | 3 (3.5%) | 4 (5.2%) |
| 80 to 84 Years | 5 (5.8%) | 0 (0.0%) |
| 85 Years and over | 0 (0.0%) | 0 (0.0%) |
| Total | 86 (100.0%) | 77 (100.0%) |
Families and Households in Stites
Median Family Size in Stites
The median family size in Stites is 2.71 persons per family, with single female/mother families (7 | 18.4%) accounting for the largest median family size of 3 persons per family. On the other hand, single male/father families (2 | 5.3%) represent the smallest median family size with 2.50 persons per family.
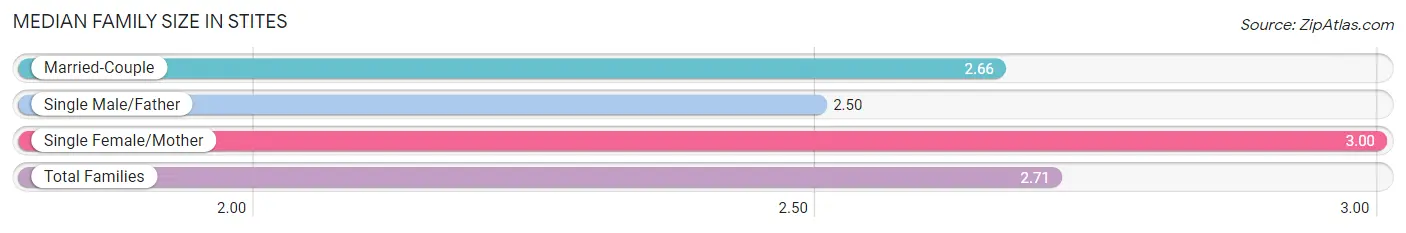
| Family Type | # Families | Family Size |
| Married-Couple | 29 (76.3%) | 2.66 |
| Single Male/Father | 2 (5.3%) | 2.50 |
| Single Female/Mother | 7 (18.4%) | 3.00 |
| Total Families | 38 (100.0%) | 2.71 |
Median Household Size in Stites
The median household size in Stites is 2.09 persons per household, with single female/mother households (7 | 9.0%) accounting for the largest median household size of 4.14 persons per household. non-family households (40 | 51.3%) represent the smallest median household size with 1.23 persons per household.
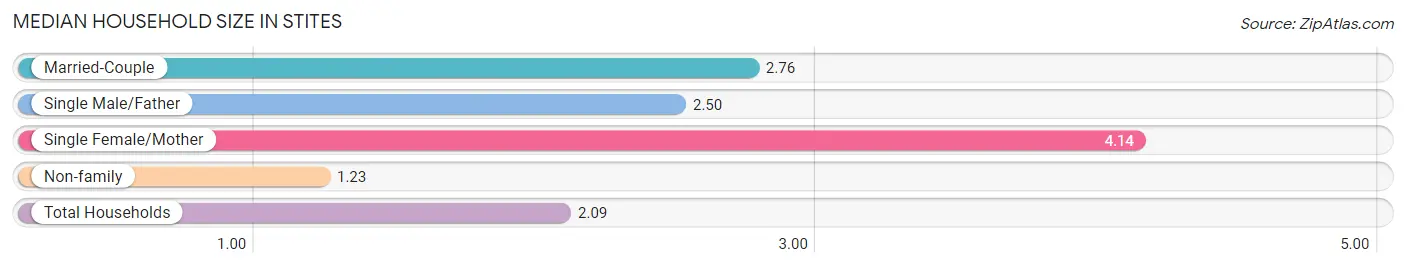
| Household Type | # Households | Household Size |
| Married-Couple | 29 (37.2%) | 2.76 |
| Single Male/Father | 2 (2.6%) | 2.50 |
| Single Female/Mother | 7 (9.0%) | 4.14 |
| Non-family | 40 (51.3%) | 1.23 |
| Total Households | 78 (100.0%) | 2.09 |
Household Size by Marriage Status in Stites
Out of a total of 78 households in Stites, 38 (48.7%) are family households, while 40 (51.3%) are nonfamily households. The most numerous type of family households are 2-person households, comprising 23, and the most common type of nonfamily households are 1-person households, comprising 33.
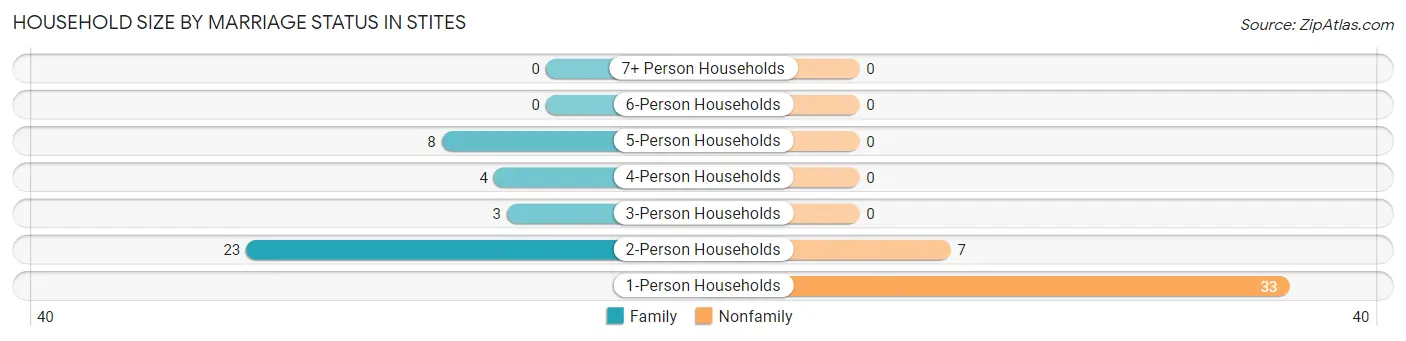
| Household Size | Family Households | Nonfamily Households |
| 1-Person Households | - | 33 (42.3%) |
| 2-Person Households | 23 (29.5%) | 7 (9.0%) |
| 3-Person Households | 3 (3.8%) | 0 (0.0%) |
| 4-Person Households | 4 (5.1%) | 0 (0.0%) |
| 5-Person Households | 8 (10.3%) | 0 (0.0%) |
| 6-Person Households | 0 (0.0%) | 0 (0.0%) |
| 7+ Person Households | 0 (0.0%) | 0 (0.0%) |
| Total | 38 (48.7%) | 40 (51.3%) |
Female Fertility in Stites
Fertility by Age in Stites
| Age Bracket | Women with Births | Births / 1,000 Women |
| 15 to 19 years | 0 (0.0%) | 0.0 |
| 20 to 34 years | 0 (0.0%) | 0.0 |
| 35 to 50 years | 0 (0.0%) | 0.0 |
| Total | 0 (0.0%) | 0.0 |
Fertility by Age by Marriage Status in Stites
| Age Bracket | Married | Unmarried |
| 15 to 19 years | 0 (0.0%) | 0 (0.0%) |
| 20 to 34 years | 0 (0.0%) | 0 (0.0%) |
| 35 to 50 years | 0 (0.0%) | 0 (0.0%) |
| Total | 0 (0.0%) | 0 (0.0%) |
Fertility by Education in Stites
| Educational Attainment | Women with Births | Births / 1,000 Women |
| Less than High School | 0 (0.0%) | 0.0 |
| High School Diploma | 0 (0.0%) | 0.0 |
| College or Associate's Degree | 0 (0.0%) | 0.0 |
| Bachelor's Degree | 0 (0.0%) | 0.0 |
| Graduate Degree | 0 (0.0%) | 0.0 |
| Total | 0 (0.0%) | 0.0 |
Fertility by Education by Marriage Status in Stites
| Educational Attainment | Married | Unmarried |
| Less than High School | 0 (0.0%) | 0 (0.0%) |
| High School Diploma | 0 (0.0%) | 0 (0.0%) |
| College or Associate's Degree | 0 (0.0%) | 0 (0.0%) |
| Bachelor's Degree | 0 (0.0%) | 0 (0.0%) |
| Graduate Degree | 0 (0.0%) | 0 (0.0%) |
| Total | 0 (0.0%) | 0 (0.0%) |
Employment Characteristics in Stites
Employment by Class of Employer in Stites
Among the 49 employed individuals in Stites, private company employees (33 | 67.3%), self-employed (not incorporated) (5 | 10.2%), and self-employed (incorporated) (4 | 8.2%) make up the most common classes of employment.
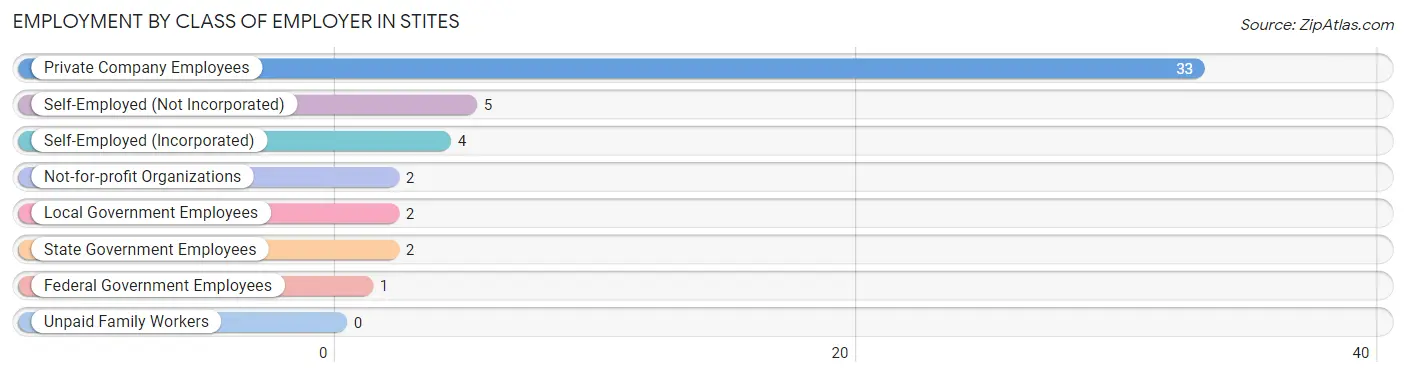
| Employer Class | # Employees | % Employees |
| Private Company Employees | 33 | 67.3% |
| Self-Employed (Incorporated) | 4 | 8.2% |
| Self-Employed (Not Incorporated) | 5 | 10.2% |
| Not-for-profit Organizations | 2 | 4.1% |
| Local Government Employees | 2 | 4.1% |
| State Government Employees | 2 | 4.1% |
| Federal Government Employees | 1 | 2.0% |
| Unpaid Family Workers | 0 | 0.0% |
| Total | 49 | 100.0% |
Employment Status by Age in Stites
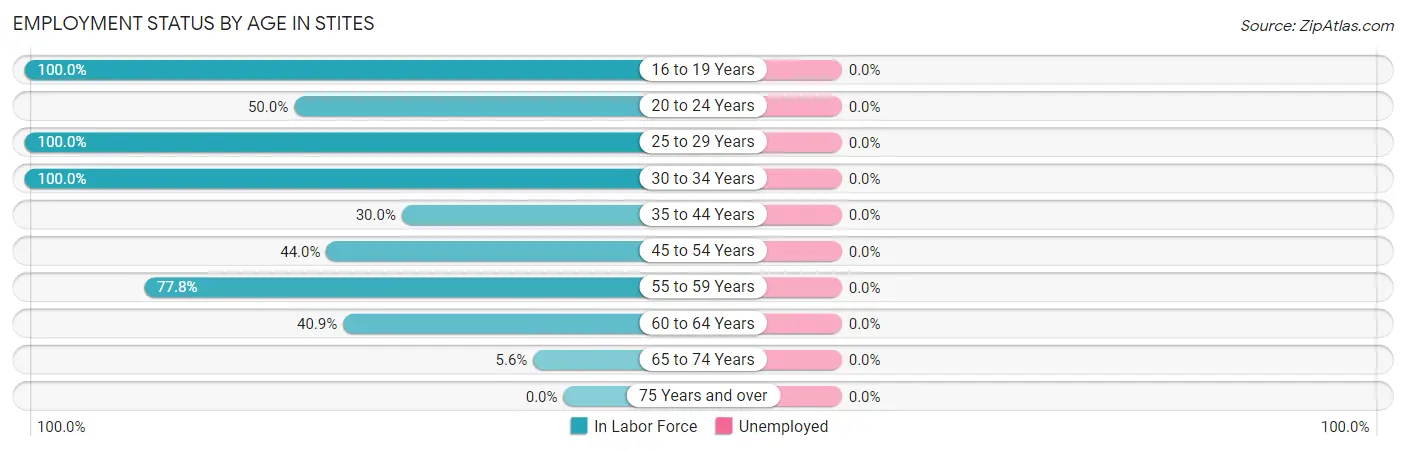
| Age Bracket | In Labor Force | Unemployed |
| 16 to 19 Years | 2 (100.0%) | 0 (0.0%) |
| 20 to 24 Years | 3 (50.0%) | 0 (0.0%) |
| 25 to 29 Years | 9 (100.0%) | 0 (0.0%) |
| 30 to 34 Years | 3 (100.0%) | 0 (0.0%) |
| 35 to 44 Years | 6 (30.0%) | 0 (0.0%) |
| 45 to 54 Years | 11 (44.0%) | 0 (0.0%) |
| 55 to 59 Years | 7 (77.8%) | 0 (0.0%) |
| 60 to 64 Years | 9 (40.9%) | 0 (0.0%) |
| 65 to 74 Years | 2 (5.6%) | 0 (0.0%) |
| 75 Years and over | 0 (0.0%) | 0 (0.0%) |
| Total | 52 (36.1%) | 0 (0.0%) |
Employment Status by Educational Attainment in Stites
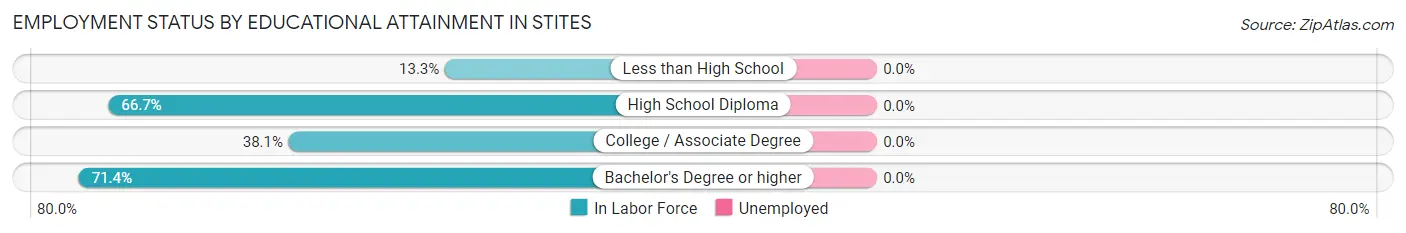
| Educational Attainment | In Labor Force | Unemployed |
| Less than High School | 2 (13.3%) | 0 (0.0%) |
| High School Diploma | 30 (66.7%) | 0 (0.0%) |
| College / Associate Degree | 8 (38.1%) | 0 (0.0%) |
| Bachelor's Degree or higher | 5 (71.4%) | 0 (0.0%) |
| Total | 45 (51.1%) | 0 (0.0%) |
Employment Occupations by Sex in Stites
Management, Business, Science and Arts Occupations
The most common Management, Business, Science and Arts occupations in Stites are Health Diagnosing & Treating (4 | 7.7%), Health Technologists (4 | 7.7%), Community & Social Service (3 | 5.8%), Education Instruction & Library (3 | 5.8%), and Business & Financial (1 | 1.9%).
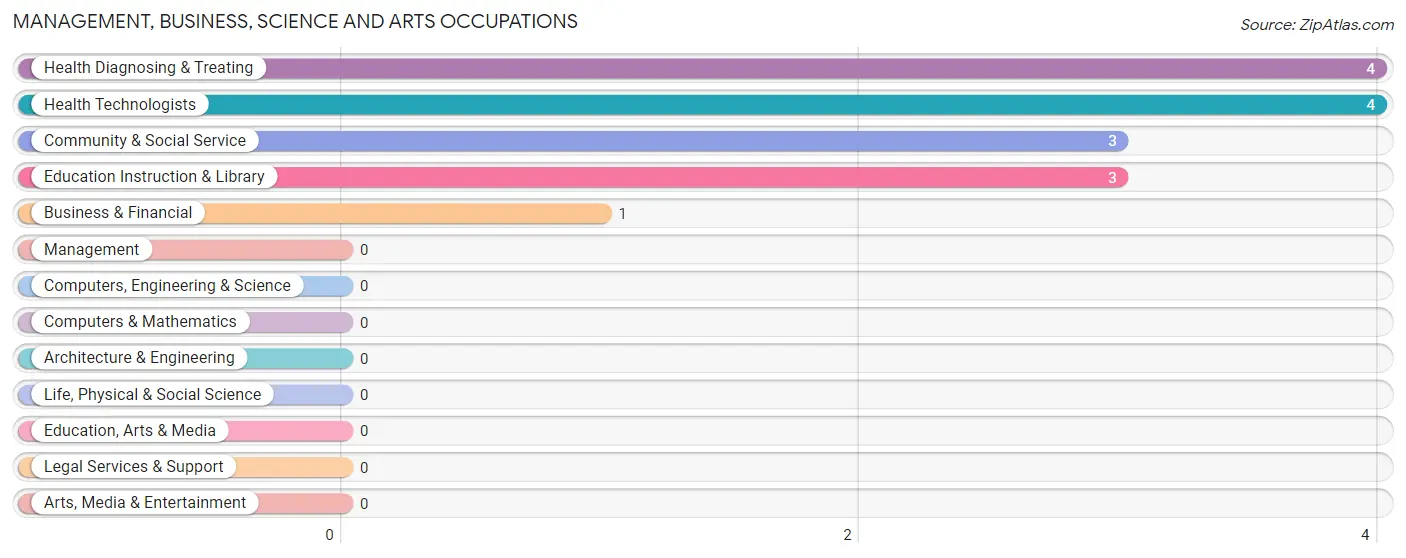
Management, Business, Science and Arts Occupations by Sex
Within the Management, Business, Science and Arts occupations in Stites, the most male-oriented occupations are Business & Financial (100.0%), Community & Social Service (100.0%), and Education Instruction & Library (100.0%), while the most female-oriented occupations are Health Diagnosing & Treating (25.0%), and Health Technologists (25.0%).
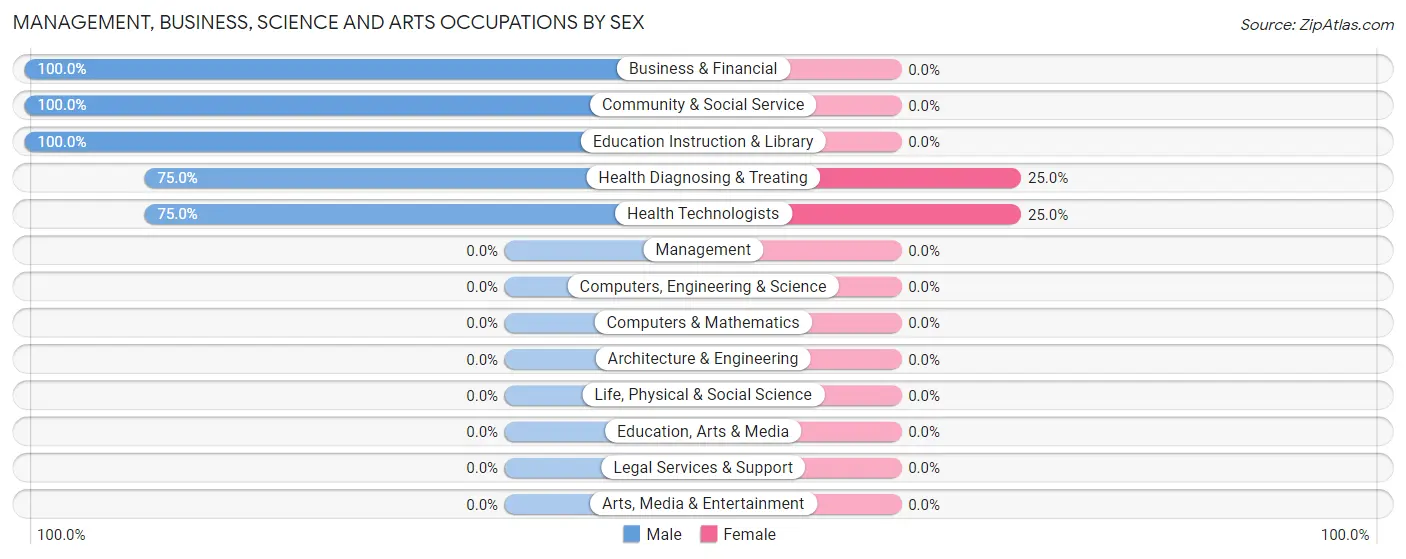
| Occupation | Male | Female |
| Management | 0 (0.0%) | 0 (0.0%) |
| Business & Financial | 1 (100.0%) | 0 (0.0%) |
| Computers, Engineering & Science | 0 (0.0%) | 0 (0.0%) |
| Computers & Mathematics | 0 (0.0%) | 0 (0.0%) |
| Architecture & Engineering | 0 (0.0%) | 0 (0.0%) |
| Life, Physical & Social Science | 0 (0.0%) | 0 (0.0%) |
| Community & Social Service | 3 (100.0%) | 0 (0.0%) |
| Education, Arts & Media | 0 (0.0%) | 0 (0.0%) |
| Legal Services & Support | 0 (0.0%) | 0 (0.0%) |
| Education Instruction & Library | 3 (100.0%) | 0 (0.0%) |
| Arts, Media & Entertainment | 0 (0.0%) | 0 (0.0%) |
| Health Diagnosing & Treating | 3 (75.0%) | 1 (25.0%) |
| Health Technologists | 3 (75.0%) | 1 (25.0%) |
| Total (Category) | 7 (87.5%) | 1 (12.5%) |
| Total (Overall) | 36 (69.2%) | 16 (30.8%) |
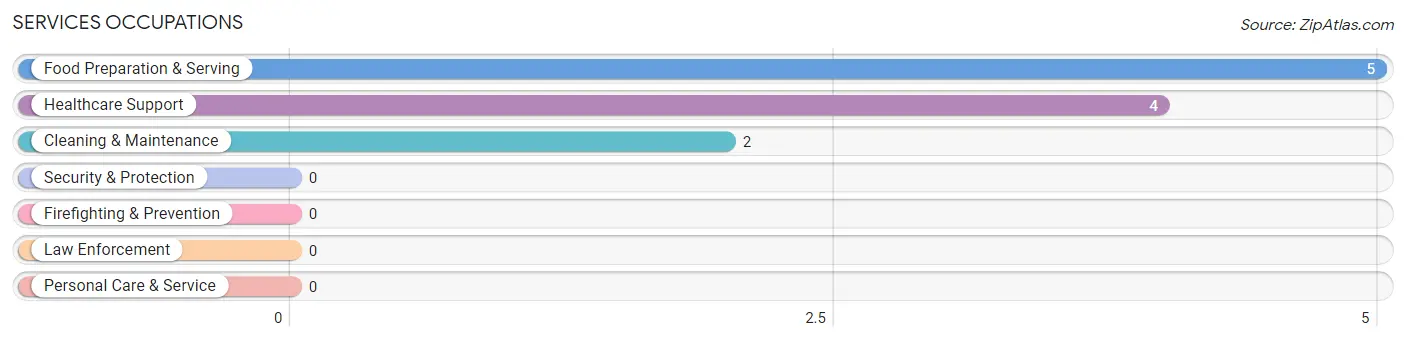
Services Occupations
The most common Services occupations in Stites are Food Preparation & Serving (5 | 9.6%), Healthcare Support (4 | 7.7%), and Cleaning & Maintenance (2 | 3.8%).
Services Occupations by Sex
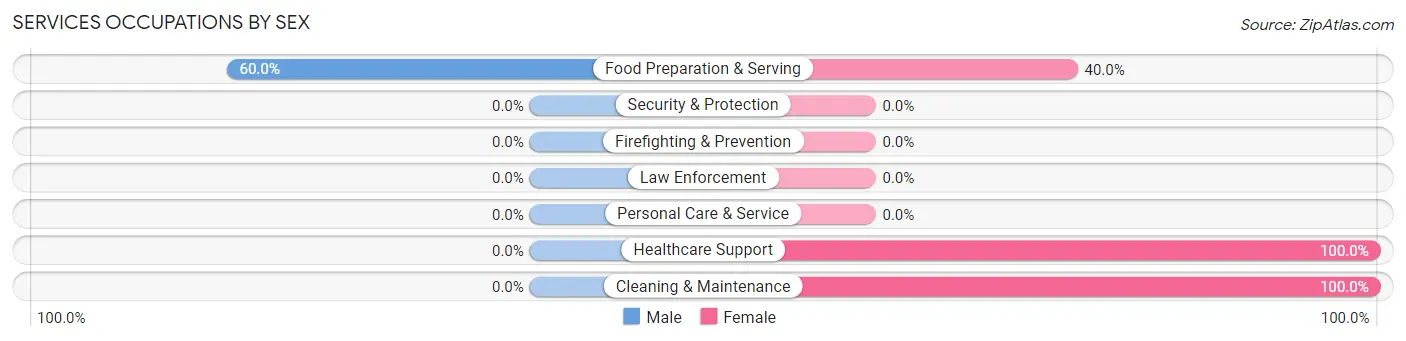
| Occupation | Male | Female |
| Healthcare Support | 0 (0.0%) | 4 (100.0%) |
| Security & Protection | 0 (0.0%) | 0 (0.0%) |
| Firefighting & Prevention | 0 (0.0%) | 0 (0.0%) |
| Law Enforcement | 0 (0.0%) | 0 (0.0%) |
| Food Preparation & Serving | 3 (60.0%) | 2 (40.0%) |
| Cleaning & Maintenance | 0 (0.0%) | 2 (100.0%) |
| Personal Care & Service | 0 (0.0%) | 0 (0.0%) |
| Total (Category) | 3 (27.3%) | 8 (72.7%) |
| Total (Overall) | 36 (69.2%) | 16 (30.8%) |
Sales and Office Occupations
The most common Sales and Office occupations in Stites are Office & Administration (4 | 7.7%), and Sales & Related (3 | 5.8%).
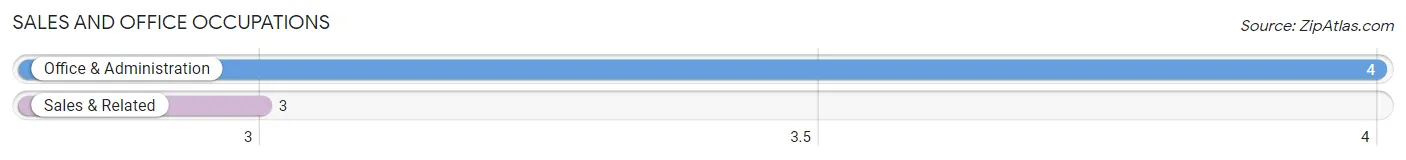
Sales and Office Occupations by Sex
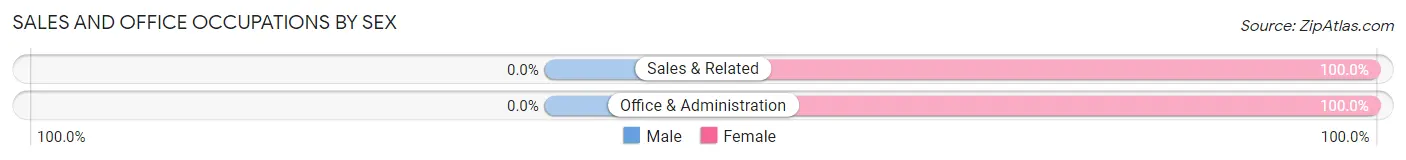
| Occupation | Male | Female |
| Sales & Related | 0 (0.0%) | 3 (100.0%) |
| Office & Administration | 0 (0.0%) | 4 (100.0%) |
| Total (Category) | 0 (0.0%) | 7 (100.0%) |
| Total (Overall) | 36 (69.2%) | 16 (30.8%) |
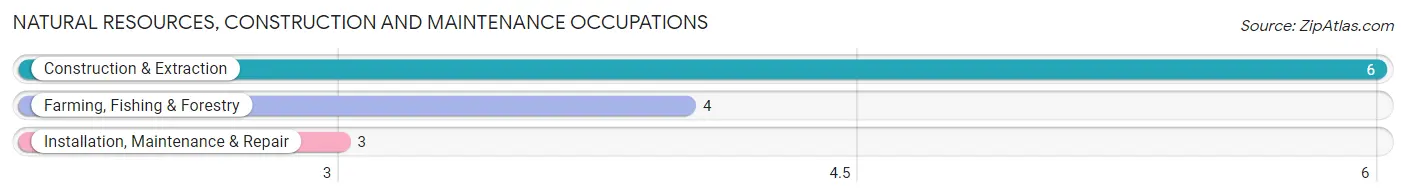
Natural Resources, Construction and Maintenance Occupations
The most common Natural Resources, Construction and Maintenance occupations in Stites are Construction & Extraction (6 | 11.5%), Farming, Fishing & Forestry (4 | 7.7%), and Installation, Maintenance & Repair (3 | 5.8%).
Natural Resources, Construction and Maintenance Occupations by Sex
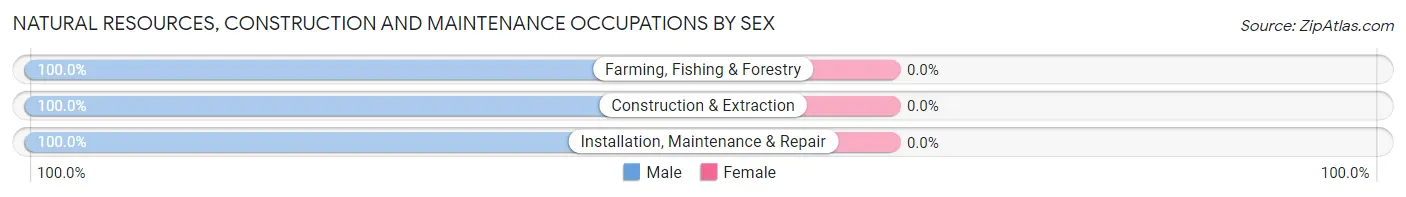
| Occupation | Male | Female |
| Farming, Fishing & Forestry | 4 (100.0%) | 0 (0.0%) |
| Construction & Extraction | 6 (100.0%) | 0 (0.0%) |
| Installation, Maintenance & Repair | 3 (100.0%) | 0 (0.0%) |
| Total (Category) | 13 (100.0%) | 0 (0.0%) |
| Total (Overall) | 36 (69.2%) | 16 (30.8%) |
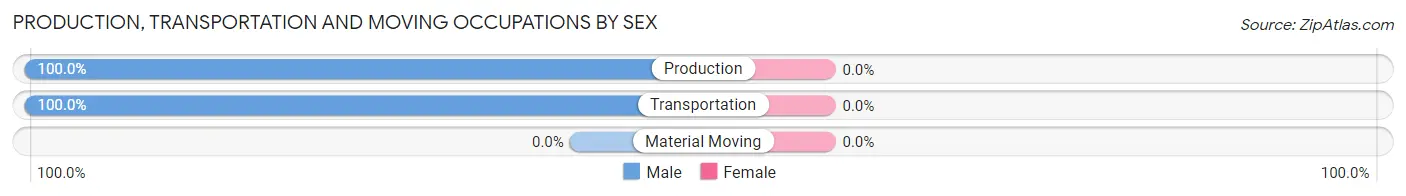
Production, Transportation and Moving Occupations
The most common Production, Transportation and Moving occupations in Stites are Production (7 | 13.5%), and Transportation (6 | 11.5%).
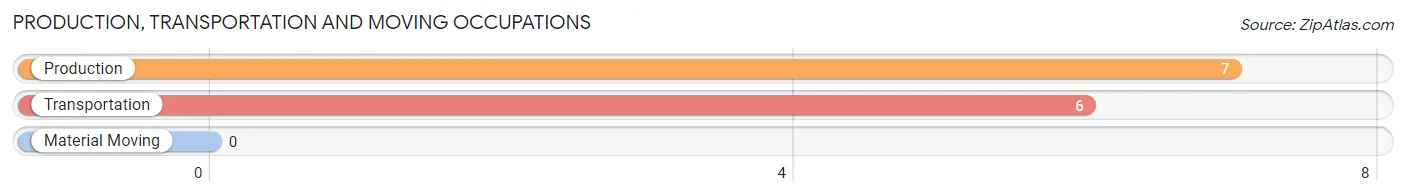
Production, Transportation and Moving Occupations by Sex
| Occupation | Male | Female |
| Production | 7 (100.0%) | 0 (0.0%) |
| Transportation | 6 (100.0%) | 0 (0.0%) |
| Material Moving | 0 (0.0%) | 0 (0.0%) |
| Total (Category) | 13 (100.0%) | 0 (0.0%) |
| Total (Overall) | 36 (69.2%) | 16 (30.8%) |
Employment Industries by Sex in Stites
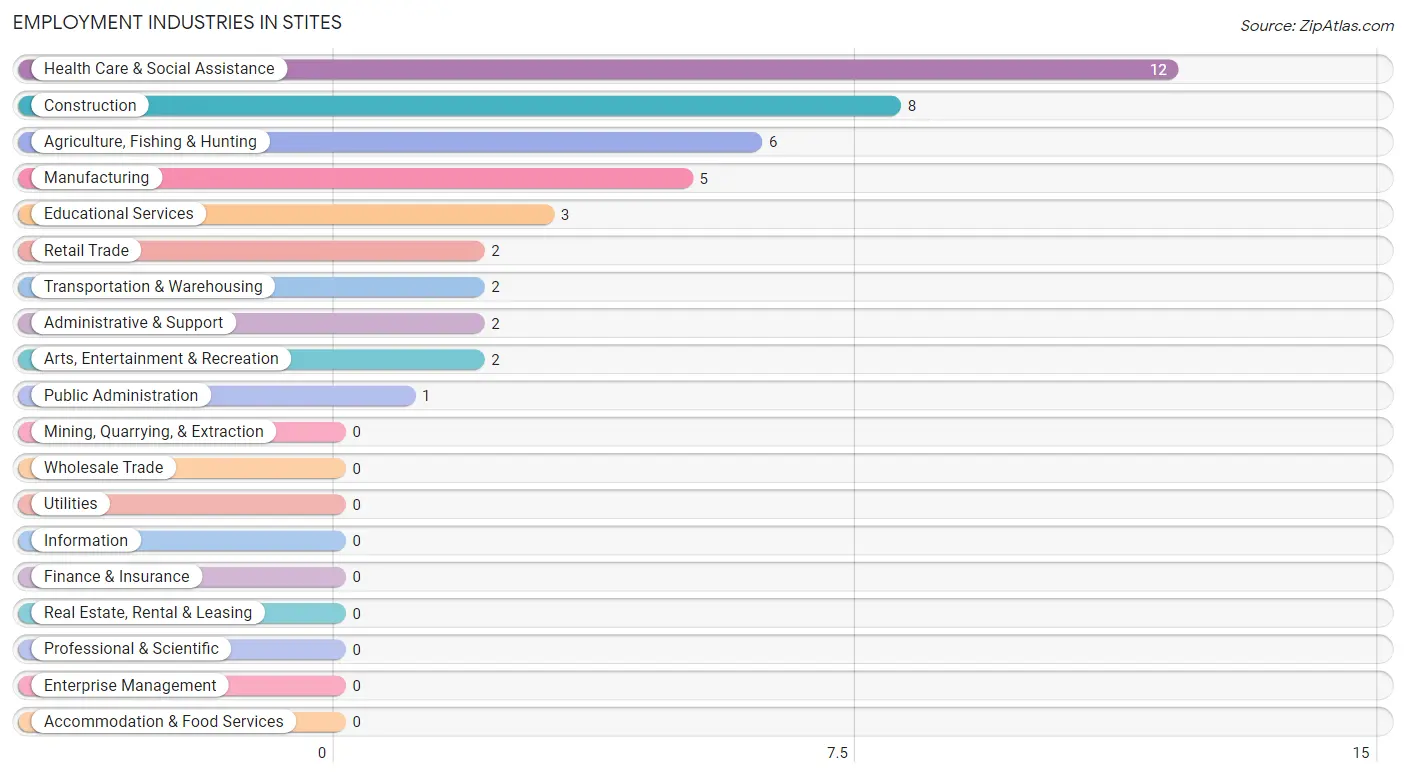
Employment Industries in Stites
The major employment industries in Stites include Health Care & Social Assistance (12 | 23.1%), Construction (8 | 15.4%), Agriculture, Fishing & Hunting (6 | 11.5%), Manufacturing (5 | 9.6%), and Educational Services (3 | 5.8%).
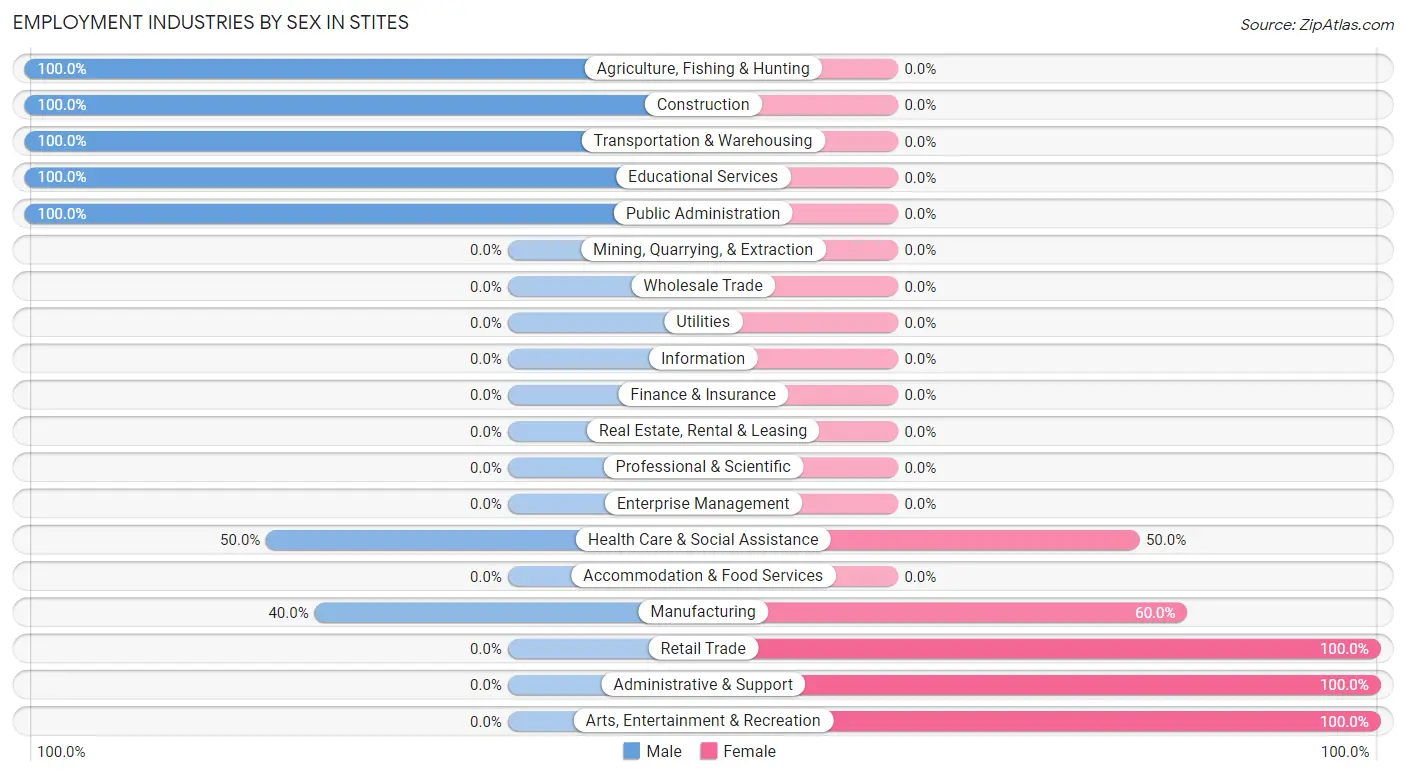
Employment Industries by Sex in Stites
The Stites industries that see more men than women are Agriculture, Fishing & Hunting (100.0%), Construction (100.0%), and Transportation & Warehousing (100.0%), whereas the industries that tend to have a higher number of women are Retail Trade (100.0%), Administrative & Support (100.0%), and Arts, Entertainment & Recreation (100.0%).
| Industry | Male | Female |
| Agriculture, Fishing & Hunting | 6 (100.0%) | 0 (0.0%) |
| Mining, Quarrying, & Extraction | 0 (0.0%) | 0 (0.0%) |
| Construction | 8 (100.0%) | 0 (0.0%) |
| Manufacturing | 2 (40.0%) | 3 (60.0%) |
| Wholesale Trade | 0 (0.0%) | 0 (0.0%) |
| Retail Trade | 0 (0.0%) | 2 (100.0%) |
| Transportation & Warehousing | 2 (100.0%) | 0 (0.0%) |
| Utilities | 0 (0.0%) | 0 (0.0%) |
| Information | 0 (0.0%) | 0 (0.0%) |
| Finance & Insurance | 0 (0.0%) | 0 (0.0%) |
| Real Estate, Rental & Leasing | 0 (0.0%) | 0 (0.0%) |
| Professional & Scientific | 0 (0.0%) | 0 (0.0%) |
| Enterprise Management | 0 (0.0%) | 0 (0.0%) |
| Administrative & Support | 0 (0.0%) | 2 (100.0%) |
| Educational Services | 3 (100.0%) | 0 (0.0%) |
| Health Care & Social Assistance | 6 (50.0%) | 6 (50.0%) |
| Arts, Entertainment & Recreation | 0 (0.0%) | 2 (100.0%) |
| Accommodation & Food Services | 0 (0.0%) | 0 (0.0%) |
| Public Administration | 1 (100.0%) | 0 (0.0%) |
| Total | 36 (69.2%) | 16 (30.8%) |
Education in Stites
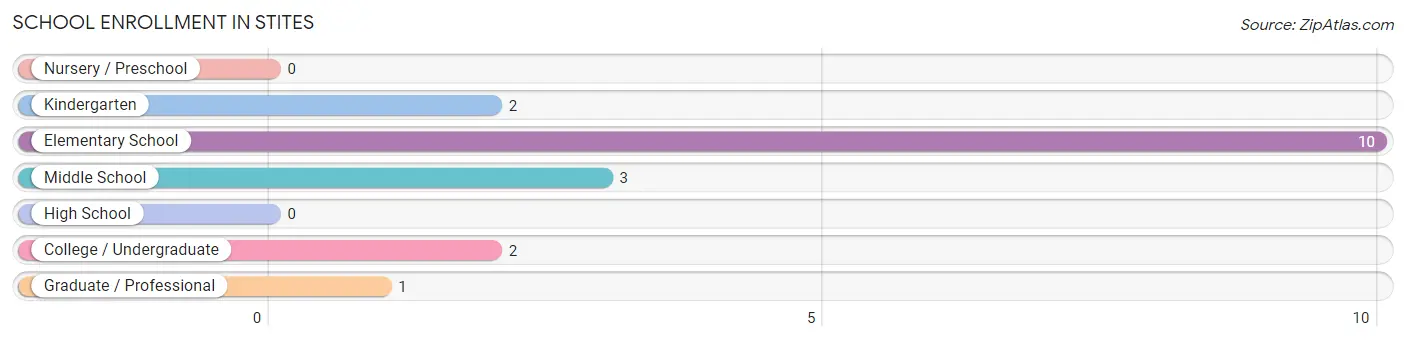
School Enrollment in Stites
The most common levels of schooling among the 18 students in Stites are elementary school (10 | 55.6%), middle school (3 | 16.7%), and kindergarten (2 | 11.1%).
| School Level | # Students | % Students |
| Nursery / Preschool | 0 | 0.0% |
| Kindergarten | 2 | 11.1% |
| Elementary School | 10 | 55.6% |
| Middle School | 3 | 16.7% |
| High School | 0 | 0.0% |
| College / Undergraduate | 2 | 11.1% |
| Graduate / Professional | 1 | 5.6% |
| Total | 18 | 100.0% |
School Enrollment by Age by Funding Source in Stites
Out of a total of 18 students who are enrolled in schools in Stites, 3 (16.7%) attend a private institution, while the remaining 15 (83.3%) are enrolled in public schools. The age group of 10 to 14 year olds has the highest likelihood of being enrolled in private schools, with 3 (50.0% in the age bracket) enrolled. Conversely, the age group of 5 to 9 year old has the lowest likelihood of being enrolled in a private school, with 9 (100.0% in the age bracket) attending a public institution.
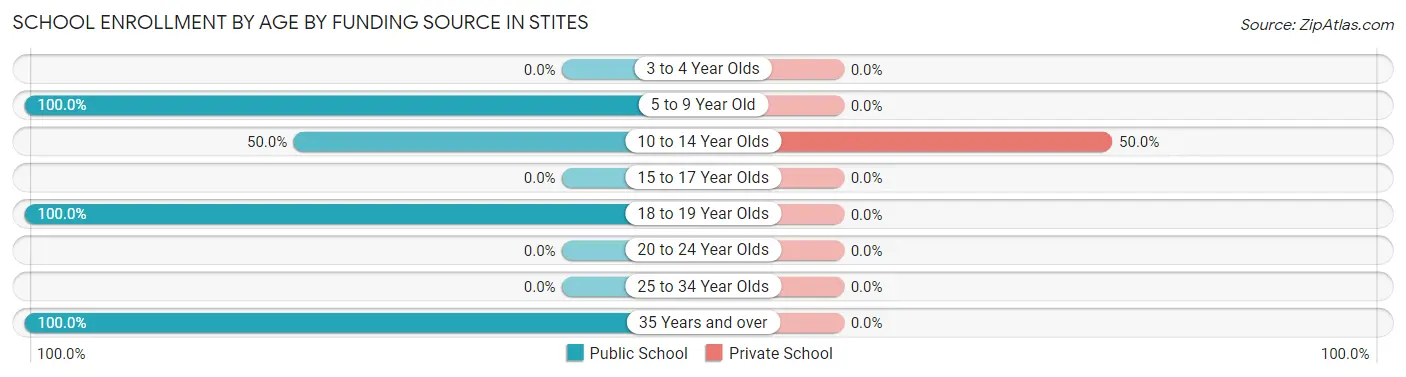
| Age Bracket | Public School | Private School |
| 3 to 4 Year Olds | 0 (0.0%) | 0 (0.0%) |
| 5 to 9 Year Old | 9 (100.0%) | 0 (0.0%) |
| 10 to 14 Year Olds | 3 (50.0%) | 3 (50.0%) |
| 15 to 17 Year Olds | 0 (0.0%) | 0 (0.0%) |
| 18 to 19 Year Olds | 2 (100.0%) | 0 (0.0%) |
| 20 to 24 Year Olds | 0 (0.0%) | 0 (0.0%) |
| 25 to 34 Year Olds | 0 (0.0%) | 0 (0.0%) |
| 35 Years and over | 1 (100.0%) | 0 (0.0%) |
| Total | 15 (83.3%) | 3 (16.7%) |
Educational Attainment by Field of Study in Stites
Education (3 | 42.9%), social sciences (2 | 28.6%), and science & technology (2 | 28.6%) are the most common fields of study among 7 individuals in Stites who have obtained a bachelor's degree or higher.
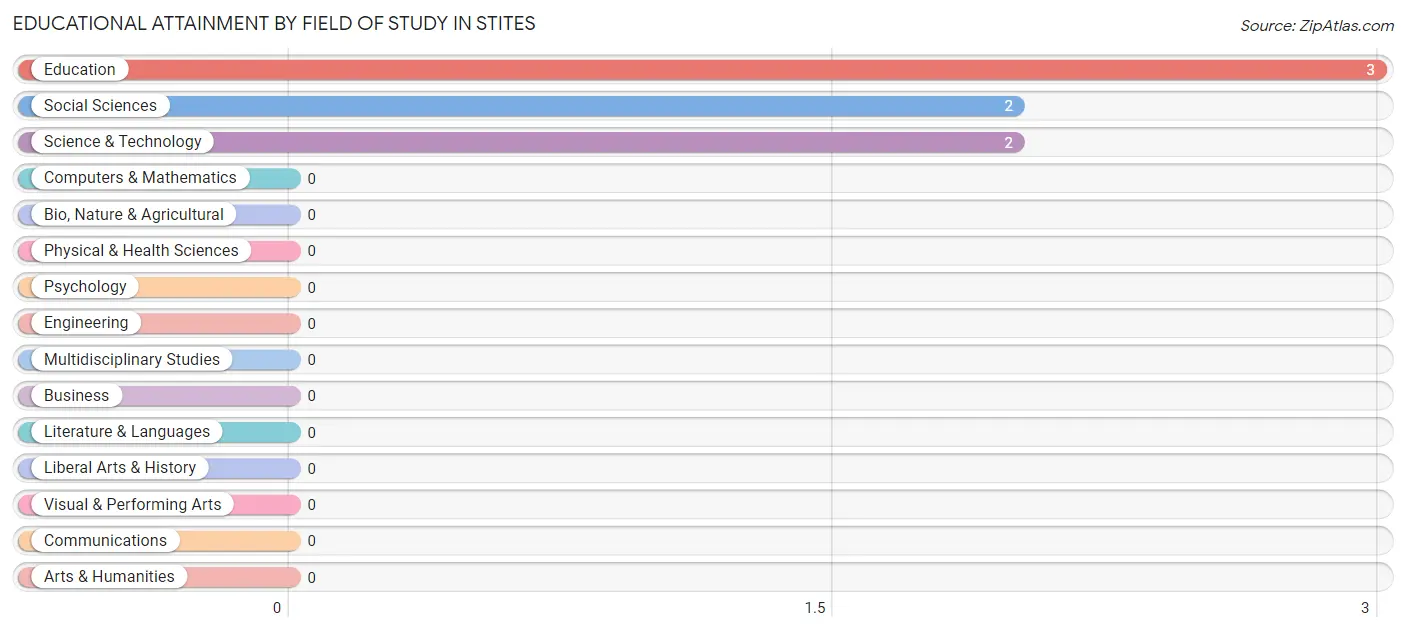
| Field of Study | # Graduates | % Graduates |
| Computers & Mathematics | 0 | 0.0% |
| Bio, Nature & Agricultural | 0 | 0.0% |
| Physical & Health Sciences | 0 | 0.0% |
| Psychology | 0 | 0.0% |
| Social Sciences | 2 | 28.6% |
| Engineering | 0 | 0.0% |
| Multidisciplinary Studies | 0 | 0.0% |
| Science & Technology | 2 | 28.6% |
| Business | 0 | 0.0% |
| Education | 3 | 42.9% |
| Literature & Languages | 0 | 0.0% |
| Liberal Arts & History | 0 | 0.0% |
| Visual & Performing Arts | 0 | 0.0% |
| Communications | 0 | 0.0% |
| Arts & Humanities | 0 | 0.0% |
| Total | 7 | 100.0% |
Transportation & Commute in Stites
Vehicle Availability by Sex in Stites
The most prevalent vehicle ownership categories in Stites are males with 2 vehicles (19, accounting for 57.6%) and females with 2 vehicles (10, making up 118.8%).
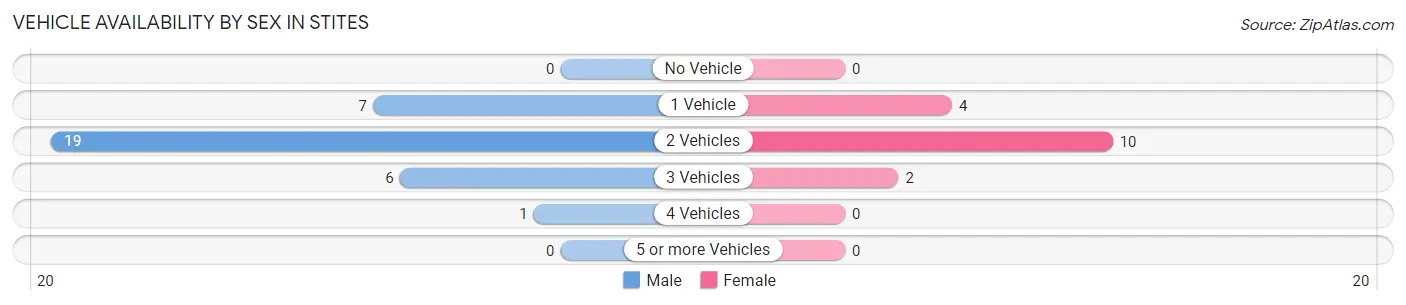
| Vehicles Available | Male | Female |
| No Vehicle | 0 (0.0%) | 0 (0.0%) |
| 1 Vehicle | 7 (21.2%) | 4 (25.0%) |
| 2 Vehicles | 19 (57.6%) | 10 (62.5%) |
| 3 Vehicles | 6 (18.2%) | 2 (12.5%) |
| 4 Vehicles | 1 (3.0%) | 0 (0.0%) |
| 5 or more Vehicles | 0 (0.0%) | 0 (0.0%) |
| Total | 33 (100.0%) | 16 (100.0%) |
Commute Time in Stites
The most frequently occuring commute durations in Stites are 20 to 24 minutes (12 commuters, 25.0%), 5 to 9 minutes (9 commuters, 18.8%), and 45 to 59 minutes (6 commuters, 12.5%).
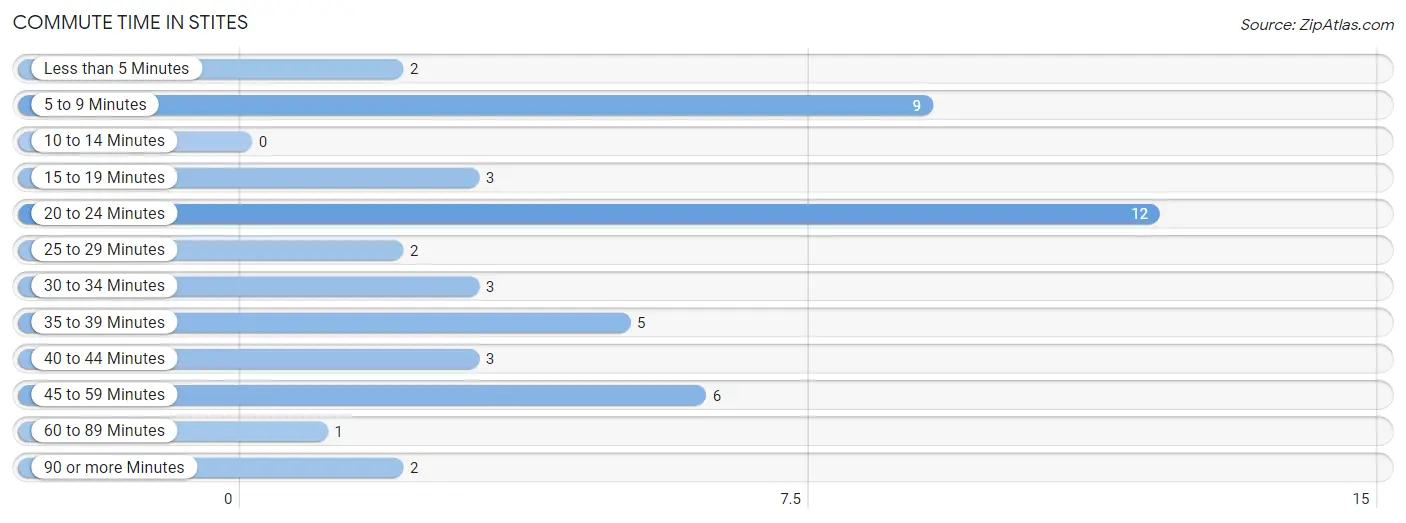
| Commute Time | # Commuters | % Commuters |
| Less than 5 Minutes | 2 | 4.2% |
| 5 to 9 Minutes | 9 | 18.8% |
| 10 to 14 Minutes | 0 | 0.0% |
| 15 to 19 Minutes | 3 | 6.2% |
| 20 to 24 Minutes | 12 | 25.0% |
| 25 to 29 Minutes | 2 | 4.2% |
| 30 to 34 Minutes | 3 | 6.2% |
| 35 to 39 Minutes | 5 | 10.4% |
| 40 to 44 Minutes | 3 | 6.2% |
| 45 to 59 Minutes | 6 | 12.5% |
| 60 to 89 Minutes | 1 | 2.1% |
| 90 or more Minutes | 2 | 4.2% |
Commute Time by Sex in Stites
The most common commute times in Stites are 20 to 24 minutes (8 commuters, 25.0%) for males and 20 to 24 minutes (4 commuters, 25.0%) for females.
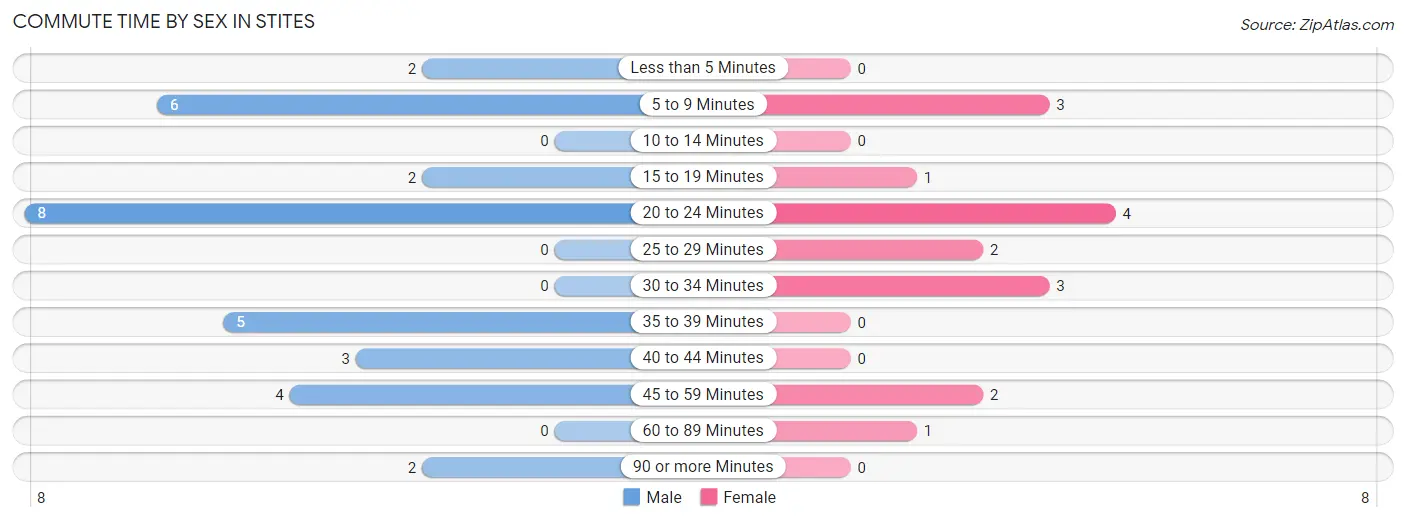
| Commute Time | Male | Female |
| Less than 5 Minutes | 2 (6.2%) | 0 (0.0%) |
| 5 to 9 Minutes | 6 (18.8%) | 3 (18.8%) |
| 10 to 14 Minutes | 0 (0.0%) | 0 (0.0%) |
| 15 to 19 Minutes | 2 (6.2%) | 1 (6.2%) |
| 20 to 24 Minutes | 8 (25.0%) | 4 (25.0%) |
| 25 to 29 Minutes | 0 (0.0%) | 2 (12.5%) |
| 30 to 34 Minutes | 0 (0.0%) | 3 (18.8%) |
| 35 to 39 Minutes | 5 (15.6%) | 0 (0.0%) |
| 40 to 44 Minutes | 3 (9.4%) | 0 (0.0%) |
| 45 to 59 Minutes | 4 (12.5%) | 2 (12.5%) |
| 60 to 89 Minutes | 0 (0.0%) | 1 (6.2%) |
| 90 or more Minutes | 2 (6.2%) | 0 (0.0%) |
Time of Departure to Work by Sex in Stites
The most frequent times of departure to work in Stites are 6:00 AM to 6:29 AM (11, 34.4%) for males and 8:00 AM to 8:29 AM (4, 25.0%) for females.
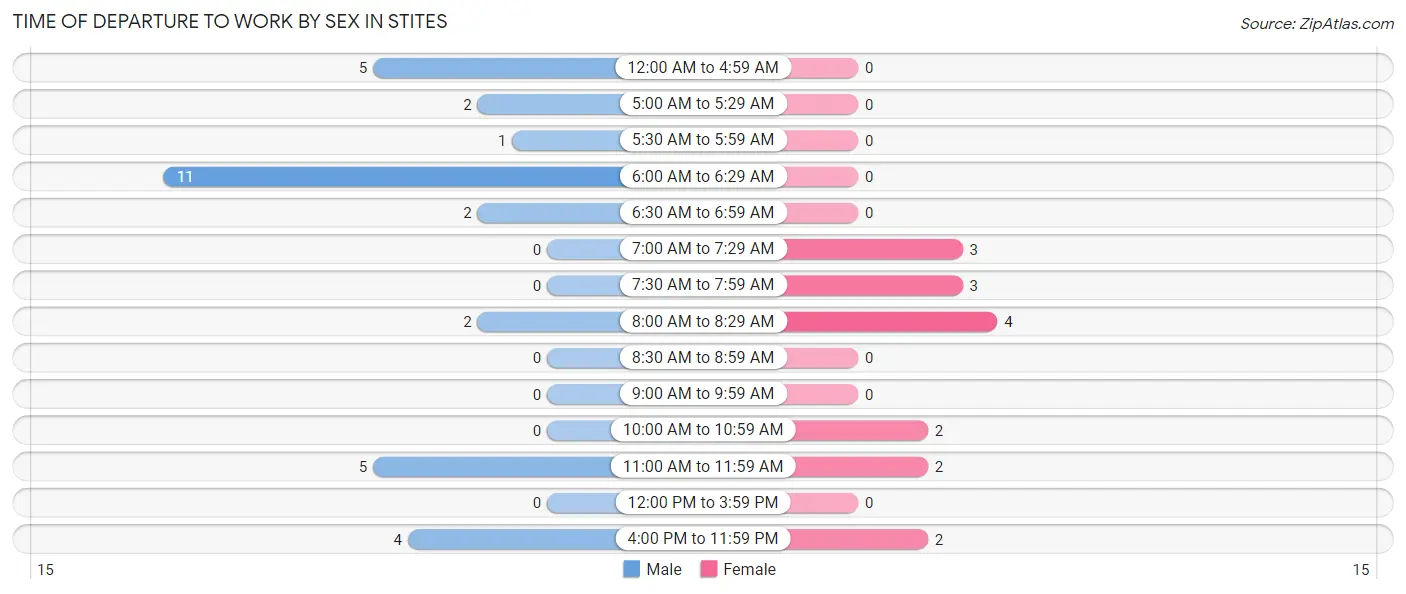
| Time of Departure | Male | Female |
| 12:00 AM to 4:59 AM | 5 (15.6%) | 0 (0.0%) |
| 5:00 AM to 5:29 AM | 2 (6.2%) | 0 (0.0%) |
| 5:30 AM to 5:59 AM | 1 (3.1%) | 0 (0.0%) |
| 6:00 AM to 6:29 AM | 11 (34.4%) | 0 (0.0%) |
| 6:30 AM to 6:59 AM | 2 (6.2%) | 0 (0.0%) |
| 7:00 AM to 7:29 AM | 0 (0.0%) | 3 (18.8%) |
| 7:30 AM to 7:59 AM | 0 (0.0%) | 3 (18.8%) |
| 8:00 AM to 8:29 AM | 2 (6.2%) | 4 (25.0%) |
| 8:30 AM to 8:59 AM | 0 (0.0%) | 0 (0.0%) |
| 9:00 AM to 9:59 AM | 0 (0.0%) | 0 (0.0%) |
| 10:00 AM to 10:59 AM | 0 (0.0%) | 2 (12.5%) |
| 11:00 AM to 11:59 AM | 5 (15.6%) | 2 (12.5%) |
| 12:00 PM to 3:59 PM | 0 (0.0%) | 0 (0.0%) |
| 4:00 PM to 11:59 PM | 4 (12.5%) | 2 (12.5%) |
| Total | 32 (100.0%) | 16 (100.0%) |
Housing Occupancy in Stites
Occupancy by Ownership in Stites
Of the total 78 dwellings in Stites, owner-occupied units account for 63 (80.8%), while renter-occupied units make up 15 (19.2%).
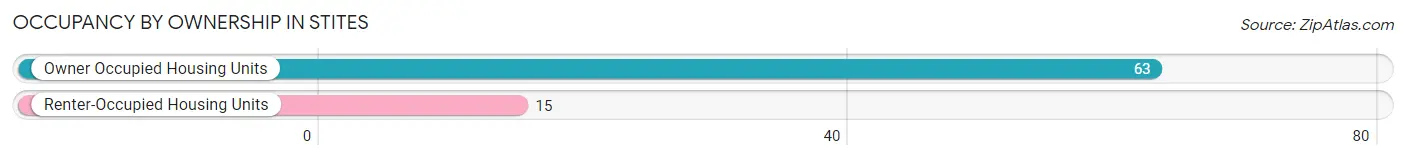
| Occupancy | # Housing Units | % Housing Units |
| Owner Occupied Housing Units | 63 | 80.8% |
| Renter-Occupied Housing Units | 15 | 19.2% |
| Total Occupied Housing Units | 78 | 100.0% |
Occupancy by Household Size in Stites
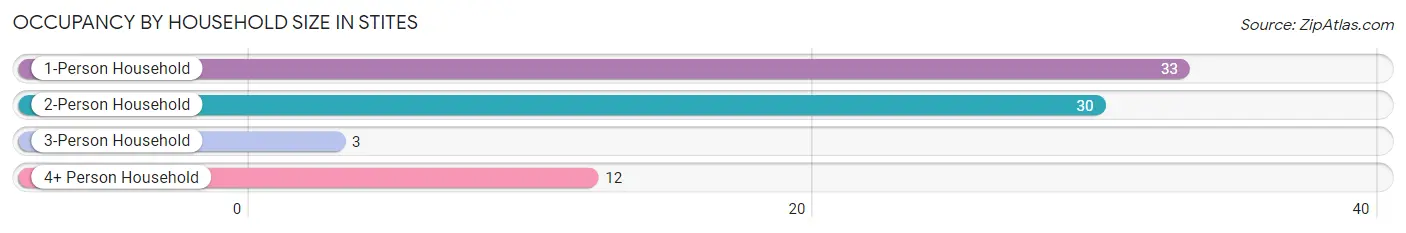
| Household Size | # Housing Units | % Housing Units |
| 1-Person Household | 33 | 42.3% |
| 2-Person Household | 30 | 38.5% |
| 3-Person Household | 3 | 3.8% |
| 4+ Person Household | 12 | 15.4% |
| Total Housing Units | 78 | 100.0% |
Occupancy by Ownership by Household Size in Stites
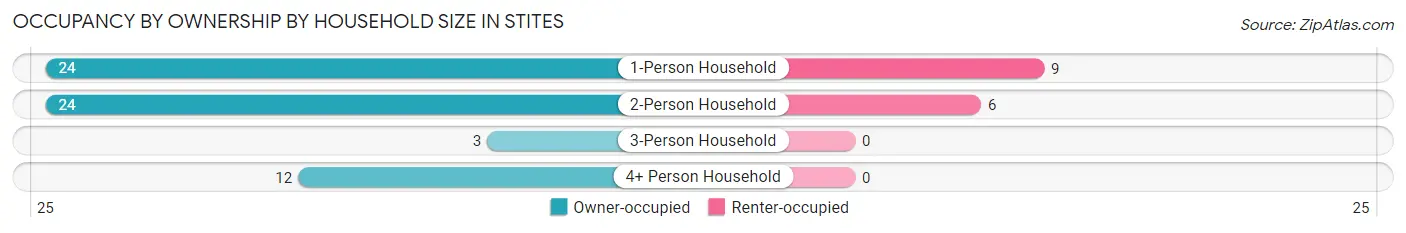
| Household Size | Owner-occupied | Renter-occupied |
| 1-Person Household | 24 (72.7%) | 9 (27.3%) |
| 2-Person Household | 24 (80.0%) | 6 (20.0%) |
| 3-Person Household | 3 (100.0%) | 0 (0.0%) |
| 4+ Person Household | 12 (100.0%) | 0 (0.0%) |
| Total Housing Units | 63 (80.8%) | 15 (19.2%) |
Occupancy by Educational Attainment in Stites
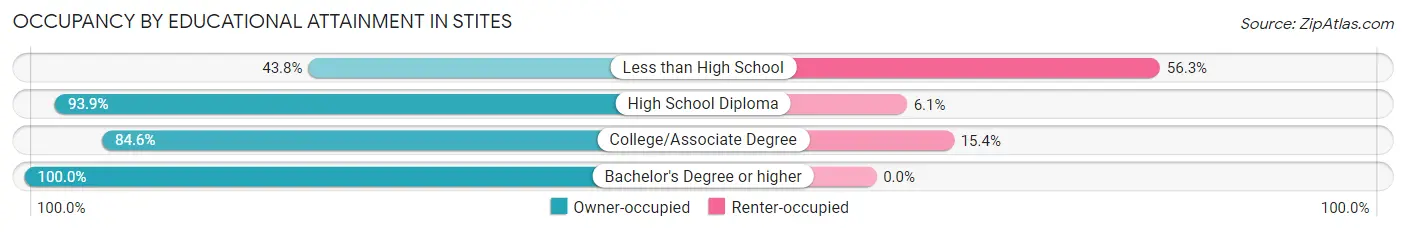
| Household Size | Owner-occupied | Renter-occupied |
| Less than High School | 7 (43.8%) | 9 (56.2%) |
| High School Diploma | 31 (93.9%) | 2 (6.1%) |
| College/Associate Degree | 22 (84.6%) | 4 (15.4%) |
| Bachelor's Degree or higher | 3 (100.0%) | 0 (0.0%) |
Occupancy by Age of Householder in Stites
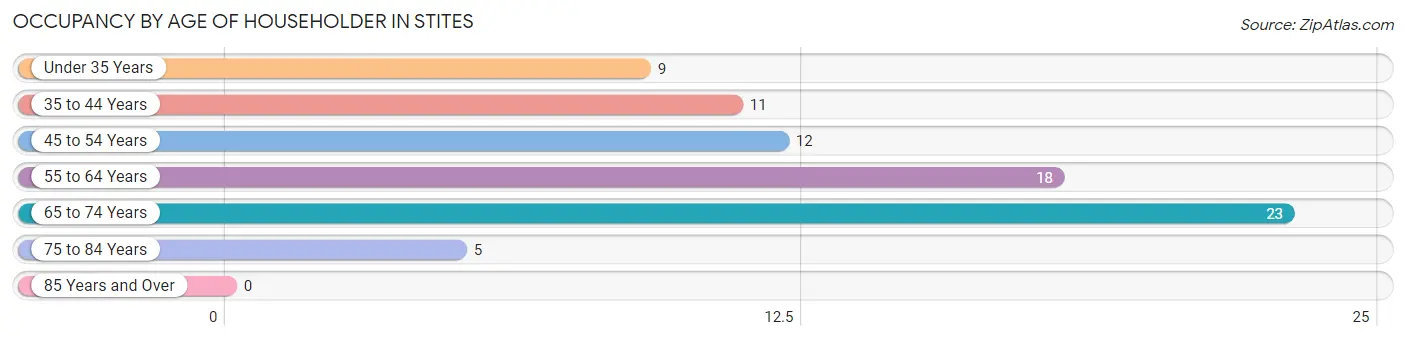
| Age Bracket | # Households | % Households |
| Under 35 Years | 9 | 11.5% |
| 35 to 44 Years | 11 | 14.1% |
| 45 to 54 Years | 12 | 15.4% |
| 55 to 64 Years | 18 | 23.1% |
| 65 to 74 Years | 23 | 29.5% |
| 75 to 84 Years | 5 | 6.4% |
| 85 Years and Over | 0 | 0.0% |
| Total | 78 | 100.0% |
Housing Finances in Stites
Median Income by Occupancy in Stites
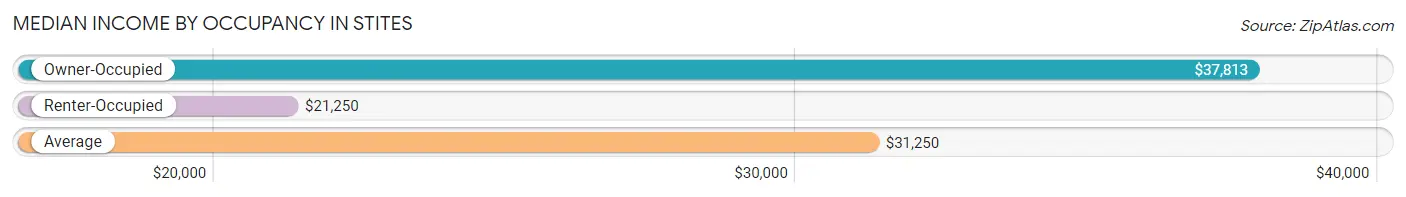
| Occupancy Type | # Households | Median Income |
| Owner-Occupied | 63 (80.8%) | $37,813 |
| Renter-Occupied | 15 (19.2%) | $21,250 |
| Average | 78 (100.0%) | $31,250 |
Occupancy by Householder Income Bracket in Stites
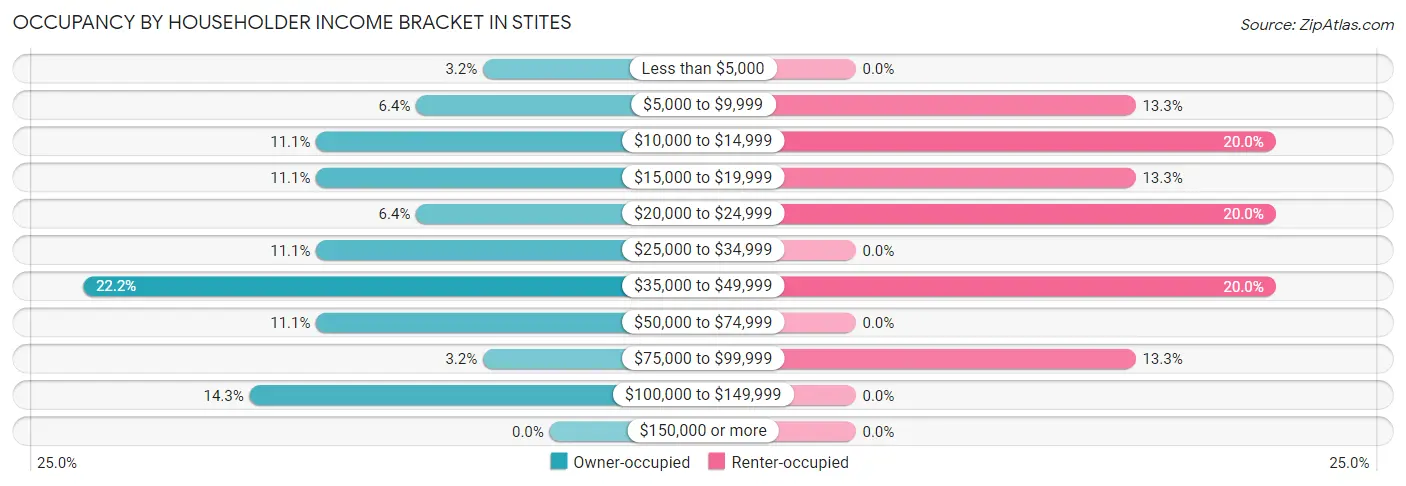
| Income Bracket | Owner-occupied | Renter-occupied |
| Less than $5,000 | 2 (3.2%) | 0 (0.0%) |
| $5,000 to $9,999 | 4 (6.4%) | 2 (13.3%) |
| $10,000 to $14,999 | 7 (11.1%) | 3 (20.0%) |
| $15,000 to $19,999 | 7 (11.1%) | 2 (13.3%) |
| $20,000 to $24,999 | 4 (6.4%) | 3 (20.0%) |
| $25,000 to $34,999 | 7 (11.1%) | 0 (0.0%) |
| $35,000 to $49,999 | 14 (22.2%) | 3 (20.0%) |
| $50,000 to $74,999 | 7 (11.1%) | 0 (0.0%) |
| $75,000 to $99,999 | 2 (3.2%) | 2 (13.3%) |
| $100,000 to $149,999 | 9 (14.3%) | 0 (0.0%) |
| $150,000 or more | 0 (0.0%) | 0 (0.0%) |
| Total | 63 (100.0%) | 15 (100.0%) |
Monthly Housing Cost Tiers in Stites
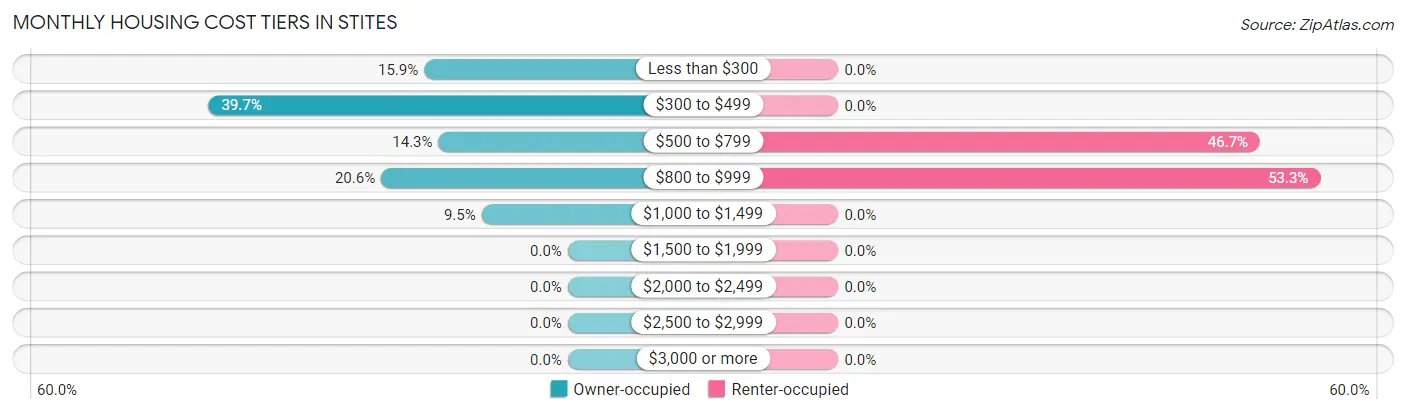
| Monthly Cost | Owner-occupied | Renter-occupied |
| Less than $300 | 10 (15.9%) | 0 (0.0%) |
| $300 to $499 | 25 (39.7%) | 0 (0.0%) |
| $500 to $799 | 9 (14.3%) | 7 (46.7%) |
| $800 to $999 | 13 (20.6%) | 8 (53.3%) |
| $1,000 to $1,499 | 6 (9.5%) | 0 (0.0%) |
| $1,500 to $1,999 | 0 (0.0%) | 0 (0.0%) |
| $2,000 to $2,499 | 0 (0.0%) | 0 (0.0%) |
| $2,500 to $2,999 | 0 (0.0%) | 0 (0.0%) |
| $3,000 or more | 0 (0.0%) | 0 (0.0%) |
| Total | 63 (100.0%) | 15 (100.0%) |
Physical Housing Characteristics in Stites
Housing Structures in Stites
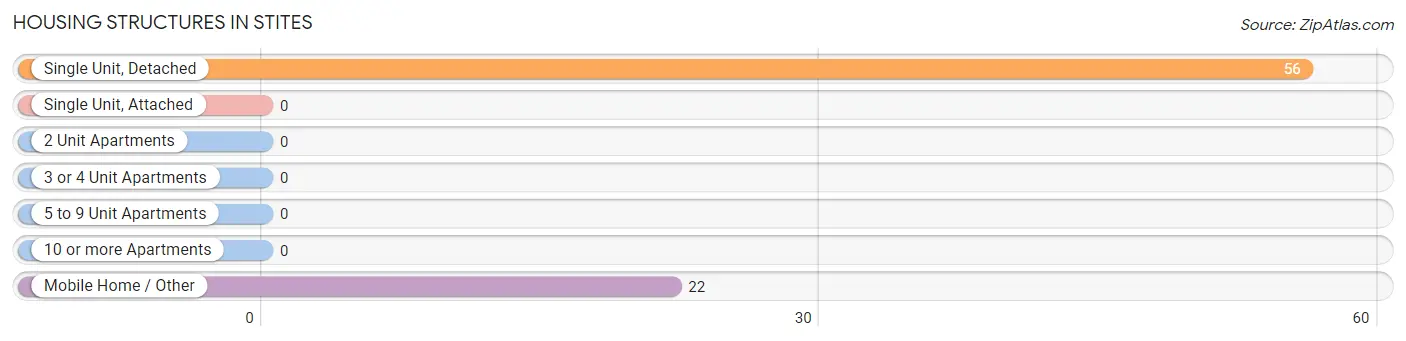
| Structure Type | # Housing Units | % Housing Units |
| Single Unit, Detached | 56 | 71.8% |
| Single Unit, Attached | 0 | 0.0% |
| 2 Unit Apartments | 0 | 0.0% |
| 3 or 4 Unit Apartments | 0 | 0.0% |
| 5 to 9 Unit Apartments | 0 | 0.0% |
| 10 or more Apartments | 0 | 0.0% |
| Mobile Home / Other | 22 | 28.2% |
| Total | 78 | 100.0% |
Housing Structures by Occupancy in Stites
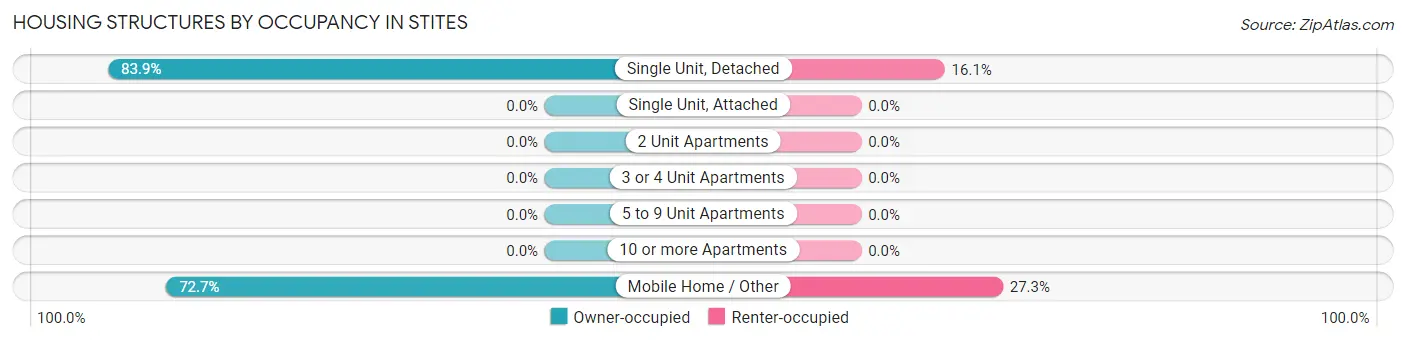
| Structure Type | Owner-occupied | Renter-occupied |
| Single Unit, Detached | 47 (83.9%) | 9 (16.1%) |
| Single Unit, Attached | 0 (0.0%) | 0 (0.0%) |
| 2 Unit Apartments | 0 (0.0%) | 0 (0.0%) |
| 3 or 4 Unit Apartments | 0 (0.0%) | 0 (0.0%) |
| 5 to 9 Unit Apartments | 0 (0.0%) | 0 (0.0%) |
| 10 or more Apartments | 0 (0.0%) | 0 (0.0%) |
| Mobile Home / Other | 16 (72.7%) | 6 (27.3%) |
| Total | 63 (80.8%) | 15 (19.2%) |
Housing Structures by Number of Rooms in Stites
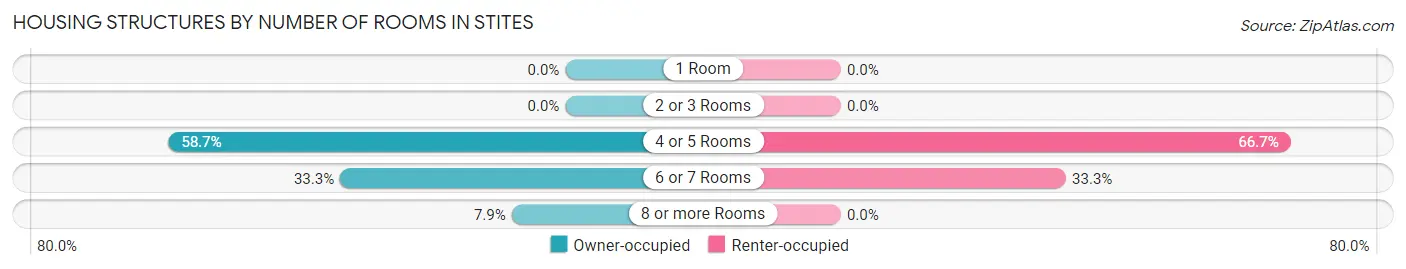
| Number of Rooms | Owner-occupied | Renter-occupied |
| 1 Room | 0 (0.0%) | 0 (0.0%) |
| 2 or 3 Rooms | 0 (0.0%) | 0 (0.0%) |
| 4 or 5 Rooms | 37 (58.7%) | 10 (66.7%) |
| 6 or 7 Rooms | 21 (33.3%) | 5 (33.3%) |
| 8 or more Rooms | 5 (7.9%) | 0 (0.0%) |
| Total | 63 (100.0%) | 15 (100.0%) |
Housing Structure by Heating Type in Stites
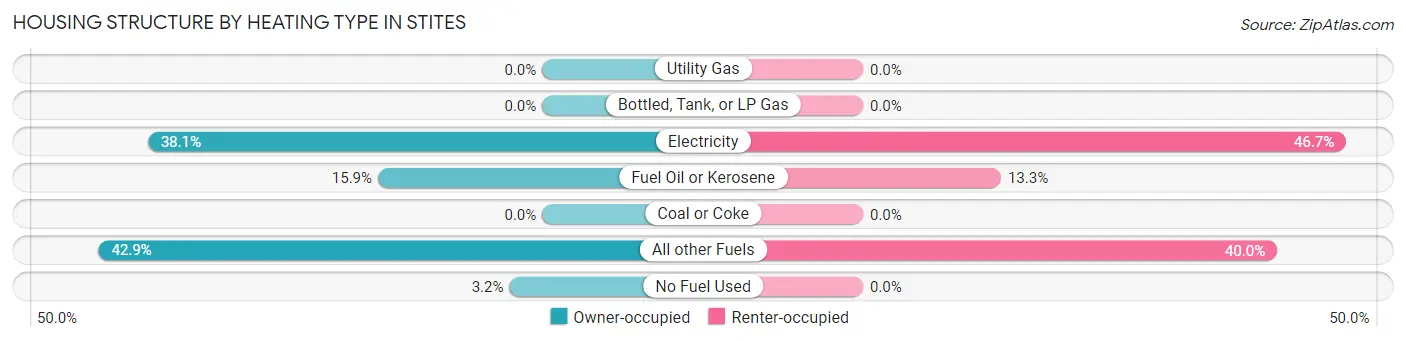
| Heating Type | Owner-occupied | Renter-occupied |
| Utility Gas | 0 (0.0%) | 0 (0.0%) |
| Bottled, Tank, or LP Gas | 0 (0.0%) | 0 (0.0%) |
| Electricity | 24 (38.1%) | 7 (46.7%) |
| Fuel Oil or Kerosene | 10 (15.9%) | 2 (13.3%) |
| Coal or Coke | 0 (0.0%) | 0 (0.0%) |
| All other Fuels | 27 (42.9%) | 6 (40.0%) |
| No Fuel Used | 2 (3.2%) | 0 (0.0%) |
| Total | 63 (100.0%) | 15 (100.0%) |
Household Vehicle Usage in Stites
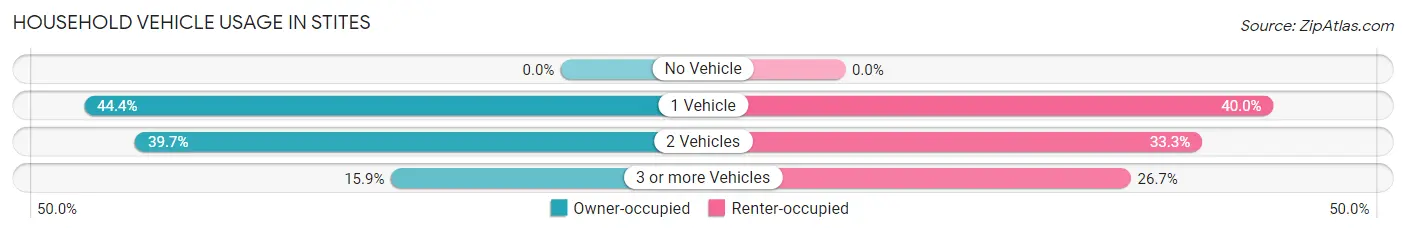
| Vehicles per Household | Owner-occupied | Renter-occupied |
| No Vehicle | 0 (0.0%) | 0 (0.0%) |
| 1 Vehicle | 28 (44.4%) | 6 (40.0%) |
| 2 Vehicles | 25 (39.7%) | 5 (33.3%) |
| 3 or more Vehicles | 10 (15.9%) | 4 (26.7%) |
| Total | 63 (100.0%) | 15 (100.0%) |
Real Estate & Mortgages in Stites
Real Estate and Mortgage Overview in Stites
| Characteristic | Without Mortgage | With Mortgage |
| Housing Units | 35 | 28 |
| Median Property Value | $118,800 | $118,800 |
| Median Household Income | $19,063 | $0 |
| Monthly Housing Costs | $358 | $0 |
| Real Estate Taxes | $417 | $4 |
Property Value by Mortgage Status in Stites
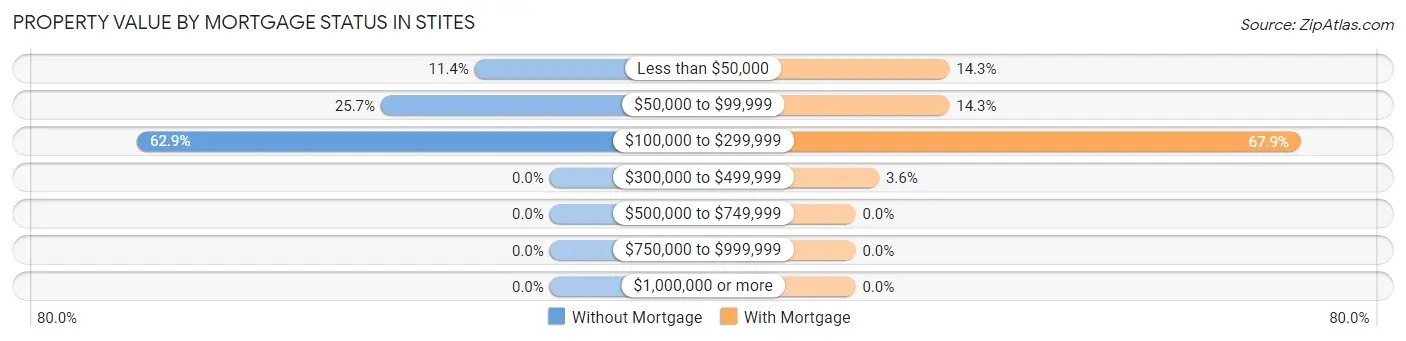
| Property Value | Without Mortgage | With Mortgage |
| Less than $50,000 | 4 (11.4%) | 4 (14.3%) |
| $50,000 to $99,999 | 9 (25.7%) | 4 (14.3%) |
| $100,000 to $299,999 | 22 (62.9%) | 19 (67.9%) |
| $300,000 to $499,999 | 0 (0.0%) | 1 (3.6%) |
| $500,000 to $749,999 | 0 (0.0%) | 0 (0.0%) |
| $750,000 to $999,999 | 0 (0.0%) | 0 (0.0%) |
| $1,000,000 or more | 0 (0.0%) | 0 (0.0%) |
| Total | 35 (100.0%) | 28 (100.0%) |
Household Income by Mortgage Status in Stites
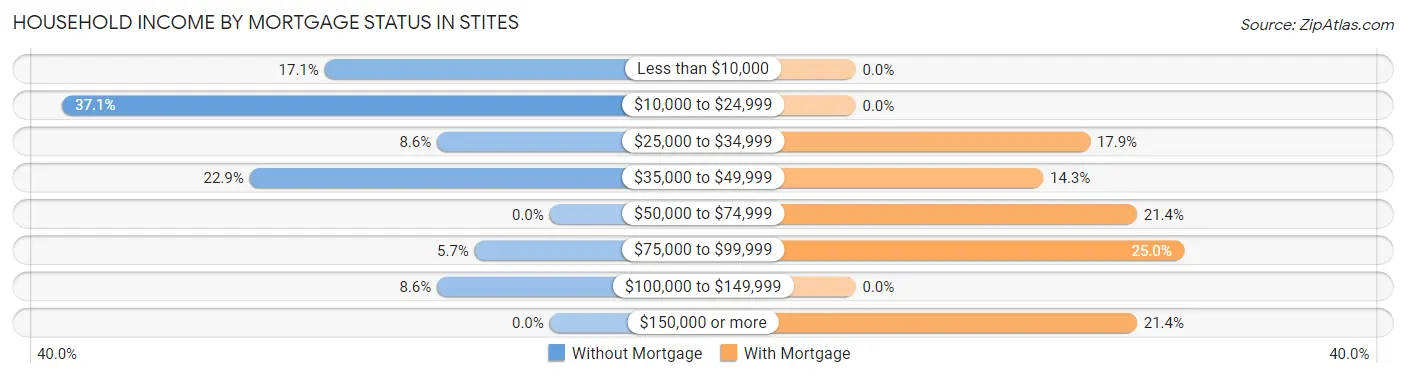
| Household Income | Without Mortgage | With Mortgage |
| Less than $10,000 | 6 (17.1%) | 0 (0.0%) |
| $10,000 to $24,999 | 13 (37.1%) | 0 (0.0%) |
| $25,000 to $34,999 | 3 (8.6%) | 5 (17.9%) |
| $35,000 to $49,999 | 8 (22.9%) | 4 (14.3%) |
| $50,000 to $74,999 | 0 (0.0%) | 6 (21.4%) |
| $75,000 to $99,999 | 2 (5.7%) | 7 (25.0%) |
| $100,000 to $149,999 | 3 (8.6%) | 0 (0.0%) |
| $150,000 or more | 0 (0.0%) | 6 (21.4%) |
| Total | 35 (100.0%) | 28 (100.0%) |
Property Value to Household Income Ratio in Stites
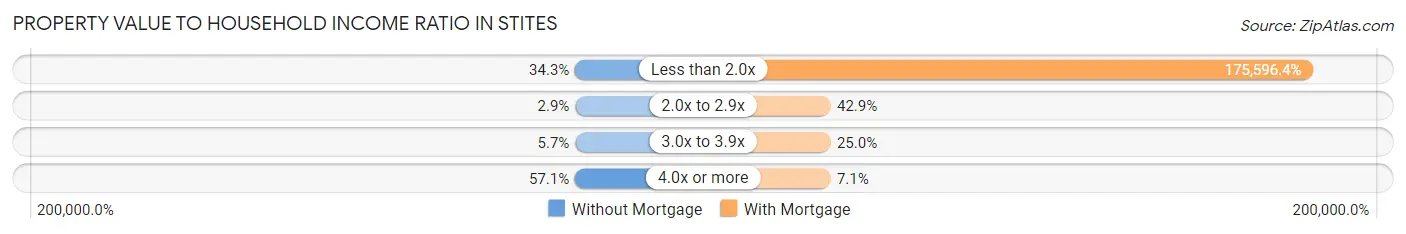
| Value-to-Income Ratio | Without Mortgage | With Mortgage |
| Less than 2.0x | 12 (34.3%) | 49,167 (175,596.4%) |
| 2.0x to 2.9x | 1 (2.9%) | 12 (42.9%) |
| 3.0x to 3.9x | 2 (5.7%) | 7 (25.0%) |
| 4.0x or more | 20 (57.1%) | 2 (7.1%) |
| Total | 35 (100.0%) | 28 (100.0%) |
Real Estate Taxes by Mortgage Status in Stites
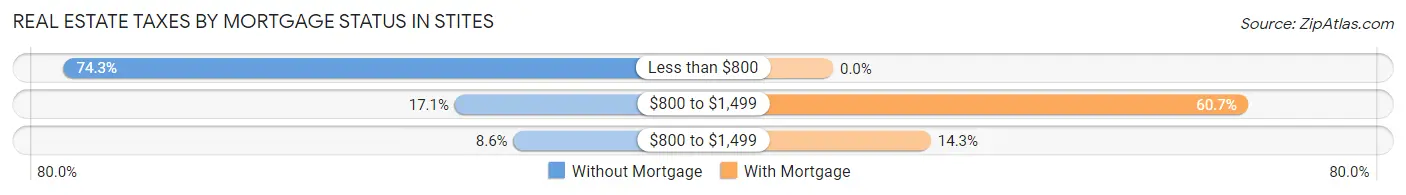
| Property Taxes | Without Mortgage | With Mortgage |
| Less than $800 | 26 (74.3%) | 0 (0.0%) |
| $800 to $1,499 | 6 (17.1%) | 17 (60.7%) |
| $800 to $1,499 | 3 (8.6%) | 4 (14.3%) |
| Total | 35 (100.0%) | 28 (100.0%) |
Health & Disability in Stites
Health Insurance Coverage by Age in Stites
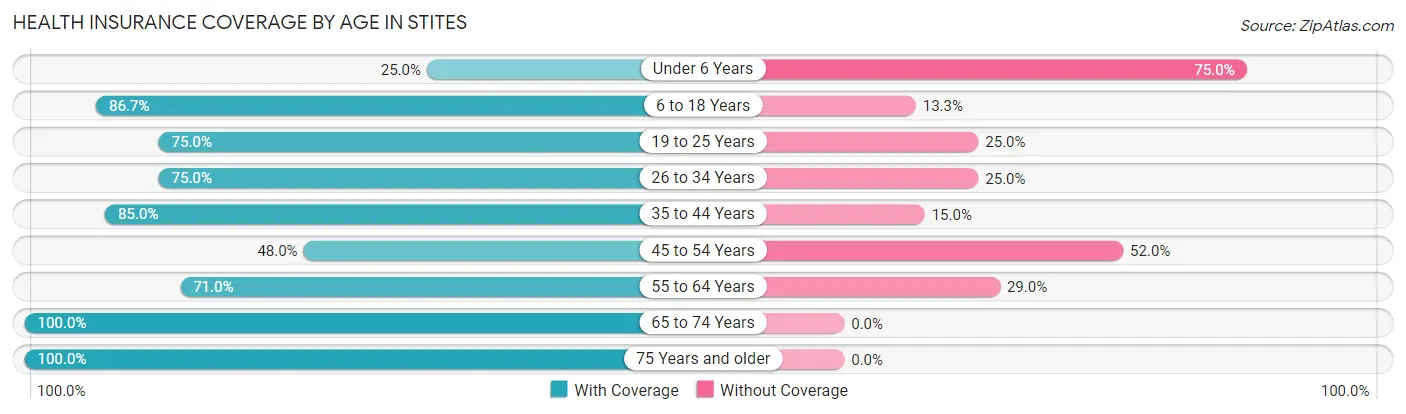
| Age Bracket | With Coverage | Without Coverage |
| Under 6 Years | 1 (25.0%) | 3 (75.0%) |
| 6 to 18 Years | 13 (86.7%) | 2 (13.3%) |
| 19 to 25 Years | 6 (75.0%) | 2 (25.0%) |
| 26 to 34 Years | 9 (75.0%) | 3 (25.0%) |
| 35 to 44 Years | 17 (85.0%) | 3 (15.0%) |
| 45 to 54 Years | 12 (48.0%) | 13 (52.0%) |
| 55 to 64 Years | 22 (71.0%) | 9 (29.0%) |
| 65 to 74 Years | 36 (100.0%) | 0 (0.0%) |
| 75 Years and older | 12 (100.0%) | 0 (0.0%) |
| Total | 128 (78.5%) | 35 (21.5%) |
Health Insurance Coverage by Citizenship Status in Stites
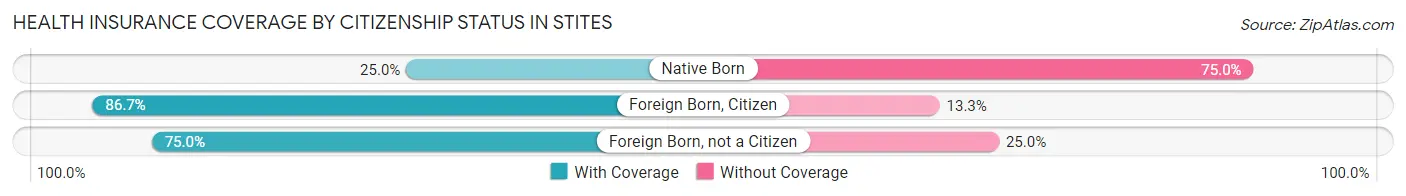
| Citizenship Status | With Coverage | Without Coverage |
| Native Born | 1 (25.0%) | 3 (75.0%) |
| Foreign Born, Citizen | 13 (86.7%) | 2 (13.3%) |
| Foreign Born, not a Citizen | 6 (75.0%) | 2 (25.0%) |
Health Insurance Coverage by Household Income in Stites
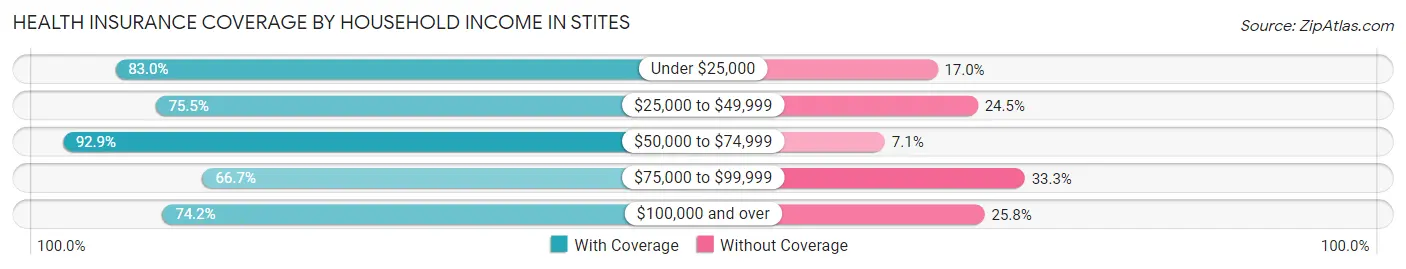
| Household Income | With Coverage | Without Coverage |
| Under $25,000 | 44 (83.0%) | 9 (17.0%) |
| $25,000 to $49,999 | 40 (75.5%) | 13 (24.5%) |
| $50,000 to $74,999 | 13 (92.9%) | 1 (7.1%) |
| $75,000 to $99,999 | 8 (66.7%) | 4 (33.3%) |
| $100,000 and over | 23 (74.2%) | 8 (25.8%) |
Public vs Private Health Insurance Coverage by Age in Stites
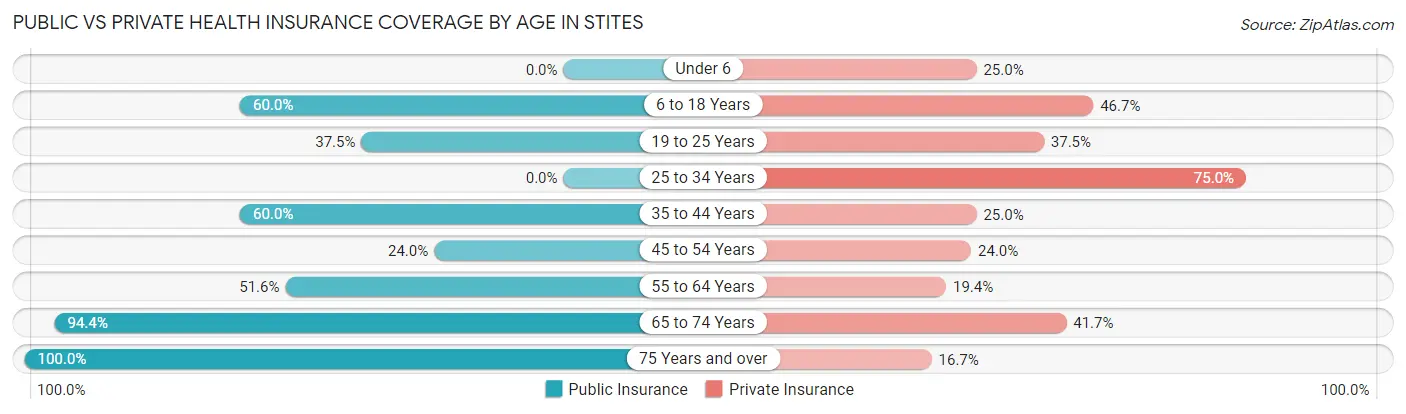
| Age Bracket | Public Insurance | Private Insurance |
| Under 6 | 0 (0.0%) | 1 (25.0%) |
| 6 to 18 Years | 9 (60.0%) | 7 (46.7%) |
| 19 to 25 Years | 3 (37.5%) | 3 (37.5%) |
| 25 to 34 Years | 0 (0.0%) | 9 (75.0%) |
| 35 to 44 Years | 12 (60.0%) | 5 (25.0%) |
| 45 to 54 Years | 6 (24.0%) | 6 (24.0%) |
| 55 to 64 Years | 16 (51.6%) | 6 (19.4%) |
| 65 to 74 Years | 34 (94.4%) | 15 (41.7%) |
| 75 Years and over | 12 (100.0%) | 2 (16.7%) |
| Total | 92 (56.4%) | 54 (33.1%) |
Disability Status by Sex by Age in Stites
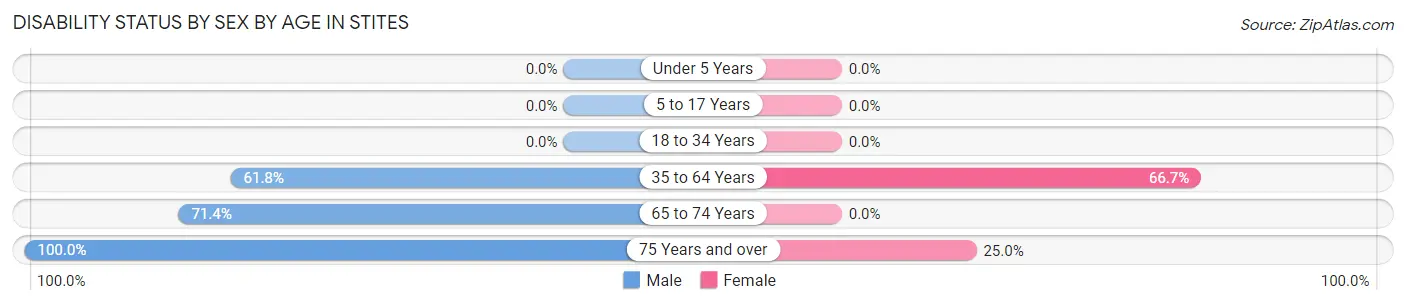
| Age Bracket | Male | Female |
| Under 5 Years | 0 (0.0%) | 0 (0.0%) |
| 5 to 17 Years | 0 (0.0%) | 0 (0.0%) |
| 18 to 34 Years | 0 (0.0%) | 0 (0.0%) |
| 35 to 64 Years | 21 (61.8%) | 28 (66.7%) |
| 65 to 74 Years | 10 (71.4%) | 0 (0.0%) |
| 75 Years and over | 8 (100.0%) | 1 (25.0%) |
Disability Class by Sex by Age in Stites
Disability Class: Hearing Difficulty
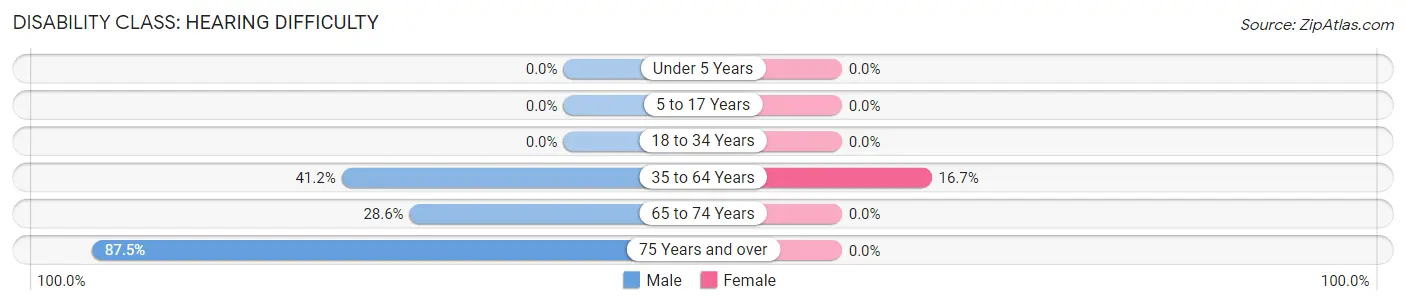
| Age Bracket | Male | Female |
| Under 5 Years | 0 (0.0%) | 0 (0.0%) |
| 5 to 17 Years | 0 (0.0%) | 0 (0.0%) |
| 18 to 34 Years | 0 (0.0%) | 0 (0.0%) |
| 35 to 64 Years | 14 (41.2%) | 7 (16.7%) |
| 65 to 74 Years | 4 (28.6%) | 0 (0.0%) |
| 75 Years and over | 7 (87.5%) | 0 (0.0%) |
Disability Class: Vision Difficulty
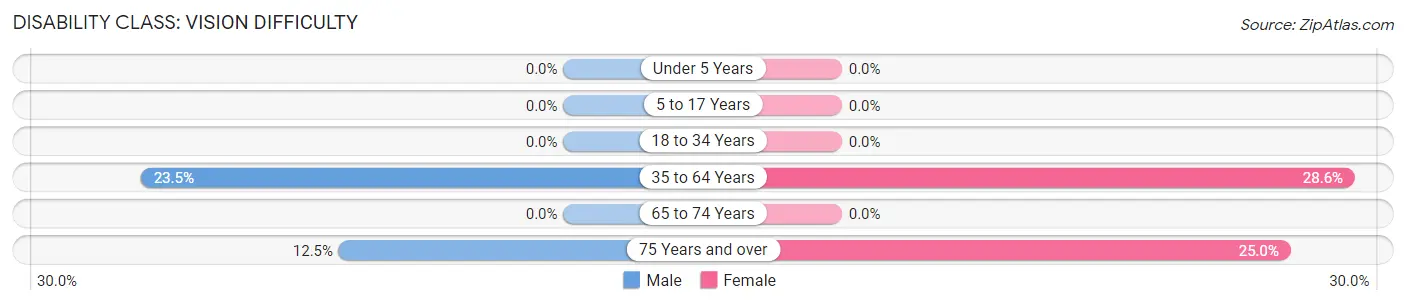
| Age Bracket | Male | Female |
| Under 5 Years | 0 (0.0%) | 0 (0.0%) |
| 5 to 17 Years | 0 (0.0%) | 0 (0.0%) |
| 18 to 34 Years | 0 (0.0%) | 0 (0.0%) |
| 35 to 64 Years | 8 (23.5%) | 12 (28.6%) |
| 65 to 74 Years | 0 (0.0%) | 0 (0.0%) |
| 75 Years and over | 1 (12.5%) | 1 (25.0%) |
Disability Class: Cognitive Difficulty
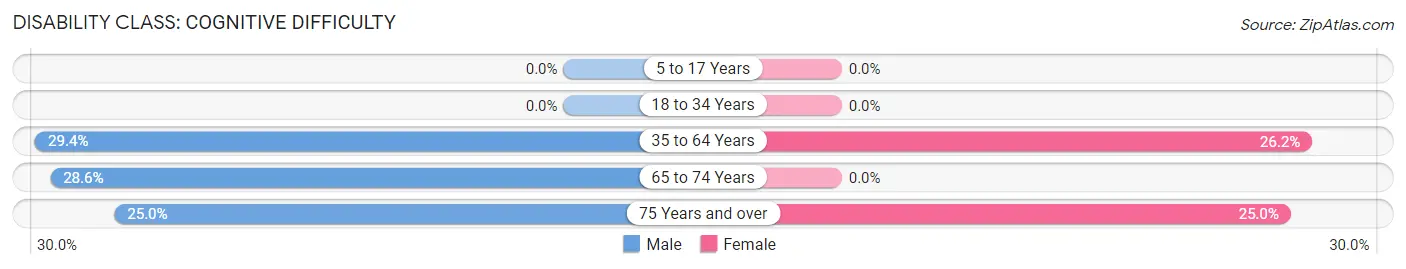
| Age Bracket | Male | Female |
| 5 to 17 Years | 0 (0.0%) | 0 (0.0%) |
| 18 to 34 Years | 0 (0.0%) | 0 (0.0%) |
| 35 to 64 Years | 10 (29.4%) | 11 (26.2%) |
| 65 to 74 Years | 4 (28.6%) | 0 (0.0%) |
| 75 Years and over | 2 (25.0%) | 1 (25.0%) |
Disability Class: Ambulatory Difficulty
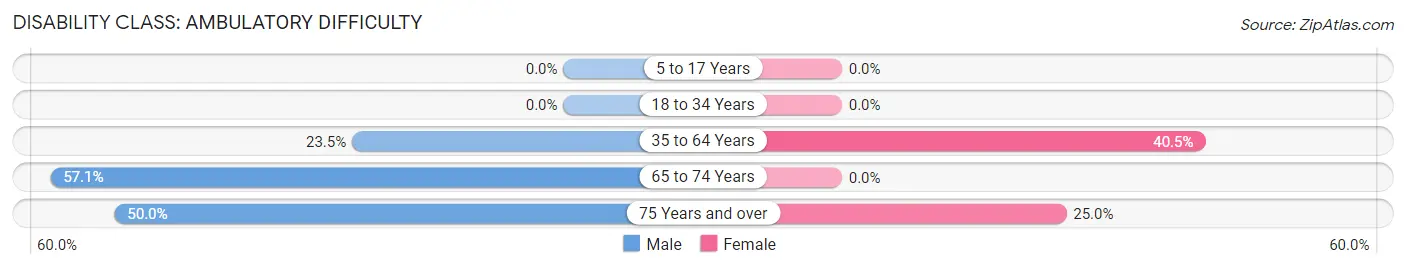
| Age Bracket | Male | Female |
| 5 to 17 Years | 0 (0.0%) | 0 (0.0%) |
| 18 to 34 Years | 0 (0.0%) | 0 (0.0%) |
| 35 to 64 Years | 8 (23.5%) | 17 (40.5%) |
| 65 to 74 Years | 8 (57.1%) | 0 (0.0%) |
| 75 Years and over | 4 (50.0%) | 1 (25.0%) |
Disability Class: Self-Care Difficulty
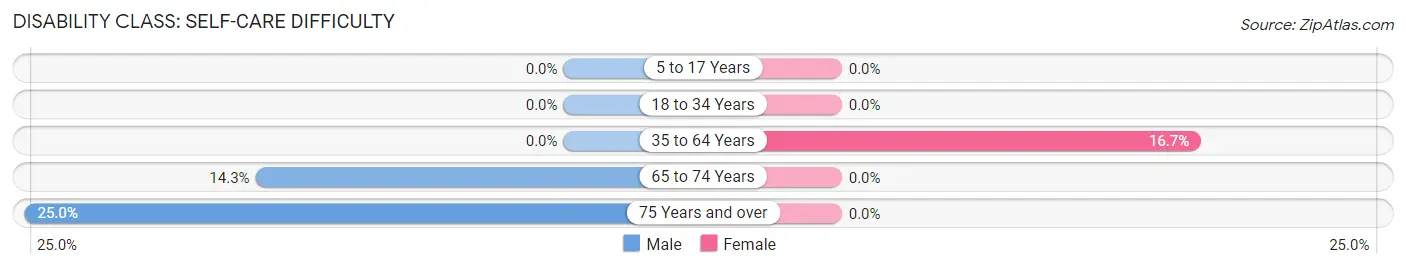
| Age Bracket | Male | Female |
| 5 to 17 Years | 0 (0.0%) | 0 (0.0%) |
| 18 to 34 Years | 0 (0.0%) | 0 (0.0%) |
| 35 to 64 Years | 0 (0.0%) | 7 (16.7%) |
| 65 to 74 Years | 2 (14.3%) | 0 (0.0%) |
| 75 Years and over | 2 (25.0%) | 0 (0.0%) |
Technology Access in Stites
Computing Device Access in Stites
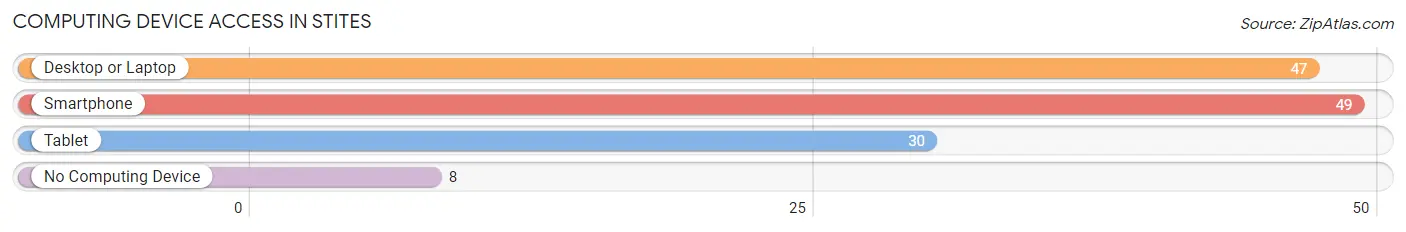
| Device Type | # Households | % Households |
| Desktop or Laptop | 47 | 60.3% |
| Smartphone | 49 | 62.8% |
| Tablet | 30 | 38.5% |
| No Computing Device | 8 | 10.3% |
| Total | 78 | 100.0% |
Internet Access in Stites
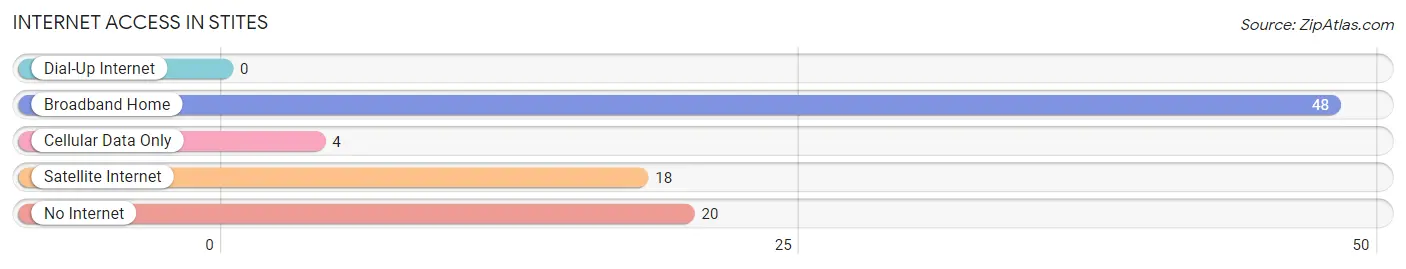
| Internet Type | # Households | % Households |
| Dial-Up Internet | 0 | 0.0% |
| Broadband Home | 48 | 61.5% |
| Cellular Data Only | 4 | 5.1% |
| Satellite Internet | 18 | 23.1% |
| No Internet | 20 | 25.6% |
| Total | 78 | 100.0% |
Stites Summary
Stites is a small town located in Idaho County, Idaho, United States. It is situated in the Clearwater River Valley, at an elevation of 2,845 feet (867 m). The population was estimated to be around 200 people in 2020.
History
Stites was founded in 1883 by a group of settlers from the Midwest. The town was named after the Stites family, who were among the first settlers. The town was originally a farming community, but it soon became a logging town. Logging was the main industry in Stites until the early 1900s, when the timber industry began to decline.
In the early 1900s, Stites began to develop into a small tourist town. The town was known for its beautiful scenery and outdoor activities, such as fishing, hunting, and camping. The town also had a few small businesses, such as a general store, a hotel, and a saloon.
In the 1950s, Stites began to experience a decline in population. This was due to the decline of the timber industry and the lack of other economic opportunities. In the late 1970s, the town began to experience a resurgence in population due to the development of the nearby Dworshak Reservoir. The reservoir provided recreational opportunities and jobs for the residents of Stites.
Geography
Stites is located in the Clearwater River Valley, at an elevation of 2,845 feet (867 m). The town is surrounded by mountains and forests, and is located near the Dworshak Reservoir. The climate in Stites is generally mild, with hot summers and cold winters.
Economy
The economy of Stites is largely based on tourism and recreation. The town is known for its outdoor activities, such as fishing, hunting, and camping. The nearby Dworshak Reservoir provides recreational opportunities and jobs for the residents of Stites.
The town also has a few small businesses, such as a general store, a hotel, and a saloon. The town also has a few restaurants and bars.
Demographics
The population of Stites was estimated to be around 200 people in 2020. The town is predominantly white, with a small Hispanic population. The median household income in Stites is $35,000, and the median age is 44. The town has a low unemployment rate, and the poverty rate is below the national average.
Common Questions
What is Per Capita Income in Stites?
Per Capita income in Stites is $21,540.
What is the Median Family Income in Stites?
Median Family Income in Stites is $43,750.
What is the Median Household income in Stites?
Median Household Income in Stites is $31,250.
What is Income or Wage Gap in Stites?
Income or Wage Gap in Stites is 67.6%.
Women in Stites earn 32.4 cents for every dollar earned by a man.
What is Inequality or Gini Index in Stites?
Inequality or Gini Index in Stites is 0.44.
What is the Total Population of Stites?
Total Population of Stites is 163.
What is the Total Male Population of Stites?
Total Male Population of Stites is 86.
What is the Total Female Population of Stites?
Total Female Population of Stites is 77.
What is the Ratio of Males per 100 Females in Stites?
There are 111.69 Males per 100 Females in Stites.
What is the Ratio of Females per 100 Males in Stites?
There are 89.53 Females per 100 Males in Stites.
What is the Median Population Age in Stites?
Median Population Age in Stites is 53.8 Years.
What is the Average Family Size in Stites
Average Family Size in Stites is 2.7 People.
What is the Average Household Size in Stites
Average Household Size in Stites is 2.1 People.
How Large is the Labor Force in Stites?
There are 52 People in the Labor Forcein in Stites.
What is the Percentage of People in the Labor Force in Stites?
36.1% of People are in the Labor Force in Stites.